Embed Size (px)
Citation preview
Q2Q1Q3 Q4
Western Balkans Quarterly Quarter 3 • July–September 2015

Frontex official publications fall into four main categories: risk analysis, training, operations and research, each marked with a distinct graphic identifier. Risk analysis publications bear a triangular symbol formed by an arrow drawing a triangle, with a dot at the centre. Metaphorically, the arrow represents the cyclical nature of risk analysis processes and its orientation towards an appropriate operational response. The triangle is a symbol of ideal proportions and knowledge, reflecting the pursuit of factual exactness, truth and exhaustive analysis. The dot at the centre represents the intelligence factor and the focal point where information from diverse sources converges to be processed, systematised and shared as analytical products. Thus, Frontex risk analysis is meant to be at the centre and to form a reliable basis for its operational activities.
European Agency for the Management of Operational Cooperation at the External Borders of the Member States of the European Union
Plac Europejski 6 00-844 Warsaw, PolandT +48 22 205 95 00 F +48 22 205 95 01 [email protected] www.frontex.europa.eu
Warsaw, January 2016 Risk Analysis Unit Frontex reference number: 20615/2015
OPOCE Catalogue number TT-AI-15-003-EN-N ISBN 978-92-95205-34-5; ISSN 2443-8367; DOI 10.2819/56872
© Frontex, 2015 All rights reserved. Reproduction is authorised provided the source is acknowledged.
DISCLAIMERSThis is a Frontex staff working document. This publication or its contents do not imply the expression of any opinion whatsoever on the part of Frontex concerning the legal status of any country, territory or city or its authorities, or concerning the delimitation of its frontiers or boundaries. All charts included in this report are the sole property of Frontex and any unauthorised use is prohibited.
Throughout the report, references to Kosovo* are marked with an asterisk to indicate that this designation is without prejudice to positions on status, and is in line with UNSCR 1244 and the ICJ Opinion on the Kosovo declaration of independence.
ACKNOWLEDGMENTSThe WB-RAN Quarterly has been prepared by the Frontex Risk Analysis Unit. During the course of developing this product, many colleagues at Frontex and from the WB-RAN contributed to it and their assistance is hereby acknowledged with gratitude.

Table of contentsIntroduction #3
I. Situational overview #4
Summary of WB-RAN indicators #5
Key findings #5
Situation at the border #6
Border surveillance #6
Border checks #8
Situation in the Western Balkans #9
Illegal stay in Western Balkan countries #9
II. Featured risk analyses #10
Large and sustained transiting flow through the Western Balkans strains border capacities #10
Main factors affecting irregular migration from Pakistan appear to be of economic nature #12
Iraqi migrant flow towards Europe and the influence of the Syrian crisis #14
III. Statistical annex #16
1 of 23
wb-ran · q3 2015
List of abbreviations used
ABL Administrative Boundary LineBCP border-crossing pointCIA Central Investigation AgencyEDF European Union Document-FraudEDF-RAN European Union Document-Fraud Risk Analysis NetworkEU European UnionEUR euroFATA The Federally Administered Tribal Areas – PakistanFRAN Frontex Risk Analysis NetworkFrontex European Agency for the Management of Operational Cooperation at the External Borders of the Member
States of the European UnionFYR Macedonia former Yugoslav Republic of MacedoniaGCC Gulf Cooperation CouncilGDP gross domestic productICJ International Court of JusticeID identification documentIDMC Internal Displacement Monitoring CentreIDP internally displaced personISIL/Da’ish Islamic State of Iraq and the LevantISAF International Security Assistance Force – AfghanistanKRG Kurdistan Regional Governmentn.a. not availableQ/Qtr quarter of the yearRAU Frontex Risk Analysis UnitUK United KingdomUNHCR United Nations High Commissioner for RefugeesUNSCR United Nations Security Council ResolutionUSD United States dollarWB-RAN Western Balkans Risk Analysis Network
2 of 23
Concept
The Western Balkans Risk Analysis Net-work (WB-RAN) performs monthly ex-changes of statistical data and information on the most recent irregular migration developments affecting the region. This information is compiled at Frontex Risk Analysis Unit (RAU) level and analysed in cooperation with the regional partners on a quarterly and annual basis. The annual reports offer a more in-depth analysis of the developments and phenomena which impact the regional and common bor-ders, while the quarterly reports are meant to provide regular updates and identify emerging trends in order to maintain sit-uational awareness. Both types of reports are aimed at offering support for strategic and operational decision making.
Methodology
The Western Balkans Quarterly is focused on quarterly developments as reflected by the seven key indicators of irregular mi-gration: (1) detections of illegal border-crossing between BCPs, (2) detections of illegal border-crossing at BCPs, (3) refus-als of entry, (4) detections of illegal stay, (5) asylum applications, (6) detections of facilitators, and (7) detections of fraudu-lent documents.1
1 Please note that the analysis of this indicator is now limited to WB-RAN countries only, given that EU Member States have transitioned to the European Union Document-Fraud (EDF) reporting scheme.
The data presented in the overview are derived from monthly statistics provided within the framework of the WB-RAN and reference period statistics from com-mon border sections of neighbouring EU Member States (Croatia, Bulgaria, Greece, Hungary and Romania). In addition, the Western Balkans Quarterly is drawing from FRAN Quarterly reports and also from data analysed in the framework of other risk analysis networks (FRAN, EDF-RAN).
Structure
The first part offers a general situational overview broken down by main areas of work of border-control authorities and po-lice activities related to irregular migration. The second part presents more in-depth featured risk analyses of particular phe-nomena. As the current issue of the West-ern Balkans Quarterly is the third following a new approach adopted for risk analy-sis quarterlies, the structure of the report may still be subject to some readjustments.
Changes in data scope after Croatia’s entry to the EU
Important changes in the collection and use of data for Western Balkans Quarterly were introduced upon Croatia’s joining the EU in July 2013. Firstly, data for Slovenia, which now has no external borders with non-EU Western Balkan countries, has not been included in the report since the third
quarter of 2013. Slovenian historical data were also excluded from the tables in or-der to make the comparison with previous quarters analytically meaningful.
Secondly, as the Croatian-Hungarian and Croatian-Slovenian border sections have now become internal EU-borders they are no longer covered by this report.
Thirdly, after joining the EU, Croatian data on illegal stay data are limited to detec-tions at the border. More precisely, Cro-atia’s illegal stay data only include cases detected on exit, while inland detections are not included. The analysis of the il-legal stay indicator takes this fact into consideration.
Changes in data scope after Kosovo*’s entry to the WB-RAN
Starting from the first quarter of 2014 data from Kosovo* on key indicators of irreg-ular migration will be included in the re-porting, making it possible to get a more comprehensive picture on the irregular movements in the region. However, as there is no historical data available for Ko-sovo*, the new data do in some measure impact the comparisons of the examined period with the previous quarters. When necessary for analytical purposes, some comparisons can be made also excluding data from Kosovo* and noted in the text.
Introduction
3 of 23
wb-ran · q3 2015

Featured Risk Analyses
!
!
!
!
!
!
3.97.2
0.7
3.02.0
1.9Kalotina
Kakavia
Kristallopigi
RöszkeKelebia
Moravita
Bajakovo
Karasovići
Stara Gradiška
Tirana
Sarajevo
Podgorica
Skopje
Belgrade
Pristina
population in milions
Croatia
Hungary
Slovenia
Romania
Bulgaria
Greece
Montenegro
Kosovo*
Albania
FYRMacedonia
Bosnia andHerzegovina
Serbia
Italy
main BCPs between WB-RAN countries and the EU
regional bordersadministrative boundary linecommon bordersPan-European Transport Corridor Xother major roads
* This designation is without prejudice to positions on status, and is in line with UNSCR 1244 and the ICJ Opinion on the Kosovo declaration of independence.
Source: The CIA World Factbook (July 2014 estimates), ESRI geodata
Figure 1. General map of the Western Balkans region
4 of 23
I. Situational overview

Summary of WB-RAN indicators
Key findings
n Record numbers of non-regional transiting migrants
n Screening and registration capacity severely overstretched given the large numbers (>40% of the non-regional flow reported as ‘unknown nationality’)
n Migration en masse used as an efficient modus operandi to overwhelm conventional border measures
n Organised transportation provided by different authorities shifted the focus away from border management and security towards migration management, clearly accelerating the flow
n Syrians remain the most detected nationality closely followed by Afghans, increased presence of Iraqi and Pakistani migrants observed
n Regional flow remains low and is not aligned with typical seasonal trends
Table 1. Overview of indicators as reported by WB-RAN members
Q3 2014 Q2 2015 Q3 2015 % change on same quarter last year
% change on previous quarter
WB-RAN Indicator
Illegal border-crossing between BCPs 14 920 81 656 614 947 4 022% 653%
Illegal border-crossing at BCPs 590 347 249 -58% -28%
Facilitators 292 572 618 112% 8%
Illegal stay 2 651 2 483 1 615 -39% -35%
Refusals of entry 14 029 9 827 13 605 -3% 38%
Asylum applications* 15 468 43 433 119 038 670% 174%
False travel-document users 213 235 216 1% -8%
* Applications for asylum in EU Member States include all applications received in the territory of the countries, not limited to those made at the Western Balkan borders.
Source: WB-RAN data as of 14 January 2016
5 of 23
wb-ran · q3 2015
Featured Risk Analyses
Border surveillance
Situation at the border
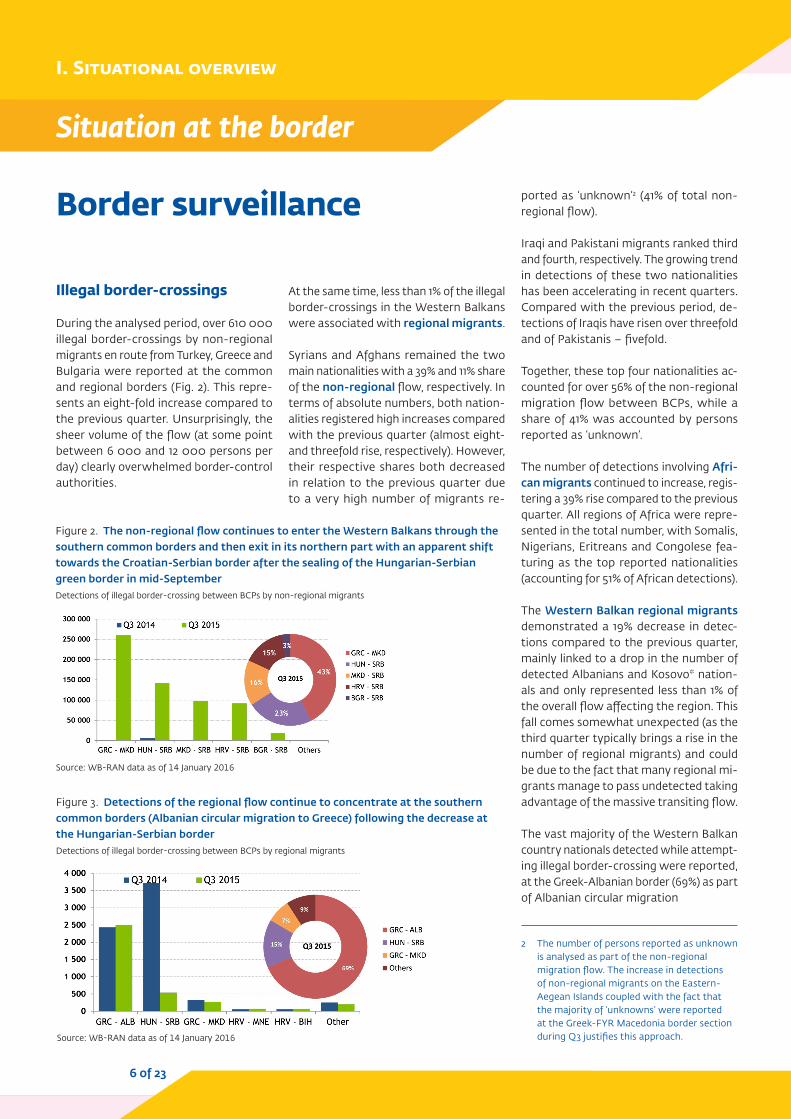
Figure 3. Detections of the regional flow continue to concentrate at the southern common borders (Albanian circular migration to Greece) following the decrease at the Hungarian-Serbian borderDetections of illegal border-crossing between BCPs by regional migrants
Source: WB-RAN data as of 14 January 2016
Illegal border-crossings
During the analysed period, over 610 000 illegal border-crossings by non-regional migrants en route from Turkey, Greece and Bulgaria were reported at the common and regional borders (Fig. 2). This repre-sents an eight-fold increase compared to the previous quarter. Unsurprisingly, the sheer volume of the flow (at some point between 6 000 and 12 000 persons per day) clearly overwhelmed border-control authorities.
At the same time, less than 1% of the illegal border-crossings in the Western Balkans were associated with regional migrants.
Syrians and Afghans remained the two main nationalities with a 39% and 11% share of the non-regional flow, respectively. In terms of absolute numbers, both nation-alities registered high increases compared with the previous quarter (almost eight-and threefold rise, respectively). However, their respective shares both decreased in relation to the previous quarter due to a very high number of migrants re-
Figure 2. The non-regional flow continues to enter the Western Balkans through the southern common borders and then exit in its northern part with an apparent shift towards the Croatian-Serbian border after the sealing of the Hungarian-Serbian green border in mid-SeptemberDetections of illegal border-crossing between BCPs by non-regional migrants
Source: WB-RAN data as of 14 January 2016
ported as ‘unknown’2 (41% of total non-regional flow).
Iraqi and Pakistani migrants ranked third and fourth, respectively. The growing trend in detections of these two nationalities has been accelerating in recent quarters. Compared with the previous period, de-tections of Iraqis have risen over threefold and of Pakistanis – fivefold.
Together, these top four nationalities ac-counted for over 56% of the non-regional migration flow between BCPs, while a share of 41% was accounted by persons reported as ‘unknown’.
The number of detections involving Afri-can migrants continued to increase, regis-tering a 39% rise compared to the previous quarter. All regions of Africa were repre-sented in the total number, with Somalis, Nigerians, Eritreans and Congolese fea-turing as the top reported nationalities (accounting for 51% of African detections).
The Western Balkan regional migrants demonstrated a 19% decrease in detec-tions compared to the previous quarter, mainly linked to a drop in the number of detected Albanians and Kosovo* nation-als and only represented less than 1% of the overall flow affecting the region. This fall comes somewhat unexpected (as the third quarter typically brings a rise in the number of regional migrants) and could be due to the fact that many regional mi-grants manage to pass undetected taking advantage of the massive transiting flow.
The vast majority of the Western Balkan country nationals detected while attempt-ing illegal border-crossing were reported, at the Greek-Albanian border (69%) as part of Albanian circular migration
2 The number of persons reported as unknown is analysed as part of the non-regional migration flow. The increase in detections of non-regional migrants on the Eastern-Aegean Islands coupled with the fact that the majority of ‘unknowns’ were reported at the Greek-FYR Macedonia border section during Q3 justifies this approach.
6 of 23
I. Situational overview

Turkey
FYRMacedonia
Kosovo*
#%
1 388101%
3 02888%
259 98638 416%2 506
-4%
31-48%
31-0%
7-56%
58-2%
534-60%
7-22%
9-36%
8750%
7710%
91 69832 649%
142 9181 364%
40122%
27358%
19-533%
314 2891 495%
18 67312 603%
Austria
Italy
98 2098 977%
Albania
Bosnia &Herzegovina
Croatia
Bulgaria
Greece
Hungary
Slovenia
Romania
Montenegro
Serbia
Frontex, RAU S3 GIS Team, 2015
* This designation is without prejudice topositions on status, and is in line withUNSCR 1244 and the ICJ Opinion on theKosovo declaration of independence.
Direction of the arrow - general direction of the flowWidth of the arrow - indicative of the size of the flow
Non-regional flows in theEastern Mediterranean route
Mostly non-regional flowMostly regional flow
#%
Total number of detectionsChange over Q3 2014
Figure 4. In the southern part of the region, the border between the former Yugoslav Republic of Macedonia and Greece remained the main entry point for the non-regional transiting flow, followed by the Bulgarian-Serbian border, both registering high increases. In the northern part, the Hungarian-Serbian green border remained the main point of exit from the region; however, after it was sealed in mid-September the transit through the Croatian-Serbian section significantly increased. The other border sections were mostly affected by low-level, mainly regional flows.Changes in detections of illegal border-crossing between BCPs between Q3 2014 and Q3 2015 at particular border sections and main directions of the flow
Q3 2014 Q3 2015 Q3 2014 Q3 2015
0
50
100
150
200
250
300
350
400
SRB HUN GRC BGR Other 0
50
100
150
200
250
300
350
400
SRB BGR ALB GRC HUN UNK PAK IRQ ROU SYR Others
55% 19%
12%
9% 5%
Q32015
SRB HUN GRC BGR Other
Figure 5. The number of facilitators remains low, possibly indicating the ability of migrants to self-organise or rely on transportation organised by authorities in transit countriesDetections of facilitators (at BCPs, between BCPs and inland), by reporting country, top shares (left) and nationalities (right)
Facilitators
During the third quarter of 2015, the num-ber of detected facilitators was 618, rep-resenting a minor 8% increase compared with the previous three-month period. This increase can be regarded marginal if compared with the eightfold rise in the number of reported illegal border-cross-ings by the non-regional migration flow. This indicates that migrants are increas-ingly able to self-organise and/or rely on authorities when it comes to travel ar-rangements for transiting the region (Greece/FYR Macedonia/Serbia/Croatia/Slovenia).
As regards nationalities, 67% of all facilita-tors detected in the analysed quarter were nationals of Western Balkan countries, 20% were citizens of the neighbouring EU Member States and 11% were third-country nationals from outside the region or ‘unknown’. Serbia continued to report the highest share of detections (55%), in great majority involving Serbian nationals.
Importantly, a 70% increase in detected facilitators compared with Q2 was re-ported at the Bulgarian-Serbian border section. This is in line with the increasing number of migrants targeting this section but also with increased efforts by the Bul-garian authorities, which reported 250% more facilitators compared to the previ-ous quarter.
Source: WB-RAN data as of 14 January 2016
Source: WB-RAN and FRAN data as of 14 January 2016
7 of 23
wb-ran · q3 2015

Featured Risk Analyses
Clandestine entries
In Q3 2015, a total of 224 non-regional mi-grants were detected while attempting to illegally cross the border hiding in vehicles. This is a significantly lower number than the peak observed in Q2 and also than the total of Q3 2014. In terms of nationalities, similar to the situation at the green bor-der, Syrians, Afghans and Iraqis were the top nationalities, together accounting for 96% of detections. Additionally, only 25 na-tionals of Western Balkan countries were reported at BCPs.
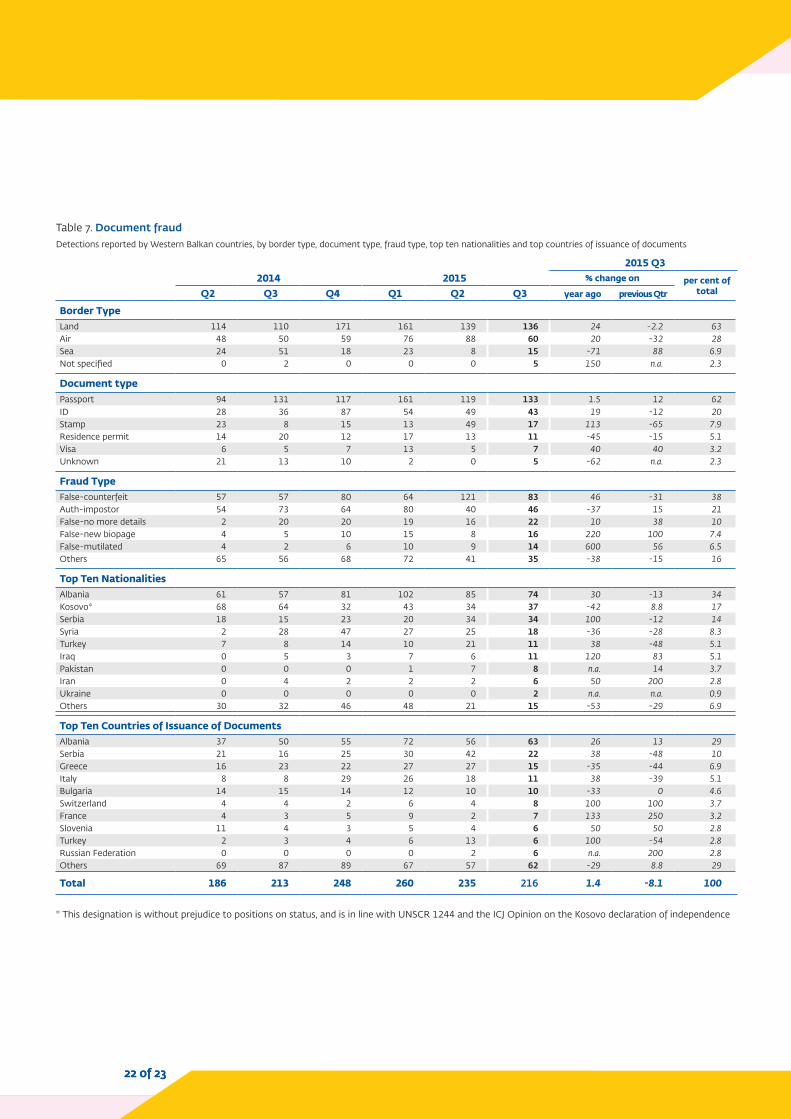
Document fraud
During the third quarter, there were 216 cases of false document use reported by the six Western Balkan countries, a num-ber 8% lower than that of the previous quarter.
Serbia continued to rank first, with 48% of all regional detections, followed by the former Yugoslav Republic of Macedonia and Albania, with 19% and 14% shares, respectively.
In Q3 Albanians continued to rank first amongst false document users, followed by Kosovo* and Serbian citizens.
The most commonly used false docu-ments were passports, ID cards and border
stamps. Unsurprisingly, the large majority of ID cards (41 out of 43) were EU Member States’ documents, as they can be used to move freely inside the Schengen area and the EU.
The majority (79) of false passports de-tected were reportedly issued by countries from the region. Most of these documents were Albanian (60), largely used by Alba-nian nationals (56) who attempted to avoid entry bans imposed due to their misuse of visa liberalisation.
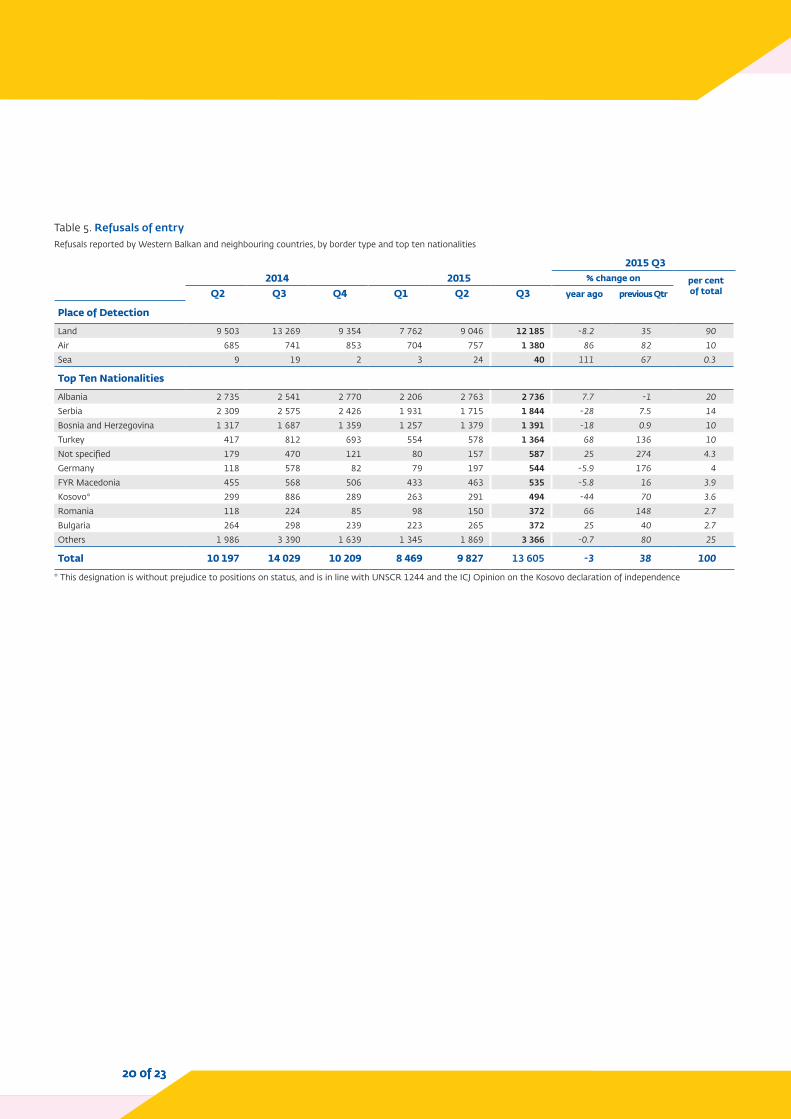
Refusals of entry
In the analysed period, the number of re-fusals of entry increased by 38% compared to the previous quarter: from roughly 9 800 to 13 600. This increase appears to be largely corresponding to usual sea-sonal trends caused by high tourist mo-bility as compared to the corresponding quarter of 2014, the number of issued re-fusals was stable. However, what stands out is the higher number of refusals is-sued to Turkish nationals, which can be also associated with the general trend of workers returning to the EU after sum-mer holiday period.
As usual, a large majority of refusals of en-try were issued at the land borders (90%), while the remaining 10% were largely re-ported at the air borders.
Most of the refusals reported by the neigh-bouring EU Member States were issued to nationals of the Western Balkans, while in the six countries of the region the largest number of refused persons were nation-als of EU Member States/Schengen Associ-ated Countries followed by local residents and Turkish nationals.
The third quarter is usually the period when the highest number of refusals are issued to Turkish nationals. This seasonal phenomenon is mainly linked to Turkish illegal workers who try to return to the EU after spending their summer holiday in Turkey. However, in Q3 2015 the num-ber of refusals issued to Turks was 68% higher than that of Q3 2014, possibly be-cause more Turkish nationals try to take advantage of the unprecedented migra-tory flow in order to get to the EU.
The overall number of refusals issued to the non-regional nationalities associated with the migratory flow originating from Turkey/Greece continued to represent a very low share of the total. This fact in-dicates that the non-regional transiting flow directly targets green borders and avoid BCPs.
Q3 2014 Q3 2015
0
500
1 000
1 500
2 000
2 500
3 000
3 500
4 000
0 500
1 000 1 500 2 000 2 500 3 000 3 500 4 000 4 500
HUN-SRB
HRV-BIH
HRV-SRB
GRC-ALB
RKS*-La
nd-
-ABL
SRB-A
ir
HRV-MNE
RKS*-ALB
BGR-SRB
BIH-S
RB
GRC-MKD
Other
20%
11%
12% 6% 6%
45% Q32015
HUN-SRB
HRV-BIH
HRV-SRB
GRC-ALB
RKS*-Land-ABL
Other
SRB BIH TUR UNK DEU MKD RKS BGR ROU OtherALB
Q3 2014 Q3 2015
Figure 6. Only a small proportion of refusals were issued to migrants transiting via Turkey/Greece (indicating that the non-regional flow predominantly targets the green borders)Persons refused entry by top border sections, top shares (left) and nationalities (right)
Source: WB-RAN data as of 14 January 2016
Border checks
8 of 23
I. Situational overview

Situation in the Western Balkans
There were 649 detections of illegal stay, reported by the six Western Balkan coun-tries during the period under review, which represents a third consecutive quarterly decrease of this indicator. The number is significantly lower in relation to the previ-ous quarter (-27%) and even more so when compared with the corresponding period of 2014 (-38%). This development can be attributed to the recent acceleration of the flow, as migrants are trying to transit the Western Balkans as fast as possible in an attempt to reach their destinations before the various announced restrictions or bor-der closures are put into effect.
During the analysed quarter, Albanians and Serbians ranked first and second, re-spectively, among detected illegal stayers.
Serbians continued to be mainly reported by Bosnia and Herzegovina and, to a lesser extent, by Montenegro, while the Albani-ans seemed to largely prefer staying in the former Yugoslav Republic of Macedonia. The nationals of Bosnia and Herzegovina ranked third in detections of illegal stayers during the third quarter and were mainly reported by Serbia.
Syrians, who used to be in the top three nationalities of illegal stayers in previous quarters, practically disappeared during the analysed period when only eight such nationals were reported.
Very few illegal stayers of nationalities as-sociated with non-regional migration flow originating from Turkey/Greece were de-
tected in the six Western Balkan coun-tries. During the analysed quarter, there were only roughly 130 such nationals re-ported, which represents the lowest num-ber since data collection began.
The huge and growing discrepancy be-tween the number of detected illegal bor-der-crossings of the non-regional flow originating from Greece/Turkey (over 380 000 reported by the six Western Bal-kan countries at and between BCPs) and the discovered illegal stayers of the same nationalities (roughly 130) indicates that these persons mainly regard the Western Balkans region as a transit area.
Figure 7. Only a small share of non-regional nationalities reported for illegal border-crossing are detected as illegal stayers (indicating that they regard the Western Balkans just as a transit area)Illegal stayers, by reporting Western Balkan country, top shares (left) and nationality (right)
Source: WB-RAN data as of 14 January 2016
Illegal stay in Western Balkan countries
9 of 23
wb-ran · q3 2015

The number of detected illegal border-crossings by the non-regional transiting flow throughout the analysed quarter was unprecedented and beyond comparison with any previous period. More exactly, the quarterly total of 611 527 detected ille-gal border-crossings by non-regional mi-grants (611 303 between BCPs and 224 at BCPs) was over two times higher than the overall number of such detections regis-tered since data collection began six and a half years ago (i.e. 208 000 illegal bor-der-crossings reported between January 2009 and June 2015).
The direct link between the non-regional migration flow transiting the Western Bal-kans and the one affecting Greece’s borders especially in the Eastern Aegean Sea was also maintained during the third quarter. Specifically, the pressure from the Aegean Islands manifested itself on the Western Balkan route with a certain time lag which is basically the time migrants need to or-ganise their onwards movements (Fig. 8).
Large and sustained transiting flow through the Western Balkans strains border capacities
During the third quarter of 2015 the non-regional migration flow continued to enter the Western Balkans across the southern common borders with Greece and Bul-garia before heading north and leaving the region, across the Hungarian-Serbian and, starting from mid-September, across the Croatian-Serbian border section.
The migratory flow increased dramatically starting at the end of June, which can be attributed to several factors such as the amendments to the Asylum Law in the former Yugoslav Republic of Macedonia (72-hour legal transit and access to public transportation) or the publicised restrictive measures prepared by the authorities of affected countries. Namely, non-regional migrants took advantage of the legal travel facilities in the former Yugoslav Republic of Macedonia and accelerated their tran-sit in order to reach the most attractive EU Member States/Schengen Associated Countries in time before the Hungarian or Croatian authorities toughened their migration policies and imposed border restrictions. Furthermore, migrants’ per-ceptions influenced by mixed media mes-sages about destination countries also played an important role in accelerating and attracting the flow.
Along with the steep increase in the num-ber of non-regional migrants the author-ities of the former Yugoslav Republic of Macedonia and Serbia began having dif-ficulties in handling the flow transiting their countries. For example, 60% of the migrants detected by the former Yugo-slav Republic of Macedonia in Q3 were re-ported as ‘unknown’ nationality, indicating that the authorities screening capacities were stretched to the limit. At the same time, Serbian statistics had to be revised, as due to some confusions they did not in-
clude as illegal border-crossings between BCPs those migrants who expressed the intention to claim asylum upon detection on the border and were allowed to travel so that they could reach reception centre.
Throughout the analysed period, en masse migration (groups of 500–1 000 people) became common. People quickly realised that authorities can be overwhelmed and thus allow free entry to all. Subsequent at-tempts by some countries to reintroduce a level of control (i.e. the former Yugo-slav Republic of Macedonia trying to seal its border with Greece at the end of Au-gust) failed for the same reason.
In an attempt to relieve the high migra-tory pressure at their borders and within their territories, the authorities of the for-mer Yugoslav Republic of Macedonia and also Serbia went from trying to prevent migrants from entering to providing them with organised onwards transportation. This involved special trains and bus con-voys. Consequently, these measures ac-celerated and the flow and transferred the pressure along the route, towards the re-gion’s northern common borders and fur-ther inside the EU.
After Hungary sealed off its green border with Serbia in mid-September, the pres-sure at this section immediately eased (from 9 000 detections on 15 September to 410 on 16 September) and the numbers continued to decrease reaching a daily av-erage of below 182 detections in the last ten days of September.
However, the flow was only diverted to-wards the Croatian-Serbian border while still continuing to increase. As a result, the Croatian-Serbian border section went from reporting an average of 17 detections
Figure 8. The migration pressure observed in the Eastern Aegean is later reflected in the Western BalkansDetections of illegal border-crossing by migrants originating outside the Western Balkans
Source: FRAN and WB-RAN data as of 14 January 2016
10 of 23
II. Featured risk analyses

to Q2 and the highest number since data collection began). Figure 9. The southern borders continue
to be the main points of entry to the region. The Croatian-Serbian border increases its importance as an exit point after mid-SeptemberShares of the non-regional flow detected between BCPs in Q2 and Q3 2015 by top border sections
Source: WB-RAN data as of 14 January 2016
Figure 10. All top five nationalities contributed to the sharp increase in detections during Q3. Pakistanis and Iraqis consistently ranked high in the whole Western Balkans regionDetections of illegal border-crossing between BCPs by non-regional migrants
Source: WB-RAN data as of 14 January 2016
at regional level involved migrants regis-tered as unknown (during August and es-pecially September).
Amongst the known nationalities, Syrians and Afghans ranked top, followed by Iraqis and Pakistanis. These four nationalities ac-count for roughly 56% of the non-regional flow, while as mentioned above, roughly 41% of the flow remains ‘unknown’. All of the top five nationalities detected for ille-gal border-crossing between BCPs contrib-uted to the sharp increase observed during the analysed quarter (Fig. 10).
More detailed analyses aimed at revealing some of the underlying reasons behind the high number of detections involving Pa-kistani and Iraqi migrants are presented in the following sections of the present report.
Despite lower numbers compared to other nationalities (8 742 illegal border-crossings between BCPs), during the analysed pe-riod another increase can be observed in detections of African migrants through-out the Western Balkans (+39% compared
per month between January and August to being confronted with a daily average of over 6 000 entries from Serbia between the middle and the end of September (i.e. over 90 800 detections between 16 and 30 September).
Similar to the situation at the border be-tween Greece and the former Yugoslav Republic of Macedonia, once the non-re-gional flow started transiting the Croa-tian-Serbian section, the authorities faced serious difficulties in screening and regis-tering the migrants (i.e. >99% of the flow was reported as ‘unknown nationality’).
Throughout the region, the main reported migrants continued to be Syrians and Af-ghans but the very high inflow made it impossible for the authorities to screen all arrivals, thus leading to a massive in-crease in the number of migrants reported with unknown nationality. More exactly, during the analysed quarter roughly 41% of the illegal-border crossings reported
The flow of Afghans towards the EU is likely to remain high
Media reports from the end of October 2015 suggest that every night roughly 60 buses travel from Kabul to Nimruz (the most common last departure place for Afghan migrants who intend to travel via the land route across Iran and onwards).
Moreover, reports from the beginning of November 2015 tend to confirm the information presented in the Western Balkans Q2 analysis according to which Afghans living in Pakistan face serious risk of deportation. The Pa-kistani authorities declared they would be unwilling to extend the right to stay for 1.5 million registered Afghans beyond December 2015. All these peo-ple will have to be returned within the next two years. Furthermore, the unregistered Afghans living in Pakistan (estimated at one million) are even more likely to be returned in line with the new policy of Pakistan.
The prospect of expulsion from Pakistan could encourage Afghans living there to try moving to the EU.
11 of 23
wb-ran · q3 2015

According to the State Bank of Pakistan, remittances4 from overseas migrants amounted to USD 18.4 billion in the fis-cal year 2014–15, representing a 16% in-crease over the previous period. Inflows from Saudi Arabia were the largest source of remittances, followed by those from the United Arab Emirates together ac-counting for USD 9.8 billion. Remittances from other Gulf Cooperation Council (GCC)countries also amounted to USD 2.1 billion. This means that the GCC accounts for a 65% share of the remittances Pakistan re-ceives, while the rest is divided between the UK and the United States (a 22.8% share) and, to a lesser extent, Norway, Switzerland, Australia and other coun-tries (a 7% share).
According to existent statistics, remit-tances account for an increasing share of Pakistan’s GDP (going from 5.7% in 2011 to almost 7% in 2015).5 Logically, the re-cent increase in remittances also con-tributed to the GDP growth registered in 2014 and 2015.
Despite this economic growth, a survey conducted in 2014 by the Pakistani Sta-tistics Bureau6, indicates that 37% of the population perceived their economic sit-uation as worse or much worse than in the previous year, 40% did not notice any change while only 20% perceived it as bet-ter or much better.
4 http://tribune.com.pk/story/920286/pakistan-pockets-remittances-amounting-to-18-4b/
5 http://data.worldbank.org/indicator/BX.TRF.PWKR.DT.GD.ZS
6 http://www.pbs.gov.pk/sites/default/files/pslm/publications/pslm_prov_dist_2012-13/satisfaction/5.1.pdf
Main factors affecting irregular migration from Pakistan appear to be of economic nature
2013. Importantly, the same report indi-cates that, statistically, the security situa-tions in all FATA regions has either already improved or is improving, due to the vari-ous military operations conducted in these regions. This is important as a number of Pakistani migrants claim that they origi-nate from these areas and that they were forced to leave the country due to inse-curity when detected at the EU’s exter-nal borders.
Analysing the country’s situation from an economic point of view may help provide some more explanations regarding the in-creased migratory flow observed in the recent period.
Pakistan saw two consecutive years of growth in 2014 (4.03%) and 2015 (4.2%). While the GDP growth rate is commend-able given Pakistan’s past performance, it is still far below the 5–7% required to ab-sorb new entrants into the labour force and to check rising unemployment.
However, if compared with the GDP growth for the entire South Asian region – of which Pakistan is the second largest economy – Pakistan’s growth of almost 4% in the past five years remains below its regional peers, which averaged almost 7%. Bangladesh has been growing at over 6% for the past few years while India, has been able to maintain the average growth of well over 5% over the past five years.
Inflation in Pakistan has fallen dramati-cally in the fiscal year 2014–15, with the pace of decline quicker than that of some regional peers. The decline is attributed to cheaper oil prices that fell by almost 50% in the same period.
Between January and September 2015 on the Eastern Mediterranean route there were roughly 12 000 detected illegal bor-der-crossings by Pakistani migrants, of which roughly 7 000 only during the third quarter. As a knock-on effect, roughly 25 000 illegal border-crossings between BCPs by Pakistanis were registered on the Western Balkan route in the framework of the WB-RAN, of which almost 20 000 during Q3.
The 7 000 illegal-border crossings by Pa-kistani migrants on the Eastern Mediter-ranean route and 20 000 on the Western Balkan route reported in the third quar-ter of 2015 represent new records for this nationality.
Migrants from Pakistan tend to transit Tur-key before entering Greece and then the Western Balkans. This is why it may seem unusual that the number of illegal border-crossings of this nationality is higher in the Western Balkans than on the Eastern Ae-gean Islands. However, this difference could be explained by the fact that the same mi-grant may be reported several times at dif-ferent border sections while transiting the Western Balkans region.
Judging by the information available in open sources, Pakistan did not experi-ence any developments that would jus-tify a rise in the migration flow originating from this country.
From a security point of view, the Aus-trian Fact Finding Mission Report of Sep-tember 20153 indicates that the situation in Pakistan, despite not being perfect, has improved at national level compared with
3 http://www.bfa.gv.at/files/berichte/PAKI_FFM%20Report_2015_09.pdf
12 of 23
II. Featured risk analyses
Moreover, according to a September 2014 study ‘Determinants of migration in Paki-stan’, published in the Mediterranean Jour-nal of Social Sciences7, 80% of the surveyed persons declare low paying jobs as push factors for migration and 70% see higher salaries as pull factors.
The study also indicates that ‘the higher rate of poverty reduction among the mi-grants’ families in the rural and urban ar-eas of Pakistan, the greater chance will be likely to the international migration’.
Judging by the above, the main push fac-tors for migration originating from Pa-kistan are of economic nature, with the Middle East remaining the main desti-nation area. Despite economic growth of Pakistan, the survey published by the national statistical bureau indicates that this growth went largely unnoticed as the majority of the population (77%) assessed their household economic situation as ei-ther unchanged or worse compared with the previous year.
7 http://www.mcser.org/journal/index.php/mjss/article/viewFile/3948/3864
The recent increase in the amount of re-mittances received by Pakistan is likely to encourage more economic migration. This is supported by the findings of the men-tioned study on determinants of migration in Pakistan, which indicates that the bet-ter migrants are able to reduce the pov-erty of their families through the money they send home, the more attractive mi-gration seems to others.
In the same line of thinking, considering the fact that most Pakistani consider low income as the most important reason to migrate and their economic situation as either unchanged or deteriorated in re-lation to previous periods, it is likely that more Pakistanis will seek employment abroad in the future.
Judging by the size of remittances, the oil-rich Middle Eastern Countries remain the first choice for Pakistani economic mi-grants for the time being. However, the fact that a considerable amount of remit-tances also originates from EU Member
States/Schengen Associated Countries, es-pecially the UK, Norway and Switzerland also highlights these countries as impor-tant destinations.
With this in mind, it is logical to assume that a slow-down of infrastructure spend-ing by GCC countries (likely if the oil prices remain low for a longer period) would neg-atively impact Pakistani employees and consequently reduce the flow of remit-tances from this part of the world. In the same context, if remittances originating from EU Member States/Schengen Asso-ciated Countries remain at the same level or continue to increase, more Pakistani economic migrants may opt for European countries as their final destinations.
A better implementation of the EU-Pa-kistan readmission agreement discussed in October8 could help reduce the attrac-tiveness of the EU for economic migrants from the south-east Asian country.
8 Communication from the Commission to the European Parliament, the European Council and the Council – Managing the refugee crisis: State of Play of the Implementation of the Priority Actions under the European Agenda on Migration – COM 510/14.10.2015
13 of 23
wb-ran · q3 2015
As a knock-on effect, roughly 280 000 il-legal border-crossings between BCPs by Syrians (236 500 in Q3) and 29 000 by Ira-qis (21 200 in Q3) were registered on the Western Balkan route reported in the con-text of the WB-RAN.
Given the geographical proximity of these two countries of origin to the Eastern part of the EU and the Western Balkans, it is somewhat natural that the highest number of detected Syrian and Iraqi mi-grants are reported on the two mentioned routes.
Syria and Iraq are neighbouring countries, both also share a border with Turkey. The ethnic and linguistic composition of their populations (mainly Arabic and Kurdish) is also very similar. Therefore, it is hardly sur-prising that the Iraqi and Syrian migrants use similar routes and modi operandi. The two nationalities tend to transit Turkey, reach the external borders of Greece and then move via the Western Balkans to reach their final destinations in the more developed EU Member States/Schengen Associated Countries.
Perceptions generally play an important role in migration decisions. One of such perceptions is that Syrian nationals are of-fered better prospects of moving and re-ceiving international protection in the EU. For example, ever since 2014 Syrian nation-als have not been kept in closed reception centres after being apprehended in Greece, and they are currently allowed to leave the Eastern Aegean Islands aboard ferries in order to go and register their asylum re-quest in Athens.
Due to these perceived advantages, other nationals may falsely claim to be Syrian (the so-called nationality swapping) and
Iraqi migrant flow towards Europe and the influence of the Syrian crisis
manage to obtain Turkish visas without difficulty and then travel legally to Tur-key, even flying from Baghdad to Istanbul. Older information also indicates that Iraqi migrants who choose to illegally cross into Turkey employ locals familiar with the ter-rain to guide them across the land border in the area of Zakho/Silopi.
Moreover, despite the fact that Iraqis need a visa to enter Turkey, in 2014 there were almost twice as many regular passengers reported at Şırnak-Habur, the main BCP of Turkey with Iraq (3.74 million), as those at the main BCP with Greece (1.98 million). Furthermore, in terms of the entry/exit ratio of Iraqis, which could be indicative of the risk of overstaying or transit, there were 61 000 more entries to Turkey dur-ing 2014. Considering this, the visa obli-gation is not a major obstacle for Iraqis to enter Turkey when they need to. Like-wise, the entry/exit ratio suggests that Turkey is treated as a transit country on route to Greece.
Public transport is used to travel across Turkey, with Istanbul and Izmir being the main hubs where deals with facilitators for the onwards journey to Europe are made. Generally, the cost of crossing the Aegean Sea to the Greek islands is around EUR 1 500, while the facilitators who guide people across Turkey’s land borders to Bul-garia charge around EUR 1 000.
Iraqi migration: the impact of the Syrian crisis, geography and perceptions
Between January and September 2015, roughly 306 000 Syrians (227 000 in Q3) and about 23 300 Iraqis (roughly 19 000 in Q3) were reported in the Eastern Med-iterranean sea and land routes.
Increased propensity of Iraqis to leave their country
According to open-source information, living standards in Iraqi Kurdistan have rapidly deteriorated as politicians hag-gle over power. Basic services and essen-tials, including electricity, cooking gas and water, are not guaranteed and corruption permeates the quasi-institutions of the Kurdistan Regional Government (KRG) and society at large.
Furthermore, the security situation in Iraq also plays an important role in the peo-ple’s decision to migrate. According to the Internal Displacement Monitoring Centre (IDMC), there were at least 4 million in-ternally displaced persons in Iraq as of 15 June 2015, which can also be regarded as a push factor.
Apparently, the growing proportion of population of Iraqi Kurdistan is frustrated by the recent developments and likely to leave the country. There are no precise figures but the United Nations estimates that more than 50 000 people left Iraq over the summer of 2015.
Moreover, during September and Octo-ber Iraqi authorities were also confronted with an unusually high demand for new passports (roughly 13 000 applications per day), while flights from Baghdad to Tur-key were booked for months in advance.
These developments tend to point towards an increased propensity of Iraqis to leave their country.
Main modus operandi and routes
Information obtained during debriefing activities indicates that Iraqi migrants
14 of 23
II. Featured risk analyses
sometimes even obtain fraudulent Syrian documents (a phenomenon revealed dur-ing debriefing interviews conducted in the Eastern Aegean and also further along the route, in Hungary).
This perception, along with the geograph-ical proximity, the ethnic, cultural and lin-guistic similarities of Iraq and Syria, may have encouraged many Iraqis to falsely claim Syrian nationality and enter the EU, often successfully. Thus the real number of Iraqis who have already reached the
Iraqi security forces leaving for Europe
Some Iraqi soldiers are abandoning their posts and joining a wave of civil-ian migrants headed for Europe, raising new doubts about the cohesion of the country’s Western-backed security forces in the fight against ISIL/Da’ish militants. Interviews with migrants and an analysis of social media activity suggest that scores of servicemen of the national army, police and special forces, as well as Shiite militias and Kurdish peshmerga, have defected in recent months or plan to leave soon.
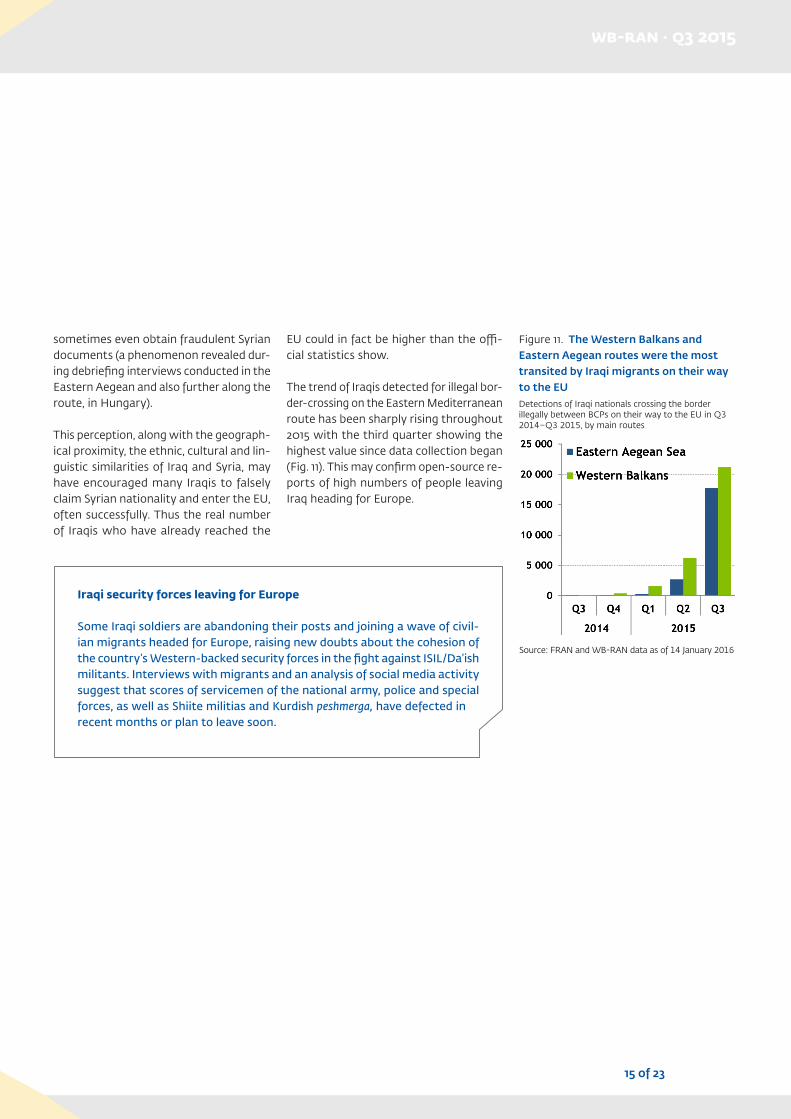
EU could in fact be higher than the offi-cial statistics show.
The trend of Iraqis detected for illegal bor-der-crossing on the Eastern Mediterranean route has been sharply rising throughout 2015 with the third quarter showing the highest value since data collection began (Fig. 11). This may confirm open-source re-ports of high numbers of people leaving Iraq heading for Europe.
Figure 11. The Western Balkans and Eastern Aegean routes were the most transited by Iraqi migrants on their way to the EUDetections of Iraqi nationals crossing the border illegally between BCPs on their way to the EU in Q3 2014–Q3 2015, by main routes
Source: FRAN and WB-RAN data as of 14 January 2016
15 of 23
wb-ran · q3 2015

III. Statistical annex
LEGEND
Symbols and abbreviations: n.a. not applicable : data not available
Source: WB-RAN and FRAN data as of 15 January 2016, unless otherwise indicated
Note: ‘Member States’ in the tables refer to FRAN Member States, including both 28 EU Member States and three Schengen Associated Countries
16 of 23

Table 1. Illegal border-crossing between BCPsDetections reported by Western Balkan and neighbouring countries, by purpose of illegal border-crossing, top five border sections and top ten nationalities
2015 Q32014 2015 % change on per cent
of totalQ2 Q3 Q4 Q1 Q2 Q3 year ago previous Qtr
Purpose of Illegal Border–Crossing
Irregular migration 4 571 6 006 9 326 15 739 46 797 476 179 7 828 918 77Not defined 2 698 8 751 27 715 32 802 34 439 138 596 1 484 302 23Other 93 91 85 69 92 88 -3.3 -4.3 0.0Smuggling 80 72 67 143 328 84 17 -74 0.0
Top Five Sections
FYR Macedonia - Greece 413 675 499 591 6 547 259 986 38 416 3 871 42Hungary - Serbia 2 959 9 762 29 579 35 274 39 459 142 918 1 364 262 23FYR Macedonia - Serbia 671 1 082 1 288 5 381 21 881 98 209 8 977 349 16Croatia - Serbia 318 280 108 174 173 91 698 32 649 52 905 15Bulgaria - Serbia 27 147 557 1 886 7 828 18 673 12 603 139 3Others 3 054 2 974 5 162 5 447 5 768 3 463 16 -40 0.6
Top Ten Nationalities
Not specified 16 36 138 137 214 247 991 688 764 115 784 40Syria 1 000 3 912 6 476 8 446 33 182 236 445 5 944 613 38Afghanistan 1 232 2 605 5 445 7 986 24 293 67 428 2 488 178 11Iraq 31 114 383 1 618 6 258 21 198 18 495 239 3.4Pakistan 100 107 241 897 3 891 19 757 18 364 408 3.2Bangladesh 23 70 176 404 951 4 765 6 707 401 0.8Albania 2 947 2 995 4 018 2 760 3 749 2 972 -0.8 -21 0.5Iran 22 60 113 236 643 2 332 3 787 263 0.4Somalia 166 101 66 1 113 1 511 1 634 1 518 8.1 0.3Palestine 88 370 515 351 757 1 506 307 99 0.2Others 1 817 4 550 19 622 24 805 6 207 8 919 96 44 1.5
Total 7 442 14 920 37 193 48 753 81 656 614 947 4 022 653 100
17 of 23
wb-ran · q3 2015
18 of 23
FRAN · q1 2015
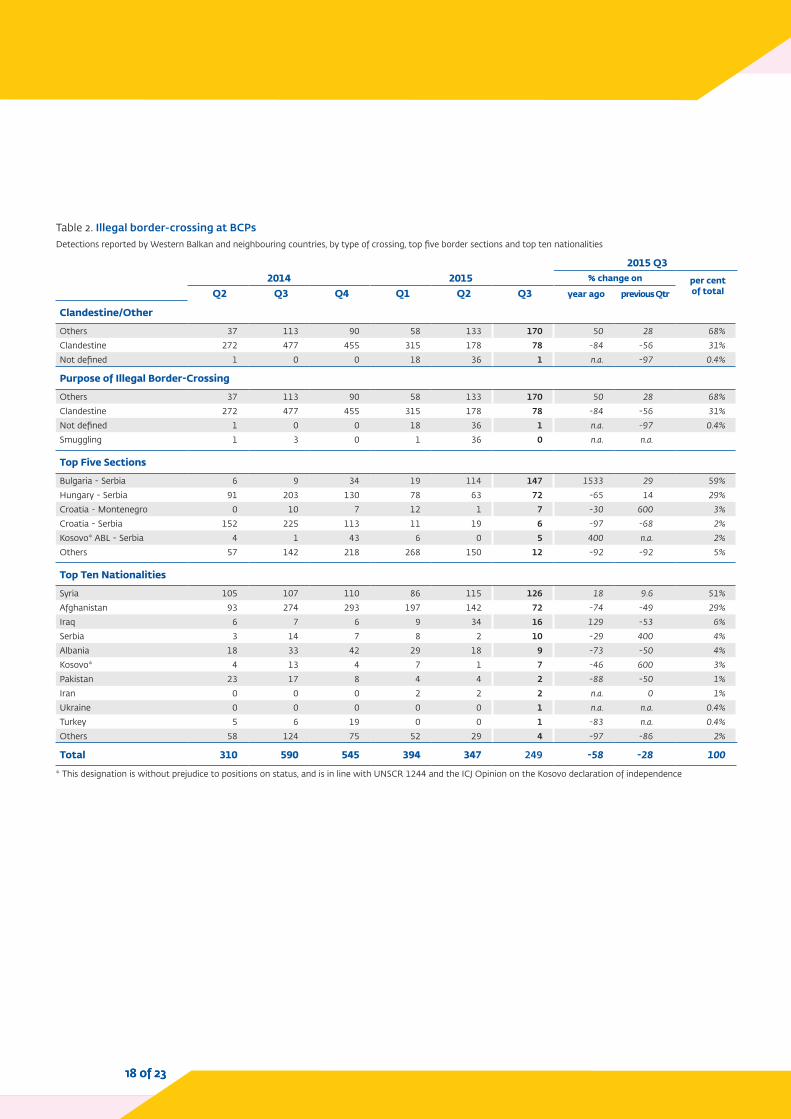
Table 2. Illegal border-crossing at BCPsDetections reported by Western Balkan and neighbouring countries, by type of crossing, top five border sections and top ten nationalities
2015 Q32014 2015 % change on per cent
of totalQ2 Q3 Q4 Q1 Q2 Q3 year ago previous Qtr
Clandestine/Other
Others 37 113 90 58 133 170 50 28 68%Clandestine 272 477 455 315 178 78 -84 -56 31%Not defined 1 0 0 18 36 1 n.a. -97 0.4%
Purpose of Illegal Border-Crossing
Others 37 113 90 58 133 170 50 28 68%Clandestine 272 477 455 315 178 78 -84 -56 31%Not defined 1 0 0 18 36 1 n.a. -97 0.4%Smuggling 1 3 0 1 36 0 n.a. n.a.
Top Five Sections
Bulgaria - Serbia 6 9 34 19 114 147 1533 29 59%Hungary - Serbia 91 203 130 78 63 72 -65 14 29%Croatia - Montenegro 0 10 7 12 1 7 -30 600 3%Croatia - Serbia 152 225 113 11 19 6 -97 -68 2%Kosovo* ABL - Serbia 4 1 43 6 0 5 400 n.a. 2%Others 57 142 218 268 150 12 -92 -92 5%
Top Ten Nationalities
Syria 105 107 110 86 115 126 18 9.6 51%Afghanistan 93 274 293 197 142 72 -74 -49 29%Iraq 6 7 6 9 34 16 129 -53 6%Serbia 3 14 7 8 2 10 -29 400 4%Albania 18 33 42 29 18 9 -73 -50 4%Kosovo* 4 13 4 7 1 7 -46 600 3%Pakistan 23 17 8 4 4 2 -88 -50 1%Iran 0 0 0 2 2 2 n.a. 0 1%Ukraine 0 0 0 0 0 1 n.a. n.a. 0.4%Turkey 5 6 19 0 0 1 -83 n.a. 0.4%Others 58 124 75 52 29 4 -97 -86 2%
Total 310 590 545 394 347 249 -58 -28 100
* This designation is without prejudice to positions on status, and is in line with UNSCR 1244 and the ICJ Opinion on the Kosovo declaration of independence
18 of 23

19 of 23
FRAN · q1 2015
Table 3. FacilitatorsDetections reported by Western Balkan and neighbouring countries, by place of detection and top ten nationalities
2015 Q32014 2015 % change on per cent
of totalQ2 Q3 Q4 Q1 Q2 Q3 year ago previous Qtr
Place of Detection
Land 178 242 418 448 551 542 124 -1.6 88Inland 11 44 65 66 21 76 73 262 12Air 2 0 1 0 0 0 n.a. n.a.Sea 2 6 2 3 0 0 n.a. n.a.
Top Ten Nationalities
Serbia 89 92 254 285 338 348 278 3 56Bulgaria 7 20 22 30 32 51 155 59 8.3Albania 36 61 60 49 48 38 -38 -21 6.1Greece 14 22 28 21 31 28 27 -9.7 4.5Hungary 2 6 5 10 11 23 283 109 3.7Not specified 11 18 18 27 13 22 22 69 3.6Pakistan 1 1 0 0 0 20 1900 n.a. 3.2Iraq 1 0 1 0 1 14 n.a. 1300 2.3Romania 0 0 5 3 5 14 n.a. 180 2.3Croatia 5 1 4 4 3 8 700 167 1.3Others 27 71 89 88 86 52 -27 -40 8.4
Total 193 292 486 517 572 618 112 8 100
Table 4. Illegal stayDetections reported by Western Balkan and neighbouring countries, by place of detection and top ten nationalities
2015 Q32014 2015 % change on per cent
of totalQ2 Q3 Q4 Q1 Q2 Q3 year ago previous Qtr
Place of Detection
Land 1 299 1 611 1 232 925 1 595 966 -40 -39 60
Inland 1 349 926 2 096 1 185 778 562 -39 -28 35Not specified 167 114 158 99 110 87 -24 -21 5.4
Top Ten Nationalities
Serbia 1 032 864 684 700 791 599 -31 -24 37Albania 249 215 245 167 149 127 -41 -15 7.9Syria 275 415 1 439 391 547 125 -70 -77 7.7FYR Macedonia 127 187 130 74 100 107 -43 7 6.6Turkey 175 111 90 74 63 92 -17 46 5.7Bosnia and Herzegovina 50 50 73 62 56 74 48 32 4.6Afghanistan 88 76 62 44 127 42 -45 -67 2.6Kosovo* 69 43 41 47 28 37 -14 32 2.3Montenegro 121 30 16 35 25 36 20 44 2.2Palestine 18 29 114 7 57 28 -3.4 -51 1.7Others 611 631 592 608 540 348 -45 -36 22
Total 2 815 2 651 3 486 2 209 2 483 1 615 -39 -35 100
* This designation is without prejudice to positions on status, and is in line with UNSCR 1244 and the ICJ Opinion on the Kosovo declaration of independence
19 of 23
wb-ran · q3 2015
20 of 23
FRAN · q1 2015
Table 5. Refusals of entryRefusals reported by Western Balkan and neighbouring countries, by border type and top ten nationalities
2015 Q32014 2015 % change on per cent
of totalQ2 Q3 Q4 Q1 Q2 Q3 year ago previous Qtr
Place of Detection
Land 9 503 13 269 9 354 7 762 9 046 12 185 -8.2 35 90Air 685 741 853 704 757 1 380 86 82 10Sea 9 19 2 3 24 40 111 67 0.3
Top Ten Nationalities
Albania 2 735 2 541 2 770 2 206 2 763 2 736 7.7 -1 20Serbia 2 309 2 575 2 426 1 931 1 715 1 844 -28 7.5 14Bosnia and Herzegovina 1 317 1 687 1 359 1 257 1 379 1 391 -18 0.9 10Turkey 417 812 693 554 578 1 364 68 136 10Not specified 179 470 121 80 157 587 25 274 4.3Germany 118 578 82 79 197 544 -5.9 176 4FYR Macedonia 455 568 506 433 463 535 -5.8 16 3.9Kosovo* 299 886 289 263 291 494 -44 70 3.6Romania 118 224 85 98 150 372 66 148 2.7Bulgaria 264 298 239 223 265 372 25 40 2.7Others 1 986 3 390 1 639 1 345 1 869 3 366 -0.7 80 25
Total 10 197 14 029 10 209 8 469 9 827 13 605 -3 38 100
* This designation is without prejudice to positions on status, and is in line with UNSCR 1244 and the ICJ Opinion on the Kosovo declaration of independence
20 of 23

21 of 23
FRAN · q1 2015
Table 6. Applications for asylumApplications for international protection reported by Western Balkan and neighbouring countries, by top ten nationalities
2015 Q32014 2015 % change on per cent
of totalQ2 Q3 Q4 Q1 Q2 Q3 year ago previous Qtr
Top Ten Nationalities
Syria 1 908 4 899 7 952 5 561 13 018 56 443 1 052 334 47Afghanistan 1 812 3 447 6 889 5 772 15 262 30 111 774 97 25Pakistan 509 537 753 1 180 3 329 12 418 2 212 273 10Iraq 213 355 845 1 423 3 856 7 929 2 134 106 6.7Bangladesh 158 263 371 528 918 3 209 1 120 250 2.7Iran 545 203 518 318 563 1 288 534 129 1.1Not specified 130 123 533 522 353 953 675 170 0.8Nigeria 169 197 173 201 461 673 242 46 0.6Congo 73 20 45 111 455 465 2 225 2.2 0.4Kosovo* 368 3 046 17 879 24 268 665 460 -85 -31 0.4Others 2 319 2 378 2 687 2 956 4 553 5 089 114 12 4.3
Total 8 204 15 468 38 645 42 840 43 433 119 038 670 174 100
* This designation is without prejudice to positions on status, and is in line with UNSCR 1244 and the ICJ Opinion on the Kosovo declaration of independence
21 of 23
wb-ran · q3 2015
22 of 23
FRAN · q1 2015
Table 7. Document fraudDetections reported by Western Balkan countries, by border type, document type, fraud type, top ten nationalities and top countries of issuance of documents
2015 Q32014 2015 % change on per cent of
totalQ2 Q3 Q4 Q1 Q2 Q3 year ago previous Qtr
Border TypeLand 114 110 171 161 139 136 24 -2.2 63Air 48 50 59 76 88 60 20 -32 28Sea 24 51 18 23 8 15 -71 88 6.9Not specified 0 2 0 0 0 5 150 n.a. 2.3
Document typePassport 94 131 117 161 119 133 1.5 12 62ID 28 36 87 54 49 43 19 -12 20Stamp 23 8 15 13 49 17 113 -65 7.9Residence permit 14 20 12 17 13 11 -45 -15 5.1Visa 6 5 7 13 5 7 40 40 3.2Unknown 21 13 10 2 0 5 -62 n.a. 2.3
Fraud TypeFalse-counterfeit 57 57 80 64 121 83 46 -31 38Auth-impostor 54 73 64 80 40 46 -37 15 21False-no more details 2 20 20 19 16 22 10 38 10False-new biopage 4 5 10 15 8 16 220 100 7.4False-mutilated 4 2 6 10 9 14 600 56 6.5Others 65 56 68 72 41 35 -38 -15 16
Top Ten NationalitiesAlbania 61 57 81 102 85 74 30 -13 34Kosovo* 68 64 32 43 34 37 -42 8.8 17Serbia 18 15 23 20 34 34 100 -12 14Syria 2 28 47 27 25 18 -36 -28 8.3Turkey 7 8 14 10 21 11 38 -48 5.1Iraq 0 5 3 7 6 11 120 83 5.1Pakistan 0 0 0 1 7 8 n.a. 14 3.7Iran 0 4 2 2 2 6 50 200 2.8Ukraine 0 0 0 0 0 2 n.a. n.a. 0.9Others 30 32 46 48 21 15 -53 -29 6.9
Top Ten Countries of Issuance of DocumentsAlbania 37 50 55 72 56 63 26 13 29Serbia 21 16 25 30 42 22 38 -48 10Greece 16 23 22 27 27 15 -35 -44 6.9Italy 8 8 29 26 18 11 38 -39 5.1Bulgaria 14 15 14 12 10 10 -33 0 4.6Switzerland 4 4 2 6 4 8 100 100 3.7France 4 3 5 9 2 7 133 250 3.2Slovenia 11 4 3 5 4 6 50 50 2.8Turkey 2 3 4 6 13 6 100 -54 2.8Russian Federation 0 0 0 0 2 6 n.a. 200 2.8Others 69 87 89 67 57 62 -29 8.8 29
Total 186 213 248 260 235 216 1.4 -8.1 100
* This designation is without prejudice to positions on status, and is in line with UNSCR 1244 and the ICJ Opinion on the Kosovo declaration of independence
22 of 23
23 of 23
FRAN · q1 2015
Explanatory note
Detections reported for EU Member States for indicators Illegal border-crossing be-tween BCPs, Illegal border-crossing at BCPs, Refusals of entry and Document fraud are detections at the common land borders on entry only. For Facilitators, de-tections at the common land borders on entry and exit are included.
For Illegal stay, detections at the common land borders on exit only are included. For Asylum, all applications (land, sea, air and inland) are included.
For Western Balkan countries, all indica-tors – save for Refusals of entry – include detections (applications) on exit and entry at the land, sea and air borders.
Each section in the table (Reporting coun-try, Border type, Place of detection, Top five border section and Top ten national-ities) refers to total detections reported by WB-RAN countries and to neighbour-ing land border detections reported by EU Member States.
23 of 23
wb-ran · q3 2015

For Public Release
Risk Analysis Unit
Reference number: 20615/2015
TT-AI-15-003-EN-N ISBN 978-92-95205-34-5 ISSN 2443-8367 DOI 10.2819/56872
Warsaw, January 2016
European Agency for the Management of Operational Cooperation at the External Borders of the Member States of the European Union
Plac Europejski 6 00-844 Warsaw, Poland
T +48 22 205 95 00 F +48 22 205 95 01
[email protected] www.frontex.europa.eu