Embed Size (px)
Citation preview
AUSTRALIAN VENTURE CONSULTANTS PTY LTD
1
Western Australian Resources Industry
Construction to Operations Phase
Workforce Study
An investigation into the workforce dynamics and implications for skills,
training and education as major projects transition from a construction
phase to an operational phase
June 2014
AUSTRALIAN VENTURE CONSULTANTS PTY LTD
2
CONTENTS
Executive Summary ................................................................................................................................... 5
Background and Purpose ...................................................................................................................... 10
Background ........................................................................................................................................... 10
Study Limitations ................................................................................................................................... 12
Current Resource Project Construction Pipeline and Workforce Estimates ................................. 14
Transition from Construction to Operations......................................................................................... 16
Project Development Cycle .............................................................................................................. 16
Impact on Resources Company Workforce ................................................................................... 19
Impact on the Construction Workforce ........................................................................................... 21
Resources Project Construction Workforce Dynamics ..................................................................... 24
Demand and Supply ........................................................................................................................... 24
Nature of the Resources Construction Workforce ......................................................................... 25
Relationship between the Mining and Construction Industry Workforces .................................... 35
Revenue and Employment ................................................................................................................ 35
Demographic Comparison ................................................................................................................ 43
Education and Training Comparison ................................................................................................ 45
Key Occupations .................................................................................................................................. 50
Assessment of Workforce Commonality .......................................................................................... 53
Lessons from the Recent Construction Phase..................................................................................... 55
Implications for Skills, Training and Education .................................................................................... 57
Conclusions ............................................................................................................................................... 58
Appendix 1 – Overview of Western Australian Resources Industry Construction Projects ......... 59
Oil and Gas Projects ............................................................................................................................ 59
Iron Ore Projects ................................................................................................................................... 61
Ammonium Nitrate, Nitrate and Urea Projects ............................................................................... 64
Gold Projects ......................................................................................................................................... 64
Resources Infrastructure Projects ....................................................................................................... 65
Appendix 2: Construction and Operational Workforce Estimate .................................................. 67
Appendix 3: 2012-13 Submissions to Infrastructure Australia ............................................................ 69
AUSTRALIAN VENTURE CONSULTANTS PTY LTD
3
Disclosure and Disclaimer
This document has been prepared by Australian Venture Consultants Pty Ltd (ACN: 101 195 699) (‘AVC’). AVC
has been commissioned to prepare this publication by the Resources Industry Training Council (RITC) and has
received a fee from the RITC for its preparation.
While the information contained in this publication has been prepared by AVC with all reasonable care from sources
that AVC believes to be reliable, no responsibility or liability is accepted from AVC for any errors, omissions or
misstatements however caused. Any opinions or recommendations reflect the judgment and assumptions of AVC
as at the date of the document and may change without notice. AVC, its officers, agents and employees exclude
all liability whatsoever, in negligence or otherwise, for any loss or damage relating to this document to the full extent
permitted by law. Any opinion contained in this publication is unsolicited general information only. AVC is not aware
that any recipient intends to rely on this document or of the manner in which a recipient intends to use it. In preparing
this information it is not possible to take into consideration the information or opinion needs of any individual
recipient. Recipients should conduct their own research into the issues discussed in this document before acting
on any recommendation.
AUSTRALIAN VENTURE CONSULTANTS PTY LTD
4
Interviewees
While this study was based primarily on the review of published data and literature, the
following experts provided key input and guidance to the study.
Andrew Blitz, Business Development Manager, Western Australian Local Government
Association
John Galvin, Executive General Manager, Georgiou Group
Bindi Gove, Government and External Affairs Manager, BHP Billiton Petroleum
Kiersten Gregg, General Manager Human Resources, Rio Tinto Iron Ore
Kapila Karunaratna, GM Technical, Mitsubishi Development
John Phillips, Executive Manager Workplace Business Solutions, Western Australian
Local Government Association
Jeanette Roberts, Australian Chair, Kvaerner
Justin Willis, Practice Leader Rail and Crawler Mounted Mobile Machines, SKM
AUSTRALIAN VENTURE CONSULTANTS PTY LTD
5
Executive Summary
Background
The recent resources industry investment phase has involved a total investment of A$457 billion
(at current prices) in new resources industry capital in Australia since 2004, an average of
approximately A$40 billion per annum over that period. Approximately 55.5 percent of this
investment has been associated with Western Australian resources projects, particularly in the
iron ore and oil and gas sectors. Presently, there remains a pipeline of 48 new resources
projects with an associated capital investment of A$229 billion that are currently under
construction or have been committed to by their proponents.
This has had a dramatic impact on demand for a range of skills from the project proponents,
EPCMs managing the construction of those projects and their contractors, which have been
sourced from construction labour markets across Australia and overseas.
The resources industry is now passing through peak investment phase, with many large
resources industry construction projects transitioning into an operational phase. As such, the
size of the total workforce associated with these projects as well as the occupational structure
of that workforce will change, focusing on the operational human resource requirements.
Transition from Construction to Operations
When a new resources project transitions from the construction phase to the operational
phase the size of the total workforce associated with the project decreases dramatically. The
degree to which the size of the workforce decreases is unique to the nature of the construction
project and the operational specifics of the project. Anecdotally, the operational workforce
can be:
As low as 4 percent of the size of the construction workforce in the case of oil and gas
projects;
Around 35 percent of the size of the construction workforce in the case of iron ore
projects;
Approximately 10 percent of the size of the construction workforce in the case of
ammonium, ammonium nitrate and urea projects;
Around 7 percent of the size of the construction workforce in the case of gold projects;
and
15 precent of the size of the construction workforce for port oriented resources
infrastructure projects.
In most cases, the skills profiles have limited commonality, particularly in the case of the oil and
gas industry. In the mining industry, occupational skills are skewed heavily toward specialist
skills such as drillers and shot-firers, metal fitters and machinists and truck drivers). In
occupational skills where there is commonality such as electricians, the operational resources
industry needs in terms of workforce numbers are very small compared to those of the
construction industry.
It is key to note that the operational workforce is not a subset of the construction workforce.
The construction workforce is comprised primarily of employees and contractors of the
construction industry companies that have been successful tenderers for aspects of the
resources construction project. When the construction project is complete, those construction
AUSTRALIAN VENTURE CONSULTANTS PTY LTD
6
industry employees and contractors remain in the construction industry, moving onto new
projects within the resources industry or more widely. Very few, if any, construction workers
transition to an operational role in a resources project.
This is primarily because, for the following reasons, the construction industry workforces are
culturally and structurally quite different:
Skills in most construction industry occupations are developed to be applicable to a
wide range of construction projects. Whereas, skills in resources industry operational
roles tend to be relatively specialised for the specific task; and
The construction workforce is largely a mobile workforce that selects the projects and
locations in which it works based on personal utility. Workers comprising that work force
are comfortable with geographic and project diversity and often thrive on that
diversity. Whereas, workers that comprise the operational resources industry workforce,
typically seek a higher degree of permanency and stability.
Most of the reduction in project workforce as projects transition to operations is the result of
construction contractors and subcontractors completing their specific tasks and exiting the
project. However, some positions that were created in the resources companies to oversee
and support the construction process also become redundant. The position most affected by
this is the project management role within the resources companies. Individuals in project
management roles are unlikely to transition back into operational roles and will be redeployed
on sustaining capital projects within the companies, or become employed by other
companies executing construction projects or by EPCMs.
During the recent resources industry investment phase, graduate programs have expanded in
many companies as these companies sought to grow the pool of professional staff available
to them. In many cases, the transition from construction to operational phase has seen a
decrease in internal activity, rendering it difficult to find places for these graduates outside of
the graduate program. This may result in a surplus of junior mining executives in the market
place in the short term until the graduate program intakes equalise.
While many companies have expanded apprentice and trainee programs on the same basis,
there is less of a challenge in the market for trade persons, apprentices and trainees. The
relative size of the pool of demand for trade skills within the resources sector and the wider
construction industry means that there is likely to be greater opportunity in the marketplace
for apprentices and trainees that have been trained on resources construction projects.
As resources projects transition to operations, some of the construction labour that is released
from these projects will be absorbed into other resources construction projects such as Roy Hill
and resources projects sustaining capital programs. But the vast majority will likely seek
employment in the conventional residential and non-residential construction sectors and the
infrastructure construction sectors, particularly transport infrastructure. Some opportunities may
also arise from investment by the Australian Defence Force.
Resources and Construction Industry Labour Market Dynamics
Whereas the operation of most resources projects is capital intensive, the construction of those
projects is labour intensive. Unlike most labour intensive enterprise, resources project
construction does not have the luxury of locating most of the labour intensive components of
the exercise in close proximity to the required labour markets. The construction workforce is
AUSTRALIAN VENTURE CONSULTANTS PTY LTD
7
located across most parts of the world, has very versatile skills and is by its nature, a relatively
mobile workforce.
Most Western Australian resources projects are located in remote, isolated regions. If they are
in proximity to a population centre, those population centres have limited civic capacity and
limited employment opportunities beyond the new resources projects and related
infrastructure, rendering permanent relocation of a construction workforce highly unlikely. As
such, the only way that new resources projects in Western Australia can access adequate
supply of workers during the investment phase is through overseas migration and/or domestic
and international long-distance commuting.
Subclass 457 Visas have been a significant source of professional and trade labour for
resources construction projects, and while long-distance commuters comprise only
approximately 2 percent of the total Australian labour force, they are critically important to
the resources industry and resources industry projects evidenced by the fact that:
The Pilbara Region is the second most common destination for long distance
commuters;
The Perth-Pilbara Region route is the most common long distance route in the Nation;
and
Approximately 70 percent of long distance commuters between Perth and the Pilbara
Region are machinery operators and drivers or technicians and trade workers.
Resources and Construction Industries Compared
The wider construction industry is substantially larger than the resources industry. In 2011-12, the
resources industry produced total revenues of approximately $240 billion, approximately 75
percent of which was produced by the coal, iron ore and oil and gas sectors. Whereas, in the
same period, the construction industry produced total revenues of approximately $305.5
billion, of which construction services accounted for approximately 45 percent and building
construction 33 percent. The heavy and civil engineering construction sector, which is the
sector of the construction industry that is most dependent on revenue from mining construction
projects, accounted for only 22 percent of construction industry revenues. Revenue from
mining projects accounts for approximately 38 percent of primary contracting revenue from
trade services in the heavy and civil engineering construction sector, but only 9 and 5 percent
in the building construction and construction services sectors respectively. The heavy and civil
engineering construction sector also operates on lower margins than the other sectors of the
Australian construction industry.
The construction industry also employs approximately 3.5 times as many people as the
resources industry. Of the 263,000 people employed in the resources industry, approximately
75 percent are employed in coal, metal ore and non-metallic mining and exploration and
other mining support roles. Of the 950,000 people employed in the Australian construction
industry, the vast majority (approximately 68 percent) are employed in the construction
services sector, with only approximately 15 percent employed in the heavy and civil
engineering construction sector. Whereas the majority of people working in the construction
services sector work for the approximate 17,500 small businesses in the sector, the majority of
workers in the heavy and civil engineering construction sector work for the approximate 70
large businesses in the sector.
In terms of geographic location, the construction industry workforce in each of the sectors that
comprise the industry is reasonably equally distributed across the larger states of New South
AUSTRALIAN VENTURE CONSULTANTS PTY LTD
8
Wales, Victoria, Queensland and Western Australia. The fact that there isn’t a skew in the
construction industry workforce toward Western Australia and Queensland is probably
reflective of considerable residential and non-residential construction markets in the more
populated states of New South Wales and Victoria, and the long-distance commuter intensity
of the resources project construction workforce.
The gender and age distribution of both the mining and construction workforce is reflective of
the physical nature of work in both industries, with both workforces dominated by males under
45 years of age. A much larger portion of the construction industry workforce is employed in in
capital cities as opposed to the regions.
The level of training and education qualification attained by labourers, technician and trade
workers, equipment operators and drivers and professionals employed in the mining and
construction industries is comparable. However, in the case of the construction industry
substantially more managers have certificate III/IV qualifications than is the case in the mining
industry. In the mining industry more managers have bachelor degrees or higher qualifications
than in the construction industry. This is reflective of the larger number of trade supervisors in
the construction industry and the more specialist technical intensity of an operational
resources project.
In terms of intensity of demand for skills the greatest commonality is in the roles of electricians
and earth moving plant operators, as well as speciality areas of construction and engineering
managers. However, the demand for these skills during the operational phase of the projects
is very limited compared to the opportunities in the wider construction industry for these
occupations.
There is likely to be common demand for other occupations such as structural steel and
welding trades, truck drivers and plumbers. However, the operational resources projects tend
to employ fewer numbers of persons in these roles and many functions such as drillers and shot
firers who comprise a large component of the mining industry workforce are specialist skills.
Furthermore, many of the general trades deployed at operational resources projects have a
specialist focus.
Lessons from the Recent Construction Phase
Over the past decade resources project development costs in Australia, and particularly in
Western Australia, do not compare well with other jurisdictions. A range of factors have
contributed to the unfavourable cost environment in Australia, including the evolution of the
mechanism that resources companies use to manage project construction. Necessary
increased focus on OHS and environment along with a need to integrate effectively with larger
EPCM teams on large projects, means that the internal project management teams within
resources companies have grown considerably in size and cost.
Similarly at the construction site, enhanced supervision and OHS requirements have seen
construction teams grow in size. Fragmentation of OHS training providers across sites often
results in a lack of accreditation of existing OHS training for site induction, resulting in delays of
several hours or more to get new contractors onto site.
Implications for Skills, Training and Education
As a result of the structural and cultural differences between the construction workforce and
the operational workforce there is unlikely to be a substantive market for supplementary
training designed to transition resources project construction workers to operational roles in
projects. The main opportunities for training and education are acquiring a deeper

AUSTRALIAN VENTURE CONSULTANTS PTY LTD
9
understanding of the root cause of the productivity penalties associated with the investment
phase over the past decade and integrating those learnings in training and education
programs targeted at the resources and construction industries. Key areas in which learnings
could be gained include investment cycle management, project management, complex
remote project construction and OHS induction.
AUSTRALIAN VENTURE CONSULTANTS PTY LTD
10
Background and Purpose
Background Over the past decade, the Australian, and particularly the Western Australian, economy has
navigated one of the largest waves of private capital investment in its history. The recent
resource sector expansion, has involved a total investment of A$457 billion (at current prices)
in new resources industry capital in Australia since 2004. This equates to an average of
approximately A$40 billion per annum during that period. Approximately 55.5 percent of this
investment has been associated with Western Australian resources projects, particularly in the
iron ore and oil and gas sectors.
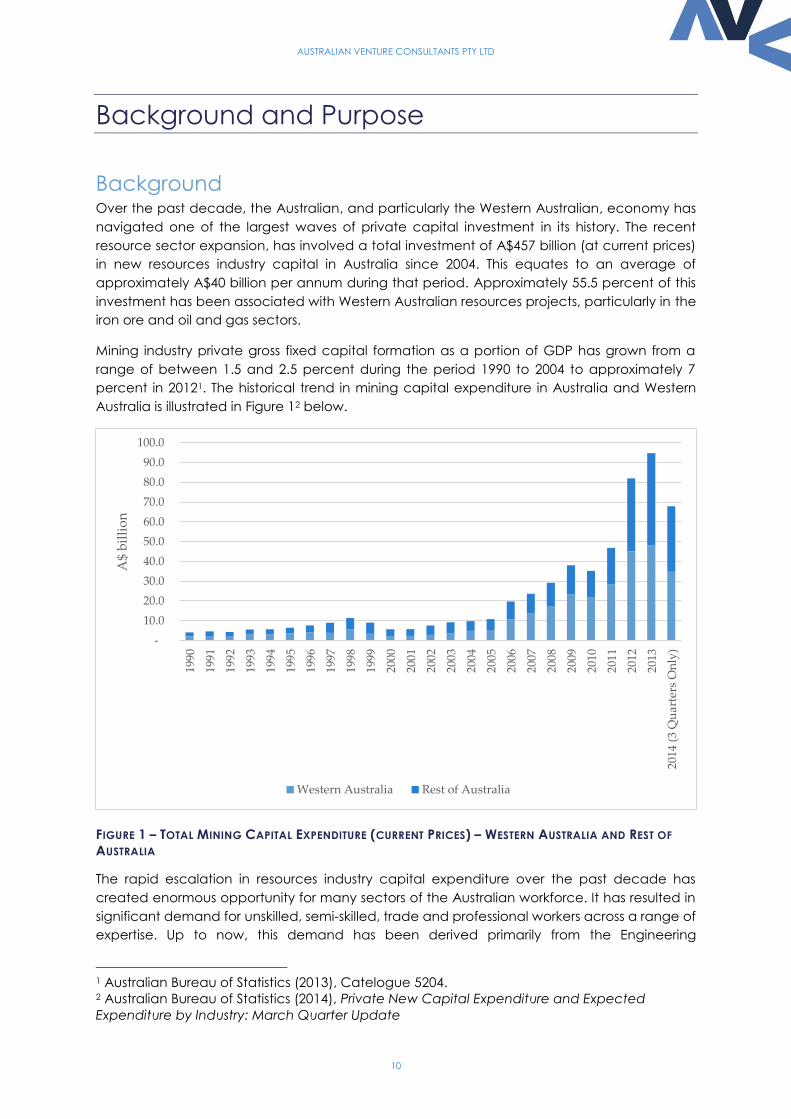
Mining industry private gross fixed capital formation as a portion of GDP has grown from a
range of between 1.5 and 2.5 percent during the period 1990 to 2004 to approximately 7
percent in 20121. The historical trend in mining capital expenditure in Australia and Western
Australia is illustrated in Figure 12 below.
FIGURE 1 – TOTAL MINING CAPITAL EXPENDITURE (CURRENT PRICES) – WESTERN AUSTRALIA AND REST OF
AUSTRALIA
The rapid escalation in resources industry capital expenditure over the past decade has
created enormous opportunity for many sectors of the Australian workforce. It has resulted in
significant demand for unskilled, semi-skilled, trade and professional workers across a range of
expertise. Up to now, this demand has been derived primarily from the Engineering
1 Australian Bureau of Statistics (2013), Catelogue 5204. 2 Australian Bureau of Statistics (2014), Private New Capital Expenditure and Expected
Expenditure by Industry: March Quarter Update
-
10.0
20.0
30.0
40.0
50.0
60.0
70.0
80.0
90.0
100.0
1990
1991
1992
1993
1994
1995
1996
1997
1998
1999
2000
2001
2002
2003
2004
2005
2006
2007
2008
2009
2010
2011
2012
2013
2014
(3
Qu
arte
rs O
nly
)
A$
bil
lio
n
Western Australia Rest of Australia
AUSTRALIAN VENTURE CONSULTANTS PTY LTD
11
Procurement and Construction Managers (EPCMs) and their construction industry contractors
and subcontractors that give effect to the substantial construction projects that have
constituted the recent expansion of the Australian resources industry. As the new and
expanded resources industry project transition to an operational phase, opportunities will be
created for skillsets that are aligned with the operational requirements of these projects.
The recent investment phase has resulted in considerable short-to-medium term labour
migration to locations where the investment in new resources projects is occurring, particularly
Western Australia and Queensland, as well as rapid growth in the domestic Fly-In-Fly-Out (FIFO)
workforce and temporary migrant workers via 457 subclass visas.
As summarised in Table 13 below there is still a total of 48 resources projects with a total capital
investment of $229 billion that have been committed to or are currently under construction,
more than half of which are in Western Australia. Additionally, there is an uncommitted pipeline
of 144 projects with capital investment of $154 billion at feasibility stage.
Project Stage Western Australia Rest of Australia Total
Feasibility No 44 100 144
A$b 58.0 96.5 154.5
Committed No 18 30 48
A$b 115.7 113.2 228.9
Completed No 11 10 21
A$b 19.8 5.9 25.7
TABLE 1 – AUSTRALIAN RESOURCES PROJECT CONSTRUCTION PIPELINE
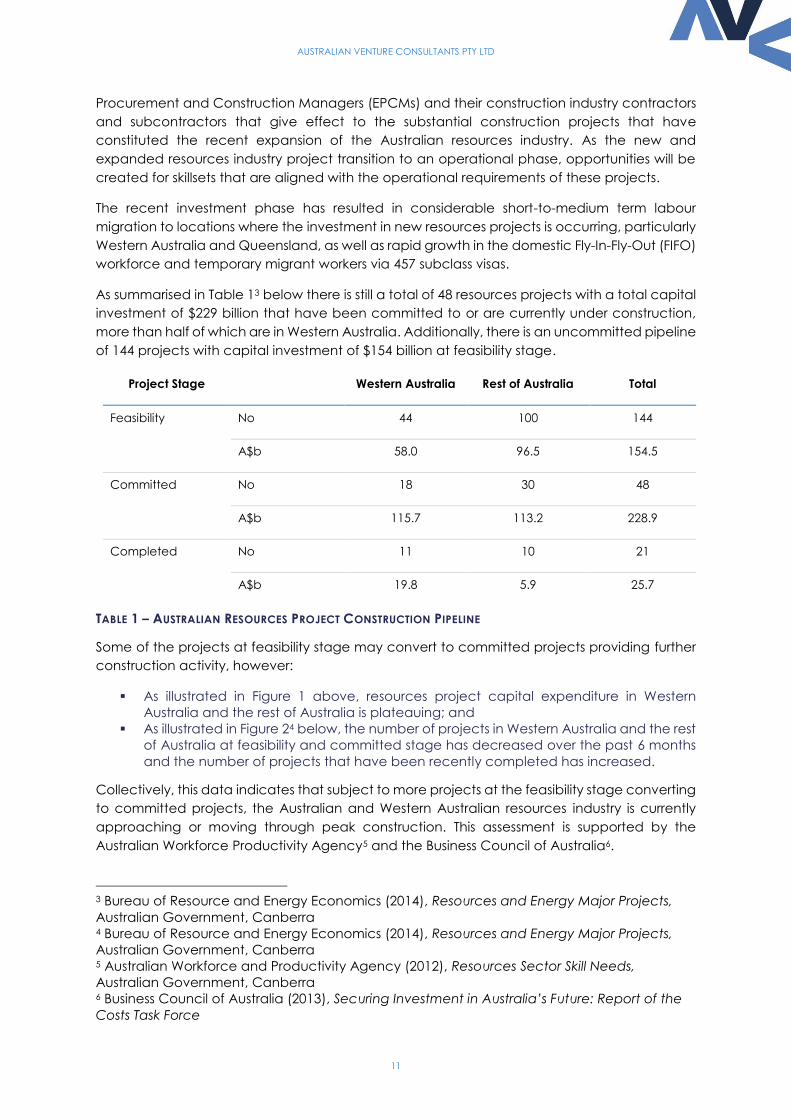
Some of the projects at feasibility stage may convert to committed projects providing further
construction activity, however:
As illustrated in Figure 1 above, resources project capital expenditure in Western
Australia and the rest of Australia is plateauing; and
As illustrated in Figure 24 below, the number of projects in Western Australia and the rest
of Australia at feasibility and committed stage has decreased over the past 6 months
and the number of projects that have been recently completed has increased.
Collectively, this data indicates that subject to more projects at the feasibility stage converting
to committed projects, the Australian and Western Australian resources industry is currently
approaching or moving through peak construction. This assessment is supported by the
Australian Workforce Productivity Agency5 and the Business Council of Australia6.
3 Bureau of Resource and Energy Economics (2014), Resources and Energy Major Projects,
Australian Government, Canberra 4 Bureau of Resource and Energy Economics (2014), Resources and Energy Major Projects,
Australian Government, Canberra 5 Australian Workforce and Productivity Agency (2012), Resources Sector Skill Needs,
Australian Government, Canberra 6 Business Council of Australia (2013), Securing Investment in Australia’s Future: Report of the
Costs Task Force
AUSTRALIAN VENTURE CONSULTANTS PTY LTD
12
FIGURE 2 – SIX MONTH TREND IN RESOURCE CONSTRUCTION PROJECT PIPELINE – WESTERN AUSTRALIA AND
REST OF AUSTRALIA
Construction activity will continue in the resources industry supported by currently committed
projects, those projects at feasibility stage that progress through final investment decision and
ongoing historically large sustaining capital programs. However, irrespective of this, demand
for resources construction workers will decrease from peak demand in the short to medium
term.
This phenomenon raises a number of questions that are pertinent to the deliberations of the
Resources Industry Training Council (RITC), such as:
What happens to the resources project construction workforce as demand for these
skills eases?
Is there an opportunity to deploy part of this workforce in new operational roles created
by the new projects and if so, is there a need for training and education to support
this?
Are there lessens from the recent construction phase in terms of skills requirements,
productivity and HSE that can be built into training and education programs?
The RITC has engaged Australian Venture Consultants (AVC) to undertake an investigation into
these issues. This paper describes the findings of that investigation.
Study Limitations The original scope of this study had anticipated the development of a detailed quantitative
model that:
Demonstrates the size, occupation and skills segmentation of the workforce associated
with the resources industry investment phase over the past decade;
Demonstrates the workforce requirements in terms of size, occupations and skills
segmentation of new projects as they transition to an operational phase; and
0
20
40
60
80
100
120
October 2013 April 2014
Nu
mb
er o
f P
roje
cts
Feasibility Western Australia Feasibility Australia
Committed Western Australia Committed Australia
Completed Western Australia Completed Australia
AUSTRALIAN VENTURE CONSULTANTS PTY LTD
13
Identifies any workforce transition relationship between the construction and
operational workforces of these projects.
It was also intended to identify examples in other industries where a major construction
workforce had transitioned to an operational workforce.
For two reasons, the study encountered significant difficulty in developing this model and
providing these examples. Firstly attaining detailed project employment data from companies,
EPCMs and contractors proved challenging. This was likely partly the result of political
sensitivities associated with aspects of workforce transition, but also as a result of the practical
difficulties in collecting and providing this data. Secondly, as discussed throughout this report,
the incidence of worker transition from construction roles to operational roles is very low,
primarily because the culture and lifestyle choices of construction workers is very different to
that of operational workers, as are most of the skills requirements.
The study has endeavoured to address this limitation by providing adequately supported
anecdotal evidence of the observations made in the study and by exploring other issues
associated with the recent investment phase and transition to operations that might be of
interest to the RITC, such as opportunities to focus future training and education on issues that
might improve construction project productivity.
AUSTRALIAN VENTURE CONSULTANTS PTY LTD
14
Current Resource Project Construction
Pipeline and Workforce Estimates
As discussed in the introductory section of this report, there are currently 18 committed new
resources projects in Western Australia with aggregate associated capital expenditure of
approximately A$116 billion. In addition, there are a further 11 projects with an associated
capital expenditure of approximately A$20 billion recently completed. This section of the
report summarises the projects currently under construction in terms of their status, key issues,
and where data is available, the size and nature of their construction and prospective
operational workforces.
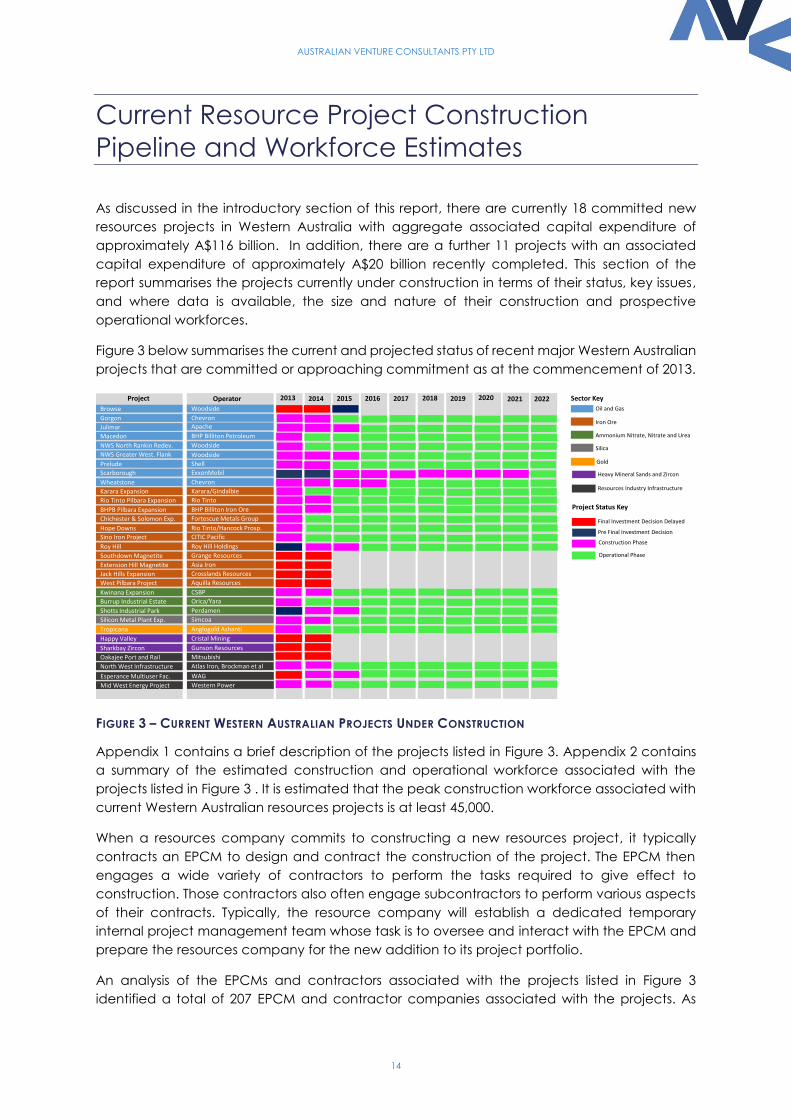
Figure 3 below summarises the current and projected status of recent major Western Australian
projects that are committed or approaching commitment as at the commencement of 2013.
FIGURE 3 – CURRENT WESTERN AUSTRALIAN PROJECTS UNDER CONSTRUCTION
Appendix 1 contains a brief description of the projects listed in Figure 3. Appendix 2 contains
a summary of the estimated construction and operational workforce associated with the
projects listed in Figure 3 . It is estimated that the peak construction workforce associated with
current Western Australian resources projects is at least 45,000.
When a resources company commits to constructing a new resources project, it typically
contracts an EPCM to design and contract the construction of the project. The EPCM then
engages a wide variety of contractors to perform the tasks required to give effect to
construction. Those contractors also often engage subcontractors to perform various aspects
of their contracts. Typically, the resource company will establish a dedicated temporary
internal project management team whose task is to oversee and interact with the EPCM and
prepare the resources company for the new addition to its project portfolio.
An analysis of the EPCMs and contractors associated with the projects listed in Figure 3
identified a total of 207 EPCM and contractor companies associated with the projects. As
Browse
Gorgon
Julimar
Macedon
NWS North Rankin Redev.
NWS Greater West. Flank
Prelude
Scarborough
Wheatstone
Karara Expansion
Rio Tinto Pilbara Expansion
BHPB Pilbara Expansion
Chichester & Solomon Exp.
Hope Downs
Sino Iron Project
Roy Hill
Southdown Magnetite
Extension Hill Magnetite
Jack Hills Expansion
West Pilbara Project
Kwinana Expansion
Burrup Industrial Estate
Shotts Industrial Park
Silicon Metal Plant Exp.
Tropicana
Happy Valley
Sharkbay Zircon
Oakajee Port and Rail
North West Infrastructure
Project
Woodside
ChevronApache
BHP Billiton Petroleum
Woodside
Woodside
Shell
ExxonMobil
Chevron
Karara/Gindalbie
Rio Tinto
BHP Billiton Iron Ore
Fortescue Metals Group
Rio Tinto/Hancock Prosp.
CITIC Pacific
Roy Hill Holdings
Grange Resources
Asia Iron
Crosslands Resources
Aquilla Resources
CSBP
Orica/Yara
Perdamen
Simcoa
Anglogold Ashanti
Cristal Mining
Gunson Resources
Mitsubishi
Atlas Iron, Brockman et al
Operator 2013 2014 2015 2016 2017 2018 2019 2020 2021 2022 Sector Key
Oil and Gas
Iron Ore
Ammonium Nitrate, Nitrate and Urea
Silica
Gold
Heavy Mineral Sands and Zircon
Resources Industry Infrastructure
Project Status Key
Final Investment Decision Delayed
Construction Phase
Operational Phase
Pre Final Investment Decision
Esperance Multiuser Fac.
Mid West Energy Project
WAG
Western Power
AUSTRALIAN VENTURE CONSULTANTS PTY LTD
15
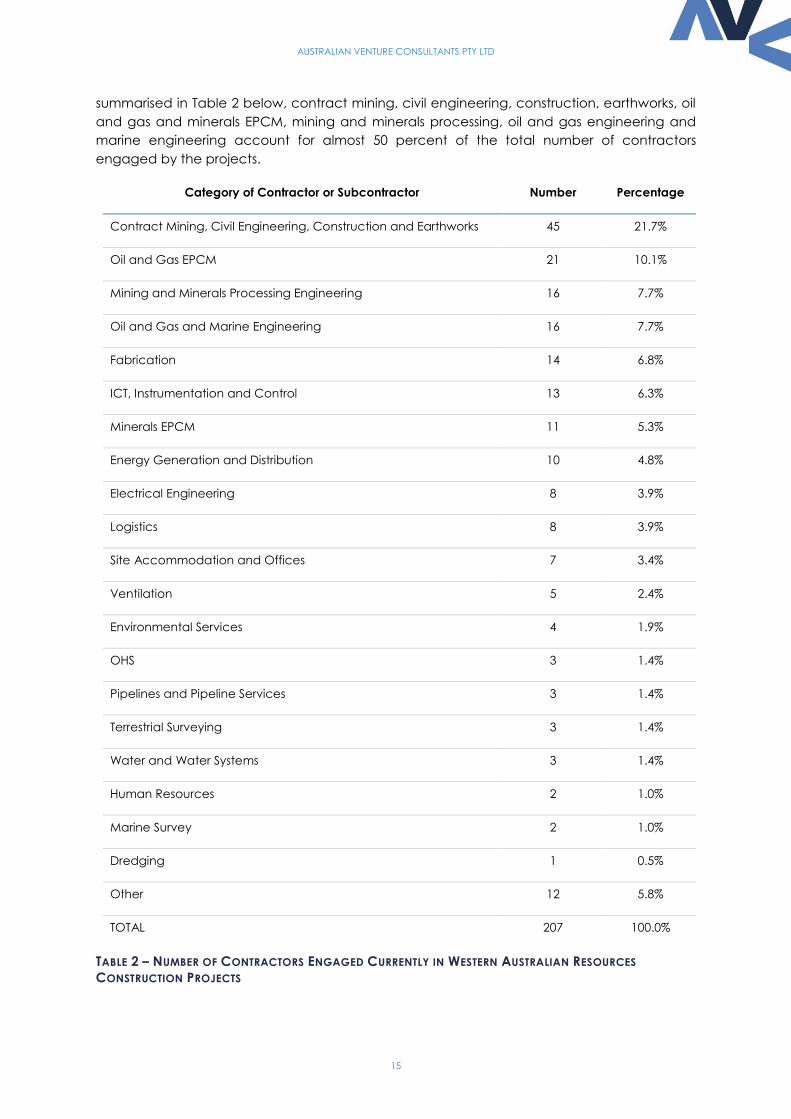
summarised in Table 2 below, contract mining, civil engineering, construction, earthworks, oil
and gas and minerals EPCM, mining and minerals processing, oil and gas engineering and
marine engineering account for almost 50 percent of the total number of contractors
engaged by the projects.
Category of Contractor or Subcontractor Number Percentage
Contract Mining, Civil Engineering, Construction and Earthworks 45 21.7%
Oil and Gas EPCM 21 10.1%
Mining and Minerals Processing Engineering 16 7.7%
Oil and Gas and Marine Engineering 16 7.7%
Fabrication 14 6.8%
ICT, Instrumentation and Control 13 6.3%
Minerals EPCM 11 5.3%
Energy Generation and Distribution 10 4.8%
Electrical Engineering 8 3.9%
Logistics 8 3.9%
Site Accommodation and Offices 7 3.4%
Ventilation 5 2.4%
Environmental Services 4 1.9%
OHS 3 1.4%
Pipelines and Pipeline Services 3 1.4%
Terrestrial Surveying 3 1.4%
Water and Water Systems 3 1.4%
Human Resources 2 1.0%
Marine Survey 2 1.0%
Dredging 1 0.5%
Other 12 5.8%
TOTAL 207 100.0%
TABLE 2 – NUMBER OF CONTRACTORS ENGAGED CURRENTLY IN WESTERN AUSTRALIAN RESOURCES
CONSTRUCTION PROJECTS
AUSTRALIAN VENTURE CONSULTANTS PTY LTD
16
Transition from Construction to Operations
Project Development Cycle Once an in situ resource has been determined by a project proponent to exhibit size, grade,
reservoir (in the case of petroleum), geotechnical, mineralogy, access to infrastructure and
other key characteristics that adequately indicate there is a prima facie case for development
of that in situ resource, the general process for development commences with a feasibility
study (which may be preceded by a pre-feasibility study). A feasibility study will identify,
analyse and compare options for the development of the resource, based primarily on
technical and economic information that is readily available.
Should the feasibility study demonstrate a technically and economically feasible development
option that meets the project proponent’s internal hurdle rate and risk appetite, the project
will likely proceed to the Front-End-Engineering and Design (FEED) phase. If there are numerous
options for developing the project, an interim Basis-of-Design phase may be required to select
the most attractive development options upon which FEED will be based. FEED involves
evaluating technical options for different components of the preferred development
pathway, and the design of an engineering solution that has a cost contingency typically with
a maximum variance of 20 percent.
The end result of FEED is a bankable feasibility study (i.e. an investment case). This bankable
feasibility study then undergoes a rigorous internal decision process based on an exhaustive
range of operational, financial and strategic criteria, the end result of which is Final Investment
Decision (FID). At this point the resources company has committed to the project. The project
development process up to this point is usually primarily an internal process supported by
external expertise (including potentially the EPCM that may be contracted to manage the
construction phase).
The nature and quantum of skills required to construct a major resources project is very different
to the nature and quantum of skills required to operate a resources project. Very few, if any
resources companies have the resources required to construct a major new project. As such,
post-FID, a resources company will typically contract an EPCM to complete final detailed
design and procure the diverse construction goods and services required to complete the
construction project.
During this period, the resources company will establish an internal project management team
that will oversee and liaise with the EPCM throughout the construction phase. This team will be
comprised principally of project managers who are usually engineers with resources project
operational experience as well as human resources, Health Safety and Environment (HSE),
finance, legal/contract and administrative personnel.
As construction approaches completion, the project management team will often gradually
be replaced with an operational readiness team. The operational readiness team typically
includes senior operational, mining, process and HSE personnel who will form the leadership in
these areas for the project when it is operational, as well as leadership from the project
management team, internal technical expertise and corporate human resources functions
who will source the operational workforce from within the company and/or externally.
Once operational, most of the operational readiness team will convert into the operational
management team that will manage and lead the recruited operations workforce. The
AUSTRALIAN VENTURE CONSULTANTS PTY LTD
17
project will continue to interact with the construction workforce from time to time for the
purposes of effecting sustaining capital investment, as well as ongoing maintenance.
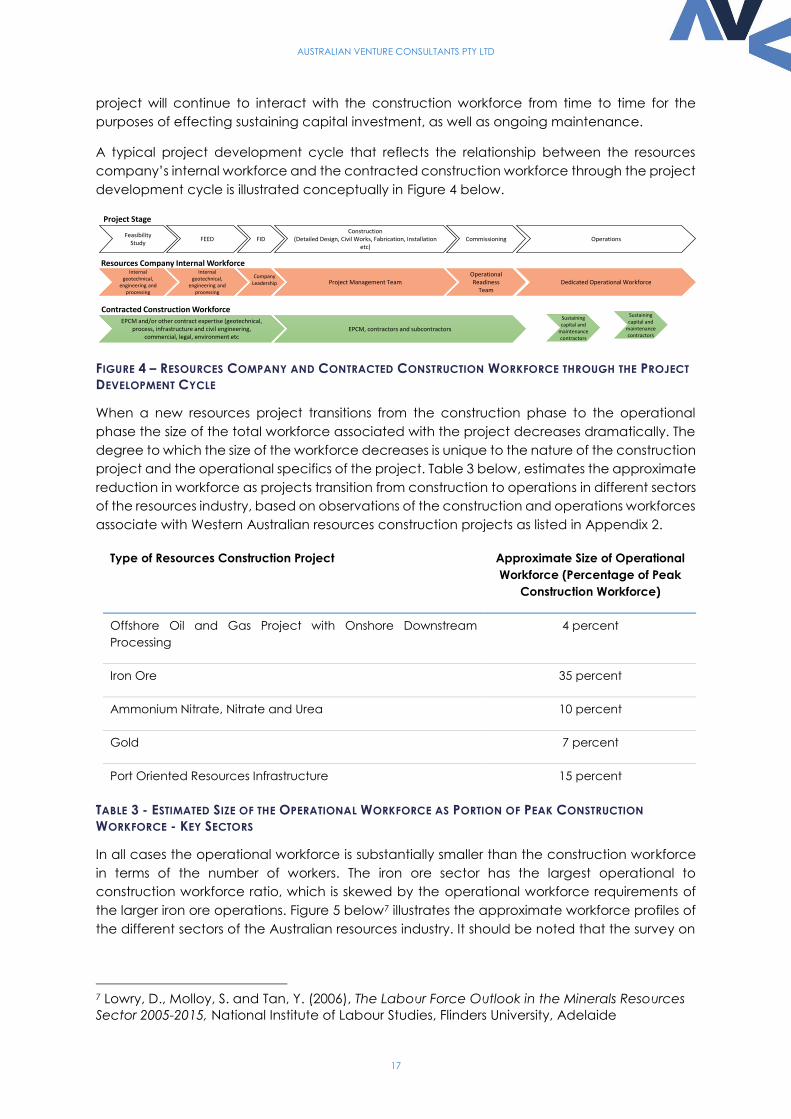
A typical project development cycle that reflects the relationship between the resources
company’s internal workforce and the contracted construction workforce through the project
development cycle is illustrated conceptually in Figure 4 below.
FIGURE 4 – RESOURCES COMPANY AND CONTRACTED CONSTRUCTION WORKFORCE THROUGH THE PROJECT
DEVELOPMENT CYCLE
When a new resources project transitions from the construction phase to the operational
phase the size of the total workforce associated with the project decreases dramatically. The
degree to which the size of the workforce decreases is unique to the nature of the construction
project and the operational specifics of the project. Table 3 below, estimates the approximate
reduction in workforce as projects transition from construction to operations in different sectors
of the resources industry, based on observations of the construction and operations workforces
associate with Western Australian resources construction projects as listed in Appendix 2.
Type of Resources Construction Project Approximate Size of Operational
Workforce (Percentage of Peak
Construction Workforce)
Offshore Oil and Gas Project with Onshore Downstream
Processing
4 percent
Iron Ore 35 percent
Ammonium Nitrate, Nitrate and Urea 10 percent
Gold 7 percent
Port Oriented Resources Infrastructure 15 percent
TABLE 3 - ESTIMATED SIZE OF THE OPERATIONAL WORKFORCE AS PORTION OF PEAK CONSTRUCTION
WORKFORCE - KEY SECTORS
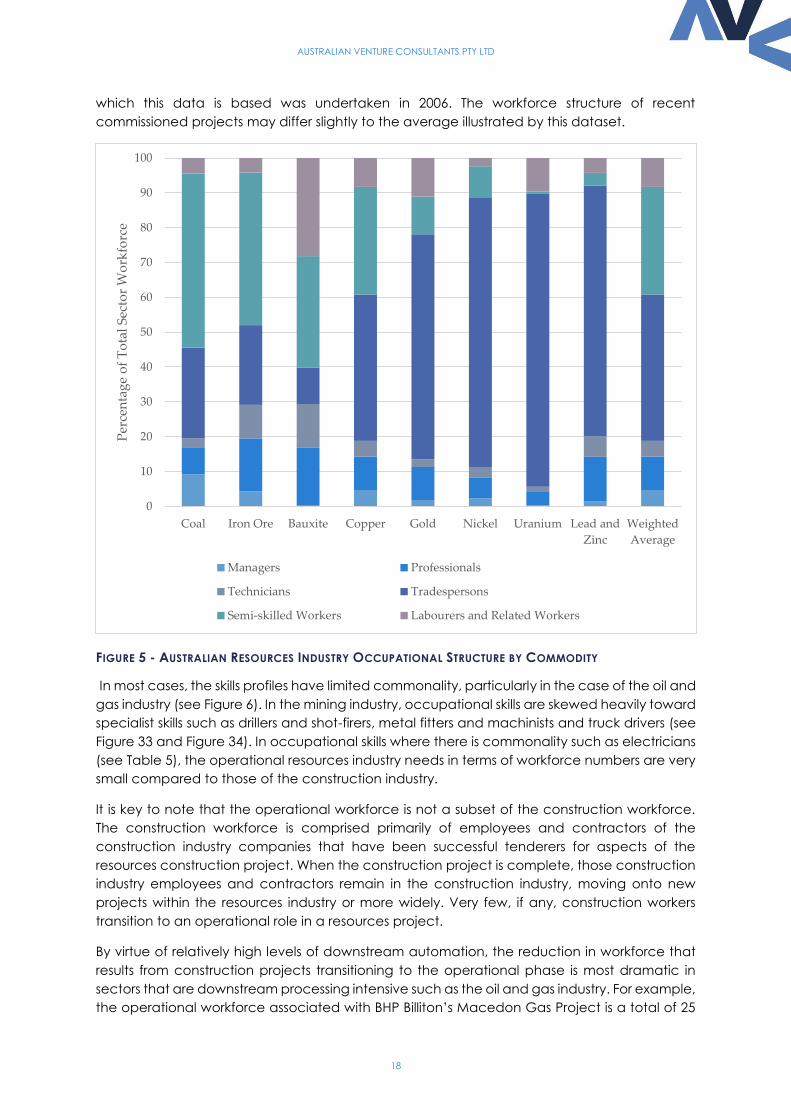
In all cases the operational workforce is substantially smaller than the construction workforce
in terms of the number of workers. The iron ore sector has the largest operational to
construction workforce ratio, which is skewed by the operational workforce requirements of
the larger iron ore operations. Figure 5 below7 illustrates the approximate workforce profiles of
the different sectors of the Australian resources industry. It should be noted that the survey on
7 Lowry, D., Molloy, S. and Tan, Y. (2006), The Labour Force Outlook in the Minerals Resources
Sector 2005-2015, National Institute of Labour Studies, Flinders University, Adelaide
Feasibility Study
FEED FIDConstruction
(Detailed Design, Civil Works, Fabrication, Installation etc)
Commissioning Operations
Internal geotechnical,
engineering and processing
Internal geotechnical,
engineering and processing
Project Management TeamOperational Readiness
TeamDedicated Operational Workforce
EPCM and/or other contract expertise (geotechnical, process, infrastructure and civil engineering,
commercial, legal, environment etc
CompanyLeadership
EPCM, contractors and subcontractors
Sustainingcapital and
maintenancecontractors
Sustainingcapital and
maintenancecontractors
Project Stage
Resources Company Internal Workforce
Contracted Construction Workforce
AUSTRALIAN VENTURE CONSULTANTS PTY LTD
18
which this data is based was undertaken in 2006. The workforce structure of recent
commissioned projects may differ slightly to the average illustrated by this dataset.
FIGURE 5 - AUSTRALIAN RESOURCES INDUSTRY OCCUPATIONAL STRUCTURE BY COMMODITY
In most cases, the skills profiles have limited commonality, particularly in the case of the oil and
gas industry (see Figure 6). In the mining industry, occupational skills are skewed heavily toward
specialist skills such as drillers and shot-firers, metal fitters and machinists and truck drivers (see
Figure 33 and Figure 34). In occupational skills where there is commonality such as electricians
(see Table 5), the operational resources industry needs in terms of workforce numbers are very
small compared to those of the construction industry.
It is key to note that the operational workforce is not a subset of the construction workforce.
The construction workforce is comprised primarily of employees and contractors of the
construction industry companies that have been successful tenderers for aspects of the
resources construction project. When the construction project is complete, those construction
industry employees and contractors remain in the construction industry, moving onto new
projects within the resources industry or more widely. Very few, if any, construction workers
transition to an operational role in a resources project.
By virtue of relatively high levels of downstream automation, the reduction in workforce that
results from construction projects transitioning to the operational phase is most dramatic in
sectors that are downstream processing intensive such as the oil and gas industry. For example,
the operational workforce associated with BHP Billiton’s Macedon Gas Project is a total of 25
0
10
20
30
40
50
60
70
80
90
100
Coal Iron Ore Bauxite Copper Gold Nickel Uranium Lead and
Zinc
Weighted
Average
Per
cen
tag
e o
f T
ota
l S
ecto
r W
ork
forc
e
Managers Professionals
Technicians Tradespersons
Semi-skilled Workers Labourers and Related Workers
AUSTRALIAN VENTURE CONSULTANTS PTY LTD
19
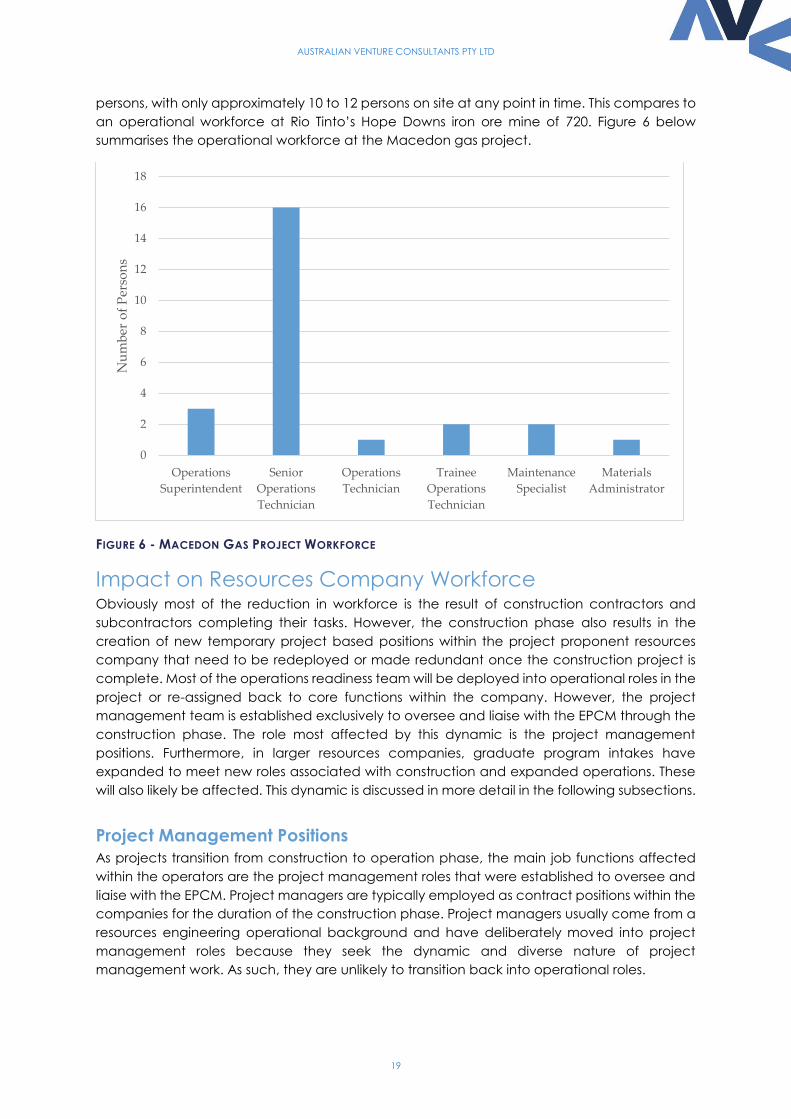
persons, with only approximately 10 to 12 persons on site at any point in time. This compares to
an operational workforce at Rio Tinto’s Hope Downs iron ore mine of 720. Figure 6 below
summarises the operational workforce at the Macedon gas project.
FIGURE 6 - MACEDON GAS PROJECT WORKFORCE
Impact on Resources Company Workforce Obviously most of the reduction in workforce is the result of construction contractors and
subcontractors completing their tasks. However, the construction phase also results in the
creation of new temporary project based positions within the project proponent resources
company that need to be redeployed or made redundant once the construction project is
complete. Most of the operations readiness team will be deployed into operational roles in the
project or re-assigned back to core functions within the company. However, the project
management team is established exclusively to oversee and liaise with the EPCM through the
construction phase. The role most affected by this dynamic is the project management
positions. Furthermore, in larger resources companies, graduate program intakes have
expanded to meet new roles associated with construction and expanded operations. These
will also likely be affected. This dynamic is discussed in more detail in the following subsections.
Project Management Positions
As projects transition from construction to operation phase, the main job functions affected
within the operators are the project management roles that were established to oversee and
liaise with the EPCM. Project managers are typically employed as contract positions within the
companies for the duration of the construction phase. Project managers usually come from a
resources engineering operational background and have deliberately moved into project
management roles because they seek the dynamic and diverse nature of project
management work. As such, they are unlikely to transition back into operational roles.
0
2
4
6
8
10
12
14
16
18
Operations
Superintendent
Senior
Operations
Technician
Operations
Technician
Trainee
Operations
Technician
Maintenance
Specialist
Materials
Administrator
Nu
mb
er o
f P
erso
ns
AUSTRALIAN VENTURE CONSULTANTS PTY LTD
20
Some project managers will likely move onto sustaining capital investment projects within the
companies, particularly those who are highly skilled and therefore a target for retention within
the companies. Others will potentially be recruited by project management teams in other
companies, or by the EPCMs seeking experienced project managers that understand project
proponent decision-making dynamics.
Operational Workforce
New projects will require a new operational workforce. Some of the new operational positions
will be filled internally if the company has existing operational projects. However, the vast
majority will likely be newly recruited to the company. Completing a construction project on
time is a key criteria for construction project performance, which in turn partly motivates
deploying the quantum of resources (within cost constraints) that is required to mitigate the
risk of scheduling slippages. However, once a project is operational, productivity becomes a
key performance measure. As a result, resources companies will seek to optimise labour
productivity when recruiting and managing the operations workforce, perhaps more so than
in the case of the construction workforce. This involves ensuring that workers employed in
longer-term operational roles have:
An optimal range and level of skills for the role;
Workplace values and attitudes that are consistent with the company’s and the
project’s culture, particularly with respect to work ethic and OHS;
Values, attitudes and capacity that motivate them to seek longer-term employment in
order to mitigate the productivity penalties associated with staff turnover;
Characteristics that are aligned with the company’s human resources KPIs such as
diversity.
Graduate, Apprentice and Trainee Positions
Many companies in the resources and construction sector have grown graduate,
apprenticeship and trainee programs in response to internal demand generated by the rapid
escalation of construction activity in the resources industry.
During the recent resources industry investment phase, graduate programs have expanded in
many companies as these companies sought to grow the pool of professional staff available
to them. In many cases, the transition from construction to operational phase has seen a
decrease in internal activity, rendering it difficult to find places for these graduates outside of
the graduate program. This may result in a surplus of junior mining executives in the market
place in the short term until the graduate program intakes equalise.
While many companies have expanded apprentice and trainee programs on the same basis,
there is less of a challenge in the market for trade persons, apprentices and trainees. The
relative size of the pool of demand for trade skills within the resources sector and the wider
construction industry means that there is likely to be greater opportunity in the marketplace
for apprentices and trainees that have been trained on resources construction projects.
AUSTRALIAN VENTURE CONSULTANTS PTY LTD
21
Impact on the Construction Workforce
Managing Workforce Requirements
By virtue of the sheer size of the construction workforce associated with resources project
capital investment since 2004, as the projects transition to an operational phase there will
inevitably be reduction in the demand for skilled and unskilled labour that has been associated
with the construction of these project. This will likely result in a surplus of many construction skills
in the labour market in the short-term. This is most likely not being felt in Western Australia to
any great degree as yet because the more expensive FIFO workers (Eastern States and
Overseas) will naturally be the first to be impacted. However, much of this labour will move
onto other projects within the resources industry, but principally in other sectors of the
economy.
Importantly, increasingly this construction workforce will bring to new projects both within the
resources industry and the wider economy new skills, particularly in remote complex
construction and OHS, enhancing the capability of the Australian construction industry.
Other Resources Industry Projects
The construction of other resources projects such as Roy Hill will absorb some of the
construction workforce as it is released from other projects and other projects in the pipeline
may graduate to construction providing further opportunity in resources project construction.
Additionally, there are significant sustaining capital programs due to commence. For example,
BHP Billiton Iron Ore has an estimated A$2.0 billion of sustaining capital investment in its pipeline.
These programs will also absorb some of the construction workforce as it is released from
projects currently under construction.
Other Construction Market Opportunities
The construction workforce is not resources project specific. As discussed in a subsequent
section of this report, with the exception of the heavy and civil engineering sector, where
mining industry projects account for approximately 38 percent of primary contracting
revenue, mining industry construction projects only account for between 5 and 9 percent of
revenue in other sectors of the construction industry. The Australian construction industry
employs a total of 950,000 people, of which only 16 percent are employed by the sector most
dependent on mining industry projects.
Multi-sector contractors have the luxury of being able to draw employees from sectors where
conditions are softer and redeploy them in sectors where there is stronger demand. This has
been the case with the recent demand for resources project construction. As the resources
project construction market softens, these contractors will redeploy the workforce in markets
where there is growing demand. Interestingly, where this is happening, contractors are
reporting a transfer of improved OHS skills to non-resources projects. As discussed in a following
subsection, the Commonwealth Government’s National Infrastructure Program stands to be a
major beneficiary of this phenomenon.
In terms of civil construction, the main markets where skills will be redeployed are the residential
and non-residential construction markets and the infrastructure construction market. In the
case of fabrication skills, defence force contracts are likely to absorb some of the released
skills.
AUSTRALIAN VENTURE CONSULTANTS PTY LTD
22
Residential and Non-residential Construction Markets
Based on record low interest rates, the Australian Construction Industry Forum is expecting total
residential building expenditure to grow at an average annual growth rate of 2.3 percent
between 2013-14 and 2022-23, with relatively strong growth in the short term, moderating by
around 2016-17 to 2019-20. Residential starts are expected to peak at approximately 185,000
new dwellings by 2017-188.
Non-residential building expenditure is projected to grow at an average rate of 1.3 percent
per annum from approximately $34 billion in 2012-13 to just below $40 billion by 2022-239.
Increased employment opportunities in both the residential and non-residential construction
market will assist in facilitating the movement of skilled labour.
National Infrastructure Program
The 2013 national infrastructure priority list sets outs priorities for Australia’s infrastructure
investment portfolio. A total of 79 proposals were submitted to Infrastructure Australia by state
and territory governments for inclusion on the 2013 priority list with an estimated cost of
approximately $80 billion. Of these, 34 were included on the priority list with an estimated value
of $24 to $27 billion. Appendix 3 contains a list of projects submitted to Infrastructure Australia
in 2012-1310.
The majority of these projects are major transport projects including road and port projects.
This is supported by a 2014-15 Federal Government budget commitment of A$50 billion for vital
transport infrastructure. Significant investment in, particularly road and port infrastructure by
state, territory and the Federal Government will create construction based employment
opportunities.
Australian Defence Force
Over the next decade, the Australian Government is planning a substantial increase in
Australian Defence Force (ADF) acquisitions across all services, at an estimated cost of more
than $200 billion11. The Defence Materiel Organisation (DMO) estimates that over the next 10
years, approximately 53 percent of its total acquisition and sustainment investment will be
spent in Australia. Over the same period, an estimated 37 percent of capital equipment
acquisition and sustainment will be spent on domestic activity, while approximately 70 percent
of the Australian Defence Force (ADF) sustainment expenditure will be spent in Australia12.
ADF related industries include shipbuilding and repair, boatbuilding and repair, aircraft
manufacturing and repair, fabricated metal product, explosive manufacturing and air space
transport, all of which are fabrication intensive. However, some Defence materiel supply also
comes from the construction sector, including businesses engaged in the construction of
8 Australian Construction Industry Forum (2014), ACIF Forecasts for Residential Building 9 Australian Construction Industry Forum (2014), ACIF Forecasts for Residential Building 10 Infrastructure Australia (2013), National Infrastructure Plan, Australian Government,
Canberra 11 Skills Australia (2012), Defence Industry Workforce Strategy: Background Paper, Australian
Government 12 Skills Australia (2012), Building Australia’s Defence Supply Capabilities: Main Report for the
Defence Industry Workforce Strategy, Australian Government, Canberra
AUSTRALIAN VENTURE CONSULTANTS PTY LTD
23
buildings and other civil engineering structures, additions, alterations, reconstruction,
installation and maintenance and repairs of other buildings13.
There is significant commonality between some of Australia’s largest defence contractors and
contractors that played a prominent role in the recent Western Australian resources industry
construction phase14 and it is highly probable that workers from these contractors will be
transitioned to defence contracts related employment.
Transition to Operational Roles
Very few resources project construction workers transition to operational roles with projects.
While there is some commonality of skills and that commonality could potentially be widened
through additional supplementary training, the structure and culture of the construction
workforce is such that most construction workers do not desire operational roles. This is
discussed in more detail in a later section of this report.
13 Skills Australia (2012), Defence Industry Workforce Strategy: Background Paper, Australian
Government 14 Skills Australia (2012), Defence Industry Workforce Strategy: Background Paper, Australian
Government
AUSTRALIAN VENTURE CONSULTANTS PTY LTD
24
Resources Project Construction Workforce
Dynamics
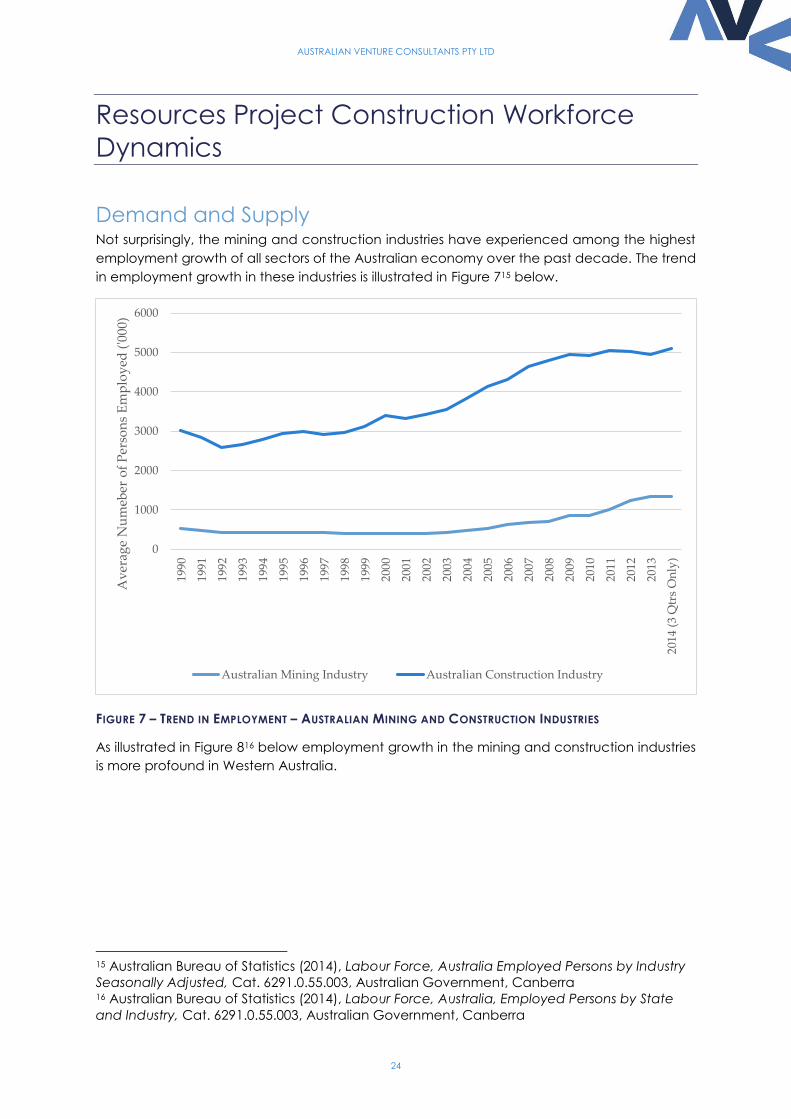
Demand and Supply Not surprisingly, the mining and construction industries have experienced among the highest
employment growth of all sectors of the Australian economy over the past decade. The trend
in employment growth in these industries is illustrated in Figure 715 below.
FIGURE 7 – TREND IN EMPLOYMENT – AUSTRALIAN MINING AND CONSTRUCTION INDUSTRIES
As illustrated in Figure 816 below employment growth in the mining and construction industries
is more profound in Western Australia.
15 Australian Bureau of Statistics (2014), Labour Force, Australia Employed Persons by Industry
Seasonally Adjusted, Cat. 6291.0.55.003, Australian Government, Canberra 16 Australian Bureau of Statistics (2014), Labour Force, Australia, Employed Persons by State
and Industry, Cat. 6291.0.55.003, Australian Government, Canberra
0
1000
2000
3000
4000
5000
6000
1990
1991
1992
1993
1994
1995
1996
1997
1998
1999
2000
2001
2002
2003
2004
2005
2006
2007
2008
2009
2010
2011
2012
2013
2014
(3
Qtr
s O
nly
)
Av
erag
e N
um
eber
of
Per
son
s E
mp
loy
ed (
'000
)
Australian Mining Industry Australian Construction Industry
AUSTRALIAN VENTURE CONSULTANTS PTY LTD
25
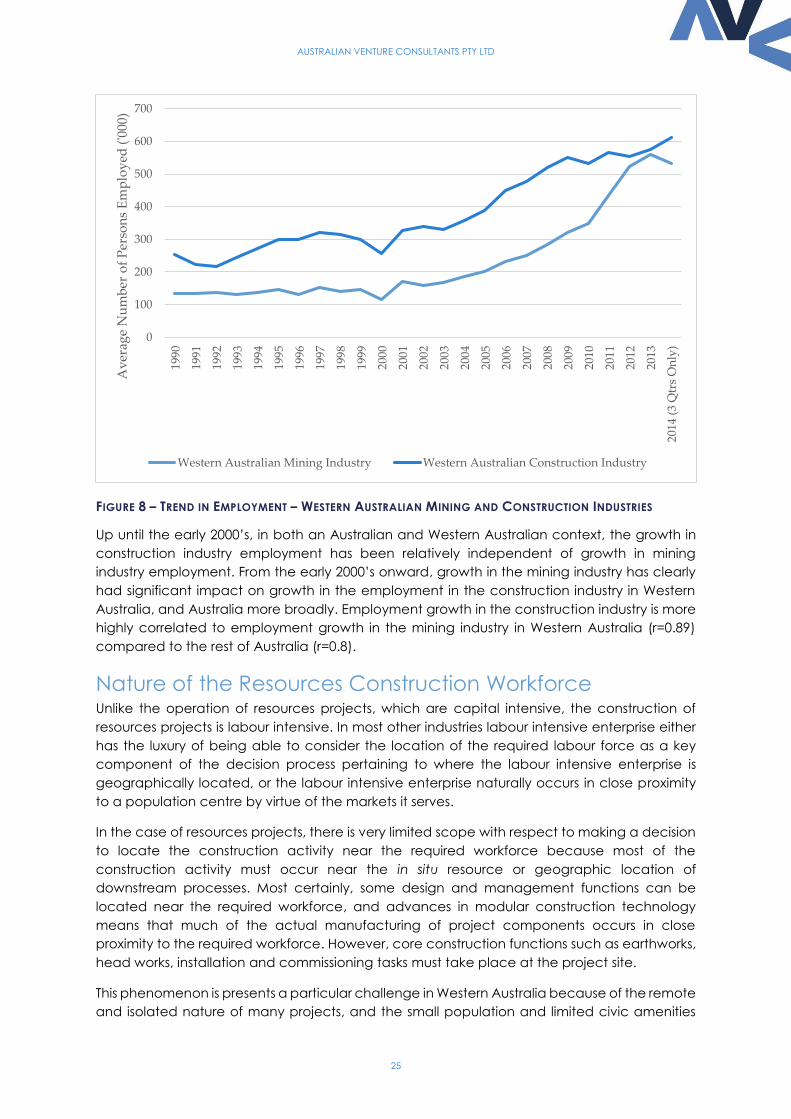
FIGURE 8 – TREND IN EMPLOYMENT – WESTERN AUSTRALIAN MINING AND CONSTRUCTION INDUSTRIES
Up until the early 2000’s, in both an Australian and Western Australian context, the growth in
construction industry employment has been relatively independent of growth in mining
industry employment. From the early 2000’s onward, growth in the mining industry has clearly
had significant impact on growth in the employment in the construction industry in Western
Australia, and Australia more broadly. Employment growth in the construction industry is more
highly correlated to employment growth in the mining industry in Western Australia (r=0.89)
compared to the rest of Australia (r=0.8).
Nature of the Resources Construction Workforce Unlike the operation of resources projects, which are capital intensive, the construction of
resources projects is labour intensive. In most other industries labour intensive enterprise either
has the luxury of being able to consider the location of the required labour force as a key
component of the decision process pertaining to where the labour intensive enterprise is
geographically located, or the labour intensive enterprise naturally occurs in close proximity
to a population centre by virtue of the markets it serves.
In the case of resources projects, there is very limited scope with respect to making a decision
to locate the construction activity near the required workforce because most of the
construction activity must occur near the in situ resource or geographic location of
downstream processes. Most certainly, some design and management functions can be
located near the required workforce, and advances in modular construction technology
means that much of the actual manufacturing of project components occurs in close
proximity to the required workforce. However, core construction functions such as earthworks,
head works, installation and commissioning tasks must take place at the project site.
This phenomenon is presents a particular challenge in Western Australia because of the remote
and isolated nature of many projects, and the small population and limited civic amenities
0
100
200
300
400
500
600
700
1990
1991
1992
1993
1994
1995
1996
1997
1998
1999
2000
2001
2002
2003
2004
2005
2006
2007
2008
2009
2010
2011
2012
2013
2014
(3
Qtr
s O
nly
)
Av
erag
e N
um
ber
of
Per
son
s E
mp
loy
ed (
'000
)
Western Australian Mining Industry Western Australian Construction Industry
AUSTRALIAN VENTURE CONSULTANTS PTY LTD
26
that exist in most population centres that are in proximity to projects. The only significant
exception to this is the Darling Ranges bauxite-alumina industry, which is in close proximity to
the Perth Metropolitan, Peel and South West regional centres.
It is this relatively unique labour market dynamic that has resulted in a dramatic increase in the
mobility of the construction workforce in Australia. Whereas resources projects are limited with
respect to optimising the location of construction activity for workforce access, construction
workers reside in most parts of the world and have relatively versatile skills that can be
deployed on construction projects in a wide range of industries. As such, most construction
workers can make decisions as to where they live, the industries they work in and how they
interact with the projects they work on, on the basis of personal utility.
Resources projects have limited options with respect to sourcing construction skills from small
labour markets that are in proximity to the projects, meaning that labour working on those
projects must relocate. Opportunities for the construction workforce to permanently or semi-
permanently relocate to a location in close proximity to resources projects is in most cases
constrained by the absence of a civic centre, or adequate civic centre in proximity to the
project and/or the lack of a sustained construction market in a civic centre that might be in
proximity to the project. As such, a well-managed Fly-in-Fly-out (FIFO) construction workforce
program is the only realistic option for the construction of many Western Australian resources
projects.
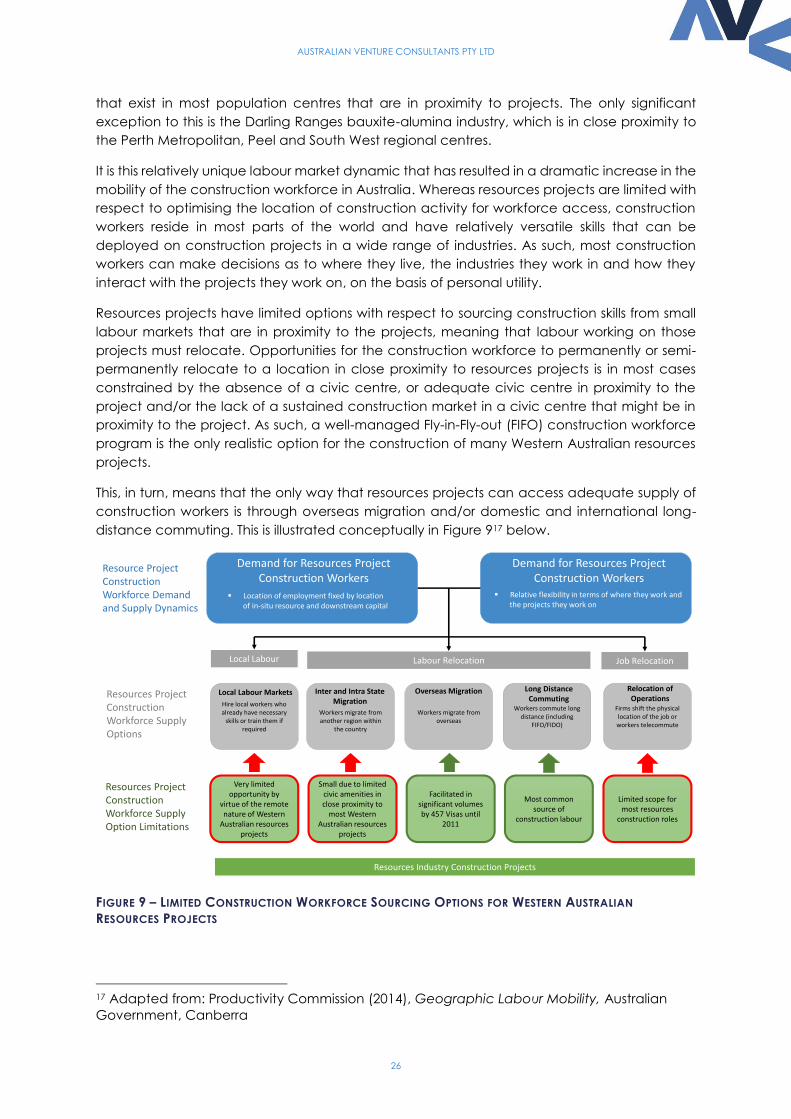
This, in turn, means that the only way that resources projects can access adequate supply of
construction workers is through overseas migration and/or domestic and international long-
distance commuting. This is illustrated conceptually in Figure 917 below.
FIGURE 9 – LIMITED CONSTRUCTION WORKFORCE SOURCING OPTIONS FOR WESTERN AUSTRALIAN
RESOURCES PROJECTS
17 Adapted from: Productivity Commission (2014), Geographic Labour Mobility, Australian
Government, Canberra
Demand for Resources ProjectConstruction Workers
Location of employment fixed by locationof in-situ resource and downstream capital
Demand for Resources ProjectConstruction Workers
Relative flexibility in terms of where they work andthe projects they work on
Resource ProjectConstructionWorkforce Demandand Supply Dynamics
Hire local workers who already have necessary
skills or train them if required
Workers migrate from another region within
the country
Workers migrate from overseas
Workers commute long distance (including
FIFO/FIDO)
Firms shift the physical location of the job or workers telecommute
Local Labour Labour Relocation Job Relocation
Resources Industry Construction Projects
Very limited opportunity by
virtue of the remote nature of Western
Australian resources projects
Small due to limited civic amenities in close proximity to
most Western Australian resources
projects
Facilitated in significant volumes by 457 Visas until
2011
Most common source of
construction labour
Limited scope for most resources
construction roles
Resources ProjectConstructionWorkforce SupplyOptions
Resources ProjectConstructionWorkforce SupplyOption Limitations
Local Labour Markets Inter and Intra StateMigration
Overseas Migration Long DistanceCommuting
Relocation ofOperations
AUSTRALIAN VENTURE CONSULTANTS PTY LTD
27
While operational resources projects face a similar dilemma, the scale of the problem is
somewhat mitigated by the fact the operational workforce is much smaller in terms of number
of workers required and in some cases narrower in terms of breadth of skills. Furthermore, the
increased deployment of automated systems at operational resources projects means that
the oversight of those ICT enabled systems can be conducted from remote operations centres
located in regional population centres. This is particularly the case in the oil and gas industry,
and while only a few mining operations operate substantive remote operating centres, this will
likely be an increasing trend across the Australian resources industry.18
The following subsections describe the dynamics of the different sources of construction
workforce available to resources projects as summarised in Figure 9.
Local Labour Market
For resources projects that are not in practical proximity to a regional population centre, hiring
construction skills from a local market is not an option. However, many resources projects are
in close proximity to Western Australian regional centres and towns such as Kalgoorlie,
Meekatharra, Newman, Tom Price, Karratha, Port Hedland and, more recently, Onslow,
Broome, Ravensthorpe and Geraldton. Indeed many of these towns have developed and
grown as a result of resources project activity. Regardless, skilled workers are generally scarce
in regional population centres.
Where a resources construction project occurs in close proximity to a small local contractor
and/or labour market, there will likely be a propensity for that local contractor and/or labour
market to seek contracts with the resources industry construction project. Where a project
engages this labour this may create a short term labour and/or service shortage in that local
market. However, it is often the case that local labour and/or contractors that have worked
on resources construction projects receive significant economic benefits and develop a
higher level of skills and capabilities from having worked on the project, particularly with
respect to OHS, which they are then able to offer their local market. In many cases, it is likely
that the opportunity created by the resources project has been the catalyst for the expansion
of local service businesses.
In smaller local communities, local government shires are often the main employers and
contractors of a range of engineers, tradespeople and machinery operators. Where this
workforce is attracted to opportunities on resources construction projects, it will typically return
with a more developed skillset and service offering that can be deployed on civic works and
maintenance. While demand for local shire employed or contracted skills from resources
construction projects has created some tension between resources companies and some
local shires, it is probable that once the projects are operational, labour market pressures will
decrease and a higher quality of skills and capabilities will be available to the shires.
Inter and Intra State Migration
Historical commentaries have criticised the Australian population for an apparent low
propensity to relocate to employment markets. However, a recent study by the Australian
18 Australian Venture Consultants (2012), Rise of the Machines? Adoption of Automation
Technology in the Australian Resources Industries and its Implications for Vocational
Education and Training and Higher Education, Resources Industry Training Council
AUSTRALIAN VENTURE CONSULTANTS PTY LTD
28
Productivity Commission19 indicates that the Australian population is actually relatively mobile
with respect to migrating interstate for the purposes of work.
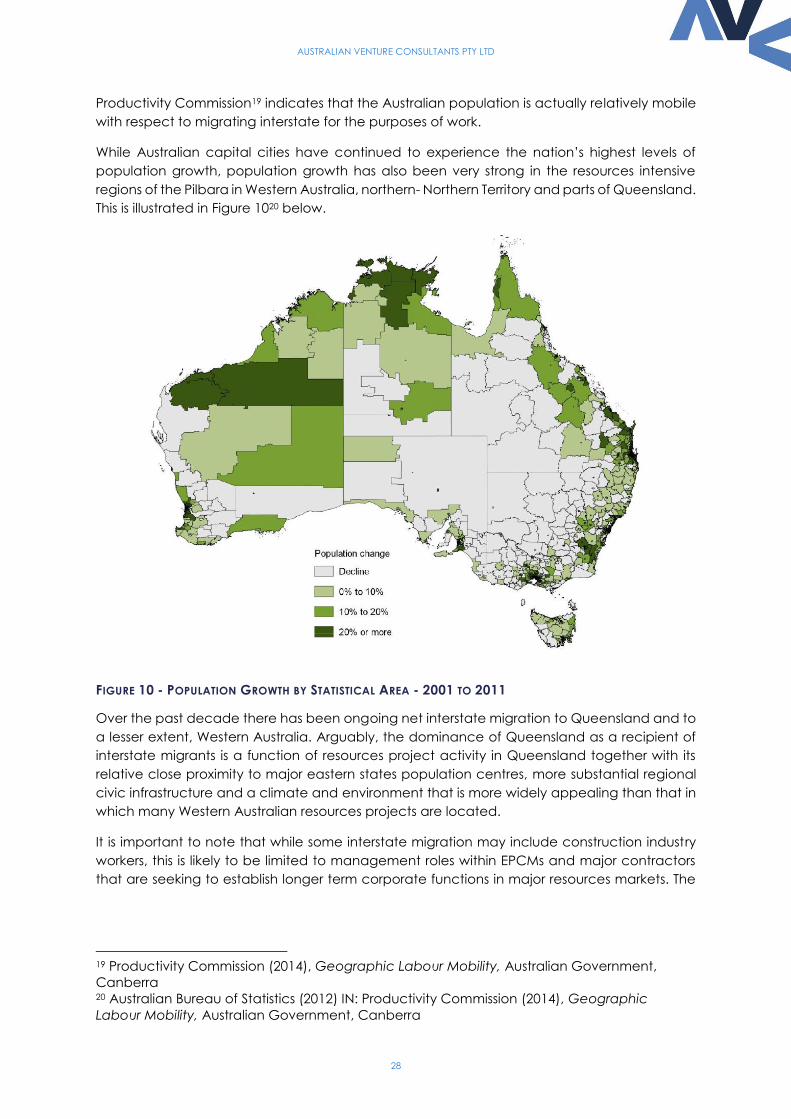
While Australian capital cities have continued to experience the nation’s highest levels of
population growth, population growth has also been very strong in the resources intensive
regions of the Pilbara in Western Australia, northern- Northern Territory and parts of Queensland.
This is illustrated in Figure 1020 below.
FIGURE 10 - POPULATION GROWTH BY STATISTICAL AREA - 2001 TO 2011
Over the past decade there has been ongoing net interstate migration to Queensland and to
a lesser extent, Western Australia. Arguably, the dominance of Queensland as a recipient of
interstate migrants is a function of resources project activity in Queensland together with its
relative close proximity to major eastern states population centres, more substantial regional
civic infrastructure and a climate and environment that is more widely appealing than that in
which many Western Australian resources projects are located.
It is important to note that while some interstate migration may include construction industry
workers, this is likely to be limited to management roles within EPCMs and major contractors
that are seeking to establish longer term corporate functions in major resources markets. The
19 Productivity Commission (2014), Geographic Labour Mobility, Australian Government,
Canberra 20 Australian Bureau of Statistics (2012) IN: Productivity Commission (2014), Geographic
Labour Mobility, Australian Government, Canberra
AUSTRALIAN VENTURE CONSULTANTS PTY LTD
29
short-term nature of most resources project construction contracts means that workers will
migrate on a short-term basis or engage through a FIFO program.
The fact that approximately 10 percent of the total Australian mining industry workforce moved
residence between labour markets prior to the last census date, whereas only 4 percent of the
construction industry workforce did the same21 suggests that permanent inter-state migration
is driven by new operational roles or longer term project management roles within mining
companies that result from the expansion of the mining industry, rather than permanent
relocation of construction workers associated with the mining industry.
Overseas Migration
Compared to Queensland, the Western Australian labour market has been more dependent
on overseas migration to meet its growing workforce needs, which is most likely the result of
workers located in the Eastern States reluctant to relocate to Western Australia, which often is
perceived as relatively remote22.
While international migration has always played an important role in Australia’s population
growth, the vast majority of migrants have traditionally settled in the Nation’s capital cities.
Over the past decade, there has been a substantial increase in overseas migrants settling in
regional areas23. This has at least in part been the result of Australian, state and territory policies
designed to attract skilled migrants to regional Australia to address the regional skills deficiency
discussed in a previous section of this report.
Many migrants working in the Australian resources industry have come to Australia on Subclass
457 Visas, which allow skilled persons to come to Australia to work for an approved employer,
accompanied by their immediate family for a period of between one day and four years.
Operational mining companies, EPCMs and contractors involved in resources construction
projects have used the 457 visa program to address skills shortages in both professional and
trade areas. However, they have not been the main users of the 457 visa program, with
accommodation and food services, health care and social assistance, information media and
telecommunications and other services sectors each routinely accounting for over 10 percent
of 457 visa applications24.
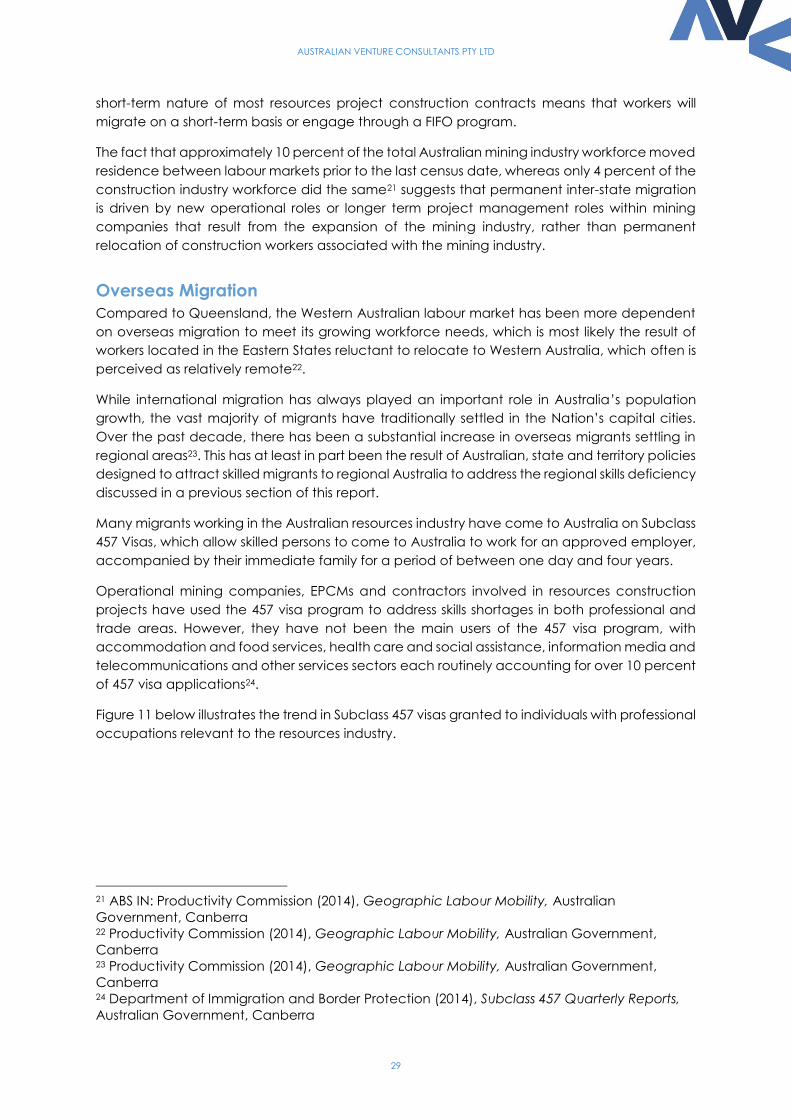
Figure 11 below illustrates the trend in Subclass 457 visas granted to individuals with professional
occupations relevant to the resources industry.
21 ABS IN: Productivity Commission (2014), Geographic Labour Mobility, Australian
Government, Canberra 22 Productivity Commission (2014), Geographic Labour Mobility, Australian Government,
Canberra 23 Productivity Commission (2014), Geographic Labour Mobility, Australian Government,
Canberra 24 Department of Immigration and Border Protection (2014), Subclass 457 Quarterly Reports,
Australian Government, Canberra
AUSTRALIAN VENTURE CONSULTANTS PTY LTD
30
FIGURE 11 - SUBCLASS 457 VISAS GRANTED TO PROFESSIONAL OCCUPATIONS RELEVANT TO THE RESOURCES
INDUSTRY - 2005-06 TO 2010-11
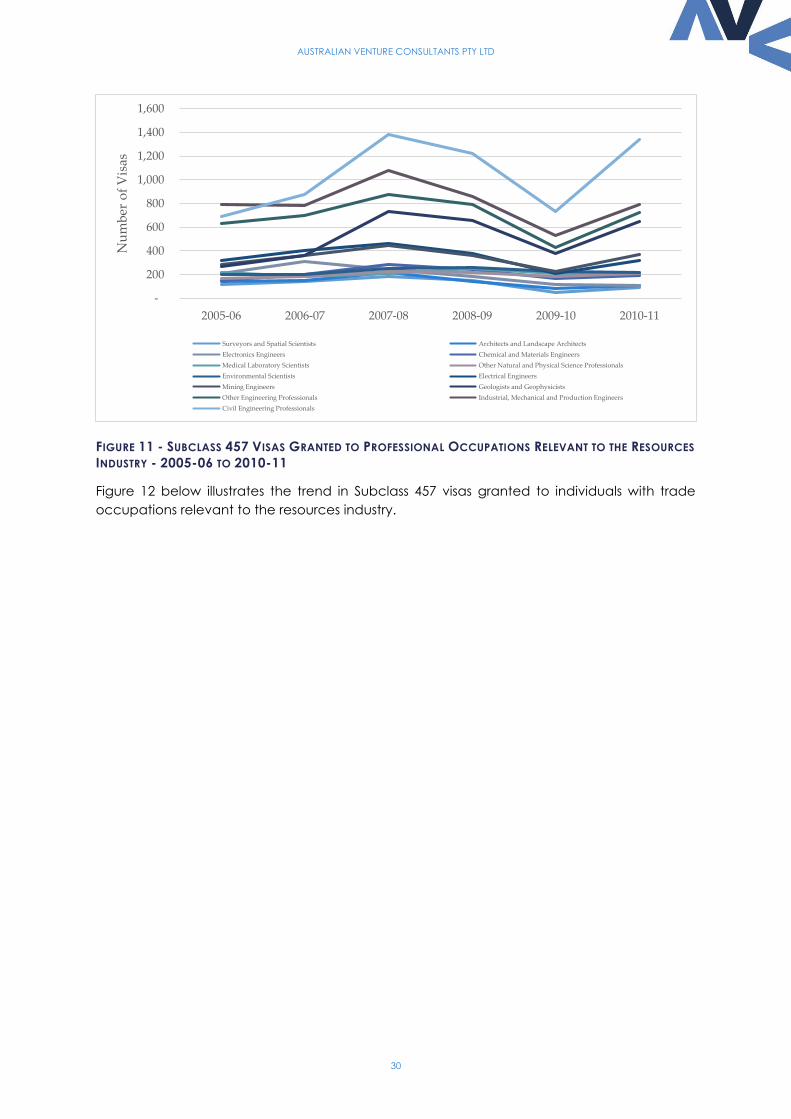
Figure 12 below illustrates the trend in Subclass 457 visas granted to individuals with trade
occupations relevant to the resources industry.
-
200
400
600
800
1,000
1,200
1,400
1,600
2005-06 2006-07 2007-08 2008-09 2009-10 2010-11
Nu
mb
er o
f V
isas
Surveyors and Spatial Scientists Architects and Landscape Architects
Electronics Engineers Chemical and Materials Engineers
Medical Laboratory Scientists Other Natural and Physical Science Professionals
Environmental Scientists Electrical Engineers
Mining Engineers Geologists and Geophysicists
Other Engineering Professionals Industrial, Mechanical and Production Engineers
Civil Engineering Professionals
AUSTRALIAN VENTURE CONSULTANTS PTY LTD
31
FIGURE 12 - SUBCLASS 457 VISAS GRANTED TO TECHNICAL AND TRADE OCCUPATIONS RELEVANT TO THE
RESOURCES INDUSTRY - 2005-06 TO 2009-10
The significant decline in subclass 457 visa grants in 2009-10 was the result of major changes to
the program that came into effect on 14 September 2009.
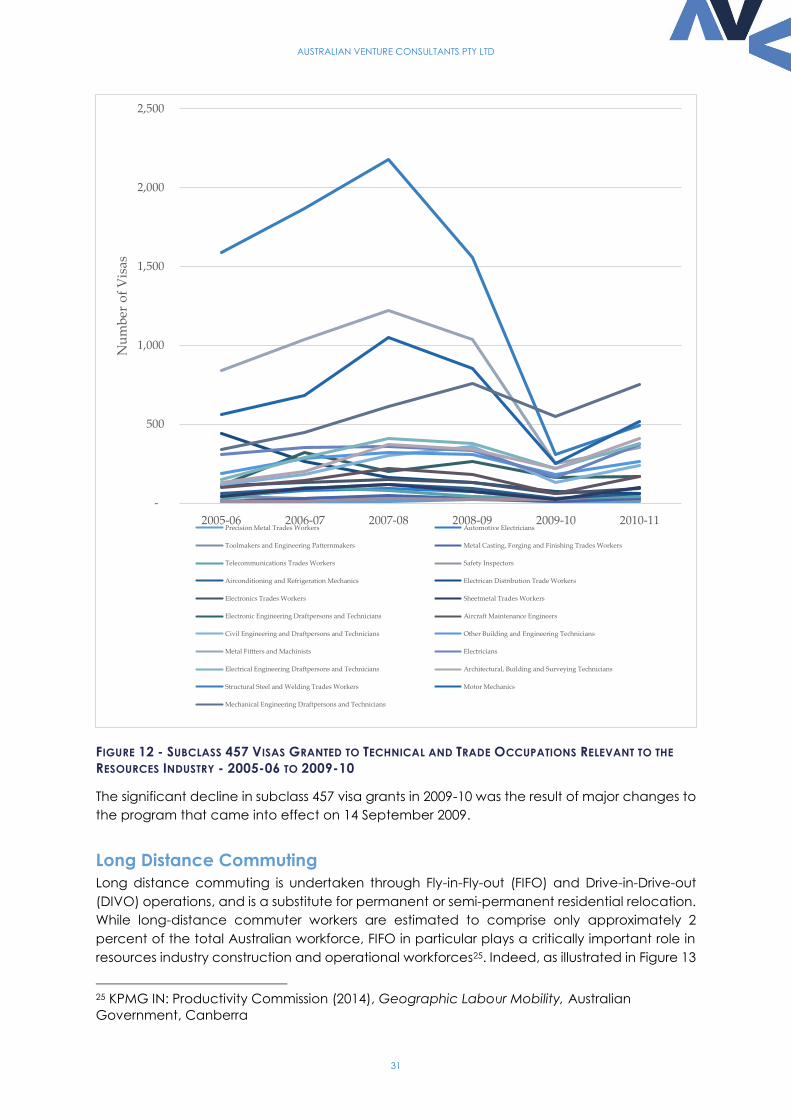
Long Distance Commuting
Long distance commuting is undertaken through Fly-in-Fly-out (FIFO) and Drive-in-Drive-out
(DIVO) operations, and is a substitute for permanent or semi-permanent residential relocation.
While long-distance commuter workers are estimated to comprise only approximately 2
percent of the total Australian workforce, FIFO in particular plays a critically important role in
resources industry construction and operational workforces25. Indeed, as illustrated in Figure 13
25 KPMG IN: Productivity Commission (2014), Geographic Labour Mobility, Australian
Government, Canberra
-
500
1,000
1,500
2,000
2,500
2005-06 2006-07 2007-08 2008-09 2009-10 2010-11
Nu
mb
er o
f V
isas
Precision Metal Trades Workers Automotive Electricians
Toolmakers and Engineering Patternmakers Metal Casting, Forging and Finishing Trades Workers
Telecommunications Trades Workers Safety Inspectors
Airconditioning and Refrigeration Mechanics Electrican Distribution Trade Workers
Electronics Trades Workers Sheetmetal Trades Workers
Electronic Engineering Draftpersons and Technicians Aircraft Maintenance Engineers
Civil Engineering and Draftpersons and Technicians Other Building and Engineering Technicians
Metal Fittters and Machinists Electricians
Electrical Engineering Draftpersons and Technicians Architectural, Building and Surveying Technicians
Structural Steel and Welding Trades Workers Motor Mechanics
Mechanical Engineering Draftpersons and Technicians
AUSTRALIAN VENTURE CONSULTANTS PTY LTD
32
below, as at 2011 the Pilbara region of Western Australia was the second most common
destination for long distance commuters in Australia26. It should be noted that FIFO and other
forms of long-distance commuting form a significant portion of the workforce in other labour
markets. For example, as illustrated in Figure 13 below, Sydney is the most common destination
for long distance commuters in Australia. Long distance commuting is common to many large
commercial centres around the globe and is a function of the breadth and depth of
organisations that comprise those centres, the breadth of depth of skills that are required by
those organisations, limited capacity of the employment market in those centres to deliver
those skills, limited residential options in those centres and the lifestyle choices of knowledge
workers.
FIGURE 13 – MOST COMMON DESTINATION FOR LONG DISTANCE COMMUTERS
Similarly in the Perth – Pilbara route is the most common long distance commuting route. This
is illustrated in Figure 1427 below.
26 Productivity Commission (2014), Geographic Labour Mobility, Australian Government,
Canberra 27 Productivity Commission (2014), Geographic Labour Mobility, Australian Government,
Canberra
-
5,000
10,000
15,000
20,000
25,000
Nu
mb
er o
f P
erso
ns
2006 2011
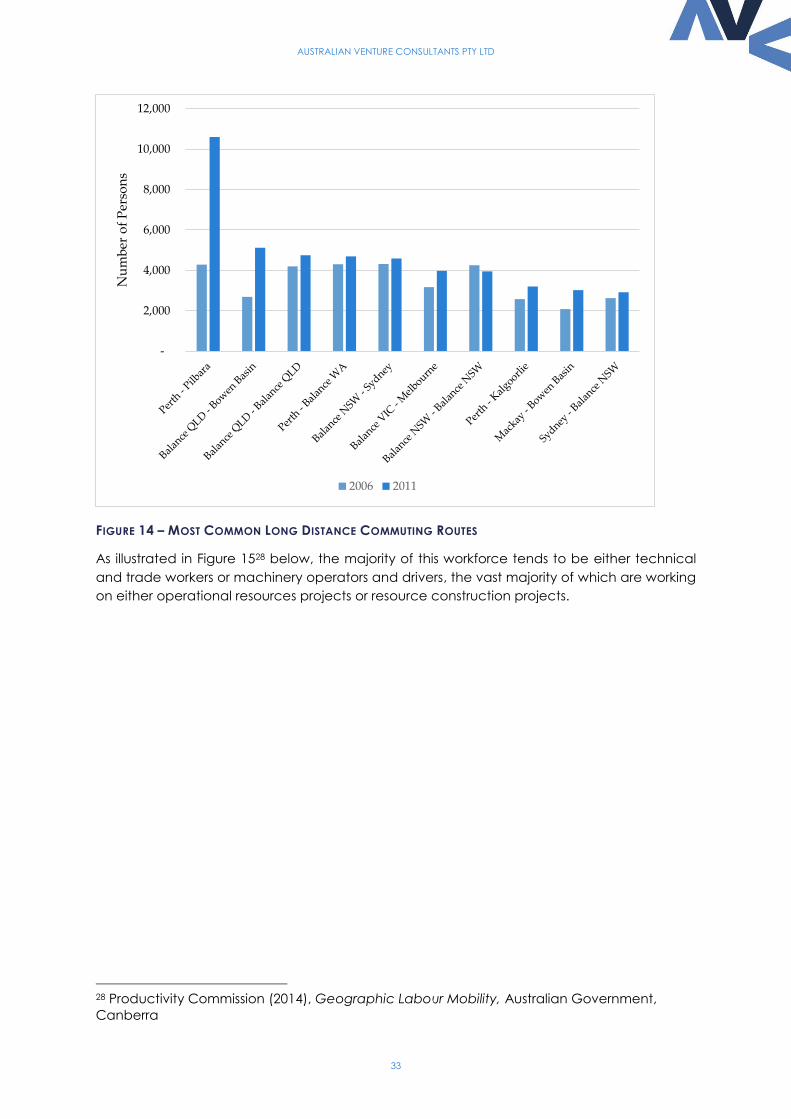
AUSTRALIAN VENTURE CONSULTANTS PTY LTD
33
FIGURE 14 – MOST COMMON LONG DISTANCE COMMUTING ROUTES
As illustrated in Figure 1528 below, the majority of this workforce tends to be either technical
and trade workers or machinery operators and drivers, the vast majority of which are working
on either operational resources projects or resource construction projects.
28 Productivity Commission (2014), Geographic Labour Mobility, Australian Government,
Canberra
-
2,000
4,000
6,000
8,000
10,000
12,000N
um
ber
of
Per
son
s
2006 2011
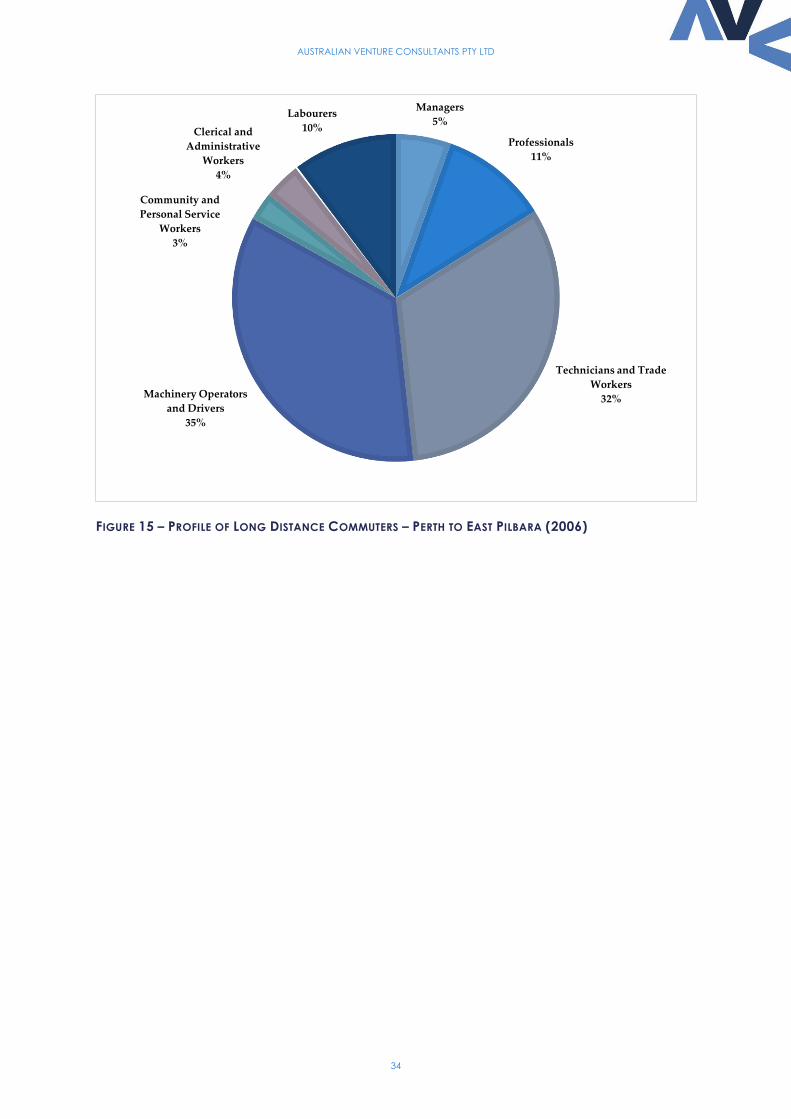
AUSTRALIAN VENTURE CONSULTANTS PTY LTD
34
FIGURE 15 – PROFILE OF LONG DISTANCE COMMUTERS – PERTH TO EAST PILBARA (2006)
Managers
5%
Professionals
11%
Technicians and Trade
Workers
32%Machinery Operators
and Drivers
35%
Community and
Personal Service
Workers
3%
Clerical and
Administrative
Workers
4%
Labourers
10%
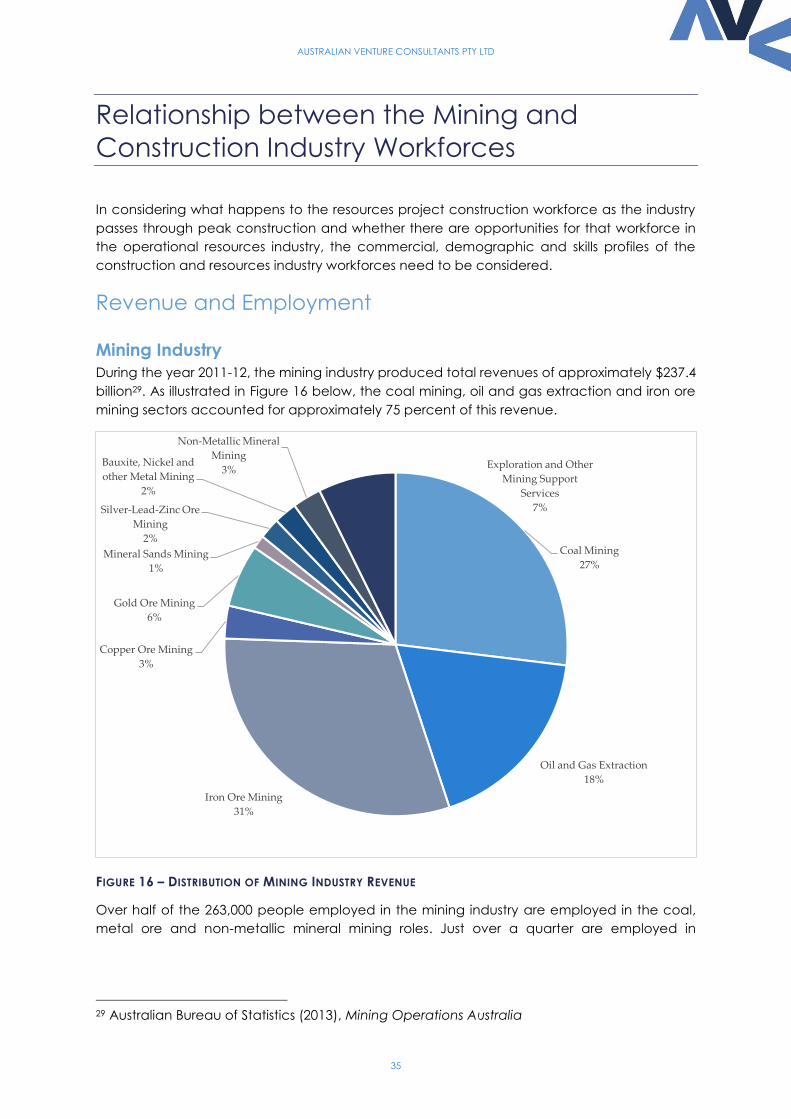
AUSTRALIAN VENTURE CONSULTANTS PTY LTD
35
Relationship between the Mining and
Construction Industry Workforces
In considering what happens to the resources project construction workforce as the industry
passes through peak construction and whether there are opportunities for that workforce in
the operational resources industry, the commercial, demographic and skills profiles of the
construction and resources industry workforces need to be considered.
Revenue and Employment
Mining Industry
During the year 2011-12, the mining industry produced total revenues of approximately $237.4
billion29. As illustrated in Figure 16 below, the coal mining, oil and gas extraction and iron ore
mining sectors accounted for approximately 75 percent of this revenue.
FIGURE 16 – DISTRIBUTION OF MINING INDUSTRY REVENUE
Over half of the 263,000 people employed in the mining industry are employed in the coal,
metal ore and non-metallic mineral mining roles. Just over a quarter are employed in
29 Australian Bureau of Statistics (2013), Mining Operations Australia
Coal Mining
27%
Oil and Gas Extraction
18%
Iron Ore Mining
31%
Copper Ore Mining
3%
Gold Ore Mining
6%
Mineral Sands Mining
1%
Silver-Lead-Zinc Ore
Mining
2%
Bauxite, Nickel and
other Metal Mining
2%
Non-Metallic Mineral
Mining
3% Exploration and Other
Mining Support
Services
7%
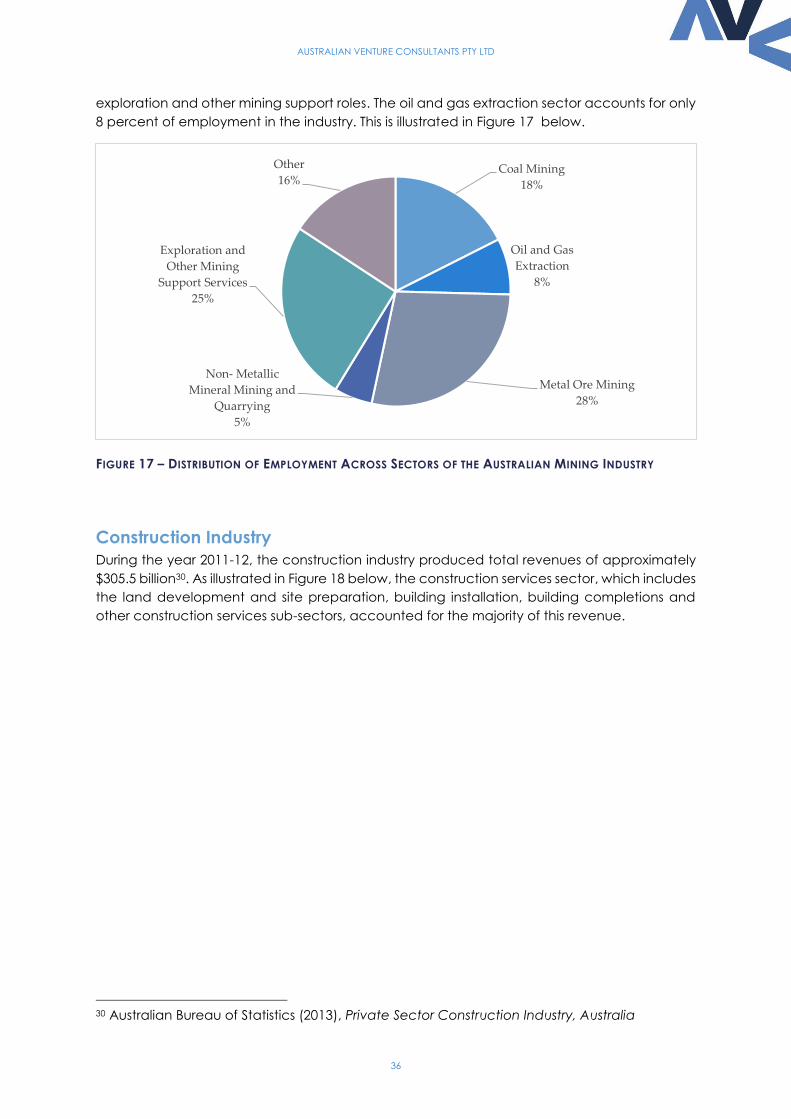
AUSTRALIAN VENTURE CONSULTANTS PTY LTD
36
exploration and other mining support roles. The oil and gas extraction sector accounts for only
8 percent of employment in the industry. This is illustrated in Figure 17 below.
FIGURE 17 – DISTRIBUTION OF EMPLOYMENT ACROSS SECTORS OF THE AUSTRALIAN MINING INDUSTRY
Construction Industry
During the year 2011-12, the construction industry produced total revenues of approximately
$305.5 billion30. As illustrated in Figure 18 below, the construction services sector, which includes
the land development and site preparation, building installation, building completions and
other construction services sub-sectors, accounted for the majority of this revenue.
30 Australian Bureau of Statistics (2013), Private Sector Construction Industry, Australia
Coal Mining
18%
Oil and Gas
Extraction
8%
Metal Ore Mining
28%
Non- Metallic
Mineral Mining and
Quarrying
5%
Exploration and
Other Mining
Support Services
25%
Other
16%
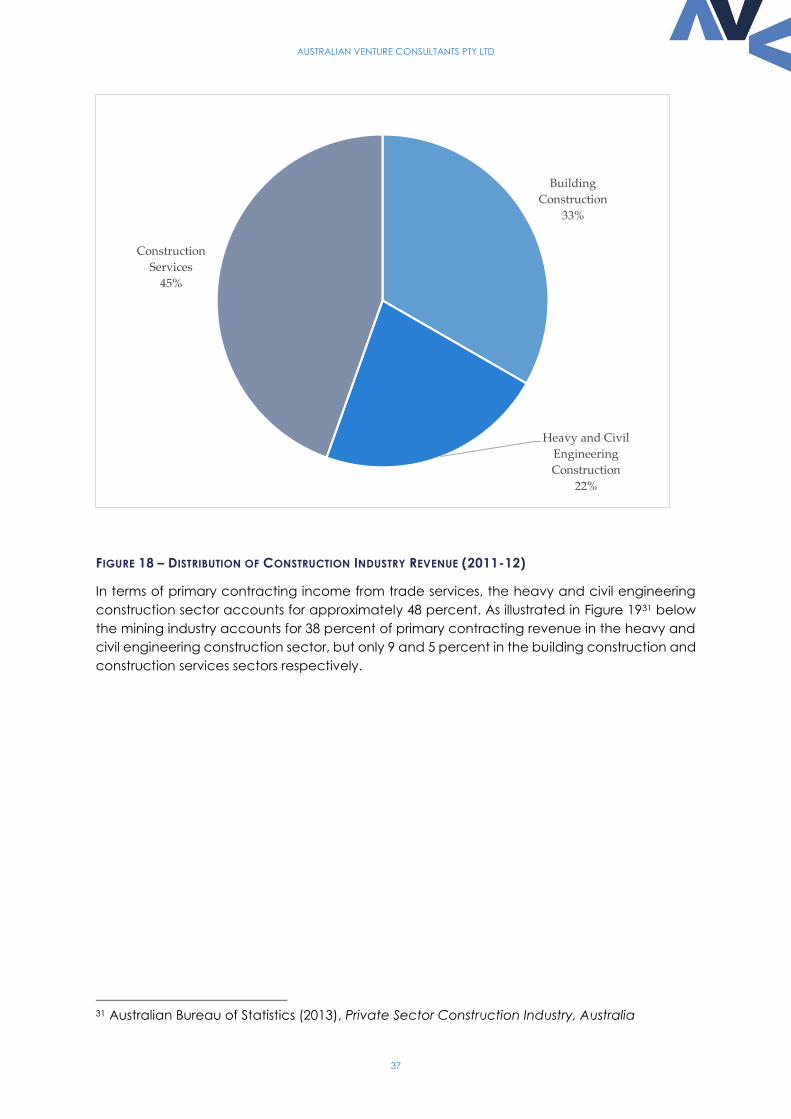
AUSTRALIAN VENTURE CONSULTANTS PTY LTD
37
FIGURE 18 – DISTRIBUTION OF CONSTRUCTION INDUSTRY REVENUE (2011-12)
In terms of primary contracting income from trade services, the heavy and civil engineering
construction sector accounts for approximately 48 percent. As illustrated in Figure 1931 below
the mining industry accounts for 38 percent of primary contracting revenue in the heavy and
civil engineering construction sector, but only 9 and 5 percent in the building construction and
construction services sectors respectively.
31 Australian Bureau of Statistics (2013), Private Sector Construction Industry, Australia
Building
Construction
33%
Heavy and Civil
Engineering
Construction
22%
Construction
Services
45%
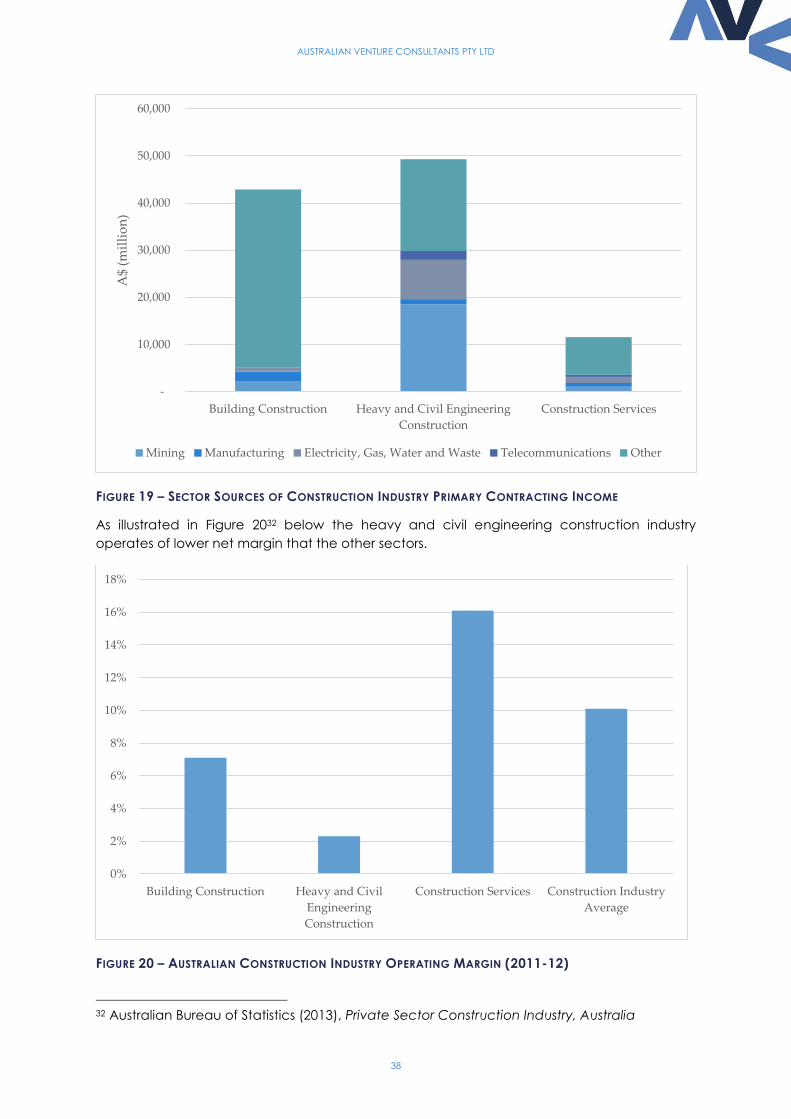
AUSTRALIAN VENTURE CONSULTANTS PTY LTD
38
FIGURE 19 – SECTOR SOURCES OF CONSTRUCTION INDUSTRY PRIMARY CONTRACTING INCOME
As illustrated in Figure 2032 below the heavy and civil engineering construction industry
operates of lower net margin that the other sectors.
FIGURE 20 – AUSTRALIAN CONSTRUCTION INDUSTRY OPERATING MARGIN (2011-12)
32 Australian Bureau of Statistics (2013), Private Sector Construction Industry, Australia
-
10,000
20,000
30,000
40,000
50,000
60,000
Building Construction Heavy and Civil Engineering
Construction
Construction Services
A$
(mil
lio
n)
Mining Manufacturing Electricity, Gas, Water and Waste Telecommunications Other
0%
2%
4%
6%
8%
10%
12%
14%
16%
18%
Building Construction Heavy and Civil
Engineering
Construction
Construction Services Construction Industry
Average
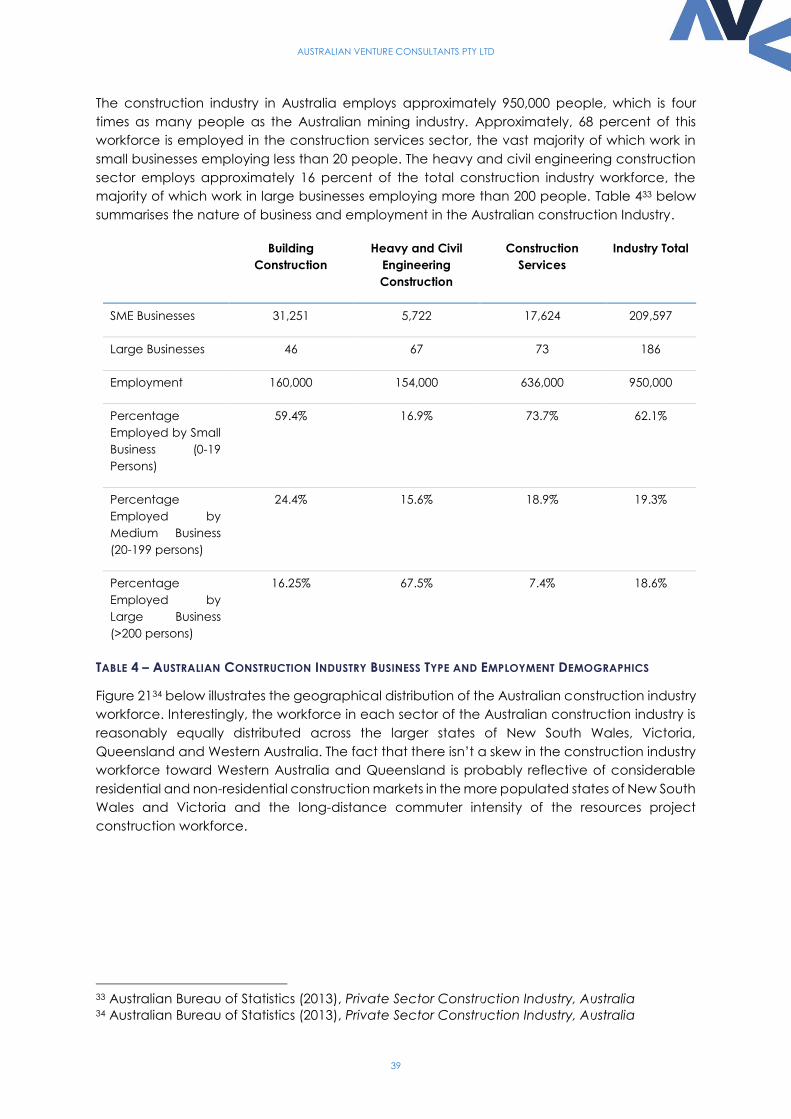
AUSTRALIAN VENTURE CONSULTANTS PTY LTD
39
The construction industry in Australia employs approximately 950,000 people, which is four
times as many people as the Australian mining industry. Approximately, 68 percent of this
workforce is employed in the construction services sector, the vast majority of which work in
small businesses employing less than 20 people. The heavy and civil engineering construction
sector employs approximately 16 percent of the total construction industry workforce, the
majority of which work in large businesses employing more than 200 people. Table 433 below
summarises the nature of business and employment in the Australian construction Industry.
Building
Construction
Heavy and Civil
Engineering
Construction
Construction
Services
Industry Total
SME Businesses 31,251 5,722 17,624 209,597
Large Businesses 46 67 73 186
Employment 160,000 154,000 636,000 950,000
Percentage
Employed by Small
Business (0-19
Persons)
59.4% 16.9% 73.7% 62.1%
Percentage
Employed by
Medium Business
(20-199 persons)
24.4% 15.6% 18.9% 19.3%
Percentage
Employed by
Large Business
(>200 persons)
16.25% 67.5% 7.4% 18.6%
TABLE 4 – AUSTRALIAN CONSTRUCTION INDUSTRY BUSINESS TYPE AND EMPLOYMENT DEMOGRAPHICS
Figure 2134 below illustrates the geographical distribution of the Australian construction industry
workforce. Interestingly, the workforce in each sector of the Australian construction industry is
reasonably equally distributed across the larger states of New South Wales, Victoria,
Queensland and Western Australia. The fact that there isn’t a skew in the construction industry
workforce toward Western Australia and Queensland is probably reflective of considerable
residential and non-residential construction markets in the more populated states of New South
Wales and Victoria and the long-distance commuter intensity of the resources project
construction workforce.
33 Australian Bureau of Statistics (2013), Private Sector Construction Industry, Australia 34 Australian Bureau of Statistics (2013), Private Sector Construction Industry, Australia
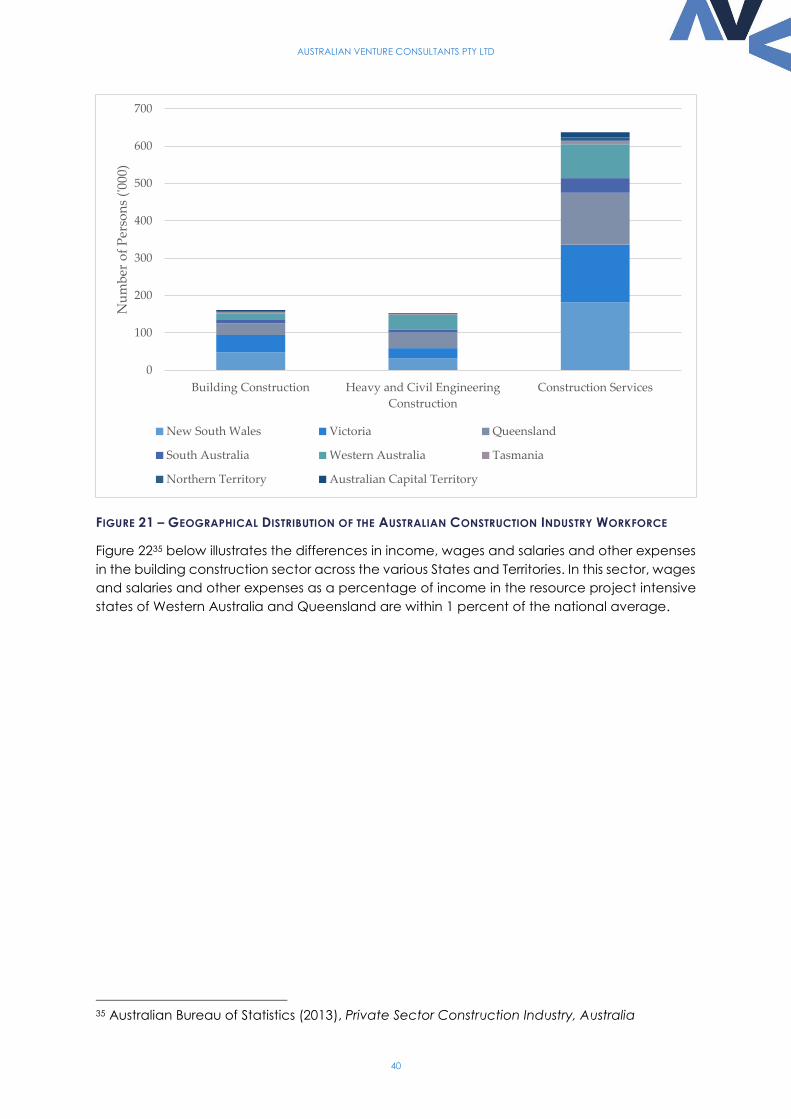
AUSTRALIAN VENTURE CONSULTANTS PTY LTD
40
FIGURE 21 – GEOGRAPHICAL DISTRIBUTION OF THE AUSTRALIAN CONSTRUCTION INDUSTRY WORKFORCE
Figure 2235 below illustrates the differences in income, wages and salaries and other expenses
in the building construction sector across the various States and Territories. In this sector, wages
and salaries and other expenses as a percentage of income in the resource project intensive
states of Western Australia and Queensland are within 1 percent of the national average.
35 Australian Bureau of Statistics (2013), Private Sector Construction Industry, Australia
0
100
200
300
400
500
600
700
Building Construction Heavy and Civil Engineering
Construction
Construction Services
Nu
mb
er o
f P
erso
ns
('00
0)
New South Wales Victoria Queensland
South Australia Western Australia Tasmania
Northern Territory Australian Capital Territory
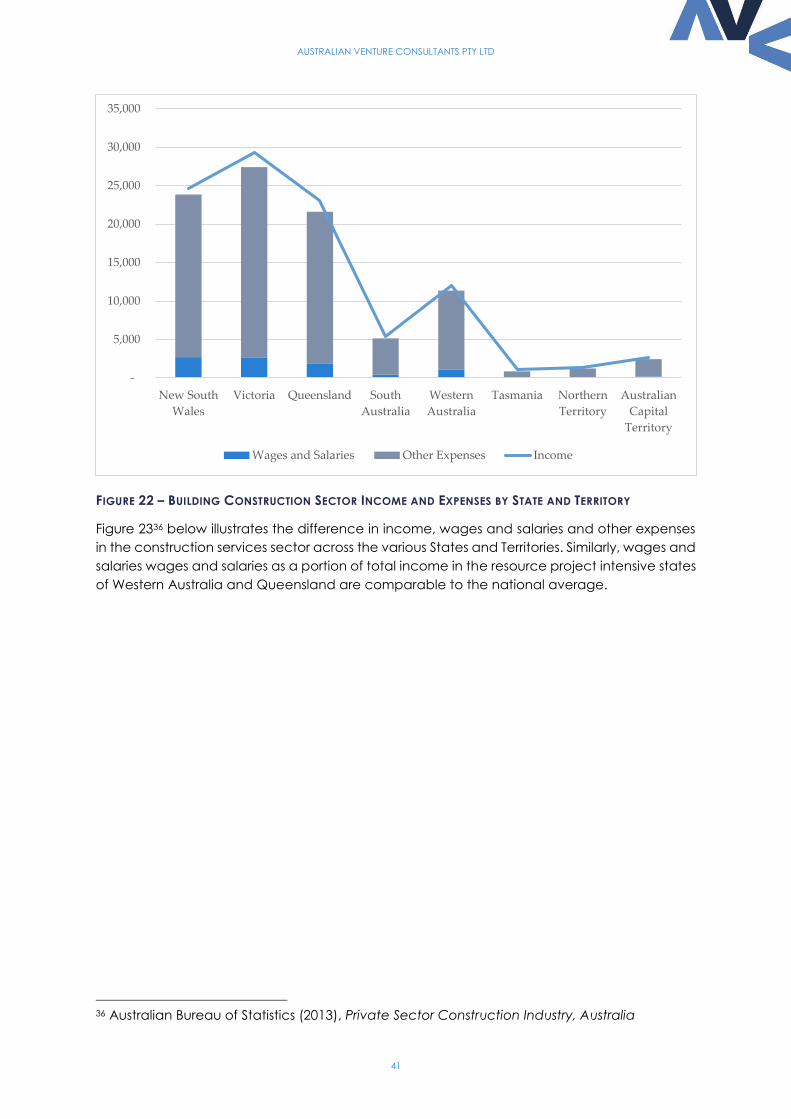
AUSTRALIAN VENTURE CONSULTANTS PTY LTD
41
FIGURE 22 – BUILDING CONSTRUCTION SECTOR INCOME AND EXPENSES BY STATE AND TERRITORY
Figure 2336 below illustrates the difference in income, wages and salaries and other expenses
in the construction services sector across the various States and Territories. Similarly, wages and
salaries wages and salaries as a portion of total income in the resource project intensive states
of Western Australia and Queensland are comparable to the national average.
36 Australian Bureau of Statistics (2013), Private Sector Construction Industry, Australia
-
5,000
10,000
15,000
20,000
25,000
30,000
35,000
New South
Wales
Victoria Queensland South
Australia
Western
Australia
Tasmania Northern
Territory
Australian
Capital
Territory
Wages and Salaries Other Expenses Income
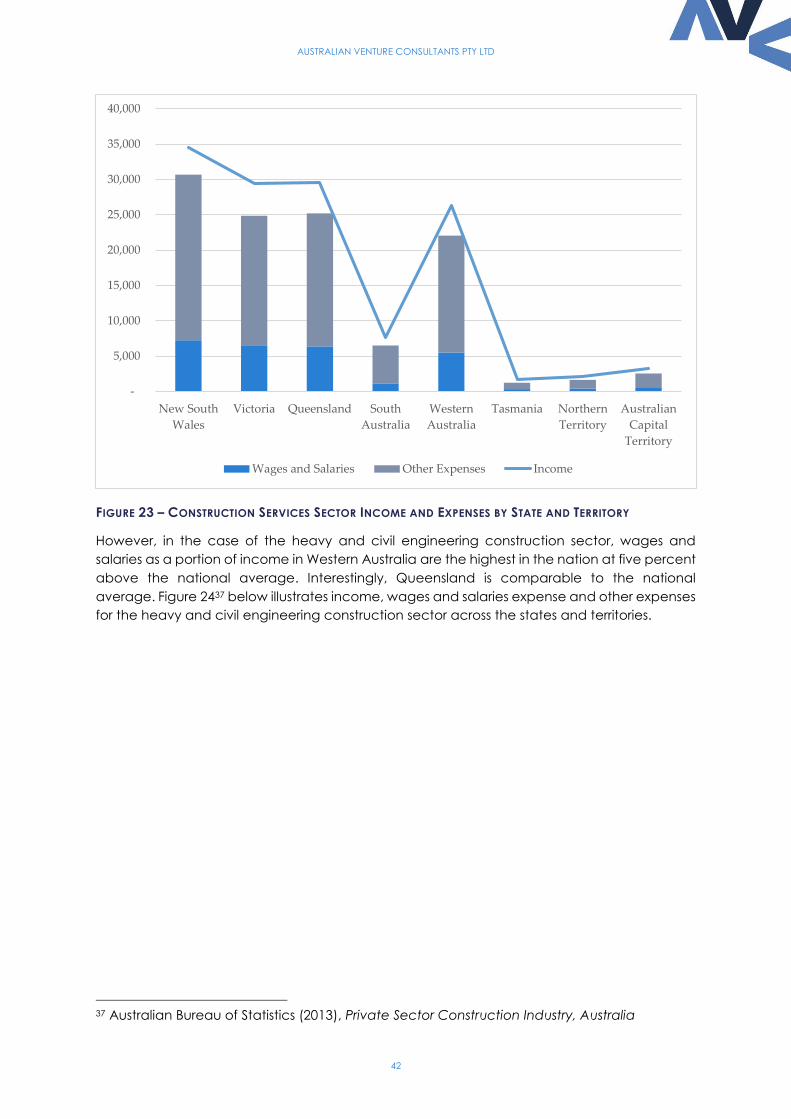
AUSTRALIAN VENTURE CONSULTANTS PTY LTD
42
FIGURE 23 – CONSTRUCTION SERVICES SECTOR INCOME AND EXPENSES BY STATE AND TERRITORY
However, in the case of the heavy and civil engineering construction sector, wages and
salaries as a portion of income in Western Australia are the highest in the nation at five percent
above the national average. Interestingly, Queensland is comparable to the national
average. Figure 2437 below illustrates income, wages and salaries expense and other expenses
for the heavy and civil engineering construction sector across the states and territories.
37 Australian Bureau of Statistics (2013), Private Sector Construction Industry, Australia
-
5,000
10,000
15,000
20,000
25,000
30,000
35,000
40,000
New South
Wales
Victoria Queensland South
Australia
Western
Australia
Tasmania Northern
Territory
Australian
Capital
Territory
Wages and Salaries Other Expenses Income
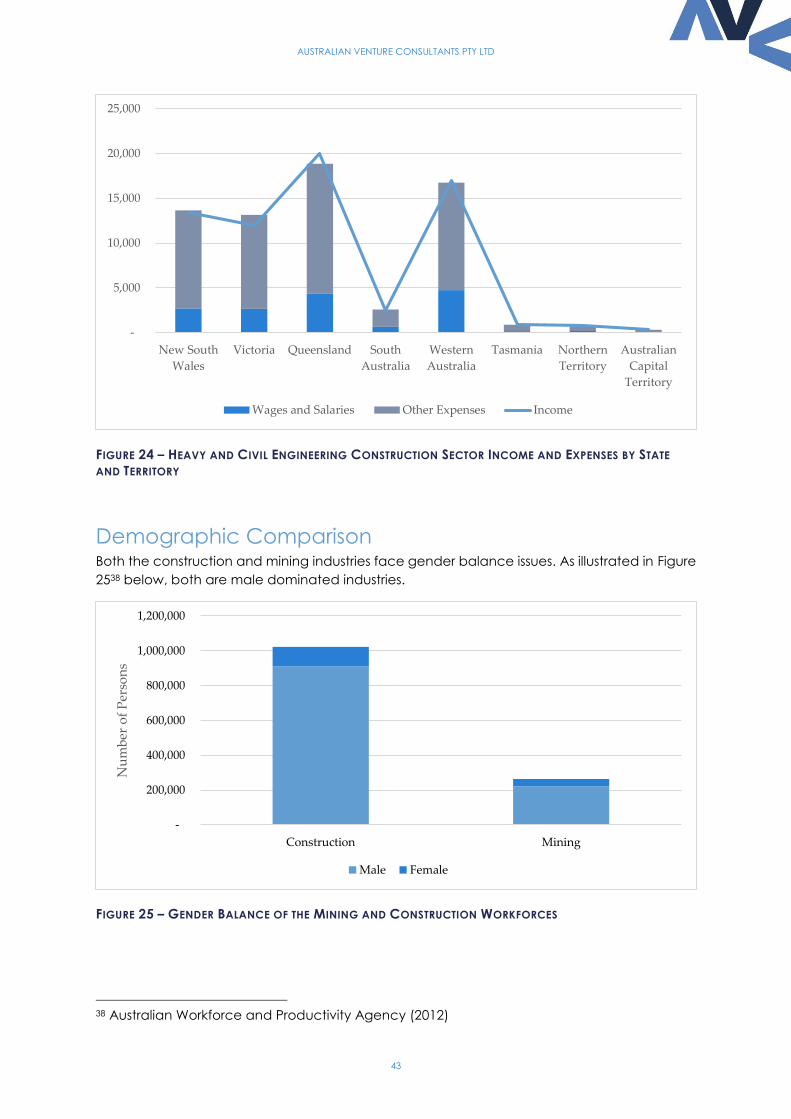
AUSTRALIAN VENTURE CONSULTANTS PTY LTD
43
FIGURE 24 – HEAVY AND CIVIL ENGINEERING CONSTRUCTION SECTOR INCOME AND EXPENSES BY STATE
AND TERRITORY
Demographic Comparison Both the construction and mining industries face gender balance issues. As illustrated in Figure
2538 below, both are male dominated industries.
FIGURE 25 – GENDER BALANCE OF THE MINING AND CONSTRUCTION WORKFORCES
38 Australian Workforce and Productivity Agency (2012)
-
5,000
10,000
15,000
20,000
25,000
New South
Wales
Victoria Queensland South
Australia
Western
Australia
Tasmania Northern
Territory
Australian
Capital
Territory
Wages and Salaries Other Expenses Income
-
200,000
400,000
600,000
800,000
1,000,000
1,200,000
Construction Mining
Nu
mb
er o
f P
erso
ns
Male Female
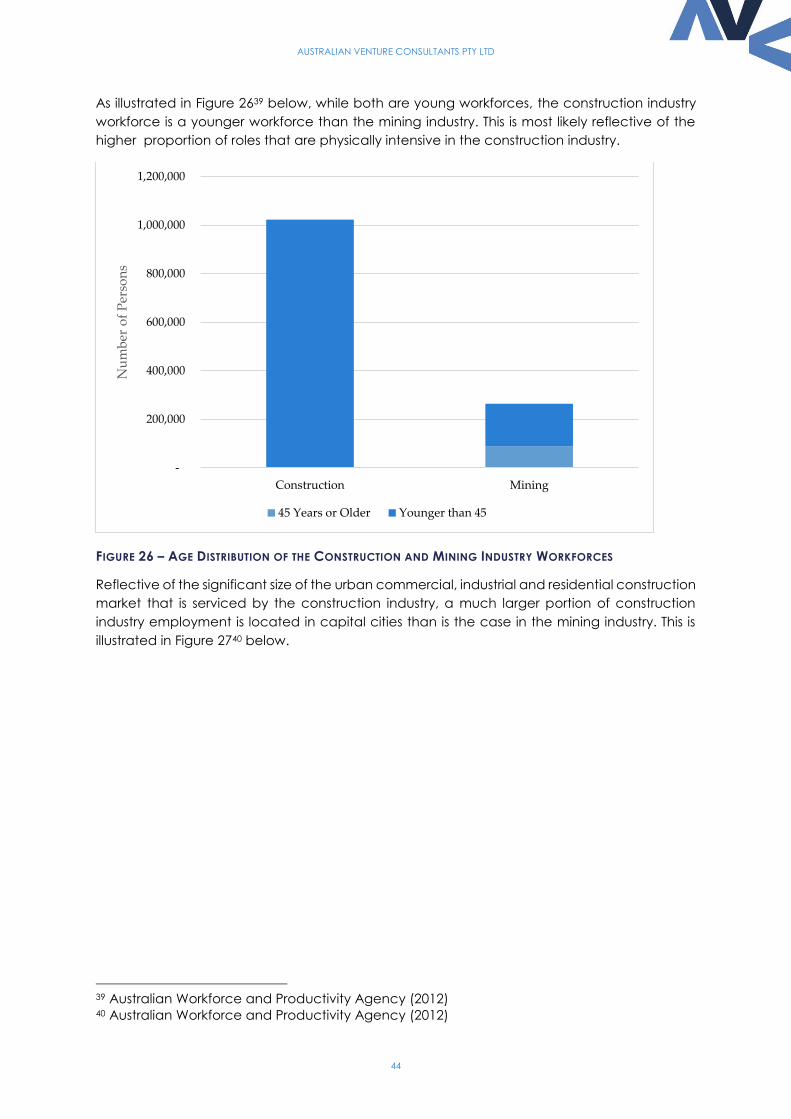
AUSTRALIAN VENTURE CONSULTANTS PTY LTD
44
As illustrated in Figure 2639 below, while both are young workforces, the construction industry
workforce is a younger workforce than the mining industry. This is most likely reflective of the
higher proportion of roles that are physically intensive in the construction industry.
FIGURE 26 – AGE DISTRIBUTION OF THE CONSTRUCTION AND MINING INDUSTRY WORKFORCES
Reflective of the significant size of the urban commercial, industrial and residential construction
market that is serviced by the construction industry, a much larger portion of construction
industry employment is located in capital cities than is the case in the mining industry. This is
illustrated in Figure 2740 below.
39 Australian Workforce and Productivity Agency (2012) 40 Australian Workforce and Productivity Agency (2012)
-
200,000
400,000
600,000
800,000
1,000,000
1,200,000
Construction Mining
Nu
mb
er o
f P
erso
ns
45 Years or Older Younger than 45
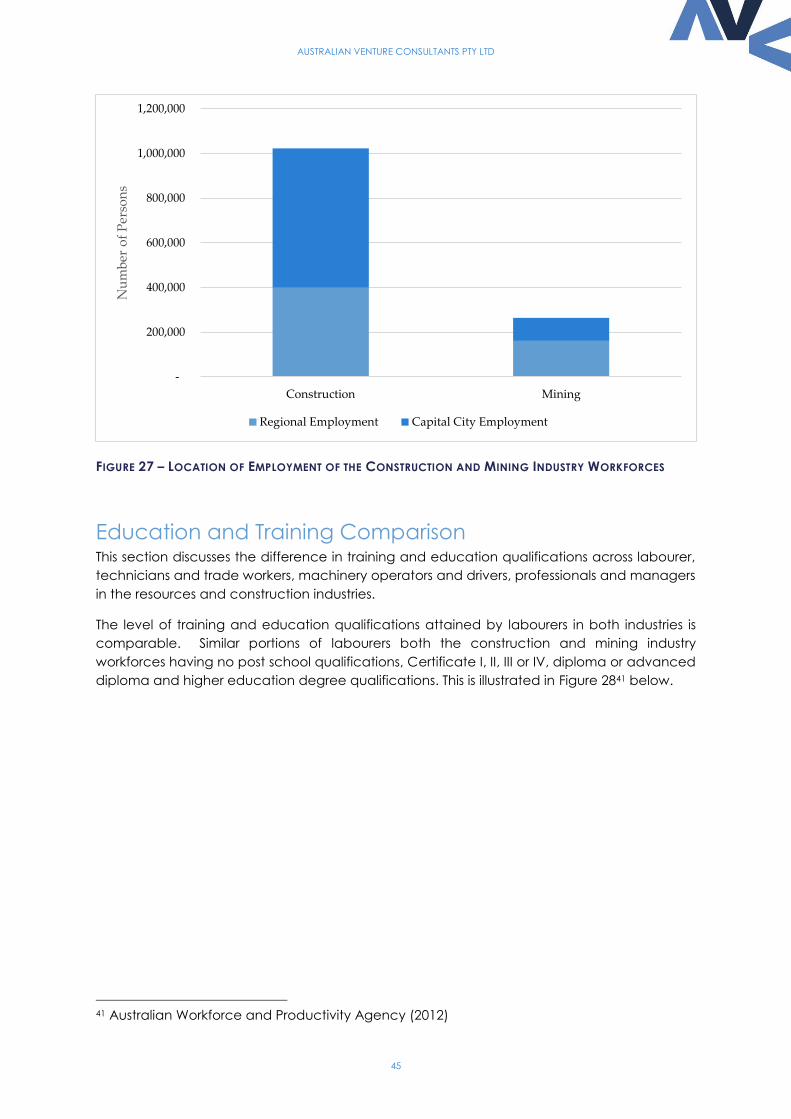
AUSTRALIAN VENTURE CONSULTANTS PTY LTD
45
FIGURE 27 – LOCATION OF EMPLOYMENT OF THE CONSTRUCTION AND MINING INDUSTRY WORKFORCES
Education and Training Comparison This section discusses the difference in training and education qualifications across labourer,
technicians and trade workers, machinery operators and drivers, professionals and managers
in the resources and construction industries.
The level of training and education qualifications attained by labourers in both industries is
comparable. Similar portions of labourers both the construction and mining industry
workforces having no post school qualifications, Certificate I, II, III or IV, diploma or advanced
diploma and higher education degree qualifications. This is illustrated in Figure 2841 below.
41 Australian Workforce and Productivity Agency (2012)
-
200,000
400,000
600,000
800,000
1,000,000
1,200,000
Construction Mining
Nu
mb
er o
f P
erso
ns
Regional Employment Capital City Employment
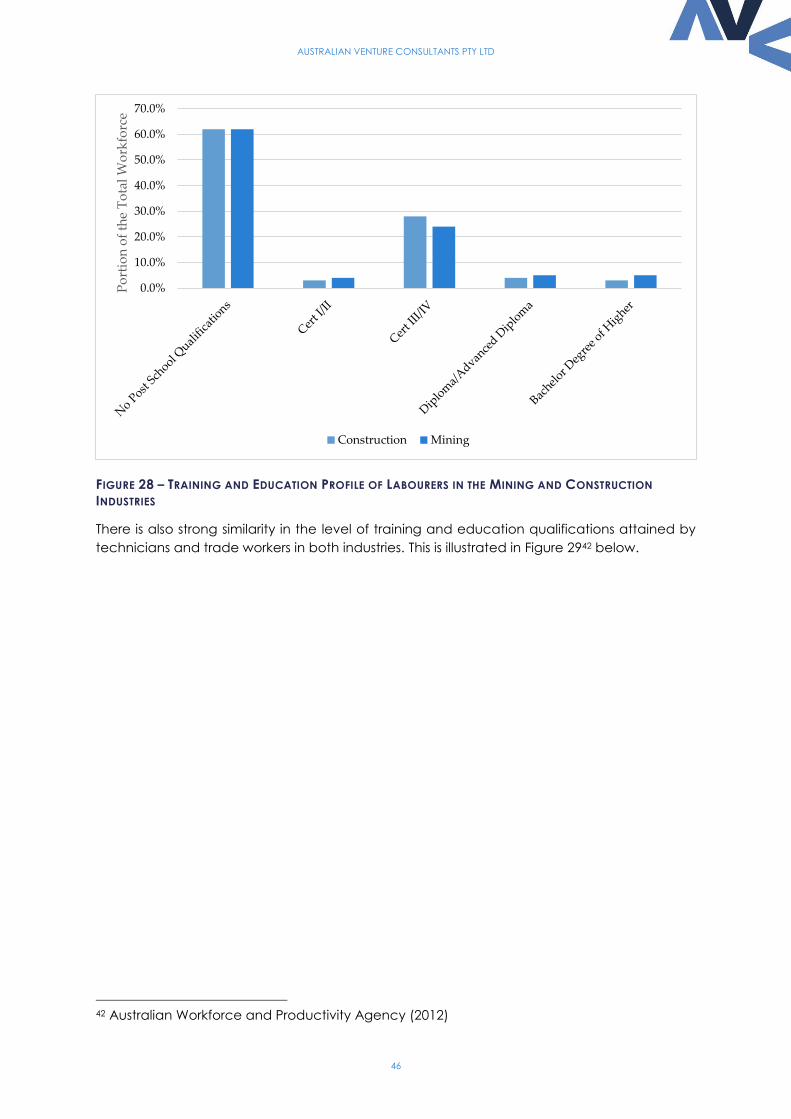
AUSTRALIAN VENTURE CONSULTANTS PTY LTD
46
FIGURE 28 – TRAINING AND EDUCATION PROFILE OF LABOURERS IN THE MINING AND CONSTRUCTION
INDUSTRIES
There is also strong similarity in the level of training and education qualifications attained by
technicians and trade workers in both industries. This is illustrated in Figure 2942 below.
42 Australian Workforce and Productivity Agency (2012)
0.0%
10.0%
20.0%
30.0%
40.0%
50.0%
60.0%
70.0%P
ort
ion
of
the
To
tal
Wo
rkfo
rce
Construction Mining
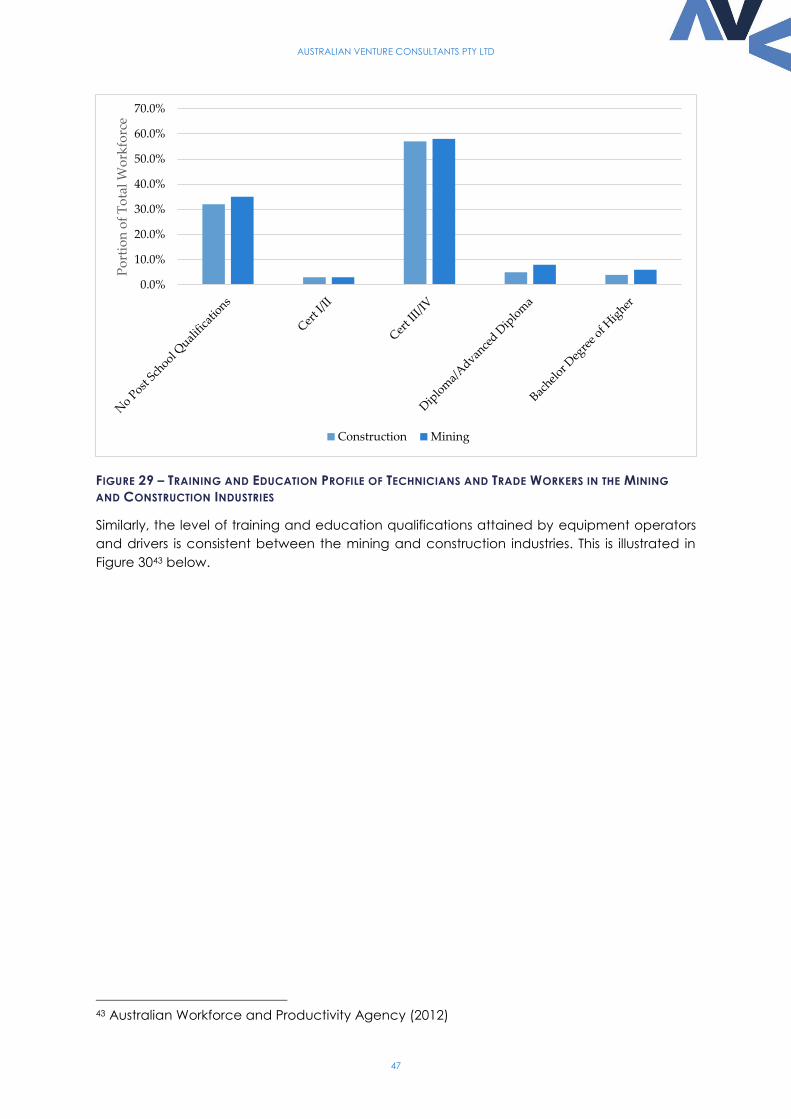
AUSTRALIAN VENTURE CONSULTANTS PTY LTD
47
FIGURE 29 – TRAINING AND EDUCATION PROFILE OF TECHNICIANS AND TRADE WORKERS IN THE MINING
AND CONSTRUCTION INDUSTRIES
Similarly, the level of training and education qualifications attained by equipment operators
and drivers is consistent between the mining and construction industries. This is illustrated in
Figure 3043 below.
43 Australian Workforce and Productivity Agency (2012)
0.0%
10.0%
20.0%
30.0%
40.0%
50.0%
60.0%
70.0%P
ort
ion
of
To
tal
Wo
rkfo
rce
Construction Mining
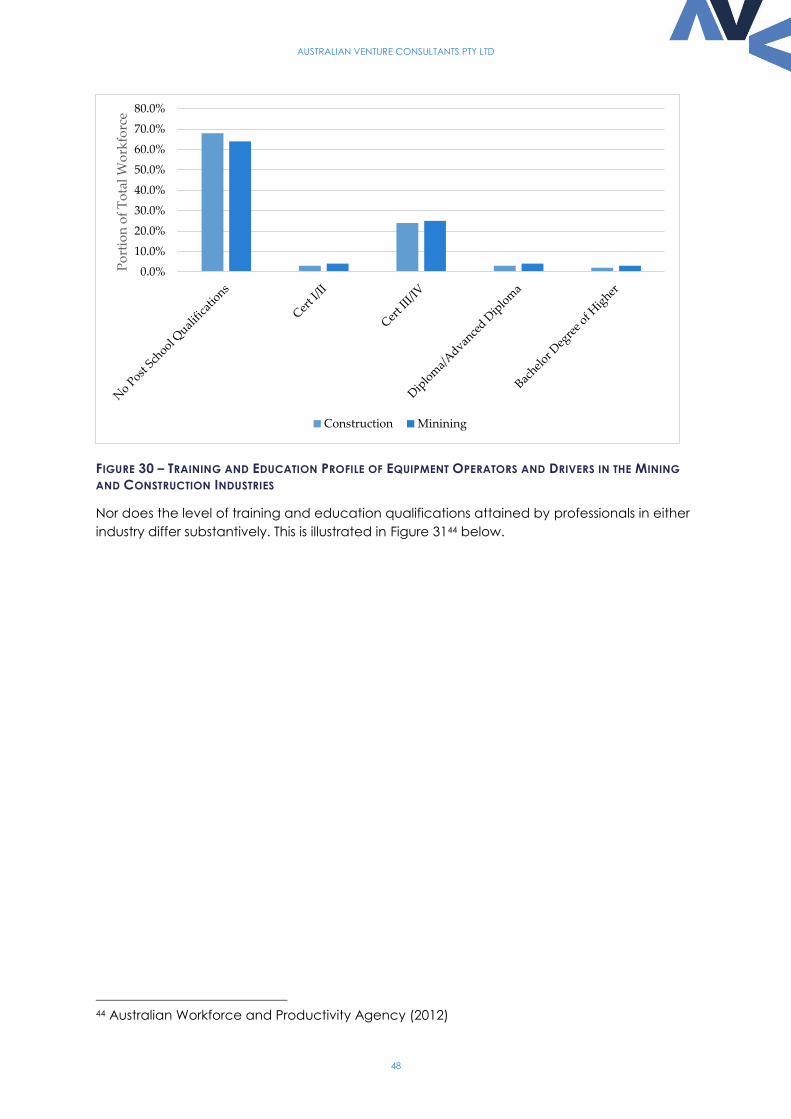
AUSTRALIAN VENTURE CONSULTANTS PTY LTD
48
FIGURE 30 – TRAINING AND EDUCATION PROFILE OF EQUIPMENT OPERATORS AND DRIVERS IN THE MINING
AND CONSTRUCTION INDUSTRIES
Nor does the level of training and education qualifications attained by professionals in either
industry differ substantively. This is illustrated in Figure 3144 below.
44 Australian Workforce and Productivity Agency (2012)
0.0%
10.0%
20.0%
30.0%
40.0%
50.0%
60.0%
70.0%
80.0%P
ort
ion
of
To
tal
Wo
rkfo
rce
Construction Minining
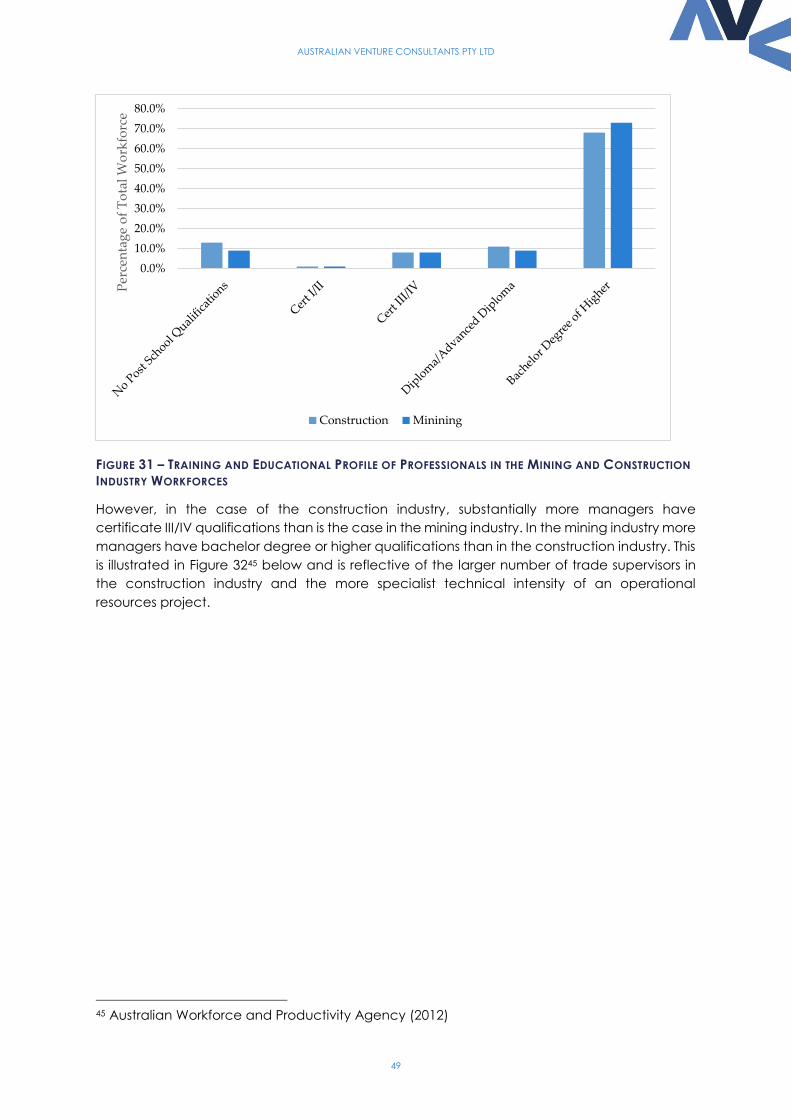
AUSTRALIAN VENTURE CONSULTANTS PTY LTD
49
FIGURE 31 – TRAINING AND EDUCATIONAL PROFILE OF PROFESSIONALS IN THE MINING AND CONSTRUCTION
INDUSTRY WORKFORCES
However, in the case of the construction industry, substantially more managers have
certificate III/IV qualifications than is the case in the mining industry. In the mining industry more
managers have bachelor degree or higher qualifications than in the construction industry. This
is illustrated in Figure 3245 below and is reflective of the larger number of trade supervisors in
the construction industry and the more specialist technical intensity of an operational
resources project.
45 Australian Workforce and Productivity Agency (2012)
0.0%
10.0%
20.0%
30.0%
40.0%
50.0%
60.0%
70.0%
80.0%P
erce
nta
ge
of
To
tal
Wo
rkfo
rce
Construction Minining
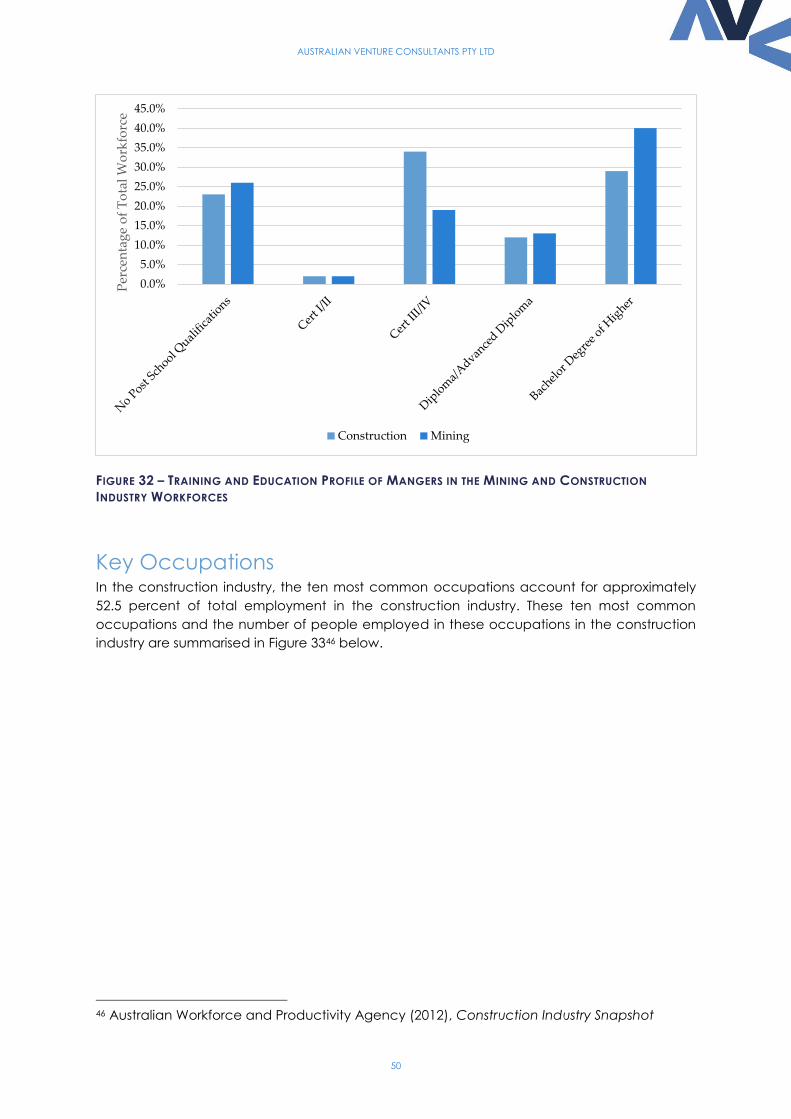
AUSTRALIAN VENTURE CONSULTANTS PTY LTD
50
FIGURE 32 – TRAINING AND EDUCATION PROFILE OF MANGERS IN THE MINING AND CONSTRUCTION
INDUSTRY WORKFORCES
Key Occupations In the construction industry, the ten most common occupations account for approximately
52.5 percent of total employment in the construction industry. These ten most common
occupations and the number of people employed in these occupations in the construction
industry are summarised in Figure 3346 below.
46 Australian Workforce and Productivity Agency (2012), Construction Industry Snapshot
0.0%
5.0%
10.0%
15.0%
20.0%
25.0%
30.0%
35.0%
40.0%
45.0%P
erce
nta
ge
of
To
tal
Wo
rkfo
rce
Construction Mining
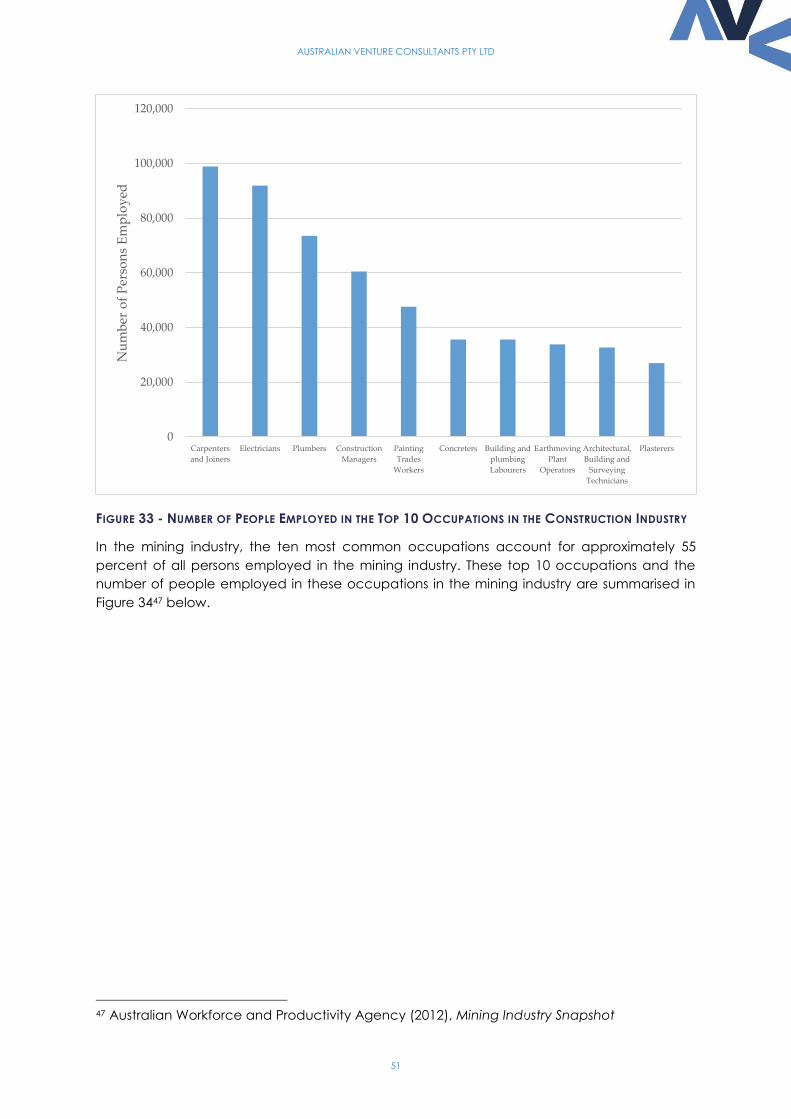
AUSTRALIAN VENTURE CONSULTANTS PTY LTD
51
FIGURE 33 - NUMBER OF PEOPLE EMPLOYED IN THE TOP 10 OCCUPATIONS IN THE CONSTRUCTION INDUSTRY
In the mining industry, the ten most common occupations account for approximately 55
percent of all persons employed in the mining industry. These top 10 occupations and the
number of people employed in these occupations in the mining industry are summarised in
Figure 3447 below.
47 Australian Workforce and Productivity Agency (2012), Mining Industry Snapshot
0
20,000
40,000
60,000
80,000
100,000
120,000
Carpenters
and Joiners
Electricians Plumbers Construction
Managers
Painting
Trades
Workers
Concreters Building and
plumbing
Labourers
Earthmoving
Plant
Operators
Architectural,
Building and
Surveying
Technicians
Plasterers
Nu
mb
er o
f P
erso
ns
Em
plo
yed
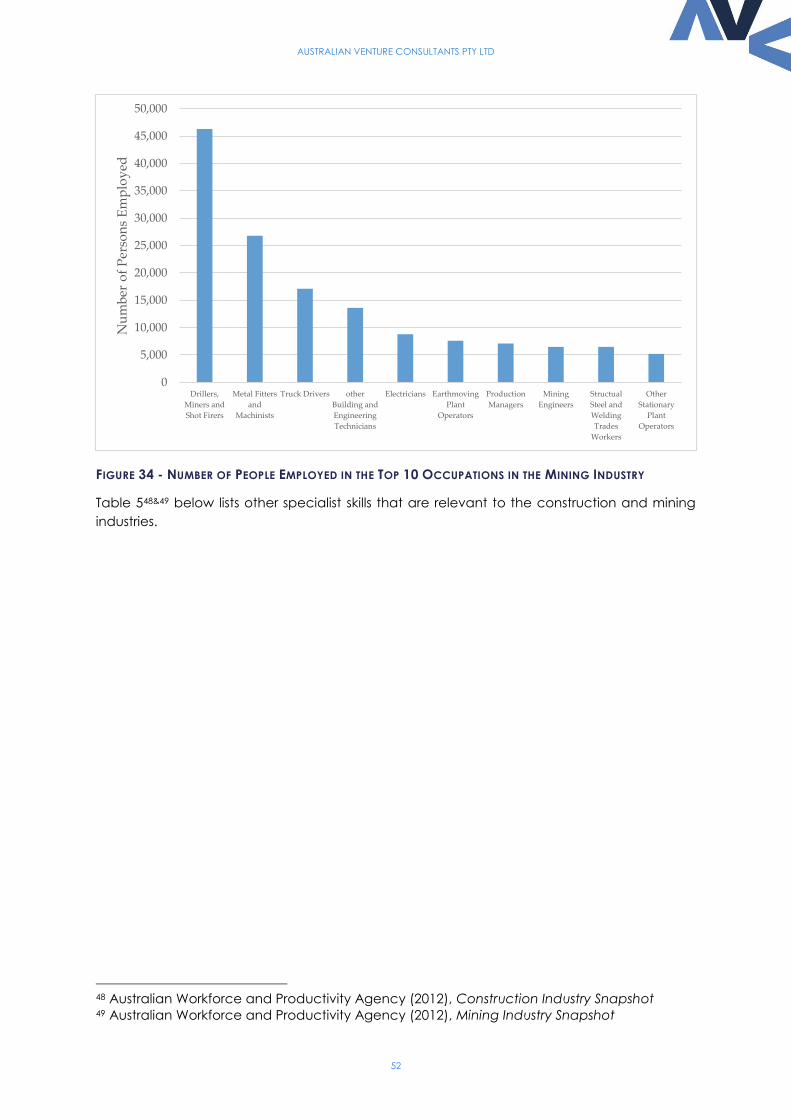
AUSTRALIAN VENTURE CONSULTANTS PTY LTD
52
FIGURE 34 - NUMBER OF PEOPLE EMPLOYED IN THE TOP 10 OCCUPATIONS IN THE MINING INDUSTRY
Table 548&49 below lists other specialist skills that are relevant to the construction and mining
industries.
48 Australian Workforce and Productivity Agency (2012), Construction Industry Snapshot 49 Australian Workforce and Productivity Agency (2012), Mining Industry Snapshot
0
5,000
10,000
15,000
20,000
25,000
30,000
35,000
40,000
45,000
50,000
Drillers,
Miners and
Shot Firers
Metal Fitters
and
Machinists
Truck Drivers other
Building and
Engineering
Technicians
Electricians Earthmoving
Plant
Operators
Production
Managers
Mining
Engineers
Structual
Steel and
Welding
Trades
Workers
Other
Stationary
Plant
Operators
Nu
mb
er o
f P
erso
ns
Em
plo
yed
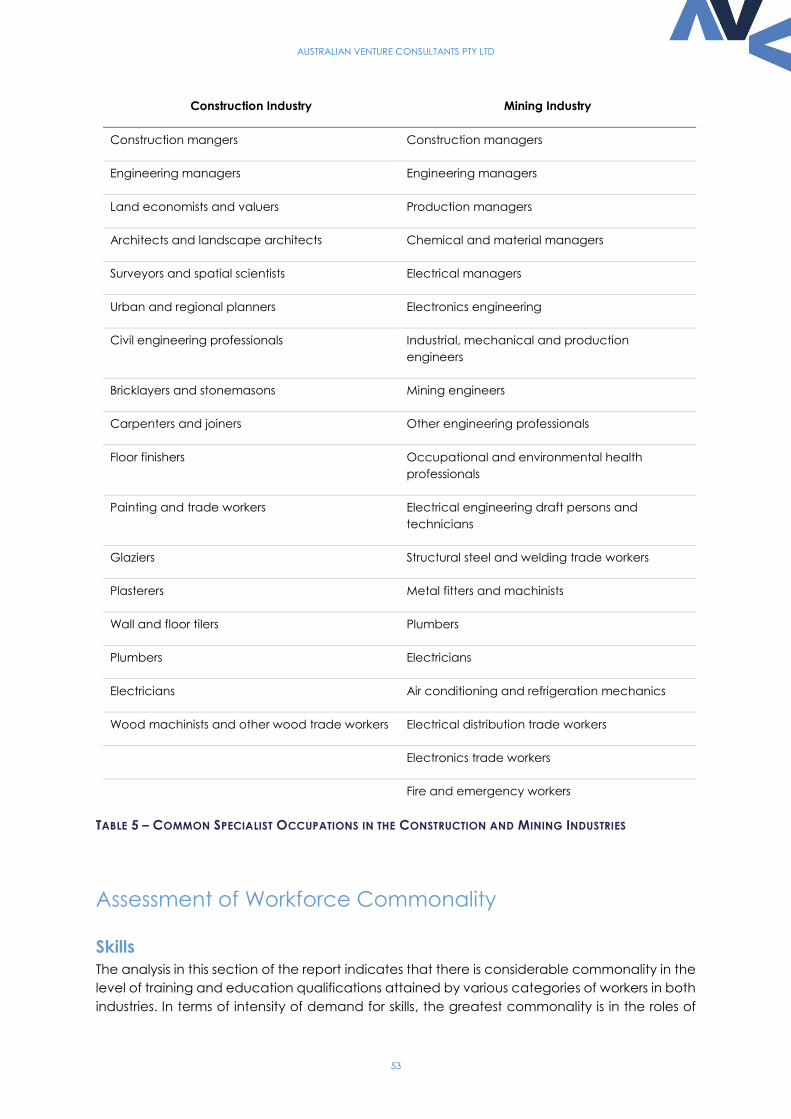
AUSTRALIAN VENTURE CONSULTANTS PTY LTD
53
Construction Industry Mining Industry
Construction mangers Construction managers
Engineering managers Engineering managers
Land economists and valuers Production managers
Architects and landscape architects Chemical and material managers
Surveyors and spatial scientists Electrical managers
Urban and regional planners Electronics engineering
Civil engineering professionals Industrial, mechanical and production
engineers
Bricklayers and stonemasons Mining engineers
Carpenters and joiners Other engineering professionals
Floor finishers Occupational and environmental health
professionals
Painting and trade workers Electrical engineering draft persons and
technicians
Glaziers Structural steel and welding trade workers
Plasterers Metal fitters and machinists
Wall and floor tilers Plumbers
Plumbers Electricians
Electricians Air conditioning and refrigeration mechanics
Wood machinists and other wood trade workers Electrical distribution trade workers
Electronics trade workers
Fire and emergency workers
TABLE 5 – COMMON SPECIALIST OCCUPATIONS IN THE CONSTRUCTION AND MINING INDUSTRIES
Assessment of Workforce Commonality
Skills
The analysis in this section of the report indicates that there is considerable commonality in the
level of training and education qualifications attained by various categories of workers in both
industries. In terms of intensity of demand for skills, the greatest commonality is in the roles of
AUSTRALIAN VENTURE CONSULTANTS PTY LTD
54
electricians and earth moving plant operators, as well as speciality areas of construction and
engineering managers. However, in all cases, the demand for these skills from operational
resources projects will be far less than demand from the construction industry simply by virtue
of the comparative size of the sectors and the much smaller overall operational resources
workforce.
There is likely to be common demand for other occupations such as structural steel and
welding trades, truck drivers and plumbers. However, the operational resources projects tend
to employ fewer numbers of persons in these roles. Many functions such as drillers and shot
firers who comprise a large component of the mining industry workforce are specialist skills with
limited application outside of the resource industry. Furthermore, many of the general trades
deployed at operational resources projects develop specialist skills peculiar to their
operational resources project role.
Structure and Culture
As discussed above, there is some scope for transition of roles in the resources industry
construction workforce to operational roles in those projects, particularly in the case of
electricians and earth moving plant operators. However, the number of opportunities for
electricians and earth moving plant operators to transition to operational roles will be
substantially limited by the much smaller size of the operational resources industry workforce.
The construction and resources industry workforces demonstrate similar demographics in terms
of age and gender profile. However, for the following reasons the construction industry
workforces are culturally and structurally quite different:
Skills in most construction industry occupations are developed to be applicable to a
wide range of construction projects, across many sectors of the economy. Whereas,
skills in resources industry operational roles tend to be relatively specialised for the
specific task.
The construction workforce is largely a mobile workforce that selects the projects and
locations in which it works based on personal utility. Workers that comprise that
workforce are comfortable with geographic and project diversity and often thrive on
that diversity. Whereas, workers that comprise the operational resources industry
workforce, typically seek a higher degree of permanency and stability.
As such, even where a construction industry worker’s skills could be deployed on an
operational resource project, or where they could be further developed through additional
training to be deployed on an operational resources industry project, it is highly unlikely that
many construction industry workers will seek a permanent operational role.
AUSTRALIAN VENTURE CONSULTANTS PTY LTD
55
Lessons from the Recent Construction Phase Resources project development costs in Australia, particularly in Western Australia, over the
past decade do not compare well with other jurisdictions. For example, it has been estimated
that when compared to the Gulf Coast of the United States, Australian sustaining capital
projects are 40 percent more expensive, iron ore and coal developments 38 percent more
expensive and large complex downstream projects 50 percent more expensive50. Additionally,
it has been widely cited that in the case of Western Australian iron ore projects, the cost per
expansion tonne has increased from A$10 per expansion tonne to between A$28 and A$48
per expansion tonne.
These higher costs are a function of a number of factors including the remote location of
projects, particularly in Western Australia, the sheer number and scale of projects under
construction at the same time, more significant capital investment associated with recovery
from lower quality deposits (resource depletion effect) and the workforce constraints discussed
in this paper. These are structural issues associated with the Australian economy that will not
change dramatically in the short to medium term.
Another cited contributor to the escalation of costs is the mechanism through which resources
construction projects are managed. The engagement of an EPCM to manage the detailed
engineering, procurement and construction of a resources project allows resources
companies to develop projects without maintaining an internal construction group, which in
the case of most, if not all, resources companies would not be sustainable. However,
anecdotally, the size of the internal project management team that is required to oversee and
effectively liaise with the EPCM has grown dramatically. Two factors have driven the growth in
the project management function:
Increased focus on OHS and Environment
Increased awareness and action on managing OHS and the environmental impact of
projects has created management positions associated with these functions within the
EPCM that need to be integrated with the resources companies OHS and environment
policies. This requires OHS and environment functionality within the internal project
team.
Man-matching
The sheer scale of the projects means that the EPCM management teams have grown
as well. In order to effectively liaise with the EPCM, the internal project management
teams have expanded. This is necessary to ensure construction projects remain on
schedule.
Construction productivity challenges are also occurring at the construction sites. This is primarily
a result of growing supervisory and safety requirements. A typical trade team is now comprised
of three trade workers, a lead-hand and a supervisor. OHS induction processes can result in it
taking up to two hours from a worker who is not accredited with the resources company’s
safety training contractor to enter a site. The fact that companies use different safety training
contractors causes significant cost where contractors are moving from project to project as
most resources companies will only accept accreditation from their specific OHS training
50 Business Council of Australia (2013), Securing Investment in Australia’s Future: Report of the
Costs Task Force
AUSTRALIAN VENTURE CONSULTANTS PTY LTD
56
service provider. For example, it has been estimated that on a $30 million construction project,
approximately $1.0 million will be associated with induction and safety training.
Furthermore, the change in construction worker FIFO rosters from 3 weeks on and 1 week-off
to 2 weeks on and 1 week off is resulting in lower productivity, as workers don’t have adequate
time to settle in and focus.
While OHS and environmental management is obviously critical, there seems scope to
substantially improve the efficiency through which this is managed. The solution is likely to
revolve around standardisation and harmonisation of induction programs where possible
across industry and the application of enhanced ICT solutions for integrating with EPCMs and
conducting project induction. It should be noted that the standardisation of induction
programs has been trialled previously by industry. The Mining and Resources Contractors Safety
Training Association (MARCSTA) is a not-for-profit organisation established in 1996 to provide
safety inductions for organisations contracting to the mining industry and industry in general.
The key product is a basic safety induction and subsequent refresher program that was
designed to ensure currency of knowledge of essential safety legislation, regulatory
requirements and fundamental industry safety practices. This is delivered by a network of
training providers. This program does not replace site specific induction program, but rather
provides and introduction to OHS fundamentals in the mining industry.
As at February of this year, MARCSTA ceased offering nationally accredited units of
competency and has relinquished its RTO status. In order to have a material effect on
productivity, a standardised OHS induction program would have to substantially reduce
individual site specific requirements.
AUSTRALIAN VENTURE CONSULTANTS PTY LTD
57
Implications for Skills, Training and Education
While it is prima-facie rational to expect that supplementary training could play a role in
transitioning some of the construction workforce to operational roles in new resources industry,
the analysis in this study strongly indicates that for cultural and structural reasons, there would
be a limited market for such training.
The most important observation from this study is the identification of productivity issues
associated with the recent investment phase. There were clearly significant productivity
penalties associated with the EPCM model of resource project construction management that
was used ubiquitously over the past decade. While there is no alternative to a contracted
construction model, there may be scope for improving the efficiency of that model. This would
require deeper research into issues such as the following so that learnings could be
incorporated into current and future training and education programs targeted at both the
resources and construction industries:
Investment Phase Cycle Management
A generally deeper understanding of the recent investment phase cycle in terms of skill
requirements and timing of those skill requirement could better inform future training
and resourcing requirements.
Project Management
Clearly a significant portion of the productivity penalty associated with the recent
investment phase was the project management structures used to manage the
construction projects. Research into this phenomenon and alternatives may inform a
more efficient future investment phase.
Complex Remote Project Construction
The recent investment phase revolved around a relatively large number of complex
construction projects in remote isolated locations. The workforce that undertook that
construction will have learnings associated with performing their specific functions in
these conditions that could be captured and incorporated into education and training
programs so that future investment phases are better informed. These learning may
range from optimal FIFO rosters to performing specific technical tasks in infrastructure
deficient locations.
Occupational Health and Safety Induction
One implication for training and education from this report is in the harmonisation of
OHS and environmental training across trades and industries to reduce induction cost.
While each project is unique and as such will have unique OHS and environmental risks,
the cost of safety training in particular could be substantially reduced if a significant
component of the fundamentals could be delivered as part of worker training and
education and that this was recognised within and across industries. Historical attempts
to achieve this have proved challenging and as such, an assessment of the reasons
historical attempts have failed should be undertaken.
AUSTRALIAN VENTURE CONSULTANTS PTY LTD
58
Conclusions
The expansion of the Australian resources industry over the past decade has seen a total of
A$457 billion of new resources industry capital, more than half of which has been expended
in Western Australia.
The peak construction workforce associated with the Western Australian projects is at least
45,000. These workers have been employed or contracted by approximately 210 EPCM and
contractor companies engaged by resources project proponents to give effect to
construction.
When a resources project transitions from the construction phase to an operational phase the
size of the workforce associated with that project substantially reduces. The degree to which
the size of the workforce decreases is a function of the nature of the project and its operational
workforce requirements. Nevertheless, the size of the workforce decreases by at least
approximately 65 percent in the case of iron ore projects and by as much as 96 percent in the
case of oil and gas projects. The skills and occupation profiles of the construction and
operational workforces are also markedly different. Many functions such as drillers and shot
firers who comprise a large component of the mining industry workforce are specialist skills with
limited application outside of the resource industry. In the limited areas of expertise where
there is overlap, such as electricians, the demand from the operational resources industry for
these skills is far less than the demand for these skills from the much larger construction industry.
Very importantly, the operational workforce is not a subset of the construction workforce as
very few, if any workers employed by construction contractors transition into operational roles
with the projects. This is primarily because for the following reasons, the construction industry
workforce is culturally and structurally very different to the operational mining industry
workforce:
Skills in most construction industry occupations are developed to be applicable to a
wide range of construction projects, across many sectors of the economy. Whereas,
skills in resources industry operational roles tend to be relatively specialised for the
specific task.
The construction workforce is largely a mobile workforce that selects the projects and
locations in which it works based on personal utility. Workers that comprise that
workforce are comfortable with geographic and project diversity and often thrive on
that diversity. Whereas, workers that comprise the operational resources industry
workforce, typically seek a higher degree of permanency and stability.
As such, while supplementary training in some areas could create opportunity for transition of
some roles from the construction workforce to the operational workforce, there is unlikely to
be a substantive market for such courses. The main implication for training and education is to
better understand the sources of productivity penalties associated with the resources industry
investment phase over the past decade and to build key learnings from that work into future
education and training programs targeted at both the resources and construction industries.
AUSTRALIAN VENTURE CONSULTANTS PTY LTD
59
Appendix 1 – Overview of Western Australian
Resources Industry Construction Projects
Oil and Gas Projects
Browse, Woodside (FID Delayed/Pre-FID)
Woodside’s Browse Basin interests are located approximately 425 kilometers off the north of
Broome, Western Australia. It was initially proposed that gas would be transferred to a shore
based LNG plant at the Western Australian Government’s proposed James Price Point Natural
Gas Precinct. However, further development of this option was suspended, when studies
demonstrated that the option would prove uneconomic. Currently, Woodside is seeking to
enter into FEED for a floating LNG option, with FID targeted for the second half of 2015.
Gorgon, Chevron (Under Construction)
The Gorgon Project is developing the Gorgon and Jansz-lo gas fields, located between 130
and 220 kilometers off the northwest coast of Western Australia. The project includes the
construction of a 15.6 MTPA LNG export plant as well as a domestic gas plant with a supply
capacity of 300 terrajoules per day on Barrow Island. The first LNG shipment and domestic gas
delivery is expected in 2015.
Julimar, Apache (Under Construction)
The Julimar and Brunello gas fields were discovered by Apache and Kuwait Foreign Petroleum
Exploration Co. (KUFPEC) in 2007 and are located approximately 180 kilometres west-northwest
of Dampier in Western Australia. In 2009, Apache and KUFPEC agreed to supply gas from the
fields to the Chevron operated Wheatstone LNG project.
Macedon, BHP Billiton Petroleum (Recently Commissioned)
The Macedon Gas Project comprises the development of the Macedon gas field, a subsea
gas pipeline and an onshore gas treatment and compression plant located at Ashburton
North, approximately 17 kilometres southwest of Onslow. The plant produces gas for sale into
the domestic market via the Dampier to Bunbury Natural Gas Pipeline. The project
commenced operations in August 2013.
North West Shelf, Rankin Redevelopment, Woodside (Recently
Commissioned)
In March 2008 the North West Shelf Project participants approved funding of the A$5 billion
North Rankin Redevelopment which will recover remaining low pressure gas from the North
Rankin and Perseus gas fields, and extend the field life to around 2040. The project has involved
the installation of a new second platform- North Rankin B- with gas compression facilities, low
pressure separators, utilities and accommodation. It also included the necessary connections
to North Rankin A and some refurbishment of the North Rankin A platform. The project
commenced sending gas to the Karratha Gas Plant in October 2013.
AUSTRALIAN VENTURE CONSULTANTS PTY LTD
60
Northwest Shelf Greater Western Flank, Woodside (Under Construction)
The broader Greater Western Flank (GWF) area consists of 16 fields located to the south west
of the Goodwyn A (GWA) platform, and are estimated to contain gross (100%) Proved plus
Probable (2P) reserves of 3.1 Tcf of dry gas and 99 million barrels of condensate. In December
2011, Woodside, as Operator of the North West Shelf Project, announced the North West Shelf
Project participants had approved the development of the first phase of the Greater Western
Flank Project off the north-west coast of Australia with a total estimated capital expenditure of
approximately A$2.5 billion. The project is expected to commence production in 2016.
Prelude, Shell (Under Construction)
The Prelude FLNG project achieved FID in May 2011. The field is currently under development
and the FLNG facility under construction. Once operational, the Prelude FLNG facility will
produce at least 5.3 million tonnes per annum (mtpa) of liquids, 3.6 mtpa of LNG, 1.3 mtpa of
condensate (equivalent to 35,000 bbl/d) and 0.4 mtpa of LPG.
The project is expected to create around 350 direct and 650 indirect jobs. Recruitment of staff
to operate the facility will ramp up during 2013 and 2014.
Scarborough, ExxonMobil (Pre-FID)
ExxonMobil's affiliate, Esso Australia Resources Pty Ltd, is the operator of the Scarborough gas
field in a 50:50 joint venture with BHP Billiton Petroleum. Scarborough, discovered in 1979, is
located approximately 220 kilometres northwest of Exmouth in 900 metres of water. It is one
of the most remote Carnarvon Basin gas resources. Development of the project will include:
o Drilling of approximately 12 production wells drilled in two phases, with
approximately seven wells being drilled between 2018 and 2019 (Phase 1) and
approximately five wells to be drilled within approximately 15 years following
Project start up (Phase 2).
o Installation of subsea infrastructure including umbilicals, risers and flowlines and
tie-back of the production wells to the FLNG facility. Offshore installation and
commissioning is scheduled to occur during 2019-2020.
o Installation and operation of the FLNG facility that will be permanently moored
on location and is expected to be approximately 495 m long and 75 m wide.
The FLNG facility will combine the requirements for gas treatment, liquefaction,
storage and transfer of LNG to carriers for delivery to market. Production is
expected to commence during 2020-21. The Scarborough gas field has an
expected producing life of approximately 25-35 years.
The Project is currently in the pre-front end engineering design (pre-FEED) phase. Given that
the Project is currently in an early phase, the Project timings provided are indicative only.
Following completion of FEED, a final investment decision (FID) is expected during 2014-2015.
Wheatstone, Chevron (Under Construction)
Chevron discovered the Wheatstone gas field in August 2004 and in March 2008 announced
an intention to develop the gas resource as a greenfield onshore LNG and domestic gas
AUSTRALIAN VENTURE CONSULTANTS PTY LTD
61
project. A final investment decision to proceed with the Wheatstone Project was made in
September 2011, with construction commencing in December of the same year. The
Wheatstone Project will include an onshore facility located at Ashburton North Strategic
Industrial Area (ANSIA), 12 kilometres west of Onslow in Western Australia’s Pilbara region. The
foundation project includes two LNG trains with a combined capacity of 8.9 million tonnes
per annum (MTPA) and a domestic gas plant.
Iron Ore Projects
Karara Expansion, Karara/Gindalbie Metals (Under Construction)
Located in the Midwest region of Western Australia, approximately 200 kilometres east of
Geraldton, the Karara DSO and magnetite operation commissioned in 2011-12 producing
approximately 8.5 mtpa of DSO and magnetite, exporting through the Port of Geraldton.
Karara’s plans to expand to 16 mtpa in the medium term, requiring an export port alternative
(ultimately Oakajee) as the Geraldton Port is at capacity.
Rio Tinto Pilbara Expansion (Under Construction)
Under its Rio Tinto 353 Expansion plan, Rio Tinto is endeavouring to achieve annual production
from its Pilbara operations of 333 mtpa by 2015. This expansion program is being conducted
over two phases. Phase 1 was completed in the third quarter of 2013 and increased production
to 290 mtpa. Phase 2 will see production capacity grow to 360 mtpa by 2015. By 2015, it is
expected that Rio Tinto will have spent more than A$18 billion on this expansion program.
Phase I and Phase II have and will involve a number of brownfield expansions at existing mines
including Nammuldi, Marandoo, Western Turner Syncline, Brockman 4 and Yandicoogina, as
well as significant upgrades to processing and rail facilities. It also includes the development
of the Hope Downs 4 mine (see below).
A significant component of the expansion is a major expansion of Rio Tinto’s Port Lambert
export facilities. The development at Cape Lambert will cost approximately A$200 million and
will increase Cape Lambert’s capacity by 53 million tpa. The project includes a tandem car
dumber facility, a stockyard (including two stackers) and two bucket wheel reclaimers, a
screenhouse and surge bin facility, 1.4 kilometre jetty and a double-sided iron ore wharf with
two shipping berths and a ship-loader.
BHP Billiton Pilbara Expansion (Under Construction)
BHP Billiton Iron Ore’s expansion plans will see production from its Pilbara operations grow to
220 mtpa. This will involve a number of brownfield expansions and increased processing and
rail capacity. Originally the expansion plans involved the development of an ‘outer-harbour’
capacity and stockyard facility at Port Hedland. However, these plans have been suspended
in favour of a more modest development of the inner-harbour.
A major component of BHP Billiton’s expansion plans has been the development of the
Jimblebar Mine, located 43 kilometres east of Newman. With a total capital investment of
US$2.6 billion and a construction workforce of 2,500, the mine commenced production in 2014
and will immediately scale to 35 mtpa by the end of the 2015 financial year. Production at
Jimblebar is ultimately expandable to 55 mtpa.
AUSTRALIAN VENTURE CONSULTANTS PTY LTD
62
Chichester and Solomon Expansion, Fortescue Metals Group (Recently
Commissioned/Under Construction)
Chichester Hub
The Chichester Hub is located 263 kilometres south of Port Hedland and 150 kilometres north of
Newman. It encompasses the Cloudbreak and Christmas Creek mines, as well as a smaller
amount of ore feedstock provided under a under a joint venture with BC Iron.
The Cloudbreak mine was commissioned in 2008 and currently processes approximately 40
mtpa. Christmas Creek is located 50 kilometres east of Cloudbreak and commenced
production in 2009. It has been the subject of expansions in 2011 and 2012. As a result the
projects have a combined processing capability of approximately 50 mtpa.
Solomon Hub
The Solomon Hub is located 120 kilometres west of the Chichester Hub. The Solomon Hub
services approximately 3 billion tonnes of iron resource associated with the Firetail and Kings
mines. Early earth works commenced in 2011, followed by significant greenfields construction
work to develop a 60 mtpa capacity. The development comprises two stages, with Firetail
coming on stream first at 20 mtpa, followed by production from the Kings mine at 40 mtpa.
Mining production from the Firetail mine commenced in 2012 with the train load-out facility
commissioned in late November 2012. Stage 1 of the US$3.2 billion facility was opened in May
2013. The Kings mine is currently under construction and will be officially opened in 2014.
In December 2012, the 129 kilometre Solomon Railway that connects the Solomon Hub to
FMG’s main line and ultimately to the Company’s Herb Elliot Port was commissioned.
Capital investment at the Solomon site has totalled US$3.5 billion to date comprising two OPFs,
three crushing hubs, a 125MW power station and airstrip and three camps housing 3,000
people.
Iron Bridge Project
The Iron Bridge Project holds iron ore projects at North Star and Glacier Valley approximately
100 kilometres south of Port Hedland.
FMG Iron Bridge is jointly owned by FMG (88 percent) and a subsidiary of China’s Shanghai
Baosteel Group Corporation (12 percent). In August 2013, FMG announced that Taiwan’s
largest private company, Formosa Plastics Group would invest US$1.5 billion in the Iron Bridge
Project. Formosa has invested in the construction of the largest steel mill in the world at Ha Tinh,
Vietnam that will process 22 mtpa.
Stage 1 construction is currently underway and expected to take approximately 12 months
and US$527 million to complete, with first production of 1.5mtpa of 66 percent magnetite-
haematite ore commencing in early 2015. The 9.5 mtpa Stage 2 expansion will commence in
2015 at FMG’s option and subject to feasibility study.
AUSTRALIAN VENTURE CONSULTANTS PTY LTD
63
Hope Downs 4, Rio Tinto and Hancock Prospecting (Recently
Commissioned)
The Hope Downs 4 mine is located approximately 200 kilometres east of Tom Price and forms
a component of Rio Tinto’s 333 Expansion plan (see above). The project is a A$1.2 billion joint
venture between Rio Tinto and Hancock Prospecting and is Rio Tinto’s largest greenfield iron
ore site. First ore was shipped from the project in 2013.
Sino Iron Project, CITIC Pacific (Under Construction)
The Sino Iron Project is owned and operated by CITIC Pacific, a Hong Kong listed diversified
company with interests in special steel, iron ore, mining and property development in mainland
China. CITIC Pacific is 58 percent owned by CITIC Group, a large diversified Chinese state-
owned enterprise established in 1979.
The Sino Iron Project is located 100 kilometres south west of Karratha and is the largest
magnetite mining and processing operation in Australia. Production of magnetite
commenced in late 2012 and processing lines 1 and 2 is scheduled to commence in 2014. The
associated port is the first new port site developed in the Pilbara for 40 years.
The project also involves the construction of a 70 megalitre seawater desalination plant and a
450 megawatt combined cycle gas fired power station,
Approximately 4,000 people were employed at peak construction. There will be between 800
and 1,000 permanent roles once the project is fully operational.
Roy Hill, Roy Hill Holdings (Under Construction)
Situated approximately 115 kilometres north of Newman, Roy Hill will be a 55 mtpa mining, rail
and port project. A 334 kilometre railway will be constructed to transport processed ore from
the mine to a dedicated port stockyard facility located to the south of Port Hedland. It will also
involve a purpose built iron ore port facility at Port Hedland with a wharf designed to
accommodate vessels of 206,000 to 320,000 tonnes.
The peak construction workforce is expected to be 3,600, with an operational workforce of
approximately 2,000 staff and contractors.
South Down Magnetite, Grange Resources (FID Delayed)
This project is located 90kms north east of Albany. The proposed $2.9 billion iron ore project
was suspended in mid-2013 as a result of a deteriorating iron ore price.
Extension Hill Magnetite Project, Asia Iron (FID Delayed)
The Extension Hill Magnetite project is located approximately 280 kilometres south east of
Geraldton. The project’s decision-making timetable was initially delayed in June 2012 as a
result of political changes in the City of Chongqing potentially affecting the Chinese
Government approvals to invest in and develop the project. Since then, it has been confirmed
by the Company that the approvals remain valid. The Company is now engaged in discussions
with the China Development Bank with respect to the debt financing component of the
project.
AUSTRALIAN VENTURE CONSULTANTS PTY LTD
64
Jack Hills, Crossland Resources (FID Delayed)
The operator of the Jack Hills Project, Crossland Resources, is well advanced with the feasibility
study for the expanded project. However, its progress is dependent on the development of
the Oakajee Port and Rail Project (see below).
West Pilbara Iron Ore Project, Aquilla Resources (FID Delayed)
The West Pilbara Iron Ore Project is located 30 kilometres West of Pannawonica. A pre-
feasibility study was completed in 2008 and feasibility study in 2010. The project proposes
investment in a 282 kilometre heavy haul railway and a new deep water port at Anketell.
Ammonium Nitrate, Nitrate and Urea Projects
Kwinana Ammonium Nitrate Facility Expansion (under Construction)
This project is located in Kwinana, approximately 35 kilometres south of Perth. The technical
feasibility study for the CSBP ammonium nitrate plant was completed in 2005 and the
Wesfarmers Board formally approved the Ammonium Nitrate Expansion Project in the same
year. The ordering of long lead equipment items such as the Nitric Acid Absorber Column,
Boiler and Man Turbo-Compressor was made in mid-2005. The project was completed in 2010,
increasing production capacity by 260,000 tpa to 780,000 tpa.
Burrup Industrial Estate, Orica and Yara (Recently Commissioned)
This $775 million joint venture will produce 330,000 tpa of ammonium nitrate. The plant is
located adjacent to the existing Yara Pilbara fertiliser plant and Burrup. The project is expected
to be completed by mid-2015 and will employ approximately 400 people during construction
and 60 people once operational.
Shotts Industrial Park Urea Project, Perdaman Chemicals (Under
Construction)
Perdaman Chemicals and Fertilisers (formally North West Chemicals and Fertilisers), which is
part of Perdaman Industries, has plans to develop a US$3.5 billion urea manufacturing plant at
Collie, Western Australia. Using innovative and clean coal gasification technology, the plant
will transform sub-bituminous coal into urea. The plant has a 2 million tonnes per annum
capacity, and most, if not all of the urea produced at the plant will be exported for global use.
Gold Projects
Tropicana, AngloAshanti Gold (Recently Commissioned)
The Tropicana Gold Project is located on the northern end of the Tropicana Joint Venture
tenements, and is centred on the Tropicana and Havana deposits. The Tropicana deposit was
discovered in 2005 after AngloGold Ashanti Australia followed up an unexplained gold in soil
anomaly. The Havana deposit, just to the south of Tropicana, was discovered in 2006.
Construction commenced in the June quarter of 2011 and first gold was poured in the
December quarter of 2013.
AUSTRALIAN VENTURE CONSULTANTS PTY LTD
65
Resources Infrastructure Projects
Oakajee Port and Rail (FID Delayed)
Oakajee Port and Rail (OPR) has been developing a greenfields infrastructure and supply
chain business to transport iron ore from Western Australia’s mid-west to customers across the
globe. The deepwater port, proposed for a site 24 km north of Geraldton, will cater to the
world’s largest ore carriers. The 570km rail network will service operating and emerging mining
projects across the region.
Project planning, evaluation, engineering and regulatory approvals are well advanced,
independent peer reviews, including value engineering assessments, have identified OPR’s
port and rail design as the optimal solution to meet the government’s scoping requirements.
OPR is owned by Mitsubishi Development Pty Ltd, a wholly-owned subsidiary of Mitsubishi
Corporation, one of the largest trading and investment companies in Japan. OPR is
developing the OPR project under a State Agreement with the Western Australian
Government. Development of the project is currently suspended as a result of uncertainty with
respect to the iron ore price.
North West Infrastructure, Atlas Iron, Brockman Mining and FerrAus
(Under Construction)
North West Infrastructure (formerly the North West Iron Ore Alliance) is an incorporated joint
venture company that represents the interests of its three shareholder companies, Atlas Iron,
Brockman Mining and FerrAus.
North West Infrastructure (NWI) is developing a port facility with an iron ore export capacity of
50 mtpa from the South-West Creek location in the Inner Harbour at Port Hedland, Western
Australia. The Western Australian Government has made this 50 mtpa allocation to support the
development plans of emerging iron ore miners in the Pilbara region.
Esperance Multi-user Facility (FID Delayed)
The Esperance Port Authority, trading as Esperance Ports Sea and Land, has commenced a
process to identify a proponent to design, finance, build and operate a Multi User Iron Ore
Facility (MUIOF) at the Port. The facility will cater for the export needs of a number of iron ore
mining companies with tenements in the Yilgarn Region of Western Australia. The MIOUF has
the objective of increasing Esperance Port’s iron ore handling capacity from the current 11.5
million tonnes a year to more than 20 million tonnes a year.
It is anticipated work on the new facility will begin in 2014 and be completed in 2015, subject
to the proponent achieving financial close and project contractual close. The MUIOF is
expected to be in operation by 2015 and will be operated by the proponent.
Midwest Energy Project (Under Construction)
The Mid West Energy Project (MWEP) will provide energy capacity to meet increasing demand
for electricity, and facilitate the connection of power generators and loads to the South West
AUSTRALIAN VENTURE CONSULTANTS PTY LTD
66
Integrated System (SWIS) network, strengthening the reliability and security of the SWIS and
extending its reach north.
It is proposed that the MWEP will be delivered in the following two stages:
o Southern Section
Connects Neerabup (Perth) to Three Springs with a 330kV double circuit
transmission line. This will enable the connection of a number of mining projects
in the Mid West (including Karara Mine) and provides additional support to the
existing 132kV network in the region by establishing a new 330/132 kV Terminal
substation at Three Springs.
o Northern Section
Connection through to Moonyoonooka (Geraldton). Key drivers for the
Northern Section are prospective load growth in the Geraldton area (from
existing customers and new block loads associated with the port and industrial
estate developments at Oakajee and Geraldton Port), potential load growth
from new iron ore mines north east of Geraldton, and new generators seeking
connection (predominately wind). A number of options to meet future
requirements have opened up and Western Power is conducting a detailed
planning assessment in consultation with key stakeholder and the community
to determine the best method and timing to meet future requirements. An
Infrastructure Australia funding submission has been made.
Construction of the 330kv line commenced in March 2013 and is expected to be energized in
the 3rd quarter of 2014.
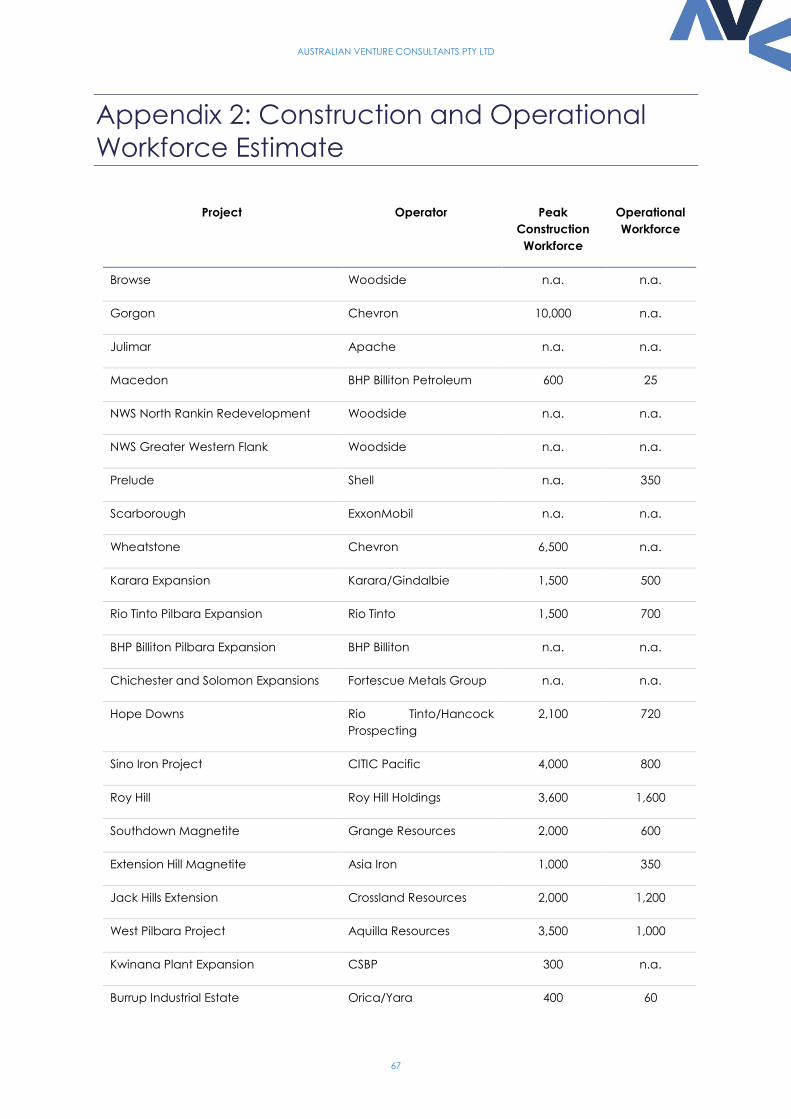
AUSTRALIAN VENTURE CONSULTANTS PTY LTD
67
Appendix 2: Construction and Operational
Workforce Estimate
Project Operator Peak
Construction
Workforce
Operational
Workforce
Browse Woodside n.a. n.a.
Gorgon Chevron 10,000 n.a.
Julimar Apache n.a. n.a.
Macedon BHP Billiton Petroleum 600 25
NWS North Rankin Redevelopment Woodside n.a. n.a.
NWS Greater Western Flank Woodside n.a. n.a.
Prelude Shell n.a. 350
Scarborough ExxonMobil n.a. n.a.
Wheatstone Chevron 6,500 n.a.
Karara Expansion Karara/Gindalbie 1,500 500
Rio Tinto Pilbara Expansion Rio Tinto 1,500 700
BHP Billiton Pilbara Expansion BHP Billiton n.a. n.a.
Chichester and Solomon Expansions Fortescue Metals Group n.a. n.a.
Hope Downs Rio Tinto/Hancock
Prospecting
2,100 720
Sino Iron Project CITIC Pacific 4,000 800
Roy Hill Roy Hill Holdings 3,600 1,600
Southdown Magnetite Grange Resources 2,000 600
Extension Hill Magnetite Asia Iron 1,000 350
Jack Hills Extension Crossland Resources 2,000 1,200
West Pilbara Project Aquilla Resources 3,500 1,000
Kwinana Plant Expansion CSBP 300 n.a.
Burrup Industrial Estate Orica/Yara 400 60
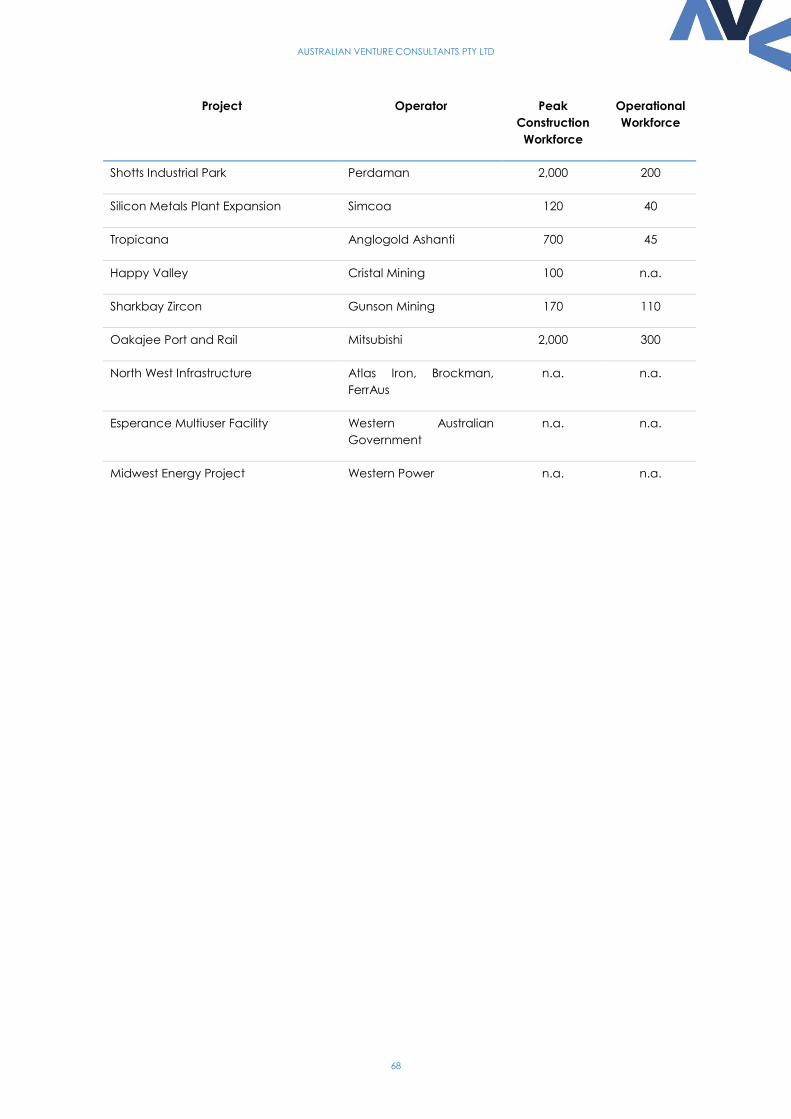
AUSTRALIAN VENTURE CONSULTANTS PTY LTD
68
Project Operator Peak
Construction
Workforce
Operational
Workforce
Shotts Industrial Park Perdaman 2,000 200
Silicon Metals Plant Expansion Simcoa 120 40
Tropicana Anglogold Ashanti 700 45
Happy Valley Cristal Mining 100 n.a.
Sharkbay Zircon Gunson Mining 170 110
Oakajee Port and Rail Mitsubishi 2,000 300
North West Infrastructure Atlas Iron, Brockman,
FerrAus
n.a. n.a.
Esperance Multiuser Facility Western Australian
Government
n.a. n.a.
Midwest Energy Project Western Power n.a. n.a.
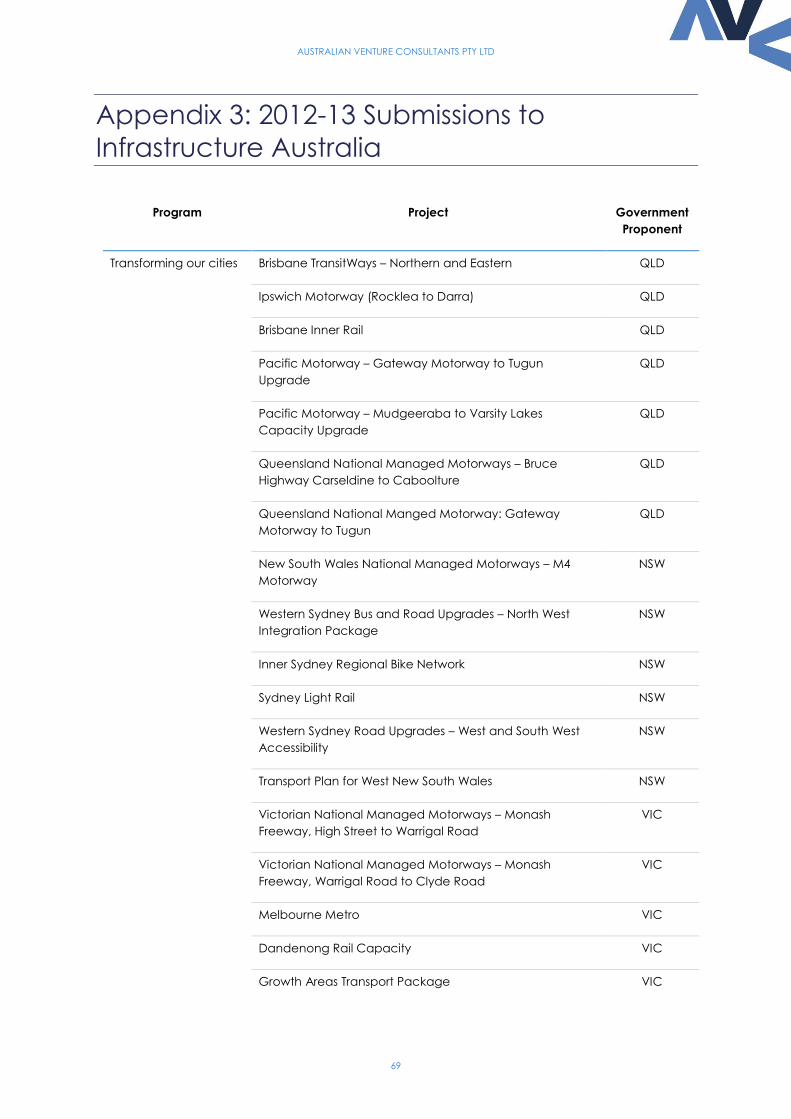
AUSTRALIAN VENTURE CONSULTANTS PTY LTD
69
Appendix 3: 2012-13 Submissions to
Infrastructure Australia
Program Project Government
Proponent
Transforming our cities Brisbane TransitWays – Northern and Eastern QLD
Ipswich Motorway (Rocklea to Darra) QLD
Brisbane Inner Rail QLD
Pacific Motorway – Gateway Motorway to Tugun
Upgrade
QLD
Pacific Motorway – Mudgeeraba to Varsity Lakes
Capacity Upgrade
QLD
Queensland National Managed Motorways – Bruce
Highway Carseldine to Caboolture
QLD
Queensland National Manged Motorway: Gateway
Motorway to Tugun
QLD
New South Wales National Managed Motorways – M4
Motorway
NSW
Western Sydney Bus and Road Upgrades – North West
Integration Package
NSW
Inner Sydney Regional Bike Network NSW
Sydney Light Rail NSW
Western Sydney Road Upgrades – West and South West
Accessibility
NSW
Transport Plan for West New South Wales NSW
Victorian National Managed Motorways – Monash
Freeway, High Street to Warrigal Road
VIC
Victorian National Managed Motorways – Monash
Freeway, Warrigal Road to Clyde Road
VIC
Melbourne Metro VIC
Dandenong Rail Capacity VIC
Growth Areas Transport Package VIC
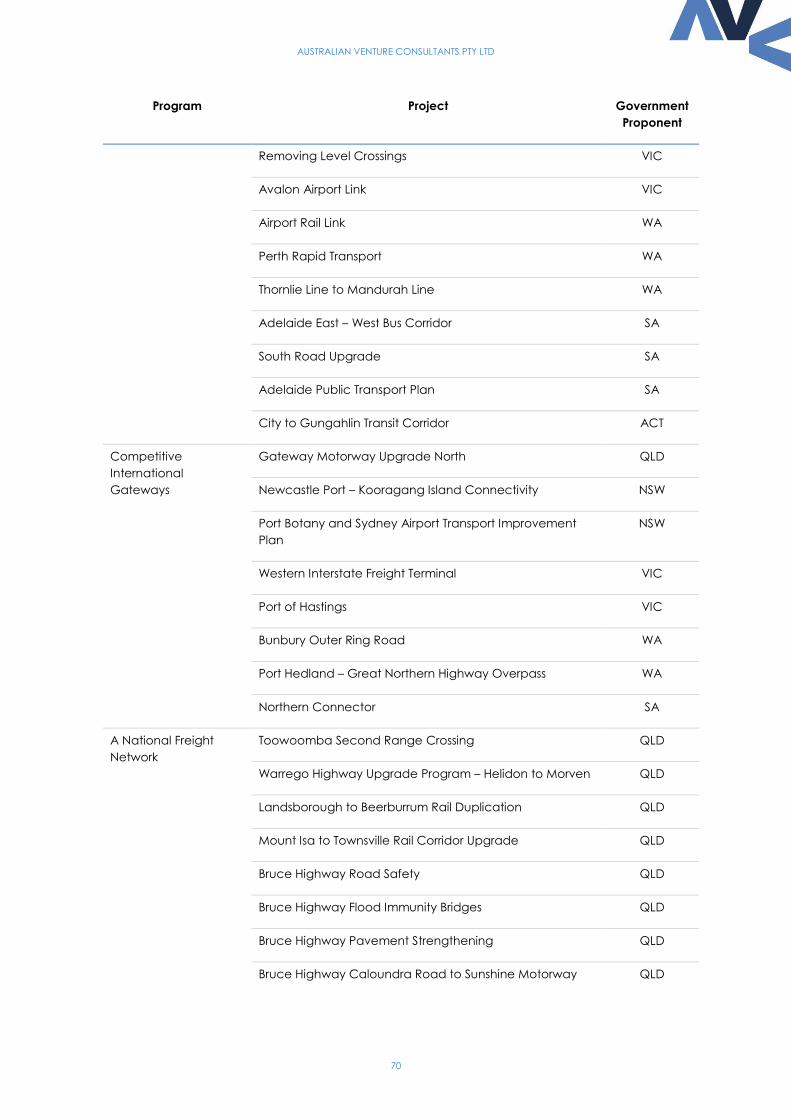
AUSTRALIAN VENTURE CONSULTANTS PTY LTD
70
Program Project Government
Proponent
Removing Level Crossings VIC
Avalon Airport Link VIC
Airport Rail Link WA
Perth Rapid Transport WA
Thornlie Line to Mandurah Line WA
Adelaide East – West Bus Corridor SA
South Road Upgrade SA
Adelaide Public Transport Plan SA
City to Gungahlin Transit Corridor ACT
Competitive
International
Gateways
Gateway Motorway Upgrade North QLD
Newcastle Port – Kooragang Island Connectivity NSW
Port Botany and Sydney Airport Transport Improvement
Plan
NSW
Western Interstate Freight Terminal VIC
Port of Hastings VIC
Bunbury Outer Ring Road WA
Port Hedland – Great Northern Highway Overpass WA
Northern Connector SA
A National Freight
Network
Toowoomba Second Range Crossing QLD
Warrego Highway Upgrade Program – Helidon to Morven QLD
Landsborough to Beerburrum Rail Duplication QLD
Mount Isa to Townsville Rail Corridor Upgrade QLD
Bruce Highway Road Safety QLD
Bruce Highway Flood Immunity Bridges QLD
Bruce Highway Pavement Strengthening QLD
Bruce Highway Caloundra Road to Sunshine Motorway QLD
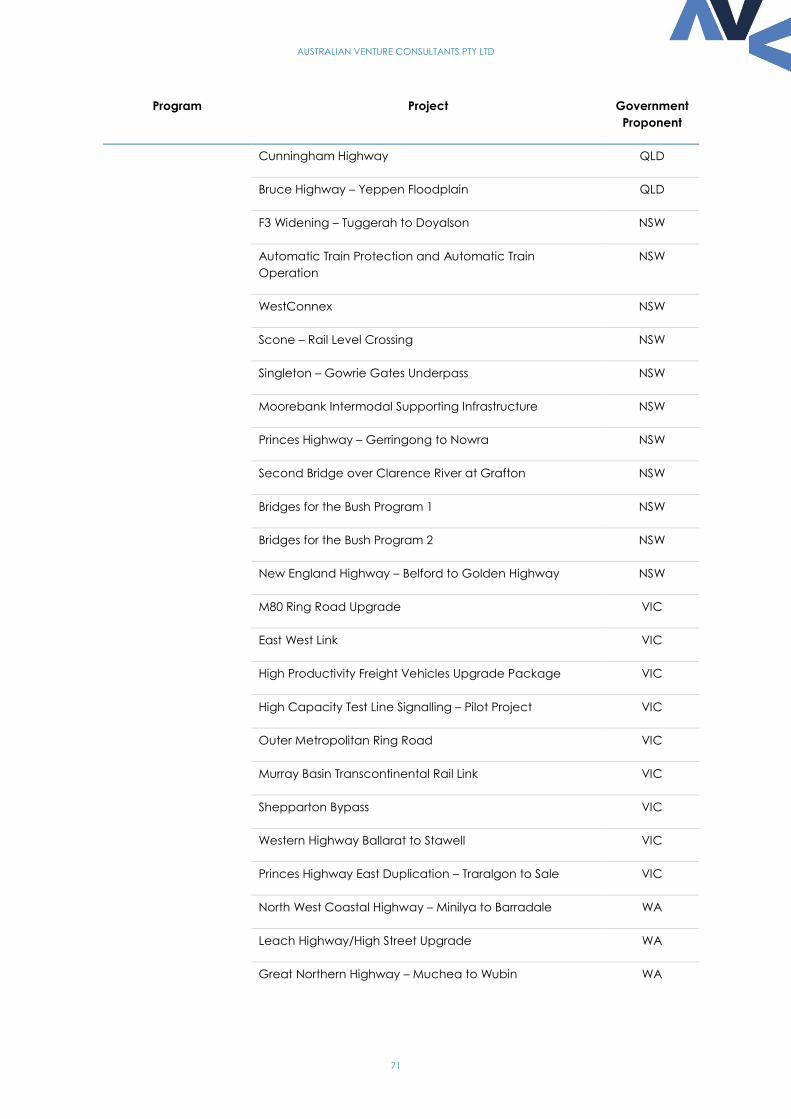
AUSTRALIAN VENTURE CONSULTANTS PTY LTD
71
Program Project Government
Proponent
Cunningham Highway QLD
Bruce Highway – Yeppen Floodplain QLD
F3 Widening – Tuggerah to Doyalson NSW
Automatic Train Protection and Automatic Train
Operation
NSW
WestConnex NSW
Scone – Rail Level Crossing NSW
Singleton – Gowrie Gates Underpass NSW
Moorebank Intermodal Supporting Infrastructure NSW
Princes Highway – Gerringong to Nowra NSW
Second Bridge over Clarence River at Grafton NSW
Bridges for the Bush Program 1 NSW
Bridges for the Bush Program 2 NSW
New England Highway – Belford to Golden Highway NSW
M80 Ring Road Upgrade VIC
East West Link VIC
High Productivity Freight Vehicles Upgrade Package VIC
High Capacity Test Line Signalling – Pilot Project VIC
Outer Metropolitan Ring Road VIC
Murray Basin Transcontinental Rail Link VIC
Shepparton Bypass VIC
Western Highway Ballarat to Stawell VIC
Princes Highway East Duplication – Traralgon to Sale VIC
North West Coastal Highway – Minilya to Barradale WA
Leach Highway/High Street Upgrade WA
Great Northern Highway – Muchea to Wubin WA
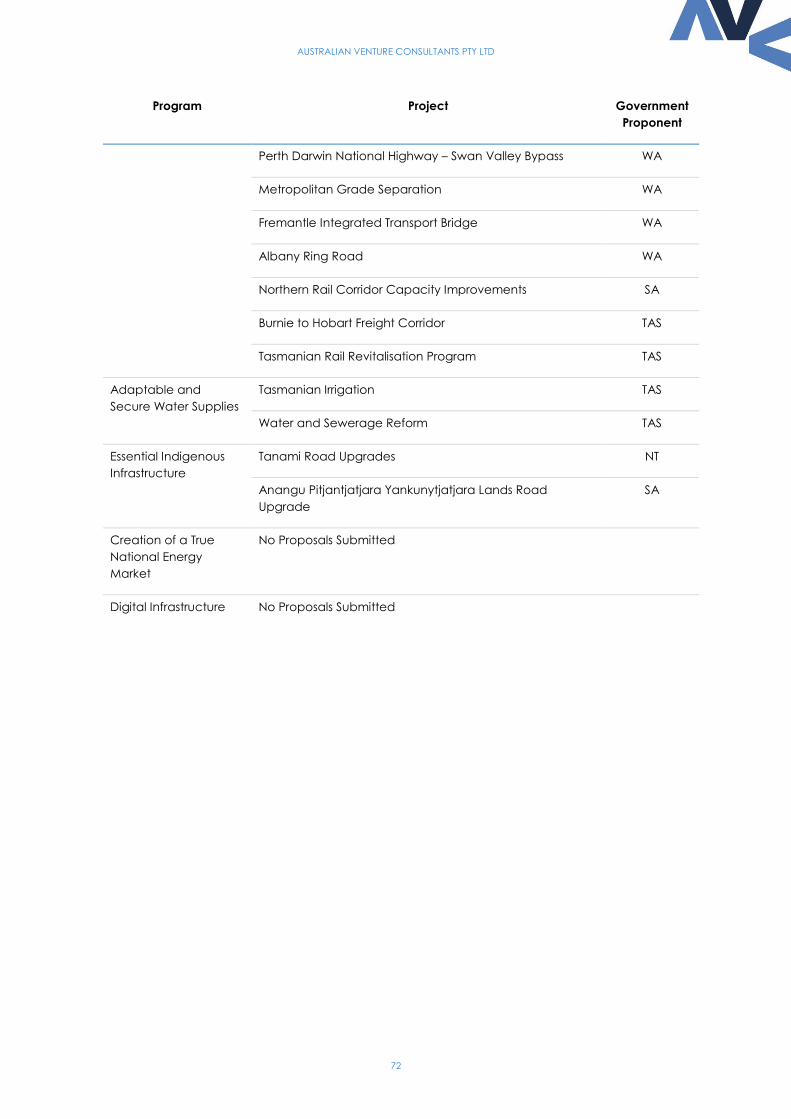
AUSTRALIAN VENTURE CONSULTANTS PTY LTD
72
Program Project Government
Proponent
Perth Darwin National Highway – Swan Valley Bypass WA
Metropolitan Grade Separation WA
Fremantle Integrated Transport Bridge WA
Albany Ring Road WA
Northern Rail Corridor Capacity Improvements SA
Burnie to Hobart Freight Corridor TAS
Tasmanian Rail Revitalisation Program TAS
Adaptable and
Secure Water Supplies
Tasmanian Irrigation TAS
Water and Sewerage Reform TAS
Essential Indigenous
Infrastructure
Tanami Road Upgrades NT
Anangu Pitjantjatjara Yankunytjatjara Lands Road
Upgrade
SA
Creation of a True
National Energy
Market
No Proposals Submitted
Digital Infrastructure No Proposals Submitted