Embed Size (px)
Citation preview
Westermost Rough Offshore Wind Farm Shellfish Survey 2017
A STUDY COMMISSIONED BY THE HOLDERNESS F ISHING INDUSTRY GROUP
Mike Roach and Mike Cohen

1 | P a g e
Contents Introduction ................................................................................................................ 3
Background to the study ......................................................................................... 3
Review of recent literature ...................................................................................... 4
Methodology ............................................................................................................... 6
Site Description....................................................................................................... 6
Sampling regime ..................................................................................................... 6
Data analysis .......................................................................................................... 9
Catch data ........................................................................................................... 9
Size distribution ................................................................................................. 10
Results ..................................................................................................................... 13
2017 Comparison between treatments ................................................................. 13
Catch per Unit of Effort and Landings per Unit of Effort .................................... 13
Size distribution ................................................................................................. 16
Sex Ratio and Ovigerous Status ........................................................................... 19
Fish Analysis ........................................................................................................ 20
Comparison between years .................................................................................. 22
Catch per Unit of Effort and Landings per Unit of Effort .................................... 22
Size Distribution ................................................................................................ 30
Discussion ................................................................................................................ 35

2 | P a g e
2017 Comparison between treatments ................................................................. 35
Catch per unit of effort and landings per unit of effort ....................................... 35
Size distribution ................................................................................................. 36
Sex ratio and ovigerous status .......................................................................... 38
Presence of fish species ................................................................................... 39
Comparison between 2017 and baseline .............................................................. 39
Catch per unit of effort and landings per unit of effort ....................................... 39
Size distribution ................................................................................................. 41
Conclusion ............................................................................................................... 42
References ............................................................................................................... 44
Annex 1 - Bycatch .................................................................................................... 48
Annex 2 – Supporting Statistics ............................................................................... 50
3 | P a g e
Introduction
Background to the study
The Holderness Fishing Industry Group (HFIG) conducted a survey in 2017
investigating the short-term effects of the construction of the Westermost Rough
offshore windfarm on the commercially important crustacean stocks in the area. This
survey supports the research undertaken by HFIG in 2013 (baseline survey (Roach &
Cohen, 2013)) and 2015 (first year post build of the wind farm (Roach & Cohen, 2015)),
forming part of the continuing study of the effects of wind farm construction on
commercial shellfish stocks. The survey in 2017 was supported via a donation from
West of Morecambe Fisheries Limited (www.westofmorecambe.com) to support the
ongoing scientific programme of HFIG.
HFIG researchers were concerned that the results reported in Roach & Cohen (2015)
did not reflect the true impacts of the wind farm construction. This was primarily
because of the Westermost Rough site being closed to fishing during the construction
phase and subsequently being reopened during the 2015 survey period. The quasi-no
take zone skewed the results reported during this survey, causing analysis to be
separated into before and after the site being reopened to fishing (Roach & Cohen,
2015). This closure followed by a reopening of the site meant that the true reflection
of the effects of the construction were difficult to ascertain. It did however raise the
question of what are the effects of reopening a site to fishing exploitation that has been
previously closed (Roach et al., under review). There was also an increase in
abundance of Atlantic Cod (Gadus morhua) caught in the shellfish pots reported
between the baseline in 2013 and 2015 (increase of 642%). This was of concern as
Atlantic Cod have been associated with predation on juvenile lobsters and their food
4 | P a g e
sources. It was a point of concern that the WMR wind farm was acting as a fish
aggregating device. This could potentially affect the food web around the wind farm.
Due to these concerns, the survey (third year post build) of the WMR wind farm was
commissioned by HFIG to further investigate its effects on commercial shellfish stocks.
The survey was timed for any no take zone effects to be negated by the fact that the
site has been subjected to fishing pressure since 13th August 2015. This allowed the
survey to study the effects of the wind farm whilst fishing pressure was stable, without
the intense pressure reported in the 2015 report immediately following the opening of
the site.
Review of recent literature
A comprehensive literature review was conducted for the 2013 and 2015 reports
(Roach & Cohen, 2013, 2015) looking at potential effects and impacts of offshore wind
farms on the marine environment. Below is a short review of the literature published
in the interim period.
As offshore renewable energy expands there is a driver to understand the short and
long-term effects of offshore wind energy installations on ecosystem services.
Modelling of offshore wind ecosystems has been demonstrated to show a positive
response of upper trophic level species to the installation of offshore wind farms.
(Raoux et al., 2017). Lower trophic level species such as infauna can also benefit from
the absence disturbance due to mobile fishing gear. Exclusion of mobile fishing gear
such as trawling due to the physical impracticalities of trawling thorough an offshore
wind farm has demonstrated to improve macrofaunal diversity (Coates et al., 2016).
However, there is focus on the co-location of fisheries (Hooper & Austen, 2014) and
aquaculture (Griffin et al., 2015) with offshore energy installations. This is
5 | P a g e
predominantly static fisheries such as netting and potting fisheries. However,
Stelzenmüller et al., (2016) theorised that there would be an 50% loss to a fishers’
earnings from netting due to offshore wind farms if the areas are excluded to fishing.
This was not observed when the potting fishery was assessed in the same survey.
Potential habitat enhancement is thought to be one of the positive effects of offshore
installations and is the focus of recent literature. Both by introducing new hard
substrate in areas not previously characterised by such. Cancer pagurus abundance
has been demonstrated to be positively influenced by offshore wind installations and
the installations providing habitat for a projected 27% of the population production
(Krone et al., 2017). New settling surfaces for sessile species can increase diversity
by providing surfaces for lower trophic level species to colonise (De Mesel et al., 2015).
The individual turbines and installations can to act as aggregating devices for fish
species. Individual turbines have been demonstrated to provide new and additional
habitat for fish species. van Hal et al., (2017) observed increase abundance of fish
species around individual turbine structures, using them for shelter and feeding.
There are current studies being undertaken in the United States investigating the
impact of EMF generated by sub-sea power cables on marine organisms (full reports
not yet published). These are currently investigating HVDC cables as opposed to
HVAC cables that exist for the WMR wind farm (Love et al., 2016). There are also in-
situ studies investigating the effects of EMF from sub-sea cables acting as a barrier to
migration for commercially important crab species. Early indications are that crab
species will cross a live unburied HVDC cable in order to access bait therefore the
cables should not act as a barrier to migration (Bureau of Ocean Energy Mangaement,
2016).
6 | P a g e
Methodology
Site Description
This study mirrored that of the 2013 and 2015 Westermost Rough surveys. The study
site was the Westermost Rough (WMR) offshore wind farm. The WMR wind farm is
located east of Tunstall on the north-east coast of the UK. The central point of the wind
farm is located at 53º 48.37’N, 000º 09.02’E. The closest point to shore is 7.7 km and
the furthest point is 13.3 km offshore. The WMR wind farm covers an area of
approximately 35 km2. It consists of 35, 6 MW turbines and associated substation. The
substrate is predominantly rock and cobble and the depth ranges from 15 -23 metres.
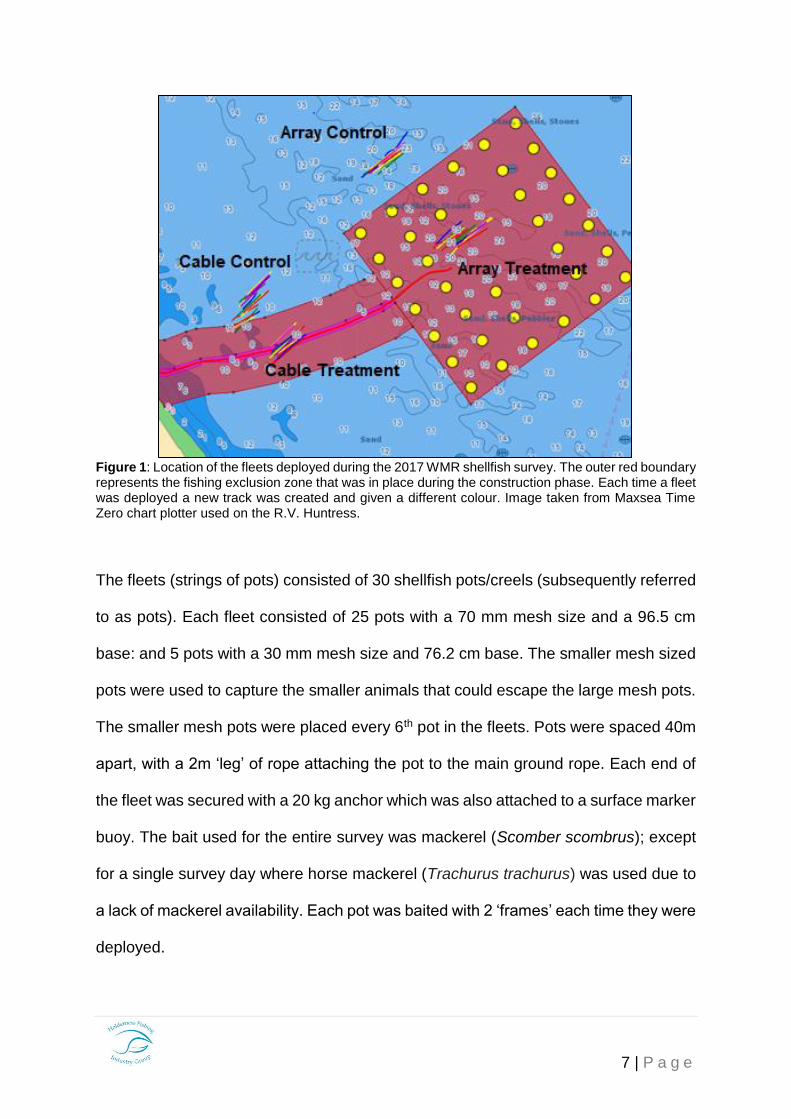
Sampling regime
The sampling equipment deployed was intended to closely reflect the fishing gear
used in in the local fishery. Four fleets (strings of pots) were deployed at the four
sample sites selected for the baseline survey in 2013 (See Roach & Cohen, 2013).
There was a treatment fleet placed within the turbine array and another over the export
cable, there were a further two fleets located approximately 1 km to the north of these
sites to act as controls (Figure 1). The control sites were selected due to being north
of the wind farm (prevailing current drifts north/south) and being on similar substrate
and depth as the treatment fleets.
7 | P a g e
Figure 1: Location of the fleets deployed during the 2017 WMR shellfish survey. The outer red boundary represents the fishing exclusion zone that was in place during the construction phase. Each time a fleet was deployed a new track was created and given a different colour. Image taken from Maxsea Time Zero chart plotter used on the R.V. Huntress.
The fleets (strings of pots) consisted of 30 shellfish pots/creels (subsequently referred
to as pots). Each fleet consisted of 25 pots with a 70 mm mesh size and a 96.5 cm
base: and 5 pots with a 30 mm mesh size and 76.2 cm base. The smaller mesh sized
pots were used to capture the smaller animals that could escape the large mesh pots.
The smaller mesh pots were placed every 6th pot in the fleets. Pots were spaced 40m
apart, with a 2m ‘leg’ of rope attaching the pot to the main ground rope. Each end of
the fleet was secured with a 20 kg anchor which was also attached to a surface marker
buoy. The bait used for the entire survey was mackerel (Scomber scombrus); except
for a single survey day where horse mackerel (Trachurus trachurus) was used due to
a lack of mackerel availability. Each pot was baited with 2 ‘frames’ each time they were
deployed.
8 | P a g e
Catch data was recorded of all commercial species and bycatch as each pot was
hauled onto the vessel. The commercial catch was separated into their respective
species and sexes and what type of pot they were caught in. Size (carapace length
(CL) of lobsters and carapace width (CW) of crab species), condition (Table 1) and
ovigerous status of females were recorded for every individual. Lobster egg stage (if
ovigerous) and whether the tail fan had been V notched was also recorded. Fish
bycatch size was recorded as total length and invertebrate species bycatch
abundance was recorded (Annex 1).
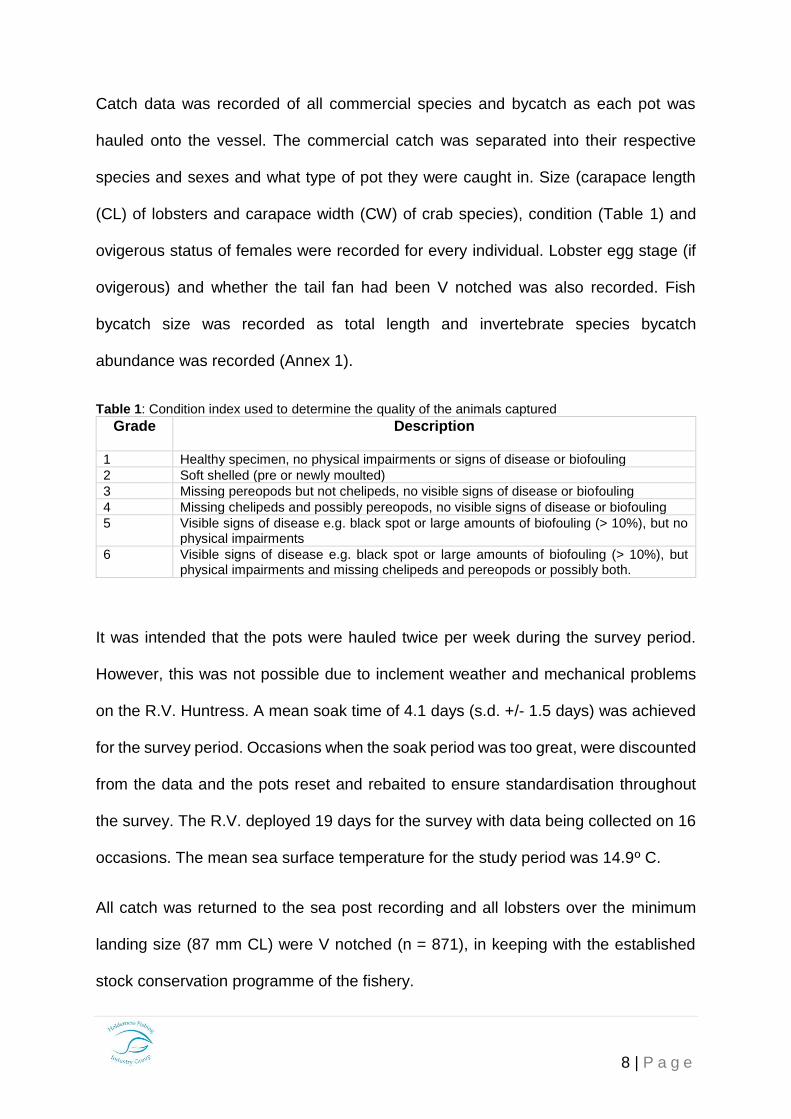
Table 1: Condition index used to determine the quality of the animals captured
Grade Description
1 Healthy specimen, no physical impairments or signs of disease or biofouling
2 Soft shelled (pre or newly moulted)
3 Missing pereopods but not chelipeds, no visible signs of disease or biofouling
4 Missing chelipeds and possibly pereopods, no visible signs of disease or biofouling
5 Visible signs of disease e.g. black spot or large amounts of biofouling (> 10%), but no physical impairments
6 Visible signs of disease e.g. black spot or large amounts of biofouling (> 10%), but physical impairments and missing chelipeds and pereopods or possibly both.
It was intended that the pots were hauled twice per week during the survey period.
However, this was not possible due to inclement weather and mechanical problems
on the R.V. Huntress. A mean soak time of 4.1 days (s.d. +/- 1.5 days) was achieved
for the survey period. Occasions when the soak period was too great, were discounted
from the data and the pots reset and rebaited to ensure standardisation throughout
the survey. The R.V. deployed 19 days for the survey with data being collected on 16
occasions. The mean sea surface temperature for the study period was 14.9º C.
All catch was returned to the sea post recording and all lobsters over the minimum
landing size (87 mm CL) were V notched (n = 871), in keeping with the established
stock conservation programme of the fishery.
9 | P a g e
On all survey days, to ensure scientific robustness and safe working practices, an
independent observer was present on board the R.V. Huntress. This observer was
provided by West od Morecambe Fisheries Limited.
Data analysis
Changes were made to the data analysis of this report in comparison to the previous
reports (Roach & Cohen 2013 & 2015). Catch per unit of effort (CPUE) has been
reclassified as the mean number of individual caught per sample fleet as opposed to
the mean number of individuals sampled per sample pot. This change was adopted to
reflect the common practice of calculating CPUE that is reported widely in the
literature. Therefore, the separate analysis of the median abundance of individuals per
site was not required. The condition index (Table 1) was used to assess whether an
individual was of a quality that could be landed to market. These criteria (alongside
size data) was used to calculate landings per unit of effort (LPUE), i.e. the mean
number of individuals per fleet that were above the minimum landing size (MLS) and
of a quality to land to market. Separate analysis of the condition of individuals between
sites was not required as this was considered when calculating LPUE.
Catch data
2017
The CPUE of lobsters conformed to a normal distribution (Shapiro Wilkes, p > 0.05)
and was equally variable (Levene’s Test, p > 0.05). The CPUE and LPUE of edible
crabs and velvet crabs (and LPUE of lobsters) did not conform to a normal distribution
(Shapiro Wilkes, p < 0.05), however were equally variable (Levene’s Test, p > 0.05).
Due to the violation of ANOVA assumptions both a one-way ANOVA and a Kruskall
Wallis test was applied to test whether the mean CPUE and mean LPUE differed
10 | P a g e
significantly between the turbine array and export cable treatment and control sites.
Standardised residuals of ANOVA analysis were checked for normality to ascertain if
ANOVA was the correct analysis applied. Therefore, one-way ANOVA analysis was
applied to the CPUE/LPUE data of lobsters and edible crabs. Velvet crab CPUE/LPUE
were analysed using Kruskall Wallis analysis.
2013/2017
Analysis of the catch data between years involved between site analysis and between
year analysis (2013, 2015 & 2017). Due to there being three survey years a repeated
measures test was applied. A two-way repeated measures ANOVA was applied to the
CPUE/LPUE data to test the null hypotheses the mean CPUE/LPUE did not differ
significantly between sites or years and there was no significant interaction between
site and year. Due to violation of the assumption of normality for ANOVA previously
discussed, the standardised residuals of all ANOVA analysis were checked for
conformity to normality. In all cases the standardised residuals conformed to a normal
distribution (Shapiro Wilkes, p > 0.05), therefore the two-way repeated measures
ANOVA analysis was applied.
Size distribution
To analyse the size distribution of the commercial catch sampled, a none-parametric,
two-sample Kolmogorov Smirnov test was applied. Testing the hypotheses that there
was no significant difference in the size distribution of commercial catch sampled at
the treatment and control sites for both the turbine array and export cable. This test
was also applied to analyse the within site variation of the size distribution, of
commercial catch between the 2017 and the baseline year (2013). Empirical
cumulative distribution function (ECDF) plots were generated from the size data. This
11 | P a g e
demonstrated the proportion of commercial catch between the control and treatment
sites for the turbine array and export cable that were less than each observed length
(Thomas et al., 2015). This was also applied to the within site size distribution between
the 2017 and baseline (2013) surveys. The size data for each of the species/sites did
not conform to a normal distribution and there was large variation in the number of
individual sampled on a daily/site basis. To support the Kolmogorov Smirnov analysis,
a Generalised Linear Mixed Models (GLMM) can be used when the data are not
normally distributed and when there is the potential for pseudo-replication (repeated
sampling go the same site) (Zuur & Ieno, 2016). This was applied to the size data of
each of the commercial species sampled, generating a model to assess the difference
in the proportion of individuals at each size between the control and treatment sites of
the turbine array and export cable. A binomial GLMM was applied where Site
(control/treatment) was the response variable, Size of individual (CL/CW) was the
fixed effect and Haul (survey day) was the crossed random intercept. Sex, Berried
status and Grade were initially included in the model, however berried was removed
due to the factor only applying to female lobsters. Sex and grade were deemed as not
significant (p > 0.05) factors within the model. Therefore, the simplest model was the
best description of the size distribution between the two sites;
Ln (Site ~ Size + Haul)
GLMM was applied using the lme4 package in R statistical software (Bates et al.,
2015). This follows a similar method described by (Holst & Revill, 2009), analysing
differences in catch composition of different trawl types. Each model was validated by
checking the standardised residuals conformed to normality (Shapiro Wilkes, p > 0.05)
and comparison to the two-sample Kolmogorov Smirnov tests and ECDF plots. Plots

12 | P a g e
were also generated from the models to allow inference as to where in the distribution
the differences in proportion at size lay.
The GLMM analysis was only applied to the 2017 size data. It was not applied to the
between years size data due to the model requiring the same number of Hauls (survey
days). The survey days in 2017 (n = 16) and 2013 (n = 24) made GLMM analysis of
size distribution between years unsuitable.
13 | P a g e
Results
2017 Comparison between treatments
Sampling was conducted between the 22nd June and 26th September 2017 (sample
days at sea, n = 16). A total of 16142 animals were sampled (lobsters (n = 4959);
edible crabs (n = 5235) and velvet swimming crabs (n = 5948)). The presence of non-
commercial target species was also recorded (Annex 1).
Catch per Unit of Effort and Landings per Unit of Effort
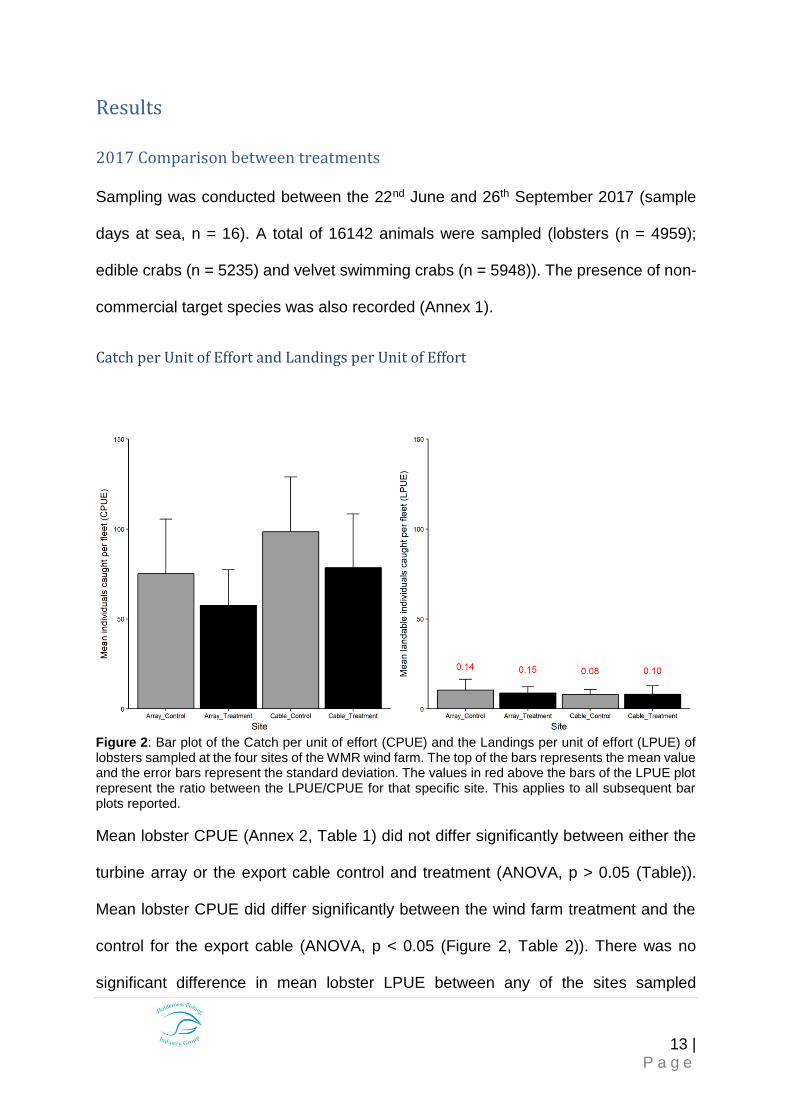
Figure 2: Bar plot of the Catch per unit of effort (CPUE) and the Landings per unit of effort (LPUE) of lobsters sampled at the four sites of the WMR wind farm. The top of the bars represents the mean value and the error bars represent the standard deviation. The values in red above the bars of the LPUE plot represent the ratio between the LPUE/CPUE for that specific site. This applies to all subsequent bar plots reported.
Mean lobster CPUE (Annex 2, Table 1) did not differ significantly between either the
turbine array or the export cable control and treatment (ANOVA, p > 0.05 (Table)).
Mean lobster CPUE did differ significantly between the wind farm treatment and the
control for the export cable (ANOVA, p < 0.05 (Figure 2, Table 2)). There was no
significant difference in mean lobster LPUE between any of the sites sampled
14 | P a g e
(ANOVA, p > 0.05 (Table 2)). The highest ratio of LPUE to CPUE was at the wind farm
control and treatment sites, indicating a greater return of catch per effort at the offshore
sites.
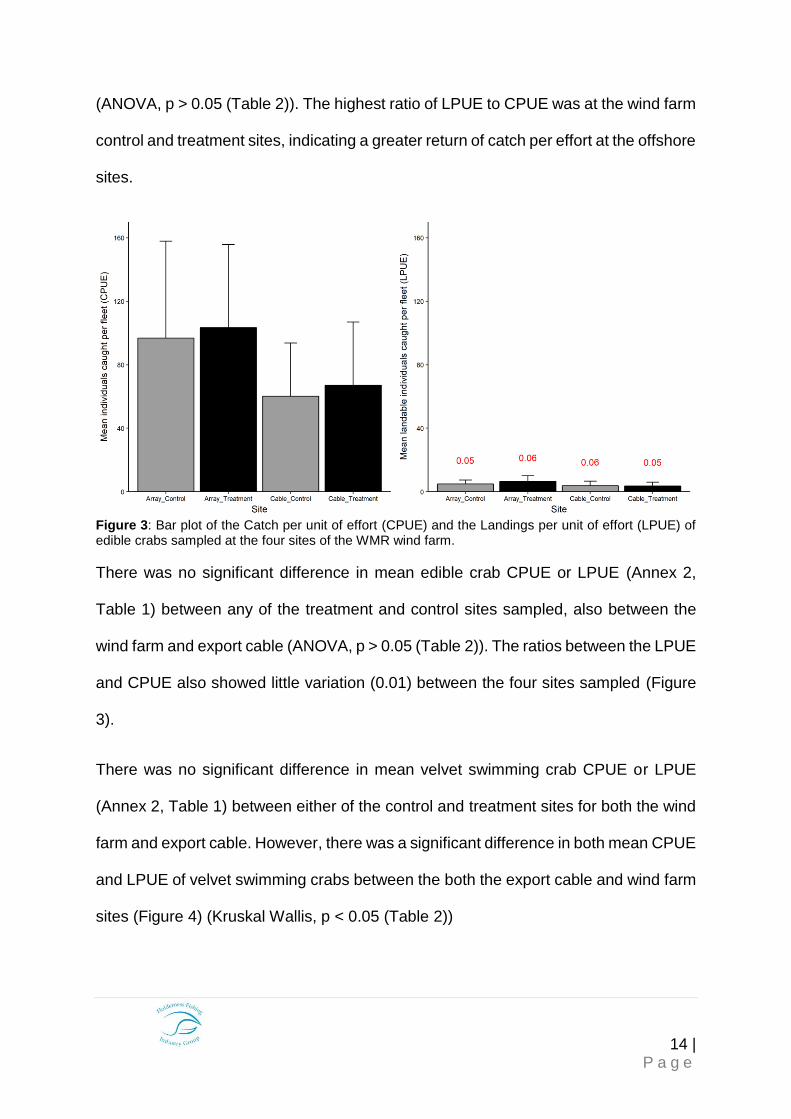
Figure 3: Bar plot of the Catch per unit of effort (CPUE) and the Landings per unit of effort (LPUE) of edible crabs sampled at the four sites of the WMR wind farm.
There was no significant difference in mean edible crab CPUE or LPUE (Annex 2,
Table 1) between any of the treatment and control sites sampled, also between the
wind farm and export cable (ANOVA, p > 0.05 (Table 2)). The ratios between the LPUE
and CPUE also showed little variation (0.01) between the four sites sampled (Figure
3).
There was no significant difference in mean velvet swimming crab CPUE or LPUE
(Annex 2, Table 1) between either of the control and treatment sites for both the wind
farm and export cable. However, there was a significant difference in both mean CPUE
and LPUE of velvet swimming crabs between the both the export cable and wind farm
sites (Figure 4) (Kruskal Wallis, p < 0.05 (Table 2))
15 | P a g e
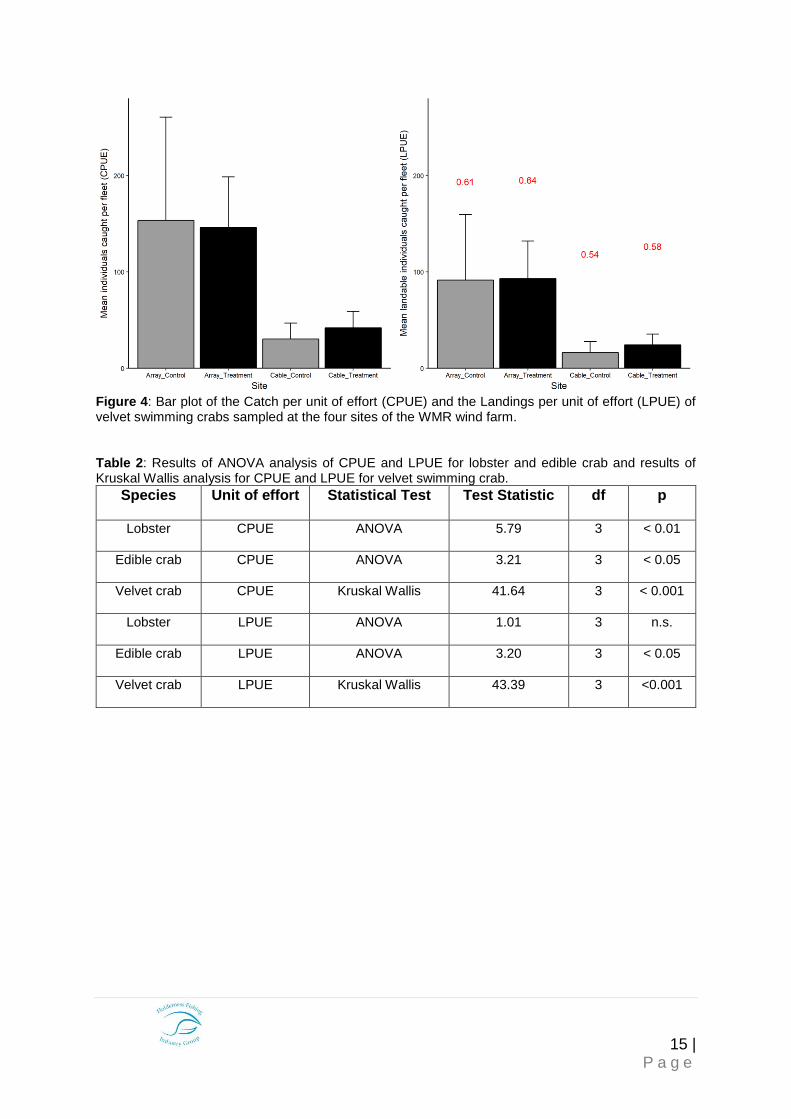
Figure 4: Bar plot of the Catch per unit of effort (CPUE) and the Landings per unit of effort (LPUE) of velvet swimming crabs sampled at the four sites of the WMR wind farm. Table 2: Results of ANOVA analysis of CPUE and LPUE for lobster and edible crab and results of Kruskal Wallis analysis for CPUE and LPUE for velvet swimming crab.
Species Unit of effort Statistical Test Test Statistic df p
Lobster CPUE ANOVA 5.79 3 < 0.01
Edible crab CPUE ANOVA 3.21 3 < 0.05
Velvet crab CPUE Kruskal Wallis 41.64 3 < 0.001
Lobster LPUE ANOVA 1.01 3 n.s.
Edible crab LPUE ANOVA 3.20 3 < 0.05
Velvet crab LPUE Kruskal Wallis 43.39 3 <0.001
16 | P a g e
Size distribution
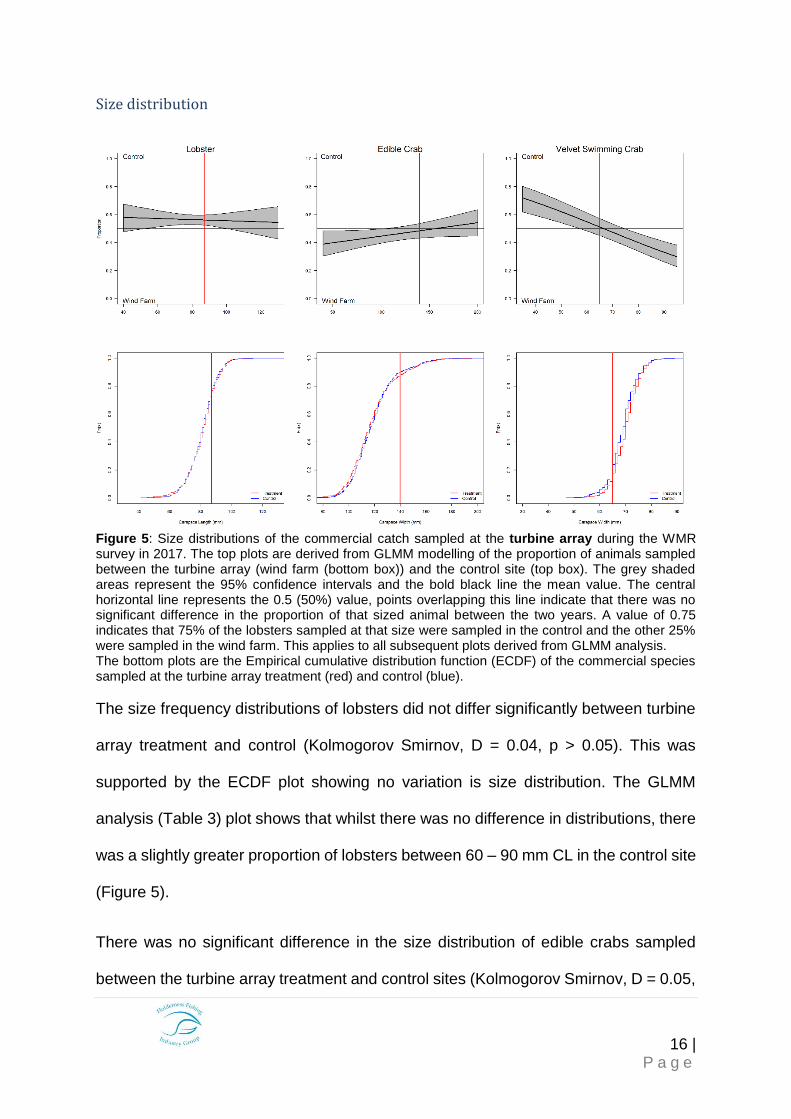
Figure 5: Size distributions of the commercial catch sampled at the turbine array during the WMR survey in 2017. The top plots are derived from GLMM modelling of the proportion of animals sampled between the turbine array (wind farm (bottom box)) and the control site (top box). The grey shaded areas represent the 95% confidence intervals and the bold black line the mean value. The central horizontal line represents the 0.5 (50%) value, points overlapping this line indicate that there was no significant difference in the proportion of that sized animal between the two years. A value of 0.75 indicates that 75% of the lobsters sampled at that size were sampled in the control and the other 25% were sampled in the wind farm. This applies to all subsequent plots derived from GLMM analysis. The bottom plots are the Empirical cumulative distribution function (ECDF) of the commercial species sampled at the turbine array treatment (red) and control (blue).
The size frequency distributions of lobsters did not differ significantly between turbine
array treatment and control (Kolmogorov Smirnov, D = 0.04, p > 0.05). This was
supported by the ECDF plot showing no variation is size distribution. The GLMM
analysis (Table 3) plot shows that whilst there was no difference in distributions, there
was a slightly greater proportion of lobsters between 60 – 90 mm CL in the control site
(Figure 5).
There was no significant difference in the size distribution of edible crabs sampled
between the turbine array treatment and control sites (Kolmogorov Smirnov, D = 0.05,
17 | P a g e
p > 0.05). The GLMM analysis (Table 3) and ECDF plots support the result of the
analysis demonstrating little variation in proportion or empirical distribution between
the two sites (Figure 5).
Velvet crab size distribution differed significantly between the turbine array treatment
and control sites (Kolmogorov Smirnov, D = 0.09, p < 0.001). The plot derived from
GLMM analysis (Table 3) shows that below the MLS of 60 mm CW there was a greater
proportion of velvet crabs in the control site. Whereas greater than 75 mm CW there
was a greater proportion of velvet crabs in the treatment site. The ECDF plot, shows
that the empirical distribution of the velvet crabs had a greater distribution in the
treatment site ranging from 55 – 80 mm CW (Figure 5).
Figure 6: Size distributions of the commercial catch sampled at the export cable during the WMR survey in 2017. The top plots are derived from GLMM modelling of the proportion of animals sampled between the export cable (bottom box) and the control site (top box). The bottom plots are the Empirical cumulative distribution function (ECDF) of the commercial species sampled at the export cable treatment (red) and control (blue).
18 | P a g e
There was a significant difference in the size distribution of lobsters sampled between
the export cable treatment and control sites (Kolmogorov Smirnov, D = 0.05, p < 0.05).
The GLMM analysis (Table 3) demonstrated that there was a greater proportion of
lobsters < 80 mm CL at the control site and no difference in lobsters > 80 mm CL
between the two sites. However, the ECDF plot (Figure 6) shows that the empirical
distribution is slightly greater in the treatment site from 60 – 87 mm CL than the control
site.
The size distribution of edible crabs did not differ significantly between the export cable
treatment and control sites (Kolmogorov Smirnov, D = 0.05, p > 0.05). The GLMM
(Table 3) and ECDF plots support the result of the analysis demonstrating little
variation in proportion or empirical distribution between the two sites (Figure 6).
There was no significant difference in the size distribution of velvet crabs between the
export cable treatment and control sites (Kolmogorov Smirnov, D = 0.07, p > 0.05).
The results of GLMM analysis (Table 3, Figure 6) demonstrate that greater than the
MLS of 65 mm CW there was a greater proportion of velvet crabs recorded in the
export cable treatment site than the control site. This is supported by the ECDF plot
(Figure 6), demonstrating a greater empirical distribution in the export cable treatment
site than the control site.
19 | P a g e
Table 3: GLMM parameters for the comparison between the control and treatment sites of both the turbine array and the export cable.
Species Treatment Response Intercept
Variance Parameter Estimate
Standard
Error
Lobster Turbine
Array
Control and
Treatment 0.04
β0
β1
0.38
- 0.001
0.39
0.005
Lobster Export
Cable
Control and
Treatment 0.12
β0
β1
1.31
-0.013
0.39
0.005
Edible
Crab
Turbine
Array
Control and
Treatment 0.12
β0
β1
-0.61
0.004
0.27
0.002
Edible
Crab
Export
Cable
Control and
Treatment 0.22
β0
β1
0.66
-0.006
0.39
0.003
Velvet
Crab
Turbine
Array
Control and
Treatment 0.21
β0
β1
1.99
-0.030
0.41
0.006
Velvet
Crab
Export
Cable
Control and
Treatment 0.38
β0
β1
0.79
-0.017
0.68
0.009
Sex Ratio and Ovigerous Status
Table 4: Sex Ratio of all commercial species sampled across all sites.
Site
Lobster Edible Crab Velvet Crab Male (n)
Female (n)
Ratio Male (n)
Female (n)
Ratio Male (n)
Female (n)
Ratio
Array Treatment
461 461 1 : 1 1042 612 1.7 : 1 1154 1183 1 : 1
Array Control
592 612 1 : 1 1005 543 1.8 : 1 1066 1390 1 : 1.3
Cable Treatment
649 607 1.1 : 1 845 226 3.7 : 1 411 260 1.5 : 1
Cable Control
796 781 1 : 1 713 249 2.8 : 1 347 137 2.5 : 1
Sex ratio of lobsters remained similar across all four sites (1:1), except for slightly more
male lobsters than female in the Cable Treatment site (1.1:1.3). Edible crab sex ratio
20 | P a g e
showed a greater number of male crabs across all sites, Cable Treatment being the
greatest ratio of male to female edible crabs 3.7:1). There was a greater amount of
female velvet crabs in the Array Control site (1:1.3), this was the only site where there
were more females than males across the three commercial species (Table 4).
A total of 222 ovigerous lobsters were sampled during the 2017 survey period. Of
which 133 (59.9%) were below the MLS of 87 mm CL. The Array Control site had the
greatest abundance of ovigerous lobsters and the Cable Treatment site showed the
lowest abundance. GLMM analysis of ovigerous lobsters did not generate a significant
model of the difference in ovigerous lobster abundance and size between either the
turbine array export cable control and treatment sites. The size distribution of
ovigerous lobsters did not differ significantly between the treatment sites of either the
turbine array or export cable (Kolmogorov Smirnov, p > 0.05).
There were only 4 ovigerous edible crabs sampled and 19 velvet crabs sampled
across all sites in 2017. Statistical analysis of ovigerous status of crab species was
therefore not possible, due to the low n value.
Fish Analysis
All bycatch of fish species presence and absence is reported in Annex 1. Due to the
high abundance of juvenile cod (Gadus morhua) in 2015 (reported in Roach & Cohen
2015), this section is also reported in this report. There was a reduction of cod bycatch
across all sites observed in 2017 in comparison to 2015. However, the overall cod
abundance is similar to that observed in the baseline year in 2013. Cod abundance in
the Array Treatment site was greatest in 2013 (n = 7) and 2015 (n = 41), however in
2017 this was the site of the lowest cod abundance (n = 2). Due to the low numbers
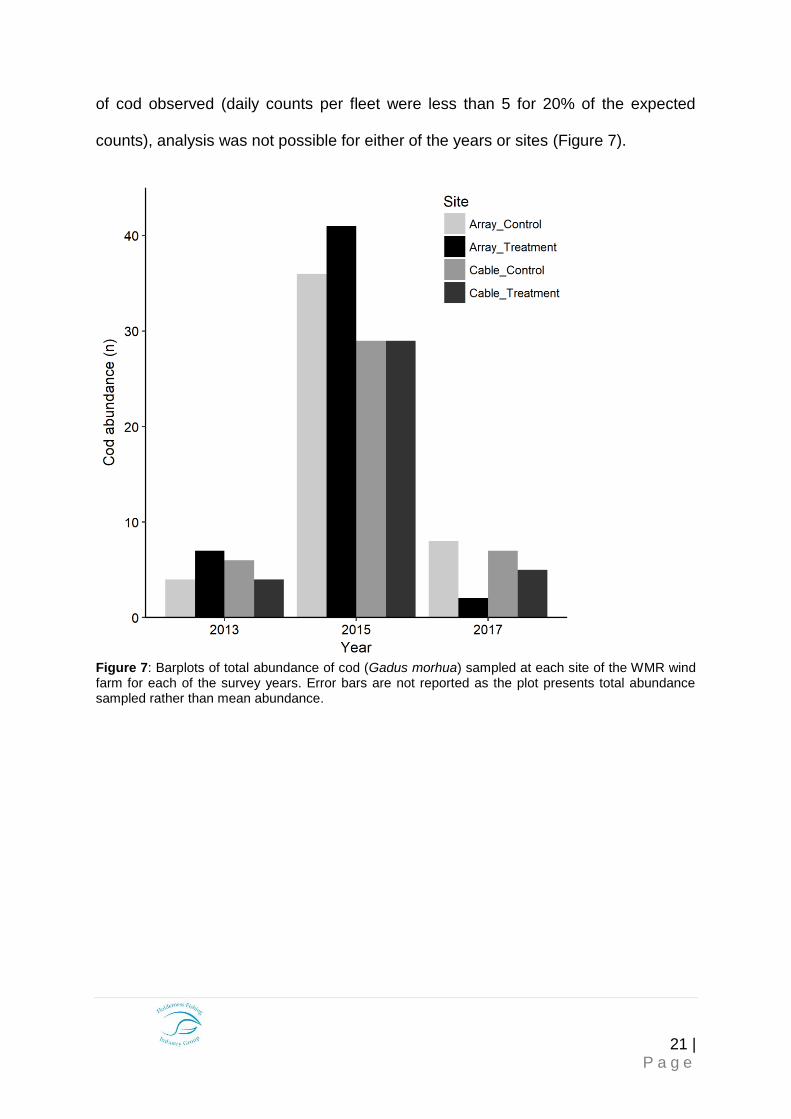
21 | P a g e
of cod observed (daily counts per fleet were less than 5 for 20% of the expected
counts), analysis was not possible for either of the years or sites (Figure 7).
Figure 7: Barplots of total abundance of cod (Gadus morhua) sampled at each site of the WMR wind farm for each of the survey years. Error bars are not reported as the plot presents total abundance sampled rather than mean abundance.
22 | P a g e
Comparison between years
Catch per Unit of Effort and Landings per Unit of Effort
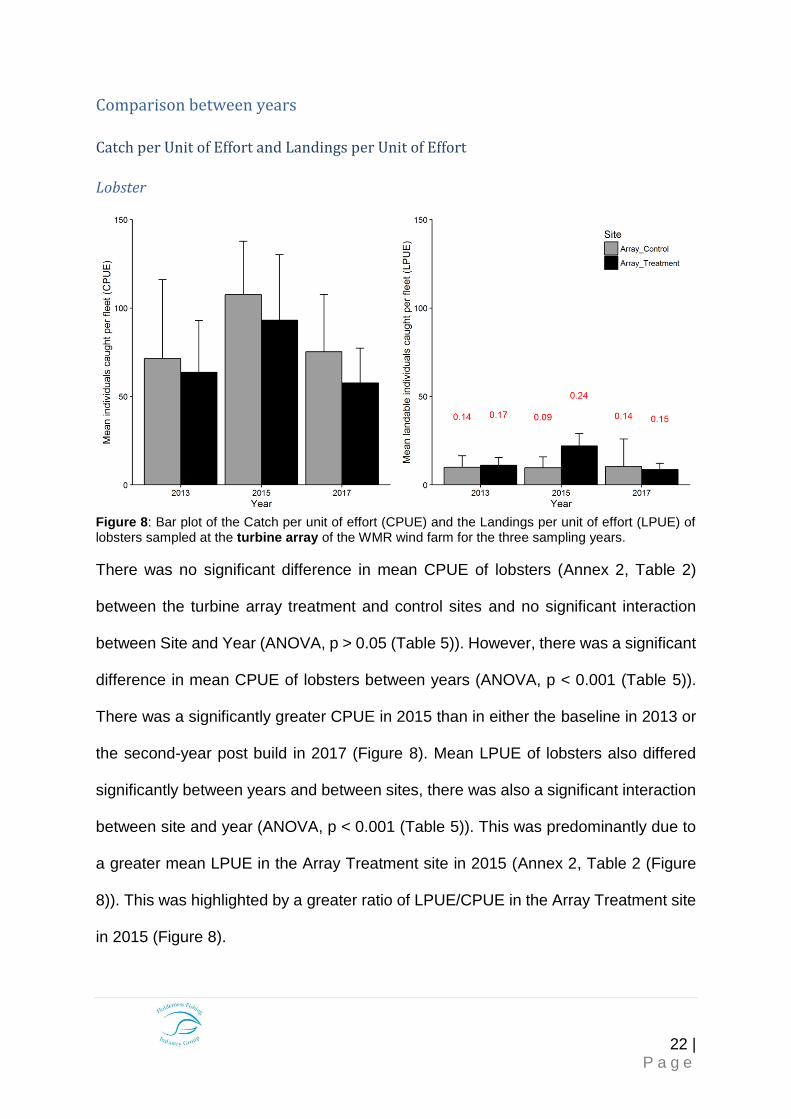
Lobster
Figure 8: Bar plot of the Catch per unit of effort (CPUE) and the Landings per unit of effort (LPUE) of lobsters sampled at the turbine array of the WMR wind farm for the three sampling years.
There was no significant difference in mean CPUE of lobsters (Annex 2, Table 2)
between the turbine array treatment and control sites and no significant interaction
between Site and Year (ANOVA, p > 0.05 (Table 5)). However, there was a significant
difference in mean CPUE of lobsters between years (ANOVA, p < 0.001 (Table 5)).
There was a significantly greater CPUE in 2015 than in either the baseline in 2013 or
the second-year post build in 2017 (Figure 8). Mean LPUE of lobsters also differed
significantly between years and between sites, there was also a significant interaction
between site and year (ANOVA, p < 0.001 (Table 5)). This was predominantly due to
a greater mean LPUE in the Array Treatment site in 2015 (Annex 2, Table 2 (Figure
8)). This was highlighted by a greater ratio of LPUE/CPUE in the Array Treatment site
in 2015 (Figure 8).
23 | P a g e
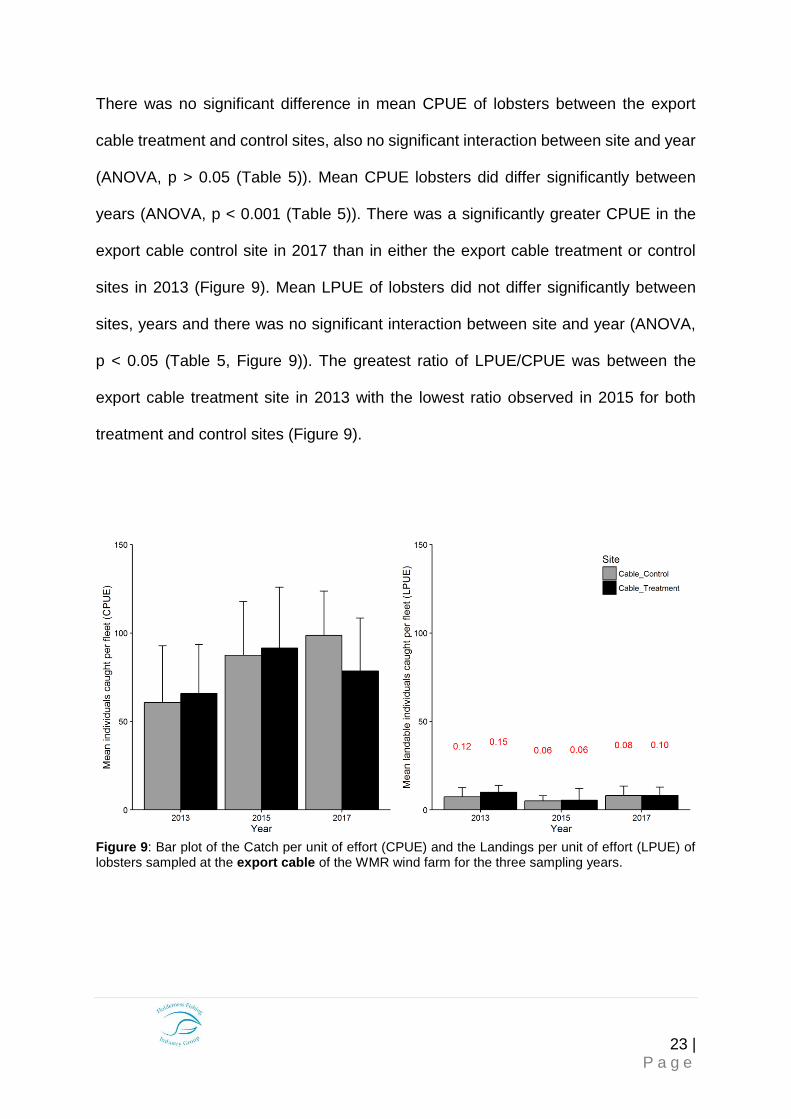
There was no significant difference in mean CPUE of lobsters between the export
cable treatment and control sites, also no significant interaction between site and year
(ANOVA, p > 0.05 (Table 5)). Mean CPUE lobsters did differ significantly between
years (ANOVA, p < 0.001 (Table 5)). There was a significantly greater CPUE in the
export cable control site in 2017 than in either the export cable treatment or control
sites in 2013 (Figure 9). Mean LPUE of lobsters did not differ significantly between
sites, years and there was no significant interaction between site and year (ANOVA,
p < 0.05 (Table 5, Figure 9)). The greatest ratio of LPUE/CPUE was between the
export cable treatment site in 2013 with the lowest ratio observed in 2015 for both
treatment and control sites (Figure 9).
Figure 9: Bar plot of the Catch per unit of effort (CPUE) and the Landings per unit of effort (LPUE) of lobsters sampled at the export cable of the WMR wind farm for the three sampling years.
24 | P a g e
Edible Crab
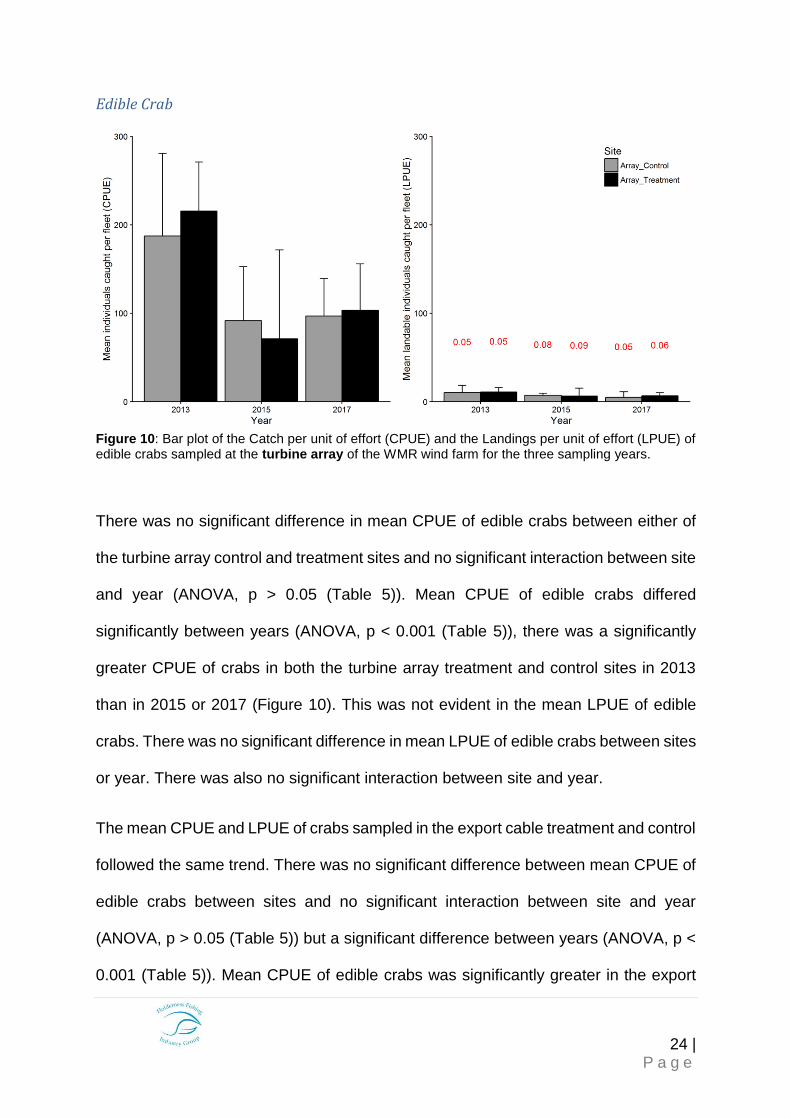
Figure 10: Bar plot of the Catch per unit of effort (CPUE) and the Landings per unit of effort (LPUE) of edible crabs sampled at the turbine array of the WMR wind farm for the three sampling years.
There was no significant difference in mean CPUE of edible crabs between either of
the turbine array control and treatment sites and no significant interaction between site
and year (ANOVA, p > 0.05 (Table 5)). Mean CPUE of edible crabs differed
significantly between years (ANOVA, p < 0.001 (Table 5)), there was a significantly
greater CPUE of crabs in both the turbine array treatment and control sites in 2013
than in 2015 or 2017 (Figure 10). This was not evident in the mean LPUE of edible
crabs. There was no significant difference in mean LPUE of edible crabs between sites
or year. There was also no significant interaction between site and year.
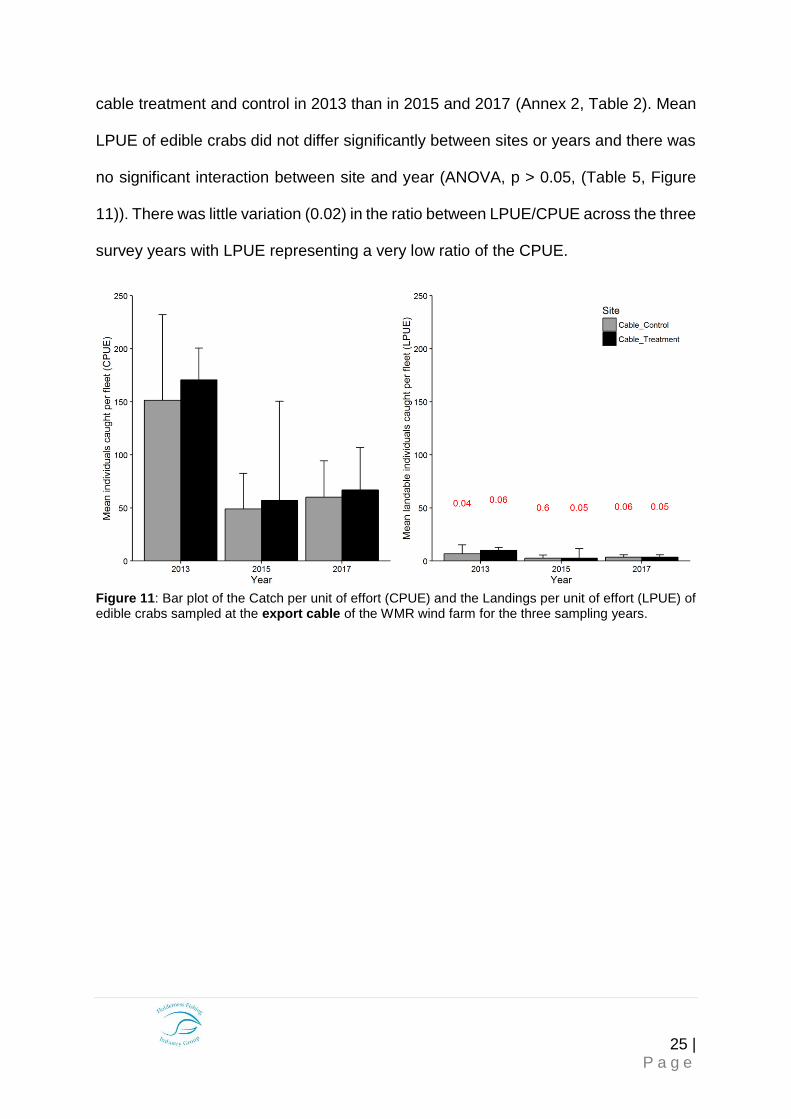
The mean CPUE and LPUE of crabs sampled in the export cable treatment and control
followed the same trend. There was no significant difference between mean CPUE of
edible crabs between sites and no significant interaction between site and year
(ANOVA, p > 0.05 (Table 5)) but a significant difference between years (ANOVA, p <
0.001 (Table 5)). Mean CPUE of edible crabs was significantly greater in the export
25 | P a g e
cable treatment and control in 2013 than in 2015 and 2017 (Annex 2, Table 2). Mean
LPUE of edible crabs did not differ significantly between sites or years and there was
no significant interaction between site and year (ANOVA, p > 0.05, (Table 5, Figure
11)). There was little variation (0.02) in the ratio between LPUE/CPUE across the three
survey years with LPUE representing a very low ratio of the CPUE.
Figure 11: Bar plot of the Catch per unit of effort (CPUE) and the Landings per unit of effort (LPUE) of edible crabs sampled at the export cable of the WMR wind farm for the three sampling years.
26 | P a g e
Velvet Crab
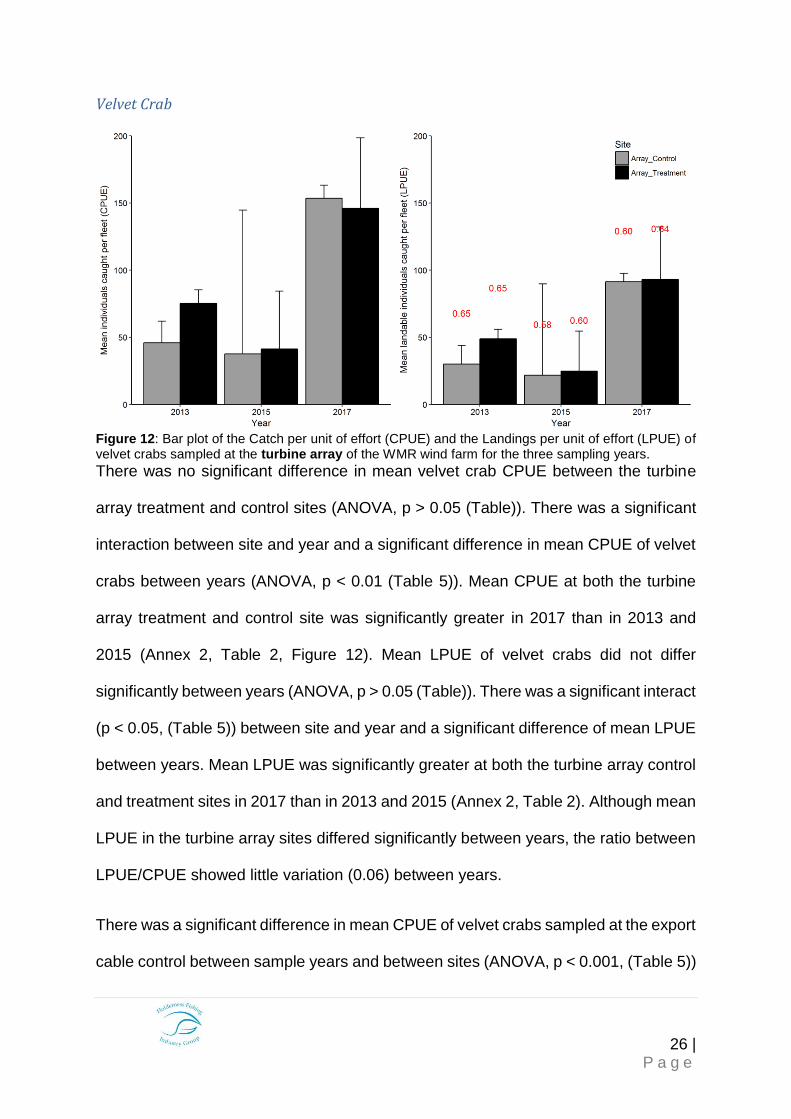
Figure 12: Bar plot of the Catch per unit of effort (CPUE) and the Landings per unit of effort (LPUE) of velvet crabs sampled at the turbine array of the WMR wind farm for the three sampling years.
There was no significant difference in mean velvet crab CPUE between the turbine
array treatment and control sites (ANOVA, p > 0.05 (Table)). There was a significant
interaction between site and year and a significant difference in mean CPUE of velvet
crabs between years (ANOVA, p < 0.01 (Table 5)). Mean CPUE at both the turbine
array treatment and control site was significantly greater in 2017 than in 2013 and
2015 (Annex 2, Table 2, Figure 12). Mean LPUE of velvet crabs did not differ
significantly between years (ANOVA, p > 0.05 (Table)). There was a significant interact
(p < 0.05, (Table 5)) between site and year and a significant difference of mean LPUE
between years. Mean LPUE was significantly greater at both the turbine array control
and treatment sites in 2017 than in 2013 and 2015 (Annex 2, Table 2). Although mean
LPUE in the turbine array sites differed significantly between years, the ratio between
LPUE/CPUE showed little variation (0.06) between years.
There was a significant difference in mean CPUE of velvet crabs sampled at the export
cable control between sample years and between sites (ANOVA, p < 0.001, (Table 5))
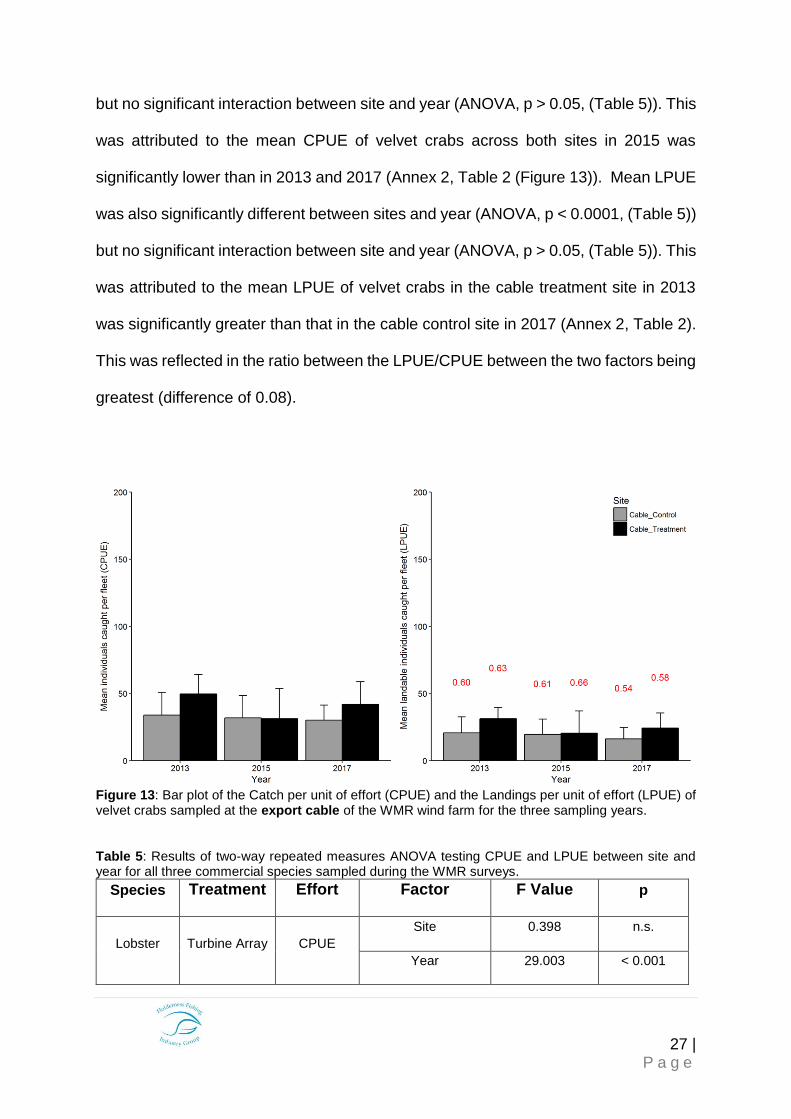
27 | P a g e
but no significant interaction between site and year (ANOVA, p > 0.05, (Table 5)). This
was attributed to the mean CPUE of velvet crabs across both sites in 2015 was
significantly lower than in 2013 and 2017 (Annex 2, Table 2 (Figure 13)). Mean LPUE
was also significantly different between sites and year (ANOVA, p < 0.0001, (Table 5))
but no significant interaction between site and year (ANOVA, p > 0.05, (Table 5)). This
was attributed to the mean LPUE of velvet crabs in the cable treatment site in 2013
was significantly greater than that in the cable control site in 2017 (Annex 2, Table 2).
This was reflected in the ratio between the LPUE/CPUE between the two factors being
greatest (difference of 0.08).
Figure 13: Bar plot of the Catch per unit of effort (CPUE) and the Landings per unit of effort (LPUE) of velvet crabs sampled at the export cable of the WMR wind farm for the three sampling years. Table 5: Results of two-way repeated measures ANOVA testing CPUE and LPUE between site and year for all three commercial species sampled during the WMR surveys.
Species Treatment Effort Factor F Value p
Lobster Turbine Array CPUE
Site 0.398 n.s.
Year 29.003 < 0.001
28 | P a g e
Site*Year 0.310 n.s.
Lobster Turbine Array LPUE
Site 19.90 < 0.001
Year 40.36 < 0.001
Site*Year 25.11 < 0.001
Lobster Export Cable CPUE
Site 3.269 n.s.
Year 25.57 < 0.001
Site*Year 1.043 n.s.
Lobster Export Cable LPUE
Site 1.243 n.s.
Year 2.072 n.s.
Site*Year 1.578 n.s.
Edible
Crab Turbine Array CPUE
Site 2.529 n.s.
Year 39.166 < 0.001
Site*Year 2.180 n.s.
Edible
Crab Turbine Array LPUE
Site 0.035 n.s.
Year 0.492 n.s.
Site*Year 0.001 n.s.
Edible
Crab Export Cable CPUE
Site 2.438 n.s.
Year 37.358 < 0.001
Site*Year 0.000 n.s.
Edible
Crab Export Cable LPUE
Site 0.000 n.s.
Year 1.653 n.s.
Site*Year 0.065 n.s.
Velvet
Crab Turbine Array CPUE
Site 0.752 n.s.
Year 69.858 < 0.001
Site*Year 6.730 < 0.01
Turbine Array LPUE Site 0.453 n.s.
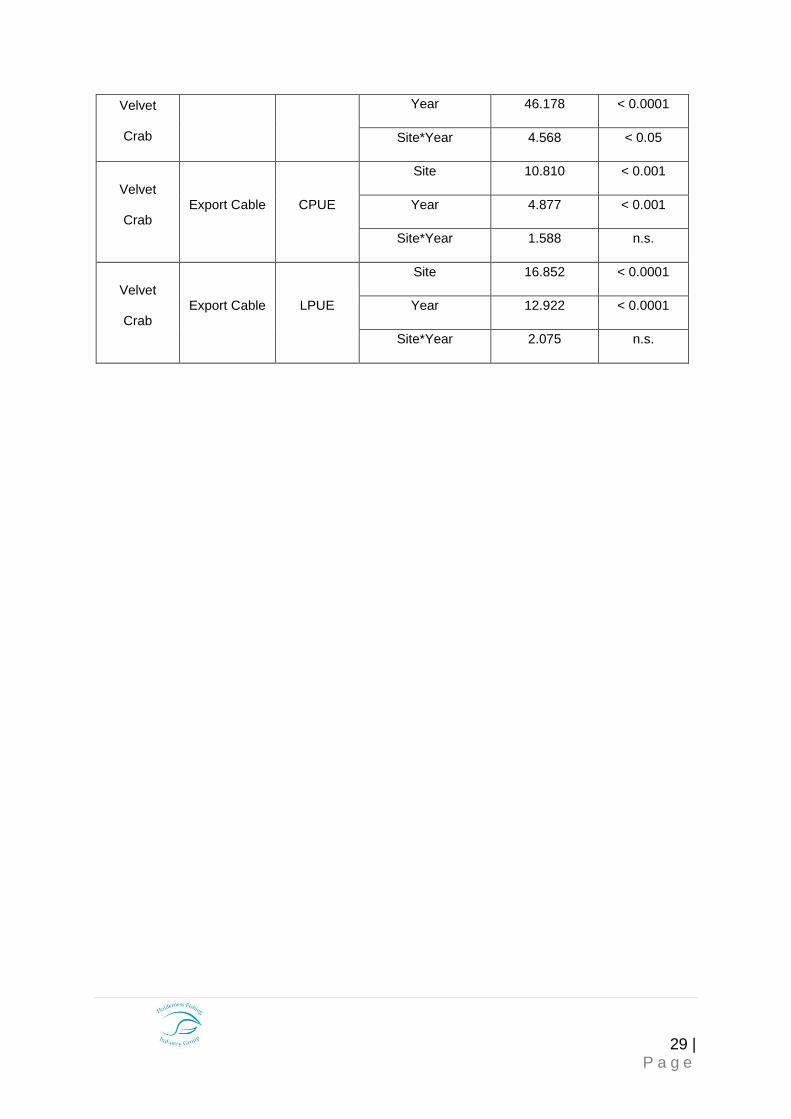
29 | P a g e
Velvet
Crab
Year 46.178 < 0.0001
Site*Year 4.568 < 0.05
Velvet
Crab Export Cable CPUE
Site 10.810 < 0.001
Year 4.877 < 0.001
Site*Year 1.588 n.s.
Velvet
Crab Export Cable LPUE
Site 16.852 < 0.0001
Year 12.922 < 0.0001
Site*Year 2.075 n.s.
30 | P a g e
Size Distribution
This section of the report focuses on the difference in size distribution between the
2017 survey and the baseline survey undertaken in 2013 only. The 2015 data is plotted
in the ECDF plots for reference only, the analysis between 2013/15 was reported in
Roach and Cohen (2015).
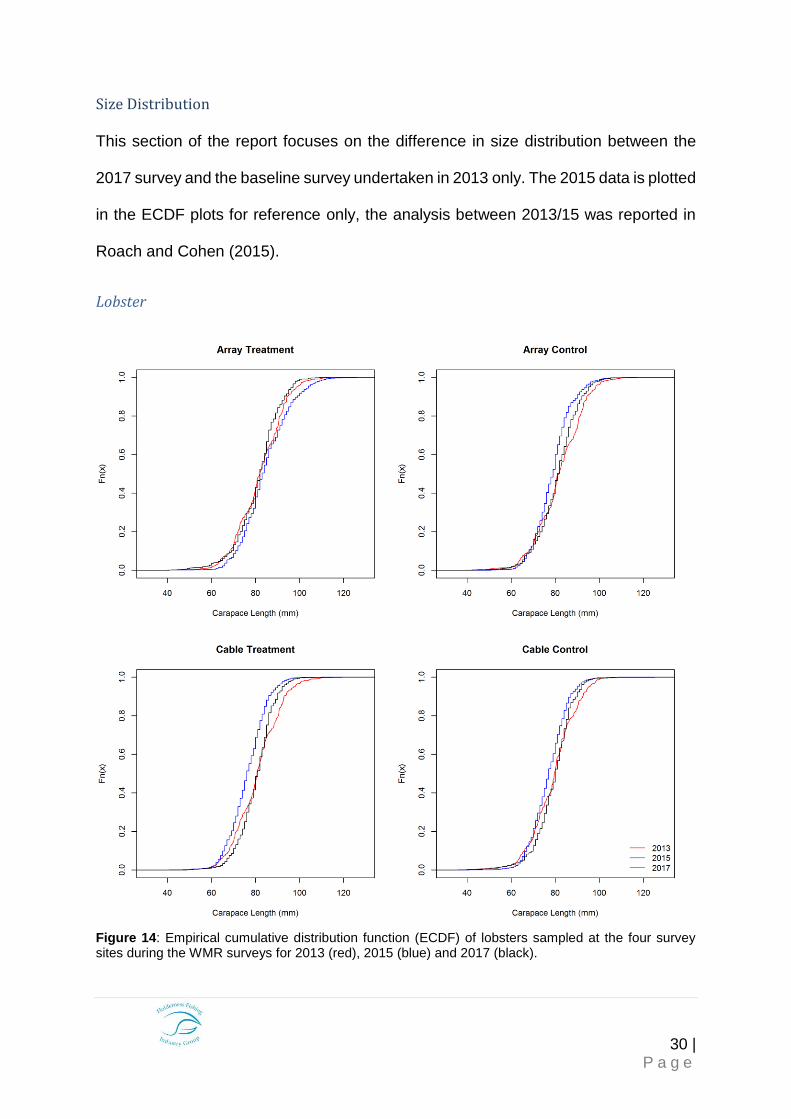
Lobster
Figure 14: Empirical cumulative distribution function (ECDF) of lobsters sampled at the four survey sites during the WMR surveys for 2013 (red), 2015 (blue) and 2017 (black).
31 | P a g e
For all sites there was a significant difference in the size distribution of lobsters
between the baseline survey in 2013 and the survey undertaken in 2017 (Kolmogorov
Smirnov, p < 0.001 (Table 6)). The ECDF plots (Figure 14) show that in the Array
Treatment site there was a greater empirical distribution of lobsters in 2017 up to
approximately 80 mm CL, above that there was a greater distribution observed in
2013. The Array Control site showed little difference up to 80 mm CL then a greater
empirical distribution in 2013. The Cable Treatment and Cable Control sites showed
a similar trend, but the distribution shifted around the MLS of 87mm CL (Figure 14).
32 | P a g e
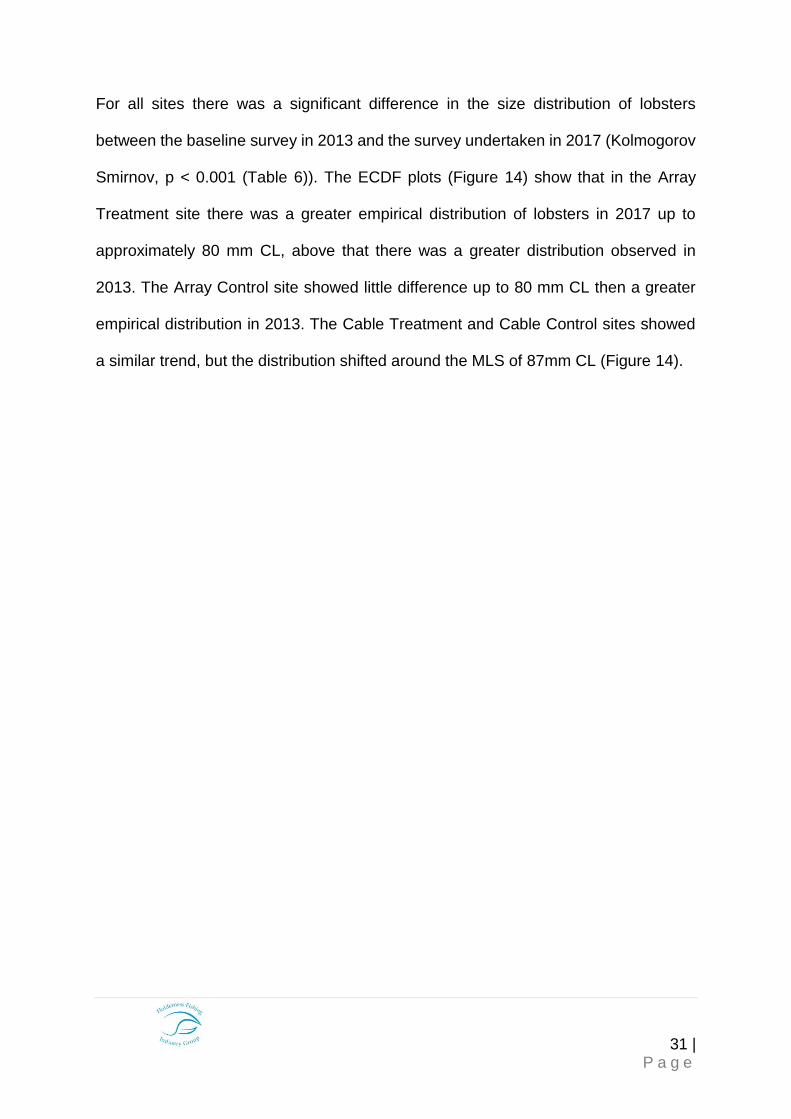
Edible Crab
Figure 15: Empirical cumulative distribution function (ECDF) of edible crabs sampled at the four survey sites during the WMR surveys for 2013 (red), 2015 (blue) and 2017 (black).
For all sites there was a significant difference in the size distribution of edible crabs
between the baseline survey in 2013 and the survey undertaken in 2017 (Kolmogorov
Smirnov, p < 0.001 (Table 6)). The ECDF plots (Figure 15) show that in the Array
Treatment and Array Control sites there was a slightly greater empirical distribution
observed across the size spectrum in 2017 than in 2013. This was the mirrored in the
33 | P a g e
Cable Treatment and Control sites however there was a greater distance between the
empirical distributions in 2017 than in 2013 (Figure 15).
Velvet Crab
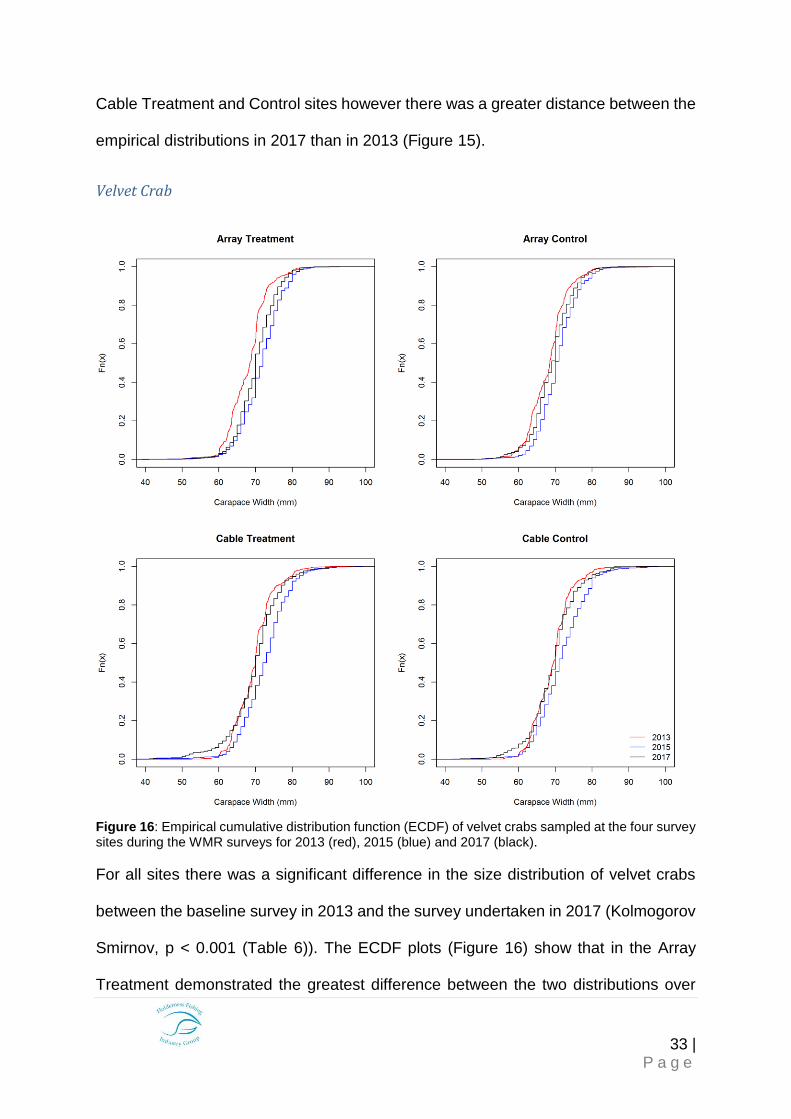
Figure 16: Empirical cumulative distribution function (ECDF) of velvet crabs sampled at the four survey sites during the WMR surveys for 2013 (red), 2015 (blue) and 2017 (black).
For all sites there was a significant difference in the size distribution of velvet crabs
between the baseline survey in 2013 and the survey undertaken in 2017 (Kolmogorov
Smirnov, p < 0.001 (Table 6)). The ECDF plots (Figure 16) show that in the Array
Treatment demonstrated the greatest difference between the two distributions over
34 | P a g e
the four sites. The empirical distribution of velvet crabs observed in the Array
Treatment site in 2017 across the entire size spectrum was greater than that in 2013.
The empirical distribution of the Array Control site was also greater in 2017 than in
2013. This was mirrored for the Cable Control and Treatment fleets, with 2017
demonstrating a greater empirical distribution than in 2013 (Figure 16).
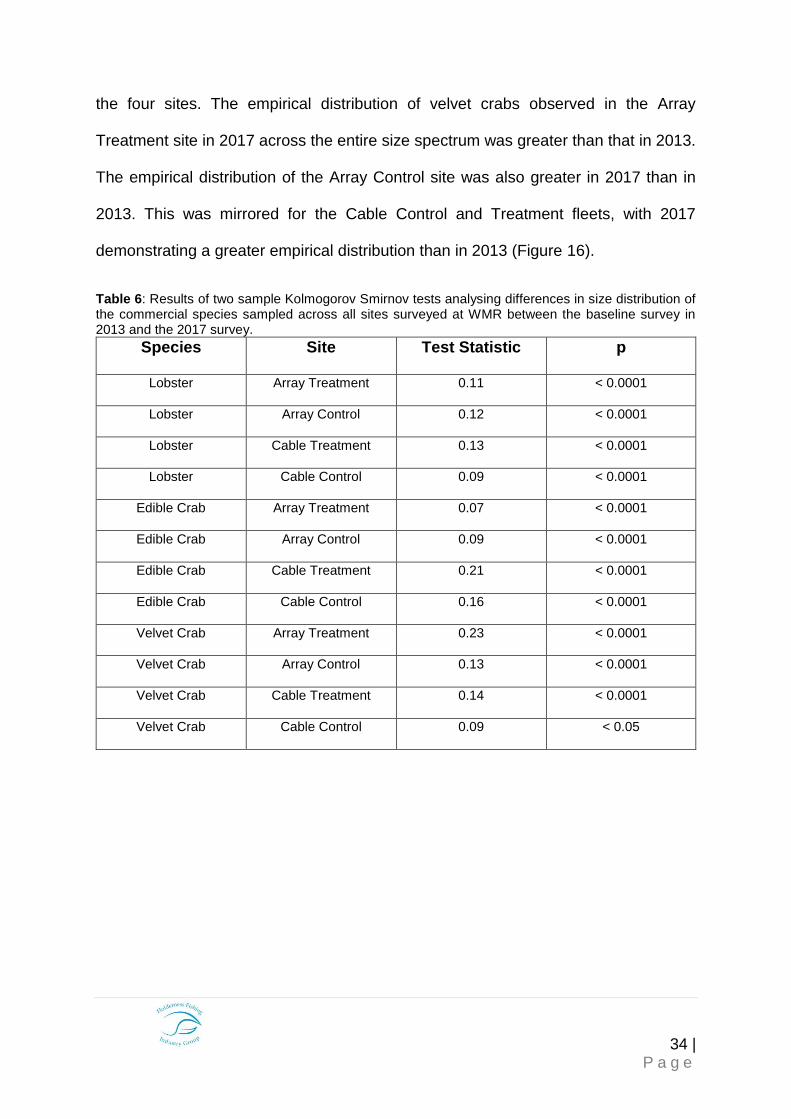
Table 6: Results of two sample Kolmogorov Smirnov tests analysing differences in size distribution of the commercial species sampled across all sites surveyed at WMR between the baseline survey in 2013 and the 2017 survey.
Species Site Test Statistic p
Lobster Array Treatment 0.11 < 0.0001
Lobster Array Control 0.12 < 0.0001
Lobster Cable Treatment 0.13 < 0.0001
Lobster Cable Control 0.09 < 0.0001
Edible Crab Array Treatment 0.07 < 0.0001
Edible Crab Array Control 0.09 < 0.0001
Edible Crab Cable Treatment 0.21 < 0.0001
Edible Crab Cable Control 0.16 < 0.0001
Velvet Crab Array Treatment 0.23 < 0.0001
Velvet Crab Array Control 0.13 < 0.0001
Velvet Crab Cable Treatment 0.14 < 0.0001
Velvet Crab Cable Control 0.09 < 0.05
35 | P a g e
Discussion
2017 Comparison between treatments
Catch per unit of effort and landings per unit of effort
Lobster CPUE did not differ between either of the treatments for both the turbine array
and export cable (Figure 2). There was a significantly greater CPUE in the cable
control site than in the turbine array treatment site. This was predominantly due to a
greater proportion of smaller lobsters in the export cable control site (Figure 6). This
is supported by the fact that the LPUE between sites did not differ significantly (Figure
2). The results indicate that the catch rate of lobsters and the number of lobsters that
could have been retained for landing (LPUE) are not influenced by the operation phase
of either the turbine array or export cable.
Edible crabs showed no difference in either CPUE or LPUE between the treatments
for the turbine array and export cable (Figure 3). The retention rates for edible crabs
were the lowest of all three species sampled (0.05/0.06) indicating that the area
demonstrates low returns for edible crabs. Krone et al., (2017) observed that turbine
foundations acted as a potential nursery ground for edible crabs. This was a study
conducted in an area where the wind farm installation introduced new hard substrate
unlike the WMR which was installed on a complex cobble habitat. The WMR was
installed in 2014/2015, therefore the potential nursery effects are too soon to be
observed. Further study of the WMR may observe the nursery effect for edible crabs.
The study period was also during the period where edible crabs were undergoing
ecdysis, this influenced the lower LPUE for edible crabs.
36 | P a g e
There was no significant difference in CPUE or LPUE of velvet crabs between either
of the treatments for the turbine array or export cable (Figure 4). The ratio between
LPUE and CPUE was the greatest for velvet crabs in comparison to the other
commercial species sampled (> 0.5), indicating a much higher return of velvet crabs
per unit of effort. However, there was a new management measure implemented by
the NEIFCA in January 2016 implementing two mandatory escape gaps in all pots
inside of six nautical miles (North Eastern Inshore Fisheries and Conservation
Authority, 2015). The escape gaps were designed to allow smaller catch
(predominantly lobsters) to escape the pots prior to capture. This affected the velvet
crab fishery as legal sized velvet crabs were able to pass through the escape gaps.
As the pots deployed for this survey were exempt from this byelaw we observed a
significantly greater number of velvet crabs in the survey fleets (Figure 4) than reported
anecdotally by the commercial fishermen in the area. The greater CPUE in the turbine
array fleets in comparison to the export cable fleets was due to velvet crabs residing
further offshore than the location of the export cable fleets were located.
Overall the catch rates and rates of catch that could have been retained for landing
did not appear to be affected by the operation phase of the WMR wind farm. There
was no difference in the treatments for the three commercial species, for both the
turbine array and export cable.
Size distribution
The size distribution of lobsters did not differ significantly between the control and
treatment sites of the turbine array (Figure 5). This distribution shift when compared
to the same sites in 2015 (Roach & Cohen, 2015), indicates that there is no observable
effect of the turbine array operation on the size distribution of lobsters. It also indicates
37 | P a g e
that once the turbine array was subjected to fishing exploitation post construction, the
size distribution reflected that of the control fleet within a relatively short period. The
size distribution of lobsters within the export cable was significantly different between
the control and treatment fleets. The plot derived from GLMM analysis (Figure 6)
indicate that there was a greater proportion of lobsters < 70 mm CL in the control fleet
than the treatment. The inverse of this trend was observed in 2015 (Roach & Cohen,
2015), demonstrating a greater proportion of lobsters > 100 mm CL in the control fleet.
There is current theory that elasmobranch species can be attracted to the EMF
generated by HVAC cables (Ashley, Mangi, & Rodwell, 2014; Bureau of Ocean Energy
Mangaement, 2016; Rodmell & Johnson, 2002). Elasmobranch species are thought
to predate on juvenile lobsters. It is possible that Elasmobranch species may be
attracted to the HVAC export cable and are in turn predating upon the smaller lobsters
in the area. As the difference is only slight and the literature on the attraction of EMF
is currently sparse, this effect may be unlikely. Additionally, the removal of boulders
during the laying of the export cable may have reduced shelter availability for smaller
lobsters (Howard, 1980). As the inverse distribution was observed in 2015 this is
unlikely, and the size distribution difference may be attributed to natural variation
between the two sites.
Edible crabs size distribution did not differ significantly between the either the turbine
array or export cable control and treatment fleets (Figure 5 & 6). This indicates that
there is on observable effect of either the turbine array or export cable on the edible
crab size distribution. Further study of the size distribution within the turbine array may
support the theory of wind turbines acting as nursery areas for edible crabs. An
38 | P a g e
increase in the proportion of edible crabs of a smaller size in future years would be
expected.
There was a significant difference in the size distribution of velvet crabs between the
treatment and control sites for the turbine array and export cable. GLMM analysis
revealed that there was a greater proportion of velvet crabs in both treatment sites
than their controls (Figure 5 & 6). The difference in the export cable sites is only slight
and is likely to be attributed to natural variation. The previously discussed change in
management measures affecting velvet crabs, is likely to be the reason for the
difference in the distributions within the turbine array. The increased velvet crabs in
the turbine array sites (Figure 4) may be taking advantage of the potentially increased
diversity associated with offshore wind turbines (De Mesel et al., 2015). There may be
a greater amount of resources available within the turbine array (De Backer et al.,
2014; Kröncke et al., 2011; Vandendriessche et al., 2015), both attracting larger velvet
crabs and increasing growth rates due to increased nutrient availability. Although the
GLMM analysis of velvet crab size distribution between the export cable sites show a
slight increase in the proportion of velvet crabs in the treatment site; there was no
significant difference observed.
Sex ratio and ovigerous status
Sex ratio of lobsters was similar to that reported in the previous two surveys (Roach &
Cohen, 2013, 2015). Ovigerous lobsters accounted for 9% of the females sampled
during the survey, with ~60% of these being below the MLS. This indicates that the
majority of females can breed at least once prior to being caught. However recent
national legislation enforced on the 1st October 2017 makes it illegal to land any
39 | P a g e
ovigerous females. Further studies should see this proportion of ovigerous females
increase and the proportion of ovigerous lobsters of a larger size increase.
The high number of edible crabs that were of a grade 2 (soft shelled), reflected by the
low LPUE (Figure 3), indicates that the survey was undertaken whilst edible crabs
were undergoing ecdysis. This could potentially explain the absence of ovigerous
edible crabs as they adopt a more sessile lifestyle during the brood period.
Presence of fish species
The increased presence of Atlantic Cod caught in pots observed in 2015 (Roach &
Cohen, 2015), were of concern due to their potential influence on the food web in the
area (Raoux et al., 2017; van Hal et al., 2017). The abundance of Atlantic Cod
observed in 2017 did not reflect those observed in 2015 (Figure 7). The abundance
observed was similar to that observed in 2013. There were only two Atlantic Cod
observed within the turbine array treatment site, the lowest of all sites (Figure 7). Due
to the safety zone around each of the individual turbines of 50m, the turbine array
treatment fleets were deployed away from the turbines. van Hal et al., (2017) observed
that fish species were aggregating around the turbines for protection and feeding
purposes. It may be that the presence of the turbines discourages Atlantic Cod from
moving around the area as much, decreasing the chance of encountering a pot.
Comparison between 2017 and baseline
Catch per unit of effort and landings per unit of effort
Lobster CPUE and LPUE did not differ significantly between control and treatment
sites, however there was a significant difference between years (Figure 8). This was
accounted for by the greater CPUE in both the turbine array treatment and control
40 | P a g e
sites in 2015. As the 2015 data is aggregated data, before and after the turbine array
was closed to fishing exploitation, the closure of the site influenced the CPUE of the
site (Roach & Cohen, 2015). The closure during the construction phase acted as de-
facto no take zone. Biomass and abundance of lobsters has been demonstrated to
increase in areas where fishing exploitation is absent (ref). This can account for the
difference in CPUE of lobsters between years. There was no significant difference
between sites or years of lobster CPUE/LPUE in the export cable, except for the cable
control site having a significantly greater CPUE in 2017 than the export cable
treatment and control sites in 2017. This did not translate into a significant increase in
LPUE from the same sites when compared between years. As this was an increase in
CPUE from the baseline and in the control site it is likely to be natural variation as
opposed to effects of the export cable.
Although there was no significant interaction of mean edible crab CPUE between site
and year, there was a significant difference between years. Mean CPUE of edible crab
for both the turbine array and export cable treatment and control was significantly
greater in 2013 than in 2015/7 (Figure 10 & 11). This is likely to be attributed to natural
variation in the crab population as there was no significant difference in mean edible
crab CPUE between the control and treatment sites in any of the survey years. The
edible crabs that could have been retained for landing (LPUE) showed no significant
difference between years and sites. This supports the theory of natural variation being
the increase of CPUE in 2013. The highest ratio of LPUE/CPUE was in 2015 when the
CPUE was lowest of the three years. This can be attributed to the de-fact no take zone
effects of the closed turbine array observed in 2015.
41 | P a g e
The mean CPUE of velvet crabs observed within the turbine array differed significantly
between years (Figure 12). There was a drop in mean CPUE in 2015 from 2013, this
can be attributed to the increased CPUE of lobsters within the same pots. Lobsters
are often the dominant species in inter-species interactions within a mixed species pot
fishery. However, the greatly increased CPUE of velvet crabs observed in 2017 can
be attributed to the escape gap management measure. The increased population of
velvet crabs that are not being exploited to the same levels as previous years is being
reflected by the greater CPUE in 2017. This trend was not observed for the export
cable. There was no significant difference in CPUE/LPUE between years or sites.
Velvet crabs had the highest ratio of LPUE/CPUE than the other species sampled,
indicating an exploitable population in the area that has a high yield in relation to effort.
Size distribution
The size distribution of lobsters in 2017 differed significantly across all sites when
compared to the baseline (2013). Figure 14 demonstrates that the empirical
distribution of lobsters was greater in 2013 at sizes > 85 mm CL and a greater
distribution of smaller lobsters in 2017. This was the general trend for all four sites. As
the control sites follow the same trend as the treatment sites it is likely that this is due
to natural variation rather than effects of the turbine array or export cable.
There was a significant difference of the size distribution of edible crabs across all
sites between 2017 and 2013. Across all sites the empirical distribution was greater in
2017 than in 2013 (Figure 15), indicating a population of larger animals sampled. In
2013 the majority of the catch sampled were of a smaller size (indicated by a high
CPUE and a relatively low LPUE in 2013 (Figure 10 & 11)). There was also an
additional management measure implemented in January 2016 (North Eastern
42 | P a g e
Inshore Fisheries and Conservation Authority, 2015) for edible crab, increasing the
MLS from 130 mm CW to 140 mm CW. This increase in MLS means that there were
a greater number of edible crabs sized 130-140 mm CW observed in 2017 than in
2013.
Velvet crab size distribution differed significantly between years across all sites (Figure
16). The difference in empirical distribution was greatest in the turbine array treatment
site than in the control site. This was influenced by the change in management
measures and the possible increase in velvet crab size and population previously
discussed. Although there was a significant difference in size distribution between
years for the export cable sites, the empirical distribution shows that the difference
was slight between years (Figure 16).
Conclusion
The overall results for the three species show little variation in population structure
between the control and treatment sites for the turbine array and export cable.
However, the introduced management measures affecting edible and velvet crabs
may be masking small effects of the WMR operational phase. As reported in 2015,
there have been external influences on the survey in 2017 that may be inadvertently
influencing the results of the survey, however these are likely to be slight. Further study
can assess whether the WMR wind farm can act as a nursery ground for juvenile
crustaceans and whether the individual turbines fish aggregating effect influence the
local crustacean populations.

43 | P a g e
44 | P a g e
References
Ashley, M. C., Mangi, S. C., & Rodwell, L. D. (2014). The potential of offshore
windfarms to act as marine protected areas – A systematic review of current evidence.
Marine Policy, 45, 301–309.
Bates, D., Mächler, M., Bolker, B. M., & Walker, S. C. (2015). Fitting linear mixed-
effects models using lme4. Journal of Statistical Software, 67(1), 1–48.
Bureau of Ocean Energy Mangaement. (2016). Environmental Studies –
Electromagnetic Fields ( EMF ) Applied Science for Informed Decisions on Ocean
Energy.
Coates, D. A., Kapasakali, D. A., Vincx, M., & Vanaverbeke, J. (2016). Short-term
effects of fishery exclusion in offshore wind farms on macrofaunal communities in the
Belgian part of the North Sea. Fisheries Research, 179, 131–138.
De Backer, A., Van Hoey, G., Coates, D., Vanaverbeke, J., & Hostens, K. (2014).
Similar diversity-disturbance responses to different physical impacts: Three cases of
small-scale biodiversity increase in the Belgian part of the North Sea. Marine Pollution
Bulletin, 84(1–2), 251–262.
De Mesel, I., Kerckhof, F., Norro, A., Rumes, B., & Degraer, S. (2015). Succession
and seasonal dynamics of the epifauna community on offshore wind farm foundations
and their role as stepping stones for non-indigenous species. Hydrobiologia, 756(1),
37–50.
Griffin, R., Buck, B., & Krause, G. (2015). Private incentives for the emergence of co-
production of offshore wind energy and mussel aquaculture. Aquaculture, 436, 80–89.
45 | P a g e
Holst, R., & Revill, A. (2009). A simple statistical method for catch comparison studies.
Fisheries Research, 95(2–3), 254–259.
Hooper, T., & Austen, M. (2014). The co-location of offshore windfarms and decapod
fisheries in the UK: Constraints and opportunities. Marine Policy, 43, 295.
Howard, a. E. (1980). Substrate controls on the size composition of lobster (Homarus
gammarus) populations. ICES Journal of Marine Science, 39(2), 130–133.
Kröncke, I., Reiss, H., Eggleton, J. D., Aldridge, J., Bergman, M. J. N., Cochrane, S.,
… Rees, H. L. (2011). Changes in North Sea macrofauna communities and species
distribution between 1986 and 2000. Estuarine, Coastal and Shelf Science, 94(1), 1–
15.
Krone, R., Dederer, G., Kanstinger, P., Krämer, P., Schneider, C., & Schmalenbach,
I. (2017). Mobile demersal megafauna at common offshore wind turbine foundations
in the German Bight (North Sea) two years after deployment - increased production
rate of Cancer pagurus. Marine Environmental Research, 123, 53–61.
Love, M. S., Nishimoto, M. M., Clark, S., & Bull, A. S. (2016). Renewable Energy in
Situ Power Cable Observation. U.S. Department of the Interior, Bureau of Ocean
Energy Management, Pacific OCS Region, Camarillo, CA. OCS Study 2016-008. 86
pp.
North Eastern Inshore Fisheries and Conservation Authority. Crustacea Conservation
Byelaw (2015).
46 | P a g e
Raoux, A., Tecchio, S., Pezy, J. P., Lassalle, G., Degraer, S., Wilhelmsson, D., Niquil,
N. (2017). Benthic and fish aggregation inside an offshore wind farm: Which effects
on the trophic web functioning? Ecological Indicators, 72, 33–46.
Roach, M., & Cohen, M. (2013). Shellfish Monitoring Report 2013 A study conducted
for DONG Energy.
Roach, M., & Cohen, M. (2015). Westermost Rough Fish & Shellfish Monitoring Report
2015 ; Including Comparison to Baseline Data 2013 A study conducted for DONG
Energy.
Rodmell, D., & Johnson, M. (2002). The development of marine based wind energy
generation and inshore fisheries in UK waters: Are they compatible? In Who owns the
sea? (pp. 76–103).
Stelzenmüller, V., Diekmann, R., Bastardie, F., Schulze, T., Berkenhagen, J.,
Kloppmann, M., … Kraus, G. (2016). Co-location of passive gear fisheries in offshore
wind farms in the German EEZ of the North Sea: A first socio-economic scoping.
Journal of Environmental Management, 183, 794–805.
Thomas, R., Lello, J., Medeiros, R., Pollard, A., Seward, A., Smith, J., Vaughan, I.
(2015). Data Analysis with R Statistical Software A guidebook for Scientists.
van Hal, R., Griffioen, A. B., & van Keeken, O. A. (2017). Changes in fish communities
on a small spatial scale, an effect of increased habitat complexity by an offshore wind
farm. Marine Environmental Research, 126, 26–36.

47 | P a g e
Vandendriessche, S., Derweduwen, J., & Hostens, K. (2015). Equivocal effects of
offshore wind farms in Belgium on soft substrate epibenthos and fish assemblages.
Hydrobiologia, 756(1), 19–35.
Zuur, A. F., & Ieno, E. N. (2016). A protocol for conducting and presenting results of
regression-type analyses. Methods in Ecology and Evolution, 7(6), 636–645.
48 | P a g e
Annex 1 - Bycatch
Presence and absence table of all by-catch caught during the baseline survey (2013), the first-year post build survey (2015) and third year post build survey (2017) for the WMR monitoring project (P= Present, A = Absent)
Common Name Scientific Name 2013 2015 2017
Shore crab Carcinus maenas P A P
Spiny Squat lobster Galathea strigosa P P P
Long Clawed Squat
Lobster Munida rugosa P P P
Marbled swimming crab Liocarcinus marmoreus P P P
Harbour Crab Liocarcinus
depurator P P P
Hermit crab Eupagarus bernhadus P P P
Long legged spider crab Macropodia rostrata P P P
Wrinkled Swimming
Crab Liocarcinus corrugatus A P P
Common urchin Echinus esculentus P P P
Common starfish Asteria rubens P P P
Dab Limanda limanda P P P
Sea scorpion/ Bullhead Myoxocephalus scorpius P P P
Pouting Trisopterus luscus P P P
Poor cod Trisopterus minutus P P P
Cod Gadus morhua P P P
Butter fish Pholis gunnelis P A A
Ling Molva molva P P A
Whiting Merlangius merlangus P P P
Ballan wrasse Labrus bergylta P P P
Three bearded rockling Gaidropsarus vulgaris P P P
Tompot blenny Parablennius gattorugine P P P

49 | P a g e
Coley/Saithe Pollachius virens A P P
Pollack Pollachius pollachius P A A
Pogge/
Armoured bullhead Agonas cataphractus A P A
Red Mullet Mullus surmuletus A P P
Top Knot Zeugopterus punctatus A P A
Lumpsucker Cyclopterus lumpus A A P
50 | P a g e
Annex 2 – Supporting Statistics
Table 1: Descriptive statistics of CPUE and LPUE for each species sampled at each site during the 2017 WMR survey.
Species Site Unit of Effort Mean s.d.
Lobster Array Control CPUE 75.25 30.23
Lobster Array Treatment CPUE 57.63 19.66
Lobster Cable Control CPUE 98.56 30.36
Lobster Cable Treatment CPUE 78.50 29.87
Lobster Array Control LPUE 10.44 6.01
Lobster Array Treatment LPUE 8.75 3.51
Lobster Cable Control LPUE 8.00 2.85
Lobster Cable Treatment LPUE 8.13 4.70
Edible Crab Array Control CPUE 96.75 61.03
Edible Crab Array Treatment CPUE 103.38 52.31
Edible Crab Cable Control CPUE 60.13 33.57
Edible Crab Cable Treatment CPUE 66.94 39.87
Edible Crab Array Control LPUE 4.87 2.42
Edible Crab Array Treatment LPUE 6.50 3.54
Edible Crab Cable Control LPUE 3.64 2.94
Edible Crab Cable Treatment LPUE 3.62 2.33
Velvet Crab Array Control CPUE 153.50 107.14
Velvet Crab Array Treatment CPUE 146.06 52.49
Velvet Crab Cable Control CPUE 30.25 16.65
Velvet Crab Cable Treatment CPUE 41.94 17.00
Velvet Crab Array Control LPUE 91.44 68.01
Velvet Crab Array Treatment LPUE 93.13 39.04
Velvet Crab Cable Control LPUE 16.31 11.46
Velvet Crab Cable Treatment LPUE 24.31 11.23
51 | P a g e
Table 2: Descriptive statistics of CPUE and LPUE for each species sampled at each site and during each year of the WMR survey.
Species Year Site Unit of Effort Mean s.d.
Lobster 2013 Array Control CPUE 71.39 44.67
Lobster 2013 Array Treatment CPUE 63.70 36.97
Lobster 2013 Cable Control CPUE 60.70 32.05
Lobster 2013 Cable Treatment CPUE 65.78 34.39
Lobster 2013 Array Control LPUE 10.00 6.53
Lobster 2013 Array Treatment LPUE 11.13 6.98
Lobster 2013 Cable Control LPUE 7.33 5.19
Lobster 2013 Cable Treatment LPUE 9.10 6.59
Lobster 2015 Array Control CPUE 107.57 29.31
Lobster 2015 Array Treatment CPUE 93.22 32.24
Lobster 2015 Cable Control CPUE 87.43 27.71
Lobster 2015 Cable Treatment CPUE 91.52 25.12
Lobster 2015 Array Control LPUE 9.78 4.40
Lobster 2015 Array Treatment LPUE 22.00 15.52
Lobster 2015 Cable Control LPUE 5.10 3.91
Lobster 2015 Cable Treatment LPUE 5.50 5.49
Lobster 2017 Array Control CPUE 75.20 30.23
Lobster 2017 Array Treatment CPUE 57.63 19.66
Lobster 2017 Cable Control CPUE 98.56 30.36
Lobster 2017 Cable Treatment CPUE 78.50 29.87
Lobster 2017 Array Control LPUE 10.44 6.01
Lobster 2017 Array Treatment LPUE 8.75 3.51
Lobster 2017 Cable Control LPUE 8.00 2.85
Lobster 2017 Cable Treatment LPUE 8.13 4.70
Edible Crab 2013 Array Control CPUE 187.35 93.42
Edible Crab 2013 Array Treatment CPUE 215.57 100.34
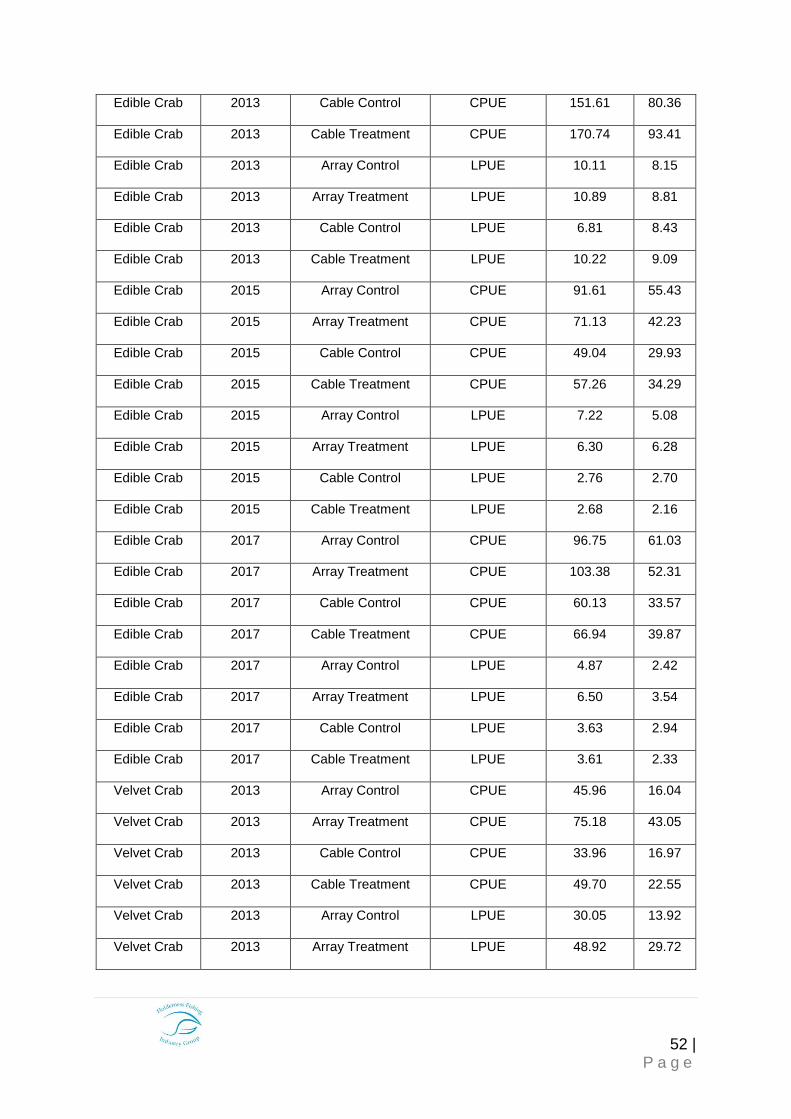
52 | P a g e
Edible Crab 2013 Cable Control CPUE 151.61 80.36
Edible Crab 2013 Cable Treatment CPUE 170.74 93.41
Edible Crab 2013 Array Control LPUE 10.11 8.15
Edible Crab 2013 Array Treatment LPUE 10.89 8.81
Edible Crab 2013 Cable Control LPUE 6.81 8.43
Edible Crab 2013 Cable Treatment LPUE 10.22 9.09
Edible Crab 2015 Array Control CPUE 91.61 55.43
Edible Crab 2015 Array Treatment CPUE 71.13 42.23
Edible Crab 2015 Cable Control CPUE 49.04 29.93
Edible Crab 2015 Cable Treatment CPUE 57.26 34.29
Edible Crab 2015 Array Control LPUE 7.22 5.08
Edible Crab 2015 Array Treatment LPUE 6.30 6.28
Edible Crab 2015 Cable Control LPUE 2.76 2.70
Edible Crab 2015 Cable Treatment LPUE 2.68 2.16
Edible Crab 2017 Array Control CPUE 96.75 61.03
Edible Crab 2017 Array Treatment CPUE 103.38 52.31
Edible Crab 2017 Cable Control CPUE 60.13 33.57
Edible Crab 2017 Cable Treatment CPUE 66.94 39.87
Edible Crab 2017 Array Control LPUE 4.87 2.42
Edible Crab 2017 Array Treatment LPUE 6.50 3.54
Edible Crab 2017 Cable Control LPUE 3.63 2.94
Edible Crab 2017 Cable Treatment LPUE 3.61 2.33
Velvet Crab 2013 Array Control CPUE 45.96 16.04
Velvet Crab 2013 Array Treatment CPUE 75.18 43.05
Velvet Crab 2013 Cable Control CPUE 33.96 16.97
Velvet Crab 2013 Cable Treatment CPUE 49.70 22.55
Velvet Crab 2013 Array Control LPUE 30.05 13.92
Velvet Crab 2013 Array Treatment LPUE 48.92 29.72
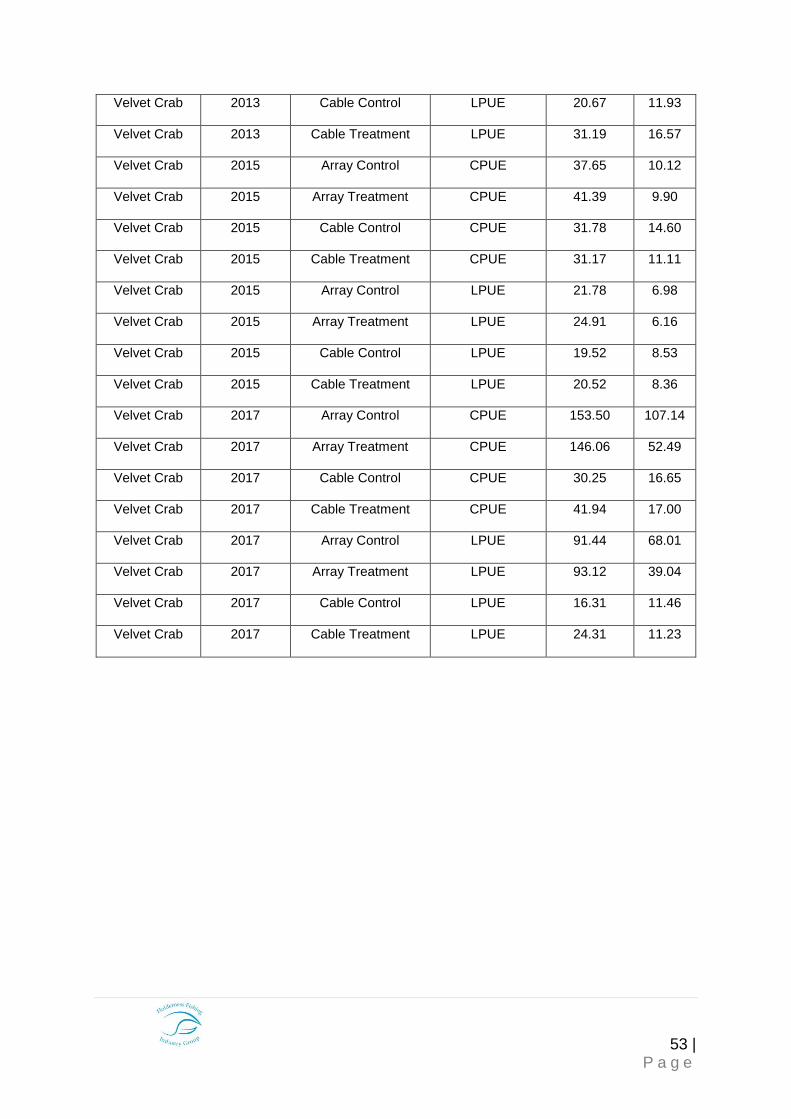
53 | P a g e
Velvet Crab 2013 Cable Control LPUE 20.67 11.93
Velvet Crab 2013 Cable Treatment LPUE 31.19 16.57
Velvet Crab 2015 Array Control CPUE 37.65 10.12
Velvet Crab 2015 Array Treatment CPUE 41.39 9.90
Velvet Crab 2015 Cable Control CPUE 31.78 14.60
Velvet Crab 2015 Cable Treatment CPUE 31.17 11.11
Velvet Crab 2015 Array Control LPUE 21.78 6.98
Velvet Crab 2015 Array Treatment LPUE 24.91 6.16
Velvet Crab 2015 Cable Control LPUE 19.52 8.53
Velvet Crab 2015 Cable Treatment LPUE 20.52 8.36
Velvet Crab 2017 Array Control CPUE 153.50 107.14
Velvet Crab 2017 Array Treatment CPUE 146.06 52.49
Velvet Crab 2017 Cable Control CPUE 30.25 16.65
Velvet Crab 2017 Cable Treatment CPUE 41.94 17.00
Velvet Crab 2017 Array Control LPUE 91.44 68.01
Velvet Crab 2017 Array Treatment LPUE 93.12 39.04
Velvet Crab 2017 Cable Control LPUE 16.31 11.46
Velvet Crab 2017 Cable Treatment LPUE 24.31 11.23

54 | P a g e