Embed Size (px)
Citation preview
1
State of West Virginia’s Budget Forecast
West Virginia Higher Education Board of Governor’s Summit
August 2013Mike McKown
State Budget Office
2
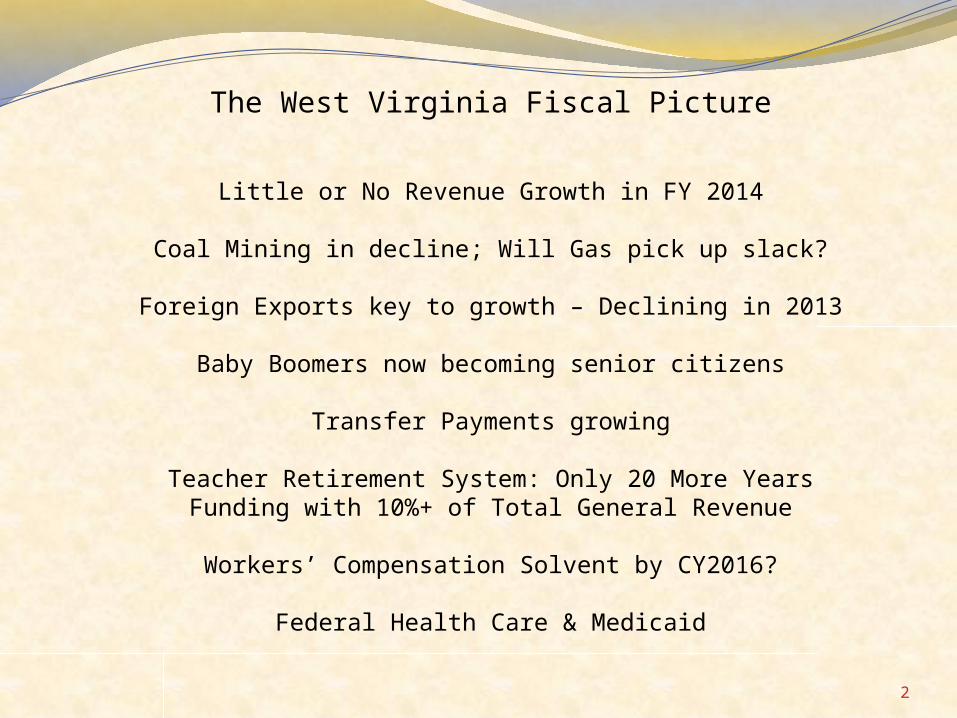
The West Virginia Fiscal Picture
Little or No Revenue Growth in FY 2014
Coal Mining in decline; Will Gas pick up slack?
Foreign Exports key to growth – Declining in 2013
Baby Boomers now becoming senior citizens
Transfer Payments growing
Teacher Retirement System: Only 20 More Years Funding with 10%+ of Total General Revenue
Workers’ Compensation Solvent by CY2016?
Federal Health Care & Medicaid

3
National Fiscal Concerns
Major U.S. Cities Pension Funds Stressed
Detroit in Bankruptcy, Chicago downgraded due to $19 Billion unfunded pension debt
Illinois - just 5 years from exhausting its pension fund.
(Unfunded liabilities at $96 Billion and climbing)
Nationwide Public Retirement Systems – The number of retirees is growing
5 times faster than the number of working members.
Federal Government accumulates over $1.75 Billion of new debt every day.
Estimated FY13 Federal government expenditures $3.455 Trillion
Estimated FY13 Federal government receipts $2.813 Trillion
Estimated FY13 Federal government deficit $0.642 Trillion
Future deficits are still predicted to be $630 Billion per year even with current budget adjustments
Medicare, Medicaid & Social Security make up 62% of Federal spending
Federal Government's accumulated debt continues to grow - $16.7 TRILLION.
(debt per citizen $53,000, debt per taxpayer $148,000)
US Debt Ceiling is $16.7 Trillion - another budget battle looming this Fall
US GDP as of June 2013 = $16.5 Trillion

4
-
50,000
100,000
150,000
200,000
250,000
300,000
350,000
400,000
450,000
500,000
2000 2010 2015 2020 2025 2030
70+
65-69

5
$42,784
$30,388
$0$5,000
$10,000$15,000$20,000$25,000$30,000$35,000$40,000$45,000
Real GSP
Source: U.S. Bureau of Economic Analysis-2012
All StatesWV

6
Seasonally Adjusted Annual Rate
0.5%
-2.0%
-1.0%
0.0%
1.0%
2.0%
3.0%
4.0%
5.0%
6.0%
7.0%
10Q1 10Q3 11Q1 11Q3 12Q1 12Q3 13Q1
Wage & Salary

7
7.5%
6.6%
13.0%15.6%
9.0%
0.0%2.0%4.0%6.0%8.0%
10.0%12.0%14.0%16.0%18.0%
1997 1998 1999 2000 2001 2002 2003 2004 2005 2006 2007 2008 2009 2010 2011 2012
Mining vs Manufacturing Share of Current $ WV GDP
Mining MFG
8
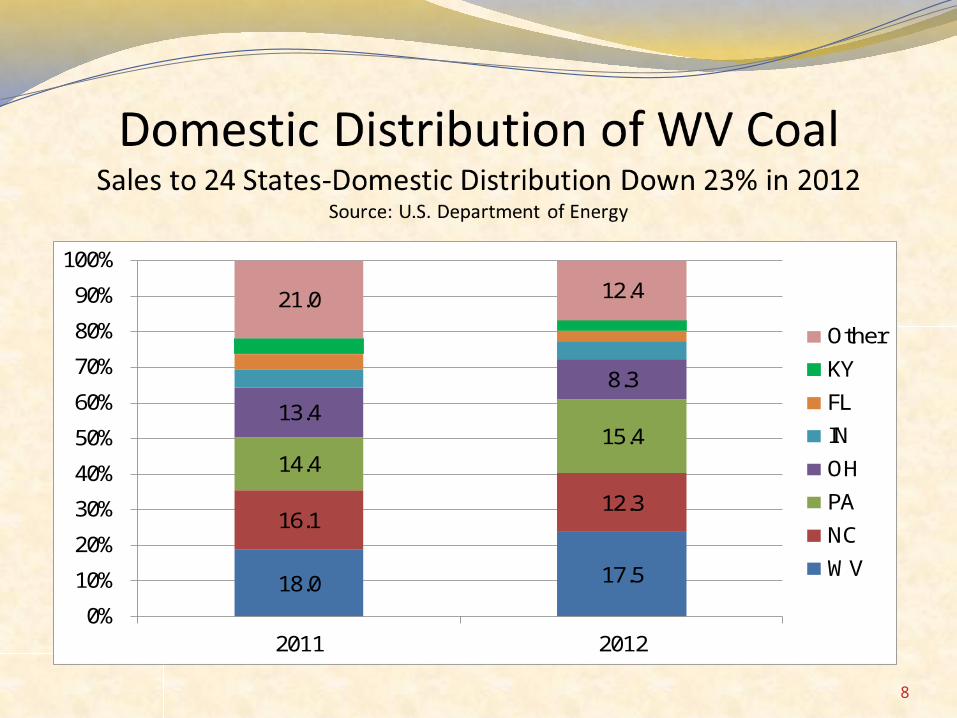
18.0 17.5
21.0 12.4
16.112.3
14.415.4
13.4
8.3
0%
10%
20%
30%
40%
50%
60%
70%
80%
90%
100%
2011 2012
Other
KY
FL
IN
OH
PA
NC
WV

9
93,933 91,123
70,783 80,789 79,000
73,326
- 10,000 20,000 30,000 40,000 50,000 60,000 70,000 80,000 90,000
100,000
Net Generation
Thou
sand
Meg
awatt
-hou
rs
2007
2008
2009
2010
2011
2012
10
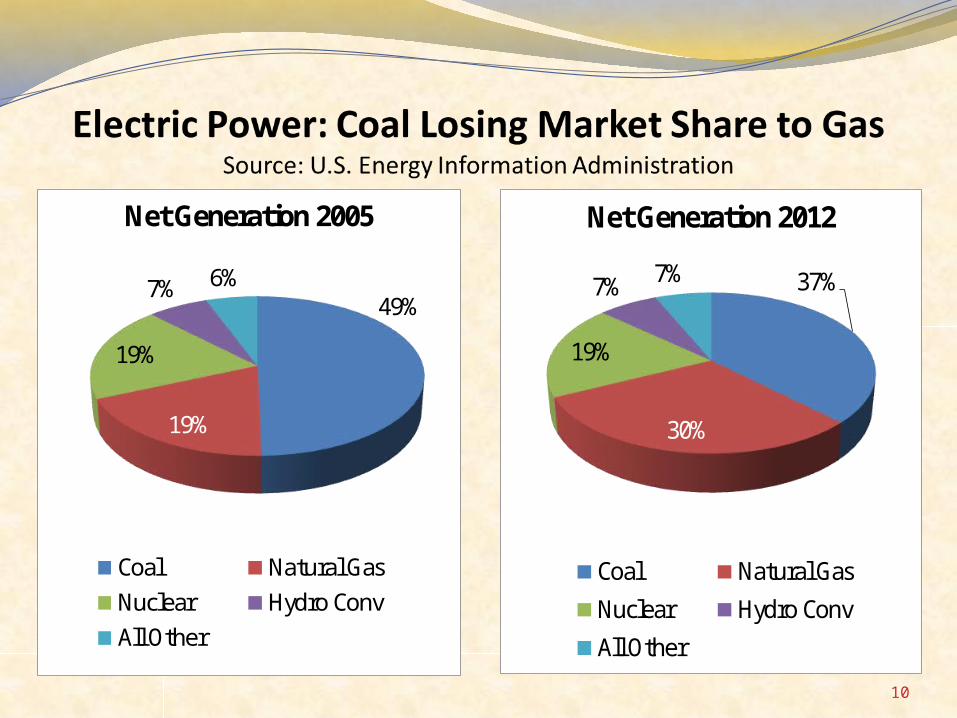
37%
30%
19%
7% 7%
Net Generation 2012
Coal Natural Gas
Nuclear Hydro Conv
All Other
49%
19%
19%
7% 6%
Net Generation 2005
Coal Natural GasNuclear Hydro ConvAll Other

11
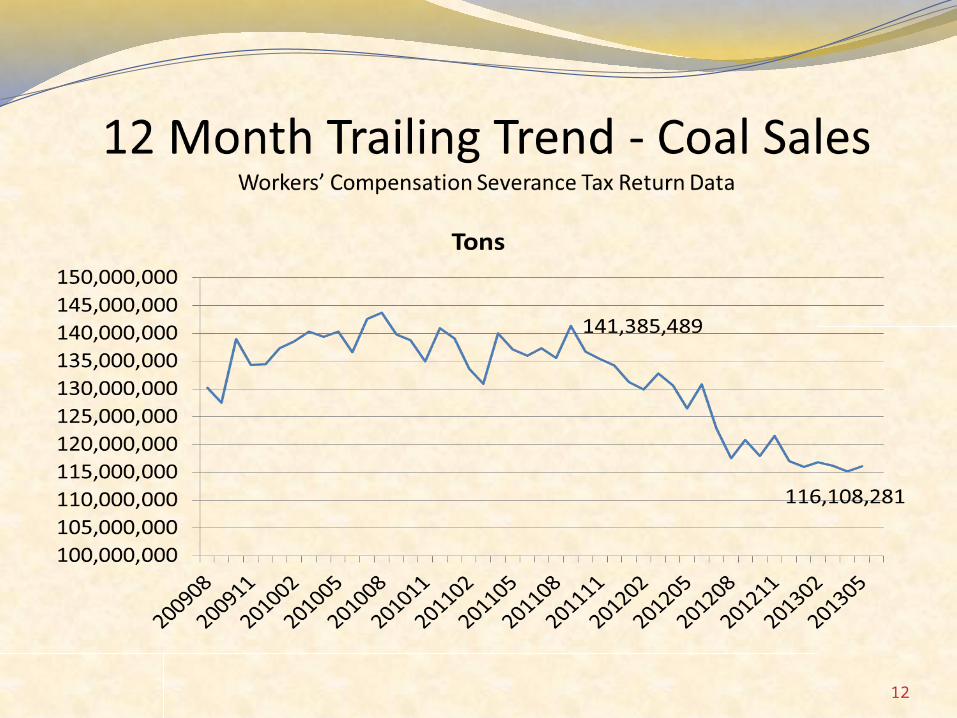
12

13

14
42%
29%
10%
6%2%
11%
General Revenue 2013
PIT Sales & Use
Severance CNIT
Lottery All Other

15
State of West Virginia
General & Lottery Appropriations
% of % of
Department FY 2009 total FY 2014 total
Public Education 1,918,411,298 44.24% 2,075,009,882 46.10%
Health & Human Resources $ 862,091,049 19.88% $ 982,565,987 21.83%
Higher Education 483,015,423 11.14% 483,031,845 10.73%
All Others 1,073,107,891 24.75% 960,888,869 21.35%
Total $ 4,336,625,661 $ 4,501,496,583

16
State Of West Virginia
General & Lottery Revenues
(in millions $)
FY 09 FY 10 FY 11 FY 12 FY 13 FY 14 FY 15 FY 16 FY 17 FY 18
General Actual Actual Actual Actual Actual Budget Estimate Estimate Estimate Estimate
Personal Income Tax 1,558 1,447 1,593 1,689 1,746 1,767 1,872 1,980 2,144 2,241
Sales / Use Tax 1,110 1,096 1,148 1,216 1,193 1,204 1,231 1,256 1,304 1,360
Corporate Net Income 270 233 303 188 238 230 218 209 192 183
Severance Tax 360 400 441 468 410 431 454 440 421 409
All Others 604 582 579 542 517 504 495 525 560 561
total 3,902 3,758 4,064 4,103 4,104 4,136 4,270 4,410 4,621 4,754
% change -3.7% 8.1% 1.0% 0.0% 0.8% 3.2% 3.3% 4.8% 2.9%
Lottery
Racetrack Video 310 275 258 274 230 174 172 172 172 172
Limited Video 206 199 199 265 204 188 188 188 188 188
Traditional Games 41 40 36 46 38 32 32 32 32 32
Table Games 18 17 32 38 34 32 32 32 32 32
total 575 531 525 623 506 426 424 424 424 424
% change -7.7% -1.1% 18.7% -18.8% -15.8% -0.5% 0.0% 0.0% 0.0%
17
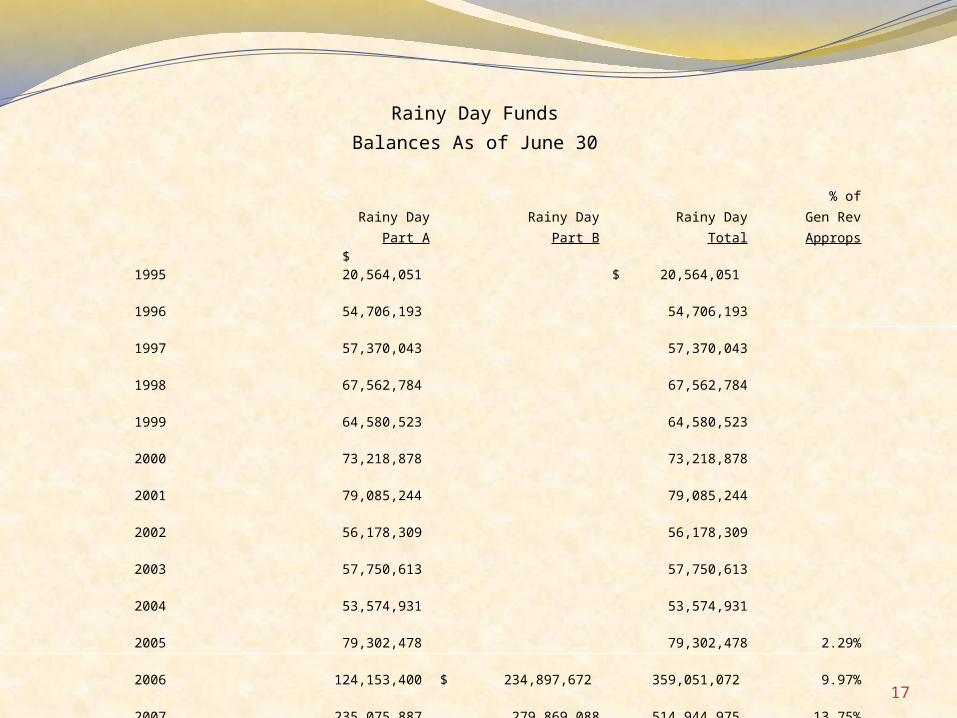
Rainy Day Funds
Balances As of June 30
% of
Rainy Day Rainy Day Rainy Day Gen Rev
Part A Part B Total Approps
1995 $ 20,564,051 $ 20,564,051
1996 54,706,193 54,706,193
1997 57,370,043 57,370,043
1998 67,562,784 67,562,784
1999 64,580,523 64,580,523
2000 73,218,878 73,218,878
2001 79,085,244 79,085,244
2002 56,178,309 56,178,309
2003 57,750,613 57,750,613
2004 53,574,931 53,574,931
2005 79,302,478 79,302,478 2.29%
2006 124,153,400 $ 234,897,672 359,051,072 9.97%
2007 235,075,887 279,869,088 514,944,975 13.75%
2008 289,801,853 291,275,043 581,076,896 14.65%
2009 236,619,573 236,006,003 472,625,575 11.99%
2010 276,949,590 279,073,100 556,022,690 14.65%
2011 342,320,538 316,806,578 659,127,115 17.38%
2012 523,689,609 327,698,977 851,388,585 20.06%
2013 557,992,969 356,472,702 914,465,671 21.09%
Today 552,195,242 348,811,176 901,006,419 21.78%

18
General & Lottery Funds
FY 2015
Summary of Requested 7.5% Budget Cuts
(in $s)
Beginning Excluded
Base from
Department Budget 7.5% cut 7.5% cut
Legislative 24,742,872 24,742,872 0
Judicial 121,511,992 121,511,992 0
Executive 44,348,629 0 3,326,147
Administrative 81,580,118 55,524,381 1,954,180
Commerce 76,737,309 18,067,125 4,400,264
Public Education 2,109,458,877 1,995,102,696 8,576,714
Education & The Arts 51,179,440 14,171,778 2,775,575
Environmental Protection 7,739,841 0 580,488
Health & Human Services 1,085,999,074 920,542,399 12,409,251
Military Affairs & Public Safety 365,876,222 217,641,492 11,117,605
Revenue 39,796,939 12,000,000 2,084,770
Transportation 6,717,821 0 503,837
Veterans' Assistance 11,321,694 6,836,188 336,413
Senior Services 63,049,496 40,736,458 1,673,478
Higher Education 482,429,969 49,000,000 32,507,248
Miscellaneous Boards 66,400,000 66,400,000 0
Total 4,638,890,293 3,542,277,381 82,245,968
19
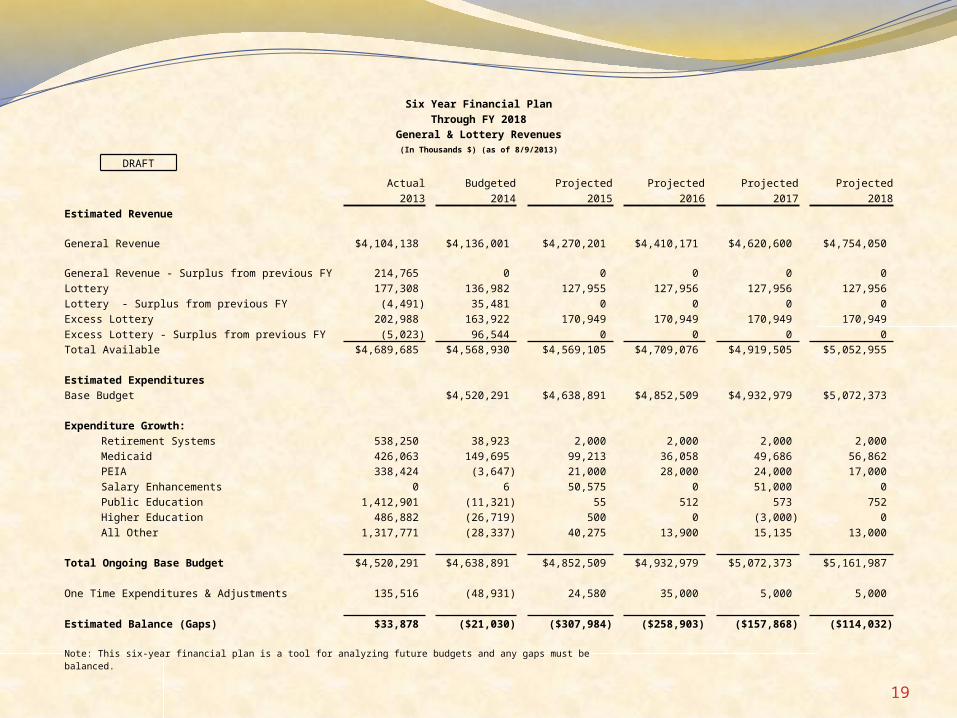
Six Year Financial Plan
Through FY 2018
General & Lottery Revenues(In Thousands $) (as of 8/9/2013)
DRAFT
Actual Budgeted Projected Projected Projected Projected
2013 2014 2015 2016 2017 2018
Estimated Revenue
General Revenue $4,104,138 $4,136,001 $4,270,201 $4,410,171 $4,620,600 $4,754,050
General Revenue - Surplus from previous FY 214,765 0 0 0 0 0
Lottery 177,308 136,982 127,955 127,956 127,956 127,956
Lottery - Surplus from previous FY (4,491) 35,481 0 0 0 0
Excess Lottery 202,988 163,922 170,949 170,949 170,949 170,949
Excess Lottery - Surplus from previous FY (5,023) 96,544 0 0 0 0
Total Available $4,689,685 $4,568,930 $4,569,105 $4,709,076 $4,919,505 $5,052,955
Estimated Expenditures
Base Budget $4,520,291 $4,638,891 $4,852,509 $4,932,979 $5,072,373
Expenditure Growth:
Retirement Systems 538,250 38,923 2,000 2,000 2,000 2,000
Medicaid 426,063 149,695 99,213 36,058 49,686 56,862
PEIA 338,424 (3,647) 21,000 28,000 24,000 17,000
Salary Enhancements 0 6 50,575 0 51,000 0
Public Education 1,412,901 (11,321) 55 512 573 752
Higher Education 486,882 (26,719) 500 0 (3,000) 0
All Other 1,317,771 (28,337) 40,275 13,900 15,135 13,000
Total Ongoing Base Budget $4,520,291 $4,638,891 $4,852,509 $4,932,979 $5,072,373 $5,161,987
One Time Expenditures & Adjustments 135,516 (48,931) 24,580 35,000 5,000 5,000
Estimated Balance (Gaps) $33,878 ($21,030) ($307,984) ($258,903) ($157,868) ($114,032)
Note: This six-year financial plan is a tool for analyzing future budgets and any gaps must be balanced.