Embed Size (px)
Citation preview

West Virginia Broadband Connectivity
Ahmed Saeed, Bao Nguyen, and Peter GardnerGeorge Mason University, Spring 2017
1

Problem Statement and Scope● Rural areas lack high speed internet access● Students, businesses, citizens fall behind● How can we get broadband to the people in these West
Virginia counties?○ Logan and Wyoming○ Previously Mercer and McDowell as well
The goal of this project is to assess the coverage, understand the options, and the tradeoffs between the options, for providing broadband internet access to a key area in southern West Virginia.
2

3

4

5
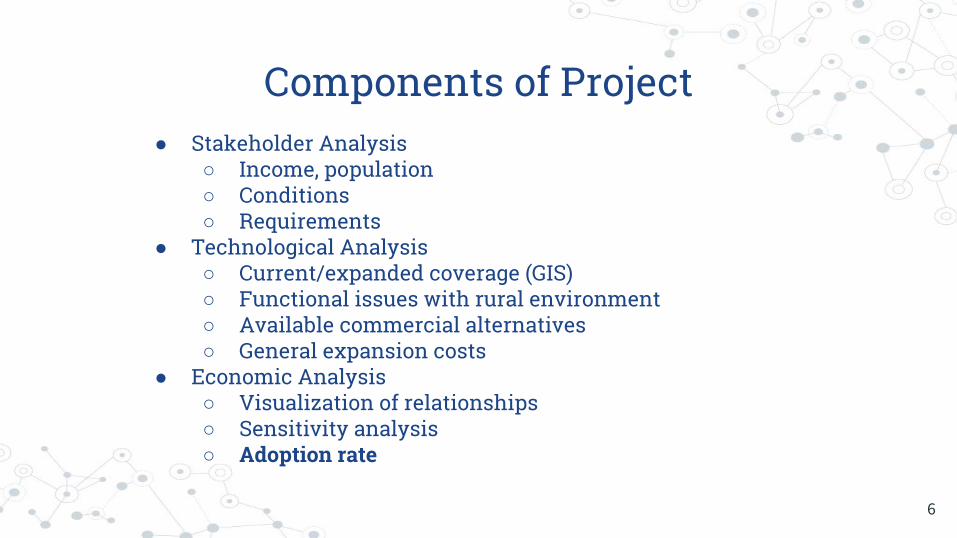
Components of Project● Stakeholder Analysis
○ Income, population○ Conditions○ Requirements
● Technological Analysis○ Current/expanded coverage (GIS)○ Functional issues with rural environment○ Available commercial alternatives○ General expansion costs
● Economic Analysis○ Visualization of relationships○ Sensitivity analysis○ Adoption rate
6

Stakeholders
● Citizens of selected WV counties○ Logan, [McDowell, Mercer,] Wyoming
● Government○ Local, state, federal
● Local internet service providers○ Shentel, Frontier, AT&T, Verizon..
● Project sponsors○ Advancing Appalachia Initiative○ Dr. Michael Hieb○ Shepherd University
7

Citizens of Southern WV Counties
Wyoming County Data
Counties Population
8

Coverage Analysis● GIS (Geographic Information Systems) software
○ QGIS○ ArcGIS
● Goals○ Evaluate current coverage○ Identify gap areas○ Analysis of demographics
● Data○ Main source: GeoTel○ Shentel for wired coverage validation○ FCC and USGS for wireless coverage validation
9
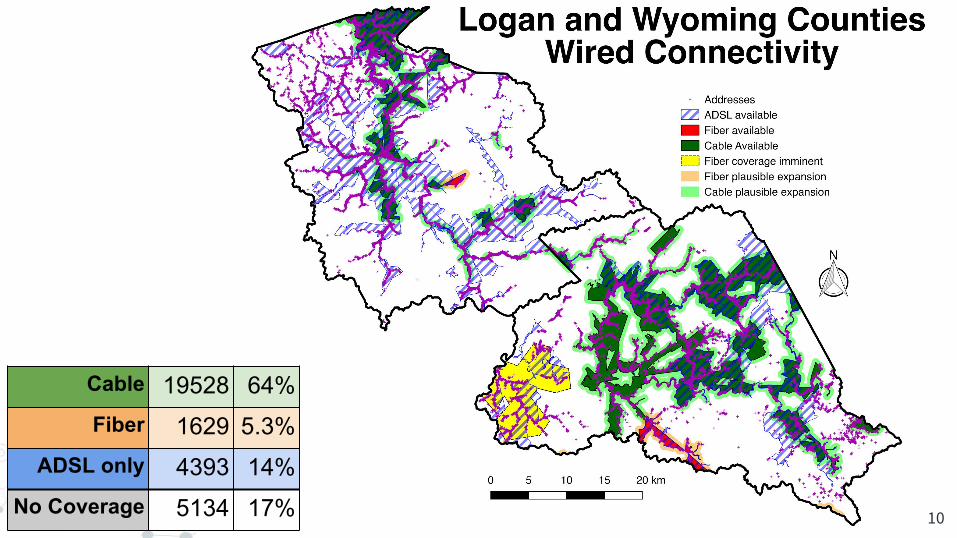
Cable 19528 64%Fiber 1629 5.3%
ADSL only 4393 14%No Coverage 5134 17% 10

AT&T 28121 92%Verizon 6696 22%
US Cellular 27 0.1%WVVA.NET 32 0.1%
No Coverage 2447 8.0% 11

12
Wireless No Wireless
Cable/Fiber 18316 60% 2841 9.3%No Cable/Fiber 8953 29% 574 1.9%
● 89% wireless coverage● 69% cable/fiber coverage● 98% overall broadband
coverage● (ADSL not included)

Available Commercial Alternatives
● Cable/Fiber○ Fast and reliable○ Moderate cost for users○ Costly to expand
● Mobile Wireless○ “Great” coverage○ Dead Zones ○ Moderate cost for users
● (A)DSL○ Relies on phone lines○ Unreliable performance○ Low cost for users○ Not expanding
● Fixed Wireless○ Fast when available○ Requires LOS - Limited coverage
area○ Typically uses unlicensed
spectrum○ Costly to expand
● Satellite○ Wide availability○ Spotty performance○ High latency○ High cost for users
13

Available Alternatives Summary
14
Technology TypeConnection
Type Download Speeds Latency ISP Expansion CostConsumer
Monthly Cost Mbps/$
Dial-up Wired 56 kbps 150 ms Not expanding N/A 0.002
DSL Wired 5-25 Mbps 49 ms Not expanding $30 0.500
Satellite Wireless 3-6 Mbps 670 ms $554/installation $60 0.075
Fixed Wireless Wireless 10-25 Mbps 30 ms $25k-250k/tower $39 0.449
4G Mobile Wireless Wireless 3-25 Mbps 110 ms $200k/tower $71 0.197
Cable Wired 10-50 Mbps 32 ms $75k/mile $60 0.583
Fiber Wired 25-100 Mbps 24 ms $30k/mile $100 0.625Future Options:
Subsidized Low Orbit Satellite (OneWeb/SpaceX)
Wireless 5-50 Mbps 35 ms R&D — 2019+ <$20? 1.375
Balloon Wireless 4G LTE(Google Loon)
Wireless 5-22 Mbps 150 ms R&D — No Est. <$20? 0.550

Tiered Consumer Options
15
Technology Speed Price Time Frame
Short-term Solution DSL/Satellite 5-10 Mbps
DSL - $30-80/monthSatellite -
$80-120/monthAvailable Now
Mid-term Solution Cable/Fiber 5-100 Mbps Cable - $50-80/month
Fiber - $100+/month 1-5 Years
Long-term Solution Subsidized Satellite Up to 50 Mbps Estimated
<$20/month 2-10 Years

Economic Analysis — Methodology
● Adoption Rate shifted focus ● Developed dynamic system model
○ Provides visualization of relationships○ Display effects of broadband adoption on income, population,
and ISP revenue ● Explanation of methodology and procedures
○ Software used○ Variables and links definitions ○ Usage with case studies
● Conduct sensitivity analysis○ Training/education and subsidies
16
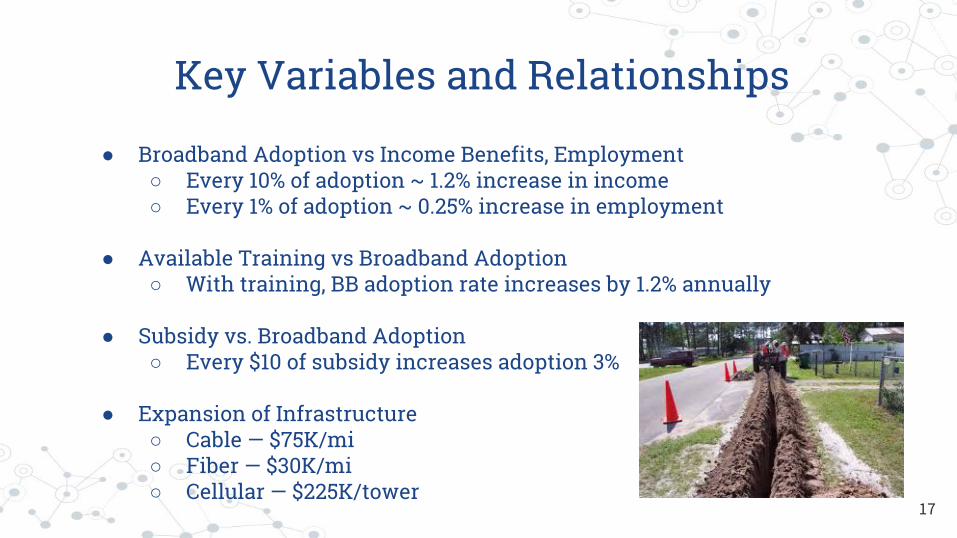
Key Variables and Relationships
● Broadband Adoption vs Income Benefits, Employment○ Every 10% of adoption ~ 1.2% increase in income○ Every 1% of adoption ~ 0.25% increase in employment
● Available Training vs Broadband Adoption○ With training, BB adoption rate increases by 1.2% annually
● Subsidy vs. Broadband Adoption○ Every $10 of subsidy increases adoption 3%
● Expansion of Infrastructure○ Cable — $75K/mi○ Fiber — $30K/mi○ Cellular — $225K/tower
17
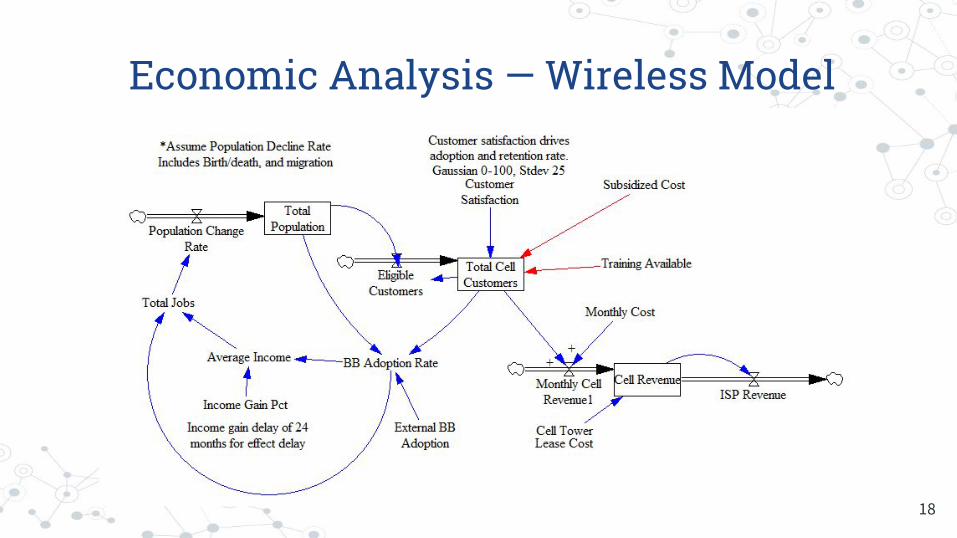
Economic Analysis — Wireless Model
18

Sensitivity Analysis - Wireless expansion
19

Sensitivity Analysis - Wired expansion
20

Model and Results Verification● Compared model outputs for Income and Employment against regression lines of
known linear relationships○ Employment Increase = Adoption Rate(%) x 0.25%○ Income Increase = Adoption Rate(%) x 1.2%
● Reached out to domain experts for comment — Pending● Model results deviated within 4.9% of estimated for Income , <1% – 13% for Jobs
21*Data from Wired Model in Logan County Case Study

Northwest Logan County: Adequate wireless coverageMinimal wired coverage
Huff Creek Valley: No wireless coverageSome wired coverage
22

One existing fiber line: Not currently used for domestic coverage here
Two new wires suggested: Could be either cable or fiber; some overlap
23

Northwest Logan County — Analysis
As is Expanded
Cable/Fiber 0 0% 703 46%
ADSL-only 426 28% 209 14%
No connection 1088 72% 602 40%
24
New wire length (km) 28.22Cost per km $19k
New wire cost $530kPredicted 10-year
revenue$1.6M
Predicted 10-year Adoption Rate
44%

25

26

Huff Creek Valley — Analysis● Connectivity improvement
○ 404 currently without wireless coverage○ 314 (78%) covered by proposed new tower
● Expansion cost○ Tower construction costs $225k
● Revenue○ Model predicts revenue of $1.23M from new tower over the first ten years
27

Wired/Wireless Economic Comparison
Wireless
Wired**
Major note: There are no major areas in the region that lack both wired AND wireless connectivity.We are utilizing a hypothetical area (12 km long) similar to Huff Creek Valley that has neither. 28
Wired Wireless
Population Connected 745 745
Expansion Cost $600k $225k
Adoption Rate 39% 27%
Income Gain(%) 25.0% 21.2%
Revenue $718k $1.23M*Using same demographic information for the region as initial values and controlled variables.
10 Year Results*

Adoption Rate
● Also called “take-up rate”● Does not correspond
directly to availability.
● While most addresses have broadband available, adoption rate remains low.
● District of Columbia - 76%
29
Wyoming Logan Overall
Cable/Fiber Only 22% 0.16% 9.3%
Wireless Only 10% 43% 29%Wireless &
Cable/Fiber67% 55% 60%
Total Connected 98% 98% 98%Adoption rate 33% 14% 22%
Adoption Rate = Number of Users / Population with Access
Adoption rates from Shentel; the exact numbers will vary by ISP.
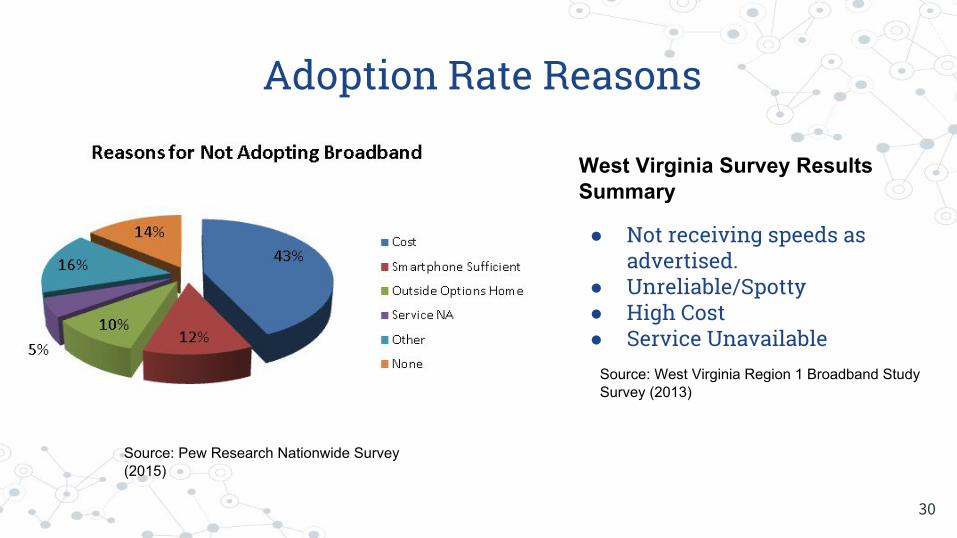
Adoption Rate Reasons
Source: Pew Research Nationwide Survey (2015)
Source: West Virginia Region 1 Broadband Study Survey (2013)
30
● Not receiving speeds as advertised.
● Unreliable/Spotty ● High Cost● Service Unavailable
West Virginia Survey Results Summary

Conclusions/Recommendations● Broadband has the capability to improve the economic conditions of
rural WV● Actual Broadband availability needs improvement for some regions
○ Availability is not the primary driver of low adoption rate○ Continue Cable/Fiber Expansion for higher adoption rate○ Cell yields lower adoption rate but cheaper to implement
● Adoption rate of broadband needs to be addressed○ Training and education
■ Availability of subsidies○ Poor performance of advertised speeds and services○ Price point
31

Future Work● Focus on adoption rate rather than the availability.● Investigate additional subsidies and programs● Continue researching other successful broadband initiatives ● Follow up on emerging technologies
32

Acknowledgements
● George Mason University○ Dr. Michael Hieb○ Dr. Syed Abbas Zaidi○ Dr. Kathryn Laskey○ GIS Department
● Geotel Communications LLC○ Teri Phares○ Andrew Bates○ Eric Cabading
● Shenandoah Telecommunications (Shentel)○ Brith Osinkosky○ Christopher Kyle
33
Questions?
34
Appendix
Extra maps
Key resources or charts
Systems Dynamics model
35

Wired/Wireless Comparison — ISP Revenue
*Using same geographic area to represent the same target population with same initial values
Wireless
Wired
36
Cell Tower Initial Costs = $225KGraph TBD

Northwest Logan County — Analysis
37
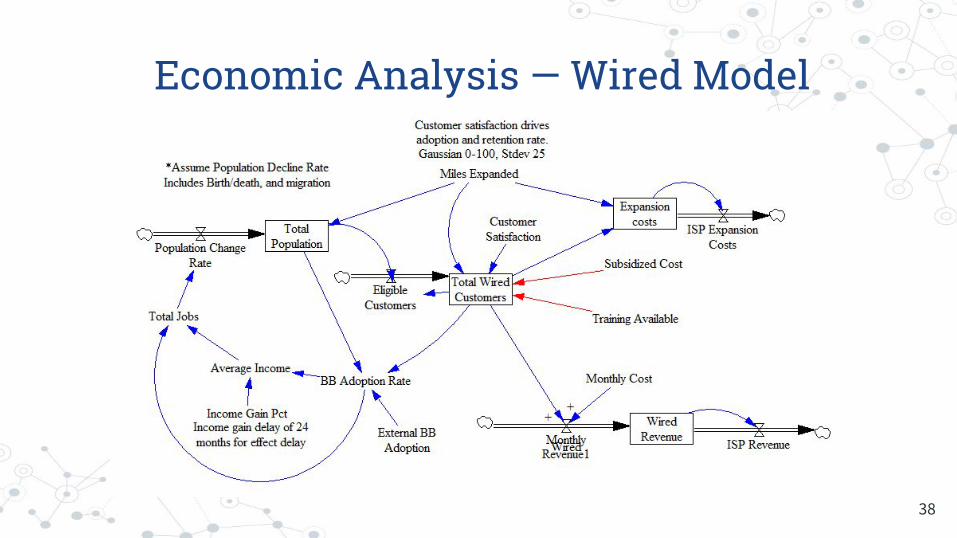
Economic Analysis — Wired Model
38

Coverage Analysis — Wired● Data on coverage area from GeoTel, by
ISP and connection type:○ Coaxial cable○ Fiber○ Asymmetric digital subscriber
line (ADSL) ● Partial data on fiber/cable lines from
Shentel (comparison on right)○ 500-meter buffer around lines for
theoretical coverage area (green)○ Mostly lines up with GeoTel data
(brown and yellow)● 500-meter buffer around GeoTel
polygons for “plausible expansion” 39

Coverage Analysis — Wireless● Main data source: GeoTel
○ Coverage polygons by provider and spectrum (purple transparent polygons, right)
● Data validation:○ Elevation data from USGS○ Cell towers (yellow arrows) from FCC○ Overlapping viewsheds calculated (green)
● Very general correlation, but not usefully close● Complicating factors:
○ Multi-path ○ Vegetation
40
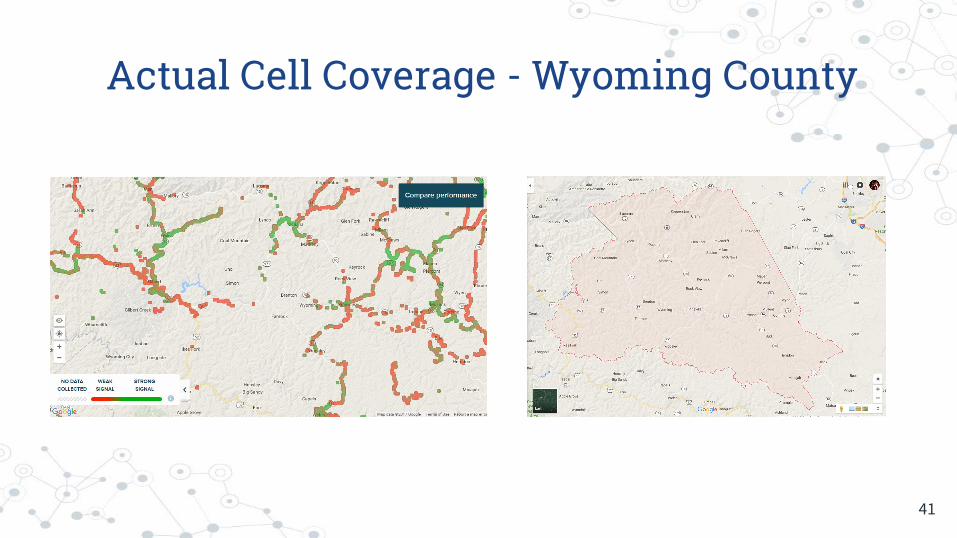
Actual Cell Coverage - Wyoming County
41

Relationship Link ResourcesRelationship between broadband adoption and income http://www.nardep.info/uploads/BroadbandWhitePaper.pdf
https://www.ericsson.com/res/thecompany/docs/corporate-responsibility/2013/impact-of-broadband-speed-on-household-income.pdf
Relationship between broadband adoption and Traininghttps://copp-ommunity.asu.edu/sites/default/files/REVChicagoSmartCommunitiesCHANGE042514-final%20%282%29.pdf
Relationship between broadband adoption and employment rateshttps://www.brookings.edu/wp-content/uploads/2016/06/06labor_crandall.pdf
Relationship between broadband adoption and Costhttps://economix.blogs.nytimes.com/2009/05/22/does-lowering-the-price-of-broadband-increase-its-use/?_r=1
DC BB Adoption Rateshttps://connect.dc.gov/publication/dc-broadband-adoption-rates
42