Embed Size (px)
Citation preview
BULLETINWest Virginia Annual
No. 47
The scale of agriculture in the United States is truly staggering. The food we consume rolls up and down our highways and rail systems on a daily basis. The food we send overseas moves on immense ships.
Even in a small state such as ours, most people would be astounded at the amount of food we consume. In fact, West Virginians eat over $7 billion worth of food each year, and we produce less than $1 billion.
How do we know this? The U.S. Department of Agriculture’s National Agricultural Statistics Service (USDA-NASS).
USDA itself was established by Abraham Lincoln in 1862. He called it “the people’s
Measuring and studying our agricultural output is clearly of great importance.
jeopardizes our food supply and our national security.
During my many years in public service, I have always relied on numbers to help me
as interesting and useful as I do.
Sincerely,
Walt Helmick, West Virginia Commissioner of Agriculture
i

West Virginia
Department of Agriculture
Walt Helmick Chris Ferro Commissioner Chief of Staff
Mike Teets Bob Tabb Director of Eastern Operations Senior Manager
U.S. Department of Agriculture National Agricultural Statistics Service
Hubert Hamer Jay Johnson Administrator Eastern Field Operations Director
West Virginia Field Office
Charmaine Wilson State Statistician
Kathryn Sayre Statistician
Amy Thomas NASDA Coordinator
Taylor Ferrell Statistical Assistant
Jessica Woods NASDA Office Enumerator
Compiled & Edited By Designed By Printed By
West Virginia Field Office WVDA Communications Department WVDA Print Shop
Contact Office: WVDA-Guthrie Center 217 Gus R. Douglass Ln. Building 2, Room 203 Charleston, WV 25312
Mail: 1900 Kanawha Blvd, East Charleston, WV 25305
Tel 304-357-5123 FAX 304-558-0297
www.nass.usda.gov (NASS) www.agriculture.wv.gov (WVDA)
2016 Agricultural Statistics
Eastern Mountain Region David Knopf
Eastern Mountain Regional Director
U.S. Department of Agriculture
National Agricultural Statistics Service
Mission
The National Agricultural Statistics Service provides timely, accurate, and useful statistics in service to U.S. agriculture.
Overview
The USDA's National Agricultural Statistics Service (NASS) conducts hundreds of
surveys every year and prepares reports covering virtually every aspect of U.S.
agriculture. Production and supplies of food and fiber, prices paid and received by
farmers, farm labor and wages, farm finances, chemical use, and changes in the
demographics of U.S. producers are only a few examples.
To uphold our continuing commitment, NASS will:
• Report the facts on American agriculture, facts needed by people working in and
depending upon U.S. agriculture.
• Provide objective and unbiased statistics on a preannounced schedule that is fair
and impartial to all market participants.
• Conduct the Census of Agriculture every five years, providing the only source of
consistent, comparable, and detailed agricultural data for every county in
America.
• Serve the needs of our data users and customers at a local level through our
network of State field offices and our cooperative relationship with universities
and State Departments of Agriculture.
• Safeguard the privacy of farmers, ranchers, and other data providers, with a
guarantee that confidentiality and data security continue to be our top priorities.
West Virginia Department of Agriculture
Mission
The mission of the West Virginia Department of Agriculture is to protect plant, animal and
human health, and the state’s food supply through a variety of scientific and regulatory
programs; to provide vision, strategic planning, and emergency response for agricultural
and other civil emergencies; to promote industrial safety and protect consumers through
educational and regulatory programs; to foster economic growth by promoting West
Virginia agriculture and agribusinesses throughout the state and abroad.
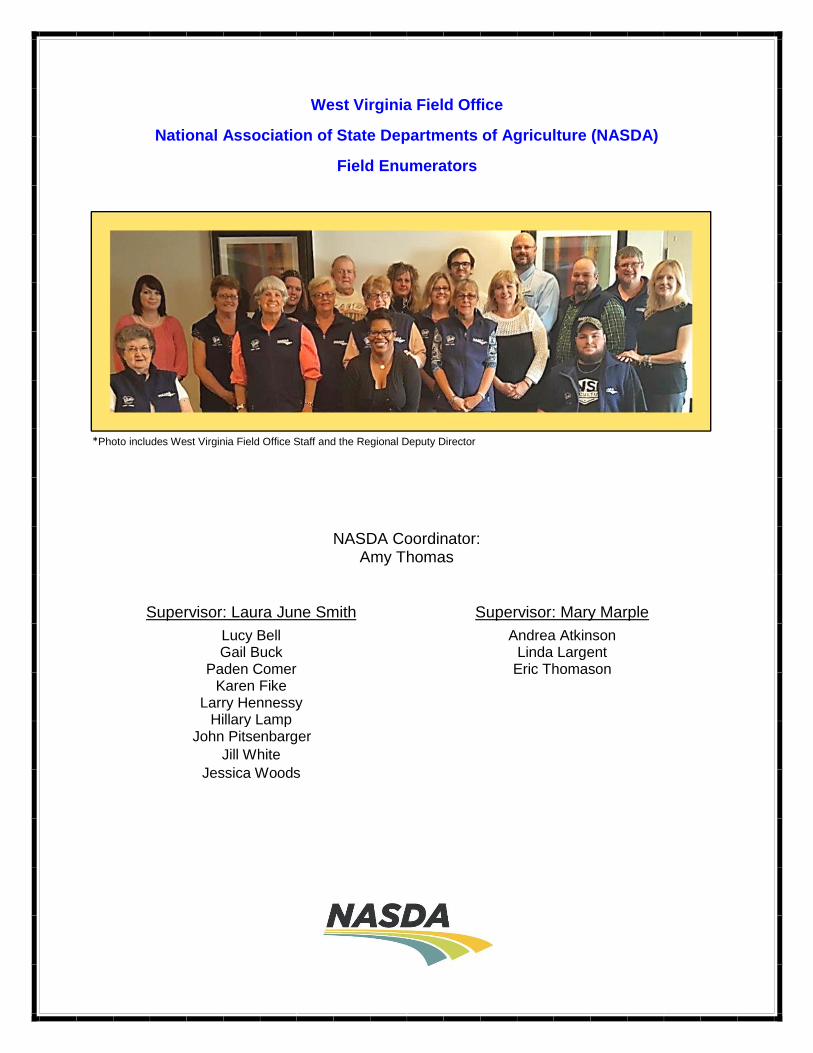
West Virginia Field Office
National Association of State Departments of Agriculture (NASDA)
Field Enumerators
NASDA Coordinator: Amy Thomas
Supervisor: Laura June Smith Supervisor: Mary Marple
Lucy Bell Gail Buck
Andrea Atkinson Linda Largent
Paden Comer Eric Thomason Karen Fike
Larry Hennessy Hillary Lamp
John Pitsenbarger Jill White
Jessica Woods
*Photo includes West Virginia Field Office Staff and the Regional Deputy Director
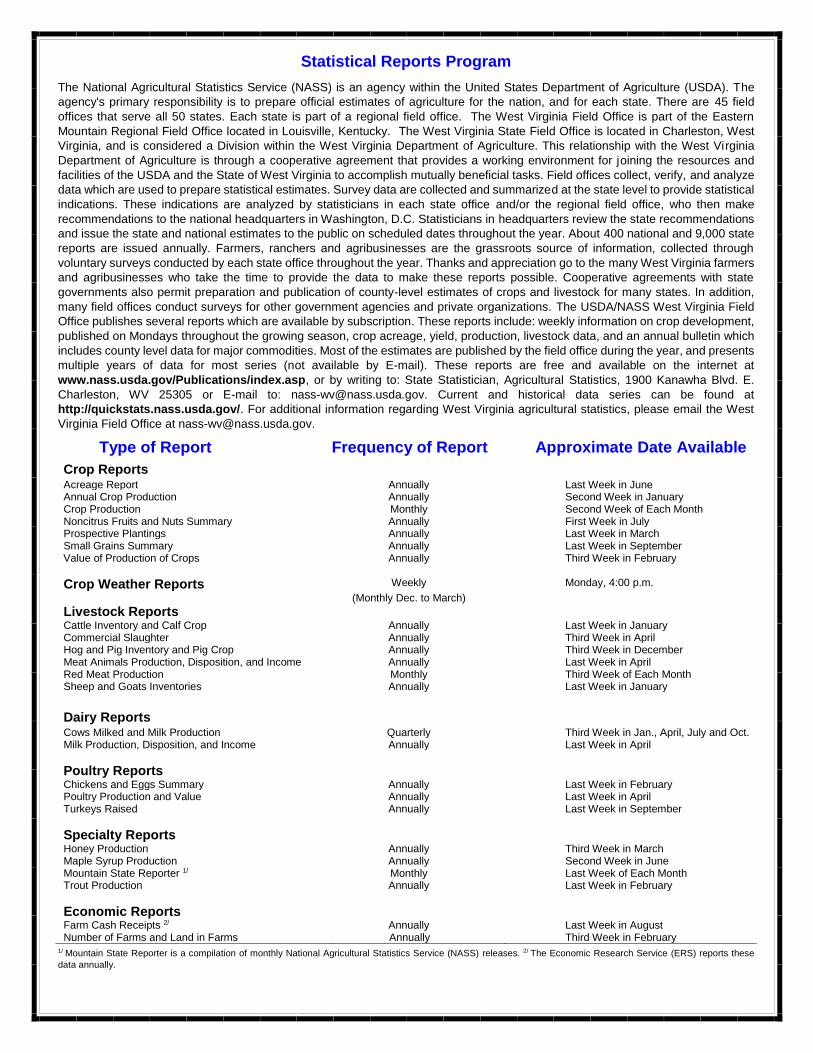
Statistical Reports Program
The National Agricultural Statistics Service (NASS) is an agency within the United States Department of Agriculture (USDA). The
agency's primary responsibility is to prepare official estimates of agriculture for the nation, and for each state. There are 45 field
offices that serve all 50 states. Each state is part of a regional field office. The West Virginia Field Office is part of the Eastern
Mountain Regional Field Office located in Louisville, Kentucky. The West Virginia State Field Office is located in Charleston, West
Virginia, and is considered a Division within the West Virginia Department of Agriculture. This relationship with the West Virginia
Department of Agriculture is through a cooperative agreement that provides a working environment for joining the resources and
facilities of the USDA and the State of West Virginia to accomplish mutually beneficial tasks. Field offices collect, verify, and analyze
data which are used to prepare statistical estimates. Survey data are collected and summarized at the state level to provide statistical
indications. These indications are analyzed by statisticians in each state office and/or the regional field office, who then make
recommendations to the national headquarters in Washington, D.C. Statisticians in headquarters review the state recommendations
and issue the state and national estimates to the public on scheduled dates throughout the year. About 400 national and 9,000 state
reports are issued annually. Farmers, ranchers and agribusinesses are the grassroots source of information, collected through
voluntary surveys conducted by each state office throughout the year. Thanks and appreciation go to the many West Virginia farmers
and agribusinesses who take the time to provide the data to make these reports possible. Cooperative agreements with state
governments also permit preparation and publication of county-level estimates of crops and livestock for many states. In addition,
many field offices conduct surveys for other government agencies and private organizations. The USDA/NASS West Virginia Field
Office publishes several reports which are available by subscription. These reports include: weekly information on crop development,
published on Mondays throughout the growing season, crop acreage, yield, production, livestock data, and an annual bulletin which
includes county level data for major commodities. Most of the estimates are published by the field office during the year, and presents
multiple years of data for most series (not available by E-mail). These reports are free and available on the internet at
www.nass.usda.gov/Publications/index.asp, or by writing to: State Statistician, Agricultural Statistics, 1900 Kanawha Blvd. E.
Charleston, WV 25305 or E-mail to: [email protected]. Current and historical data series can be found at
http://quickstats.nass.usda.gov/. For additional information regarding West Virginia agricultural statistics, please email the West
Virginia Field Office at [email protected].
1/ Mountain State Reporter is a compilation of monthly National Agricultural Statistics Service (NASS) releases. 2/ The Economic Research Service (ERS) reports these
data annually.
Type of Report Frequency of Report Approximate Date Available Crop Reports Acreage Report Annually Last Week in June Annual Crop Production Annually Second Week in January Crop Production Monthly Second Week of Each Month Noncitrus Fruits and Nuts Summary Annually First Week in July Prospective Plantings Annually Last Week in March Small Grains Summary Annually Last Week in September
V Value of Production of Crops Annually Third Week in February
Crop Weather Reports Weekly Monday, 4:00 p.m.
(Monthly Dec. to March)
Livestock Reports
Cattle Inventory and Calf Crop Annually Last Week in January Commercial Slaughter Annually Third Week in April Hog and Pig Inventory and Pig Crop Annually Third Week in December Meat Animals Production, Disposition, and Income Annually Last Week in April Red Meat Production Monthly Third Week of Each Month Sheep and Goats Inventories Annually Last Week in January Dairy Reports Cows Milked and Milk Production Quarterly Third Week in Jan., April, July and Oct. Milk Production, Disposition, and Income Annually Last Week in April
Poultry Reports
Chickens and Eggs Summary Annually Last Week in February Poultry Production and Value Annually Last Week in April Turkeys Raised Annually Last Week in September
Specialty Reports
Honey Production Annually Third Week in March Maple Syrup Production Annually Second Week in June Mountain State Reporter 1/ Monthly Last Week of Each Month Trout Production Annually Last Week in February
Economic Reports
Farm Cash Receipts 2/ Annually Last Week in August Number of Farms and Land in Farms Annually Third Week in February
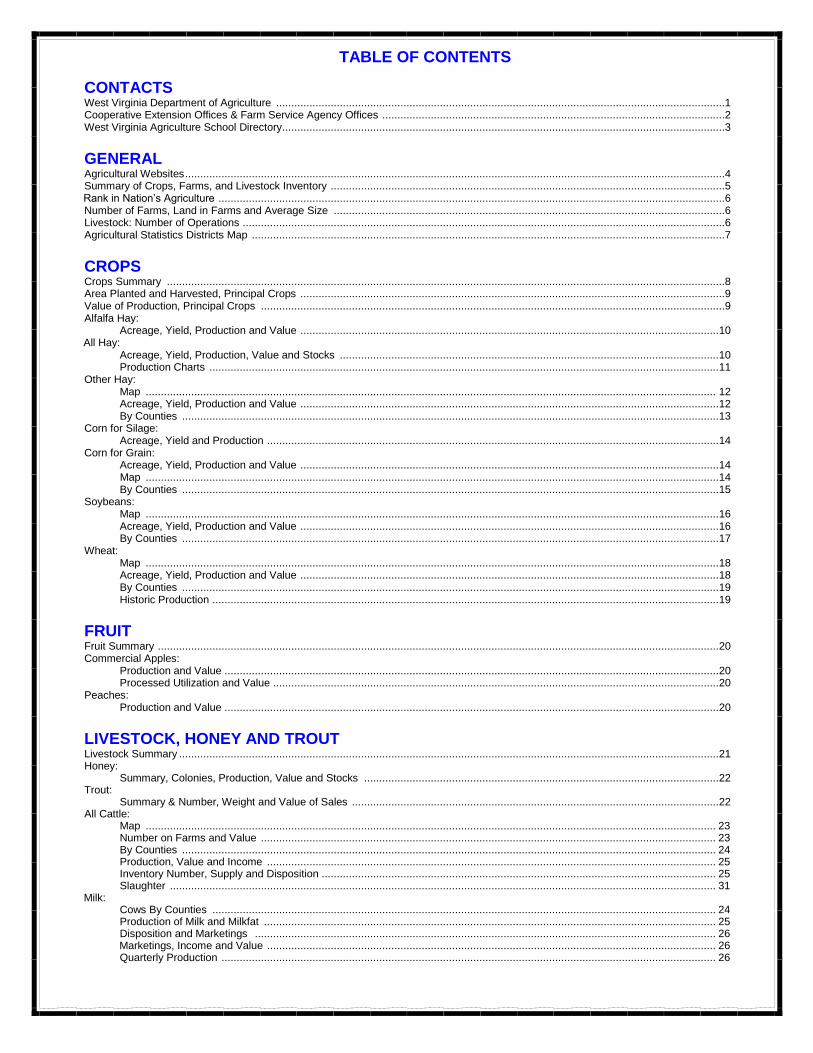
TABLE OF CONTENTS
CONTACTS West Virginia Department of Agriculture ....................................................................................................................................................1 Cooperative Extension Offices & Farm Service Agency Offices .................................................................................................................2 West Virginia Agriculture School Directory ..................................................................................................................................................3
GENERAL
Agricultural Websites ..................................................................................................................................................................................4 Summary of Crops, Farms, and Livestock Inventory ..................................................................................................................................5
Rank in Nation’s Agriculture .......................................................................................................................................................................6 Number of Farms, Land in Farms and Average Size .................................................................................................................................6 Livestock: Number of Operations ...............................................................................................................................................................6 Agricultural Statistics Districts Map ............................................................................................................................................................7
CROPS
Crops Summary ........................................................................................................................................................................................8 Area Planted and Harvested, Principal Crops ............................................................................................................................................9 Value of Production, Principal Crops .........................................................................................................................................................9 Alfalfa Hay: Acreage, Yield, Production and Value .......................................................................................................................................... 10
All Hay: Acreage, Yield, Production, Value and Stocks ............................................................................................................................. 10 Production Charts ........................................................................................................................................................................ 11 Other Hay: Map ............................................................................................................................................................................................ 12 Acreage, Yield, Production and Value .......................................................................................................................................... 12 By Counties ................................................................................................................................................................................. 13 Corn for Silage: Acreage, Yield and Production ..................................................................................................................................................... 14 Corn for Grain: Acreage, Yield, Production and Value .......................................................................................................................................... 14 Map ............................................................................................................................................................................................. 14 By Counties ................................................................................................................................................................................. 15 Soybeans: Map ............................................................................................................................................................................................. 16 Acreage, Yield, Production and Value .......................................................................................................................................... 16 By Counties ................................................................................................................................................................................. 17 Wheat: Map ............................................................................................................................................................................................. 18 Acreage, Yield, Production and Value .......................................................................................................................................... 18 By Counties ................................................................................................................................................................................. 19 Historic Production ....................................................................................................................................................................... 19
FRUIT
Fruit Summary ......................................................................................................................................................................................... 20 Commercial Apples: Production and Value ................................................................................................................................................................... 20 Processed Utilization and Value ................................................................................................................................................... 20 Peaches: Production and Value ................................................................................................................................................................... 20
LIVESTOCK, HONEY AND TROUT
Livestock Summary .................................................................................................................................................................................. 21 Honey: Summary, Colonies, Production, Value and Stocks ..................................................................................................................... 22 Trout: Summary & Number, Weight and Value of Sales ......................................................................................................................... 22 All Cattle: Map ............................................................................................................................................................................................ 23 Number on Farms and Value ...................................................................................................................................................... 23 By Counties ................................................................................................................................................................................ 24 Production, Value and Income .................................................................................................................................................... 25 Inventory Number, Supply and Disposition .................................................................................................................................. 25 Slaughter .................................................................................................................................................................................... 31 Milk: Cows By Counties ...................................................................................................................................................................... 24 Production of Milk and Milkfat ..................................................................................................................................................... 25 Disposition and Marketings ........................................................................................................................................................ 26 Marketings, Income and Value .................................................................................................................................................... 26 Quarterly Production ................................................................................................................................................................... 26
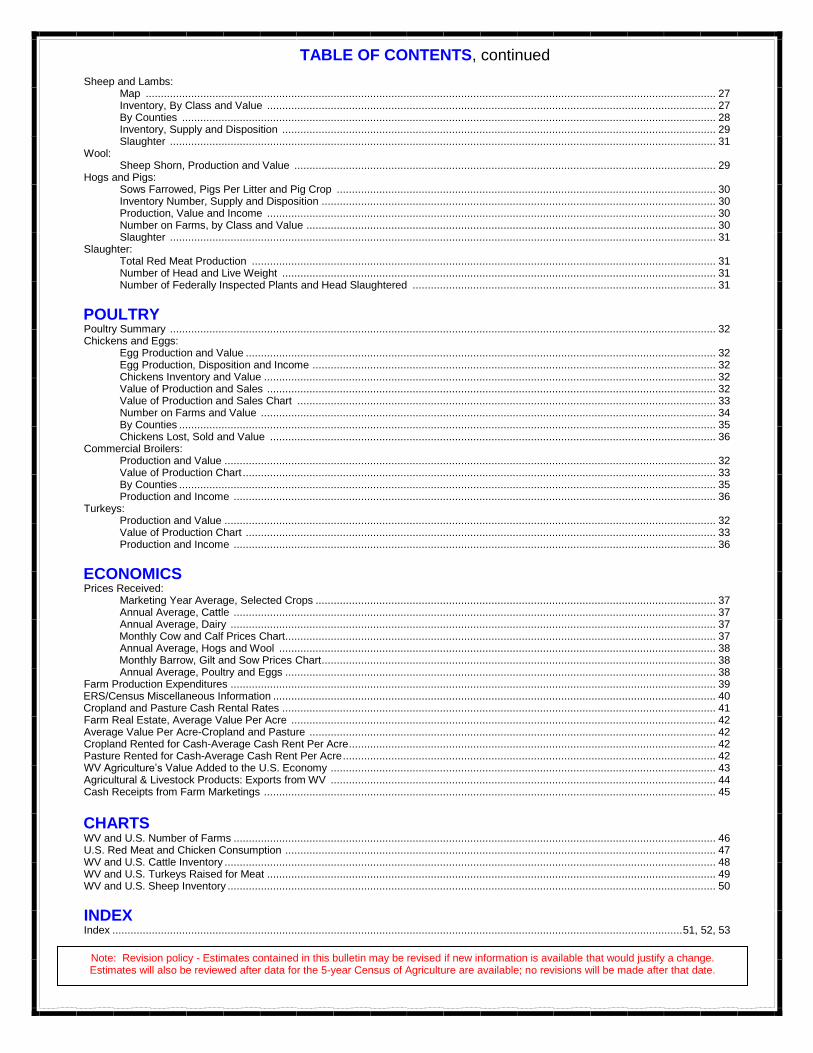
TABLE OF CONTENTS, continued
Sheep and Lambs: Map ............................................................................................................................................................................................ 27 Inventory, By Class and Value .................................................................................................................................................... 27 By Counties ................................................................................................................................................................................ 28 Inventory, Supply and Disposition ............................................................................................................................................... 29 Slaughter .................................................................................................................................................................................... 31 Wool: Sheep Shorn, Production and Value ........................................................................................................................................... 29 Hogs and Pigs: Sows Farrowed, Pigs Per Litter and Pig Crop ............................................................................................................................. 30 Inventory Number, Supply and Disposition .................................................................................................................................. 30 Production, Value and Income .................................................................................................................................................... 30 Number on Farms, by Class and Value ....................................................................................................................................... 30 Slaughter .................................................................................................................................................................................... 31 Slaughter: Total Red Meat Production ......................................................................................................................................................... 31 Number of Head and Live Weight ............................................................................................................................................... 31 Number of Federally Inspected Plants and Head Slaughtered .................................................................................................... 31
POULTRY Poultry Summary .................................................................................................................................................................................... 32 Chickens and Eggs: Egg Production and Value ........................................................................................................................................................... 32 Egg Production, Disposition and Income ..................................................................................................................................... 32 Chickens Inventory and Value ..................................................................................................................................................... 32 Value of Production and Sales .................................................................................................................................................... 32 Value of Production and Sales Chart .......................................................................................................................................... 33 Number on Farms and Value ...................................................................................................................................................... 34 By Counties ................................................................................................................................................................................. 35 Chickens Lost, Sold and Value ................................................................................................................................................... 36 Commercial Broilers: Production and Value .................................................................................................................................................................. 32 Value of Production Chart ............................................................................................................................................................ 33 By Counties ................................................................................................................................................................................. 35 Production and Income ............................................................................................................................................................... 36 Turkeys:
Production and Value .................................................................................................................................................................. 32 Value of Production Chart ........................................................................................................................................................... 33 Production and Income ............................................................................................................................................................... 36
ECONOMICS Prices Received: Marketing Year Average, Selected Crops .................................................................................................................................... 37 Annual Average, Cattle ............................................................................................................................................................... 37 Annual Average, Dairy ................................................................................................................................................................ 37 Monthly Cow and Calf Prices Chart .............................................................................................................................................. 37 Annual Average, Hogs and Wool ................................................................................................................................................ 38 Monthly Barrow, Gilt and Sow Prices Chart .................................................................................................................................. 38 Annual Average, Poultry and Eggs .............................................................................................................................................. 38 Farm Production Expenditures ................................................................................................................................................................ 39
ERS/Census Miscellaneous Information .................................................................................................................................................. 40 Cropland and Pasture Cash Rental Rates ............................................................................................................................................... 41
Farm Real Estate, Average Value Per Acre ............................................................................................................................................ 42 Average Value Per Acre-Cropland and Pasture ...................................................................................................................................... 42 Cropland Rented for Cash-Average Cash Rent Per Acre ......................................................................................................................... 42 Pasture Rented for Cash-Average Cash Rent Per Acre ........................................................................................................................... 42 WV Agriculture’s Value Added to the U.S. Economy ............................................................................................................................... 43 Agricultural & Livestock Products: Exports from WV ............................................................................................................................... 44 Cash Receipts from Farm Marketings ..................................................................................................................................................... 45
CHARTS
WV and U.S. Number of Farms ............................................................................................................................................................... 46 U.S. Red Meat and Chicken Consumption .............................................................................................................................................. 47 WV and U.S. Cattle Inventory .................................................................................................................................................................. 48 WV and U.S. Turkeys Raised for Meat .................................................................................................................................................... 49 WV and U.S. Sheep Inventory ................................................................................................................................................................. 50
INDEX Index ............................................................................................................................................................................................ 51, 52, 53
Note: Revision policy - Estimates contained in this bulletin may be revised if new information is available that would justify a change. Estimates will also be reviewed after data for the 5-year Census of Agriculture are available; no revisions will be made after that date.
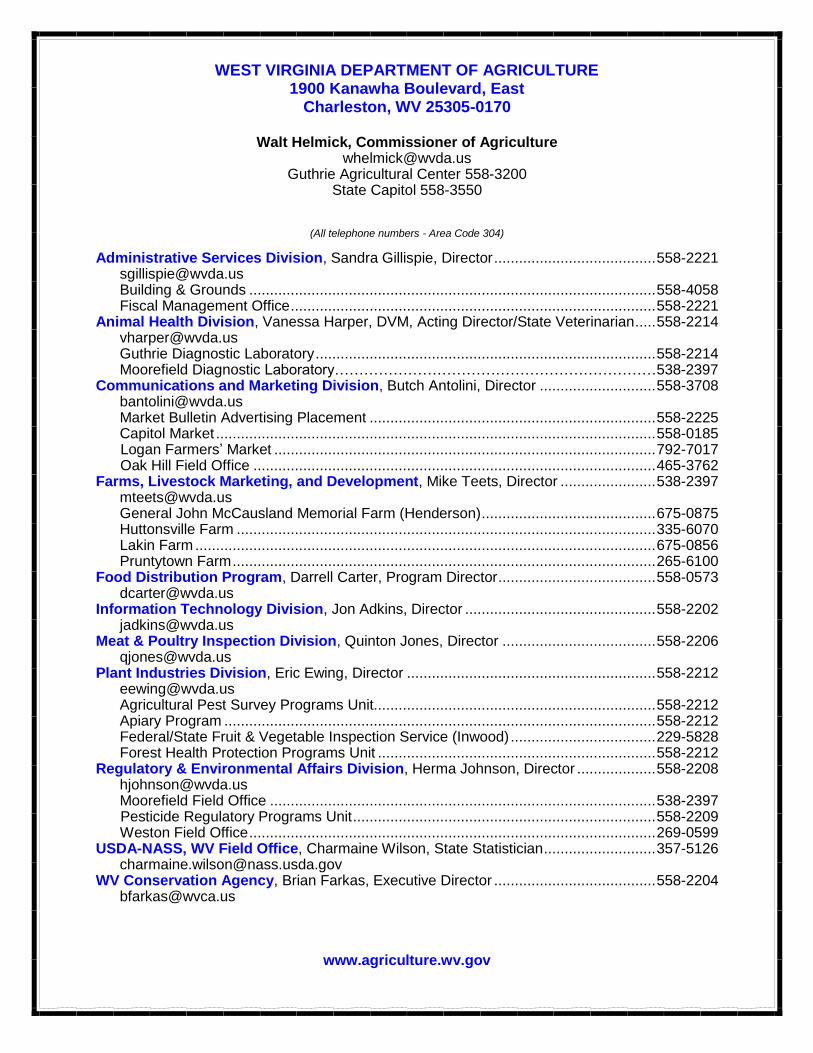
WEST VIRGINIA DEPARTMENT OF AGRICULTURE
1900 Kanawha Boulevard, East Charleston, WV 25305-0170
Walt Helmick, Commissioner of Agriculture
[email protected] Guthrie Agricultural Center 558-3200
State Capitol 558-3550
(All telephone numbers - Area Code 304)
Administrative Services Division, Sandra Gillispie, Director ....................................... 558-2221 [email protected] Building & Grounds .................................................................................................. 558-4058 Fiscal Management Office ........................................................................................ 558-2221 Animal Health Division, Vanessa Harper, DVM, Acting Director/State Veterinarian ..... 558-2214 [email protected] Guthrie Diagnostic Laboratory .................................................................................. 558-2214 Moorefield Diagnostic Laboratory…………………………………………………………538-2397 Communications and Marketing Division, Butch Antolini, Director ............................ 558-3708 [email protected] Market Bulletin Advertising Placement ..................................................................... 558-2225 Capitol Market .......................................................................................................... 558-0185 Logan Farmers’ Market ............................................................................................ 792-7017 Oak Hill Field Office ................................................................................................. 465-3762 Farms, Livestock Marketing, and Development, Mike Teets, Director ....................... 538-2397 [email protected] General John McCausland Memorial Farm (Henderson) .......................................... 675-0875 Huttonsville Farm ..................................................................................................... 335-6070 Lakin Farm ............................................................................................................... 675-0856 Pruntytown Farm ...................................................................................................... 265-6100 Food Distribution Program, Darrell Carter, Program Director ...................................... 558-0573 [email protected] Information Technology Division, Jon Adkins, Director .............................................. 558-2202 [email protected] Meat & Poultry Inspection Division, Quinton Jones, Director ..................................... 558-2206 [email protected] Plant Industries Division, Eric Ewing, Director ............................................................ 558-2212 [email protected] Agricultural Pest Survey Programs Unit.................................................................... 558-2212 Apiary Program ........................................................................................................ 558-2212 Federal/State Fruit & Vegetable Inspection Service (Inwood) ................................... 229-5828 Forest Health Protection Programs Unit ................................................................... 558-2212 Regulatory & Environmental Affairs Division, Herma Johnson, Director ................... 558-2208 [email protected] Moorefield Field Office ............................................................................................. 538-2397 Pesticide Regulatory Programs Unit ......................................................................... 558-2209 Weston Field Office .................................................................................................. 269-0599USDA-NASS, WV Field Office, Charmaine Wilson, State Statistician ........................... 357-5126 [email protected] WV Conservation Agency, Brian Farkas, Executive Director ....................................... 558-2204 [email protected]
www.agriculture.wv.gov
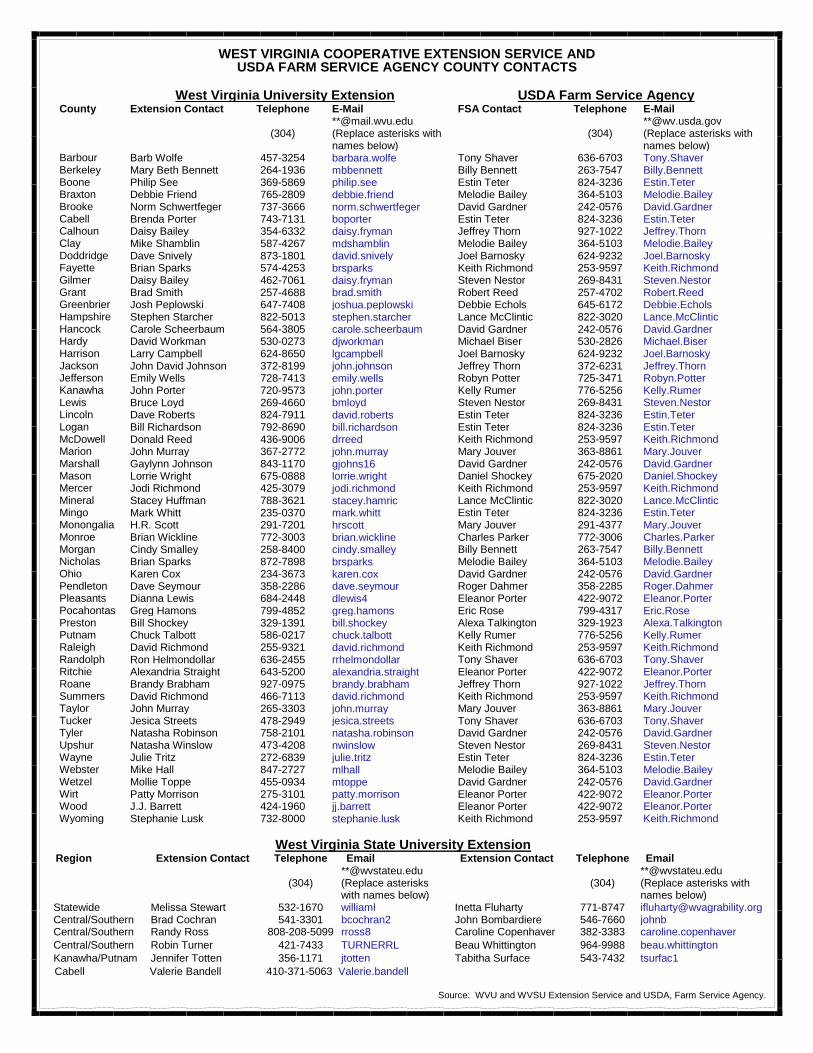
WEST VIRGINIA COOPERATIVE EXTENSION SERVICE AND USDA FARM SERVICE AGENCY COUNTY CONTACTS
West Virginia University Extension USDA Farm Service Agency
County Extension Contact Telephone E-Mail FSA Contact Telephone E-Mail
(304) **@mail.wvu.edu (Replace asterisks with names below)
(304)
**@wv.usda.gov (Replace asterisks with names below)
Barbour Barb Wolfe 457-3254 barbara.wolfe Tony Shaver 636-6703 Tony.Shaver Berkeley Mary Beth Bennett 264-1936 mbbennett Billy Bennett 263-7547 Billy.Bennett Boone Philip See 369-5869 philip.see Estin Teter 824-3236 Estin.Teter Braxton Debbie Friend 765-2809 debbie.friend Melodie Bailey 364-5103 Melodie.Bailey Brooke Norm Schwertfeger 737-3666 norm.schwertfeger David Gardner 242-0576 David.Gardner Cabell Brenda Porter 743-7131 boporter Estin Teter 824-3236 Estin.Teter Calhoun Daisy Bailey 354-6332 daisy.fryman Jeffrey Thorn 927-1022 Jeffrey.Thorn Clay Mike Shamblin 587-4267 mdshamblin Melodie Bailey 364-5103 Melodie.Bailey Doddridge Dave Snively 873-1801 david.snively Joel Barnosky 624-9232 Joel.Barnosky Fayette Brian Sparks 574-4253 brsparks Keith Richmond 253-9597 Keith.Richmond Gilmer Daisy Bailey 462-7061 daisy.fryman Steven Nestor 269-8431 Steven.Nestor Grant Brad Smith 257-4688 brad.smith Robert Reed 257-4702 Robert.Reed Greenbrier Josh Peplowski 647-7408 joshua.peplowski Debbie Echols 645-6172 Debbie.Echols Hampshire Stephen Starcher 822-5013 stephen.starcher Lance McClintic 822-3020 Lance.McClintic Hancock Carole Scheerbaum 564-3805 carole.scheerbaum David Gardner 242-0576 David.Gardner Hardy David Workman 530-0273 djworkman Michael Biser 530-2826 Michael.Biser Harrison Larry Campbell 624-8650 lgcampbell Joel Barnosky 624-9232 Joel.Barnosky Jackson John David Johnson 372-8199 john.johnson Jeffrey Thorn 372-6231 Jeffrey.Thorn Jefferson Emily Wells 728-7413 emily.wells Robyn Potter 725-3471 Robyn.Potter Kanawha John Porter 720-9573 john.porter Kelly Rumer 776-5256 Kelly.Rumer Lewis Bruce Loyd 269-4660 bmloyd Steven Nestor 269-8431 Steven.Nestor Lincoln Dave Roberts 824-7911 david.roberts Estin Teter 824-3236 Estin.Teter Logan Bill Richardson 792-8690 bill.richardson Estin Teter 824-3236 Estin.Teter McDowell Donald Reed 436-9006 drreed Keith Richmond 253-9597 Keith.Richmond Marion John Murray 367-2772 john.murray Mary Jouver 363-8861 Mary.Jouver Marshall Gaylynn Johnson 843-1170 gjohns16 David Gardner 242-0576 David.Gardner Mason Lorrie Wright 675-0888 lorrie.wright Daniel Shockey 675-2020 Daniel.Shockey Mercer Jodi Richmond 425-3079 jodi.richmond Keith Richmond 253-9597 Keith.Richmond Mineral Stacey Huffman 788-3621 stacey.hamric Lance McClintic 822-3020 Lance.McClintic Mingo Mark Whitt 235-0370 mark.whitt Estin Teter 824-3236 Estin.Teter Monongalia H.R. Scott 291-7201 hrscott Mary Jouver 291-4377 Mary.Jouver Monroe Brian Wickline 772-3003 brian.wickline Charles Parker 772-3006 Charles.Parker Morgan Cindy Smalley 258-8400 cindy.smalley Billy Bennett 263-7547 Billy.Bennett Nicholas Brian Sparks 872-7898 brsparks Melodie Bailey 364-5103 Melodie.Bailey Ohio Karen Cox 234-3673 karen.cox David Gardner 242-0576 David.Gardner Pendleton Dave Seymour 358-2286 dave.seymour Roger Dahmer 358-2285 Roger.Dahmer Pleasants Dianna Lewis 684-2448 dlewis4 Eleanor Porter 422-9072 Eleanor.Porter Pocahontas Greg Hamons 799-4852 greg.hamons Eric Rose 799-4317 Eric.Rose Preston Bill Shockey 329-1391 bill.shockey Alexa Talkington 329-1923 Alexa.Talkington Putnam Chuck Talbott 586-0217 chuck.talbott Kelly Rumer 776-5256 Kelly.Rumer Raleigh David Richmond 255-9321 david.richmond Keith Richmond 253-9597 Keith.Richmond Randolph Ron Helmondollar 636-2455 rrhelmondollar Tony Shaver 636-6703 Tony.Shaver Ritchie Alexandria Straight 643-5200 alexandria.straight Eleanor Porter 422-9072 Eleanor.Porter Roane Brandy Brabham 927-0975 brandy.brabham Jeffrey Thorn 927-1022 Jeffrey.Thorn Summers David Richmond 466-7113 david.richmond Keith Richmond 253-9597 Keith.Richmond Taylor John Murray 265-3303 john.murray Mary Jouver 363-8861 Mary.Jouver Tucker Jesica Streets 478-2949 jesica.streets Tony Shaver 636-6703 Tony.Shaver Tyler Natasha Robinson 758-2101 natasha.robinson David Gardner 242-0576 David.Gardner Upshur Natasha Winslow 473-4208 nwinslow Steven Nestor 269-8431 Steven.Nestor Wayne Julie Tritz 272-6839 julie.tritz Estin Teter 824-3236 Estin.Teter Webster Mike Hall 847-2727 mlhall Melodie Bailey 364-5103 Melodie.Bailey Wetzel Mollie Toppe 455-0934 mtoppe David Gardner 242-0576 David.Gardner Wirt Patty Morrison 275-3101 patty.morrison Eleanor Porter 422-9072 Eleanor.Porter Wood J.J. Barrett 424-1960 jj.barrett Eleanor Porter 422-9072 Eleanor.Porter Wyoming Stephanie Lusk 732-8000 stephanie.lusk Keith Richmond 253-9597 Keith.Richmond
West Virginia State University Extension Region Extension Contact Telephone Email Extension Contact Telephone Email
(304)
**@wvstateu.edu (Replace asterisks with names below)
(304)
**@wvstateu.edu (Replace asterisks with names below)
Statewide Melissa Stewart 532-1670 williaml Inetta Fluharty 771-8747 [email protected] Central/Southern Brad Cochran 541-3301 bcochran2 John Bombardiere 546-7660 johnb Central/Southern Randy Ross 808-208-5099 rross8 Caroline Copenhaver 382-3383 caroline.copenhaver
Central/Southern Robin Turner 421-7433 TURNERRL Beau Whittington 964-9988 beau.whittington
Kanawha/Putnam Jennifer Totten 356-1171 jtotten Tabitha Surface 543-7432 tsurfac1
Cabell Valerie Bandell 410-371-5063 Valerie.bandell
Source: WVU and WVSU Extension Service and USDA, Farm Service Agency.
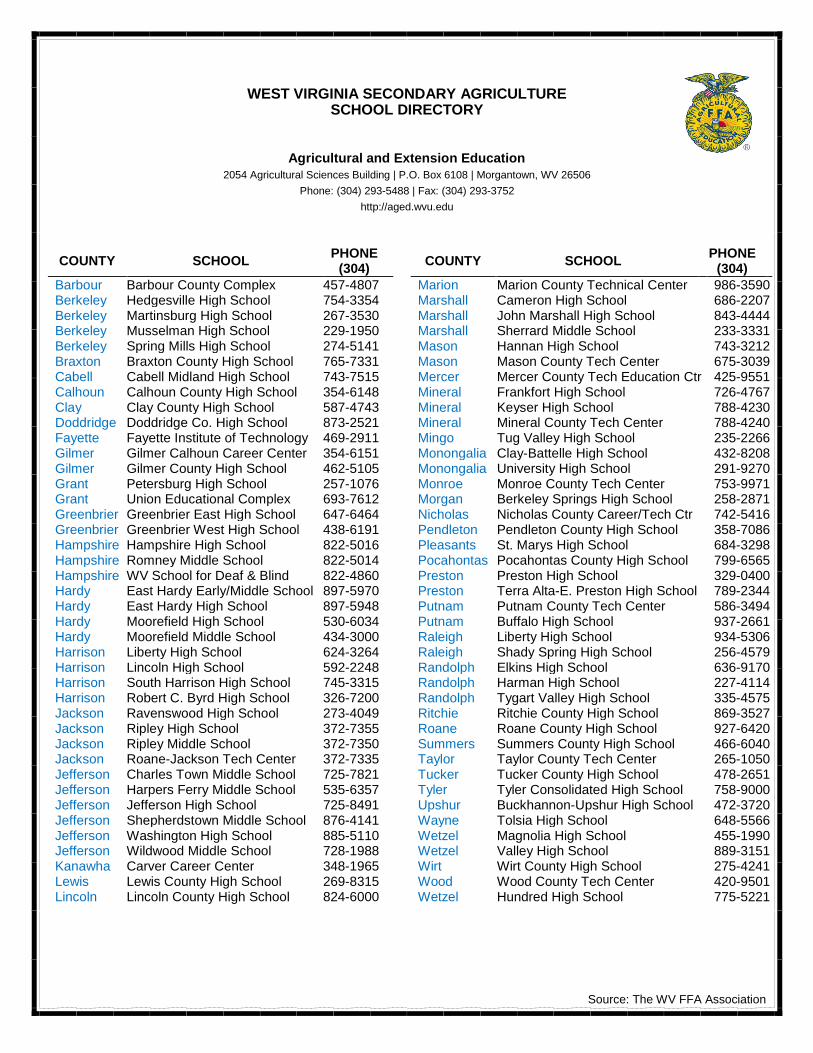
Source: The WV FFA Association
WEST VIRGINIA SECONDARY AGRICULTURE SCHOOL DIRECTORY
Agricultural and Extension Education
2054 Agricultural Sciences Building | P.O. Box 6108 | Morgantown, WV 26506
Phone: (304) 293-5488 | Fax: (304) 293-3752
http://aged.wvu.edu
COUNTY SCHOOL PHONE
(304) COUNTY SCHOOL
PHONE (304)
Barbour Barbour County Complex 457-4807 Marion Marion County Technical Center 986-3590 Berkeley Hedgesville High School 754-3354 Marshall Cameron High School 686-2207 Berkeley Martinsburg High School 267-3530 Marshall John Marshall High School 843-4444 Berkeley Musselman High School 229-1950 Marshall Sherrard Middle School 233-3331 Berkeley Spring Mills High School 274-5141 Mason Hannan High School 743-3212 Braxton Braxton County High School 765-7331 Mason Mason County Tech Center 675-3039 Cabell Cabell Midland High School 743-7515 Mercer Mercer County Tech Education Ctr 425-9551 Calhoun Calhoun County High School 354-6148 Mineral Frankfort High School 726-4767 Clay Clay County High School 587-4743 Mineral Keyser High School 788-4230 Doddridge Doddridge Co. High School 873-2521 Mineral Mineral County Tech Center 788-4240 Fayette Fayette Institute of Technology 469-2911 Mingo Tug Valley High School 235-2266 Gilmer Gilmer Calhoun Career Center 354-6151 Monongalia Clay-Battelle High School 432-8208 Gilmer Gilmer County High School 462-5105 Monongalia University High School 291-9270 Grant Petersburg High School 257-1076 Monroe Monroe County Tech Center 753-9971 Grant Union Educational Complex 693-7612 Morgan Berkeley Springs High School 258-2871 Greenbrier Greenbrier East High School 647-6464 Nicholas Nicholas County Career/Tech Ctr 742-5416 Greenbrier Greenbrier West High School 438-6191 Pendleton Pendleton County High School 358-7086 Hampshire Hampshire High School 822-5016 Pleasants St. Marys High School 684-3298 Hampshire Romney Middle School 822-5014 Pocahontas Pocahontas County High School 799-6565 Hampshire WV School for Deaf & Blind 822-4860 Preston Preston High School 329-0400 Hardy East Hardy Early/Middle School 897-5970 Preston Terra Alta-E. Preston High School 789-2344 Hardy East Hardy High School 897-5948 Putnam Putnam County Tech Center 586-3494 Hardy Moorefield High School 530-6034 Putnam Buffalo High School 937-2661 Hardy Moorefield Middle School 434-3000 Raleigh Liberty High School 934-5306 Harrison Liberty High School 624-3264 Raleigh Shady Spring High School 256-4579 Harrison Lincoln High School 592-2248 Randolph Elkins High School 636-9170 Harrison South Harrison High School 745-3315 Randolph Harman High School 227-4114 Harrison Robert C. Byrd High School 326-7200 Randolph Tygart Valley High School 335-4575 Jackson Ravenswood High School 273-4049 Ritchie Ritchie County High School 869-3527 Jackson Ripley High School 372-7355 Roane Roane County High School 927-6420 Jackson Ripley Middle School 372-7350 Summers Summers County High School 466-6040 Jackson Roane-Jackson Tech Center 372-7335 Taylor Taylor County Tech Center 265-1050 Jefferson Charles Town Middle School 725-7821 Tucker Tucker County High School 478-2651 Jefferson Harpers Ferry Middle School 535-6357 Tyler Tyler Consolidated High School 758-9000 Jefferson Jefferson High School 725-8491 Upshur Buckhannon-Upshur High School 472-3720 Jefferson Shepherdstown Middle School 876-4141 Wayne Tolsia High School 648-5566 Jefferson Washington High School 885-5110 Wetzel Magnolia High School 455-1990 Jefferson Wildwood Middle School 728-1988 Wetzel Valley High School 889-3151 Kanawha Carver Career Center 348-1965 Wirt Wirt County High School 275-4241 Lewis Lewis County High School 269-8315 Wood Wood County Tech Center 420-9501 Lincoln Lincoln County High School 824-6000 Wetzel Hundred High School 775-5221
General
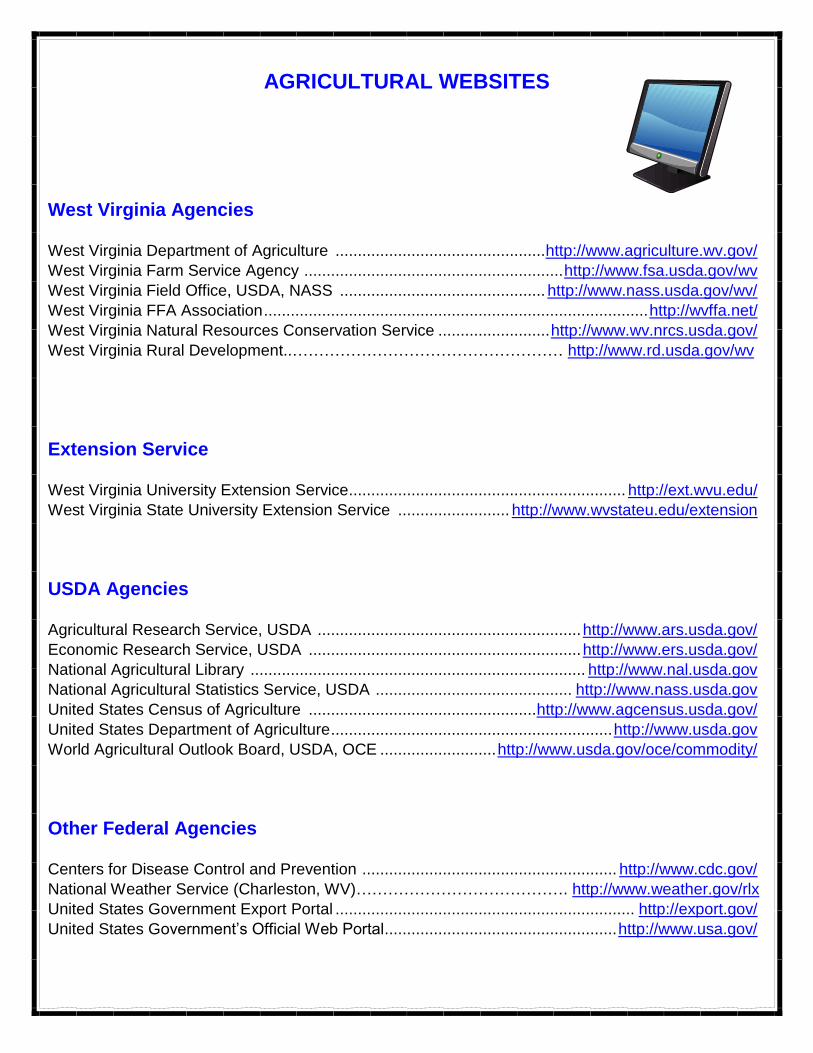
AGRICULTURAL WEBSITES
West Virginia Agencies
West Virginia Department of Agriculture ............................................... http://www.agriculture.wv.gov/
West Virginia Farm Service Agency .......................................................... http://www.fsa.usda.gov/wv
West Virginia Field Office, USDA, NASS .............................................. http://www.nass.usda.gov/wv/
West Virginia FFA Association ...................................................................................... http://wvffa.net/
West Virginia Natural Resources Conservation Service ......................... http://www.wv.nrcs.usda.gov/
West Virginia Rural Development..…………………………………………… http://www.rd.usda.gov/wv
Extension Service West Virginia University Extension Service.............................................................. http://ext.wvu.edu/
West Virginia State University Extension Service ......................... http://www.wvstateu.edu/extension
USDA Agencies
Agricultural Research Service, USDA ........................................................... http://www.ars.usda.gov/
Economic Research Service, USDA ............................................................. http://www.ers.usda.gov/
National Agricultural Library ........................................................................... http://www.nal.usda.gov
National Agricultural Statistics Service, USDA ............................................ http://www.nass.usda.gov
United States Census of Agriculture ................................................... http://www.agcensus.usda.gov/
United States Department of Agriculture ............................................................... http://www.usda.gov
World Agricultural Outlook Board, USDA, OCE .......................... http://www.usda.gov/oce/commodity/
Other Federal Agencies
Centers for Disease Control and Prevention ......................................................... http://www.cdc.gov/
National Weather Service (Charleston, WV)…………………………………. http://www.weather.gov/rlx
United States Government Export Portal ................................................................... http://export.gov/
United States Government’s Official Web Portal .................................................... http://www.usa.gov/
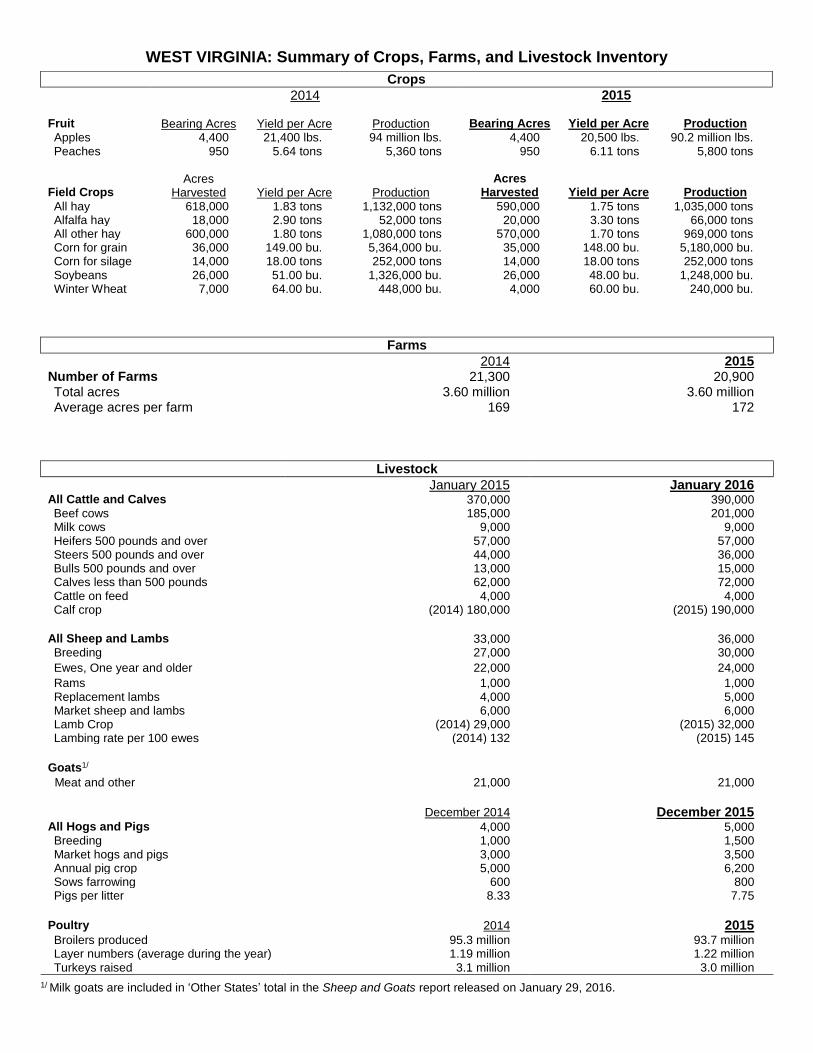
WEST VIRGINIA: Summary of Crops, Farms, and Livestock Inventory
Farms
2014 2015 Number of Farms 21,300 20,900 Total acres 3.60 million 3.60 million Average acres per farm 169 172
Livestock
January 2015 January 2016 All Cattle and Calves 370,000 390,000 Beef cows 185,000 201,000 Milk cows 9,000 9,000 Heifers 500 pounds and over 57,000 57,000 Steers 500 pounds and over 44,000 36,000 Bulls 500 pounds and over 13,000 15,000 Calves less than 500 pounds 62,000 72,000 Cattle on feed 4,000 4,000 Calf crop (2014) 180,000 (2015) 190,000
All Sheep and Lambs 33,000 36,000 Breeding 27,000 30,000
Ewes, One year and older 22,000 24,000
Rams 1,000 1,000 Replacement lambs 4,000 5,000 Market sheep and lambs 6,000 6,000 Lamb Crop (2014) 29,000 (2015) 32,000 Lambing rate per 100 ewes (2014) 132 (2015) 145
Goats1/ Meat and other 21,000 21,000
December 2014 December 2015 All Hogs and Pigs 4,000 5,000 Breeding 1,000 1,500 Market hogs and pigs 3,000 3,500 Annual pig crop 5,000 6,200 Sows farrowing 600 800 Pigs per litter 8.33 7.75
Poultry 2014 2015 Broilers produced 95.3 million 93.7 million Layer numbers (average during the year) 1.19 million 1.22 million Turkeys raised 3.1 million 3.0 million
Crops
2014 2015
Fruit Bearing Acres
Yield per Acre Production Bearing Acres
Yield per Acre Production
Apples 4,400 21,400 lbs. 94 million lbs. 4,400 20,500 lbs. 90.2 million lbs. Peaches 950 5.64 tons 5,360 tons 950 6.11 tons 5,800 tons
Field Crops Acres
Harvested
Yield per Acre Production
Acres Harvested
Yield per Acre Production
All hay 618,000 1.83 tons 1,132,000 tons 590,000 1.75 tons 1,035,000 tons Alfalfa hay 18,000 2.90 tons 52,000 tons 20,000 3.30 tons 66,000 tons All other hay 600,000 1.80 tons 1,080,000 tons 570,000 1.70 tons 969,000 tons Corn for grain 36,000 149.00 bu. 5,364,000 bu. 35,000 148.00 bu. 5,180,000 bu. Corn for silage 14,000 18.00 tons 252,000 tons 14,000 18.00 tons 252,000 tons Soybeans 26,000 51.00 bu. 1,326,000 bu. 26,000 48.00 bu. 1,248,000 bu. Winter Wheat 7,000 64.00 bu. 448,000 bu. 4,000 60.00 bu. 240,000 bu.
1/ Milk goats are included in ‘Other States’ total in the Sheep and Goats report released on January 29, 2016.
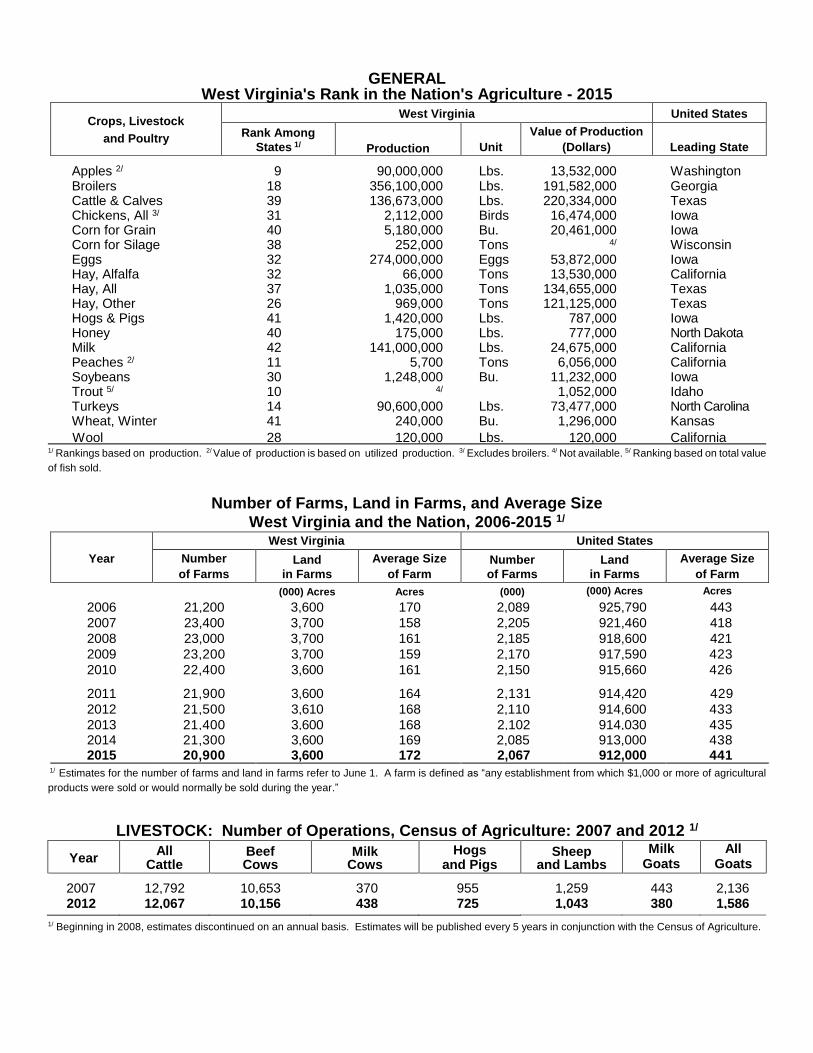
GENERAL West Virginia's Rank in the Nation's Agriculture - 2015
Crops, Livestock
and Poultry
West Virginia United States
Rank Among
States 1/
Production Unit
Value of Production
(Dollars) Leading State
Apples 2/ 9 90,000,000 Lbs. 13,532,000 Washington Broilers 18 356,100,000 Lbs. 191,582,000 Georgia Cattle & Calves 39 136,673,000 Lbs. 220,334,000 Texas Chickens, All 3/ 31 2,112,000 Birds 16,474,000 Iowa Corn for Grain 40 5,180,000 Bu. 20,461,000 Iowa Corn for Silage 38 252,000 Tons 4/ Wisconsin Eggs 32 274,000,000 Eggs 53,872,000 Iowa Hay, Alfalfa 32 66,000 Tons 13,530,000 California Hay, All 37 1,035,000 Tons 134,655,000 Texas Hay, Other 26 969,000 Tons 121,125,000 Texas Hogs & Pigs 41 1,420,000 Lbs. 787,000 Iowa Honey 40 175,000 Lbs. 777,000 North Dakota Milk 42 141,000,000 Lbs. 24,675,000 California Peaches 2/ 11 5,700 Tons 6,056,000 California Soybeans 30 1,248,000 Bu. 11,232,000 Iowa Trout 5/ 10
4/ 1,052,000 Idaho Turkeys 14 90,600,000 Lbs. 73,477,000 North Carolina Wheat, Winter 41 240,000 Bu. 1,296,000 Kansas
Wool 28 120,000 Lbs. 120,000 California 1/ Rankings based on production. 2/ Value of production is based on utilized production. 3/ Excludes broilers. 4/ Not available. 5/ Ranking based on total value
of fish sold.
Number of Farms, Land in Farms, and Average Size
West Virginia and the Nation, 2006-2015 1/
Year
West Virginia United States
Number
of Farms
Land
in Farms
Average Size
of Farm
Number
of Farms
Land
in Farms
Average Size
of Farm
(000) Acres
Acres
(000)
(000) Acres
Acres
2006 21,200 3,600 170 2,089 925,790 443
2007 23,400 3,700 158 2,205 921,460 418
2008 23,000 3,700 161 2,185 918,600 421
2009 23,200 3,700 159 2,170 917,590 423
2010 22,400 3,600 161 2,150 915,660 426
2011 21,900 3,600 164 2,131 914,420 429
2012 21,500 3,610 168 2,110 914,600 433
2013 21,400 3,600 168 2,102 914,030 435 2014 21,300 3,600 169 2,085 913,000 438 2015 20,900 3,600 172 2,067 912,000 441
1/ Estimates for the number of farms and land in farms refer to June 1. A farm is defined as “any establishment from which $1,000 or more of agricultural
products were sold or would normally be sold during the year.”
LIVESTOCK: Number of Operations, Census of Agriculture: 2007 and 2012 1/
Year
All
Cattle
Beef Cows
Milk
Cows Hogs
and Pigs
Sheep
and Lambs
Milk Goats
All Goats
2007 12,792 10,653 370 955 1,259 443 2,136
2012 12,067 10,156 438 725 1,043 380 1,586
1/ Beginning in 2008, estimates discontinued on an annual basis. Estimates will be published every 5 years in conjunction with the Census of Agriculture.
Randolph
Kanawha
Greenbrier
Hardy
Fayette
Preston
Grant
Pocahontas
Raleigh
Nicholas
Boone
Wayne
Roane
Clay
Logan
Pendleton
Webster
Mason
Braxton
Lewis
RitchieWood
Monroe
Tucker
Hampshire
Lincoln
Wyoming
Wirt
Gilmer
Harrison
Barbour
Min
goMercer
Jackson
McDowell
Wetzel
Tyler
Upshu
r
Putnam
Cabell
Marion
MineralS
um
mers
Berkeley
Marshall
Calh
ou
n
Monongalia
Dod
dri
dg
e
Morgan
Taylor Jefferson
Ohio
Pleasants
Brooke
Hancock
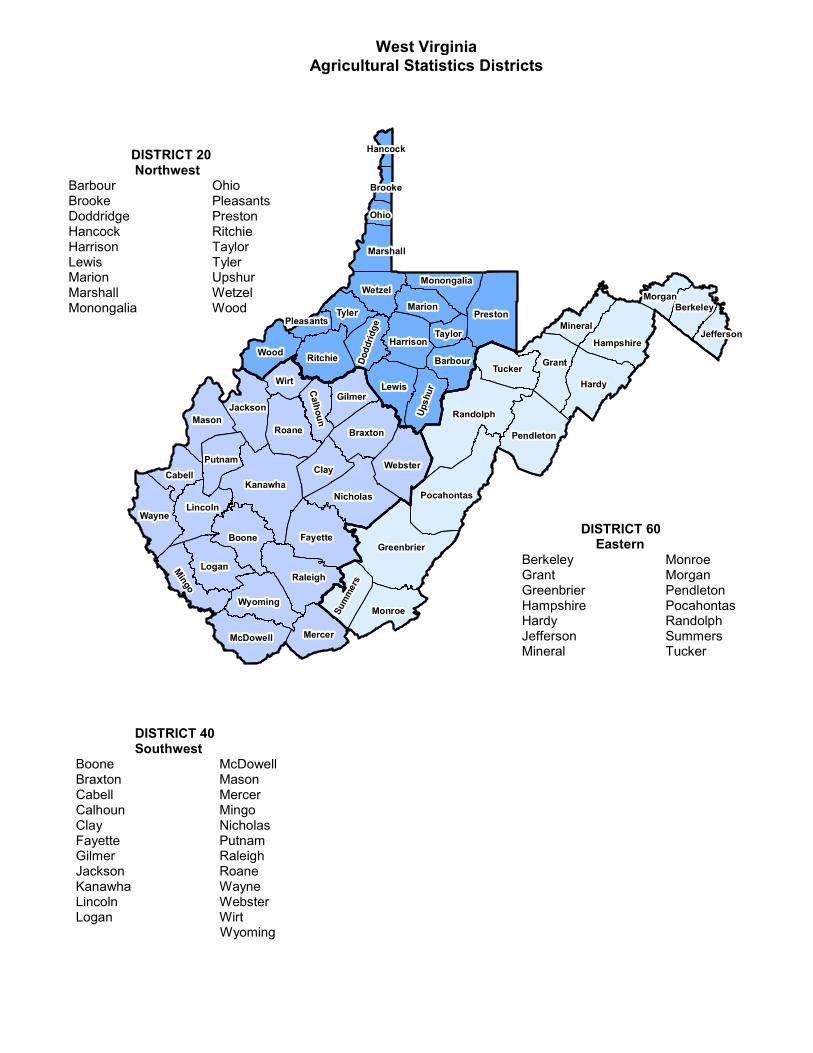
DISTRICT 40 Southwest Boone McDowell Braxton Mason Cabell Mercer Calhoun Mingo Clay Nicholas Fayette Putnam Gilmer Raleigh Jackson Roane Kanawha Wayne Lincoln Webster Logan Wirt
Wyoming
DISTRICT 20 Northwest Barbour Ohio Brooke Pleasants Doddridge Preston Hancock Ritchie Harrison Taylor Lewis Tyler Marion Upshur Marshall Wetzel Monongalia Wood
DISTRICT 60 Eastern Berkeley Monroe Grant Morgan Greenbrier Pendleton Hampshire Pocahontas Hardy Randolph Jefferson Summers Mineral Tucker
West Virginia
Agricultural Statistics Districts
Crops
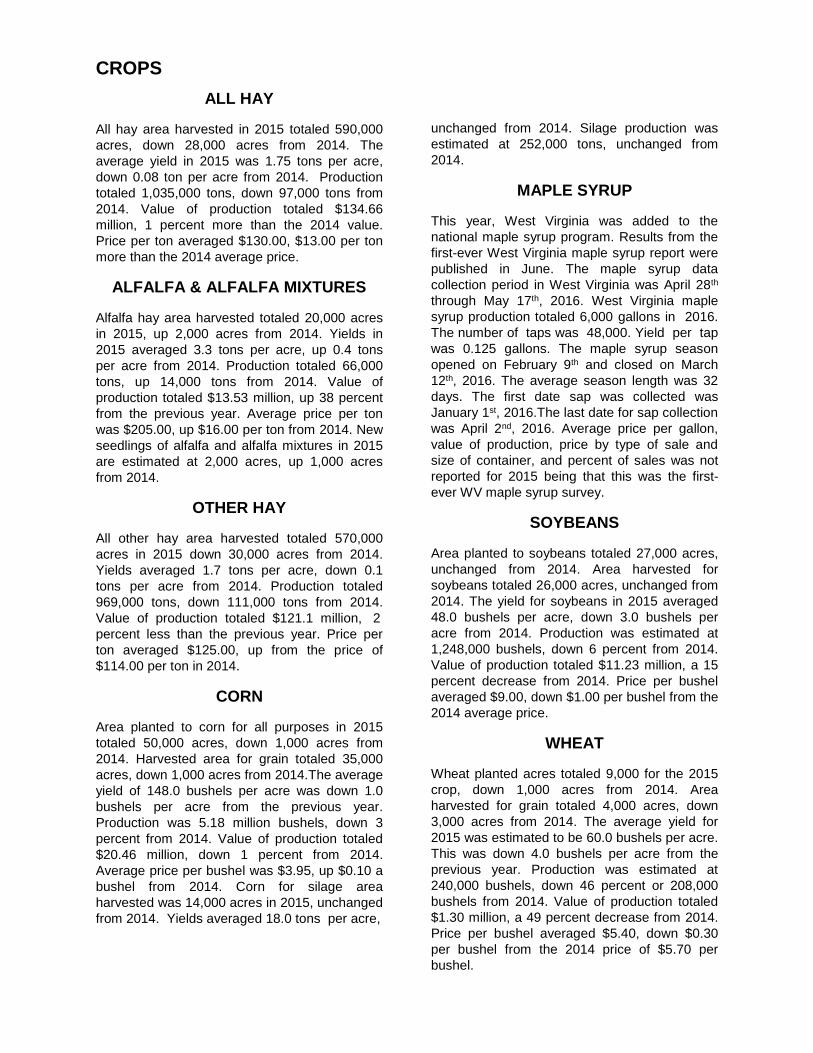
CROPS
ALL HAY All hay area harvested in 2015 totaled 590,000
acres, down 28,000 acres from 2014. The
average yield in 2015 was 1.75 tons per acre,
down 0.08 ton per acre from 2014. Production
totaled 1,035,000 tons, down 97,000 tons from
2014. Value of production totaled $134.66
million, 1 percent more than the 2014 value.
Price per ton averaged $130.00, $13.00 per ton
more than the 2014 average price.
ALFALFA & ALFALFA MIXTURES Alfalfa hay area harvested totaled 20,000 acres
in 2015, up 2,000 acres from 2014. Yields in
2015 averaged 3.3 tons per acre, up 0.4 tons
per acre from 2014. Production totaled 66,000
tons, up 14,000 tons from 2014. Value of
production totaled $13.53 million, up 38 percent
from the previous year. Average price per ton
was $205.00, up $16.00 per ton from 2014. New
seedlings of alfalfa and alfalfa mixtures in 2015
are estimated at 2,000 acres, up 1,000 acres
from 2014.
OTHER HAY All other hay area harvested totaled 570,000
acres in 2015 down 30,000 acres from 2014.
Yields averaged 1.7 tons per acre, down 0.1
tons per acre from 2014. Production totaled
969,000 tons, down 111,000 tons from 2014.
Value of production totaled $121.1 million, 2
percent less than the previous year. Price per
ton averaged $125.00, up from the price of
$114.00 per ton in 2014.
CORN Area planted to corn for all purposes in 2015
totaled 50,000 acres, down 1,000 acres from
2014. Harvested area for grain totaled 35,000
acres, down 1,000 acres from 2014.The average
yield of 148.0 bushels per acre was down 1.0
bushels per acre from the previous year.
Production was 5.18 million bushels, down 3
percent from 2014. Value of production totaled
$20.46 million, down 1 percent from 2014.
Average price per bushel was $3.95, up $0.10 a
bushel from 2014. Corn for silage area
harvested was 14,000 acres in 2015, unchanged
from 2014. Yields averaged 18.0 tons per acre,
unchanged from 2014. Silage production was
estimated at 252,000 tons, unchanged from
2014.
MAPLE SYRUP This year, West Virginia was added to the
national maple syrup program. Results from the
first-ever West Virginia maple syrup report were
published in June. The maple syrup data
collection period in West Virginia was April 28th
through May 17th, 2016. West Virginia maple
syrup production totaled 6,000 gallons in 2016.
The number of taps was 48,000. Yield per tap
was 0.125 gallons. The maple syrup season
opened on February 9th and closed on March
12th, 2016. The average season length was 32
days. The first date sap was collected was
January 1st, 2016.The last date for sap collection
was April 2nd, 2016. Average price per gallon,
value of production, price by type of sale and
size of container, and percent of sales was not
reported for 2015 being that this was the first-
ever WV maple syrup survey.
SOYBEANS Area planted to soybeans totaled 27,000 acres,
unchanged from 2014. Area harvested for
soybeans totaled 26,000 acres, unchanged from
2014. The yield for soybeans in 2015 averaged
48.0 bushels per acre, down 3.0 bushels per
acre from 2014. Production was estimated at
1,248,000 bushels, down 6 percent from 2014.
Value of production totaled $11.23 million, a 15
percent decrease from 2014. Price per bushel
averaged $9.00, down $1.00 per bushel from the
2014 average price.
WHEAT Wheat planted acres totaled 9,000 for the 2015
crop, down 1,000 acres from 2014. Area
harvested for grain totaled 4,000 acres, down
3,000 acres from 2014. The average yield for
2015 was estimated to be 60.0 bushels per acre.
This was down 4.0 bushels per acre from the
previous year. Production was estimated at
240,000 bushels, down 46 percent or 208,000
bushels from 2014. Value of production totaled
$1.30 million, a 49 percent decrease from 2014.
Price per bushel averaged $5.40, down $0.30
per bushel from the 2014 price of $5.70 per
bushel.
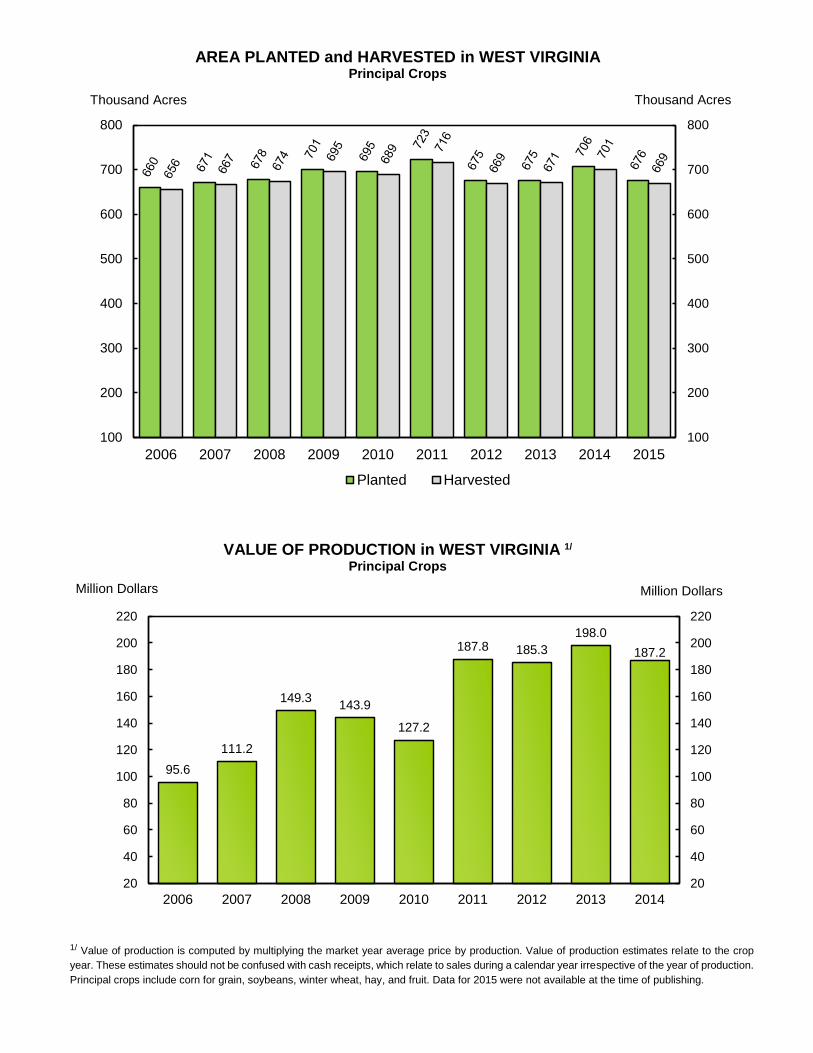
1/ Value of production is computed by multiplying the market year average price by production. Value of production estimates relate to the crop
year. These estimates should not be confused with cash receipts, which relate to sales during a calendar year irrespective of the year of production.
Principal crops include corn for grain, soybeans, winter wheat, hay, and fruit. Data for 2015 were not available at the time of publishing.
95.6
111.2
149.3143.9
127.2
187.8 185.3
198.0
187.2
20
40
60
80
100
120
140
160
180
200
220
20
40
60
80
100
120
140
160
180
200
220
2006 2007 2008 2009 2010 2011 2012 2013 2014
AREA PLANTED and HARVESTED in WEST VIRGINIA Principal Crops
VALUE OF PRODUCTION in WEST VIRGINIA 1/ Principal Crops
100
200
300
400
500
600
700
800
100
200
300
400
500
600
700
800
2006 2007 2008 2009 2010 2011 2012 2013 2014 2015
Thousand AcresThousand Acres
Planted Harvested
Million Dollars Million Dollars
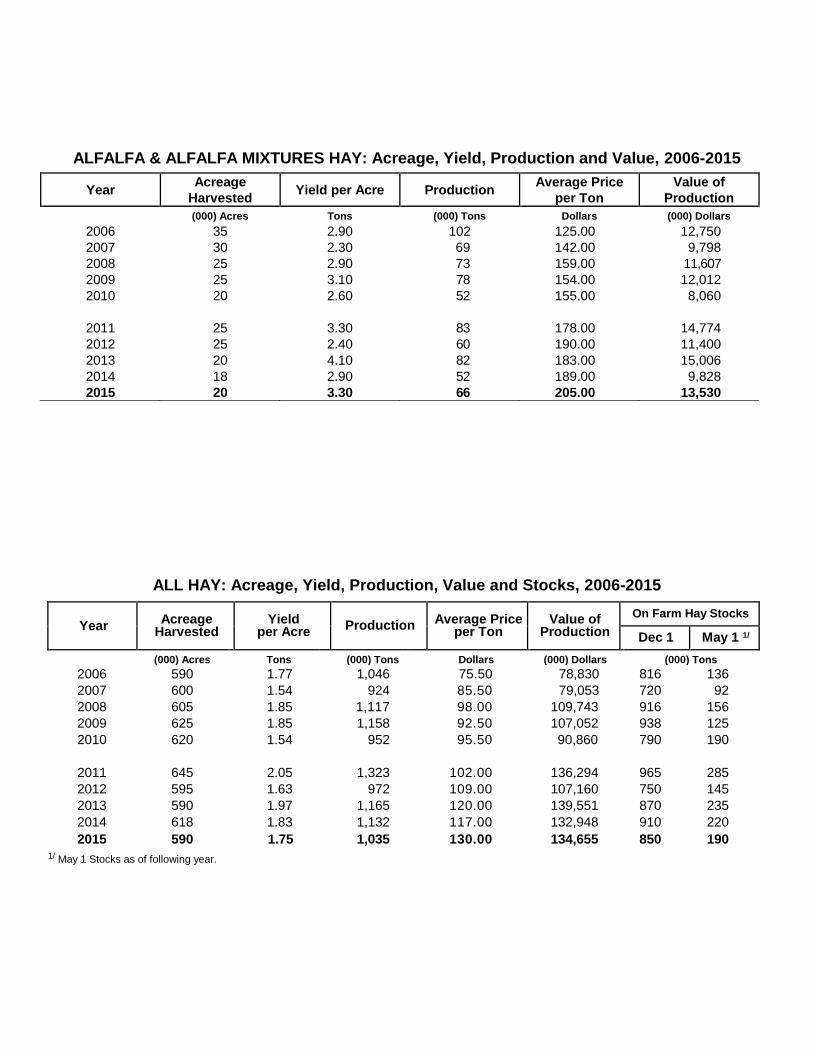
ALFALFA & ALFALFA MIXTURES HAY: Acreage, Yield, Production and Value, 2006-2015
Year Acreage
Harvested Yield per Acre Production
Average Price
per Ton
Value of
Production
(000) Acres Tons (000) Tons Dollars (000) Dollars
2006 35 2.90 102 125.00 12,750
2007 30 2.30 69 142.00 9,798
2008 25 2.90 73 159.00 11,607
2009 25 3.10 78 154.00 12,012
2010 20 2.60 52 155.00 8,060
2011 25 3.30 83 178.00 14,774
2012 25 2.40 60 190.00 11,400
2013 20 4.10 82 183.00 15,006
2014 18 2.90 52 189.00 9,828
2015 20 3.30 66 205.00 13,530
ALL HAY: Acreage, Yield, Production, Value and Stocks, 2006-2015
1/ May 1 Stocks as of following year.
Year Acreage
Harvested Yield
per Acre Production
Average Price per Ton
Value of Production
On Farm Hay Stocks
Dec 1 May 1 1/
(000) Acres Tons (000) Tons Dollars (000) Dollars (000) Tons 2006 590 1.77 1,046 75.50 78,830 816 136
2007 600 1.54 924 85.50 79,053 720 92
2008 605 1.85 1,117 98.00 109,743 916 156
2009 625 1.85 1,158 92.50 107,052 938 125
2010 620 1.54 952 95.50 90,860 790 190
2011 645 2.05 1,323 102.00 136,294 965 285
2012 595 1.63 972 109.00 107,160 750 145
2013 590 1.97 1,165 120.00 139,551 870 235
2014 618 1.83 1,132 117.00 132,948 910 220
2015 590 1.75 1,035 130.00 134,655 850 190
60,000,000
70,000,000
80,000,000
90,000,000
100,000,000
110,000,000
120,000,000
130,000,000
140,000,000
150,000,000
160,000,000
20152005199519851975196519551945193519251915
330,000
430,000
530,000
630,000
730,000
830,000
930,000
1,030,000
1,130,000
1,230,000
1,330,000
20152005199519851975196519551945193519251915
Year
Year
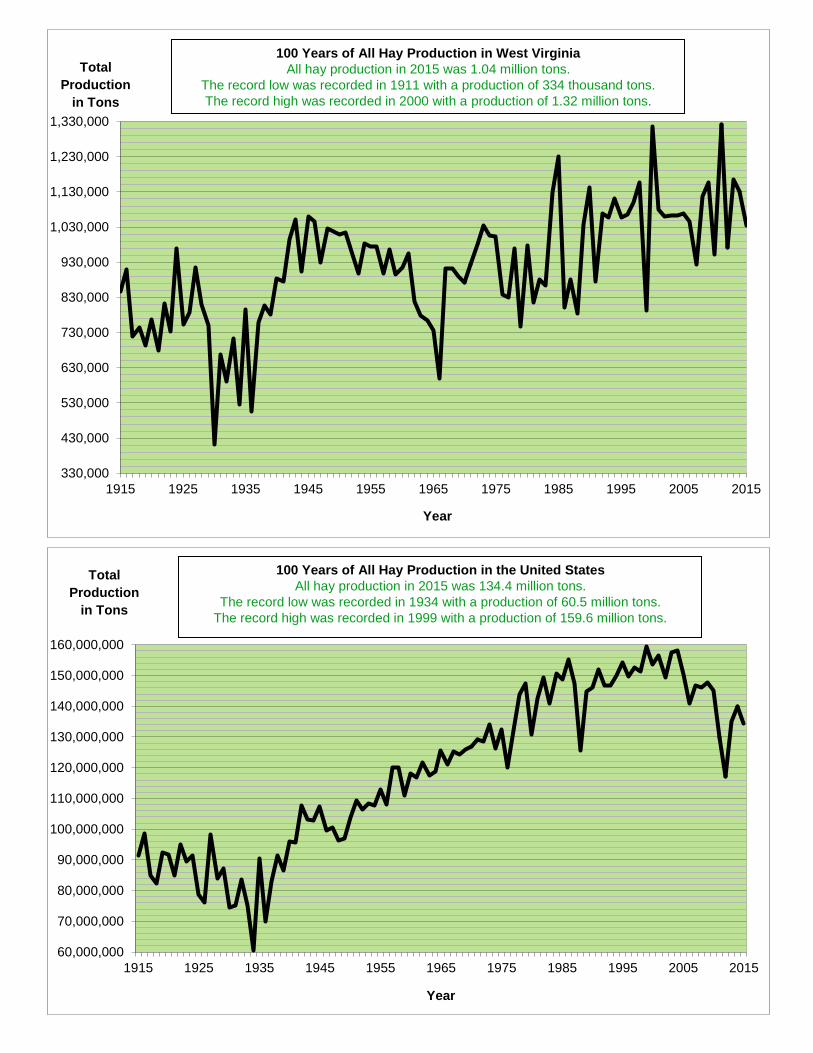
100 Years of All Hay Production in West Virginia
All hay production in 2015 was 1.04 million tons.
The record low was recorded in 1911 with a production of 334 thousand tons.
The record high was recorded in 2000 with a production of 1.32 million tons.
Total
Production
in Tons
100 Years of All Hay Production in the United States
All hay production in 2015 was 134.4 million tons.
The record low was recorded in 1934 with a production of 60.5 million tons.
The record high was recorded in 1999 with a production of 159.6 million tons.
Total
Production
in Tons
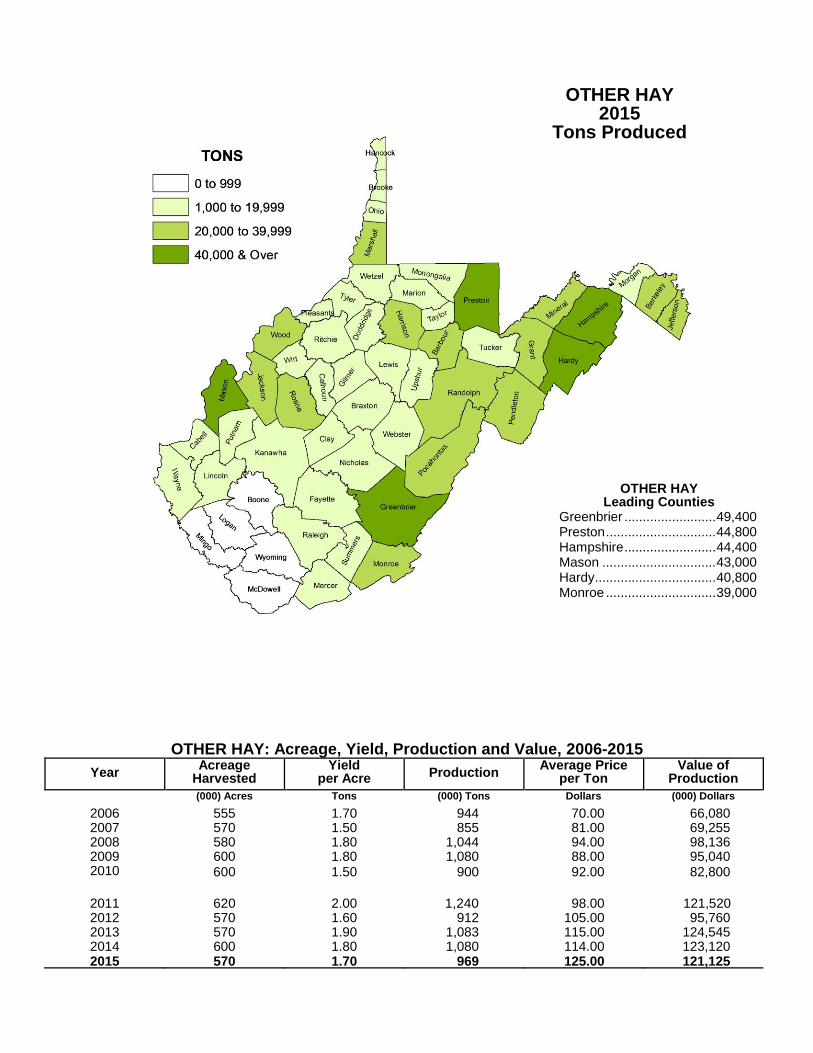
OTHER HAY: Acreage, Yield, Production and Value, 2006-2015
Year Acreage
Harvested Yield
per Acre Production Average Price
per Ton Value of
Production
(000) Acres Tons (000) Tons Dollars (000) Dollars
2006 555 1.70 944 70.00 66,080 2007 570 1.50 855 81.00 69,255 2008 580 1.80 1,044 94.00 98,136 2009 600 1.80 1,080 88.00 95,040 2010 600 1.50 900 92.00 82,800
2011 620 2.00 1,240 98.00 121,520 2012 570 1.60 912 105.00 95,760 2013 570 1.90 1,083 115.00 124,545 2014 600 1.80 1,080 114.00 123,120 2015 570 1.70 969 125.00 121,125
OTHER HAY 2015 Tons Produced
OTHER HAY Leading Counties Greenbrier ......................... 49,400 Preston .............................. 44,800 Hampshire ......................... 44,400 Mason ............................... 43,000 Hardy ................................. 40,800 Monroe .............................. 39,000
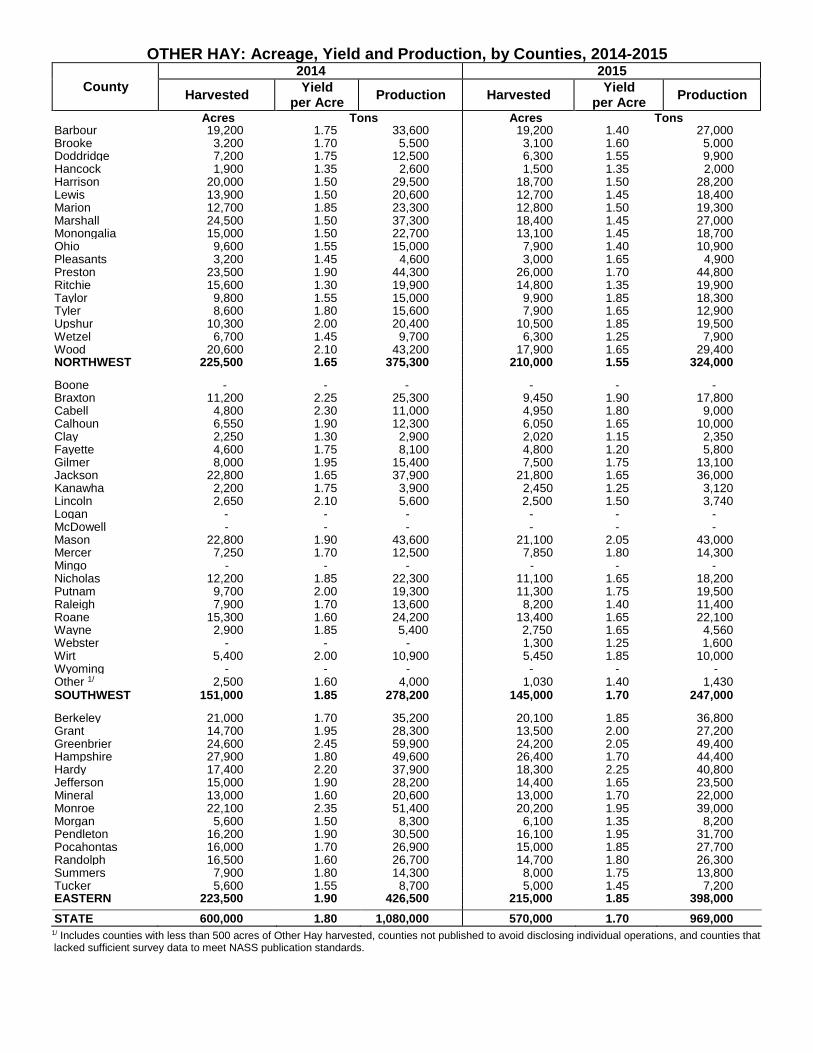
OTHER HAY: Acreage, Yield and Production, by Counties, 2014-2015
County
2014 2015
Harvested Yield
per Acre Production Harvested
Yield per Acre
Production
Acres Tons Acres Tons Barbour 19,200 1.75 33,600 19,200 1.40 27,000 Brooke 3,200 1.70 5,500 3,100 1.60 5,000 Doddridge 7,200 1.75 12,500 6,300 1.55 9,900 Hancock 1,900 1.35 2,600 1,500 1.35 2,000 Harrison 20,000 1.50 29,500 18,700 1.50 28,200 Lewis 13,900 1.50 20,600 12,700 1.45 18,400 Marion 12,700 1.85 23,300 12,800 1.50 19,300 Marshall 24,500 1.50 37,300 18,400 1.45 27,000 Monongalia 15,000 1.50 22,700 13,100 1.45 18,700 Ohio 9,600 1.55 15,000 7,900 1.40 10,900 Pleasants 3,200 1.45 4,600 3,000 1.65 4,900 Preston 23,500 1.90 44,300 26,000 1.70 44,800 Ritchie 15,600 1.30 19,900 14,800 1.35 19,900 Taylor 9,800 1.55 15,000 9,900 1.85 18,300 Tyler 8,600 1.80 15,600 7,900 1.65 12,900 Upshur 10,300 2.00 20,400 10,500 1.85 19,500 Wetzel 6,700 1.45 9,700 6,300 1.25 7,900 Wood 20,600 2.10 43,200 17,900 1.65 29,400 NORTHWEST 225,500 1.65 375,300 210,000 1.55 324,000 Boone - - - - - - Braxton 11,200 2.25 25,300 9,450 1.90 17,800 Cabell 4,800 2.30 11,000 4,950 1.80 9,000 Calhoun 6,550 1.90 12,300 6,050 1.65 10,000 Clay 2,250 1.30 2,900 2,020 1.15 2,350 Fayette 4,600 1.75 8,100 4,800 1.20 5,800 Gilmer 8,000 1.95 15,400 7,500 1.75 13,100 Jackson 22,800 1.65 37,900 21,800 1.65 36,000 Kanawha 2,200 1.75 3,900 2,450 1.25 3,120 Lincoln 2,650 2.10 5,600 2,500 1.50 3,740 Logan - - - - - - McDowell - - - - - - Mason 22,800 1.90 43,600 21,100 2.05 43,000 Mercer 7,250 1.70 12,500 7,850 1.80 14,300 Mingo - - - - - - Nicholas 12,200 1.85 22,300 11,100 1.65 18,200 Putnam 9,700 2.00 19,300 11,300 1.75 19,500 Raleigh 7,900 1.70 13,600 8,200 1.40 11,400 Roane 15,300 1.60 24,200 13,400 1.65 22,100 Wayne 2,900 1.85 5,400 2,750 1.65 4,560 Webster - - - 1,300 1.25 1,600 Wirt 5,400 2.00 10,900 5,450 1.85 10,000 Wyoming - - - - - - Other 1/ 2,500 1.60 4,000 1,030 1.40 1,430 SOUTHWEST 151,000 1.85 278,200 145,000 1.70 247,000 Berkeley 21,000 1.70 35,200 20,100 1.85 36,800 Grant 14,700 1.95 28,300 13,500 2.00 27,200 Greenbrier 24,600 2.45 59,900 24,200 2.05 49,400 Hampshire 27,900 1.80 49,600 26,400 1.70 44,400 Hardy 17,400 2.20 37,900 18,300 2.25 40,800 Jefferson 15,000 1.90 28,200 14,400 1.65 23,500 Mineral 13,000 1.60 20,600 13,000 1.70 22,000 Monroe 22,100 2.35 51,400 20,200 1.95 39,000 Morgan 5,600 1.50 8,300 6,100 1.35 8,200 Pendleton 16,200 1.90 30,500 16,100 1.95 31,700 Pocahontas 16,000 1.70 26,900 15,000 1.85 27,700 Randolph 16,500 1.60 26,700 14,700 1.80 26,300 Summers 7,900 1.80 14,300 8,000 1.75 13,800 Tucker 5,600 1.55 8,700 5,000 1.45 7,200 EASTERN 223,500 1.90 426,500 215,000 1.85 398,000 STATE 600,000 1.80 1,080,000 570,000 1.70 969,000
1/ Includes counties with less than 500 acres of Other Hay harvested, counties not published to avoid disclosing individual operations, and counties that lacked sufficient survey data to meet NASS publication standards.
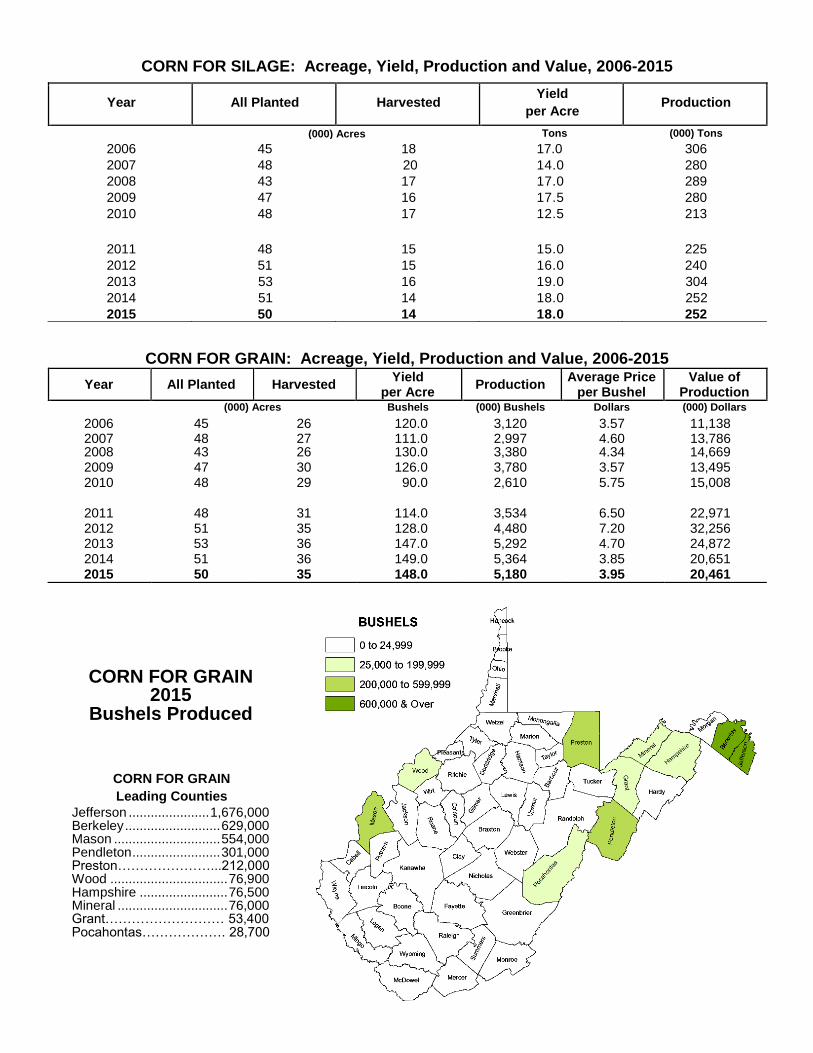
CORN FOR SILAGE: Acreage, Yield, Production and Value, 2006-2015
CORN FOR GRAIN: Acreage, Yield, Production and Value, 2006-2015
Year All Planted Harvested Yield
per Acre Production
(000) Acres Tons (000) Tons
2006 45 18 17.0 306
2007 48 20 14.0 280
2008 43 17 17.0 289
2009 47 16 17.5 280
2010 48 17 12.5 213
2011 48 15 15.0 225
2012 51 15 16.0 240
2013 53 16 19.0 304
2014 51 14 18.0 252
2015 50 14 18.0 252
Year All Planted Harvested Yield
per Acre Production
Average Price per Bushel
Value of Production
(000) Acres Bushels (000) Bushels Dollars (000) Dollars
2006 45 26 120.0 3,120 3.57 11,138 2007 48 27 111.0 2,997 4.60 13,786
13,786 13,786*
2008 43 26 130.0 3,380 4.34 14,669 2009 47 30 126.0 3,780 3.57 13,495 2010 48 29 90.0 2,610 5.75 15,008
2011 48 31 114.0 3,534 6.50 22,971 2012 51 35 128.0 4,480 7.20 32,256 2013 53 36 147.0 5,292 4.70 24,872 2014 51 36 149.0 5,364 3.85 20,651 2015 50 35 148.0 5,180 3.95 20,461
CORN FOR GRAIN 2015 Bushels Produced
CORN FOR GRAIN
Leading Counties
Jefferson ...................... 1,676,000 Berkeley .......................... 629,000 Mason ............................. 554,000 Pendleton ........................ 301,000 Preston…………………...212,000 Wood ................................ 76,900 Hampshire ........................ 76,500 Mineral .............................. 76,000 Grant……………………… 53,400 Pocahontas………………. 28,700
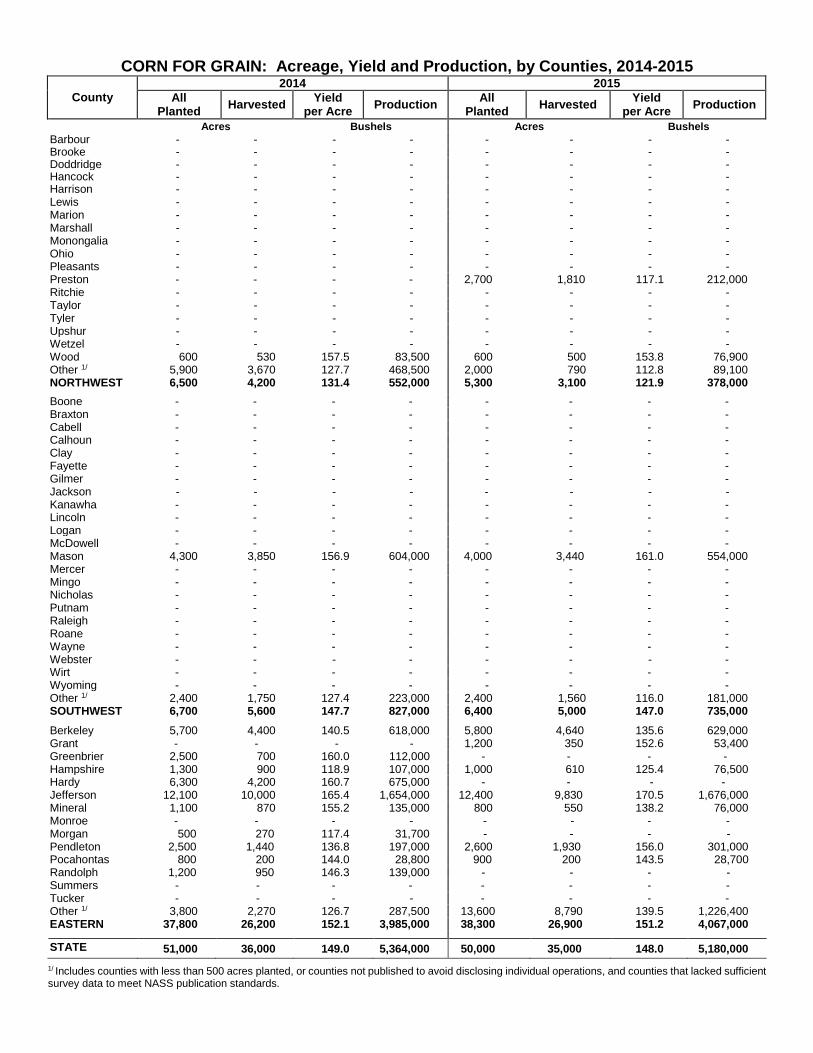
CORN FOR GRAIN: Acreage, Yield and Production, by Counties, 2014-2015
County
2014 2015
All Planted
Harvested Yield
per Acre Production
All Planted
Harvested Yield
per Acre Production
Acres Bushels Acres Bushels
Barbour - - - - - - - - Brooke - - - - - - - - Doddridge - - - - - - - - Hancock - - - - - - - - Harrison - - - - - - - - Lewis - - - - - - - - Marion - - - - - - - - Marshall - - - - - - - - Monongalia - - - - - - - - Ohio - - - - - - - - Pleasants - - - - - - - - Preston - - - - 2,700 1,810 117.1 212,000 Ritchie - - - - - - - - Taylor - - - - - - - - Tyler - - - - - - - - Upshur - - - - - - - - Wetzel - - - - - - - - Wood 600 530 157.5 83,500 600 500 153.8 76,900 Other 1/ 5,900 3,670 127.7 468,500 2,000 790 112.8 89,100 NORTHWEST 6,500 4,200 131.4 552,000 5,300 3,100 121.9 378,000 Boone - - - - - - - - Braxton - - - - - - - - Cabell - - - - - - - - Calhoun - - - - - - - - Clay - - - - - - - - Fayette - - - - - - - - Gilmer - - - - - - - - Jackson - - - - - - - - Kanawha - - - - - - - - Lincoln - - - - - - - - Logan - - - - - - - - McDowell - - - - - - - - Mason 4,300 3,850 156.9 604,000 4,000 3,440 161.0 554,000 Mercer - - - - - - - - Mingo - - - - - - - - Nicholas - - - - - - - - Putnam - - - - - - - - Raleigh - - - - - - - - Roane - - - - - - - - Wayne - - - - - - - - Webster - - - - - - - - Wirt - - - - - - - - Wyoming - - - - - - - - Other 1/ 2,400 1,750 127.4 223,000 2,400 1,560 116.0 181,000 SOUTHWEST 6,700 5,600 147.7 827,000 6,400 5,000 147.0 735,000 Berkeley 5,700 4,400 140.5 618,000 5,800 4,640 135.6 629,000 Grant - - - - 1,200 350 152.6 53,400 Greenbrier 2,500 700 160.0 112,000 - - - - Hampshire 1,300 900 118.9 107,000 1,000 610 125.4 76,500 Hardy 6,300 4,200 160.7 675,000 - - - - Jefferson 12,100 10,000 165.4 1,654,000 12,400 9,830 170.5 1,676,000 Mineral 1,100 870 155.2 135,000 800 550 138.2 76,000 Monroe - - - - - - - - Morgan 500 270 117.4 31,700 - - - - Pendleton 2,500 1,440 136.8 197,000 2,600 1,930 156.0 301,000 Pocahontas 800 200 144.0 28,800 900 200 143.5 28,700 Randolph 1,200 950 146.3 139,000 - - - - Summers - - - - - - - - Tucker - - - - - - - - Other 1/ 3,800 2,270 126.7
287,500 13,600 8,790 139.5
1,226,400
EASTERN 37,800 26,200 152.1 3,985,000 38,300 26,900 151.2 4,067,000 STATE
51,000 36,000 149.0 5,364,000 50,000 35,000 148.0 5,180,000
1/ Includes counties with less than 500 acres planted, or counties not published to avoid disclosing individual operations, and counties that lacked sufficient survey data to meet NASS publication standards.
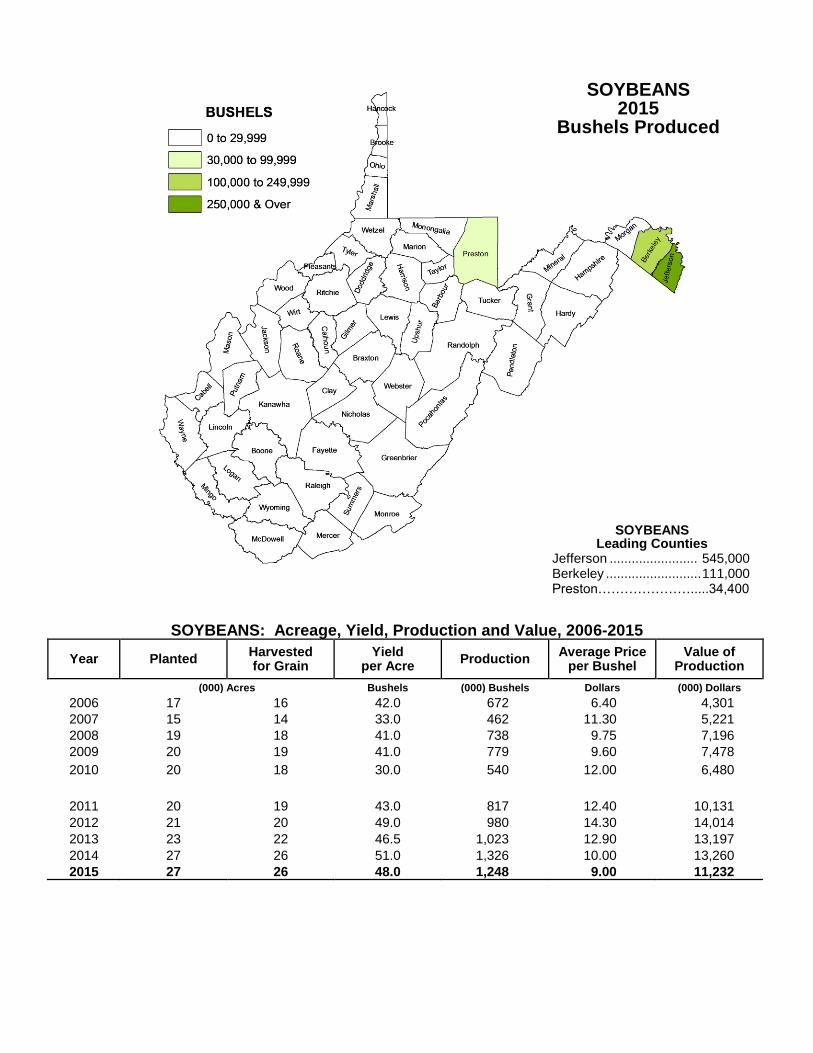
SOYBEANS: Acreage, Yield, Production and Value, 2006-2015
Year Planted Harvested for Grain
Yield per Acre
Production Average Price
per Bushel Value of
Production
(000) Acres Bushels (000) Bushels Dollars (000) Dollars
2006 17 16 42.0 672 6.40 4,301
2007 15 14 33.0 462 11.30 5,221
2008 19 18 41.0 738 9.75 7,196
2009 20 19 41.0 779 9.60 7,478
2010 20 18 30.0 540 12.00 6,480
2011 20 19 43.0 817 12.40 10,131
2012 21 20 49.0 980 14.30 14,014
2013 23 22 46.5 1,023 12.90 13,197
2014 27 26 51.0 1,326 10.00 13,260
2015 27 26 48.0 1,248 9.00 11,232
SOYBEANS 2015 Bushels Produced
SOYBEANS Leading Counties Jefferson ........................ 545,000 Berkeley .......................... 111,000 Preston………………….....34,400
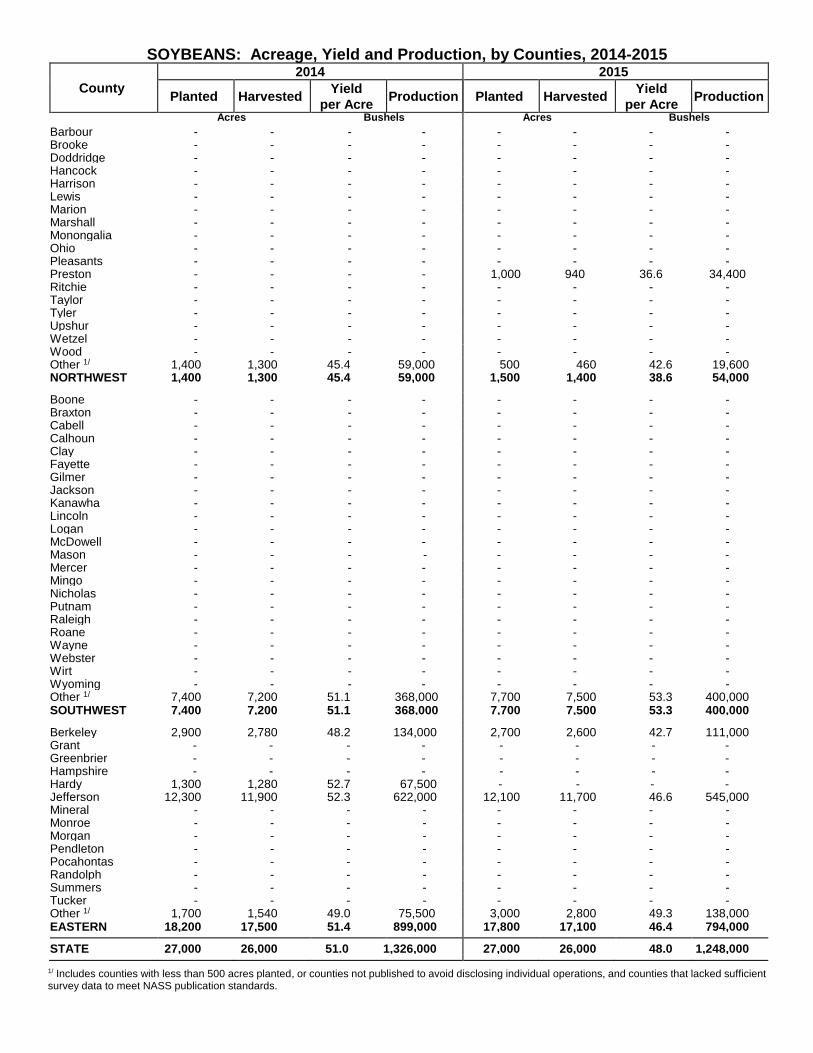
SOYBEANS: Acreage, Yield and Production, by Counties, 2014-2015
County
2014 2015
Planted Harvested Yield
per Acre Production Planted Harvested
Yield
per Acre Production
Acres Bushels Acres Bushels
Barbour - - - - - - - - Brooke - - - - - - - - Doddridge - - - - - - - - Hancock - - - - - - - - Harrison - - - - - - - - Lewis - - - - - - - - Marion - - - - - - - - Marshall - - - - - - - - Monongalia - - - - - - - - Ohio - - - - - - - - Pleasants - - - - - - - - Preston - - - - 1,000 940 36.6 34,400 Ritchie - - - - - - - - Taylor - - - - - - - - Tyler - - - - - - - - Upshur - - - - - - - - Wetzel - - - - - - - - Wood - - - - - - - - Other 1/ 1,400 1,300 45.4 59,000 500 460 42.6 19,600 NORTHWEST 1,400 1,300 45.4 59,000 1,500 1,400 38.6 54,000 Boone - - - - - - - - Braxton - - - - - - - - Cabell - - - - - - - - Calhoun - - - - - - - - Clay - - - - - - - - Fayette - - - - - - - - Gilmer - - - - - - - - Jackson - - - - - - - - Kanawha - - - - - - - - Lincoln - - - - - - - - Logan - - - - - - - - McDowell - - - - - - - - Mason - - - - - - - - Mercer - - - - - - - - Mingo - - - - - - - - Nicholas - - - - - - - - Putnam - - - - - - - - Raleigh - - - - - - - - Roane - - - - - - - - Wayne - - - - - - - - Webster - - - - - - - - Wirt - - - - - - - - Wyoming - - - - - - - - Other 1/ 7,400 7,200 51.1 368,000 7,700 7,500 53.3 400,000 SOUTHWEST 7,400 7,200 51.1 368,000 7,700 7,500 53.3 400,000 Berkeley 2,900 2,780 48.2 134,000 2,700 2,600 42.7 111,000 Grant - - - - - - - - Greenbrier - - - - - - - - Hampshire - - - - - - - - Hardy 1,300 1,280 52.7 67,500 - - - - Jefferson 12,300 11,900 52.3 622,000 12,100 11,700 46.6 545,000 Mineral - - - - - - - - Monroe - - - - - - - - Morgan - - - - - - - - Pendleton - - - - - - - - Pocahontas - - - - - - - - Randolph - - - - - - - - Summers - - - - - - - - Tucker - - - - - - - - Other 1/ 1,700 1,540 49.0 75,500 3,000 2,800 49.3 138,000 EASTERN 18,200 17,500 51.4 899,000 17,800 17,100 46.4 794,000 STATE 27,000 26,000 51.0 1,326,000 27,000 26,000 48.0 1,248,000
1/ Includes counties with less than 500 acres planted, or counties not published to avoid disclosing individual operations, and counties that lacked sufficient survey data to meet NASS publication standards.
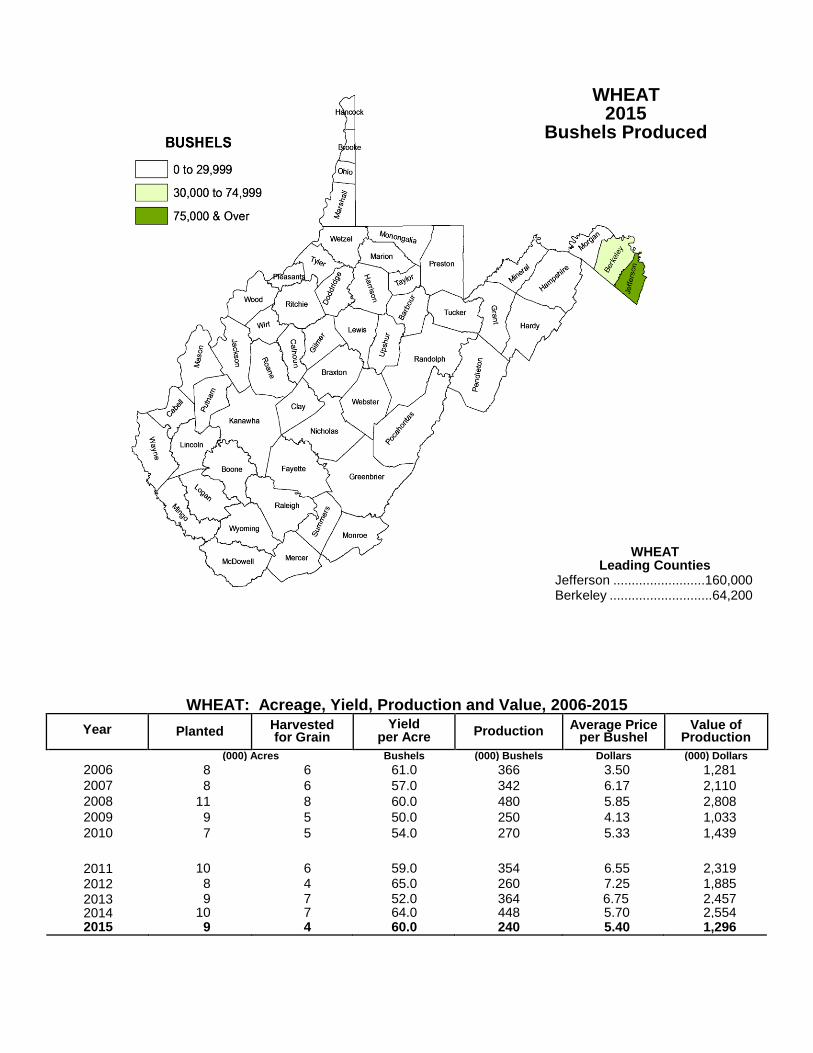
WHEAT: Acreage, Yield, Production and Value, 2006-2015
Year
Planted
Harvested for Grain
Yield per Acre
Production
Average Price
per Bushel
Value of
Production
(000) Acres Bushels (000) Bushels Dollars (000) Dollars 2006 8 6 61.0 366 3.50 1,281
2007 8 6 57.0 342 6.17 2,110
2008 11 8 60.0 480 5.85 2,808
2009 9 5 50.0 250 4.13 1,033
2010 7 5 54.0 270 5.33 1,439
2011 10 6 59.0 354 6.55 2,319
2012 8 4 65.0 260 7.25 1,885
2013 9 7 52.0 364 6.75 2,457 2014 10 7 64.0 448 5.70 2,554 2015 9 4 60.0 240 5.40 1,296
WHEAT 2015 Bushels Produced
WHEAT Leading Counties Jefferson .........................160,000 Berkeley ............................64,200
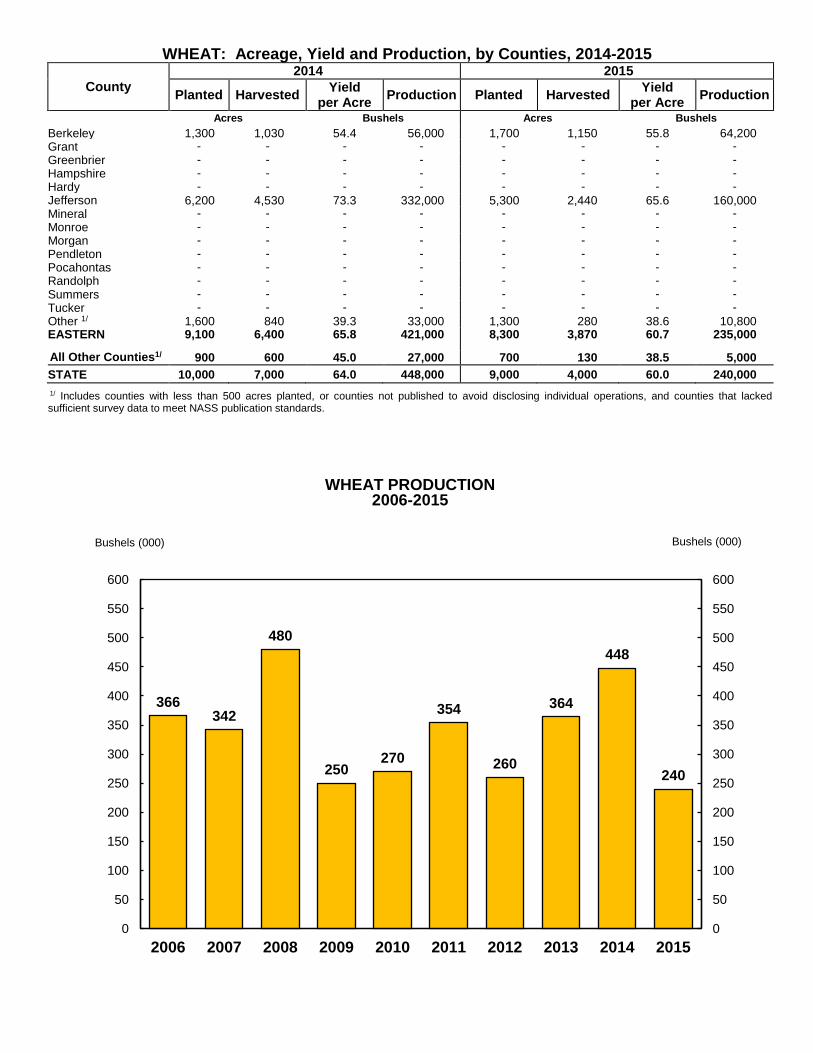
WHEAT: Acreage, Yield and Production, by Counties, 2014-2015
County 2014 2015
Planted Harvested Yield
per Acre Production Planted Harvested
Yield per Acre
Production
Acres Bushels Acres Bushels
Berkeley 1,300 1,030 54.4 56,000 1,700 1,150 55.8 64,200 Grant - - - - - - - -
Greenbrier - - - - - - - - Hampshire - - - - - - - - Hardy - - - - - - - - Jefferson 6,200 4,530 73.3 332,000 5,300 2,440 65.6 160,000 Mineral - - - - - - - -
Monroe - - - - - - - -
Morgan - - - - - - - - Pendleton - - - - - - - - Pocahontas - - - - - - - - Randolph - - - - - - - -
Summers - - - - - - - -
Tucker - - - - - - - -
Other 1/ 1,600 840 39.3 33,000 1,300 280 38.6 10,800 EASTERN 9,100 6,400 65.8 421,000 8,300 3,870 60.7 235,000 All Other Counties1/ 900 600 45.0 27,000 700 130 38.5 5,000
STATE 10,000 7,000 64.0 448,000 9,000 4,000 60.0 240,000
1/ Includes counties with less than 500 acres planted, or counties not published to avoid disclosing individual operations, and counties that lacked sufficient survey data to meet NASS publication standards.
WHEAT PRODUCTION 2006-2015
366342
480
250270
354
260
364
448
240
0
50
100
150
200
250
300
350
400
450
500
550
600
0
50
100
150
200
250
300
350
400
450
500
550
600
2006 2007 2008 2009 2010 2011 2012 2013 2014 2015
Bushels (000)Bushels (000)
COMMERCIAL APPLES: Production and Value, 2006-2015
Year Bearing Acreage Yield per Acre Total Utilized
Production Price
per Pound
Value of Utilized
Production
Acres Lbs. Mill. Lbs. Mill. Lbs. Cents (000) Dollars
2006 5,000 18,000 90.0 88.0 9.2 8,058
2007 5,000 16,000 80.0 77.0 9.8 7,557
2008 5,000 17,000 85.0 81.0 14.4 11,630
2009 4,900 16,700 82.0 79.0 13.8 10,912
2010 4,900 13,100 64.0 61.0 14.4 8,797
2011 4,500 14,900 67.0 65.0 17.5 11,371
2012 4,300 21,200 91.0 90.0 25.8 23,193
2013 4,300 22,100 95.0 95.0 13.7 13,008
2014 4,400 21,400 94.0 94.0 15.0 14,140
2015 4,400 20,500 90.2 90.0 15.0 13,532
COMMERCIAL APPLES: Processed Utilization and Value, 2006-2015
Year Quantity
Fresh Market
Fresh Market Price
per Pound
Fresh Market
Value of Production
Quantity Processed
All Processed Price per
Ton
Canned Canned Price/ Ton
Juice & Cider
Juice & Cider Price/ Ton
Processed Value of
Production
Mill. Lbs. Cents (000) Dollars Mill. Lbs. Dollars Mill. Lbs. Dollars Mill. Lbs. Dollars (000) Dollars 2006 16.0 17.3 2,768 72 147 47.0 163 20.0 110 5,290
2007 14.0 18.7 2,618 63 157 43.0 169 16.0 127 4,939
2008 16.0 25.7 4,112 65 231 30.0 250 30.0 220 7,518
2009 20.0 31.3 6,260 59 158 44.0 175 14.0 104 4,652
2010 14.0 31.9 4,466 47 184 32.0 201 13.0 143 4,331
2011 19.0 36.5 6,935 46 193 29.0 213 16.0 161 4,436
2012 13.0 47.8 6,214 77 441 48.0 441 27.0 441 16,979
2013 20.0 27.6 5,520 75 200 49.0 215 24.0 170 7,488
2014 20.0 33.6 6,720 74 201 1/ 1/ 1/ 1/ 7,420
2015 17.0 33.0 5,610 73 217 1/ 1/ 1/ 1/ 7,922 1/ Withheld to avoid disclosing data for individual operations.
PEACHES: Production and Value, 2006-2015
Year Bearing
Acreage
Yield per
Acre Total
Utilized
Production
Price
per Ton
Value of Utilized
Production
Acres Tons Tons Tons Dollars (000) Dollars
2006 950 5.47 5,200 5,000 578 2,890 2007 950 4.42 4,200 4,000 858 3,431 2008 950 5.89 5,600 5,000 650 3,250 2009 950 5.58 5,300 5,290 741 3,920 2010 950 5.58 5,300 5,000 925 4,625 2011 950 6.00 5,700 5,500 852 4,686
2012 950 5.60 5,320 5,200 1,300 6,760
2013 950 6.00 5,700 5,460 900 4,914 2014 950 5.64 5,360 5,250 1,020 5,355 2015 950 6.11 5,800 5,660 1,070 6,056
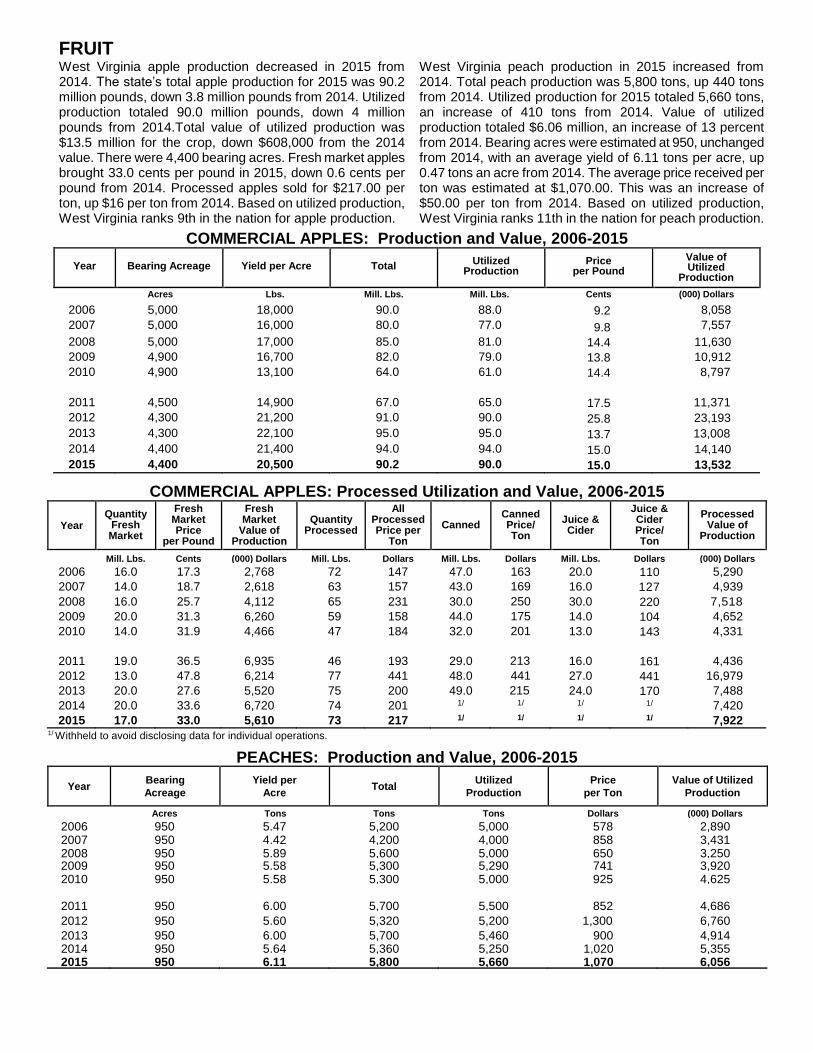
FRUIT West Virginia apple production decreased in 2015 from 2014. The state’s total apple production for 2015 was 90.2 million pounds, down 3.8 million pounds from 2014. Utilized production totaled 90.0 million pounds, down 4 million pounds from 2014.Total value of utilized production was $13.5 million for the crop, down $608,000 from the 2014 value. There were 4,400 bearing acres. Fresh market apples brought 33.0 cents per pound in 2015, down 0.6 cents per pound from 2014. Processed apples sold for $217.00 per ton, up $16 per ton from 2014. Based on utilized production, West Virginia ranks 9th in the nation for apple production.
West Virginia peach production in 2015 increased from 2014. Total peach production was 5,800 tons, up 440 tons from 2014. Utilized production for 2015 totaled 5,660 tons, an increase of 410 tons from 2014. Value of utilized production totaled $6.06 million, an increase of 13 percent from 2014. Bearing acres were estimated at 950, unchanged from 2014, with an average yield of 6.11 tons per acre, up 0.47 tons an acre from 2014. The average price received per ton was estimated at $1,070.00. This was an increase of $50.00 per ton from 2014. Based on utilized production, West Virginia ranks 11th in the nation for peach production.
Livestock
LIVESTOCK
CATTLE All cattle inventory as of January 1, 2016, was 390,000 head, up 20,000 head from the January 1, 2015, inventory. The inventory value for cattle was estimated at $495.3 million, down 8 percent from the 2015 value of $540.2 million. Value per head averaged $1,270, down from $1,460 in 2015. The 2015 calf crop was 190,000 head, up 10,000 head from 2014. All cows and heifers that have calved, at 210,000 head, were up 8 percent or 16,000 head from 2015. Beef production for 2015 totaled 136.7 million pounds live weight, up 1 percent from the 2014 production of 134.7 million pounds. Marketings totaled 130.2 million pounds, down 17 percent from 2014 marketings of 156.3 million pounds. Value of production increased from $217.2 million in 2014 to $220.3 million in 2015. Gross income, including home consumption, totaled $218.6 million, a decrease of 15 percent from the 2014 value of $258.1 million.
MILK
The inventory of dairy cows in West Virginia on January 1, 2016 was 9,000 head, unchanged from January 1, 2015. Milk cow market year average price received for a West Virginia milk cow in 2015 averaged $1,880.00, up from $1,700.00 in 2014. The total milk produced in 2015 was 141 million pounds, up 1 million pounds from the total of 140 million pounds in 2014. There were 139 million pounds marketed in 2015, up 1 million pounds from the total of 138 million pounds in 2014. Cash receipts from the milk marketed totaled $24.3 million, down 28 percent from the cash receipts of $33.7 million in 2014. The gross producer income, including home consumption, totaled $24.5 million, down 28 percent from $33.9 million in 2014.
HOGS AND PIGS
Hog and pig inventory as of December 1, 2015, totaled 5,000 head, up 1,000 head from the 2014 inventory of 4,000 head. The inventory value was estimated at $500,000 down 17 percent from the value of $600,000 for 2014. The pig crop totaled 6,200 head, up 24 percent from the 2014 total of 5,000 head. Pork production for 2015 was 1.4 million pounds, up 13 percent from 2014. Marketings of 860 thousand pounds during 2015 were 4 percent above the 2014 total marketings of 830 thousand pounds. The value of production was $787 thousand, 16 percent below the 2014 value of production of $939 thousand. The gross income from hog production, including home consumption, totaled $756 thousand, a decrease of 34 percent from the 2014 value of $1.1 million.
SHEEP AND LAMBS
Sheep and lamb inventory on January 1, 2016 was estimated at 36,000 head, up 3,000 head from January 1, 2015. The inventory value at $7.2 million was up from the value of $7.1 million in 2015. Value per head averaged $199.00, down $15.00 per head from the value of $214.00 per head in 2015. The 2015 lamb crop totaled 32,000 head, up 3,000 head from the previous year of 29,000 head. Sheep shorn in 2015 totaled 22,000 head, up 2,000 head from 2014. The average fleece weight was 5.5 pounds, giving a production of 120,000 pounds, up 5 percent from the 2014 production of 114,000 pounds. The average price per pound for wool was $1.00, up 14 cents from the previous year. Value of production for wool totaled $120,000, up 22 percent from the 2014 value of $98,000.
GOATS
Meat and other goat inventory (excluding milk and angora goats) on January 1, 2016, totaled 21,000 head, unchanged from January 1, 2015. Milk goat inventory and Angora goat inventory was not published to avoid disclosing individual operations.
GOATS AND KIDS: Number on Farms, by Type, January 1, 2007-2016
Year Meat & Other Dairy Angora
2007 21,000 1,700 1/
2008 24,000 2,000 1/
2009 23,000 2,200 1/
2010 21,500 2,000 1/
2011 22,500 2,500 1/
2012 21,000 2,500 1/
2013 20,000 2,300 1/
2014 19,000 2,000 1/
2015 21,000 1/ 1/
2016 21,000 1/ 1/
1/Inventory not published to avoid disclosing individual operations.
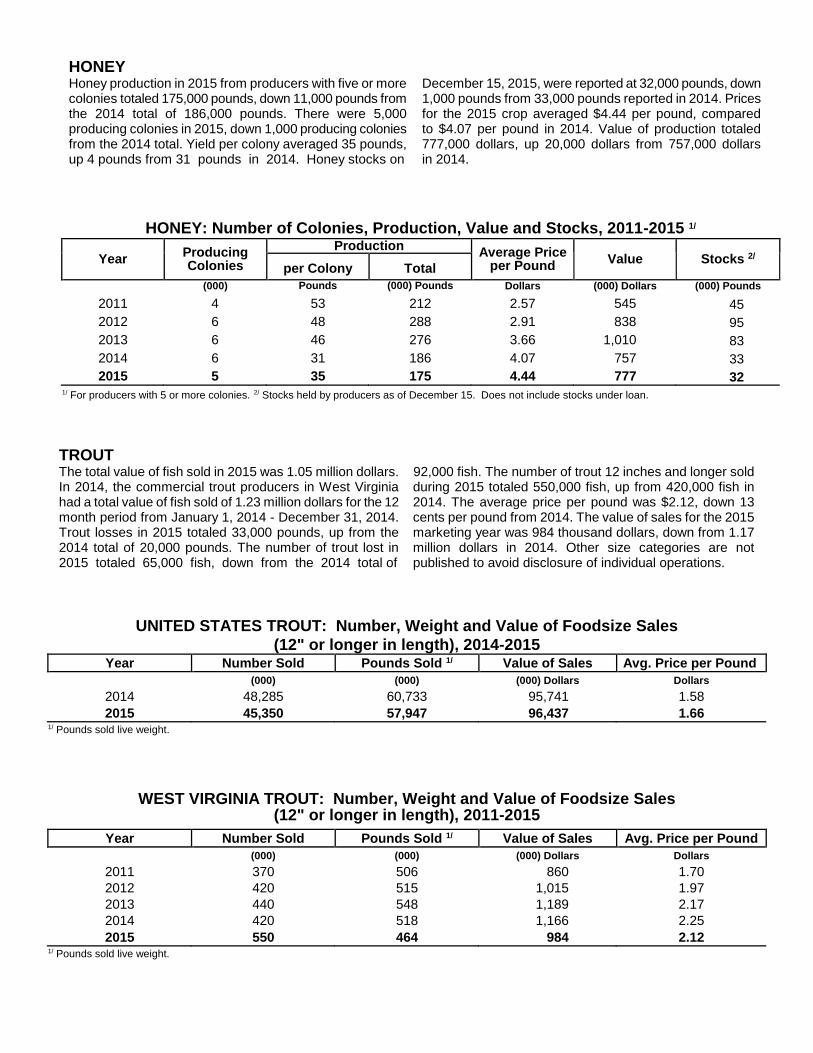
HONEY Honey production in 2015 from producers with five or more colonies totaled 175,000 pounds, down 11,000 pounds from the 2014 total of 186,000 pounds. There were 5,000 producing colonies in 2015, down 1,000 producing colonies from the 2014 total. Yield per colony averaged 35 pounds, up 4 pounds from 31 pounds in 2014. Honey stocks on
December 15, 2015, were reported at 32,000 pounds, down 1,000 pounds from 33,000 pounds reported in 2014. Prices for the 2015 crop averaged $4.44 per pound, compared to $4.07 per pound in 2014. Value of production totaled 777,000 dollars, up 20,000 dollars from 757,000 dollars in 2014.
HONEY: Number of Colonies, Production, Value and Stocks, 2011-2015 1/
Year Producing Colonies
Production Average Price
per Pound Value Stocks 2/
per Colony
Total
(000) Pounds (000) Pounds Dollars (000) Dollars (000) Pounds
2011 4 53 212 2.57 545 45
2012 6 48 288 2.91 838 95
2013 6 46 276 3.66 1,010 83
2014 6 31 186 4.07 757 33
2015 5 35 175 4.44 777 32
1/ For producers with 5 or more colonies. 2/ Stocks held by producers as of December 15. Does not include stocks under loan.
UNITED STATES TROUT: Number, Weight and Value of Foodsize Sales
(12" or longer in length), 2014-2015 Year Number Sold Pounds Sold 1/ Value of Sales Avg. Price per Pound
PPPPPoundPound
(000)
(000)
(000) Dollars
Dollars
2014 48,285 60,733 95,741 1.58
2015 45,350 57,947 96,437 1.66 1/ Pounds sold live weight.
WEST VIRGINIA TROUT: Number, Weight and Value of Foodsize Sales (12" or longer in length), 2011-2015
Year Number Sold Pounds Sold 1/ Value of Sales Avg. Price per Pound
(000)
(000)
(000) Dollars
Dollars
2011
370 506 860 1.70
2012
420 515 1,015 1.97
2013 440 548 1,189 2.17
2014 420 518 1,166 2.25
2015 550 464 984 2.12 1/ Pounds sold live weight.
TROUT
The total value of fish sold in 2015 was 1.05 million dollars. In 2014, the commercial trout producers in West Virginia had a total value of fish sold of 1.23 million dollars for the 12 month period from January 1, 2014 - December 31, 2014. Trout losses in 2015 totaled 33,000 pounds, up from the 2014 total of 20,000 pounds. The number of trout lost in 2015 totaled 65,000 fish, down from the 2014 total of
Nu 92,000 fish. The number of trout 12 inches and longer sold during 2015 totaled 550,000 fish, up from 420,000 fish in 2014. The average price per pound was $2.12, down 13 cents per pound from 2014. The value of sales for the 2015 marketing year was 984 thousand dollars, down from 1.17 million dollars in 2014. Other size categories are not published to avoid disclosure of individual operations.
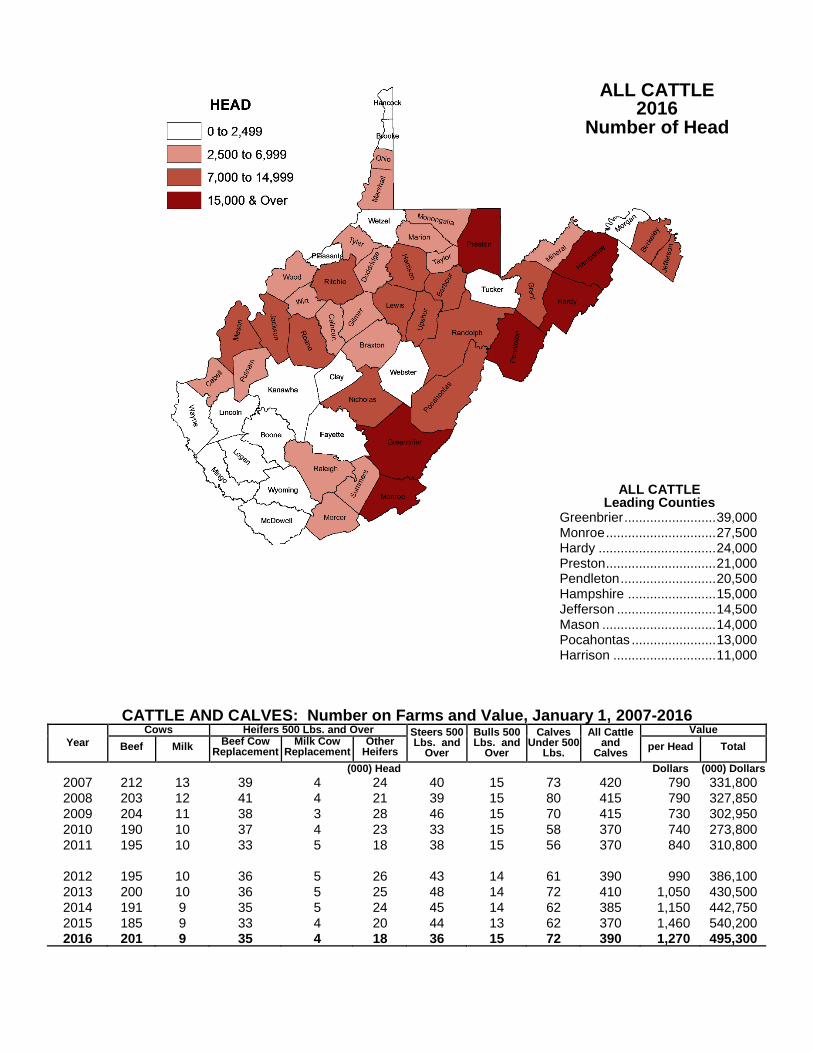
CATTLE AND CALVES: Number on Farms and Value, January 1, 2007-2016
Year
Cows Heifers 500 Lbs. and Over Steers 500 Lbs. and
Over
Bulls 500 Lbs. and
Over
Calves Under 500
Lbs.
All Cattle and
Calves
Value
Beef Milk Beef Cow
Replacement Milk Cow
Replacement Other
Heifers per Head Total
(000) Head
Dollars
(000) Dollars
2007 212 13 39 4 24 40 15 73 420 790 331,800
2008 203 12 41 4 21 39 15 80 415 790 327,850
2009 204 11 38 3 28 46 15 70 415 730 302,950
2010 190 10 37 4 23 33 15 58 370 740 273,800
2011 195 10 33 5 18 38 15 56 370 840 310,800
2012 195 10 36 5 26 43 14 61 390 990 386,100
2013 200 10 36 5 25 48 14 72 410 1,050 430,500
2014 191 9 35 5 24 45 14 62 385 1,150 442,750
2015 185 9 33 4 20 44 13 62 370 1,460 540,200 2016 201 9 35 4 18 36 15 72 390 1,270 495,300
ALL CATTLE 2016 Number of Head
ALL CATTLE Leading Counties Greenbrier ......................... 39,000 Monroe .............................. 27,500 Hardy ................................ 24,000 Preston .............................. 21,000 Pendleton .......................... 20,500 Hampshire ........................ 15,000 Jefferson ........................... 14,500 Mason ............................... 14,000 Pocahontas ....................... 13,000 Harrison ............................ 11,000
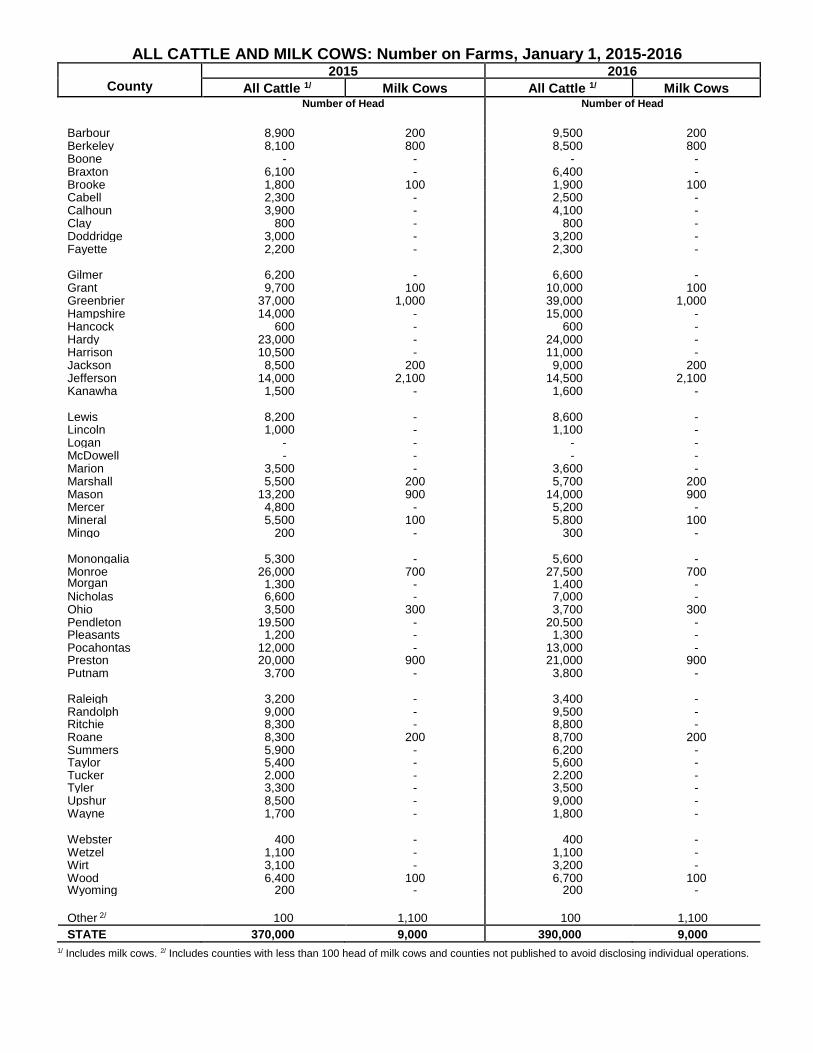
ALL CATTLE AND MILK COWS: Number on Farms, January 1, 2015-2016
County 2015 2016
All Cattle 1/ Milk Cows All Cattle 1/ Milk Cows
Number of Head Number of Head
Barbour 8,900 200 9,500 200 Berkeley 8,100 800 8,500 800 Boone - - - - Braxton 6,100 - 6,400 - Brooke 1,800 100 1,900 100 Cabell 2,300 - 2,500 - Calhoun 3,900 - 4,100 - Clay 800 - 800 - Doddridge 3,000 - 3,200 - Fayette 2,200 - 2,300 - Gilmer 6,200 - 6,600 - Grant 9,700 100 10,000 100 Greenbrier 37,000 1,000 39,000 1,000 Hampshire 14,000 - 15,000 - Hancock 600 - 600 - Hardy 23,000 - 24,000 - Harrison 10,500 - 11,000 - Jackson 8,500 200 9,000 200 Jefferson 14,000 2,100 14,500 2,100 Kanawha 1,500 - 1,600 - Lewis 8,200 - 8,600 - Lincoln 1,000 - 1,100 - Logan - - - - McDowell - - - - Marion 3,500 - 3,600 - Marshall 5,500 200 5,700 200 Mason 13,200 900 14,000 900 Mercer 4,800 - 5,200 - Mineral 5,500 100 5,800 100 Mingo 200 - 300 - Monongalia 5,300 - 5,600 - Monroe 26,000 700 27,500 700 Morgan 1,300 - 1,400 - Nicholas 6,600 - 7,000 - Ohio 3,500 300 3,700 300 Pendleton 19,500 - 20,500 - Pleasants 1,200 - 1,300 - Pocahontas 12,000 - 13,000 - Preston 20,000 900 21,000 900 Putnam 3,700 - 3,800 - Raleigh 3,200 - 3,400 - Randolph 9,000 - 9,500 - Ritchie 8,300 - 8,800 - Roane 8,300 200 8,700 200 Summers 5,900 - 6,200 - Taylor 5,400 - 5,600 - Tucker 2,000 - 2,200 - Tyler 3,300 - 3,500 - Upshur 8,500 - 9,000 - Wayne 1,700 - 1,800 - Webster 400 - 400 - Wetzel 1,100 - 1,100 - Wirt 3,100 - 3,200 - Wood 6,400 100 6,700 100 Wyoming 200 - 200 -
Other 2/ 100 1,100 100 1,100
STATE 370,000 9,000 390,000 9,000
1/ Includes milk cows. 2/ Includes counties with less than 100 head of milk cows and counties not published to avoid disclosing individual operations.
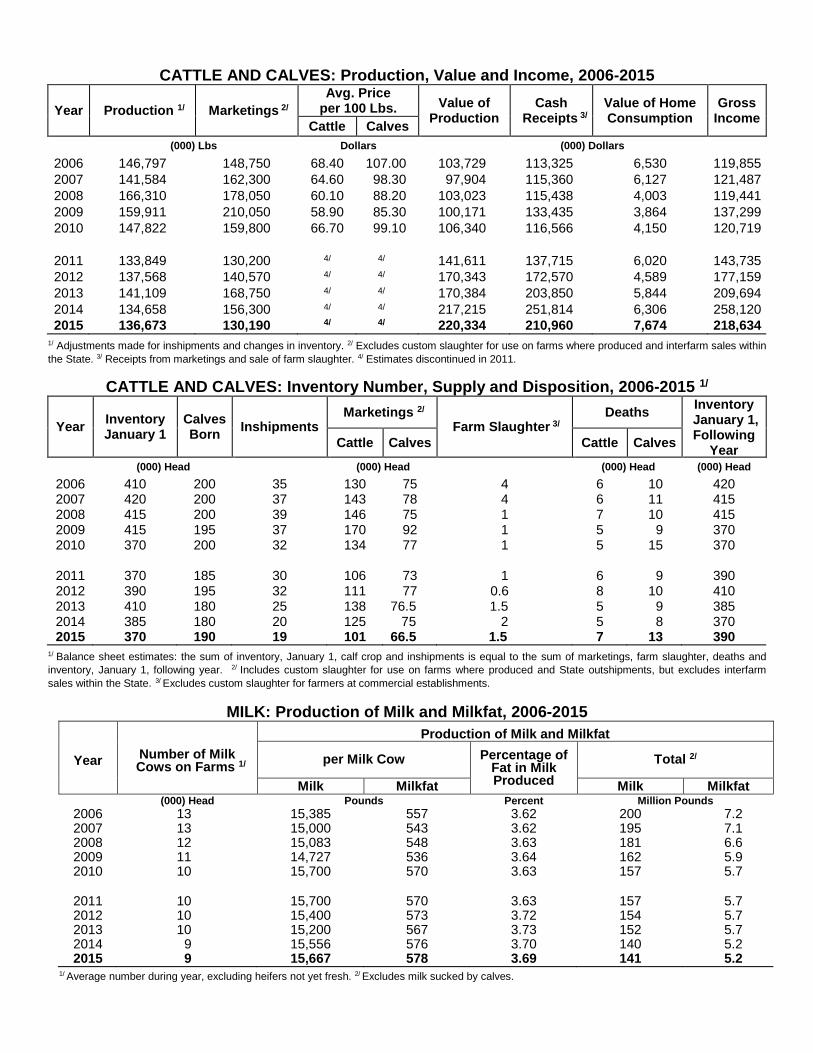
CATTLE AND CALVES: Production, Value and Income, 2006-2015
Year Production 1/ Marketings 2/
Avg. Price per 100 Lbs. Value of
Production
Cash Receipts 3/
Value of Home Consumption
Gross Income
Cattle Calves
(000) Lbs Dollars (000) Dollars
2006 146,797 148,750 68.40 107.00 103,729 113,325 6,530 119,855
2007 141,584 162,300 64.60 98.30 97,904 115,360 6,127 121,487
2008 166,310 178,050 60.10 88.20 103,023 115,438 4,003 119,441
2009 159,911 210,050 58.90 85.30 100,171 133,435 3,864 137,299
2010 147,822 159,800 66.70 99.10 106,340 116,566 4,150 120,719
2011 133,849 130,200 4/ 4/ 141,611 137,715 6,020 143,735
2012 137,568 140,570 4/ 4/ 170,343 172,570 4,589 177,159
2013 141,109 168,750 4/ 4/ 170,384 203,850 5,844 209,694
2014 134,658 156,300 4/ 4/ 217,215 251,814 6,306 258,120
2015 136,673 130,190 4/ 4/ 220,334 210,960 7,674 218,634
1/ Adjustments made for inshipments and changes in inventory. 2/ Excludes custom slaughter for use on farms where produced and interfarm sales within
the State. 3/ Receipts from marketings and sale of farm slaughter. 4/ Estimates discontinued in 2011.
CATTLE AND CALVES: Inventory Number, Supply and Disposition, 2006-2015 1/
Year Inventory January 1
Calves Born
Inshipments Marketings 2/
Farm Slaughter 3/ Deaths
Inventory January 1, Following
Year Cattle Calves Cattle Calves
(000) Head (000) Head (000) Head (000) Head 2006 410 200 35 130 75 4 6 10 420 2007 420 200 37 143 78 4 6 11 415 2008 415 200 39 146 75 1 7 10 415 2009 415 195 37 170 92 1 5 9 370 2010 370 200 32 134 77 1 5 15 370
2011 370 185 30 106 73 1 6 9 390 2012 390 195 32 111 77 0.6 8 10 410 2013 410 180 25 138 76.5 1.5 5 9 385 2014 385 180 20 125 75 2 5 8 370 2015 370 190 19 101 66.5 1.5 7 13 390
1/ Balance sheet estimates: the sum of inventory, January 1, calf crop and inshipments is equal to the sum of marketings, farm slaughter, deaths and
inventory, January 1, following year. 2/ Includes custom slaughter for use on farms where produced and State outshipments, but excludes interfarm
sales within the State. 3/ Excludes custom slaughter for farmers at commercial establishments.
MILK: Production of Milk and Milkfat, 2006-2015
Year Number of Milk
Cows on Farms 1/
Production of Milk and Milkfat
per Milk Cow Percentage of Fat in Milk Produced
Total 2/
Milk Milkfat Milk Milkfat (000) Head Pounds Percent Million Pounds
2006 13 15,385 557 3.62 200 7.2 2007 13 15,000 543 3.62 195 7.1 2008 12 15,083 548 3.63 181 6.6 2009 11 14,727 536 3.64 162 5.9 2010 10 15,700 570 3.63 157 5.7
2011 10 15,700 570 3.63 157 5.7 2012 10 15,400 573 3.72 154 5.7 2013 10 15,200 567 3.73 152 5.7 2014 9 15,556 576 3.70 140 5.2 2015 9 15,667 578 3.69 141 5.2
1/ Average number during year, excluding heifers not yet fresh. 2/ Excludes milk sucked by calves.
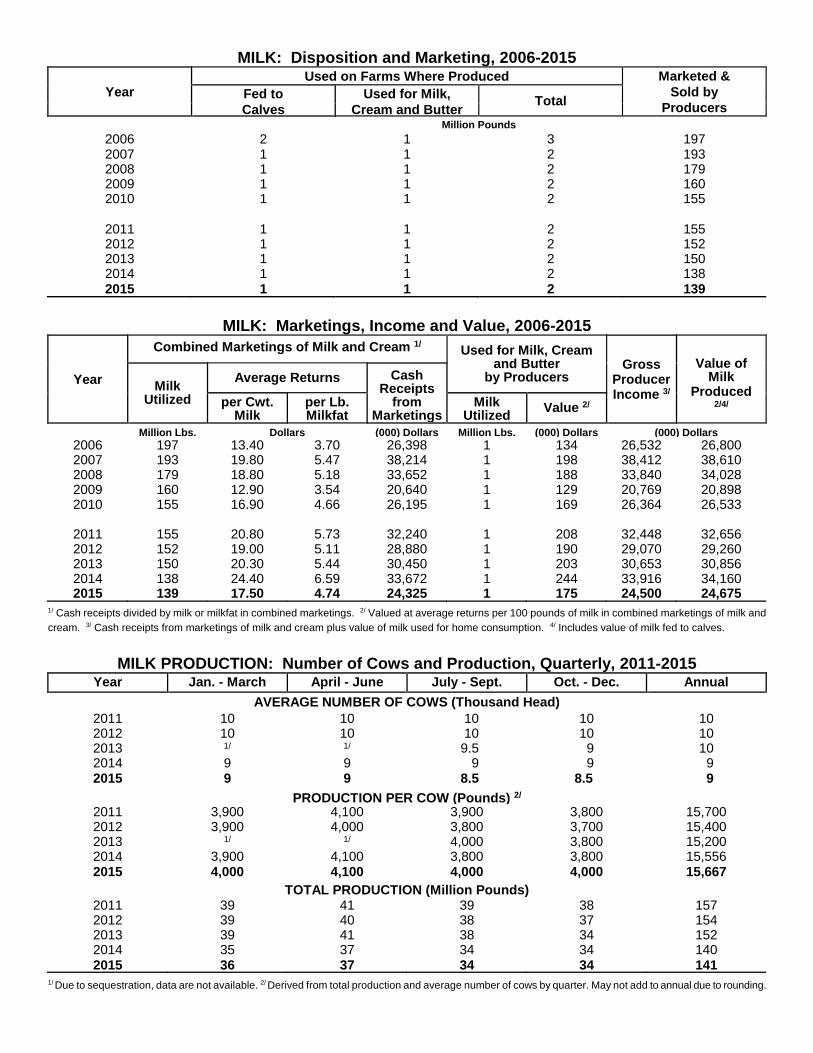
MILK: Disposition and Marketing, 2006-2015
Year
Used on Farms Where Produced Marketed &
Sold by
Producers Fed to
Calves
Used for Milk,
Cream and Butter Total
Million Pounds 2006 2 1 3 197 2007 1 1 2 193 2008 1 1 2 179 2009 1 1 2 160 2010 1 1 2 155
2011 1 1 2 155 2012 1 1 2 152 2013 1 1 2 150 2014 1 1 2 138 2015 1 1 2 139
MILK: Marketings, Income and Value, 2006-2015
Year
Combined Marketings of Milk and Cream 1/ Used for Milk, Cream
and Butter by Producers
Gross Producer Income 3/
Value of
Milk Produced
2/4/
Milk Utilized
Average Returns Cash Receipts
from Marketings
per Cwt. Milk
per Lb. Milkfat
Milk Utilized
Value 2/
Million Lbs.
Dollars
(000) Dollars
Million Lbs.
(000) Dollars
(000) Dollars 2006 197 13.40 3.70 26,398 1 134 26,532 26,800 2007 193 19.80 5.47 38,214 1 198 38,412 38,610 2008 179 18.80 5.18 33,652 1 188 33,840 34,028 2009 160 12.90 3.54 20,640 1 129 20,769 20,898 2010 155 16.90 4.66 26,195 1 169 26,364 26,533
2011 155 20.80 5.73 32,240 1 208 32,448 32,656 2012 152 19.00 5.11 28,880 1 190 29,070 29,260 2013 150 20.30 5.44 30,450 1 203 30,653 30,856 2014 138 24.40 6.59 33,672 1 244 33,916 34,160 2015 139 17.50 4.74 24,325 1 175 24,500 24,675
1/ Cash receipts divided by milk or milkfat in combined marketings. 2/ Valued at average returns per 100 pounds of milk in combined marketings of milk and
cream. 3/ Cash receipts from marketings of milk and cream plus value of milk used for home consumption. 4/ Includes value of milk fed to calves.
MILK PRODUCTION: Number of Cows and Production, Quarterly, 2011-2015 Year Jan. - March April - June July - Sept. Oct. - Dec. Annual
AVERAGE NUMBER OF COWS (Thousand Head)
2011 10 10 10 10 10 2012 10 10 10 10 10 2013 1/ 1/ 9.5 9 10 2014 9 9 9 09 9 2015 9 9 8.5 8.5 9
PRODUCTION PER COW (Pounds) 2/ 2011 3,900 4,100 3,900 3,800 15,700 2012 3,900 4,000 3,800 3,700 15,400 2013 1/ 1/ 4,000 3,800 15,200 2014 3,900 4,100 3,800 3,800 15,556 2015 4,000 4,100 4,000 4,000 15,667
TOTAL PRODUCTION (Million Pounds)
2011 39 41 39 38 157 2012 39 40 38 37 154 2013 39 41 38 34 152 2014 35 37 34 34 140 2015 36 37 34 34 141
1/ Due to sequestration, data are not available. 2/ Derived from total production and average number of cows by quarter. May not add to annual due to rounding.
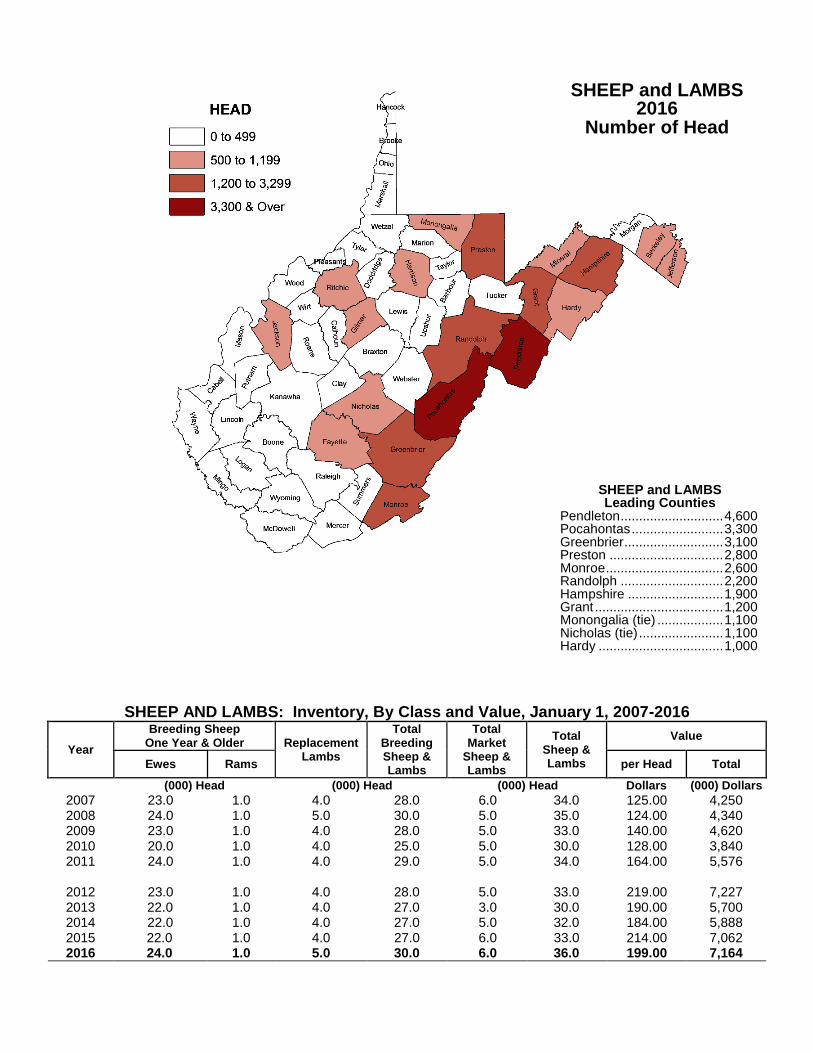
SHEEP AND LAMBS: Inventory, By Class and Value, January 1, 2007-2016
Year
Breeding Sheep One Year & Older Replacement
Lambs
Total Breeding Sheep & Lambs
Total Market
Sheep & Lambs
Total Sheep & Lambs
Value
Ewes Rams per Head Total
(000) Head (000) Head (000) Head Dollars (000) Dollars
2007 23.0 1.0 4.0 28.0 6.0 34.0 125.00 4,250 2008 24.0 1.0 5.0 30.0 5.0 35.0 124.00 4,340 2009 23.0 1.0 4.0 28.0 5.0 33.0 140.00 4,620 2010 20.0 1.0 4.0 25.0 5.0 30.0 128.00 3,840 2011 24.0 1.0 4.0 29.0 5.0 34.0 164.00 5,576
2012 23.0 1.0 4.0 28.0 5.0 33.0 219.00 7,227 2013 22.0 1.0 4.0 27.0 3.0 30.0 190.00 5,700 2014 22.0 1.0 4.0 27.0 5.0 32.0 184.00 5,888 2015 22.0 1.0 4.0 27.0 6.0 33.0 214.00 7,062 2016 24.0 1.0 5.0 30.0 6.0 36.0 199.00 7,164
SHEEP and LAMBS 2016 Number of Head
SHEEP and LAMBS Leading Counties Pendleton ............................ 4,600 Pocahontas ......................... 3,300 Greenbrier ........................... 3,100 Preston ............................... 2,800 Monroe ................................ 2,600 Randolph ............................ 2,200 Hampshire .......................... 1,900 Grant ................................... 1,200 Monongalia (tie) .................. 1,100 Nicholas (tie) ....................... 1,100 Hardy .................................. 1,000
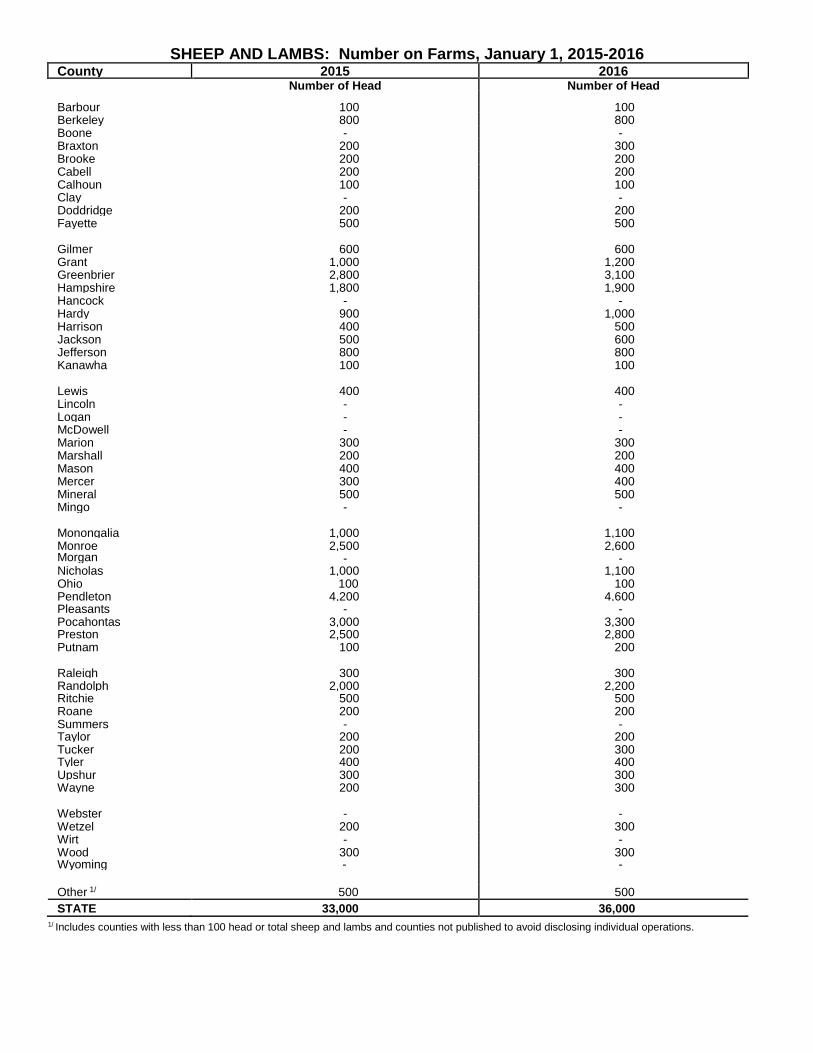
SHEEP AND LAMBS: Number on Farms, January 1, 2015-2016
County 2015 2016 Number of Head Number of Head Barbour 100 100 Berkeley 800 800 Boone - - Braxton 200 300 Brooke 200 200 Cabell 200 200 Calhoun 100 100 Clay - - Doddridge 200 200 Fayette 500 500 Gilmer 600 600 Grant 1,000 1,200 Greenbrier 2,800 3,100 Hampshire 1,800 1,900 Hancock - - Hardy 900 1,000 Harrison 400 500 Jackson 500 600 Jefferson 800 800 Kanawha 100 100 Lewis 400 400 Lincoln - - Logan - - McDowell - - Marion 300 300 Marshall 200 200 Mason 400 400 Mercer 300 400 Mineral 500 500 Mingo - - Monongalia 1,000 1,100 Monroe 2,500 2,600 Morgan - - Nicholas 1,000 1,100 Ohio 100 100 Pendleton 4,200 4,600 Pleasants - - Pocahontas 3,000 3,300 Preston 2,500 2,800 Putnam 100 200 Raleigh 300 300 Randolph 2,000 2,200 Ritchie 500 500 Roane 200 200 Summers - - Taylor 200 200 Tucker 200 300 Tyler 400 400 Upshur 300 300 Wayne 200 300 Webster - - Wetzel 200 300 Wirt - - Wood 300 300 Wyoming - -
Other 1/ 500 500
STATE 33,000 36,000
1/ Includes counties with less than 100 head or total sheep and lambs and counties not published to avoid disclosing individual operations.
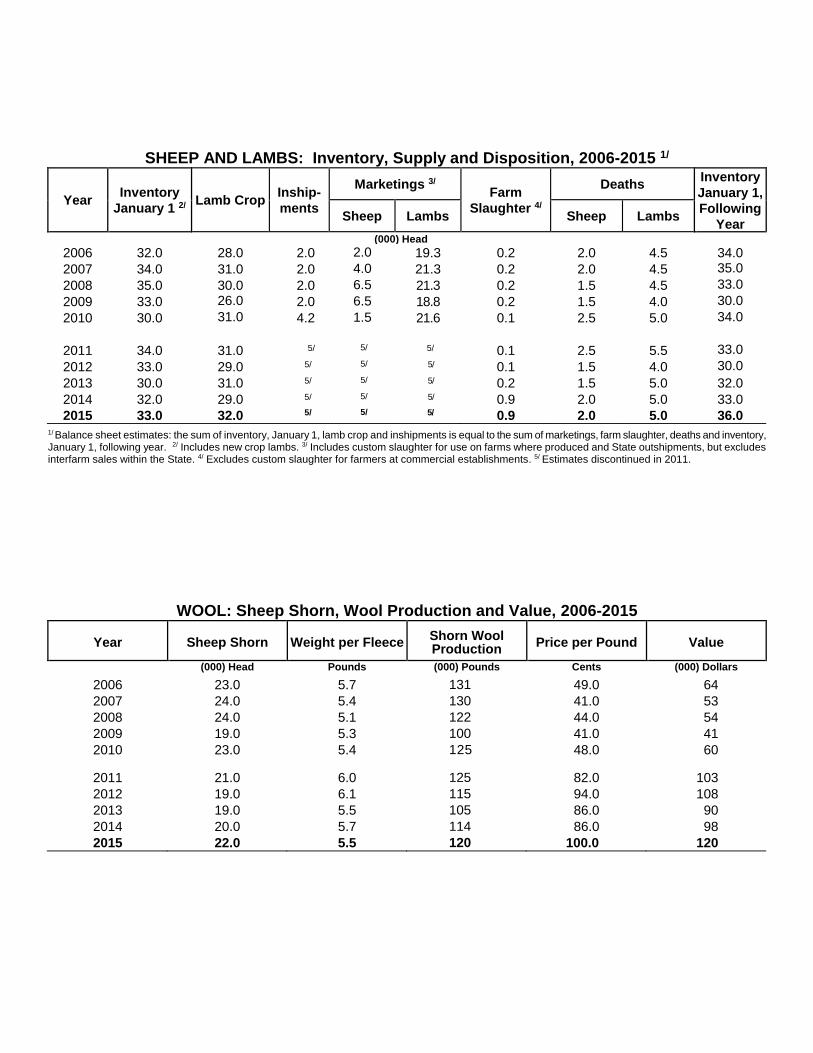
SHEEP AND LAMBS: Inventory, Supply and Disposition, 2006-2015 1/
Year Inventory
January 1 2/ Lamb Crop
Inship-
ments
Marketings 3/ Farm
Slaughter 4/
Deaths Inventory
January 1,
Following
Year Sheep Lambs Sheep Lambs
(000) Head 2006 32.0 28.0 2.0 2.0 19.3 0.2 2.0 4.5 34.0
2007 34.0 31.0 2.0 4.0 21.3 0.2 2.0 4.5 35.0 3 2008 35.0 30.0 2.0 6.5 21.3 0.2 1.5 4.5 33.0
2009 33.0 26.0 21
2.0 6.5 18.8 0.2 1.5 4.0 30.0 2010 30.0 31.0
4.2 1.5 21.6 0.1 2.5 5.0 34.0
2011 34.0 31.0 5/ 5/ 5/ 0.1 2.5 5.5 33.0
2012 33.0 29.0 5/ 5/ 5/ 0.1 1.5 4.0 30.0
2013 30.0 31.0 5/ 5/ 5/ 0.2 1.5 5.0 32.0
2014 32.0 29.0 5/ 5/ 5/ 0.9 2.0 5.0 33.0
2015 33.0 32.0 5/ 5/ 5/ 0.9 2.0 5.0 36.0
1/ Balance sheet estimates: the sum of inventory, January 1, lamb crop and inshipments is equal to the sum of marketings, farm slaughter, deaths and inventory, January 1, following year. 2/ Includes new crop lambs. 3/ Includes custom slaughter for use on farms where produced and State outshipments, but excludes interfarm sales within the State. 4/ Excludes custom slaughter for farmers at commercial establishments. 5/
Estimates discontinued in 2011.
WOOL: Sheep Shorn, Wool Production and Value, 2006-2015
Year
Sheep Shorn
Weight per Fleece
Shorn Wool Production
Price per Pound
Value
(000) Head Pounds (000) Pounds Cents (000) Dollars
2006 23.0 5.7 131 49.0 64
2007 24.0 5.4 130 41.0 53
2008 24.0 5.1 122 44.0 54
2009 19.0 5.3 100 41.0 41
2010 23.0 5.4 125 48.0 60
2011 21.0 6.0 125 82.0 103
2012 19.0 6.1 115 94.0 108
2013 19.0 5.5 105 86.0 90
2014 20.0 5.7 114 86.0 98
2015 22.0 5.5 120 100.0 120
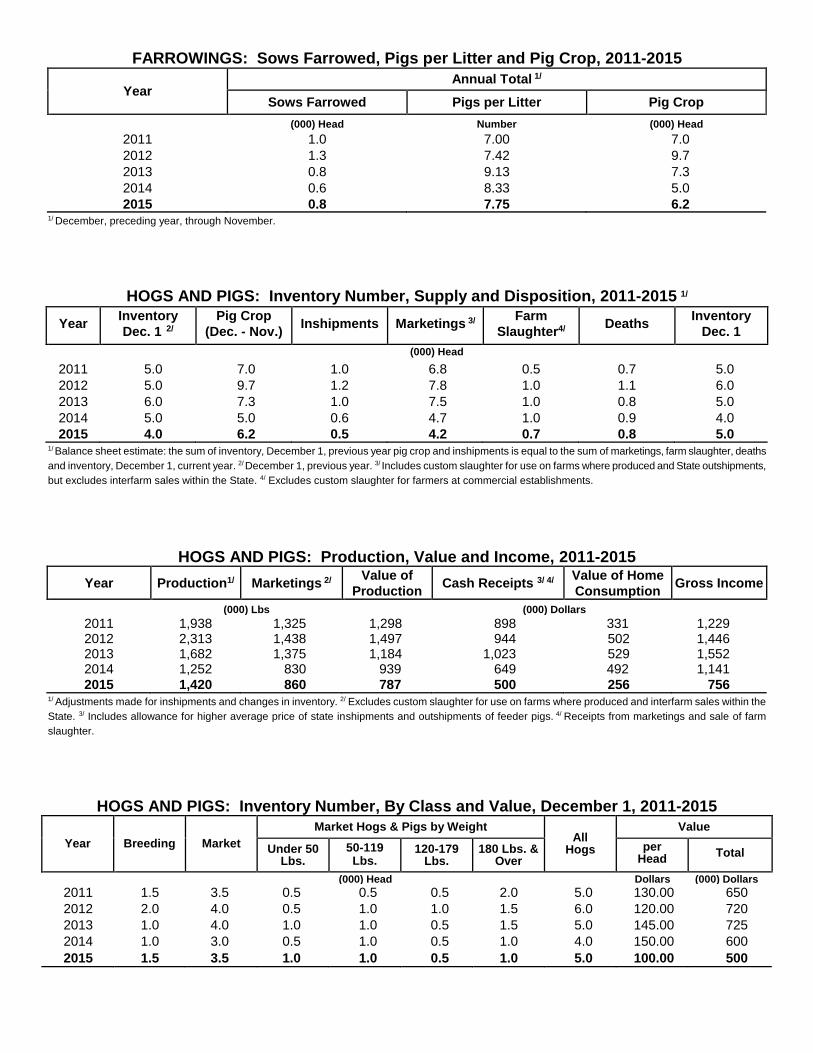
FARROWINGS: Sows Farrowed, Pigs per Litter and Pig Crop, 2011-2015
Year Annual Total 1/
Sows Farrowed Pigs per Litter Pig Crop
(000) Head Number (000) Head
2011 1.0 7.00 7.0
2012 1.3 7.42 9.7
2013 0.8 9.13 7.3
2014 0.6 8.33 5.0
2015 0.8 7.75 6.2 1/ December, preceding year, through November.
HOGS AND PIGS: Inventory Number, Supply and Disposition, 2011-2015 1/
Year Inventory
Dec. 1 2/
Pig Crop
(Dec. - Nov.) Inshipments Marketings 3/
Farm
Slaughter4/ Deaths
Inventory
Dec. 1
(000) Head
2011 5.0 7.0 1.0 6.8 0.5 0.7 5.0
2012 5.0 9.7 1.2 7.8 1.0 1.1 6.0
2013 6.0 7.3 1.0 7.5 1.0 0.8 5.0
2014 5.0 5.0 0.6 4.7 1.0 0.9 4.0
2015 4.0 6.2 0.5 4.2 0.7 0.8 5.0 1/ Balance sheet estimate: the sum of inventory, December 1, previous year pig crop and inshipments is equal to the sum of marketings, farm slaughter, deaths
and inventory, December 1, current year. 2/ December 1, previous year. 3/ Includes custom slaughter for use on farms where produced and State outshipments,
but excludes interfarm sales within the State. 4/ Excludes custom slaughter for farmers at commercial establishments.
HOGS AND PIGS: Production, Value and Income, 2011-2015
Year Production1/ Marketings 2/ Value of
Production Cash Receipts 3/ 4/
Value of Home
Consumption Gross Income
(000) Lbs (000) Dollars 2011 1,938 1,325 1,298 898 331 1,229 2012 2,313 1,438 1,497 944 502 1,446 2013 1,682 1,375 1,184 1,023 529 1,552 2014 1,252 830 939 649 492 1,141
2015 1,420 860 787 500 256 756 1/ Adjustments made for inshipments and changes in inventory. 2/ Excludes custom slaughter for use on farms where produced and interfarm sales within the
State. 3/ Includes allowance for higher average price of state inshipments and outshipments of feeder pigs. 4/ Receipts from marketings and sale of farm
slaughter.
HOGS AND PIGS: Inventory Number, By Class and Value, December 1, 2011-2015
Year Breeding Market
Market Hogs & Pigs by Weight All
Hogs
Value
Under 50 Lbs.
50-119 Lbs.
120-179 Lbs.
180 Lbs. & Over
per Head
Total
(000) Head Dollars (000) Dollars
2011 1.5 3.5 0.5 0.5 0.5 2.0 5.0 130.00 650
2012 2.0 4.0 0.5 1.0 1.0 1.5 6.0 120.00 720
2013 1.0 4.0 1.0 1.0 0.5 1.5 5.0 145.00 725
2014 1.0 3.0 0.5 1.0 0.5 1.0 4.0 150.00 600
2015 1.5 3.5 1.0 1.0 0.5 1.0 5.0 100.00 500
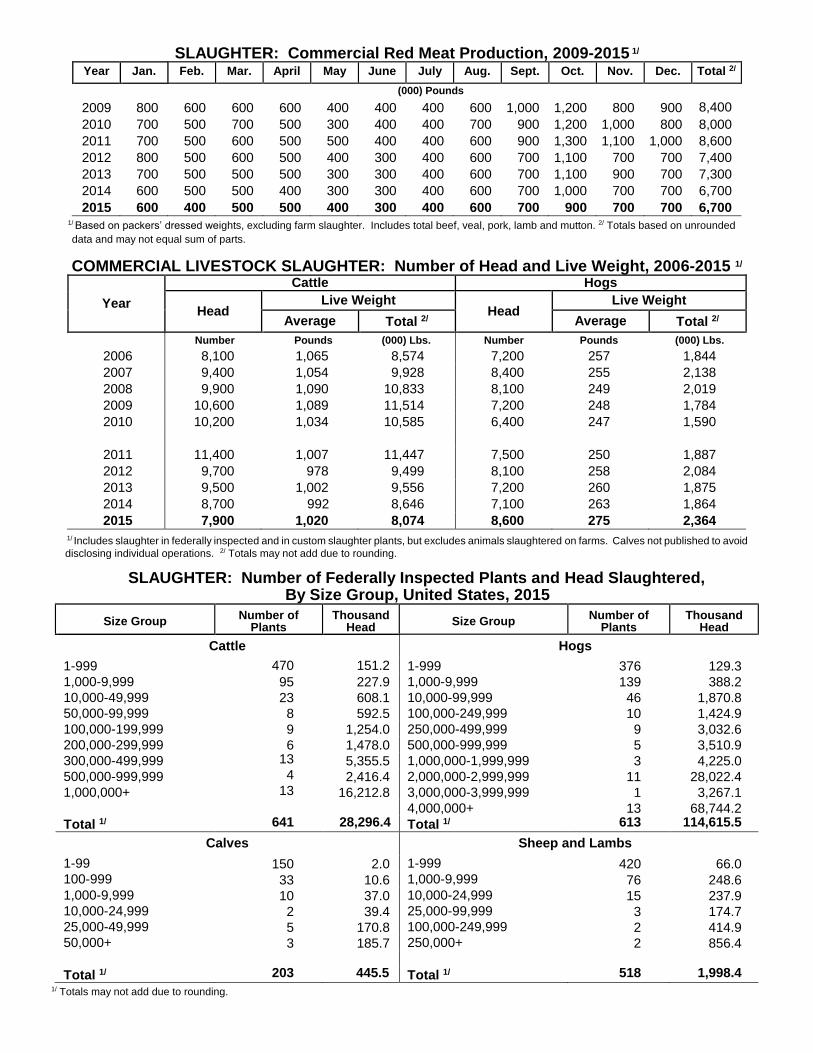
SLAUGHTER: Commercial Red Meat Production, 2009-2015 1/
Year Jan. Feb. Mar. April May June July Aug. Sept. Oct. Nov. Dec. Total 2/
(000) Pounds
2009 800 600 600 600 400 400 400 600 1,000 1,200 800 900 8,400
2010 700 500 700 500 300 400 400 700 900 1,200 1,000 800 8,000
2011 700 500 600 500 500 400 400 600 900 1,300 1,100 1,000 8,600
2012 800 500 600 500 400 300 400 600 700 1,100 700 700 7,400
2013 700 500 500 500 300 300 400 600 700 1,100 900 700 7,300
2014 600 500 500 400 300 300 400 600 700 1,000 700 700 6,700
2015 600 400 500 500 400 300 400 600 700 900 700 700 6,700 1/ Based on packers’ dressed weights, excluding farm slaughter. Includes total beef, veal, pork, lamb and mutton. 2/ Totals based on unrounded
data and may not equal sum of parts.
COMMERCIAL LIVESTOCK SLAUGHTER: Number of Head and Live Weight, 2006-2015 1/
Year
Cattle Hogs
Head
Live Weight
Head
Live Weight
Average
Total 2/
Average
Total 2/
Number
Pounds
(000) Lbs.
Number
Pounds
(000) Lbs.
2006 8,100 1,065 8,574 7,200 257 1,844
2007 9,400 1,054 9,928 8,400 255 2,138
2008 9,900 1,090 10,833 8,100 249 2,019
2009 10,600 1,089 11,514 7,200 248 1,784
2010 10,200 1,034 10,585 6,400 247 1,590
2011 11,400 1,007 11,447 7,500 250 1,887
2012 9,700 978 9,499 8,100 258 2,084
2013 9,500 1,002 9,556 7,200 260 1,875
2014 8,700 992 8,646 7,100 263 1,864
2015 7,900 1,020 8,074 8,600 275 2,364
1/ Includes slaughter in federally inspected and in custom slaughter plants, but excludes animals slaughtered on farms. Calves not published to avoid
disclosing individual operations. 2/ Totals may not add due to rounding.
SLAUGHTER: Number of Federally Inspected Plants and Head Slaughtered, By Size Group, United States, 2015
Size Group
Number of
Plants
Thousand
Head
Size Group
Number of
Plants
Thousand
Head
Cattle
Hogs 1-999 470
151.2
1-999 376 129.3
1,000-9,999 95 227.9 1,000-9,999 139 388.2
10,000-49,999 23 608.1 10,000-99,999 46 1,870.8
50,000-99,999 8 592.5 100,000-249,999 10 1,424.9
100,000-199,999 9 1,254.0 250,000-499,999 9 3,032.6
200,000-299,999 6 1,478.0 500,000-999,999 5 3,510.9
300,000-499,999 13 5,355.5 1,000,000-1,999,999 3 4,225.0
500,000-999,999 4 2,416.4 2,000,000-2,999,999 11 28,022.4
1,000,000+ 13 16,212.8 3,000,000-3,999,999 1 3,267.1
4,000,000+ 13 68,744.2
Total 1/ 641 28,296.4 Total 1/ 613 114,615.5
Calves Sheep and Lambs
1-99 150 2.0 1-999 420 66.0 100-999 33 10.6 1,000-9,999 76 248.6 1,000-9,999 10 37.0 10,000-24,999 15 237.9 10,000-24,999 2 39.4 25,000-99,999 3 174.7 25,000-49,999 5 170.8 100,000-249,999 2 414.9 50,000+ 3 185.7 250,000+ 2 856.4 Total 1/ 203 445.5
Total 1/ 518 1,998.4
1/ Totals may not add due to rounding.
Poultry
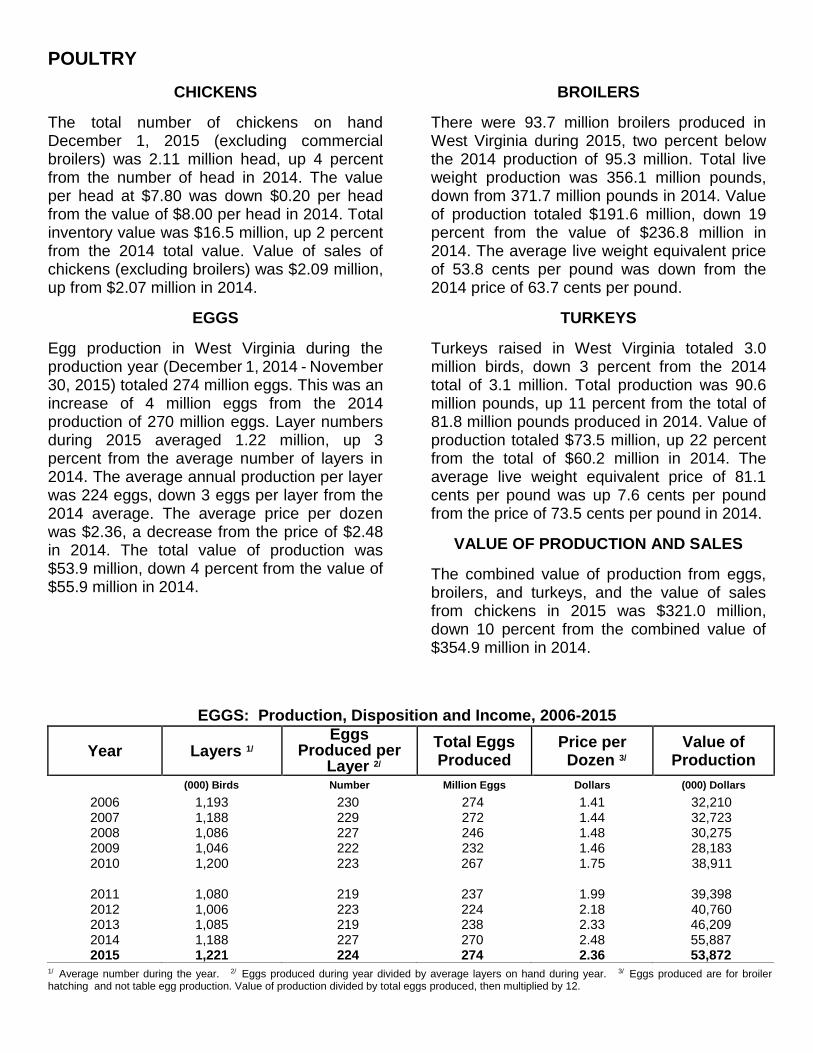
POULTRY
CHICKENS
The total number of chickens on hand December 1, 2015 (excluding commercial broilers) was 2.11 million head, up 4 percent from the number of head in 2014. The value per head at $7.80 was down $0.20 per head from the value of $8.00 per head in 2014. Total inventory value was $16.5 million, up 2 percent from the 2014 total value. Value of sales of chickens (excluding broilers) was $2.09 million, up from $2.07 million in 2014.
EGGS
Egg production in West Virginia during the production year (December 1, 2014 - November 30, 2015) totaled 274 million eggs. This was an increase of 4 million eggs from the 2014 production of 270 million eggs. Layer numbers during 2015 averaged 1.22 million, up 3 percent from the average number of layers in 2014. The average annual production per layer was 224 eggs, down 3 eggs per layer from the 2014 average. The average price per dozen was $2.36, a decrease from the price of $2.48 in 2014. The total value of production was $53.9 million, down 4 percent from the value of $55.9 million in 2014.
BROILERS There were 93.7 million broilers produced in West Virginia during 2015, two percent below the 2014 production of 95.3 million. Total live weight production was 356.1 million pounds, down from 371.7 million pounds in 2014. Value of production totaled $191.6 million, down 19 percent from the value of $236.8 million in 2014. The average live weight equivalent price of 53.8 cents per pound was down from the 2014 price of 63.7 cents per pound.
TURKEYS Turkeys raised in West Virginia totaled 3.0 million birds, down 3 percent from the 2014 total of 3.1 million. Total production was 90.6 million pounds, up 11 percent from the total of 81.8 million pounds produced in 2014. Value of production totaled $73.5 million, up 22 percent from the total of $60.2 million in 2014. The average live weight equivalent price of 81.1 cents per pound was up 7.6 cents per pound from the price of 73.5 cents per pound in 2014.
VALUE OF PRODUCTION AND SALES
The combined value of production from eggs, broilers, and turkeys, and the value of sales from chickens in 2015 was $321.0 million, down 10 percent from the combined value of $354.9 million in 2014.
EGGS: Production, Disposition and Income, 2006-2015
1/ Average number during the year. 2/ Eggs produced during year divided by average layers on hand during year. 3/ Eggs produced are for broiler hatching and not table egg production. Value of production divided by total eggs produced, then multiplied by 12.
Year Layers 1/ Eggs
Produced per Layer 2/
Total Eggs Produced
Price per Dozen 3/
Value of Production
(000) Birds Number Million Eggs Dollars (000) Dollars 2006 1,193 230 274 1.41 32,210 2007 1,188 229 272 1.44 32,723 2008 1,086 227 246 1.48 30,275 2009 1,046 222 232 1.46 28,183 2010 1,200 223 267 1.75 38,911
2011 1,080 219 237 1.99 39,398 2012 1,006 223 224 2.18 40,760 2013 1,085 219 238 2.33 46,209 2014 1,188 227 270 2.48 55,887 2015 1,221 224 274 2.36 53,872
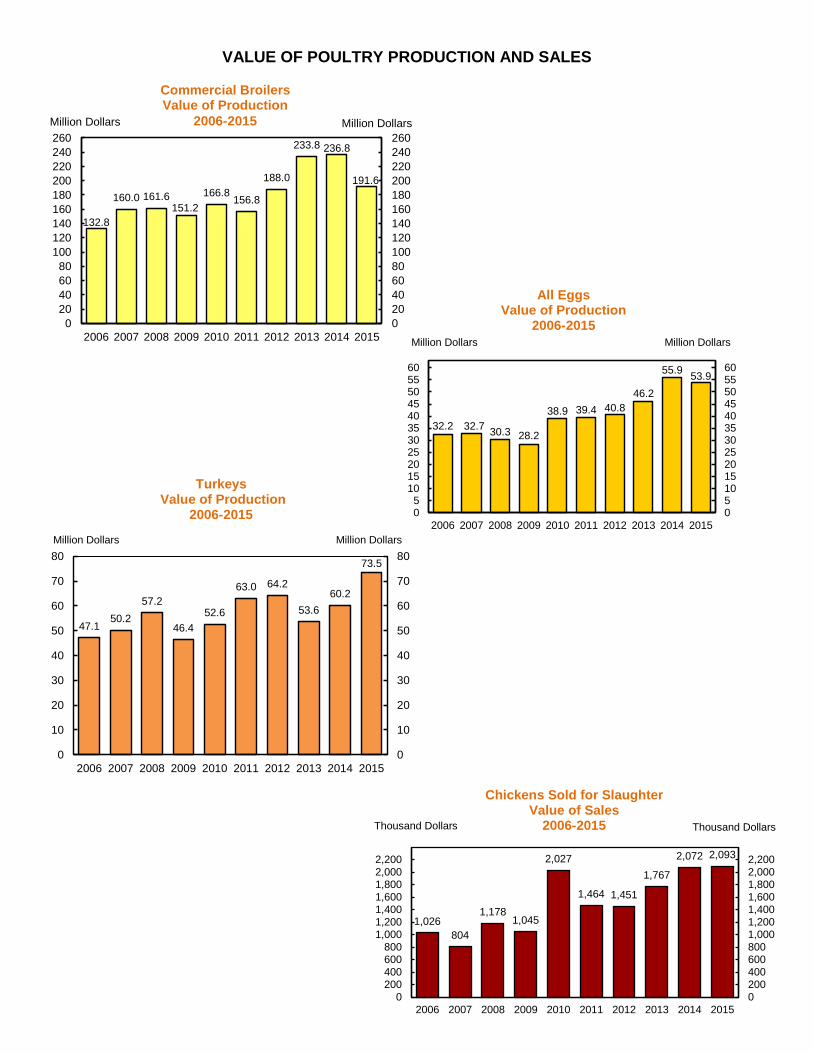
47.150.2
57.2
46.4
52.6
63.0 64.2
53.6
60.2
73.5
0
10
20
30
40
50
60
70
80
0
10
20
30
40
50
60
70
80
2006 2007 2008 2009 2010 2011 2012 2013 2014 2015
Million DollarsMillion Dollars
1,026
804
1,1781,045
2,027
1,464 1,451
1,767
2,072 2,093
02004006008001,0001,2001,4001,6001,8002,0002,200
0200400600800
1,0001,2001,4001,6001,8002,0002,200
2006 2007 2008 2009 2010 2011 2012 2013 2014 2015
Thousand Dollars Thousand Dollars
VALUE OF POULTRY PRODUCTION AND SALES
Commercial Broilers Value of Production
2006-2015
32.2 32.7 30.3 28.2
38.9 39.4 40.8
46.2
55.953.9
051015202530354045505560
05
1015202530354045505560
2006 2007 2008 2009 2010 2011 2012 2013 2014 2015
132.8
160.0 161.6151.2
166.8156.8
188.0
233.8 236.8
191.6
0
20
40
60
80
100
120
140
160
180
200
220
240
260
0
20
40
60
80
100
120
140
160
180
200
220
240
260
2006 2007 2008 2009 2010 2011 2012 2013 2014 2015
Million DollarsMillion Dollars
Turkeys Value of Production
2006-2015
All Eggs Value of Production
2006-2015
Million Dollars Million Dollars
Chickens Sold for Slaughter Value of Sales
2006-2015
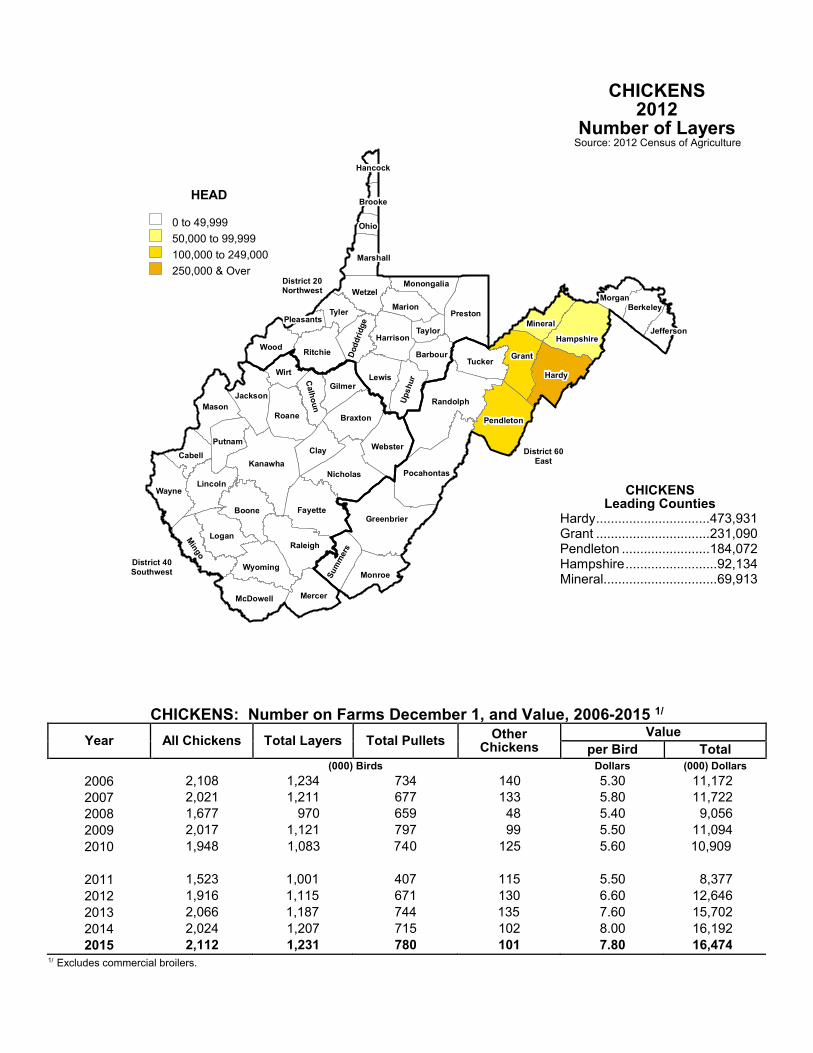
District 40
Southwest
District 60
East
District 20Northwest
HEAD
0 to 49,999
50,000 to 199,999
200,000 to 499,999
500,000 & Over
Randolph
Kanawha
Greenbrier
Hardy
Fayette
Preston
Grant
Pocahontas
Raleigh
Nicholas
Boone
Wayne
Roane
Clay
Logan
Pendleton
Webster
Mason
Braxton
Lewis
RitchieWood
Monroe
Tucker
Hampshire
Lincoln
Wyoming
Wirt
Gilmer
Harrison
Barbour
Min
go
Mercer
Jackson
McDowell
Wetzel
Tyler
Up
sh
ur
Putnam
Cabell
Marion
MineralS
um
mers
Berkeley
Marshall
Calh
ou
n
Monongalia
Dod
dri
dg
e
Morgan
Taylor Jefferson
Ohio
Pleasants
Brooke
Hancock
CHICKENS: Number on Farms December 1, and Value, 2006-2015 1/
Year
All Chickens
Total Layers
Total Pullets
Other
Chickens
Value
per Bird
Total
(000) Birds
Dollars
(000) Dollars
2006 2,108 1,234 734 140 5.30 11,172
2007 2,021 1,211 677 133 5.80 11,722
2008 1,677 970 659 48 5.40 9,056
2009 2,017 1,121 797 99 5.50 11,094
2010 1,948 1,083 740 125 5.60 10,909
2011 1,523 1,001 407 115 5.50 8,377
2012 1,916 1,115 671 130 6.60 12,646
2013 2,066 1,187 744 135 7.60 15,702
2014 2,024 1,207 715 102 8.00 16,192
2015 2,112 1,231 780 101 7.80 16,474
1/ Excludes commercial broilers.
CHICKENS 2012 Number of Layers Source: 2012 Census of Agriculture
CHICKENS Leading Counties Hardy ............................... 473,931 Grant ............................... 231,090 Pendleton ........................ 184,072 Hampshire ......................... 92,134 Mineral............................... 69,913
0 to 49,999
50,000 to 99,999
100,000 to 249,000
250,000 & Over
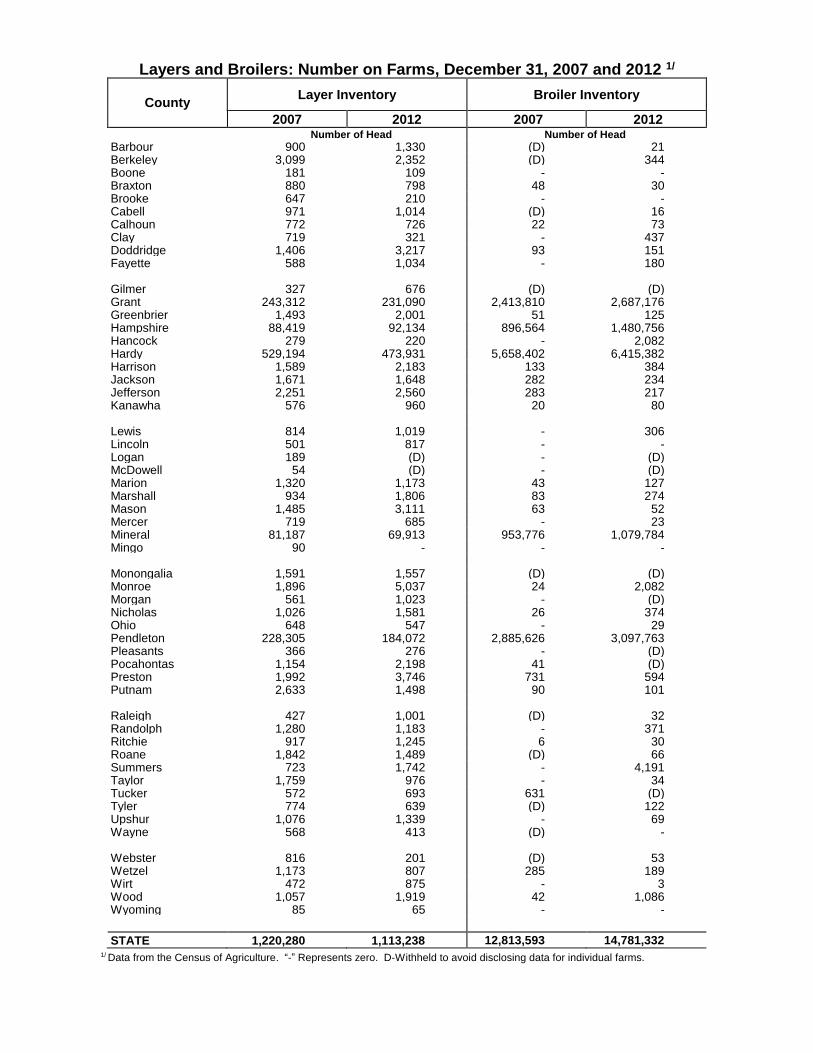
Layers and Broilers: Number on Farms, December 31, 2007 and 2012 1/
County Layer Inventory Broiler Inventory
2007 2012 2007 2012 Number of Head Number of Head Barbour 900 1,330 (D) 21 Berkeley 3,099 2,352 (D) 344 Boone 181 109 - - Braxton 880 798 48 30 Brooke 647 210 - - Cabell 971 1,014 (D) 16 Calhoun 772 726 22 73 Clay 719 321 - 437 Doddridge 1,406 3,217 93 151 Fayette 588 1,034 - 180 Gilmer 327 676 (D) (D) Grant 243,312 231,090 2,413,810 2,687,176 Greenbrier 1,493 2,001 51 125 Hampshire 88,419 92,134 896,564 1,480,756 Hancock 279 220 - 2,082 Hardy 529,194 473,931 5,658,402 6,415,382 Harrison 1,589 2,183 133 384 Jackson 1,671 1,648 282 234 Jefferson 2,251 2,560 283 217 Kanawha 576 960 20 80 Lewis 814 1,019 - 306 Lincoln 501 817 - - Logan 189 (D) - (D) McDowell 54 (D) - (D) Marion 1,320 1,173 43 127 Marshall 934 1,806 83 274 Mason 1,485 3,111 63 52 Mercer 719 685 - 23 Mineral 81,187 69,913 953,776 1,079,784 Mingo 90 - - - Monongalia 1,591 1,557 (D) (D) Monroe 1,896 5,037 24 2,082 Morgan 561 1,023 - (D) Nicholas 1,026 1,581 26 374 Ohio 648 547 - 29 Pendleton 228,305 184,072 2,885,626 3,097,763 Pleasants 366 276 - (D) Pocahontas 1,154 2,198 41 (D) Preston 1,992 3,746 731 594 Putnam 2,633 1,498 90 101 Raleigh 427 1,001 (D) 32 Randolph 1,280 1,183 - 371 Ritchie 917 1,245 6 30 Roane 1,842 1,489 (D) 66 Summers 723 1,742 - 4,191 Taylor 1,759 976 - 34 Tucker 572 693 631 (D) Tyler 774 639 (D) 122 Upshur 1,076 1,339 - 69 Wayne 568 413 (D) - Webster 816 201 (D) 53 Wetzel 1,173 807 285 189 Wirt 472 875 - 3 Wood 1,057 1,919 42 1,086 Wyoming 85 65 - -
STATE 1,220,280 1,113,238 12,813,593 14,781,332 1/ Data from the Census of Agriculture. “-” Represents zero. D-Withheld to avoid disclosing data for individual farms.
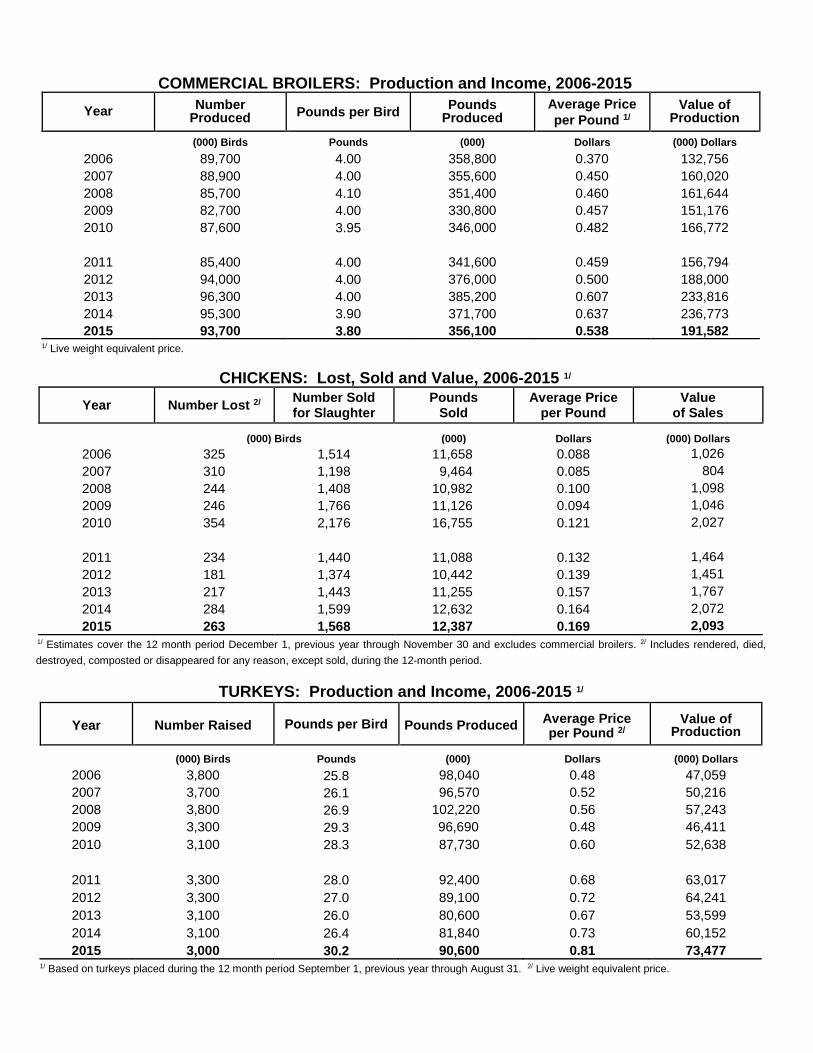
COMMERCIAL BROILERS: Production and Income, 2006-2015
Year Number
Produced
Pounds per Bird
Pounds Produced
Average Price
per Pound 1/ Value of
Production
(000) Birds Pounds (000) Dollars (000) Dollars
2006 89,700 4.00 358,800 0.370 132,756
2007 88,900 4.00 355,600 0.450 160,020
2008 85,700 4.10 351,400 0.460 161,644
2009 82,700 4.00 330,800 0.457 151,176
2010 87,600 3.95 346,000 0.482 166,772
2011 85,400 4.00 341,600 0.459 156,794
2012 94,000 4.00 376,000 0.500 188,000
2013 96,300 4.00 385,200 0.607 233,816
2014 95,300 3.90 371,700 0.637 236,773
2015 93,700 3.80 356,100 0.538 191,582 1/ Live weight equivalent price.
CHICKENS: Lost, Sold and Value, 2006-2015 1/
Year Number Lost 2/ Number Sold for Slaughter
Pounds Sold
Average Price per Pound
Value of Sales
(000) Birds
(000)
Dollars
(000) Dollars
2006 325 1,514 11,658 0.088 1,026
2007 310 1,198 9,464 0.085 804
2008 244 1,408 10,982 0.100 1,098
2009 246 1,766 11,126 0.094 1,046
2010 354 2,176 16,755 0.121 2,027
2011 234 1,440 11,088 0.132 1,464
2012 181 1,374 10,442 0.139 1,451
2013 217 1,443 11,255 0.157 1,767
2014 284 1,599 12,632 0.164 2,072
2015 263 1,568 12,387 0.169 2,093 1/ Estimates cover the 12 month period December 1, previous year through November 30 and excludes commercial broilers. 2/ Includes rendered, died,
destroyed, composted or disappeared for any reason, except sold, during the 12-month period.
TURKEYS: Production and Income, 2006-2015 1/
Year
Number Raised
Pounds per Bird
Pounds Produced
Average Price per Pound 2/
Value of
Production
(000) Birds Pounds (000) Dollars (000) Dollars
2006 3,800 25.8 98,040 0.48 47,059
2007 3,700 26.1 96,570 0.52 50,216
2008 3,800 26.9 102,220 0.56 57,243
2009 3,300 29.3 96,690 0.48 46,411
2010 3,100 28.3 87,730 0.60 52,638
2011 3,300 28.0 92,400 0.68 63,017
2012 3,300 27.0 89,100 0.72 64,241
2013 3,100 26.0 80,600 0.67 53,599
2014 3,100 26.4 81,840 0.73 60,152
2015 3,000 30.2 90,600 0.81 73,477 1/ Based on turkeys placed during the 12 month period September 1, previous year through August 31. 2/ Live weight equivalent price.
Economics
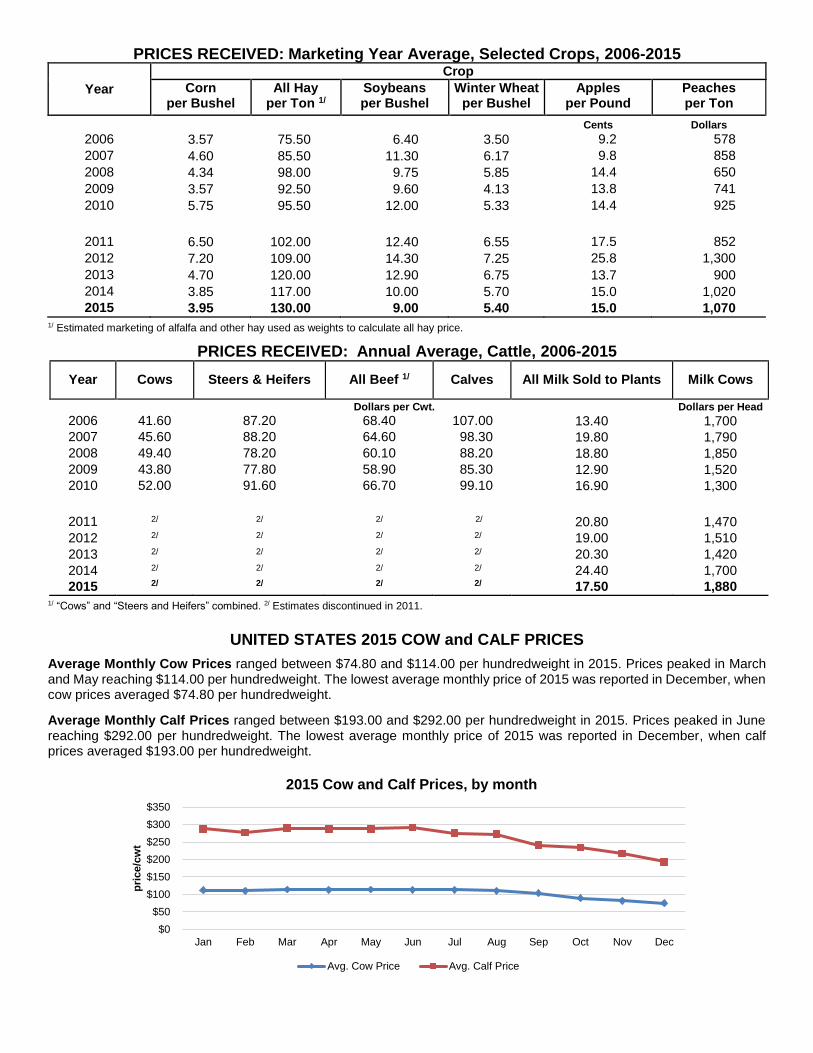
PRICES RECEIVED: Marketing Year Average, Selected Crops, 2006-2015
Year
Crop
Corn per Bushel
All Hay per Ton 1/
Soybeans per Bushel
Winter Wheat per Bushel
Apples per Pound
Peaches per Ton
Cents Dollars
2006 3.57 75.50 6.40 3.50 9.2 578
2007 4.60 85.50 11.30 6.17 9.8 858
2008 4.34 98.00 9.75 5.85 14.4 650
2009 3.57 92.50 9.60 4.13 13.8 741
2010 5.75 95.50 12.00 5.33 14.4 925
2011 6.50 102.00 12.40 6.55 17.5 852
2012 7.20 109.00 14.30 7.25 25.8 1,300
2013 4.70 120.00 12.90 6.75 13.7 900
2014 3.85 117.00 10.00 5.70 15.0 1,020
2015 3.95 130.00 9.00 5.40 15.0 1,070
1/ Estimated marketing of alfalfa and other hay used as weights to calculate all hay price.
PRICES RECEIVED: Annual Average, Cattle, 2006-2015
Year Cows Steers & Heifers All Beef 1/ Calves All Milk Sold to Plants Milk Cows
Dollars per Cwt. Dollars per Head
2006 41.60 87.20 68.40 107.00 13.40 1,700
2007 45.60 88.20 64.60 98.30 19.80 1,790
2008 49.40 78.20 60.10 88.20 18.80 1,850
2009 43.80 77.80 58.90 85.30 12.90 1,520
2010 52.00 91.60 66.70 99.10 16.90 1,300
2011 2/ 2/ 2/ 2/ 20.80 1,470
2012 2/ 2/ 2/ 2/ 19.00 1,510
2013 2/ 2/ 2/ 2/ 20.30 1,420
2014 2/ 2/ 2/ 2/ 24.40 1,700
2015 2/ 2/ 2/ 2/ 17.50 1,880
1/ “Cows” and “Steers and Heifers” combined. 2/ Estimates discontinued in 2011.
UNITED STATES 2015 COW and CALF PRICES
Average Monthly Cow Prices ranged between $74.80 and $114.00 per hundredweight in 2015. Prices peaked in March and May reaching $114.00 per hundredweight. The lowest average monthly price of 2015 was reported in December, when cow prices averaged $74.80 per hundredweight. Average Monthly Calf Prices ranged between $193.00 and $292.00 per hundredweight in 2015. Prices peaked in June reaching $292.00 per hundredweight. The lowest average monthly price of 2015 was reported in December, when calf prices averaged $193.00 per hundredweight.
$0
$50
$100
$150
$200
$250
$300
$350
Jan Feb Mar Apr May Jun Jul Aug Sep Oct Nov Dec
pri
ce/c
wt
2015 Cow and Calf Prices, by month
Avg. Cow Price Avg. Calf Price
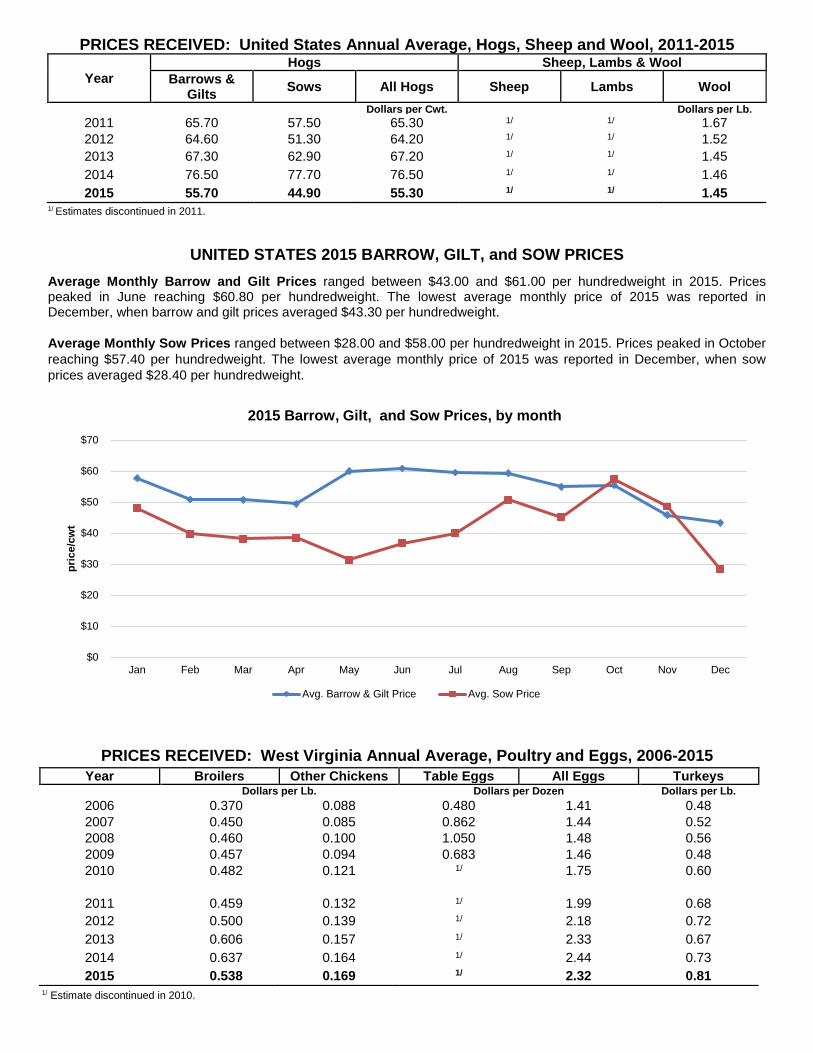
PRICES RECEIVED: United States Annual Average, Hogs, Sheep and Wool, 2011-2015
Year
Hogs Sheep, Lambs & Wool
Barrows & Gilts
Sows All Hogs Sheep Lambs Wool
Dollars per Cwt. Dollars per Lb. 2011 65.70 57.50 65.30 1/ 1/ 1.67
2012 64.60 51.30 64.20 1/ 1/ 1.52
2013 67.30 62.90 67.20 1/ 1/ 1.45
2014 76.50 77.70 76.50 1/ 1/ 1.46
2015 55.70 44.90 55.30 1/ 1/ 1.45 1/ Estimates discontinued in 2011.
UNITED STATES 2015 BARROW, GILT, and SOW PRICES
Average Monthly Barrow and Gilt Prices ranged between $43.00 and $61.00 per hundredweight in 2015. Prices peaked in June reaching $60.80 per hundredweight. The lowest average monthly price of 2015 was reported in December, when barrow and gilt prices averaged $43.30 per hundredweight.
Average Monthly Sow Prices ranged between $28.00 and $58.00 per hundredweight in 2015. Prices peaked in October
reaching $57.40 per hundredweight. The lowest average monthly price of 2015 was reported in December, when sow
prices averaged $28.40 per hundredweight.
PRICES RECEIVED: West Virginia Annual Average, Poultry and Eggs, 2006-2015
1/ Estimate discontinued in 2010.
Year Broilers Other Chickens Table Eggs All Eggs Turkeys Dollars per Lb. Dollars per Dozen Dollars per Lb.
2006 0.370 0.088 0.480 1.41 0.48
2007 0.450 0.085 0.862 1.44 0.52
2008 0.460 0.100 1.050 1.48 0.56
2009 0.457 0.094 0.683 1.46 0.48
2010 0.482 0.121 1/ 1.75 0.60
2011 0.459 0.132 1/ 1.99 0.68
2012 0.500 0.139 1/ 2.18 0.72
2013 0.606 0.157 1/ 2.33 0.67
2014 0.637 0.164 1/ 2.44 0.73
2015 0.538 0.169 1/ 2.32 0.81
$0
$10
$20
$30
$40
$50
$60
$70
Jan Feb Mar Apr May Jun Jul Aug Sep Oct Nov Dec
pri
ce/c
wt
2015 Barrow, Gilt, and Sow Prices, by month
Avg. Barrow & Gilt Price Avg. Sow Price
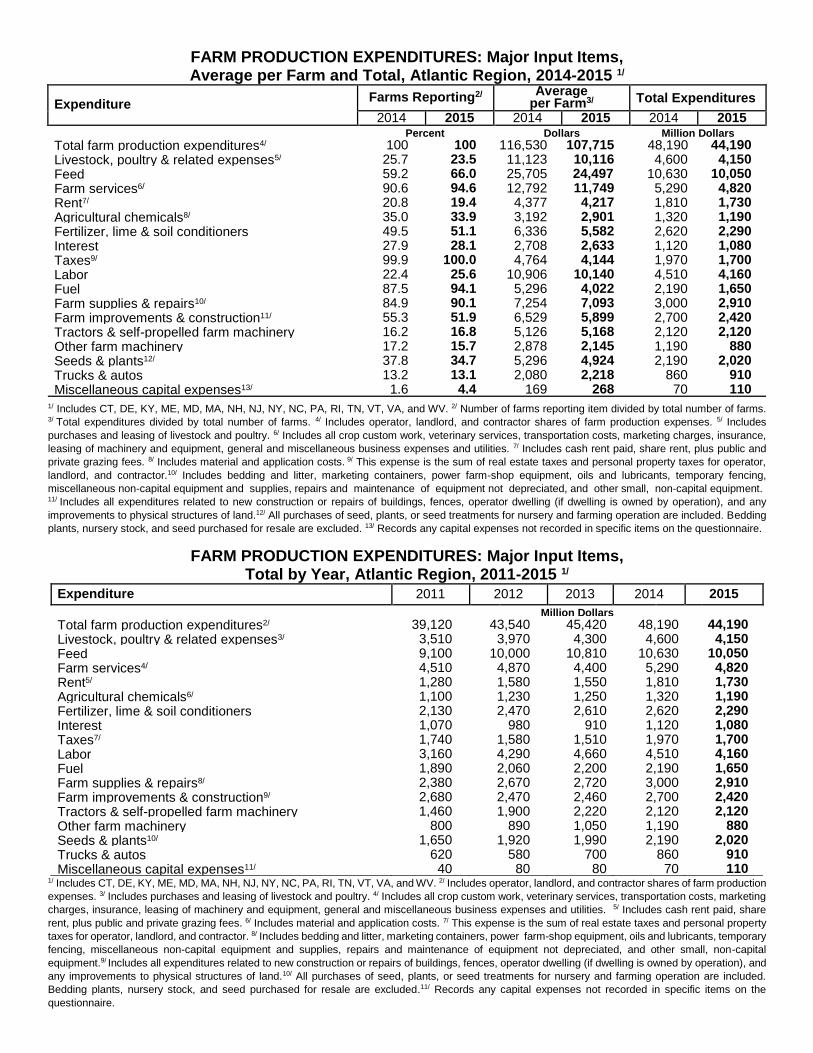
FARM PRODUCTION EXPENDITURES: Major Input Items, Average per Farm and Total, Atlantic Region, 2014-2015 1/
Expenditure Farms Reporting2/
Average per Farm3/ Total Expenditures
2014 2015 2014 2015 2014 2015 Percent Dollars Million Dollars
Total farm production expenditures4/ 100 100 116,530 107,715 48,190 44,190 Livestock, poultry & related expenses5/ 25.7 23.5 11,123 10,116 4,600 4,150 Feed 59.2 66.0 25,705 24,497 10,630 10,050 Farm services6/ 90.6 94.6 12,792 11,749 5,290 4,820 Rent7/ 20.8 19.4 4,377 4,217 1,810 1,730 Agricultural chemicals8/ 35.0 33.9 3,192 2,901 1,320 1,190 Fertilizer, lime & soil conditioners 49.5 51.1 6,336 5,582 2,620 2,290 Interest 27.9 28.1 2,708 2,633 1,120 1,080 Taxes9/ 99.9 100.0 4,764 4,144 1,970 1,700 Labor 22.4 25.6 10,906 10,140 4,510 4,160 Fuel 87.5 94.1 5,296 4,022 2,190 1,650 Farm supplies & repairs10/ 84.9 90.1 7,254 7,093 3,000 2,910 Farm improvements & construction11/ 55.3 51.9 6,529 5,899 2,700 2,420 Tractors & self-propelled farm machinery 16.2 16.8 5,126 5,168 2,120 2,120 Other farm machinery 17.2 15.7 2,878 2,145 1,190 880 Seeds & plants12/ 37.8 34.7 5,296 4,924 2,190 2,020 Trucks & autos 13.2 13.1 2,080 2,218 860 910 Miscellaneous capital expenses13/ 1.6 4.4 169 268 70 110
1/ Includes CT, DE, KY, ME, MD, MA, NH, NJ, NY, NC, PA, RI, TN, VT, VA, and WV. 2/ Number of farms reporting item divided by total number of farms.
3/ Total expenditures divided by total number of farms. 4/ Includes operator, landlord, and contractor shares of farm production expenses. 5/ Includes
purchases and leasing of livestock and poultry. 6/ Includes all crop custom work, veterinary services, transportation costs, marketing charges, insurance,
leasing of machinery and equipment, general and miscellaneous business expenses and utilities. 7/ Includes cash rent paid, share rent, plus public and
private grazing fees. 8/ Includes material and application costs. 9/ This expense is the sum of real estate taxes and personal property taxes for operator,
landlord, and contractor.10/ Includes bedding and litter, marketing containers, power farm-shop equipment, oils and lubricants, temporary fencing,
miscellaneous non-capital equipment and supplies, repairs and maintenance of equipment not depreciated, and other small, non-capital equipment. 11/ Includes all expenditures related to new construction or repairs of buildings, fences, operator dwelling (if dwelling is owned by operation), and any
improvements to physical structures of land.12/ All purchases of seed, plants, or seed treatments for nursery and farming operation are included. Bedding
plants, nursery stock, and seed purchased for resale are excluded. 13/ Records any capital expenses not recorded in specific items on the questionnaire.
FARM PRODUCTION EXPENDITURES: Major Input Items, Total by Year, Atlantic Region, 2011-2015 1/
Expenditure 2011 2012 2013 2014 2015
Million Dollars
Total farm production expenditures2/ 39,120 43,540 45,420 48,190 44,190 Livestock, poultry & related expenses3/ 3,510 3,970 4,300 4,600 4,150 Feed 9,100 10,000 10,810 10,630 10,050 Farm services4/ 4,510 4,870 4,400 5,290 4,820 Rent5/ 1,280 1,580 1,550 1,810 1,730 Agricultural chemicals6/ 1,100 1,230 1,250 1,320 1,190 Fertilizer, lime & soil conditioners 2,130 2,470 2,610 2,620 2,290 Interest 1,070 980 910 1,120 1,080 Taxes7/ 1,740 1,580 1,510 1,970 1,700 Labor 3,160 4,290 4,660 4,510 4,160 Fuel 1,890 2,060 2,200 2,190 1,650 Farm supplies & repairs8/ 2,380 2,670 2,720 3,000 2,910 Farm improvements & construction9/ 2,680 2,470 2,460 2,700 2,420 Tractors & self-propelled farm machinery 1,460 1,900 2,220 2,120 2,120 Other farm machinery 800 890 1,050 1,190 880 Seeds & plants10/ 1,650 1,920 1,990 2,190 2,020 Trucks & autos 620 580 700 860 910 Miscellaneous capital expenses11/ 40 80 80 70 110
1/ Includes CT, DE, KY, ME, MD, MA, NH, NJ, NY, NC, PA, RI, TN, VT, VA, and WV. 2/ Includes operator, landlord, and contractor shares of farm production
expenses. 3/ Includes purchases and leasing of livestock and poultry. 4/ Includes all crop custom work, veterinary services, transportation costs, marketing
charges, insurance, leasing of machinery and equipment, general and miscellaneous business expenses and utilities. 5/ Includes cash rent paid, share
rent, plus public and private grazing fees. 6/ Includes material and application costs. 7/ This expense is the sum of real estate taxes and personal property
taxes for operator, landlord, and contractor. 8/ Includes bedding and litter, marketing containers, power farm-shop equipment, oils and lubricants, temporary
fencing, miscellaneous non-capital equipment and supplies, repairs and maintenance of equipment not depreciated, and other small, non-capital
equipment.9/ Includes all expenditures related to new construction or repairs of buildings, fences, operator dwelling (if dwelling is owned by operation), and
any improvements to physical structures of land.10/ All purchases of seed, plants, or seed treatments for nursery and farming operation are included.
Bedding plants, nursery stock, and seed purchased for resale are excluded.11/ Records any capital expenses not recorded in specific items on the
questionnaire.
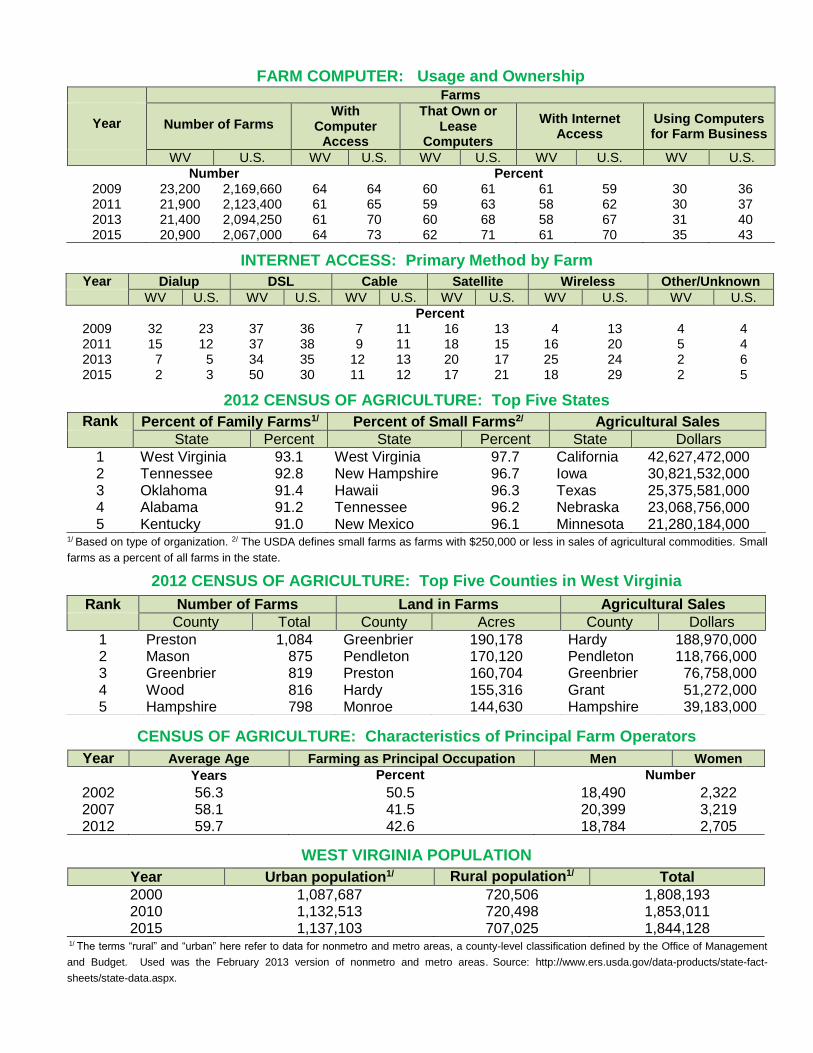
FARM COMPUTER: Usage and Ownership
INTERNET ACCESS: Primary Method by Farm
2012 CENSUS OF AGRICULTURE: Top Five States
1/ Based on type of organization. 2/ The USDA defines small farms as farms with $250,000 or less in sales of agricultural commodities. Small
farms as a percent of all farms in the state.
2012 CENSUS OF AGRICULTURE: Top Five Counties in West Virginia
CENSUS OF AGRICULTURE: Characteristics of Principal Farm Operators
WEST VIRGINIA POPULATION
1/ The terms “rural” and “urban” here refer to data for nonmetro and metro areas, a county-level classification defined by the Office of Management
and Budget. Used was the February 2013 version of nonmetro and metro areas. Source: http://www.ers.usda.gov/data-products/state-fact-
sheets/state-data.aspx.
Farms
Year
Number of Farms With
Computer Access
That Own or Lease
Computers
With Internet Access
Using Computers for Farm Business
WV U.S. WV U.S. WV U.S. WV U.S. WV U.S.
Number Percent 2009 23,200 2,169,660 64 64 60 61 61 59 30 36 2011 21,900 2,123,400 61 65 59 63 58 62 30 37 2013 21,400 2,094,250 61 70 60 68 58 67 31 40 2015 20,900 2,067,000 64 73 62 71 61 70 35 43
Year Dialup DSL Cable Satellite Wireless Other/Unknown
WV U.S. WV U.S. WV U.S. WV U.S. WV U.S. WV U.S.
Percent 2009 32 23 37 36 7 11 16 13 4 13 4 4 2011 15 12 37 38 9 11 18 15 16 20 5 4 2013 7 5 34 35 12 13 20 17 25 24 2 6 2015 2 3 50 30 11 12 17 21 18 29 2 5
Rank Percent of Family Farms1/ Percent of Small Farms2/ Agricultural Sales
State Percent State Percent State Dollars
1 West Virginia 93.1 West Virginia 97.7 California 42,627,472,000 2 Tennessee 92.8 New Hampshire 96.7 Iowa 30,821,532,000 3 Oklahoma 91.4 Hawaii 96.3 Texas 25,375,581,000 4 Alabama 91.2 Tennessee 96.2 Nebraska 23,068,756,000 5 Kentucky 91.0 New Mexico 96.1 Minnesota 21,280,184,000
Rank Number of Farms Land in Farms Agricultural Sales
County Total County Acres County Dollars
1 Preston 1,084 Greenbrier 190,178 Hardy 188,970,000 2 Mason 875 Pendleton 170,120 Pendleton 118,766,000 3 Greenbrier 819 Preston 160,704 Greenbrier 76,758,000 4 Wood 816 Hardy 155,316 Grant 51,272,000 5 Hampshire 798 Monroe 144,630 Hampshire 39,183,000
Year Average Age Farming as Principal Occupation Men Women
Years Percent Number
2002 56.3 50.5 18,490 2,322 2007 58.1 41.5 20,399 3,219 2012 59.7 42.6 18,784 2,705
Year Urban population1/ Rural population1/ Total
2000 1,087,687 720,506 1,808,193 2010 1,132,513 720,498 1,853,011 2015 1,137,103 707,025 1,844,128
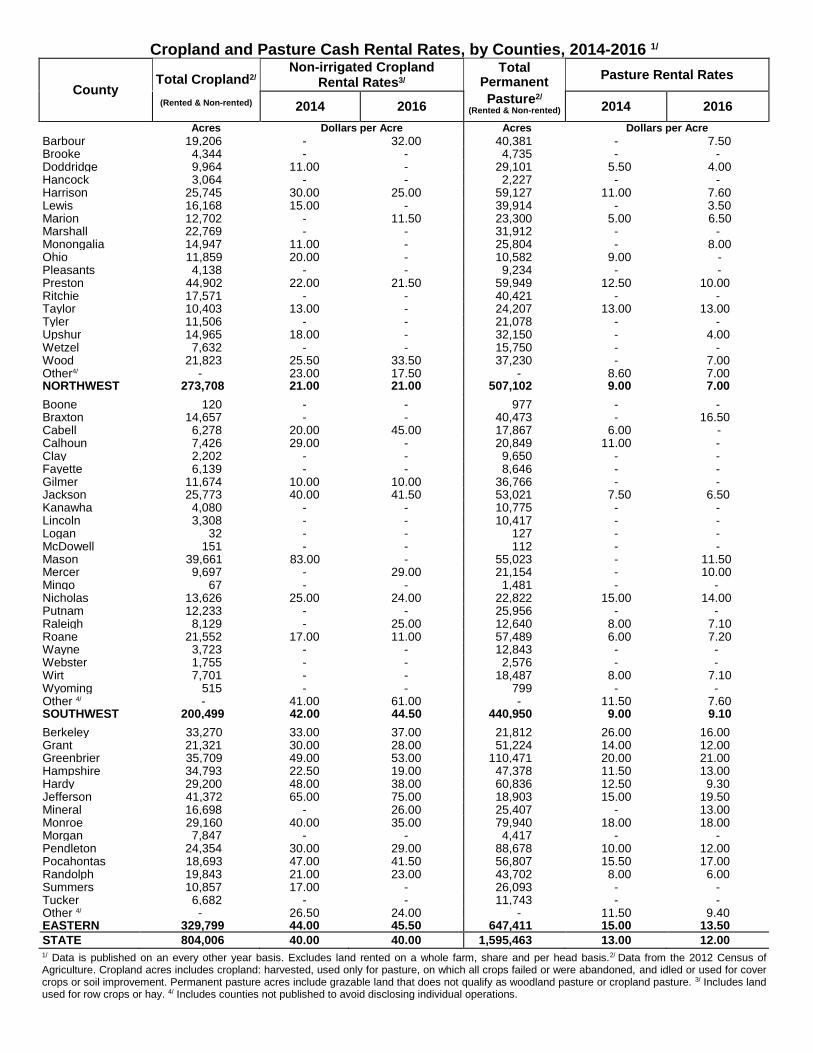
Cropland and Pasture Cash Rental Rates, by Counties, 2014-2016 1/
County
Total Cropland2/
Non-irrigated Cropland Rental Rates3/
Total Permanent Pasture Rental Rates
(Rented & Non-rented) 2014 2016 Pasture2/
(Rented & Non-rented) 2014 2016
Acres Dollars per Acre Acres Dollars per Acre Barbour 19,206 - 32.00 40,381 - 7.50 Brooke 4,344 - - 4,735 - - Doddridge 9,964 11.00 - 29,101 5.50 4.00 Hancock 3,064 - - 2,227 - - Harrison 25,745 30.00 25.00 59,127 11.00 7.60 Lewis 16,168 15.00 - 39,914 - 3.50 Marion 12,702 - 11.50 23,300 5.00 6.50 Marshall 22,769 - - 31,912 - - Monongalia 14,947 11.00 - 25,804 - 8.00 Ohio 11,859 20.00 - 10,582 9.00 - Pleasants 4,138 - - 9,234 - - Preston 44,902 22.00 21.50 59,949 12.50 10.00 Ritchie 17,571 - - 40,421 - - Taylor 10,403 13.00 - 24,207 13.00 13.00 Tyler 11,506 - - 21,078 - - Upshur 14,965 18.00 - 32,150 - 4.00 Wetzel 7,632 - - 15,750 - - Wood 21,823 25.50 33.50 37,230 - 7.00 Other4/ - 23.00 17.50 - 8.60 7.00 NORTHWEST 273,708 21.00 21.00 507,102 9.00 7.00 Boone 120 - - 977 - - Braxton 14,657 - - 40,473 - 16.50 Cabell 6,278 20.00 45.00 17,867 6.00 - Calhoun 7,426 29.00 - 20,849 11.00 - Clay 2,202 - - 9,650 - - Fayette 6,139 - - 8,646 - - Gilmer 11,674 10.00 10.00 36,766 - - Jackson 25,773 40.00 41.50 53,021 7.50 6.50 Kanawha 4,080 - - 10,775 - - Lincoln 3,308 - - 10,417 - - Logan 32 - - 127 - - McDowell 151 - - 112 - - Mason 39,661 83.00 - 55,023 - 11.50 Mercer 9,697 - 29.00 21,154 - 10.00 Mingo 67 - - 1,481 - - Nicholas 13,626 25.00 24.00 22,822 15.00 14.00 Putnam 12,233 - - 25,956 - - Raleigh 8,129 - 25.00 12,640 8.00 7.10 Roane 21,552 17.00 11.00 57,489 6.00 7.20 Wayne 3,723 - - 12,843 - - Webster 1,755 - - 2,576 - - Wirt 7,701 - - 18,487 8.00 7.10 Wyoming 515 - - 799 - - Other 4/ - 41.00 61.00 - 11.50 7.60 SOUTHWEST 200,499 42.00
42.00 44.50 440,950 9.00 9.10
Berkeley 33,270 33.00 37.00 21,812 26.00 16.00 Grant 21,321 30.00 28.00 51,224 14.00 12.00 Greenbrier 35,709 49.00 53.00 110,471 20.00 21.00 Hampshire 34,793 22.50 19.00 47,378 11.50 13.00 Hardy 29,200 48.00 38.00 60,836 12.50 9.30 Jefferson 41,372 65.00 75.00 18,903 15.00 19.50 Mineral 16,698 - 26.00 25,407 - 13.00 Monroe 29,160 40.00 35.00 79,940 18.00 18.00 Morgan 7,847 - - 4,417 - - Pendleton 24,354 30.00 29.00 88,678 10.00 12.00 Pocahontas 18,693 47.00 41.50 56,807 15.50 17.00 Randolph 19,843 21.00 23.00 43,702 8.00 6.00 Summers 10,857 17.00 - 26,093 - - Tucker 6,682 - - 11,743 - - Other 4/ - 26.50 24.00 - 11.50 9.40 EASTERN 329,799 44.00 45.50 647,411 15.00 13.50
STATE 804,006 40.00 40.00 1,595,463 13.00 12.00 1/ Data is published on an every other year basis. Excludes land rented on a whole farm, share and per head basis.2/ Data from the 2012 Census of Agriculture. Cropland acres includes cropland: harvested, used only for pasture, on which all crops failed or were abandoned, and idled or used for cover crops or soil improvement. Permanent pasture acres include grazable land that does not qualify as woodland pasture or cropland pasture. 3/ Includes land used for row crops or hay. 4/ Includes counties not published to avoid disclosing individual operations.
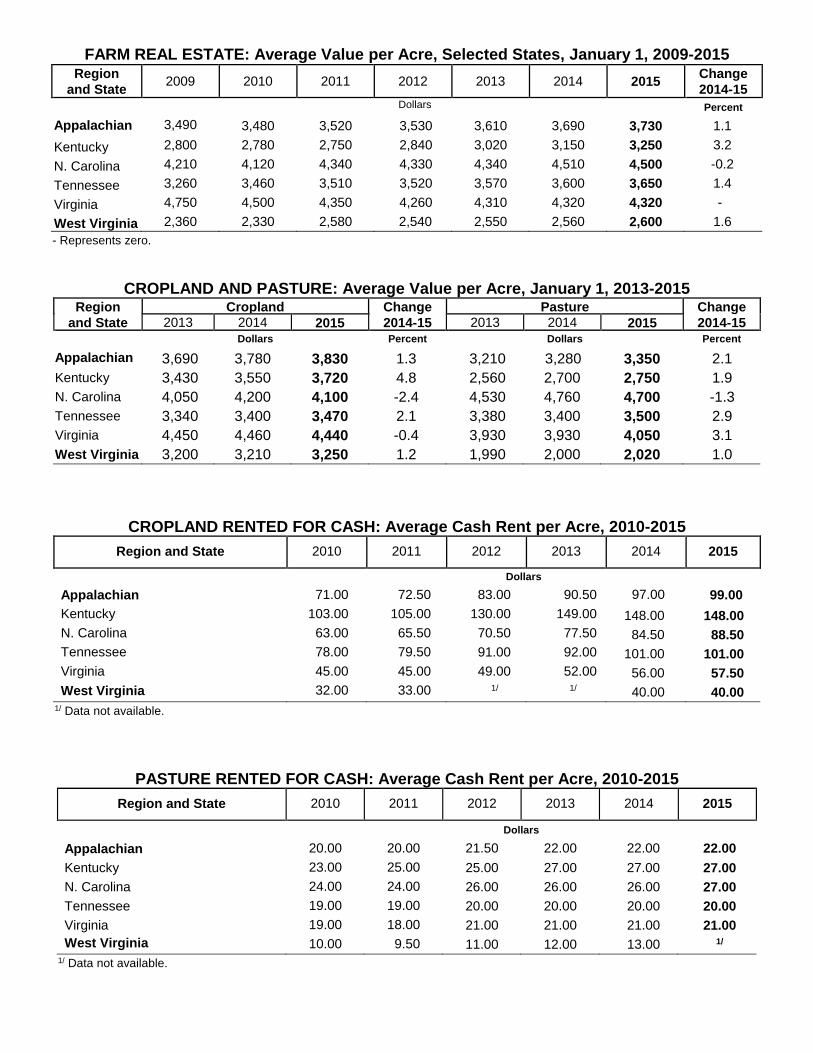
FARM REAL ESTATE: Average Value per Acre, Selected States, January 1, 2009-2015 Region
and State 2009 2010 2011 2012 2013 2014 2015
Change
2014-15 Dollars Percent
Appalachian 3,490 3,480 3,520 3,530 3,610 3,690 3,730 1.1
Kentucky 2,800 2,780 2,750 2,840 3,020 3,150 3,250 3.2
N. Carolina 4,210 4,120 4,340 4,330 4,340 4,510 4,500 -0.2
Tennessee 3,260 3,460 3,510 3,520 3,570 3,600 3,650 1.4
Virginia 4,750 4,500 4,350 4,260 4,310 4,320 4,320 -
West Virginia 2,360 2,330 2,580 2,540 2,550 2,560 2,600 1.6 - Represents zero.
CROPLAND AND PASTURE: Average Value per Acre, January 1, 2013-2015 Region
and State
Cropland Change
2014-15
Pasture Change
2014-15 2013 2014 2015 2013 2014 2015
Dollars Percent Dollars Percent
Appalachian 3,690 3,780 3,830 1.3 3,210 3,280 3,350 2.1
Kentucky 3,430 3,550 3,720 4.8 2,560 2,700 2,750 1.9
N. Carolina 4,050 4,200 4,100 -2.4 4,530 4,760 4,700 -1.3
Tennessee 3,340 3,400 3,470 2.1 3,380 3,400 3,500 2.9
Virginia 4,450 4,460 4,440 -0.4 3,930 3,930 4,050 3.1
West Virginia 3,200 3,210 3,250 1.2 1,990 2,000 2,020 1.0
CROPLAND RENTED FOR CASH: Average Cash Rent per Acre, 2010-2015
Region and State 2010 2011 2012 2013 2014 2015
Dollars
Appalachian 71.00 72.50 83.00 90.50 97.00 99.00
Kentucky 103.00 105.00 130.00 149.00 148.00 148.00
N. Carolina 63.00 65.50 70.50 77.50 84.50 88.50
Tennessee 78.00 79.50 91.00 92.00 101.00 101.00
Virginia 45.00 45.00 49.00 52.00 56.00 57.50
West Virginia 32.00
0.
33.00
0.
1/ 1/ 40.00 40.00 1/ Data not available.
PASTURE RENTED FOR CASH: Average Cash Rent per Acre, 2010-2015
Region and State 2010 2011 2012 2013 2014 2015
Dollars Appalachian 20.00 20.00 21.50 22.00 22.00 22.00 Kentucky 23.00 25.00 25.00 27.00 27.00 27.00
N. Carolina 24.00 24.00 26.00 26.00 26.00 27.00
Tennessee 19.00 19.00 20.00 20.00 20.00 20.00
Virginia 19.00 18.00 21.00 21.00 21.00 21.00
West Virginia 10.00 9.50 11.00 12.00 13.00 1/ 1/ Data not available.
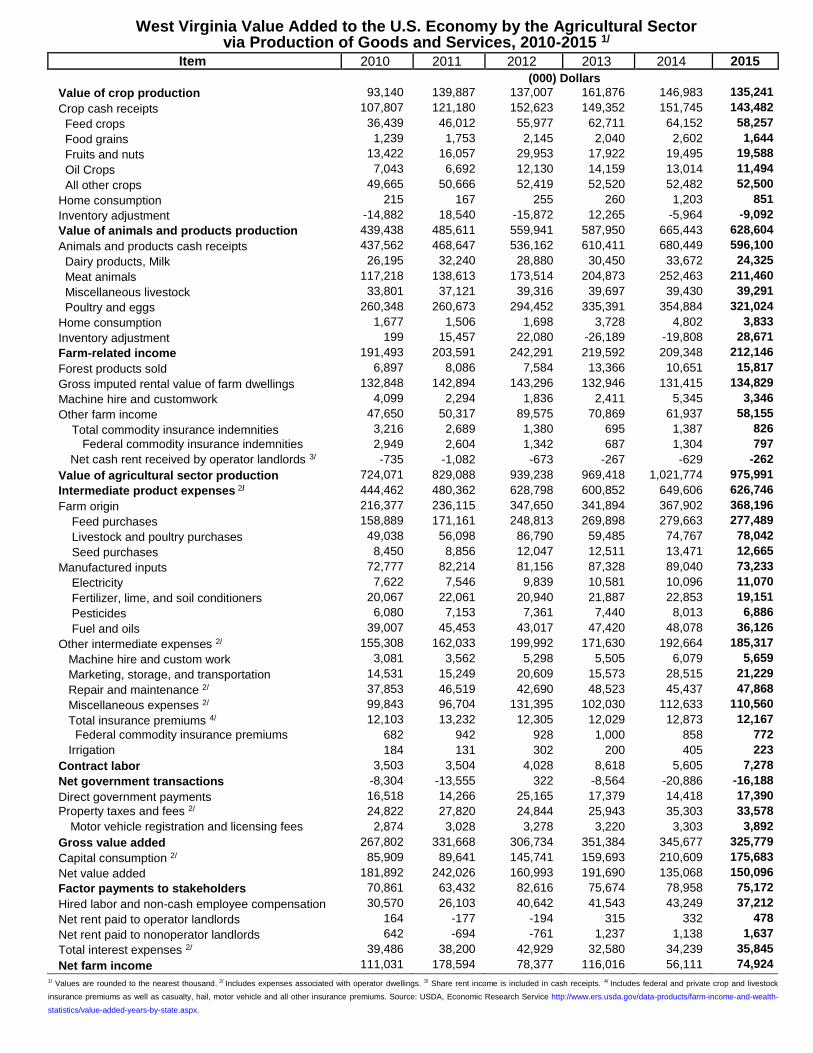
West Virginia Value Added to the U.S. Economy by the Agricultural Sector via Production of Goods and Services, 2010-2015 1/
Item 2010 2011 2012 2013 2014 2015
(000) Dollars
Value of crop production 93,140 139,887 137,007 161,876 146,983 135,241
Crop cash receipts 107,807 121,180 152,623 149,352 151,745 143,482
Feed crops 36,439 46,012 55,977 62,711 64,152 58,257
Food grains 1,239 1,753 2,145 2,040 2,602 1,644
Fruits and nuts 13,422 16,057 29,953 17,922 19,495 19,588
Oil Crops 7,043 6,692 12,130 14,159 13,014 11,494
All other crops 49,665 50,666 52,419 52,520 52,482 52,500
Home consumption 215 167 255 260 1,203 851
Inventory adjustment -14,882 18,540 -15,872 12,265 -5,964 -9,092
Value of animals and products production 439,438 485,611 559,941 587,950 665,443 628,604
Animals and products cash receipts 437,562 468,647 536,162 610,411 680,449 596,100
Dairy products, Milk 26,195 32,240 28,880 30,450 33,672 24,325
Meat animals 117,218 138,613 173,514 204,873 252,463 211,460
Miscellaneous livestock 33,801 37,121 39,316 39,697 39,430 39,291
Poultry and eggs 260,348 260,673 294,452 335,391 354,884 321,024
Home consumption 1,677 1,506 1,698 3,728 4,802 3,833
Inventory adjustment 199 15,457 22,080 -26,189 -19,808 28,671
Farm-related income 191,493 203,591 242,291 219,592 209,348 212,146
Forest products sold 6,897 8,086 7,584 13,366 10,651 15,817
Gross imputed rental value of farm dwellings 132,848 142,894 143,296 132,946 131,415 134,829
Machine hire and customwork 4,099 2,294 1,836 2,411 5,345 3,346
Other farm income 47,650 50,317 89,575 70,869 61,937 58,155
Total commodity insurance indemnities 3,216 2,689 1,380 695 1,387 826
Federal commodity insurance indemnities 2,949 2,604 1,342 687 1,304 797
Net cash rent received by operator landlords 3/ -735 -1,082 -673 -267 -629 -262
Value of agricultural sector production 724,071 829,088 939,238 969,418 1,021,774 975,991
Intermediate product expenses 2/ 444,462 480,362 628,798 600,852 649,606 626,746
Farm origin 216,377 236,115 347,650 341,894 367,902 368,196
Feed purchases 158,889 171,161 248,813 269,898 279,663 277,489
Livestock and poultry purchases 49,038 56,098 86,790 59,485 74,767 78,042
Seed purchases 8,450 8,856 12,047 12,511 13,471 12,665
Manufactured inputs 72,777 82,214 81,156 87,328 89,040 73,233
Electricity 7,622 7,546 9,839 10,581 10,096 11,070
Fertilizer, lime, and soil conditioners 20,067 22,061 20,940 21,887 22,853 19,151
Pesticides 6,080 7,153 7,361 7,440 8,013 6,886
Fuel and oils 39,007 45,453 43,017 47,420 48,078 36,126
Other intermediate expenses 2/ 155,308 162,033 199,992 171,630 192,664 185,317
Machine hire and custom work 3,081 3,562 5,298 5,505 6,079 5,659
Marketing, storage, and transportation 14,531 15,249 20,609 15,573 28,515 21,229
Repair and maintenance 2/ 37,853 46,519 42,690 48,523 45,437 47,868
Miscellaneous expenses 2/ 99,843 96,704 131,395 102,030 112,633 110,560
Total insurance premiums 4/ 12,103 13,232 12,305 12,029 12,873 12,167
Federal commodity insurance premiums 682 942 928 1,000 858 772
Irrigation 184 131 302 200 405 223
Contract labor 3,503 3,504 4,028 8,618 5,605 7,278
Net government transactions -8,304 -13,555 322 -8,564 -20,886 -16,188
Direct government payments 16,518 14,266 25,165 17,379 14,418 17,390
Property taxes and fees 2/ 24,822 27,820 24,844 25,943 35,303 33,578
Motor vehicle registration and licensing fees 2,874 3,028 3,278 3,220 3,303 3,892
Gross value added 267,802 331,668 306,734 351,384 345,677 325,779
Capital consumption 2/ 85,909 89,641 145,741 159,693 210,609 175,683
Net value added 181,892 242,026 160,993 191,690 135,068 150,096
Factor payments to stakeholders 70,861 63,432 82,616 75,674 78,958 75,172
Hired labor and non-cash employee compensation 30,570 26,103 40,642 41,543 43,249 37,212
Net rent paid to operator landlords 164 -177 -194 315 332 478
Net rent paid to nonoperator landlords 642 -694 -761 1,237 1,138 1,637
Total interest expenses 2/ 39,486 38,200 42,929 32,580 34,239 35,845
Net farm income 111,031 178,594 78,377 116,016 56,111 74,924
1/ Values are rounded to the nearest thousand. 2/ Includes expenses associated with operator dwellings. 3/ Share rent income is included in cash receipts. 4/ Includes federal and private crop and livestock
insurance premiums as well as casualty, hail, motor vehicle and all other insurance premiums. Source: USDA, Economic Research Service http://www.ers.usda.gov/data-products/farm-income-and-wealth-
statistics/value-added-years-by-state.aspx.
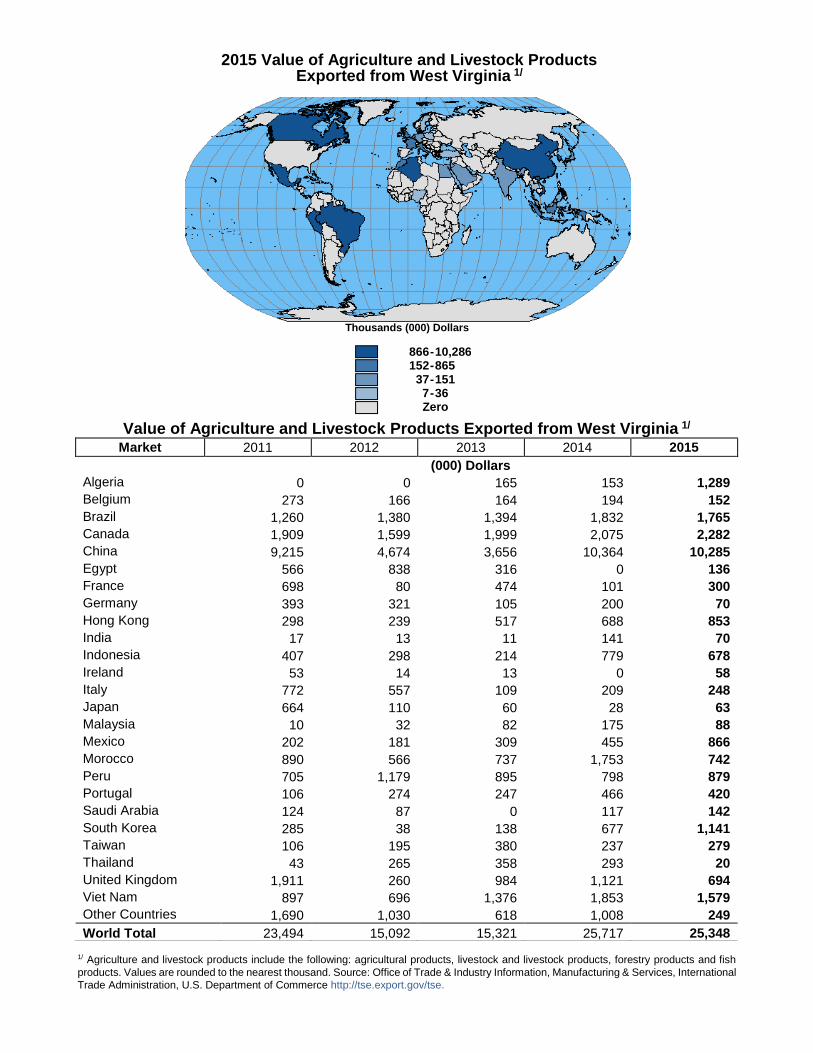
1/ Agriculture and livestock products include the following: agricultural products, livestock and livestock products, forestry products and fish
products. Values are rounded to the nearest thousand. Source: Office of Trade & Industry Information, Manufacturing & Services, International
Trade Administration, U.S. Department of Commerce http://tse.export.gov/tse.
Thousands (000) Dollars
866 - 10,286 152 - 865
37 - 151 7 - 36
Zero
Value of Agriculture and Livestock Products Exported from West Virginia 1/ Market 2011 2012 2013 2014 2015
(000) Dollars
Algeria 0 0 165 153 1,289
Belgium 273 166 164 194 152
Brazil 1,260 1,380 1,394 1,832 1,765
Canada 1,909 1,599 1,999 2,075 2,282
China 9,215 4,674 3,656 10,364 10,285
Egypt 566 838 316 0 136
France 698 80 474 101 300
Germany 393 321 105 200 70
Hong Kong 298 239 517 688 853
India 17 13 11 141 70
Indonesia 407 298 214 779 678
Ireland 53 14 13 0 58
Italy 772 557 109 209 248
Japan 664 110 60 28 63
Malaysia 10 32 82 175 88
Mexico 202 181 309 455 866
Morocco 890 566 737 1,753 742
Peru 705 1,179 895 798 879
Portugal 106 274 247 466 420
Saudi Arabia 124 87 0 117 142
South Korea 285 38 138 677 1,141
Taiwan 106 195 380 237 279
Thailand 43 265 358 293 20
United Kingdom 1,911 260 984 1,121 694
Viet Nam 897 696 1,376 1,853 1,579
Other Countries 1,690 1,030 618 1,008 249
World Total 23,494 15,092 15,321 25,717 25,348
2015 Value of Agriculture and Livestock Products Exported from West Virginia 1/
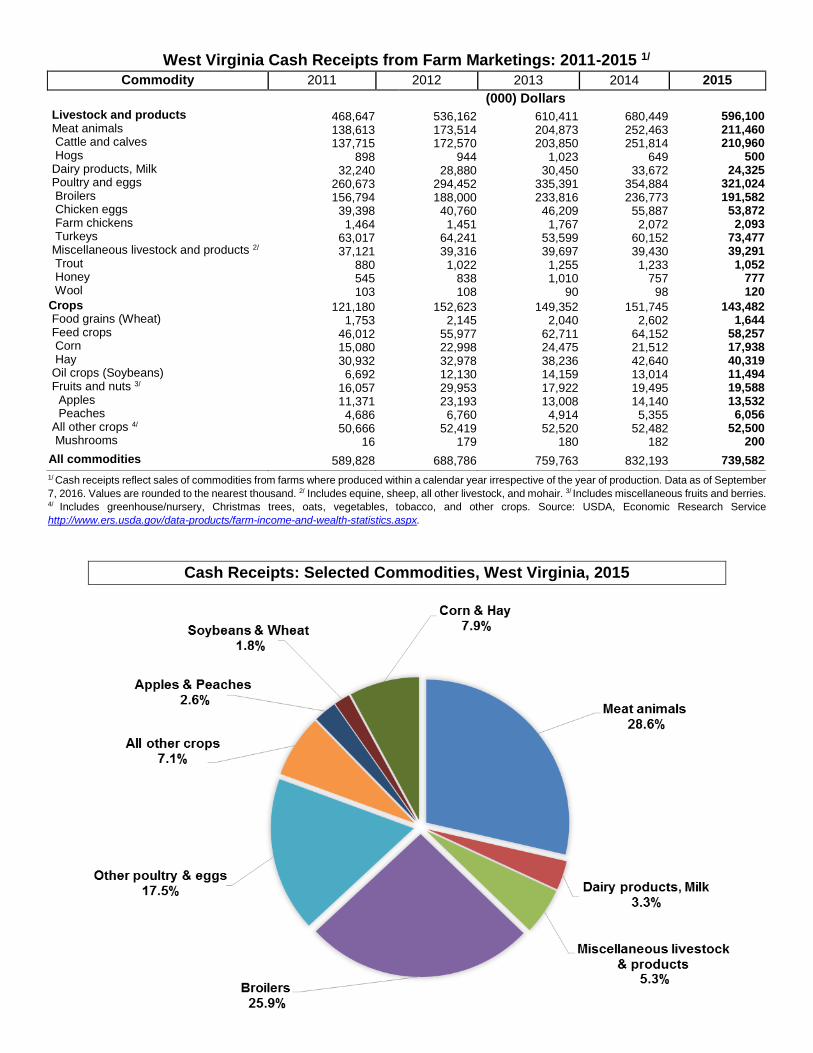
1/ Cash receipts reflect sales of commodities from farms where produced within a calendar year irrespective of the year of production. Data as of September
7, 2016. Values are rounded to the nearest thousand. 2/ Includes equine, sheep, all other livestock, and mohair. 3/ Includes miscellaneous fruits and berries. 4/ Includes greenhouse/nursery, Christmas trees, oats, vegetables, tobacco, and other crops. Source: USDA, Economic Research Service
http://www.ers.usda.gov/data-products/farm-income-and-wealth-statistics.aspx.
Cash Receipts: Selected Commodities, West Virginia, 2015
West Virginia Cash Receipts from Farm Marketings: 2011-2015 1/
Commodity 2011 2012 2013 2014 2015
(000) Dollars
Livestock and products 468,647 536,162 610,411 680,449 596,100 Meat animals 138,613 173,514 204,873 252,463 211,460 Cattle and calves 137,715 172,570 203,850 251,814 210,960 Hogs 898 944 1,023 649 500 Dairy products, Milk 32,240 28,880 30,450 33,672 24,325 Poultry and eggs 260,673 294,452 335,391 354,884 321,024 Broilers 156,794 188,000 233,816 236,773 191,582 Chicken eggs 39,398 40,760 46,209 55,887 53,872 Farm chickens 1,464 1,451 1,767 2,072 2,093 Turkeys 63,017 64,241 53,599 60,152 73,477 Miscellaneous livestock and products 2/ 37,121 39,316 39,697 39,430 39,291 Trout 880 1,022 1,255 1,233 1,052 Honey 545 838 1,010 757 777 Wool 103 108 90 98 120 Crops 121,180 152,623 149,352 151,745 143,482 Food grains (Wheat) 1,753 2,145 2,040 2,602 1,644 Feed crops 46,012 55,977 62,711 64,152 58,257 Corn 15,080 22,998 24,475 21,512 17,938 Hay 30,932 32,978 38,236 42,640 40,319 Oil crops (Soybeans) 6,692 12,130 14,159 13,014 11,494 Fruits and nuts 3/ 16,057 29,953 17,922 19,495 19,588 Apples 11,371 23,193 13,008 14,140 13,532 Peaches 4,686 6,760 4,914 5,355 6,056 All other crops 4/ 50,666 52,419 52,520 52,482 52,500 Mushrooms 16 179 180 182 200 All commodities 589,828 688,786 759,763 832,193 739,582
Charts
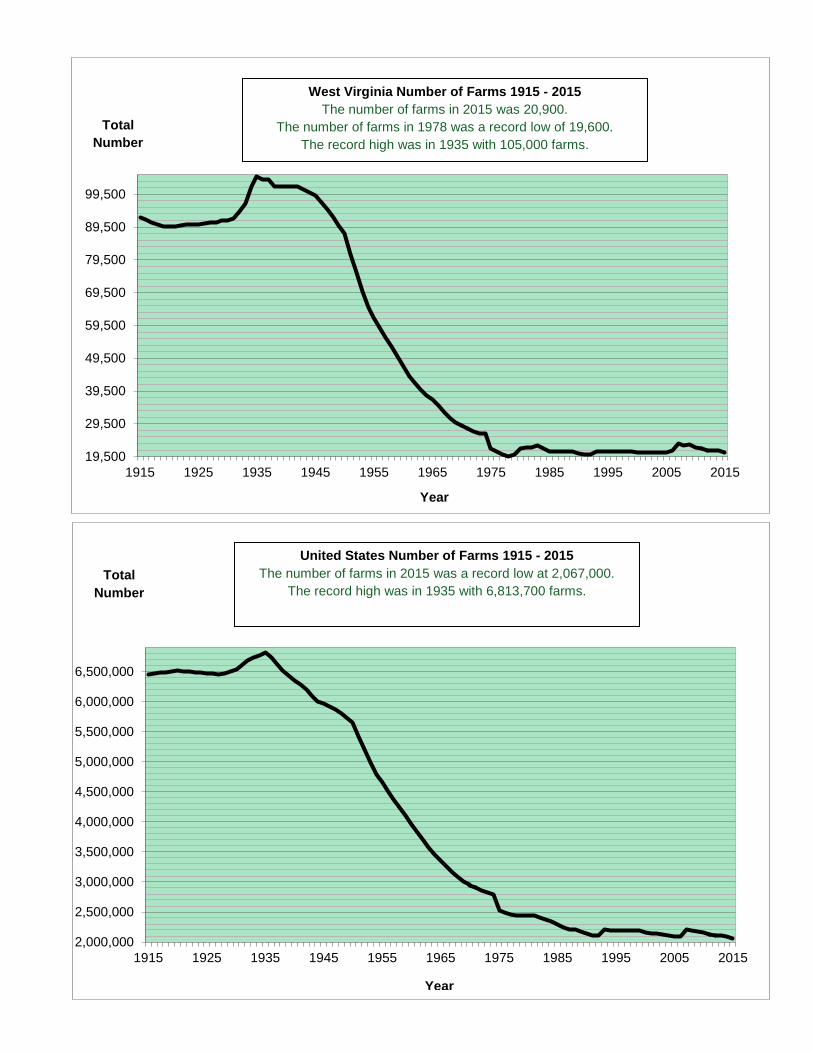
19,500
29,500
39,500
49,500
59,500
69,500
79,500
89,500
99,500
20152005199519851975196519551945193519251915
2,000,000
2,500,000
3,000,000
3,500,000
4,000,000
4,500,000
5,000,000
5,500,000
6,000,000
6,500,000
20152005199519851975196519551945193519251915
Total
Number
Year
United States Number of Farms 1915 - 2015
The number of farms in 2015 was a record low at 2,067,000.
The record high was in 1935 with 6,813,700 farms.
Total
Number
Year
West Virginia Number of Farms 1915 - 2015
The number of farms in 2015 was 20,900.
The number of farms in 1978 was a record low of 19,600.
The record high was in 1935 with 105,000 farms.
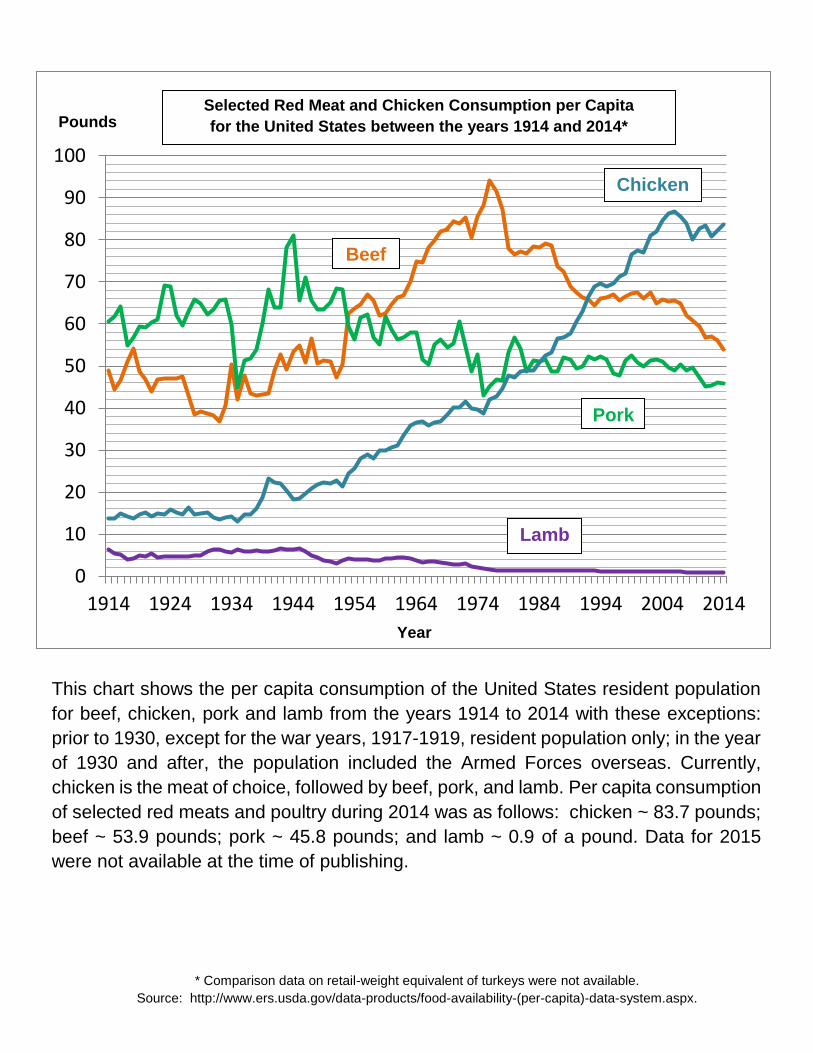
0
10
20
30
40
50
60
70
80
90
100
20142004199419841974196419541944193419241914
Year
Selected Red Meat and Chicken Consumption per Capita
for the United States between the years 1914 and 2014*
*Source: http://www.ers.usda.gov/Data/FoodConsumption/
Beef
Pork
Chicken
Lamb
Chicken
Pork
Lamb
This chart shows the per capita consumption of the United States resident population
for beef, chicken, pork and lamb from the years 1914 to 2014 with these exceptions:
prior to 1930, except for the war years, 1917-1919, resident population only; in the year
of 1930 and after, the population included the Armed Forces overseas. Currently,
chicken is the meat of choice, followed by beef, pork, and lamb. Per capita consumption
of selected red meats and poultry during 2014 was as follows: chicken ~ 83.7 pounds;
beef ~ 53.9 pounds; pork ~ 45.8 pounds; and lamb ~ 0.9 of a pound. Data for 2015
were not available at the time of publishing.
* Comparison data on retail-weight equivalent of turkeys were not available.
Source: http://www.ers.usda.gov/data-products/food-availability-(per-capita)-data-system.aspx.
Pounds
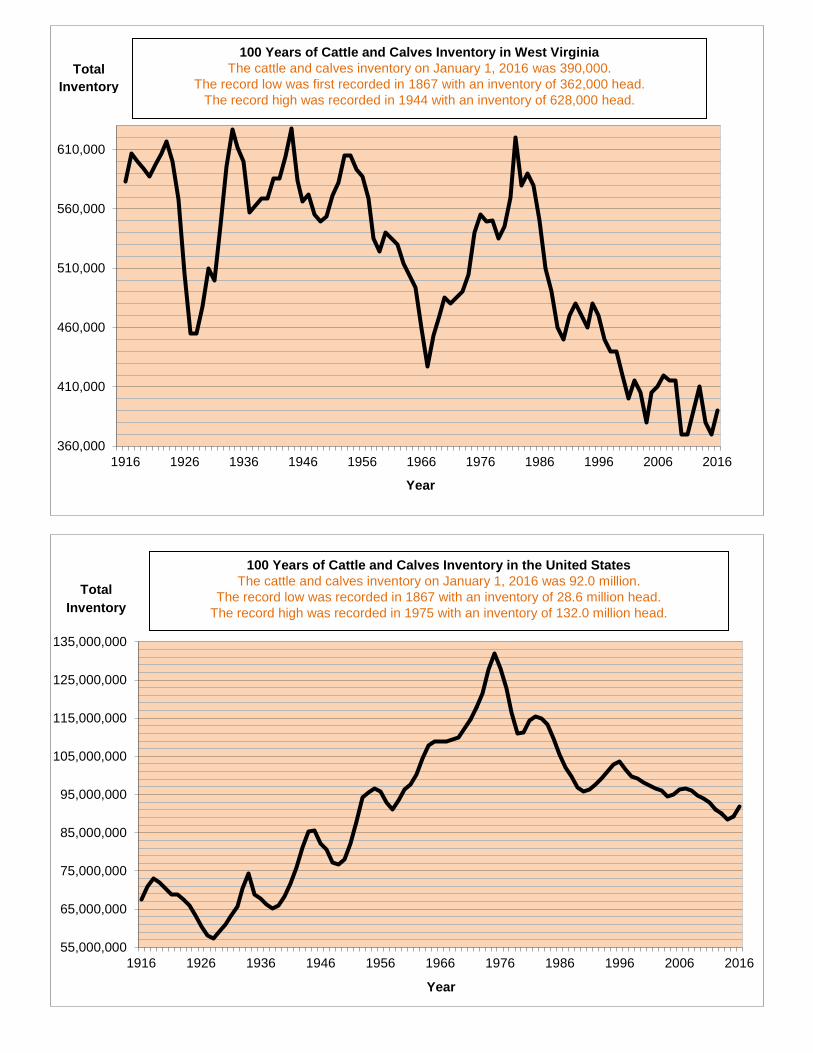
360,000
410,000
460,000
510,000
560,000
610,000
20162006199619861976196619561946193619261916
55,000,000
65,000,000
75,000,000
85,000,000
95,000,000
105,000,000
115,000,000
125,000,000
135,000,000
20162006199619861976196619561946193619261916
Total
Inventory
Year
100 Years of Cattle and Calves Inventory in West Virginia
The cattle and calves inventory on January 1, 2016 was 390,000.
The record low was first recorded in 1867 with an inventory of 362,000 head.
The record high was recorded in 1944 with an inventory of 628,000 head.
100 Years of Cattle and Calves Inventory in the United States
The cattle and calves inventory on January 1, 2016 was 92.0 million.
The record low was recorded in 1867 with an inventory of 28.6 million head.
The record high was recorded in 1975 with an inventory of 132.0 million head.
Total
Inventory
Year
100 Years of Cattle and Calves Inventory in West Virginia
The cattle and calves inventory on January 1, 2016 was 390,000.
The record low was first recorded in 1867 with an inventory of 362,000 head.
The record high was recorded in 1944 with an inventory of 628,000 head.
Total
Inventory
100 Years of Cattle and Calves Inventory in the United States
The cattle and calves inventory on January 1, 2016 was 92.0 million.
The record low was recorded in 1867 with an inventory of 28.6 million head.
The record high was recorded in 1975 with an inventory of 132.0 million head.
Total
Inventory
Year
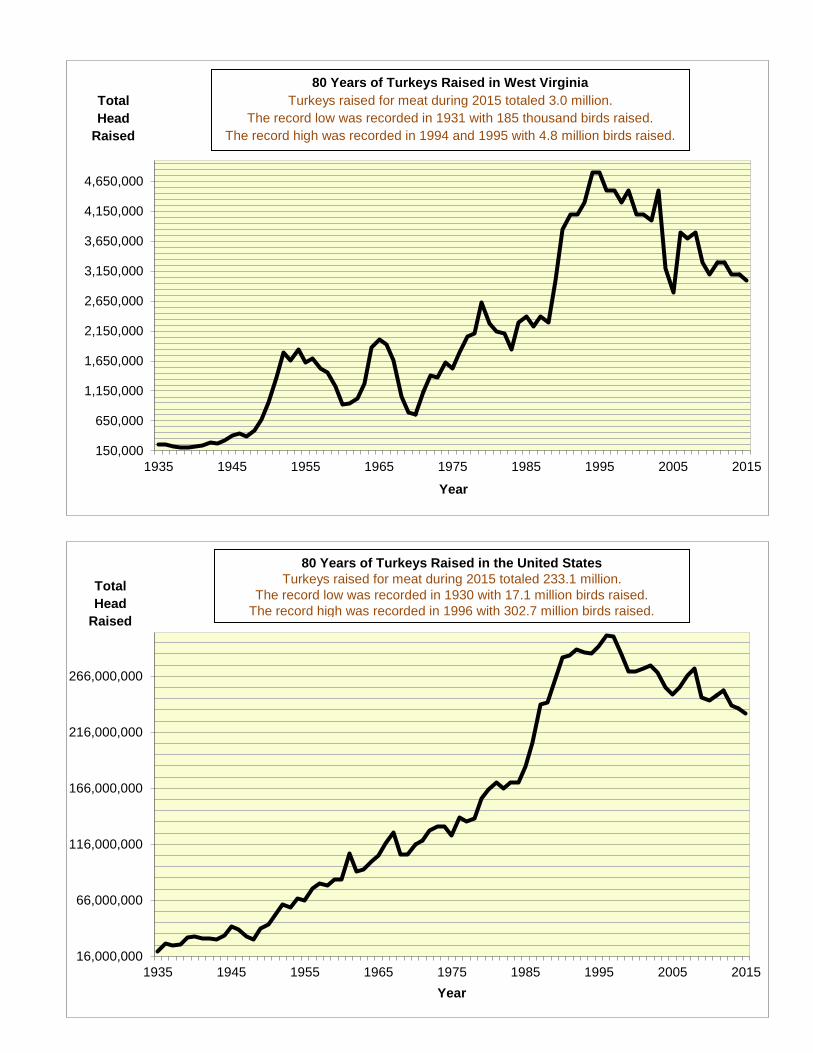
150,000
650,000
1,150,000
1,650,000
2,150,000
2,650,000
3,150,000
3,650,000
4,150,000
4,650,000
201520051995198519751965195519451935
16,000,000
66,000,000
116,000,000
166,000,000
216,000,000
266,000,000
201520051995198519751965195519451935
Year
80 Years of Turkeys Raised in West Virginia
Turkeys raised for meat during 2015 totaled 3.0 million.
The record low was recorded in 1931 with 185 thousand birds raised.
The record high was recorded in 1994 and 1995 with 4.8 million birds raised.
Total
Head
Raised
80 Years of Turkeys Raised in the United States
Turkeys raised for meat during 2015 totaled 233.1 million.
The record low was recorded in 1930 with 17.1 million birds raised.
The record high was recorded in 1996 with 302.7 million birds raised.
Total
Head
Raised
Year
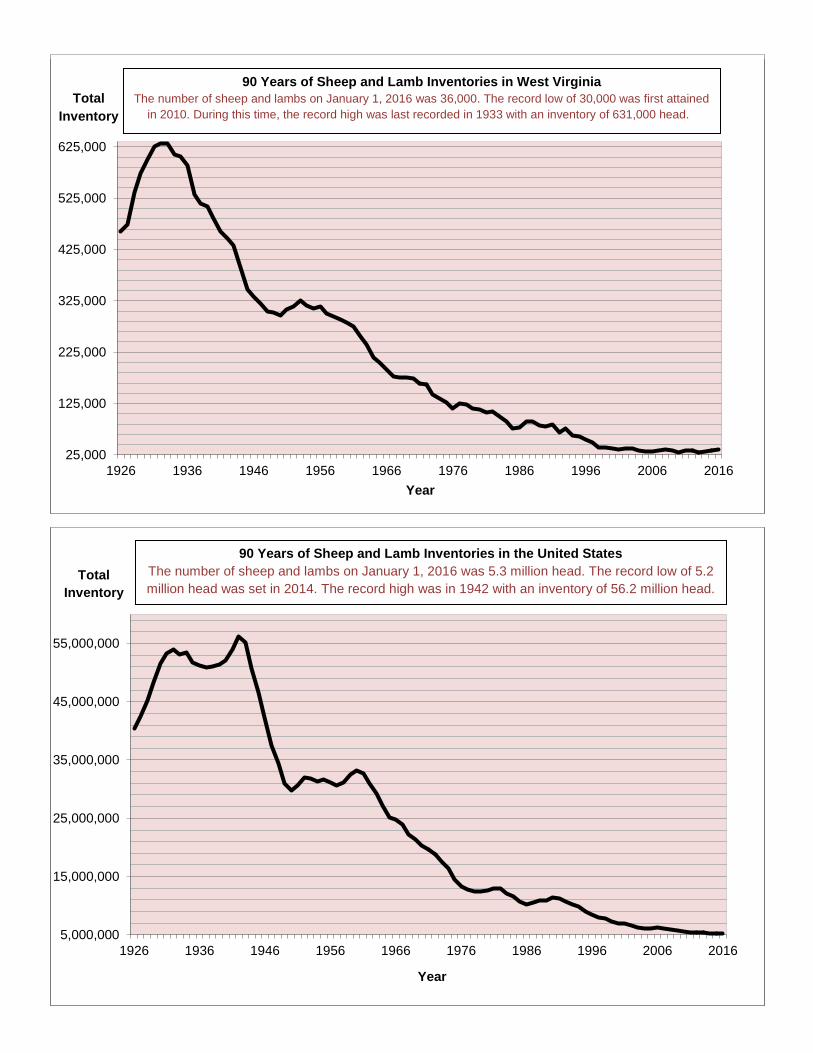
25,000
125,000
225,000
325,000
425,000
525,000
625,000
2013200319931983197319631953194319331923
5,000,000
15,000,000
25,000,000
35,000,000
45,000,000
55,000,000
2013200319931983197319631953194319331923
25,000
125,000
225,000
325,000
425,000
525,000
625,000
2016200619961986197619661956194619361926
5,000,000
15,000,000
25,000,000
35,000,000
45,000,000
55,000,000
2016200619961986197619661956194619361926
Total
Inventory
Year
90 Years of Sheep and Lamb Inventories in the United States
The number of sheep and lambs on January 1, 2016 was 5.3 million head. The record low of 5.2
million head was set in 2014. The record high was in 1942 with an inventory of 56.2 million head.
Total
Inventory
Year
90 Years of Sheep and Lamb Inventories in West Virginia
The number of sheep and lambs on January 1, 2016 was 36,000. The record low of 30,000 was first attained
in 2010. During this time, the record high was last recorded in 1933 with an inventory of 631,000 head.
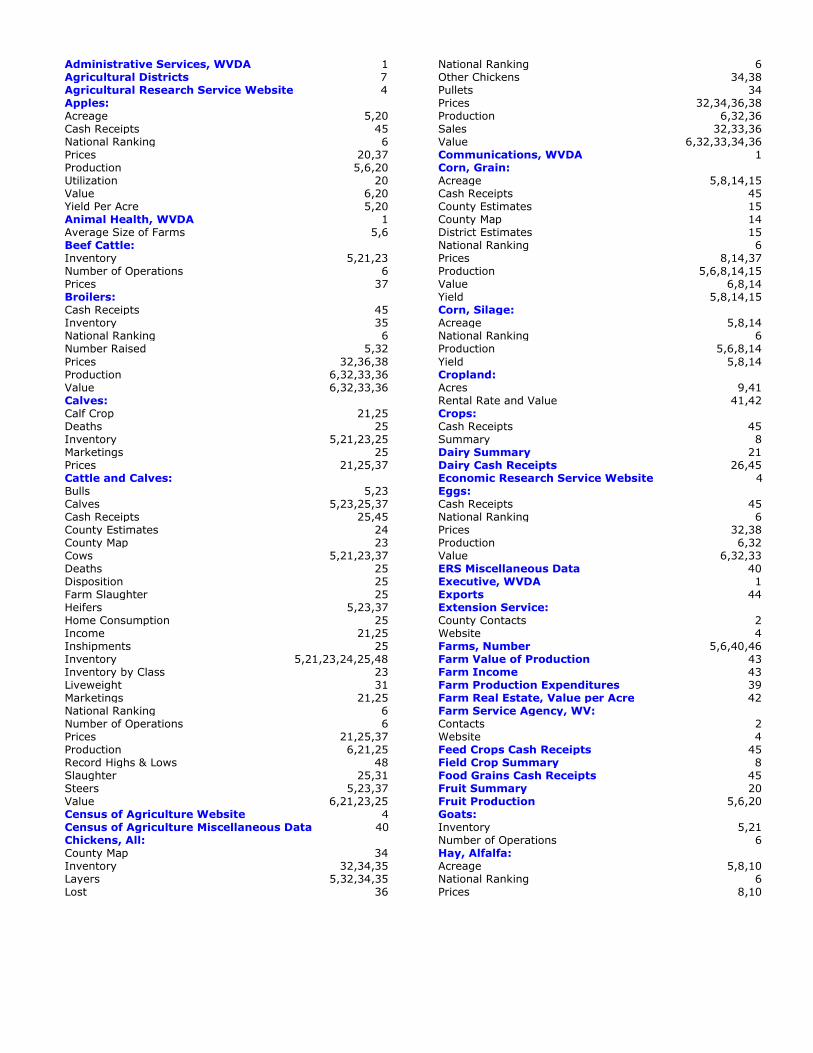
Administrative Services, WVDA 1 Agricultural Districts 7 Agricultural Research Service Website 4 Apples: Acreage 5,20 Cash Receipts 45 National Ranking 6 Prices 20,37 Production 5,6,20 Utilization 20 Value 6,20 Yield Per Acre 5,20 Animal Health, WVDA 1 Average Size of Farms 5,6 Beef Cattle: Inventory 5,21,23 Number of Operations 6 Prices 37 Broilers: Cash Receipts 45 Inventory 35 National Ranking 6 Number Raised 5,32
Prices 32,36,38 Production 6,32,33,36 Value 6,32,33,36 Calves: Calf Crop 21,25 Deaths 25 Inventory 5,21,23,25 Marketings 25 Prices 21,25,37 Cattle and Calves: Bulls 5,23 Calves 5,23,25,37 Cash Receipts 25,45 County Estimates 24 County Map 23 Cows 5,21,23,37 Deaths 25 Disposition 25 Farm Slaughter 25 Heifers 5,23,37 Home Consumption 25 Income 21,25 Inshipments 25 Inventory 5,21,23,24,25,48 Inventory by Class 23 Liveweight 31 Marketings 21,25 National Ranking 6 Number of Operations 6 Prices 21,25,37 Production 6,21,25 Record Highs & Lows 48 Slaughter 25,31 Steers 5,23,37 Value 6,21,23,25 Census of Agriculture Website 4 Census of Agriculture Miscellaneous Data 40 Chickens, All: County Map
34
Inventory 32,34,35 Layers 5,32,34,35 Lost 36
National Ranking 6 Other Chickens Pullets
34,38 34
Prices 32,34,36,38 Production 6,32,36 Sales 32,33,36 Value 6,32,33,34,36 Communications, WVDA 1 Corn, Grain: Acreage 5,8,14,15 Cash Receipts 45 County Estimates 15 County Map 14 District Estimates 15 National Ranking 6 Prices 8,14,37 Production 5,6,8,14,15 Value 6,8,14 Yield 5,8,14,15 Corn, Silage: Acreage 5,8,14 National Ranking 6 Production 5,6,8,14
Yield 5,8,14 Cropland: Acres 9,41 Rental Rate and Value 41,42 Crops: Cash Receipts 45 Summary 8 Dairy Summary 21 Dairy Cash Receipts 26,45 Economic Research Service Website 4 Eggs: Cash Receipts 45 National Ranking 6 Prices 32,38 Production 6,32 Value 6,32,33 ERS Miscellaneous Data 40 Executive, WVDA 1 Exports 44 Extension Service: County Contacts 2 Website 4 Farms, Number 5,6,40,46 Farm Value of Production 43 Farm Income 43 Farm Production Expenditures 39 Farm Real Estate, Value per Acre 42 Farm Service Agency, WV: Contacts 2 Website 4 Feed Crops Cash Receipts 45 Field Crop Summary 8 Food Grains Cash Receipts 45 Fruit Summary 20 Fruit Production 5,6,20 Goats: Inventory Number of Operations
5,21 6
Hay, Alfalfa: Acreage
5,8,10
National Ranking Prices
6 8,10
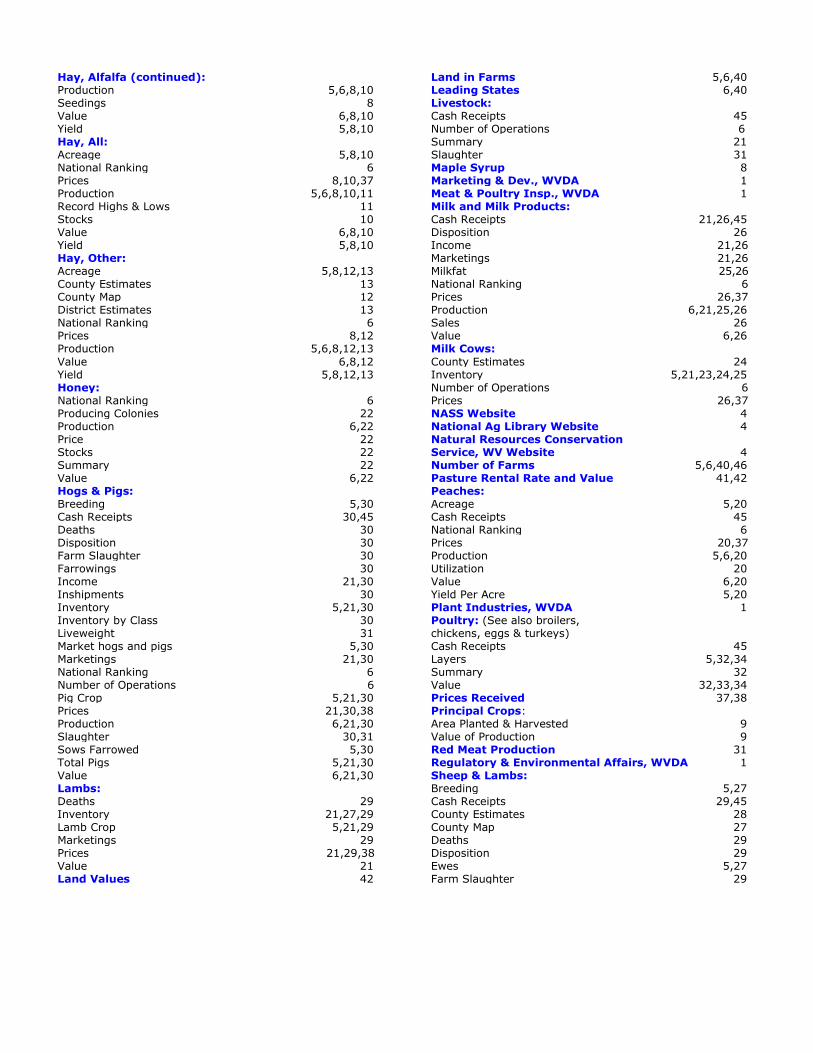
Hay, Alfalfa (continued): Production
5,6,8,10
Seedings 8 Value 6,8,10 Yield 5,8,10 Hay, All: Acreage 5,8,10 National Ranking 6 Prices 8,10,37 Production 5,6,8,10,11 Record Highs & Lows 11 Stocks 10 Value 6,8,10 Yield 5,8,10 Hay, Other: Acreage 5,8,12,13 County Estimates 13 County Map 12 District Estimates 13 National Ranking 6 Prices 8,12 Production 5,6,8,12,13
Value 6,8,12 Yield 5,8,12,13 Honey: National Ranking 6 Producing Colonies 22 Production 6,22 Price 22 Stocks 22 Summary 22 Value 6,22 Hogs & Pigs: Breeding 5,30 Cash Receipts 30,45 Deaths 30 Disposition 30 Farm Slaughter 30 Farrowings 30 Income 21,30 Inshipments 30 Inventory 5,21,30 Inventory by Class 30 Liveweight 31 Market hogs and pigs 5,30 Marketings 21,30 National Ranking 6 Number of Operations 6 Pig Crop 5,21,30 Prices 21,30,38 Production 6,21,30 Slaughter 30,31 Sows Farrowed 5,30 Total Pigs 5,21,30 Value 6,21,30 Lambs: Deaths 29 Inventory 21,27,29 Lamb Crop 5,21,29 Marketings 29 Prices 21,29,38 Value 21 Land Values 42
Land in Farms Leading States
5,6,40
6,40 Livestock: Cash Receipts 45 Number of Operations 6 Summary 21 Slaughter 31 Maple Syrup 8 Marketing & Dev., WVDA 1 Meat & Poultry Insp., WVDA 1 Milk and Milk Products: Cash Receipts 21,26,45 Disposition 26 Income 21,26 Marketings 21,26 Milkfat 25,26 National Ranking 6 Prices 26,37 Production 6,21,25,26 Sales 26 Value 6,26 Milk Cows:
County Estimates 24 Inventory 5,21,23,24,25 Number of Operations 6 Prices 26,37 NASS Website 4 National Ag Library Website 4 Natural Resources Conservation Service, WV Website 4 Number of Farms 5,6,40,46 Pasture Rental Rate and Value 41,42 Peaches: Acreage 5,20 Cash Receipts 45 National Ranking 6 Prices 20,37 Production Utilization
5,6,20 20
Value 6,20 Yield Per Acre 5,20 Plant Industries, WVDA 1 Poultry: (See also broilers, chickens, eggs & turkeys)
Cash Receipts 45 Layers 5,32,34 Summary 32 Value 32,33,34 Prices Received 37,38 Principal Crops: Area Planted & Harvested 9 Value of Production 9 Red Meat Production 31 Regulatory & Environmental Affairs, WVDA 1 Sheep & Lambs: Breeding 5,27 Cash Receipts 29,45 County Estimates 28 County Map 27 Deaths 29 Disposition 29 Ewes 5,27 Farm Slaughter 29
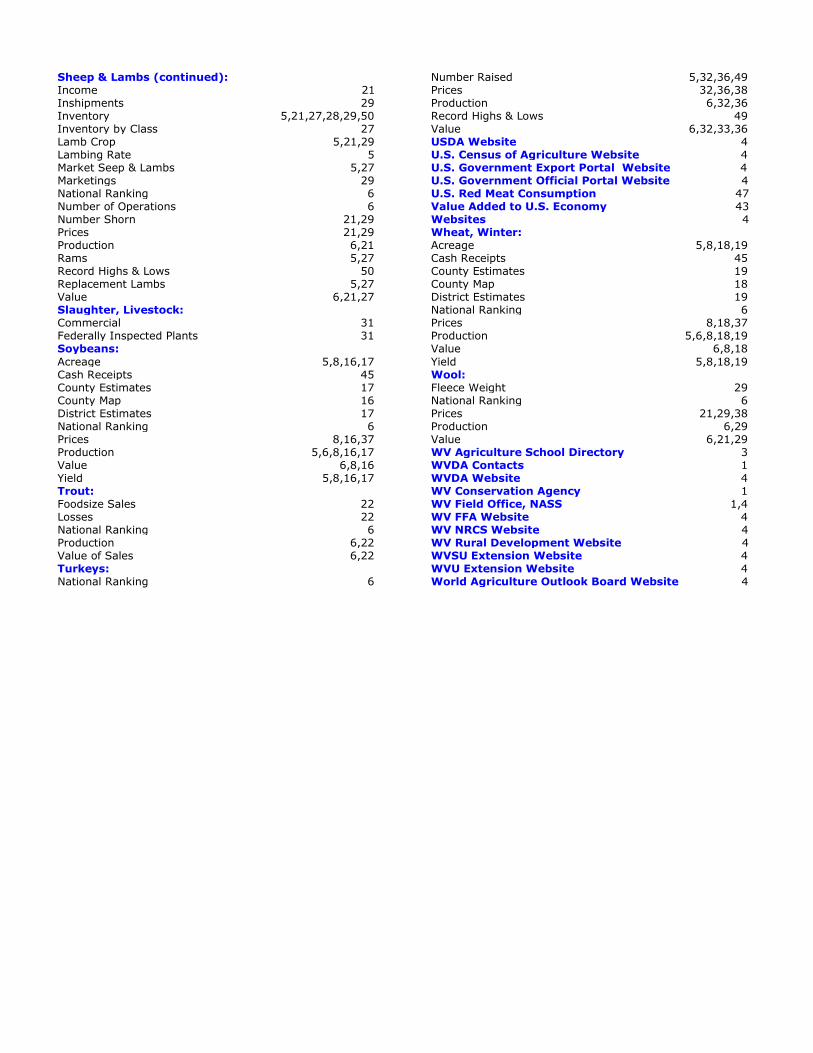
Sheep & Lambs (continued): Income 21 Inshipments 29 Inventory 5,21,27,28,29,50 Inventory by Class 27 Lamb Crop Lambing Rate Market Seep & Lambs Marketings
5,21,29 5
5,27 29
National Ranking 6 Number of Operations 6 Number Shorn 21,29 Prices 21,29 Production 6,21 Rams 5,27 Record Highs & Lows 50 Replacement Lambs 5,27 Value 6,21,27 Slaughter, Livestock: Commercial 31 Federally Inspected Plants 31 Soybeans:
Acreage 5,8,16,17 Cash Receipts 45 County Estimates 17 County Map 16 District Estimates 17 National Ranking 6 Prices 8,16,37 Production 5,6,8,16,17 Value 6,8,16 Yield 5,8,16,17 Trout: Foodsize Sales 22 Losses 22 National Ranking 6 Production 6,22 Value of Sales 6,22 Turkeys: National Ranking
6
Number Raised Prices
5,32,36,49 32,36,38
Production Record Highs & Lows Value
6,32,36 49
6,32,33,36 USDA Website 4 U.S. Census of Agriculture Website 4 U.S. Government Export Portal Website 4 U.S. Government Official Portal Website 4 U.S. Red Meat Consumption 47 Value Added to U.S. Economy 43 Websites 4 Wheat, Winter: Acreage 5,8,18,19 Cash Receipts 45 County Estimates 19 County Map 18 District Estimates 19 National Ranking 6 Prices 8,18,37 Production 5,6,8,18,19 Value 6,8,18
Yield 5,8,18,19 Wool: Fleece Weight 29 National Ranking 6 Prices 21,29,38 Production 6,29 Value 6,21,29 WV Agriculture School Directory 3 WVDA Contacts 1 WVDA Website 4 WV Conservation Agency WV Field Office, NASS
1 1,4
WV FFA Website 4 WV NRCS Website 4 WV Rural Development Website 4 WVSU Extension Website 4 WVU Extension Website 4 World Agriculture Outlook Board Website 4