Embed Size (px)
Citation preview
Opinion Research Services | The Strand • Swansea • SA1 1AF | 01792 535300 | www.ors.org.uk | [email protected]
West London Strategic Housing Market Assessment
Report of Findings
October 2018

Opinion Research Services | West London – Strategic Housing Market Assessment October 2018
2
Opinion Research Services | The Strand, Swansea SA1 1AF
Jonathan Lee | Nigel Moore | Trevor Baker | Scott Lawrence
enquiries: 01792 535300 · [email protected] · www.ors.org.uk
© Copyright October 2018
Opinion Research Services | West London – Strategic Housing Market Assessment October 2018
3
Contents
Executive Summary ............................................................................................ 7
Summary of Key Findings and Conclusions
Introduction ................................................................................................................................................. 7
Existing Planning Policy ............................................................................................................................... 7
Household Projections ................................................................................................................................ 8
Affordable Housing Need ............................................................................................................................ 9
Market Signals ............................................................................................................................................. 9
Conclusions on OAN .................................................................................................................................. 10
Size and Tenure Mix .................................................................................................................................. 11
Analysing the Impact of Changes Proposed by CLG .................................................................................. 12
1. Introducing the Study .................................................................................. 14
Background to the project and wider policy context
Introduction ............................................................................................................................................... 14
Government Policy: Pre July 2018 ............................................................................................................. 14
Government Policy: Post July 2018 ........................................................................................................... 15
London Specific SHMAs ............................................................................................................................. 16
Greater London SHMA 2017 ..................................................................................................................... 17
Assessing Overall Housing Need: Analysing the Impact of PPG Changes Proposed by CLG ..................... 20
Developing the Strategic Housing Market Assessment ............................................................................ 22
2. Defining the Housing Market Area .............................................................. 24
An evidence base to identify functional housing markets
Functional Housing Market Areas ............................................................................................................. 24
Planning Practice Guidance ....................................................................................................................... 24
Geography of Housing Market Areas (NHPAU/CURDS) ............................................................................ 25
Travel to Work Areas ................................................................................................................................. 26
Housing Markets in London ...................................................................................................................... 27
Migration Patterns .................................................................................................................................... 29
House Prices and Valuation Office Agency Broad Rental Market Areas ................................................... 31
Administrative Boundaries and Housing Market Areas ............................................................................ 33
Conclusions ................................................................................................................................................ 34
Opinion Research Services | West London – Strategic Housing Market Assessment October 2018
4
3. Area Profile and Market Signals................................................................... 35
Considering the balance between housing need and supply
Introduction ............................................................................................................................................... 35
Households and Dwellings ........................................................................................................................ 36
Property Type ............................................................................................................................................ 36
Tenure ....................................................................................................................................................... 37
Defining Market Signals............................................................................................................................. 37
Summary of Market Signals ...................................................................................................................... 38
4. Objectively Assessed Need .......................................................................... 42
Establishing the need for new dwellings
Process for Establishing Objectively Assessed Need ................................................................................. 42
GLA Projections ......................................................................................................................................... 43
Establishing Objectively Assessed Need for the West London Sub-Region .............................................. 47
CLG Household Projections ....................................................................................................................... 47
GLA Adjustments ....................................................................................................................................... 48
Employment Trends .................................................................................................................................. 48
Planned Employment Growth ................................................................................................................... 48
Economic Activity Projections ................................................................................................................... 49
Labour Market Participation Projections .................................................................................................. 50
Older People .............................................................................................................................................. 51
Female Participation .................................................................................................................................. 52
Young People ............................................................................................................................................. 54
Projecting Future Economic Activity for West London ............................................................................ 54
Future Changes to Workforce ................................................................................................................... 55
Conclusions on Jobs and Workers ............................................................................................................. 56
Market Signals ........................................................................................................................................... 56
Conclusions on OAN .................................................................................................................................. 57
5. Affordable Housing Need ............................................................................ 59
Identifying households who cannot afford market housing
Introduction ............................................................................................................................................... 59
Current Affordable Housing Need: The Backlog of Need .......................................................................... 60
Local Authority Data: Homeless Households and Temporary Accommodation ....................................... 60
Census Data: Concealed Households and Overcrowding ......................................................................... 61
Concealed Families .................................................................................................................................... 61
Overcrowding ............................................................................................................................................ 62
English Housing Survey Data ..................................................................................................................... 63
Opinion Research Services | West London – Strategic Housing Market Assessment October 2018
5
Overcrowding ............................................................................................................................................ 63
Housing Register Data ............................................................................................................................... 65
Households Unable to Afford their Housing Costs .................................................................................... 67
Establishing Affordable Housing Need ...................................................................................................... 68
Establishing the Current Unmet Need for Affordable Housing ................................................................. 68
Projected Future Affordable Housing Need .............................................................................................. 70
Assessing the Overall Need for Affordable Housing ................................................................................. 72
Size and Tenure Mix .................................................................................................................................. 73
Affordable Housing in the Greater London SHMA .................................................................................... 75
Affordable Housing to Own ....................................................................................................................... 78
Essential Public Sector Workers ................................................................................................................ 79
Conclusions ................................................................................................................................................ 80
6. Needs of different groups ............................................................................ 81
Addressing the need for all types of housing
The Private Rented Sector ......................................................................................................................... 81
National Context ....................................................................................................................................... 82
Private Rented Sector in London ............................................................................................................... 83
Private Rented Sector in the West London Sub-Region ............................................................................ 83
The Future Role of the Private Rented Sector........................................................................................... 84
Projected Population Age Profile .............................................................................................................. 84
Household Projections .............................................................................................................................. 86
Projected Household Types ....................................................................................................................... 87
Summary ................................................................................................................................................... 88
People Wishing to Build their Own Homes ............................................................................................... 89
Housing for Older People .......................................................................................................................... 91
Housing for People with Disabilities .......................................................................................................... 94
Black and Minority Ethnic Population ..................................................................................................... 102
Tenure ..................................................................................................................................................... 106
Overcrowding .......................................................................................................................................... 107
Concealed Households ............................................................................................................................ 108
Religion .................................................................................................................................................... 111
Service Families ....................................................................................................................................... 115
The Armed Forces in West London ......................................................................................................... 115
Student Housing ...................................................................................................................................... 117
Gypsies and Travellers ............................................................................................................................. 118
Boat Dwellers .......................................................................................................................................... 120

Opinion Research Services | West London – Strategic Housing Market Assessment October 2018
6
Appendix A ..................................................................................................... 122
Table of Figures
Appendix B ..................................................................................................... 126
Glossary of Terms
Definitions ............................................................................................................................................... 126
Acronyms and Initials .............................................................................................................................. 129
Opinion Research Services | West London – Strategic Housing Market Assessment October 2018
7
Executive Summary Summary of Key Findings and Conclusions
Introduction
1. Opinion Research Services (ORS) was commissioned by the London Borough of Barnet to prepare a Strategic
Housing Market Assessment (SHMA) for the boroughs comprising the West London Alliance (WLA). The West
London Alliance is a partnership between the London boroughs of Barnet, Brent, Ealing, Hammersmith &
Fulham, Harrow, Hillingdon, Hounslow and Old Oak and Park Royal Development Corporation. This is the
Executive Summary for West London sub-region.
2. The SHMA methodology was based on secondary data, and the SHMA sought to:
» Provide evidence of the need and demand for housing based on demographic projections;
» Consider market signals about the balance between demand for and supply of dwellings;
» Establish the Objectively Assessed Need for housing over the period 2016-41;
» Identify the appropriate balance between market and affordable housing; and
» Address the needs for all types of housing, including the private rented sector, people wishing
to build their own home, family housing, housing for older people and households with
specific needs.
Existing Planning Policy
3. The National Planning Policy Framework (NPPF) was updated in July 2018. Prior to July 2018, the NPPF 2012
contained a presumption in favour of sustainable development, and stated that Local Plans should meet the
full, objectively assessed needs for market and affordable housing in the housing market area.
4. The NPPF was updated in July 2018 and contains a number of changes. The underlying theme of sustainable
development remains, but in relation of identifying and meeting housing needs several significant changes
have been implemented. These include the NPPF 2018 containing:
» No references to housing market areas;
» No mention of Strategic Housing Market Assessments;
» A new standard methodology to underwrite a local housing market assessment;
» A new definition of affordable housing; and
» A housing delivery test to assess if a planning authority is meeting its housing needs.
5. The NPPF 2018 also contains a transition period which implies that any Local Plan submitted before January
24th 2019 will be assessed against the NPPF 2012 and existing planning practice guidance.
Opinion Research Services | West London – Strategic Housing Market Assessment October 2018
8
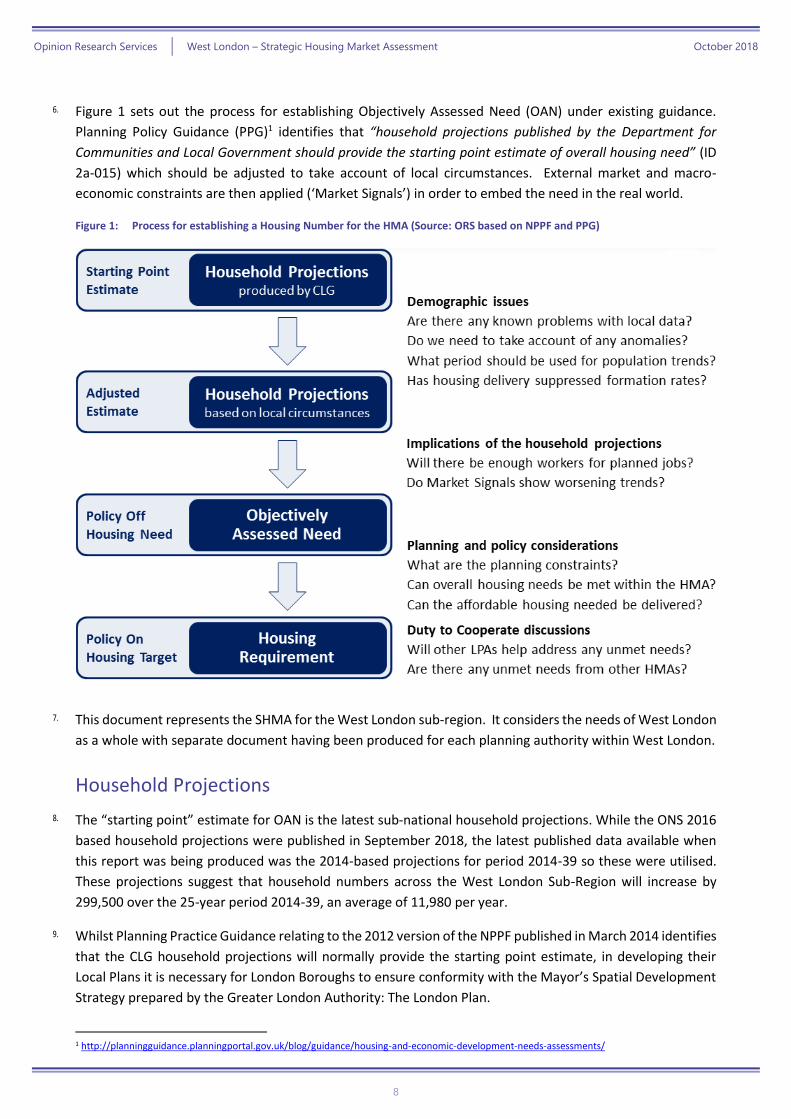
6. Figure 1 sets out the process for establishing Objectively Assessed Need (OAN) under existing guidance.
Planning Policy Guidance (PPG)1 identifies that “household projections published by the Department for
Communities and Local Government should provide the starting point estimate of overall housing need” (ID
2a-015) which should be adjusted to take account of local circumstances. External market and macro-
economic constraints are then applied (‘Market Signals’) in order to embed the need in the real world.
Figure 1: Process for establishing a Housing Number for the HMA (Source: ORS based on NPPF and PPG)
7. This document represents the SHMA for the West London sub-region. It considers the needs of West London
as a whole with separate document having been produced for each planning authority within West London.
Household Projections
8. The “starting point” estimate for OAN is the latest sub-national household projections. While the ONS 2016
based household projections were published in September 2018, the latest published data available when
this report was being produced was the 2014-based projections for period 2014-39 so these were utilised.
These projections suggest that household numbers across the West London Sub-Region will increase by
299,500 over the 25-year period 2014-39, an average of 11,980 per year.
9. Whilst Planning Practice Guidance relating to the 2012 version of the NPPF published in March 2014 identifies
that the CLG household projections will normally provide the starting point estimate, in developing their
Local Plans it is necessary for London Boroughs to ensure conformity with the Mayor’s Spatial Development
Strategy prepared by the Greater London Authority: The London Plan.
1 http://planningguidance.planningportal.gov.uk/blog/guidance/housing-and-economic-development-needs-assessments/
Opinion Research Services | West London – Strategic Housing Market Assessment October 2018
9
10. The London Plan is informed by household projections developed by the GLA. Given this context, the GLA
projections have been routinely accepted for establishing overall housing need for London boroughs. The
GLA have calculated 2016 based household projections also include scenarios using 5, 10 and 15-year
migration trends. On the basis of 10-year migration trends, household numbers in the West London Sub-
Region are projected to increase by 266,750 households over the 25-year period 2016-41, an average of
10,670 per year. Whilst this projection is lower than the CLG 2014-based household projection as this
scenario is based on longer-term migration trends it gives the most reliable and appropriate demographic
projection for establishing future housing need.
11. However, we would note that we do have concerns around the validity of the GLA demographic data. Using
alternative and reasonable assumptions regarding likely sizes of future households shows a growth in
household numbers for 2016-41 of 168,400 households (6,700 per annum).
Affordable Housing Need
12. Based on the household projections of an increase of 10,670 per annum to be in conformity with the GLA’s
Central trend scenario, this study has established the balance between the need for market housing and the
need for affordable housing. The analysis includes an identified need to increase the overall housing need
by 10,334 households to take account of concealed families and homeless households that would not be
captured by the household projections.
13. The housing mix analysis identified a need to provide 106,219 additional affordable dwellings over the 25-
year period 2016-41 (an average of 4,250 per year), representing 33% of the overall OAN for the West London
sub-region. In summary:
» Based upon affordability being assessed against the ability to afford market rents there is a
need for 67% of the new dwelling stock to be market housing and 33% to be affordable.
Among this affordable housing need there is a need for around 25% to be intermediate and
75% low cost rent; and
» The change in definition to affordable housing set out in the NPPF 2018 will see affordable
housing being assessed against the ability to want and afford owner occupation. This will see
households who would otherwise be able to afford market rent being in need of affordable
housing because they wish to become owner occupiers. The impact of this change would be
to see a share of the market housing need move to intermediate housing need as households
who cannot afford to be owner occupiers are counted in the affordable housing need
category.
Market Signals
14. NPPF sets out that “Plans should take account of market signals…” (ID 2a-017) and PPG identifies that “the
housing need number suggested by household projections (the starting point) should be adjusted to reflect
appropriate market signals”. The SHMA has considered the Market Signals for West London and compared
these to other London Boroughs and England as a whole. On the basis of this data we can conclude that in
West London:
» Five of the seven boroughs have average lower quartile house prices than Greater London as a
whole;
» Average monthly rents have increased, though by less than for Greater London as a whole;
Opinion Research Services | West London – Strategic Housing Market Assessment October 2018
10
» Whilst the affordability ratio has increased over 5 years by less than the percentage increase for
Greater London in four out of the seven boroughs, affordability is worse than for Greater
London in five of the seven;
» The percentage of overcrowded households has increased by more than for Greater London in
four of the seven boroughs;
» Housing delivery relative to stock has increased by more than for Greater London in four of the
seven boroughs since 2011.
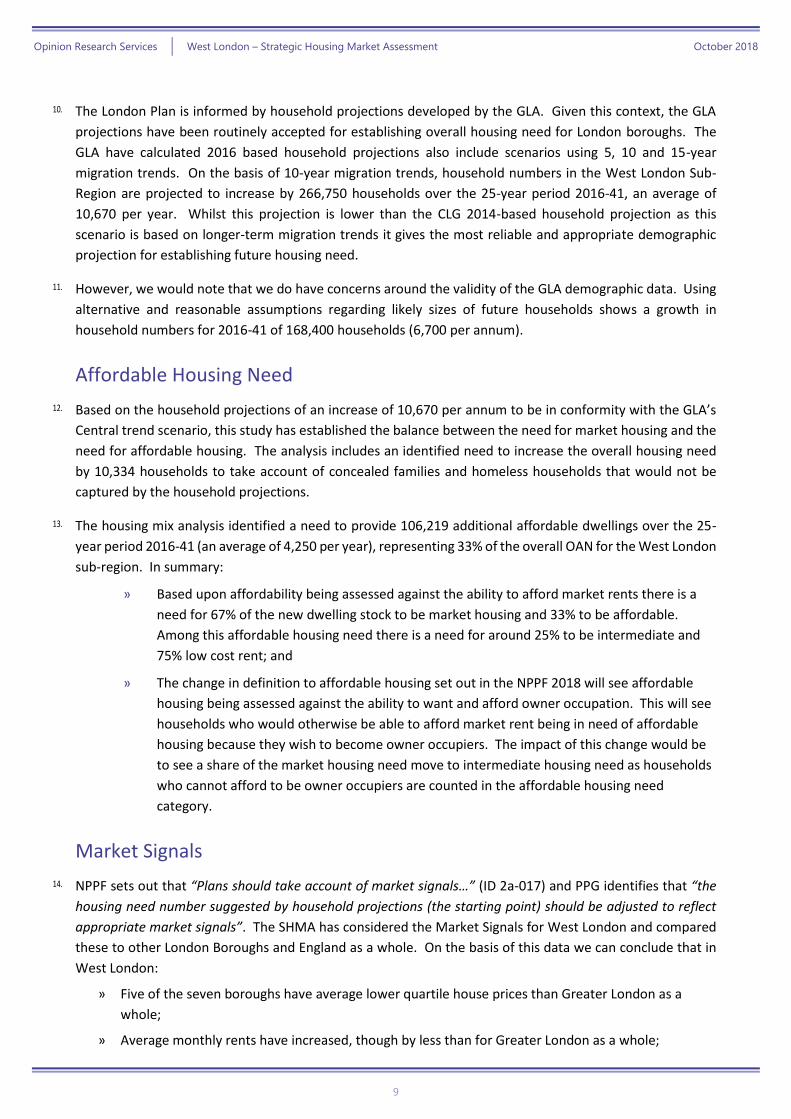
15. Given the relative market signal indicators for each borough (discussed in each borough’s respective SHMA),
the following uplifts were deemed reasonable for the West London boroughs (Figure 20):
Figure 2: Market Signals Uplifts for West London Boroughs (Source 2018 SHMA reports, ORS)
West London Borough Market Signals Uplift
Barnet 20%
Brent 20%
Ealing 20%
Hammersmith & Fulham 20%
Harrow 20%
Hillingdon 15%
Hounslow 15%
Conclusions on OAN
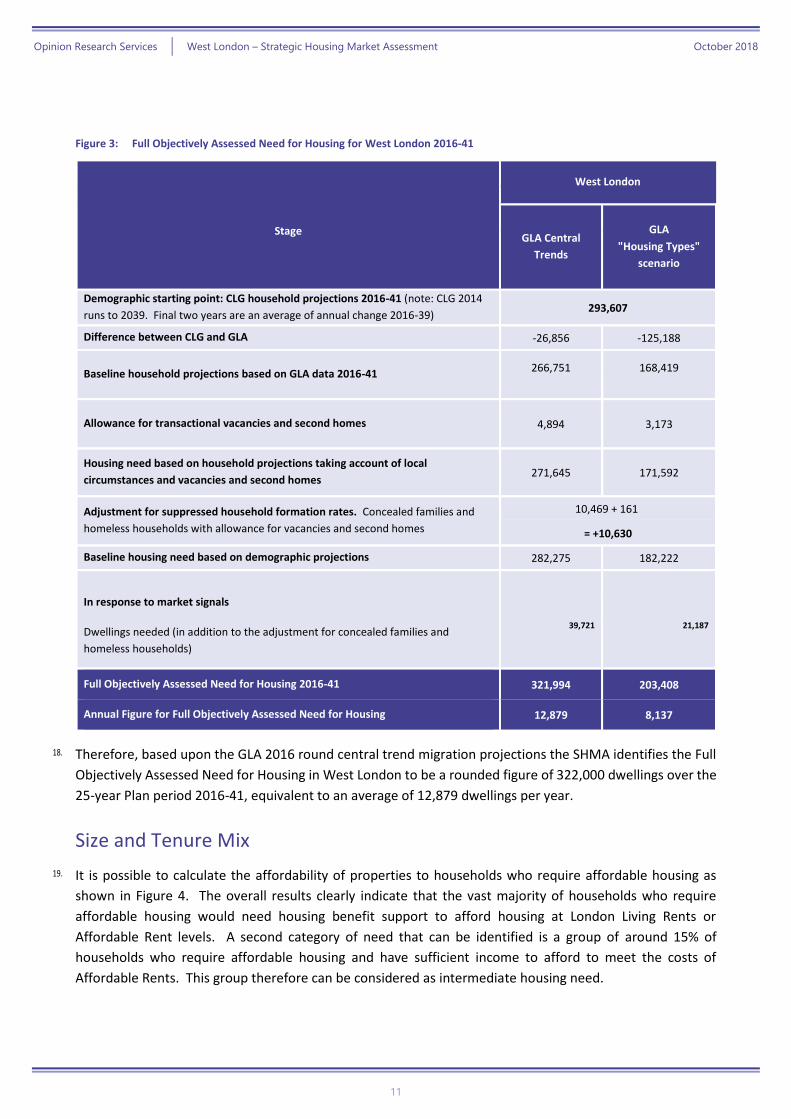
16. Based upon the information set out in the chapter on OAN, Figure 3 summarises the Full Objectively Assessed
Need for Housing across West London, including the response for market signals and a vacancy and second
home rate2.
17. The two figures presented can be seen to be at either end of a spectrum where one assumes the total number
of households in the GLA Central trends projections is correct, while the second assumes that the mix of
households is correct. In practice the key issue is that the population of West London must be
accommodated, and this can be done in a higher number of smaller dwellings, or a lower number of larger
dwellings.
2 Source: MHCLG Live Table 615 (vacants), Council Tax Base (second homes)
Opinion Research Services | West London – Strategic Housing Market Assessment October 2018
11
Figure 3: Full Objectively Assessed Need for Housing for West London 2016-41
Stage
West London
GLA Central
Trends
GLA
"Housing Types"
scenario
Demographic starting point: CLG household projections 2016-41 (note: CLG 2014
runs to 2039. Final two years are an average of annual change 2016-39) 293,607
Difference between CLG and GLA -26,856 -125,188
Baseline household projections based on GLA data 2016-41 266,751
168,419
Allowance for transactional vacancies and second homes 4,894 3,173
Housing need based on household projections taking account of local
circumstances and vacancies and second homes 271,645 171,592
Adjustment for suppressed household formation rates. Concealed families and
homeless households with allowance for vacancies and second homes
10,469 + 161
= +10,630
Baseline housing need based on demographic projections 282,275 182,222
In response to market signals
Dwellings needed (in addition to the adjustment for concealed families and
homeless households)
39,721 21,187
Full Objectively Assessed Need for Housing 2016-41 321,994 203,408
Annual Figure for Full Objectively Assessed Need for Housing 12,879 8,137
18. Therefore, based upon the GLA 2016 round central trend migration projections the SHMA identifies the Full
Objectively Assessed Need for Housing in West London to be a rounded figure of 322,000 dwellings over the
25-year Plan period 2016-41, equivalent to an average of 12,879 dwellings per year.
Size and Tenure Mix
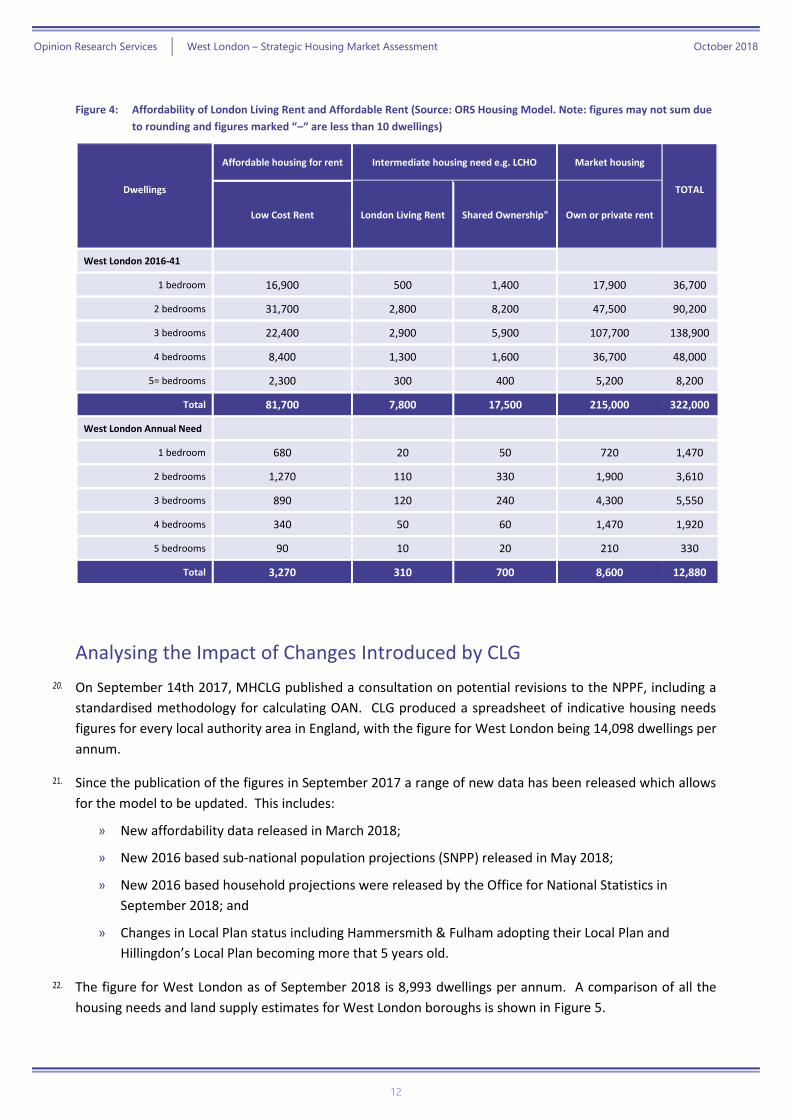
19. It is possible to calculate the affordability of properties to households who require affordable housing as
shown in Figure 4. The overall results clearly indicate that the vast majority of households who require
affordable housing would need housing benefit support to afford housing at London Living Rents or
Affordable Rent levels. A second category of need that can be identified is a group of around 15% of
households who require affordable housing and have sufficient income to afford to meet the costs of
Affordable Rents. This group therefore can be considered as intermediate housing need.
Opinion Research Services | West London – Strategic Housing Market Assessment October 2018
12
Figure 4: Affordability of London Living Rent and Affordable Rent (Source: ORS Housing Model. Note: figures may not sum due
to rounding and figures marked “–“ are less than 10 dwellings)
Dwellings
Affordable housing for rent Intermediate housing need e.g. LCHO Market housing
TOTAL
Low Cost Rent London Living Rent Shared Ownership" Own or private rent
West London 2016-41
1 bedroom 16,900 500 1,400 17,900 36,700
2 bedrooms 31,700 2,800 8,200 47,500 90,200
3 bedrooms 22,400 2,900 5,900 107,700 138,900
4 bedrooms 8,400 1,300 1,600 36,700 48,000
5= bedrooms 2,300 300 400 5,200 8,200
Total 81,700 7,800 17,500 215,000 322,000
West London Annual Need
1 bedroom 680 20 50 720 1,470
2 bedrooms 1,270 110 330 1,900 3,610
3 bedrooms 890 120 240 4,300 5,550
4 bedrooms 340 50 60 1,470 1,920
5 bedrooms 90 10 20 210 330
Total 3,270 310 700 8,600 12,880
Analysing the Impact of Changes Introduced by CLG
20. On September 14th 2017, MHCLG published a consultation on potential revisions to the NPPF, including a
standardised methodology for calculating OAN. CLG produced a spreadsheet of indicative housing needs
figures for every local authority area in England, with the figure for West London being 14,098 dwellings per
annum.
21. Since the publication of the figures in September 2017 a range of new data has been released which allows
for the model to be updated. This includes:
» New affordability data released in March 2018;
» New 2016 based sub-national population projections (SNPP) released in May 2018;
» New 2016 based household projections were released by the Office for National Statistics in
September 2018; and
» Changes in Local Plan status including Hammersmith & Fulham adopting their Local Plan and
Hillingdon’s Local Plan becoming more that 5 years old.
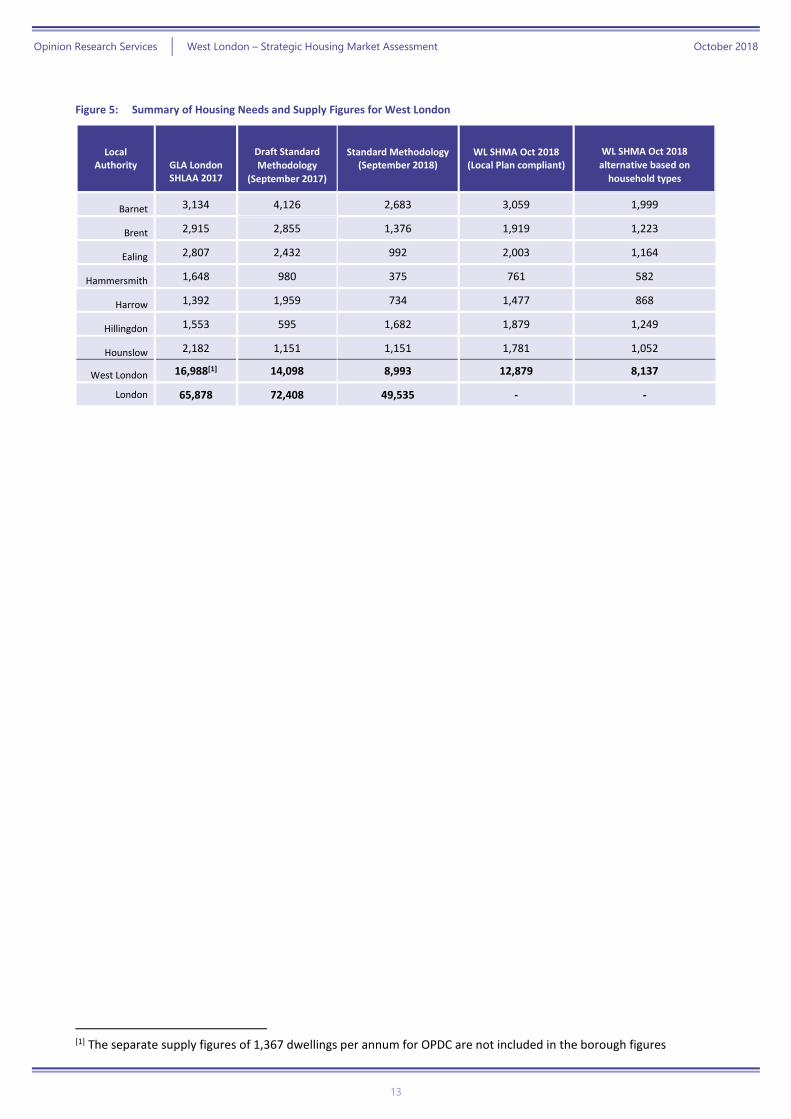
22. The figure for West London as of September 2018 is 8,993 dwellings per annum. A comparison of all the
housing needs and land supply estimates for West London boroughs is shown in Figure 5.
Opinion Research Services | West London – Strategic Housing Market Assessment October 2018
13
Figure 5: Summary of Housing Needs and Supply Figures for West London
Local Authority
GLA London SHLAA 2017
Draft Standard
Methodology
(September 2017)
Standard Methodology (September 2018)
WL SHMA Oct 2018 (Local Plan compliant)
WL SHMA Oct 2018
alternative based on
household types
Barnet 3,134 4,126 2,683 3,059 1,999
Brent 2,915 2,855 1,376 1,919 1,223
Ealing 2,807 2,432 992 2,003 1,164
Hammersmith 1,648 980 375 761 582
Harrow 1,392 1,959 734 1,477 868
Hillingdon 1,553 595 1,682 1,879 1,249
Hounslow 2,182 1,151 1,151 1,781 1,052
West London 16,988[1] 14,098 8,993 12,879 8,137
London 65,878 72,408 49,535 - -
[1] The separate supply figures of 1,367 dwellings per annum for OPDC are not included in the borough figures

Opinion Research Services | West London – Strategic Housing Market Assessment October 2018
14
1. Introducing the Study Background to the project and wider policy context
Introduction
1.1 Opinion Research Services (ORS) was commissioned by the London Borough of Barnet to prepare a Strategic
Housing Market Assessment (SHMA) for the boroughs comprising the West London Alliance (WLA). The
West London Alliance is a partnership between the London boroughs of Barnet, Brent, Ealing, Hammersmith
& Fulham, Harrow, Hillingdon and Hounslow.
1.2 One of the main purposes of the West London Alliance is to facilitate the seven boroughs working together
to meet their strategic housing objectives. To this end, this SHMA examines the needs of West London as a
whole; and should be read in the context of the individual SHMAs for each borough that have been produced
in parallel to this study.
1.3 In addition, a further SHMA has been produced for the Old Oak and Park Royal Development Corporation
(OPDC) area. This Mayoral Development Corporation is working specifically to develop an area comprising
a portion of Brent, Ealing, and Hammersmith & Fulham. Their SHMA is built from analysis at the individual
borough level. As such, the needs identified in the OPDC SHMA are included within the wider needs of Brent
Ealing and Hammersmith & Fulham for the purposes of this document and are not considered separately as
part of aggregate totals. This precludes the possibility of double counting.
Government Policy: Pre July 2018
1.4 The National Planning Policy Framework (NPPF) was updated in July 2018. Prior to July 2018, the NPPF 2012
contained a presumption in favour of sustainable development, and stated that Local Plans should meet the
full, objectively assessed needs for market and affordable housing in the housing market area.
At the heart of the National Planning Policy Framework is a presumption in favour of sustainable
development, which should be seen as a golden thread running through both plan-making and
decision-taking.
Local planning authorities should positively seek opportunities to meet the development needs of
their area.
Local Plans should meet objectively assessed needs, with sufficient flexibility to adapt to rapid
change, unless any adverse impacts of doing so would significantly and demonstrably outweigh the
benefits, when assessed against the policies in this Framework taken as a whole.
National Planning Policy Framework (NPPF), paragraph 14
To boost significantly the supply of housing, local planning authorities should use their evidence
base to ensure that their Local Plan meets the full, objectively assessed needs for market and
affordable housing in the housing market area, as far as is consistent with the policies set out in this
Framework.
Opinion Research Services | West London – Strategic Housing Market Assessment October 2018
15
National Planning Policy Framework 2012 (NPPF), paragraph 47
1.5 Given this context, Strategic Housing Market Assessments (SHMAs) primarily informed the production of the
Local Plan (which sets out the spatial policy for a local area). Their key objective was to provide the robust
and strategic evidence base required to establish the full Objectively Assessed Need (OAN) for housing and
provide information on the appropriate mix of housing and range of tenures needed. They did not set a
‘housing target’ for the planning authority.
1.6 Planning Practice Guidance (PPG) on the assessment of housing and economic development needs was
published in March 2014 and was updated in March 2015 and was further updated in September 2018.
Government Policy: Post July 2018
1.7 The NPPF was updated in July 2018 and contains a number of changes. The underlying theme of sustainable
development remains, but in relation of identifying and meeting housing needs several significant changes
have been implemented. These include the NPPF 2018 containing:
» No references to housing market areas;
» No mention of Strategic Housing Market Assessments;
» A new standard methodology to underwrite a local housing market assessment;
» A new definition of affordable housing; and
» A housing delivery test to assess if a planning authority is meeting its housing needs.
60. To determine the minimum number of homes needed, strategic policies should be informed by a
local housing need assessment, conducted using the standard method in national planning guidance
– unless exceptional circumstances justify an alternative approach which also reflects current and
future demographic trends and market signals. In addition to the local housing need figure, any
needs that cannot be met within neighbouring areas should also be taken into account in
establishing the amount of housing to be planned for.
61. Within this context, the size, type and tenure of housing needed for different groups in the
community should be assessed and reflected in planning policies (including, but not limited to, those
who require affordable housing, families with children, older people, students, people with
disabilities, service families, travellers, people who rent their homes and people wishing to
commission or build their own homes).
62. Where a need for affordable housing is identified, planning policies should specify the type of
affordable housing required, and expect it to be met on-site unless: a) off-site provision or an
appropriate financial contribution in lieu can be robustly justified; and b) the agreed approach
contributes to the objective of creating mixed and balanced communities.
National Planning Policy Framework 2018 (NPPF), paragraph 60-62
1.8 We will explore all of these issues in more detail below. The NPPF 2018 also contains a transition period
which implies that any Local Plan submitted before January 24th 2019 will be assessed against the NPPF 2012
and existing planning practice guidance.
Opinion Research Services | West London – Strategic Housing Market Assessment October 2018
16
London Specific SHMAs
1.9 The Strategic Planning Authority for London is the Greater London Authority. The GLA have produced a
London SHMA (2013) covering the whole of Greater London which has been used to underwrite the evidence
base for the Further Alterations to the London Plan (FALP) 2014.
1.10 The Report on the Examination in Public into the Further Alterations to the London Plan was published in
November 2014. Issue 2 of the report was:
Given that the FALP sets out the objectively assessed housing need for London should London Boroughs be required to undertake their own assessments?
1.11 In response to this question the inspector concluded that this was not necessary. From paragraph 18
onwards he concluded that:
“The NPPF at paragraph 47 requires local planning authorities to, amongst other things, ‘use
their evidence base to ensure that their Local Plan meets the full, objectively assessed needs
for market and affordable housing in the housing market area’. The guidance in the NPPF
regarding plan making is silent with regard to how responsibilities should be divided in a two
tier system as exists uniquely in London. The London Plan is part of the development plan for
London and, in my view, it must be right that read together with the development plan
documents produced by London Boroughs, the development plan should be consistent with
national policy.
However, in a two tier system there should be no need for each part of the development plan
to include the full range of policies necessary to accord with all parts of the NPPF or PPG,
provided that together they do (as far as is necessary) and are consistent with national
policy. The PPG advises that there should be no need to reiterate policies that are already
set out in the NPPF in Local Plans. It seems to me that the same principle should apply to a
spatial development strategy. Further, to avoid unnecessary duplication and potential
confusion, there should be no need for a local plan in London to reiterate policies set out in
the FALP.
Section 334 of the GLA Act requires the Mayor to prepare a spatial development strategy.
That plan must include a statement formulating the Mayor’s strategy for spatial
development for the use of land in Greater London. Housing need, supply and distribution
are undisputedly strategic matters in London. I conclude below that the Mayor’s estimate of
objectively assessed housing need in London is justified by the evidence submitted to the EiP.
Further, although I have reservations, I also consider that the FALP’s strategy with regard to
supply and distribution can be supported in the short term.
Once adopted, statute will require the local plans produced by London Boroughs to be in
general conformity with the FALP. That includes conforming with a strategy which seeks to
meet London’s needs on brownfield land within the existing built up area. The SHLAA
identifies most of the existing capacity and, effectively, through the SHLAA, the FALP has
determined the extent to which individual Boroughs can contribute to meeting the strategic
need for housing across London. Within the confines of the FALP’s strategy there is little
scope to do more.
Opinion Research Services | West London – Strategic Housing Market Assessment October 2018
17
I acknowledge that the NPPF requires each local planning authority to identify its own
objectively assessed housing need. However, in my view, it is the role of the spatial
development strategy to determine the overall level of need for London and to guide the
distribution of new housing to meet that need. The Mayor points to the acceptance by
previous EiP Panels that London constitutes a single housing market area with sub markets
which span Borough boundaries. The Mayor also points to the findings of the High Court,
following a challenge to the Revised Early Minor Alterations to the London Plan, within
which in his (undisputed) opinion, the Court accepted that although local variations exist,
this did not compromise the view that London constitutes a single housing market area.
Other than some fine tuning regarding local need relating to the size and type of property
and tenure, there is no need, in my view, for each London Borough to duplicate the work
done by the GLA and produce their own individual assessment of overall need. IRC1
recommends that the FALP is changed to reflect this approach by removing references to
London Boroughs needing to identify objectively assessed need with regard to the quantum
of new housing in their areas”.
1.12 In a position which lead to some initial confusion, the wording of this letter has been accepted by the Mayor
of London, however no polices in the FALP were changed as a result. The GLA’s position was clarified in May
2015 in their Draft Interim Housing Supplementary Planning Guidance. At paragraph 3.19 the document lists
how the London planning authorities should proceed in assessing their housing needs.
» Consider housing market area geographies that extend beyond single borough boundaries
» Consider different demographic scenarios, ideally using GLA household projections for
consistency
» Make allowance for backlog need and other factors that increase the number of homes
required.
» Take account of market signals
» Consider how the economy and jobs growth will influence housing need.
» Take into account wider needs.
» Specific needs.
1.13 This SHMA meets the CLG national guidance (NPPF) and the GLA’s Draft Interim Housing Supplementary
Planning Guidance, paragraph 3.19.
Greater London SHMA 2017
1.14 The Greater London SHMA 2017 builds upon the work of the Greater London SHMA 2013 using a very similar
methodology and assumptions to produce a new estimated annual dwelling need of 65,878 dwellings. A
separate estimate for potential dwelling delivery has been produced and is shown for West London in Figure
6. This clearly represent a very substantial growth, so we will review the process by which the calculation
was derived.
Opinion Research Services | West London – Strategic Housing Market Assessment October 2018
18
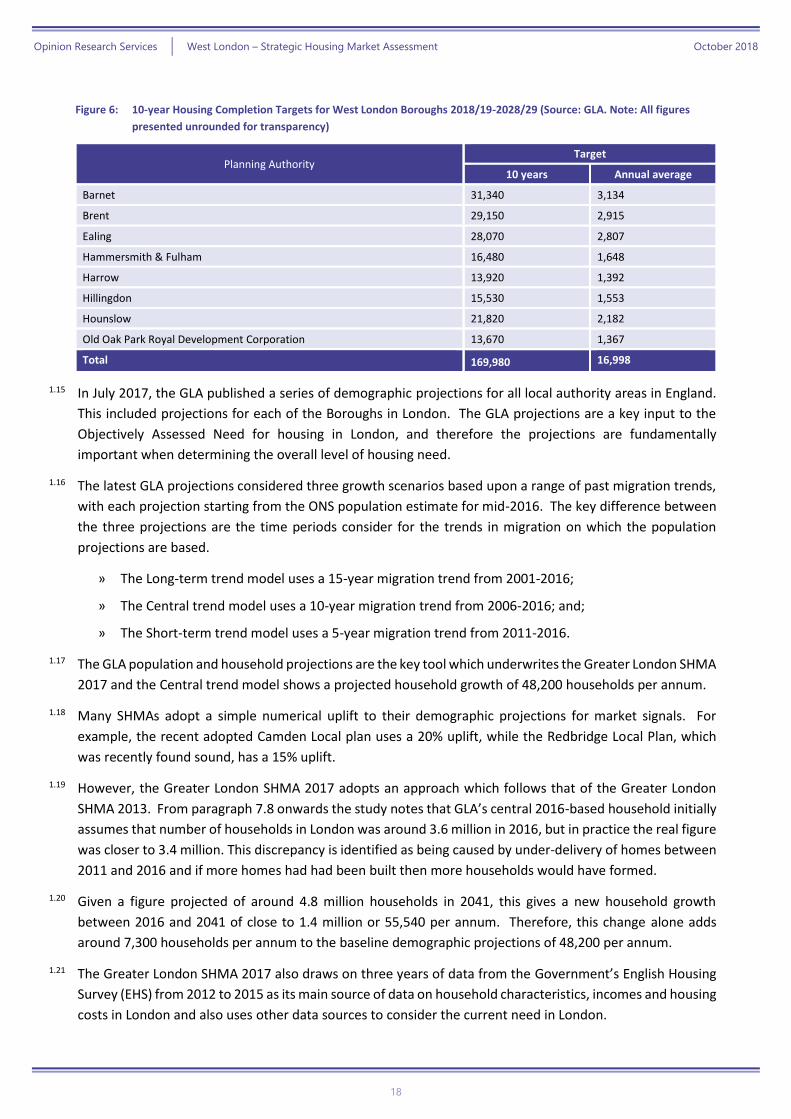
Figure 6: 10-year Housing Completion Targets for West London Boroughs 2018/19-2028/29 (Source: GLA. Note: All figures
presented unrounded for transparency)
Planning Authority Target
10 years Annual average
Barnet 31,340 3,134
Brent 29,150 2,915
Ealing 28,070 2,807
Hammersmith & Fulham 16,480 1,648
Harrow 13,920 1,392
Hillingdon 15,530 1,553
Hounslow 21,820 2,182
Old Oak Park Royal Development Corporation 13,670 1,367
Total 169,980 16,998
1.15 In July 2017, the GLA published a series of demographic projections for all local authority areas in England.
This included projections for each of the Boroughs in London. The GLA projections are a key input to the
Objectively Assessed Need for housing in London, and therefore the projections are fundamentally
important when determining the overall level of housing need.
1.16 The latest GLA projections considered three growth scenarios based upon a range of past migration trends,
with each projection starting from the ONS population estimate for mid-2016. The key difference between
the three projections are the time periods consider for the trends in migration on which the population
projections are based.
» The Long-term trend model uses a 15-year migration trend from 2001-2016;
» The Central trend model uses a 10-year migration trend from 2006-2016; and;
» The Short-term trend model uses a 5-year migration trend from 2011-2016.
1.17 The GLA population and household projections are the key tool which underwrites the Greater London SHMA
2017 and the Central trend model shows a projected household growth of 48,200 households per annum.
1.18 Many SHMAs adopt a simple numerical uplift to their demographic projections for market signals. For
example, the recent adopted Camden Local plan uses a 20% uplift, while the Redbridge Local Plan, which
was recently found sound, has a 15% uplift.
1.19 However, the Greater London SHMA 2017 adopts an approach which follows that of the Greater London
SHMA 2013. From paragraph 7.8 onwards the study notes that GLA’s central 2016-based household initially
assumes that number of households in London was around 3.6 million in 2016, but in practice the real figure
was closer to 3.4 million. This discrepancy is identified as being caused by under-delivery of homes between
2011 and 2016 and if more homes had had been built then more households would have formed.
1.20 Given a figure projected of around 4.8 million households in 2041, this gives a new household growth
between 2016 and 2041 of close to 1.4 million or 55,540 per annum. Therefore, this change alone adds
around 7,300 households per annum to the baseline demographic projections of 48,200 per annum.
1.21 The Greater London SHMA 2017 also draws on three years of data from the Government’s English Housing
Survey (EHS) from 2012 to 2015 as its main source of data on household characteristics, incomes and housing
costs in London and also uses other data sources to consider the current need in London.
Opinion Research Services | West London – Strategic Housing Market Assessment October 2018
19
1.22 This identifies a total of 219,025 households in need of a dwellings in 2016, or an annual average backlog of
need spread over 20 years of 8,761 per annum. The impact of include these needs is to a raise the level of
total household growth to 64,301 per annum.
1.23 In line with standard practice a vacancy and second home rate are then added to this figure at a rate of 1.9%,
giving a total objectively assessed need of 65,878 per annum. Figure 7 summarises the various stages which
build to the Greater London SHMA 2017 OAN.
Figure 7: Stages for objectively Assessed need for London 2016-41 (Source: GLA Greater London SHMA 2017 Note: All figures
presented unrounded for transparency)
Stage
Household/Dwelling growth
Annualised GLA 2016 based Central Trend household projections
+48,200
Backlog of need for dwellings not delivered since 2011 +7,340
Backlog of need for households in need from EHS and other data sources
+8,761
Vacancy and second home allowance +1,577
Objectively Assessed Housing Needs for London 65,878
1.24 A figure of 65,878 dwellings per annum for the Objectively Assessed Needs for Greater London would equate
to a growth in the dwelling stock of London by around 50% over the period 2016-41. While the population
projections suggest that growth over the same period will be around 23%, dwelling growth is projected to
occur at twice this rate.
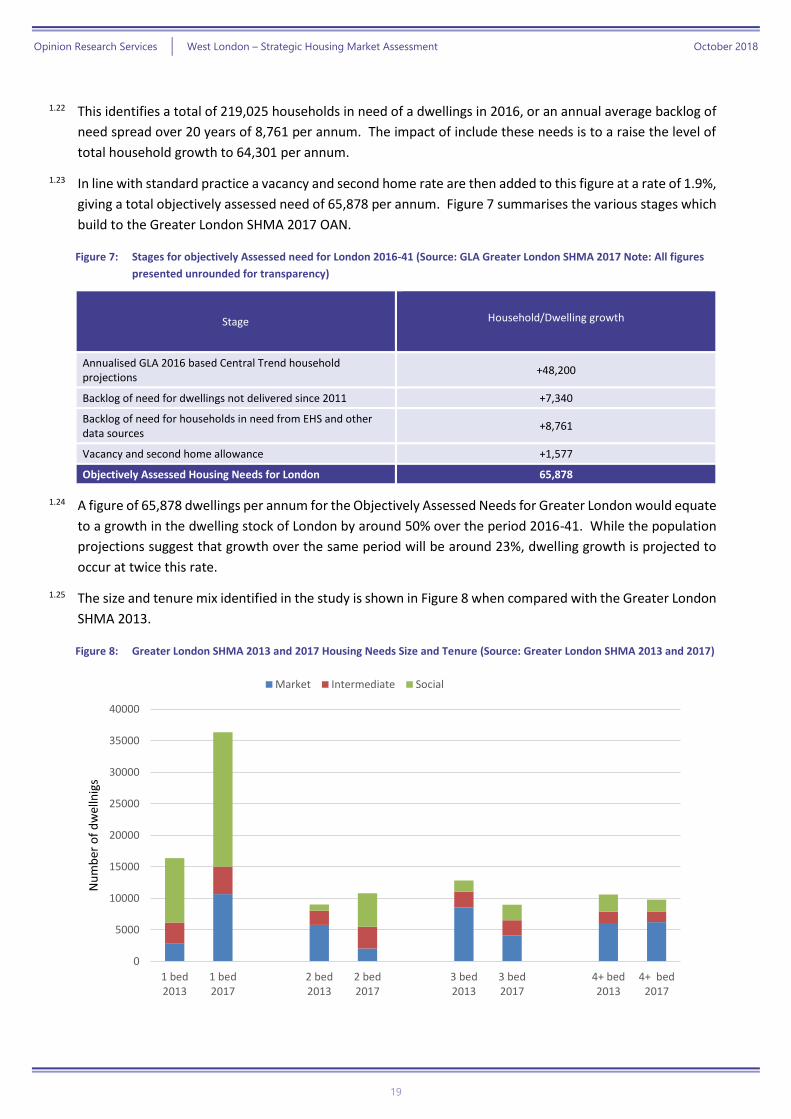
1.25 The size and tenure mix identified in the study is shown in Figure 8 when compared with the Greater London
SHMA 2013.
Figure 8: Greater London SHMA 2013 and 2017 Housing Needs Size and Tenure (Source: Greater London SHMA 2013 and 2017)
0
5000
10000
15000
20000
25000
30000
35000
40000
1 bed2013
1 bed2017
2 bed2013
2 bed2017
3 bed2013
3 bed2017
4+ bed2013
4+ bed2017
Nu
mb
er o
f d
wel
lnig
s
Market Intermediate Social
Opinion Research Services | West London – Strategic Housing Market Assessment October 2018
20
1.26 The figures show a much higher need for affordable housing than the Greater London SHMA 2013 and also
a much greater need for 1 bed properties. The key reason for this is that around 75% of the net backlog of
need comes from concealed households, who can be any individual, couple or other household type aged
25 years or over. Around 90% of this group are identified as requiring a 1-bedroom property, indicating that
they are either a single person or a couple without a child.
1.27 Recent changes to welfare payments have seen the Local Housing Allowance (LHA) Shared Accommodation
Rate (SAR) allowance to cover all single persons up to 35 years of age has meant that many more young
people will only be able to afford shared housing, which are typically Houses in Multiple Occupation.
1.28 Therefore, the Greater London SHMA 2017 identifies the need for self-contained accommodation for many
households who the welfare support system assumes will occupy shared accommodation. Against a
backdrop at a national level of pressure to reduce housing benefit costs, this assumption would not appear
to be robust. Arguably there is no realistic prospect that changes will occur which will allow these single
people to access self-contained dwellings. As such the validity of this assumption is highly questionable.’
1.29 This clearly has two potential impacts. Firstly, it will increase the total number of dwellings required and
second it will affect the size and tenure mix. The Greater London SHMA 2017 assumes that the households
will need a greater number of 1-bedroom affordable dwellings, but in practice the needs of these households
are likely to be meet in larger shared properties, often in the private sector.
1.30 The unintended consequence of having a 1 bed need that vastly exceeds the effective need, is that
• there will be less funding available for affordable 2+ bed accommodation, for which there is the highest effective demand,
• this in turn will lead to even greater overcrowding in the low cost rented sector,
• and a surplus of 1 bed properties that we cannot let.
Assessing Overall Housing Need: Analysing the Impact of PPG Changes Proposed by CLG
1.31 On September 14th 2017, Department of Communities and Local Government (CLG) published a consultation
on potential revisions to the NPPF, including a standardised methodology for calculating objectively assessed
housing needs (OAN). This contained a number of key proposals:
» The starting point for calculating the OAN for any area should be the most up to date
household projections published by CLG;
» While, deviation from this starting point can be considered, the consultation proposals
note that; There should be very limited grounds for adopting an alternative method
which results in a lower need; and
» The household projections published by CLG should be uplifted by a fixed affordability
relationship based upon the ratio of house prices to earnings. The maximum uplift for a
local authority area will be 40% above its CLG household projections or current Local
plan housing target.
1.32 CLG produced a spreadsheet of indicative housing needs figures which covers every local authority area in
England, with the figure for West London as a whole being 14,098 dwellings per annum and for Greater
London 72,408 dwellings per annum.
Opinion Research Services | West London – Strategic Housing Market Assessment October 2018
21
1.33 The NPPF 2018 confirms that planning authorities should use the standard methodology for plans to be
submitted after January 24th 2019.
1.34 Since the publication of the figures in September 2017 a range of new data has been released which allows
for the model to be updated. This includes:
• New affordability data released in March 2018;
• New 2016 based sub-national population projections (SNPP) released in May 2018;
• New 2016 based household projections were released by the Office for National Statistics in September 2018; and
• Changes in Local Plan status including Hammersmith and Fulham adopting their Local Plan and Hillingdon’s Local Plan becoming more that 5 years old and therefore no longer having a capped OAN figure.
1.35 The figure for West London as of September 2018 is 8,993 dwellings per annum. The figures are only
produced for local authority areas, so no separate figures are included for Old Oak and Park Royal DC. We
will return to these figures in Chapter 4 of this report where they place other estimates of housing need in
context.
Figure 9: Estimated Annual OAN Using CLG Standardised Methodology. (Source: CLG and ORS Estimates)
Local Authority
Annual OAN
CLG Published Estimate
September 2017
Updated Estimate based upon March 2018
Affordability and 2016 based SNPP
Updated Estimate based upon March 2018
Affordability, and 2016 based ONS
household projections
Barnet 4,126 3,439 2,683
Brent 2,855 1,914 1,376
Ealing 2,432 1,468 992
Hammersmith & Fulham 980 629 375
Harrow 1,959 1,229 734
Hillingdon 595 2,196 1,682
Hounslow 1,151 1,151 1,151
West London Total 14,098 12,026 8,993
Greater London Total 72,408 62,826 49,535
1.36 However, we would also note that the NPPF 2018 came with the following statement:
» Your attention is drawn to the following wording within the government response document to
the revised National Planning Policy Framework:
» “A number of responses to this question provided comment on the proposed local housing need
method. The government is aware that lower than previously forecast population projections
have an impact on the outputs associated with the method. Specifically, it is noted that the
revised projections are likely to result in the minimum need numbers generated by the method
being subject to a significant reduction, once the relevant household projection figures are
released in September 2018.
Opinion Research Services | West London – Strategic Housing Market Assessment October 2018
22
» In the housing white paper the government was clear that reforms set out (which included the
introduction of a standard method for assessing housing need) should lead to more homes
being built. In order to ensure that the outputs associated with the method are consistent with
this, we will consider adjusting the method after the household projections are released in
September 2018. We will consult on the specific details of any change at that time.
» It should be noted that the intention is to consider adjusting the method to ensure that the
starting point in the plan-making process is consistent in aggregate with the proposals in
Planning for the right homes in the right places consultation and continues to be consistent with
ensuring that 300,000 homes are built per year by the mid 2020s.”
1.37 Therefore, while the NPPF 2018 places a clear duty upon local authorities to use the standard methodology
housing assessment number for their area unless they have good reasons not to do so, it is also clear that
MHCLG are seeking to revise those figures before it is even formally introduced. At this stage there is no
indication of how the methodology will be changed by MHCLG.
Developing the Strategic Housing Market Assessment
1.38 The objective of the SHMA study was to give West London an objectively assessed and evidence-based
assessment of development needs for housing (both market and affordable) and to ensure that this was
compliant with the requirements of the National Planning Policy Framework and Guidance. As noted earlier
this has been undertaken at the level of the boroughs which comprise the West London area to ensure a
sufficiently large demographic base and that the strategic role of each was properly considered.
1.39 The methodology used was based on the analysis and modelling of secondary data. Overall, the methodology
sought to:
» Consider the housing market area
» Establish the need for housing (both market and affordable)
» Take market signals into account.
1.40 The first key objective of this SHMA was to identify and define the functional housing market area(s) (HMA)
which included OPDC.
1.41 The second key objective of this SHMA was to establish the collective OAN for housing (both market and
affordable) in the London boroughs of Barnet, Brent, Ealing, Hammersmith & Fulham, Harrow, Hillingdon
and Hounslow (presented in detail in their respective individual SHMAs) ensuring that this was fully
compliant with the requirements of the NPPF and PPG and mindful of good practice. The OAN for housing
will help inform the planning policies for the period 2016-41.
1.42 A third key objective was to provide a ‘sense check’ on assumptions and methodology of the 2017 London
SHMA.’
1.43 The SHMA methodology was based on secondary data, and the SHMA sought to:
» Provide evidence of the need and demand for housing based on demographic projections;
» Consider market signals about the balance between demand for and supply of dwellings;
» Establish the Objectively Assessed Need for housing over the period 2017-37;
» Identify the appropriate balance between market and affordable housing; and
Opinion Research Services | West London – Strategic Housing Market Assessment October 2018
23
» Address the needs for all types of housing, including the private rented sector, people wishing
to build their own home, family housing, housing for older people and households with
specific needs.
1.44 This report considers the key outputs from the SHMA – namely establishing the Housing Market Area and
establishing the Full Objectively Assessed Need for housing in Barnet, Brent, Ealing, Hammersmith & Fulham,
Harrow, Hillingdon and Hounslow (including the overall balance between market and affordable housing)
over the 25-year period 2016-41 in line with the NPPF 2012. The individual borough SHMAs for Hounslow
and Hillingdon identify OANs for different periods, but for purposes of aggregation in this document those
results have been recalculated for 2016-41, with no changes to the underlying methodology.
1.45 It is important to recognise that the information from the SHMA should not be considered in isolation, but
forms part of a wider evidence base to inform the development of housing and planning policies.
Opinion Research Services | West London – Strategic Housing Market Assessment October 2018
24
2. Defining the Housing Market Area An evidence base to identify functional housing markets
Functional Housing Market Areas
2.1 The definition of a functional housing market area is well-established as being “...the geographical area in
which a substantial majority of the employed population both live and work and where those moving house
without changing employment choose to stay” (Maclennan et al, 1998)3 .
Planning Practice Guidance
2.2 As noted in the introduction, the NPPF 2018 includes no reference to housing market areas, but Planning
Practice Guidance (PPG)4 on the Assessment of Housing and Economic Development Needs (March 2014)
reflects this existing concept, confirming that the underlying principles for defining housing markets are
concerned with the functional areas in which people both live and work:
What is a housing market area?
A housing market area is a geographical area defined by household demand and preferences for all
types of housing, reflecting the key functional linkages between places where people live and work.
It might be the case the housing market areas overlap.
The extent of the housing market areas identified will vary, and many will in practice cut across
various local planning authority administrative boundaries. Local planning authorities should work
with all the other constituent authorities under the duty to cooperate.
Planning Practice Guidance 2014, paragraph 10
2.3 Therefore, PPG requires an understanding of the housing market area and says this can be defined using
three different sources of information:
» House prices and rates of change in house prices
» Household migration and search patterns
» Contextual data (e.g. travel to work area boundaries, retail and school catchment areas)
2.4 These sources are consistent with those identified in the CLG advice note ‘Identifying sub-regional housing
market areas’ published in 20075.
3 Local Housing Systems Analysis: Best Practice Guide. Edinburgh: Scottish Homes 4 http://planningguidance.planningportal.gov.uk/blog/guidance/housing-and-economic-development-needs-assessments/ 5 Identifying sub-regional housing market areas (CLG, March 2007); paragraph 1.6
Opinion Research Services | West London – Strategic Housing Market Assessment October 2018
25
Geography of Housing Market Areas (NHPAU/CURDS)
2.5 CLG also published a report on the ‘Geography of Housing Market Areas’ in 20106 which was commissioned
by the former National Housing and Planning Advice Unit (NHPAU) and undertaken by the Centre for Urban
and Regional Development Studies (CURDS) at Newcastle University. This study explored a range of potential
methods for calculating housing market areas for England and applied these methods to the whole country
to show the range of housing markets which would be generated. The report also proposed three
overlapping tiers of geography for housing markets:
» Tier 1: framework housing market areas defined by long distance commuting flows and the
long-term spatial framework with which housing markets operate;
» Tier 2: local housing market areas defined by migration patterns that determine the limits of
short-term spatial house price arbitrage;
» Tier 3: sub-markets defined in terms of neighbourhoods or house type price premiums.
2.6 The report recognised that migration patterns and commuting flows were the most relevant information
sources for identifying the upper tier housing market areas, with house prices only becoming relevant at a
more local level and when establishing housing sub-markets. The report also outlined that no one single
approach (nor one single data source) will provide a definitive solution to identifying local housing markets;
but by using a range of available data, judgements on appropriate geography can be made.
2.7 Advice recently published in the PAS OAN technical advice note also suggests that the main indicators will
be migration and commuting (paragraph 5.4).
“The PPG provides a long list of possible indicators, comprising house prices, migration and
search patterns and contextual data including travel-to-work areas, retail and school
catchments. In practice, the main indicators used are migration and commuting. With regard
to migration, the PPG explains that areas that form an HMA will be reasonably self-
contained, so that…
A relatively high proportion of household moves (typically 70%) are contained [within the
area]. This excludes long-distance moves (e.g. those due to a change of lifestyle or
retirement, reflecting the fact that most people move relatively short distances due to
connections to families, friends, jobs and schools).”
2.8 The PAS OAN technical advice note also suggests that analysis reported in the CLG report “Geography of
Housing Market Areas” (CLG, November 2010) should provide a starting point for drawing HMAs (Figure 10).
It is apparent that this study identifies a single housing market across London and beyond. Consequently,
this is not useful in defining functional HMAs for the boroughs.
2.9 Nevertheless, it is important to note that whilst the ‘starting point’ CLG study (2010) was commissioned by
the former National Housing and Planning Advice Unit (NHPAU) and undertaken by the Centre for Urban and
Regional Development Studies (CURDS) at Newcastle University, the analysis of migration and commuting
was based on data from the 2001 Census.
6 Geography of Housing Market Areas (CLG, November 2010); paragraph 1.6

Opinion Research Services | West London – Strategic Housing Market Assessment October 2018
26
Figure 10: NHPAU Study - PAS OAN technical advice note 'Starting Point
Travel to Work Areas
2.10 Housing market areas reflect “the key functional linkages between places where people live and work” and
therefore it is important to consider travel to work patterns within the identified area alongside the
migration patterns:
Travel to work areas can provide information about commuting flows and the spatial structure of
the labour market, which will influence household price and location. They can also provide
information about the areas within which people move without changing other aspects of their lives
(e.g. work or service use).
Planning Practice Guidance 2014, paragraph 11
2.11 One of the PPG suggested data sources is the Office for National Statistics travel to work areas (TTWAs).
Figure 11 shows the latest ONS TTWAs. These were published in 2015 and they are based on the origin-
destination data from the 2011 Census.
2.12 London is represented by a single TTWA. Consequently, TTWAs are not useful in defining functional HMAs
for London boroughs.

Opinion Research Services | West London – Strategic Housing Market Assessment October 2018
27
Figure 11: ONS Travel To Work Areas (Source: ONS 2015)
Housing Markets in London
2.13 As noted above, Housing Market Areas reflect “the key functional linkages between places where people live
and work” and therefore it is important to consider travel to work patterns within the identified area
alongside the migration patterns.
2.14 The identification of housing markets in London is not a new area of study. As previously noted, the ONS
identified London as a single Travel to Work Area and the CURDS analysis identified a single housing market
area for London that extended beyond the city’s administrative boundary.
2.15 The Greater London Authority has published Strategic Housing Market Assessments in 2008, 2014 and 2017
which all treat London as a single housing market area. The 2014 Greater London SHMA notes at Table 5;
Opinion Research Services | West London – Strategic Housing Market Assessment October 2018
28
“While the London housing market is accepted to cross the regional boundary, practical
considerations including data availability and the precise identification of the market area
(see chapter 2) favour limiting the study to the Greater London area, in line with previous
such studies and with common practice both within London and in neighbouring areas”.
2.16 The identification of a single London wide housing market has been further supported by a recent High Court
judgement. Nine London Boroughs sought to challenge the Mayor of London’s policy in relation to
Affordable Rent in March 2014. The claimants case was summarised in paragraph 9 of the judgement in
that:
“The Claimants submit that the Defendant has failed to have proper regard to the
requirements of the NPPF. Indeed, he has mis-interpreted the NPPF when he claims that rent
caps would undermine the deliverability of affordable housing, contrary to the objective of
the NPPF. He was also mistaken in treating London as a single housing market. Each
Borough had to assess its own needs, and develop its own targets and policies to meet
them.”
2.17 In relation to the issue of a single housing market in London the judgement concluded at paragraphs 39-41
that:
“Turning to the next issue, I accept the Defendant’s submission that he was entitled to
conclude, in the exercise of his planning judgment that London represented a single housing
market.
The term “housing market area” appears in the NPPF, but is not defined. That a “housing
market area” within the meaning of the NPPF does not necessarily equate to LPA
administrative boundaries is plain from paragraph 159:
“159. Local planning authorities should have a clear understanding of housing needs
in their area. They should: prepare a Strategic Housing Market Assessment to assess
their full housing needs, working with neighbouring authorities where housing
market areas cross administrative boundaries. [...]”
The view that London should be regarded as a single housing market is not new. As the
reasons supporting MD1268 noted at paragraph 7.22:
“[...] since at least the establishment of the GLA, London has always been regarded
as a single market for strategic planning purposes. Both the London Plan and the
Mayor’s Housing Strategy are based on this accepted approach.”
2.18 However, paragraph 43 of the judgement states:
The Draft Replacement London Plan, Report of Panel, March 2011 stated at 3.28:
“As it was not disputed that London is a single Strategic Housing Market Area with
complex sub-markets that spread across Borough boundaries and has constrained
land supply the use of which has to be optimised, we agree with the Mayor that it is
not only appropriate but necessary to include Borough provision targets.”
Opinion Research Services | West London – Strategic Housing Market Assessment October 2018
29
2.19 The view that London contains many housing market areas within it is further supported by the 2014 Greater
London SHMA which notes at paragraph 1.13:
“It is important to note that this SHMA, like the 2004 HRS and the 2008 SHMA before it,
looks at housing requirements at the regional London level only, and does not provide any
estimates of requirements at the local level. London boroughs remain responsible for
assessing their own requirements, within the policy context set by the NPPF and the London
Plan. Given the fact that housing market areas in London frequently extend across local
borough boundaries, many boroughs have chosen to work in partnership to assess housing
requirements on a sub-regional basis.”
2.20 Given this context, we can conclude that each planning authority in West London forms part of the Greater
London Housing Market Area (GLHMA); the GLHMA (a “Tier 1” HMA that is defined by commuting and
migration patterns) needs to ensure a balance of jobs and workers. The Greater London Authority has
prepared an SHMA for the GLHMA to inform the London Plan, and it is this study that must consider the
need to balance jobs and housing at the London-wide level.
2.21 In the light of the above, there is a need to consider how housing market area geography might be considered
at a level below London, in order to develop a pragmatic solution for practical planning purposes and the
local assessment of housing need. In this way, it allows for practical planning by small groups of boroughs,
working together, within the framework of an overarching GLHMA.
2.22 This SHMA, therefore, is based on a lower-tier HMA that will help the LPAs plan housing at a more local level.
In determining the number of homes needed at the planning authority level, the SHMA will need to be
consistent with the London Plan and the projected population/households will need to be consistent with
GLA figures. By doing so, this lower-tier HMA will, therefore, contribute to balancing jobs and workers across
the Greater London HMA, consistent with the London Plan. We would note that the outputs of this work
will not directly link to the GLA’s housing targets for the boroughs because those figures have been set on
assumed capacity that will be available on sites that come forward.
Migration Patterns
2.23 One of the ways to define a Housing Market Area is to consider an area “where most of those changing house
without changing employment choose to stay”. Unfortunately, no data is available that relates migration
with changes in employment circumstances, but given that most working people will live relatively close to
their job, it is reasonable to assume that those migrants moving longer distances will tend to also change
their place of work.
2.24 Figure 12 shows migration flows within London. This shows a complex pattern of moves from Central London
to outer London boroughs, with a clear movement northwards and westwards.
Opinion Research Services | West London – Strategic Housing Market Assessment October 2018
30
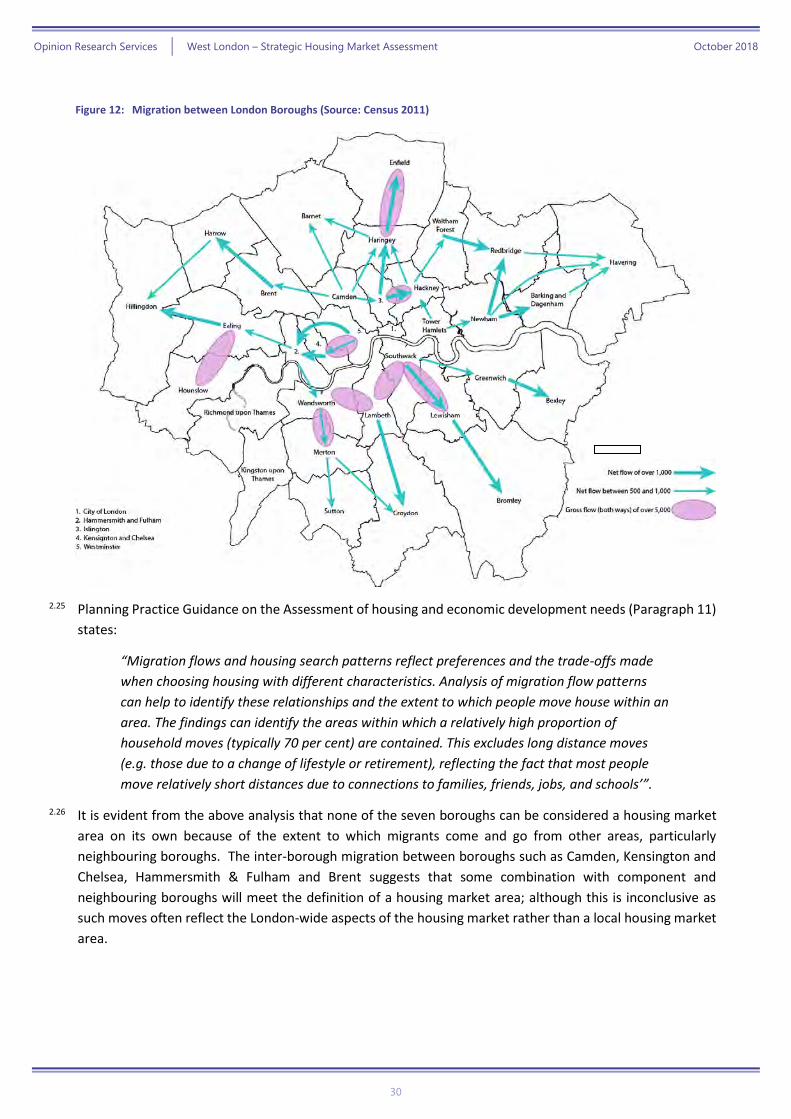
Figure 12: Migration between London Boroughs (Source: Census 2011)
2.25 Planning Practice Guidance on the Assessment of housing and economic development needs (Paragraph 11)
states:
“Migration flows and housing search patterns reflect preferences and the trade-offs made
when choosing housing with different characteristics. Analysis of migration flow patterns
can help to identify these relationships and the extent to which people move house within an
area. The findings can identify the areas within which a relatively high proportion of
household moves (typically 70 per cent) are contained. This excludes long distance moves
(e.g. those due to a change of lifestyle or retirement), reflecting the fact that most people
move relatively short distances due to connections to families, friends, jobs, and schools’”.
2.26 It is evident from the above analysis that none of the seven boroughs can be considered a housing market
area on its own because of the extent to which migrants come and go from other areas, particularly
neighbouring boroughs. The inter-borough migration between boroughs such as Camden, Kensington and
Chelsea, Hammersmith & Fulham and Brent suggests that some combination with component and
neighbouring boroughs will meet the definition of a housing market area; although this is inconclusive as
such moves often reflect the London-wide aspects of the housing market rather than a local housing market
area.
Opinion Research Services | West London – Strategic Housing Market Assessment October 2018
31
House Prices and Valuation Office Agency Broad Rental Market Areas
2.27 The Broad Rental Market Area (BRMA) is the geographical area used by the Valuation Office Agency (VOA)
to determine the Local Housing Allowance (LHA), the allowance paid to Housing Benefit applicants in the
private rented sector. The BRMA area takes into account local house prices and rents; and is based on where
a person could reasonably be expected to live, taking into account access to facilities and services for the
purposes of health, education, recreation, personal banking and shopping. When determining BRMAs the
Rent Officer takes account of the distance of travel, by public and private transport, to and from these
facilities and services. The boundaries of a BRMA do not have to match the boundaries of a local authority
and BRMAs will often fall across more than one local authority area.
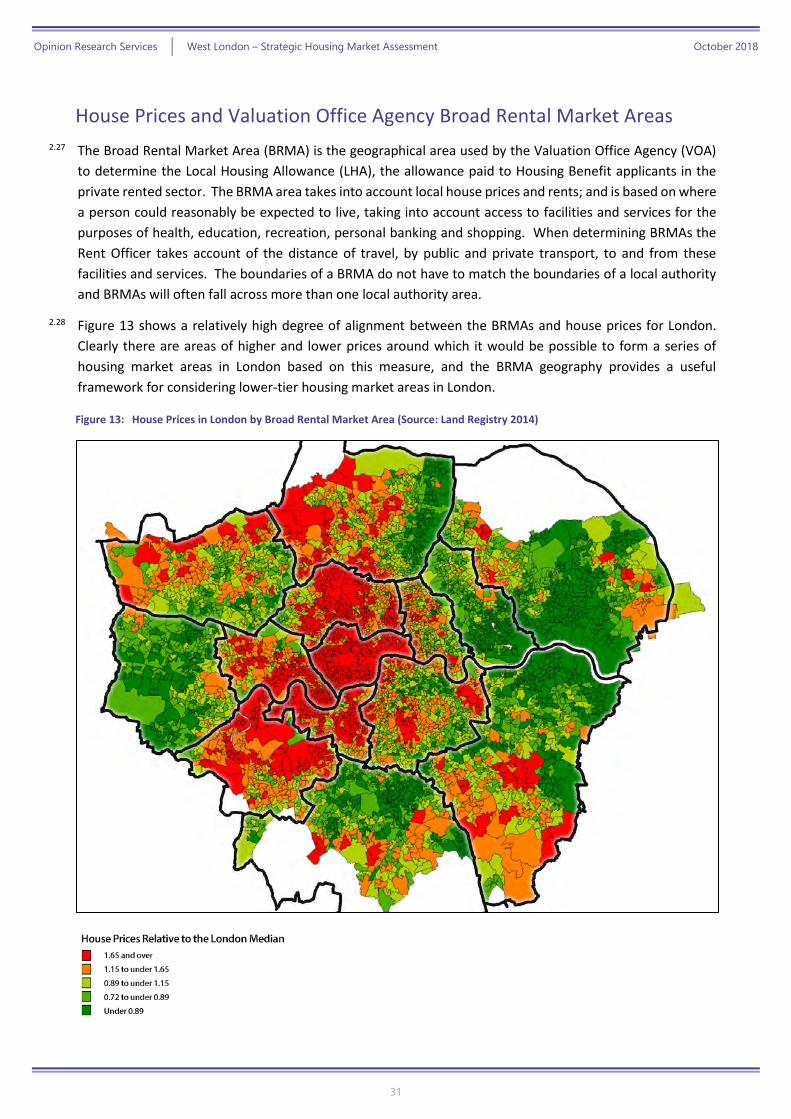
2.28 Figure 13 shows a relatively high degree of alignment between the BRMAs and house prices for London.
Clearly there are areas of higher and lower prices around which it would be possible to form a series of
housing market areas in London based on this measure, and the BRMA geography provides a useful
framework for considering lower-tier housing market areas in London.
Figure 13: House Prices in London by Broad Rental Market Area (Source: Land Registry 2014)

Opinion Research Services | West London – Strategic Housing Market Assessment October 2018
32
2.29 Figure 14 shows how the boroughs of West London are split across BRMAs. Clearly there is a large overlap
between borough and BRMA boundaries and in total the 7 boroughs and the OPDC sit within 5 BRMAs.
Figure 14: West London Broad Rental Market Areas including percentage of each borough contained within BRMA
2.30 For planning purposes and the operation of the NPPF it is sensible for housing market areas to be relatively
small to allow local authorities to work together as cohesive units. Therefore, ORS considers that the national
Government-defined BRMAs based on house prices and rents form a sensible basis for deriving housing
market areas in London where migration and travel to work patterns do not identify any distinct sub-
markets.
2.31 We would stress that there are many ways of analysing housing sub-markets. The SHMA conclusion does
not prevent other options being explored and in practical terms the identification of HMAs in London has
little operational purpose due to the role of the GLA in wider strategic planning for the whole of London.
Opinion Research Services | West London – Strategic Housing Market Assessment October 2018
33
Administrative Boundaries and Housing Market Areas
2.32 The NPPF recognises that housing market areas may cross administrative boundaries, and PPG emphasises
that housing market areas reflect functional linkages between places where people live and work. The
previous 2007 CLG advice note7 also established that functional housing market areas should not be
constrained by administrative boundaries, nevertheless it suggested the need for a “best fit” approximation
to local authority areas for developing evidence and policy (paragraph 9):
“The extent of sub-regional functional housing market areas identified will vary and many
will in practice cut across local authority administrative boundaries. For these reasons,
regions and local authorities will want to consider, for the purposes of developing evidence
bases and policy, using a pragmatic approach that groups local authority administrative
areas together as an approximation for functional sub-regional housing market areas.”
2.33 This “best fit” approximation has also been commended by the PAS OAN technical advice note, which
suggests (paragraph 5.21):
“It is best if HMAs, as defined for the purpose of needs assessments, do not straddle local
authority boundaries. For areas smaller than local authorities data availability is poor and
analysis is becomes impossibly complex. There may also be ‘cliff edge’ effects at the HMA
boundary, for example development allowed on one side of a road but not the other.”
2.34 This means there is a need for balance in methodological approach:
2.35 On the one hand, it is important that the process of analysis and identification of the functional housing
market areas should not be constrained by local authority boundaries. This allows the full extent of each
functional housing market to be properly understood and ensures that all of the constituent local planning
authorities can work together under the duty to cooperate, as set out in Guidance (PPG, paragraph 10).
2.36 On the other hand, and as suggested by the recent PAS OAN technical advice note (and the previous CLG
advice note), it is also necessary to identify a “best fit” for each functional housing market area that is based
on local planning authority boundaries. This “best fit” area provides an appropriate basis for analysing
evidence and drafting policy; and would normally represent the group of authorities that would take
responsibility for undertaking a Strategic Housing Market Assessment (SHMA).
2.37 In summary, therefore, the approach to defining housing market areas needs to balance robust analysis with
pragmatic administrative requirements. Therefore, whilst we have established the most up-to-date
functional housing markets for OPDC, it is now necessary to consider the most appropriate working
arrangements for establishing the evidence base that the NPPF requires.
7 Identifying sub-regional housing market areas (CLG, March 2007)
Opinion Research Services | West London – Strategic Housing Market Assessment October 2018
34
Conclusions
2.38 On the basis of the evidence, we would conclude that:
» Greater London can be considered as a single large housing market area which contains
within it many smaller overlapping housing market areas.
» Migration and travel to work flows do not identify any distinct housing market areas in
London.
» House price represents a means of identifying separate housing market areas in London. The
VOA has worked with house price and rent nationally to identify BRMAs which determined
LHA levels.
» BRMAs represent the most practical and pragmatic approach to identifying housing market
areas in London. The 13 BRMAs in London will allow small groups of London boroughs to plan
together.
» 5 BRMAs cover the West London sub-region, but there is no inconsistency between the HMAs
and the West London area because the BRMAs build to a larger area.
» The HMA analysis should not be seen as prescriptive on other authorities who may wish to
identify their housing market areas by other means.
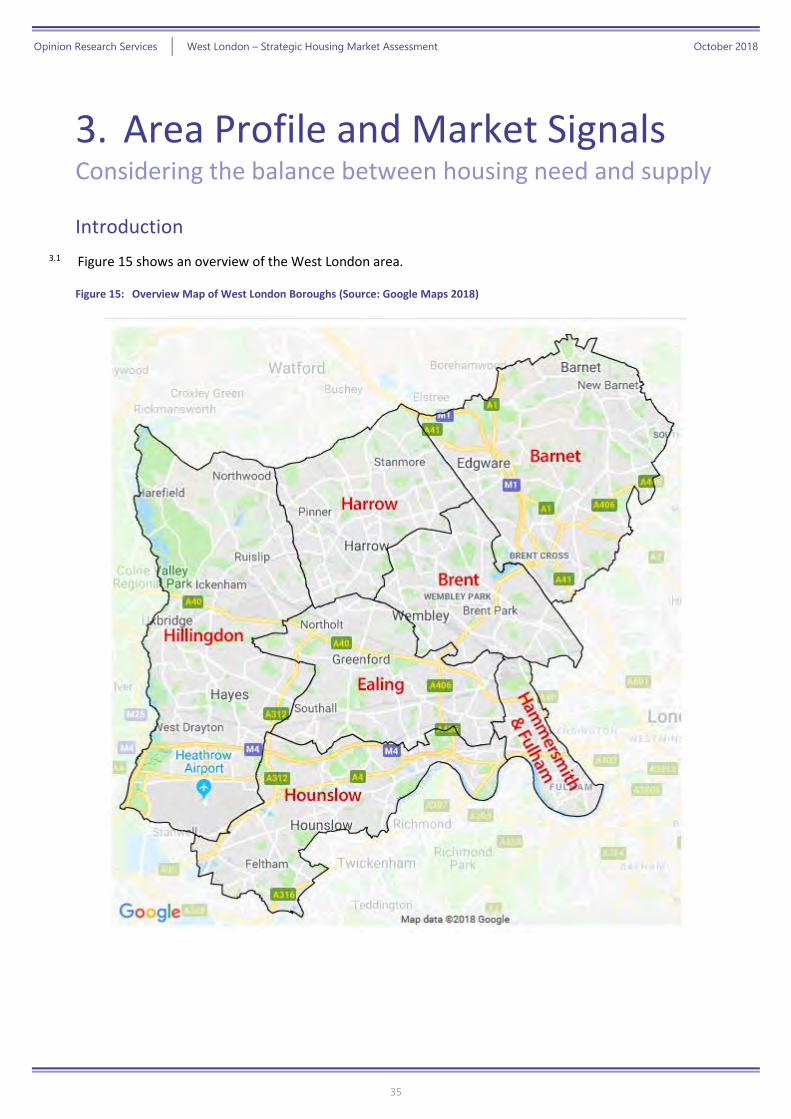
Opinion Research Services | West London – Strategic Housing Market Assessment October 2018
35
3. Area Profile and Market Signals Considering the balance between housing need and supply
Introduction
3.1 Figure 15 shows an overview of the West London area.
Figure 15: Overview Map of West London Boroughs (Source: Google Maps 2018)
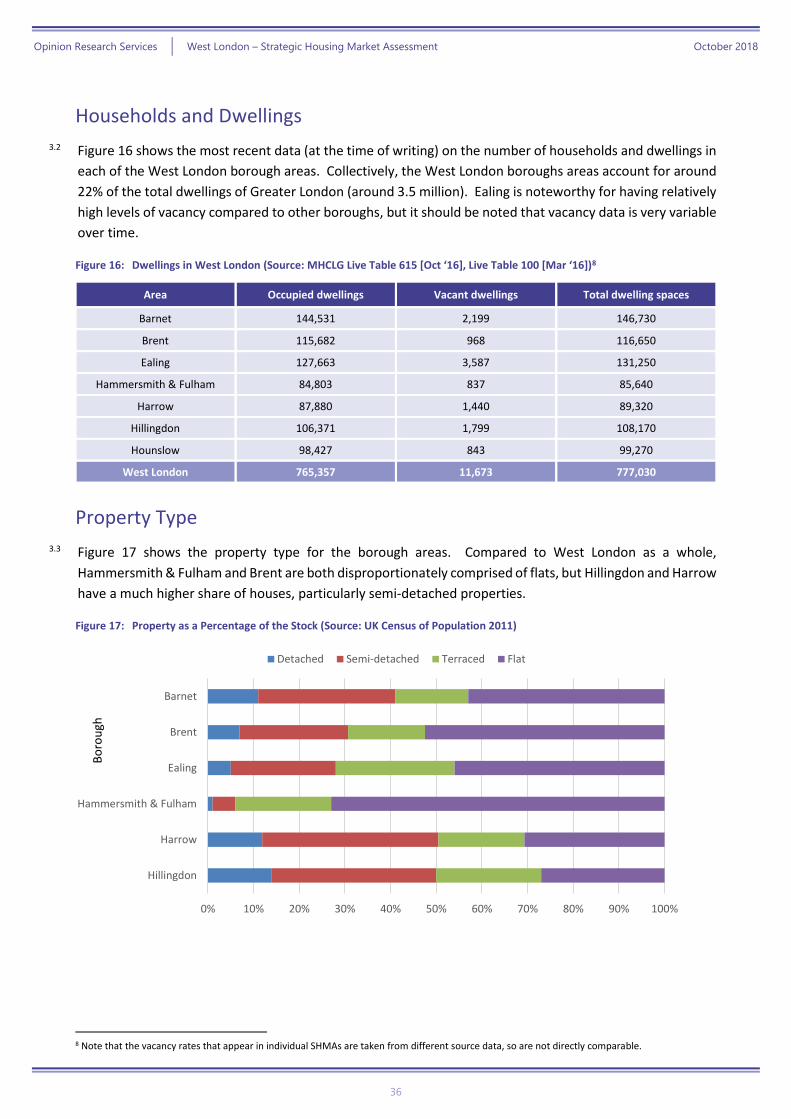
Opinion Research Services | West London – Strategic Housing Market Assessment October 2018
36
Households and Dwellings
3.2 Figure 16 shows the most recent data (at the time of writing) on the number of households and dwellings in
each of the West London borough areas. Collectively, the West London boroughs areas account for around
22% of the total dwellings of Greater London (around 3.5 million). Ealing is noteworthy for having relatively
high levels of vacancy compared to other boroughs, but it should be noted that vacancy data is very variable
over time.
Figure 16: Dwellings in West London (Source: MHCLG Live Table 615 [Oct ‘16], Live Table 100 [Mar ‘16])8
Area Occupied dwellings Vacant dwellings Total dwelling spaces
Barnet 144,531 2,199 146,730
Brent 115,682 968 116,650
Ealing 127,663 3,587 131,250
Hammersmith & Fulham 84,803 837 85,640
Harrow 87,880 1,440 89,320
Hillingdon 106,371 1,799 108,170
Hounslow 98,427 843 99,270
West London 765,357 11,673 777,030
Property Type
3.3 Figure 17 shows the property type for the borough areas. Compared to West London as a whole,
Hammersmith & Fulham and Brent are both disproportionately comprised of flats, but Hillingdon and Harrow
have a much higher share of houses, particularly semi-detached properties.
Figure 17: Property as a Percentage of the Stock (Source: UK Census of Population 2011)
8 Note that the vacancy rates that appear in individual SHMAs are taken from different source data, so are not directly comparable.
0% 10% 20% 30% 40% 50% 60% 70% 80% 90% 100%
Hillingdon
Harrow
Hammersmith & Fulham
Ealing
Brent
Barnet
Bo
rou
gh
Detached Semi-detached Terraced Flat
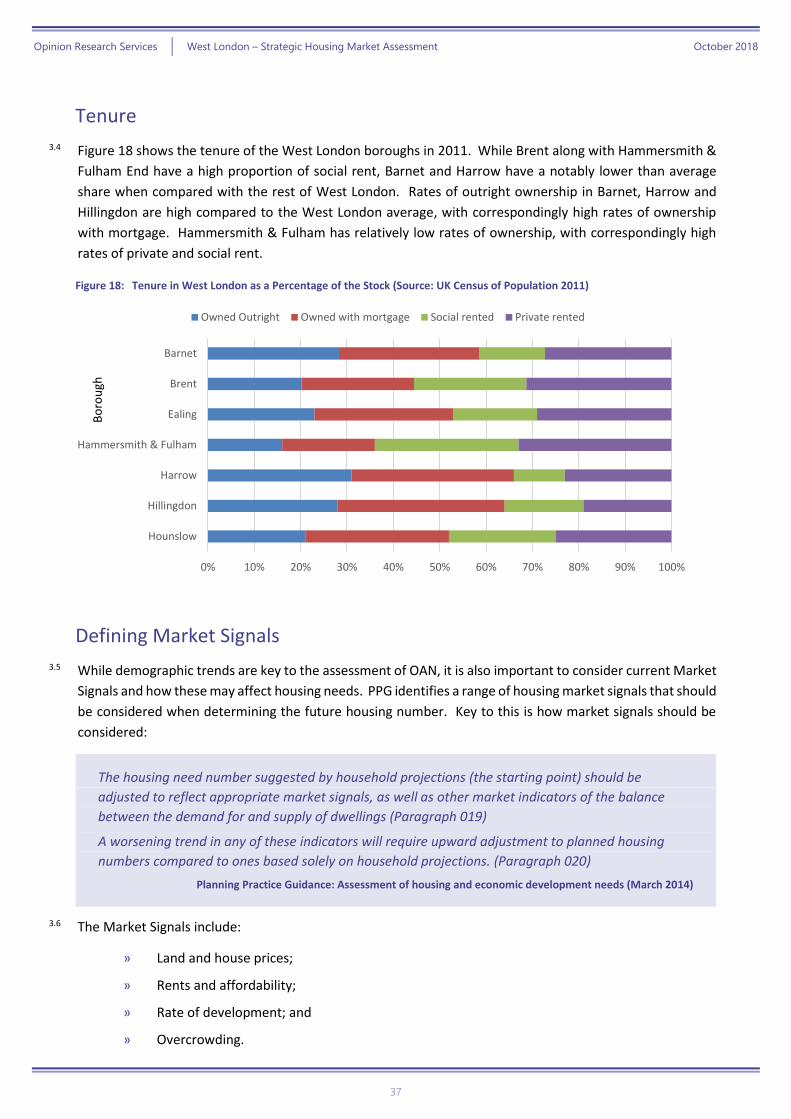
Opinion Research Services | West London – Strategic Housing Market Assessment October 2018
37
Tenure
3.4 Figure 18 shows the tenure of the West London boroughs in 2011. While Brent along with Hammersmith &
Fulham End have a high proportion of social rent, Barnet and Harrow have a notably lower than average
share when compared with the rest of West London. Rates of outright ownership in Barnet, Harrow and
Hillingdon are high compared to the West London average, with correspondingly high rates of ownership
with mortgage. Hammersmith & Fulham has relatively low rates of ownership, with correspondingly high
rates of private and social rent.
Figure 18: Tenure in West London as a Percentage of the Stock (Source: UK Census of Population 2011)
Defining Market Signals
3.5 While demographic trends are key to the assessment of OAN, it is also important to consider current Market
Signals and how these may affect housing needs. PPG identifies a range of housing market signals that should
be considered when determining the future housing number. Key to this is how market signals should be
considered:
The housing need number suggested by household projections (the starting point) should be
adjusted to reflect appropriate market signals, as well as other market indicators of the balance
between the demand for and supply of dwellings (Paragraph 019)
A worsening trend in any of these indicators will require upward adjustment to planned housing
numbers compared to ones based solely on household projections. (Paragraph 020)
Planning Practice Guidance: Assessment of housing and economic development needs (March 2014)
3.6 The Market Signals include:
» Land and house prices;
» Rents and affordability;
» Rate of development; and
» Overcrowding.
0% 10% 20% 30% 40% 50% 60% 70% 80% 90% 100%
Hounslow
Hillingdon
Harrow
Hammersmith & Fulham
Ealing
Brent
Barnet
Bo
rou
gh
Owned Outright Owned with mortgage Social rented Private rented
Opinion Research Services | West London – Strategic Housing Market Assessment October 2018
38
3.7 Furthermore, there are other issues that should be considered, for example the macro-economic climate
(PAS OAN technical advice note, para 6.13). Further, there are wider market trends and drivers to consider.
A full range of market signals are considered here and their implications especially where these may indicate
undersupply relative to demand and the need to deviate from household projections.
3.8 PPG and the PAS OAN technical advice note emphasise the importance of considering indicators in the
context of longer-term trends and looking at rates of change as well as absolute levels – for example, house
prices in the housing market may be higher or lower than the national average, however the more important
consideration is whether they are becoming more (or less) expensive at a rate that differs from the national
rates or rates in similar areas.
Appropriate comparisons of indicators should be made. This includes comparison with
longer term trends (both in absolute levels and rates of change) in the housing market area;
similar demographic and economic areas; and nationally. (Paragraph 020)
Planning Practice Guidance: Assessment of housing and economic development needs (March 2014)
Summary of Market Signals
3.9 There is no single formula that can be used to consolidate the implications of this information; and
furthermore, the housing market signals will have been predominantly influenced by relatively recent
housing market trends. Nevertheless, the indicators provide a context for considering the balance between
housing need and supply.
3.10 In terms of headline outputs, the market signals for the West London boroughs compared to other London
boroughs are shown below in Figure 19 where indicators marked green are ‘better’ than for Greater London
and indicators marked red are ‘worse’ than for Greater London:
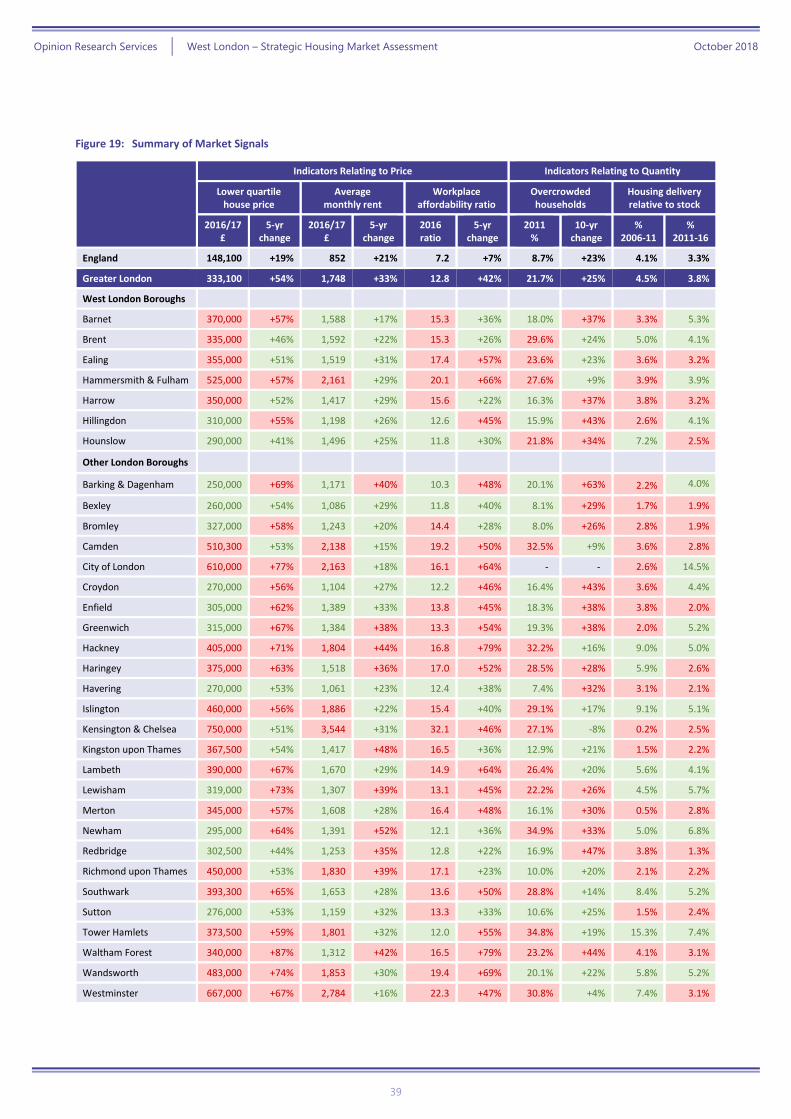
Opinion Research Services | West London – Strategic Housing Market Assessment October 2018
39
Figure 19: Summary of Market Signals
Indicators Relating to Price Indicators Relating to Quantity
Lower quartile house price
Average monthly rent
Workplace affordability ratio
Overcrowded households
Housing delivery relative to stock
2016/17 £
5-yr change
2016/17 £
5-yr change
2016 ratio
5-yr change
2011 %
10-yr change
% 2006-11
% 2011-16
England 148,100 +19% 852 +21% 7.2 +7% 8.7% +23% 4.1% 3.3%
Greater London 333,100 +54% 1,748 +33% 12.8 +42% 21.7% +25% 4.5% 3.8%
West London Boroughs
Barnet 370,000 +57% 1,588 +17% 15.3 +36% 18.0% +37% 3.3% 5.3%
Brent 335,000 +46% 1,592 +22% 15.3 +26% 29.6% +24% 5.0% 4.1%
Ealing 355,000 +51% 1,519 +31% 17.4 +57% 23.6% +23% 3.6% 3.2%
Hammersmith & Fulham 525,000 +57% 2,161 +29% 20.1 +66% 27.6% +9% 3.9% 3.9%
Harrow 350,000 +52% 1,417 +29% 15.6 +22% 16.3% +37% 3.8% 3.2%
Hillingdon 310,000 +55% 1,198 +26% 12.6 +45% 15.9% +43% 2.6% 4.1%
Hounslow 290,000 +41% 1,496 +25% 11.8 +30% 21.8% +34% 7.2% 2.5%
Other London Boroughs
Barking & Dagenham 250,000 +69% 1,171 +40% 10.3 +48% 20.1% +63% 2.2% 4.0%
Bexley 260,000 +54% 1,086 +29% 11.8 +40% 8.1% +29% 1.7% 1.9%
Bromley 327,000 +58% 1,243 +20% 14.4 +28% 8.0% +26% 2.8% 1.9%
Camden 510,300 +53% 2,138 +15% 19.2 +50% 32.5% +9% 3.6% 2.8%
City of London 610,000 +77% 2,163 +18% 16.1 +64% - - 2.6% 14.5%
Croydon 270,000 +56% 1,104 +27% 12.2 +46% 16.4% +43% 3.6% 4.4%
Enfield 305,000 +62% 1,389 +33% 13.8 +45% 18.3% +38% 3.8% 2.0%
Greenwich 315,000 +67% 1,384 +38% 13.3 +54% 19.3% +38% 2.0% 5.2%
Hackney 405,000 +71% 1,804 +44% 16.8 +79% 32.2% +16% 9.0% 5.0%
Haringey 375,000 +63% 1,518 +36% 17.0 +52% 28.5% +28% 5.9% 2.6%
Havering 270,000 +53% 1,061 +23% 12.4 +38% 7.4% +32% 3.1% 2.1%
Islington 460,000 +56% 1,886 +22% 15.4 +40% 29.1% +17% 9.1% 5.1%
Kensington & Chelsea 750,000 +51% 3,544 +31% 32.1 +46% 27.1% -8% 0.2% 2.5%
Kingston upon Thames 367,500 +54% 1,417 +48% 16.5 +36% 12.9% +21% 1.5% 2.2%
Lambeth 390,000 +67% 1,670 +29% 14.9 +64% 26.4% +20% 5.6% 4.1%
Lewisham 319,000 +73% 1,307 +39% 13.1 +45% 22.2% +26% 4.5% 5.7%
Merton 345,000 +57% 1,608 +28% 16.4 +48% 16.1% +30% 0.5% 2.8%
Newham 295,000 +64% 1,391 +52% 12.1 +36% 34.9% +33% 5.0% 6.8%
Redbridge 302,500 +44% 1,253 +35% 12.8 +22% 16.9% +47% 3.8% 1.3%
Richmond upon Thames 450,000 +53% 1,830 +39% 17.1 +23% 10.0% +20% 2.1% 2.2%
Southwark 393,300 +65% 1,653 +28% 13.6 +50% 28.8% +14% 8.4% 5.2%
Sutton 276,000 +53% 1,159 +32% 13.3 +33% 10.6% +25% 1.5% 2.4%
Tower Hamlets 373,500 +59% 1,801 +32% 12.0 +55% 34.8% +19% 15.3% 7.4%
Waltham Forest 340,000 +87% 1,312 +42% 16.5 +79% 23.2% +44% 4.1% 3.1%
Wandsworth 483,000 +74% 1,853 +30% 19.4 +69% 20.1% +22% 5.8% 5.2%
Westminster 667,000 +67% 2,784 +16% 22.3 +47% 30.8% +4% 7.4% 3.1%
Opinion Research Services | West London – Strategic Housing Market Assessment October 2018
40
3.11 The trends for West London show:
» Five of the seven boroughs have average lower quartile house prices than Greater London as a
whole;
» Average monthly rents have increased, though by less than for Greater London as a whole;
» Whilst the affordability ratio has increased over 5 years by less than the percentage increase for
Greater London in four out of the seven boroughs, affordability is worse than for Greater
London in five of the seven;
» The percentage of overcrowded households has increased by more than for Greater London in
four of the seven boroughs;
» Housing delivery relative to stock has increased by more than for Greater London in four of the
seven boroughs since 2011.
3.12 Based on house prices, affordability and overcrowding, it is appropriate to consider an uplift to the
household projection when establishing OAN in response to market signals. The indicators collectively show
that the circumstances in each borough are somewhat different; therefore, any uplift must be determined
at the borough level.
3.13 There is no definitive guidance on what level of uplift is appropriate. Nevertheless, the Inspector examining
the Eastleigh Local Plan judged 10% to be reasonable given the market signals identified for that HMA:
“It is very difficult to judge the appropriate scale of such an uplift … Exploration of an uplift
of, say, 10% would be compatible with the “modest” pressure of market signals recognised
in the SHMA itself.”
3.14 The PAS Objectively Assessed Need and Housing Targets Technical Advice Note (July 2015) supports this
approach as a method to estimate the uplift and says that “where the evidence suggests moderate under-
provision…the projected housing need might be increased by 10%”. The inspector at the Canterbury Local
Plan in August 2015 stated that a 20% uplift was ‘very substantial’9 and a 20% uplift was accepted at the
Examination on the London Borough of Camden Local Plan.
3.15 We would also note that impact of market signals adjustments for the Greater London SHMA was an increase
of 13.5%, but the GLA SHMA also included under-delivery from 2011-16 taking the final housing requirement
to around 25% above the baseline household projections.
9 https://www.canterbury.gov.uk/localplan
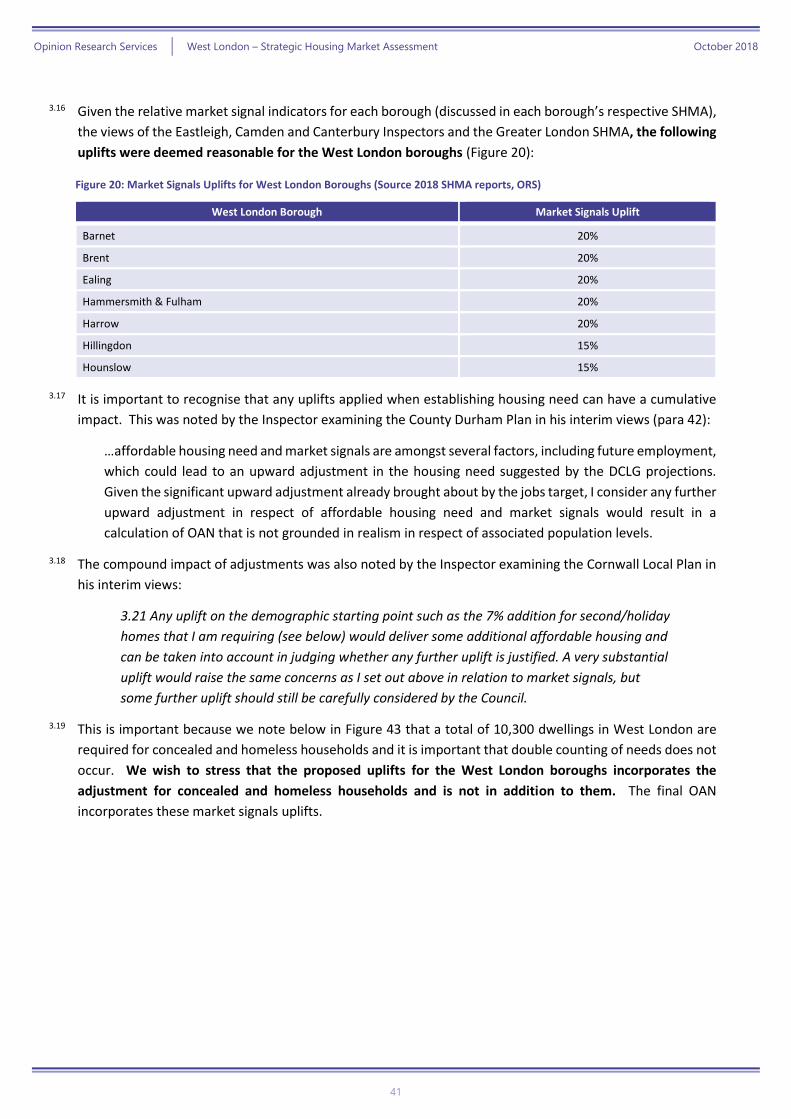
Opinion Research Services | West London – Strategic Housing Market Assessment October 2018
41
3.16 Given the relative market signal indicators for each borough (discussed in each borough’s respective SHMA),
the views of the Eastleigh, Camden and Canterbury Inspectors and the Greater London SHMA, the following
uplifts were deemed reasonable for the West London boroughs (Figure 20):
Figure 20: Market Signals Uplifts for West London Boroughs (Source 2018 SHMA reports, ORS)
West London Borough Market Signals Uplift
Barnet 20%
Brent 20%
Ealing 20%
Hammersmith & Fulham 20%
Harrow 20%
Hillingdon 15%
Hounslow 15%
3.17 It is important to recognise that any uplifts applied when establishing housing need can have a cumulative
impact. This was noted by the Inspector examining the County Durham Plan in his interim views (para 42):
…affordable housing need and market signals are amongst several factors, including future employment,
which could lead to an upward adjustment in the housing need suggested by the DCLG projections.
Given the significant upward adjustment already brought about by the jobs target, I consider any further
upward adjustment in respect of affordable housing need and market signals would result in a
calculation of OAN that is not grounded in realism in respect of associated population levels.
3.18 The compound impact of adjustments was also noted by the Inspector examining the Cornwall Local Plan in
his interim views:
3.21 Any uplift on the demographic starting point such as the 7% addition for second/holiday
homes that I am requiring (see below) would deliver some additional affordable housing and
can be taken into account in judging whether any further uplift is justified. A very substantial
uplift would raise the same concerns as I set out above in relation to market signals, but
some further uplift should still be carefully considered by the Council.
3.19 This is important because we note below in Figure 43 that a total of 10,300 dwellings in West London are
required for concealed and homeless households and it is important that double counting of needs does not
occur. We wish to stress that the proposed uplifts for the West London boroughs incorporates the
adjustment for concealed and homeless households and is not in addition to them. The final OAN
incorporates these market signals uplifts.
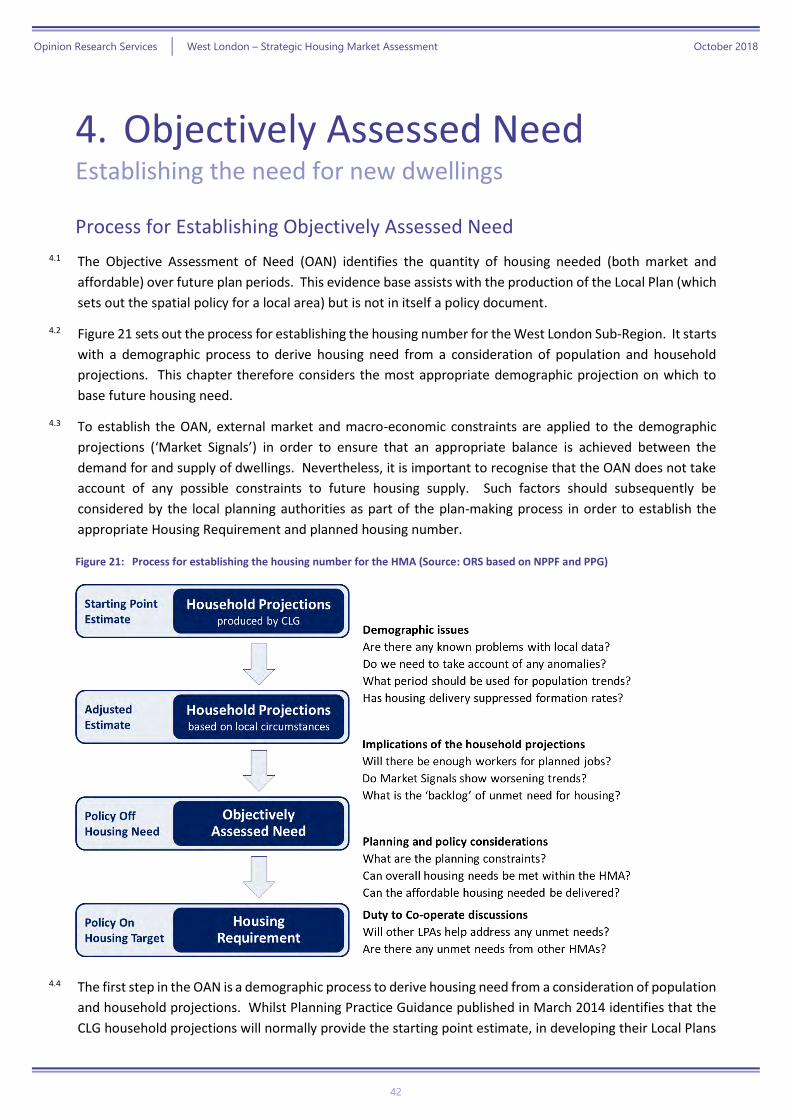
Opinion Research Services | West London – Strategic Housing Market Assessment October 2018
42
4. Objectively Assessed Need Establishing the need for new dwellings
Process for Establishing Objectively Assessed Need
4.1 The Objective Assessment of Need (OAN) identifies the quantity of housing needed (both market and
affordable) over future plan periods. This evidence base assists with the production of the Local Plan (which
sets out the spatial policy for a local area) but is not in itself a policy document.
4.2 Figure 21 sets out the process for establishing the housing number for the West London Sub-Region. It starts
with a demographic process to derive housing need from a consideration of population and household
projections. This chapter therefore considers the most appropriate demographic projection on which to
base future housing need.
4.3 To establish the OAN, external market and macro-economic constraints are applied to the demographic
projections (‘Market Signals’) in order to ensure that an appropriate balance is achieved between the
demand for and supply of dwellings. Nevertheless, it is important to recognise that the OAN does not take
account of any possible constraints to future housing supply. Such factors should subsequently be
considered by the local planning authorities as part of the plan-making process in order to establish the
appropriate Housing Requirement and planned housing number.
Figure 21: Process for establishing the housing number for the HMA (Source: ORS based on NPPF and PPG)
4.4 The first step in the OAN is a demographic process to derive housing need from a consideration of population
and household projections. Whilst Planning Practice Guidance published in March 2014 identifies that the
CLG household projections will normally provide the starting point estimate, in developing their Local Plans
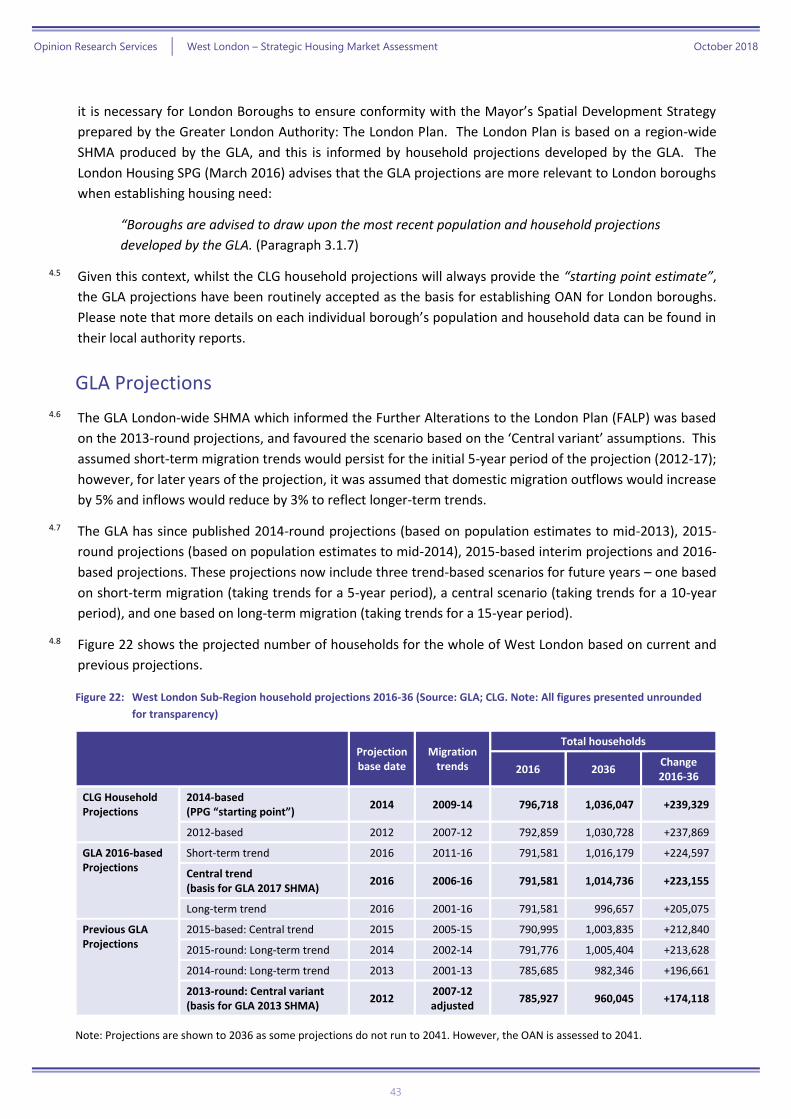
Opinion Research Services | West London – Strategic Housing Market Assessment October 2018
43
it is necessary for London Boroughs to ensure conformity with the Mayor’s Spatial Development Strategy
prepared by the Greater London Authority: The London Plan. The London Plan is based on a region-wide
SHMA produced by the GLA, and this is informed by household projections developed by the GLA. The
London Housing SPG (March 2016) advises that the GLA projections are more relevant to London boroughs
when establishing housing need:
“Boroughs are advised to draw upon the most recent population and household projections
developed by the GLA. (Paragraph 3.1.7)
4.5 Given this context, whilst the CLG household projections will always provide the “starting point estimate”,
the GLA projections have been routinely accepted as the basis for establishing OAN for London boroughs.
Please note that more details on each individual borough’s population and household data can be found in
their local authority reports.
GLA Projections
4.6 The GLA London-wide SHMA which informed the Further Alterations to the London Plan (FALP) was based
on the 2013-round projections, and favoured the scenario based on the ‘Central variant’ assumptions. This
assumed short-term migration trends would persist for the initial 5-year period of the projection (2012-17);
however, for later years of the projection, it was assumed that domestic migration outflows would increase
by 5% and inflows would reduce by 3% to reflect longer-term trends.
4.7 The GLA has since published 2014-round projections (based on population estimates to mid-2013), 2015-
round projections (based on population estimates to mid-2014), 2015-based interim projections and 2016-
based projections. These projections now include three trend-based scenarios for future years – one based
on short-term migration (taking trends for a 5-year period), a central scenario (taking trends for a 10-year
period), and one based on long-term migration (taking trends for a 15-year period).
4.8 Figure 22 shows the projected number of households for the whole of West London based on current and
previous projections.
Figure 22: West London Sub-Region household projections 2016-36 (Source: GLA; CLG. Note: All figures presented unrounded
for transparency)
Projection base date
Migration trends
Total households
2016 2036 Change 2016-36
CLG Household Projections
2014-based (PPG “starting point”)
2014 2009-14 796,718 1,036,047 +239,329
2012-based 2012 2007-12 792,859 1,030,728 +237,869
GLA 2016-based Projections
Short-term trend 2016 2011-16 791,581 1,016,179 +224,597
Central trend (basis for GLA 2017 SHMA)
2016 2006-16 791,581 1,014,736 +223,155
Long-term trend 2016 2001-16 791,581 996,657 +205,075
Previous GLA Projections
2015-based: Central trend 2015 2005-15 790,995 1,003,835 +212,840
2015-round: Long-term trend 2014 2002-14 791,776 1,005,404 +213,628
2014-round: Long-term trend 2013 2001-13 785,685 982,346 +196,661
2013-round: Central variant (basis for GLA 2013 SHMA)
2012 2007-12 adjusted
785,927 960,045 +174,118
Note: Projections are shown to 2036 as some projections do not run to 2041. However, the OAN is assessed to 2041.
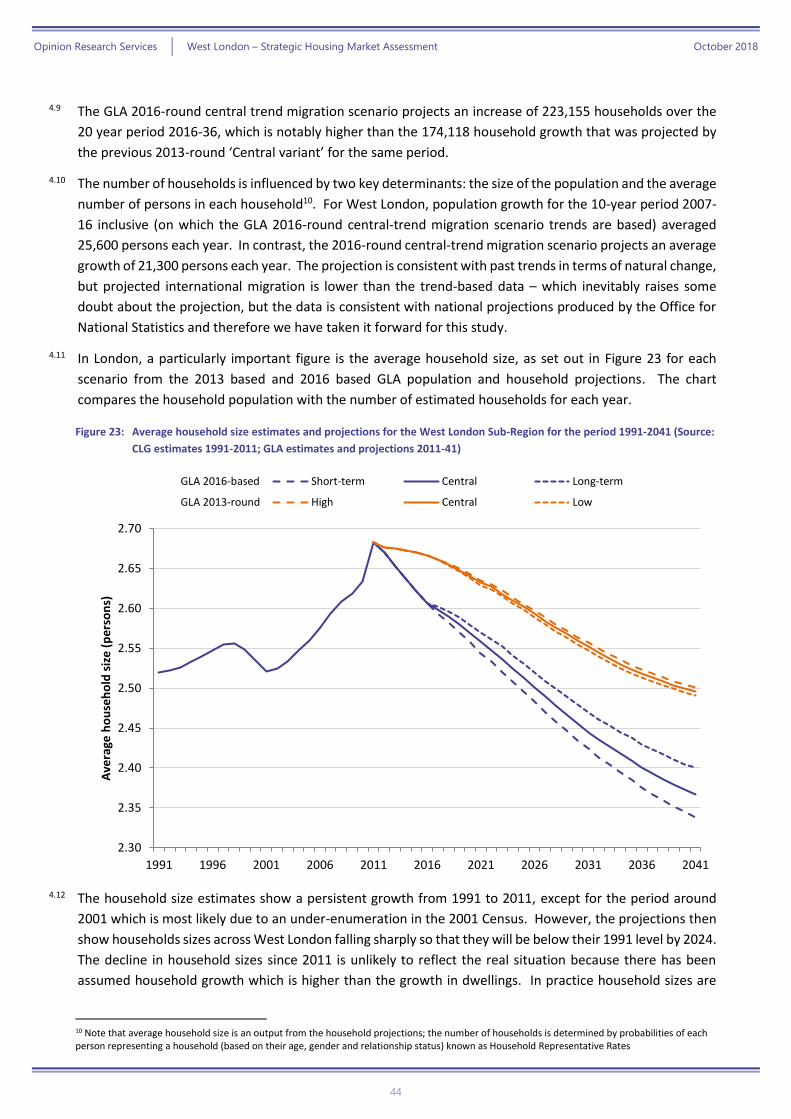
Opinion Research Services | West London – Strategic Housing Market Assessment October 2018
44
4.9 The GLA 2016-round central trend migration scenario projects an increase of 223,155 households over the
20 year period 2016-36, which is notably higher than the 174,118 household growth that was projected by
the previous 2013-round ‘Central variant’ for the same period.
4.10 The number of households is influenced by two key determinants: the size of the population and the average
number of persons in each household10. For West London, population growth for the 10-year period 2007-
16 inclusive (on which the GLA 2016-round central-trend migration scenario trends are based) averaged
25,600 persons each year. In contrast, the 2016-round central-trend migration scenario projects an average
growth of 21,300 persons each year. The projection is consistent with past trends in terms of natural change,
but projected international migration is lower than the trend-based data – which inevitably raises some
doubt about the projection, but the data is consistent with national projections produced by the Office for
National Statistics and therefore we have taken it forward for this study.
4.11 In London, a particularly important figure is the average household size, as set out in Figure 23 for each
scenario from the 2013 based and 2016 based GLA population and household projections. The chart
compares the household population with the number of estimated households for each year.
Figure 23: Average household size estimates and projections for the West London Sub-Region for the period 1991-2041 (Source:
CLG estimates 1991-2011; GLA estimates and projections 2011-41)
4.12 The household size estimates show a persistent growth from 1991 to 2011, except for the period around
2001 which is most likely due to an under-enumeration in the 2001 Census. However, the projections then
show households sizes across West London falling sharply so that they will be below their 1991 level by 2024.
The decline in household sizes since 2011 is unlikely to reflect the real situation because there has been
assumed household growth which is higher than the growth in dwellings. In practice household sizes are
10 Note that average household size is an output from the household projections; the number of households is determined by probabilities of each person representing a household (based on their age, gender and relationship status) known as Household Representative Rates
2.30
2.35
2.40
2.45
2.50
2.55
2.60
2.65
2.70
1991 1996 2001 2006 2011 2016 2021 2026 2031 2036 2041
Ave
rage
ho
use
ho
ld s
ize
(p
ers
on
s)
GLA 2016-based Short-term Central Long-term
GLA 2013-round High Central Low
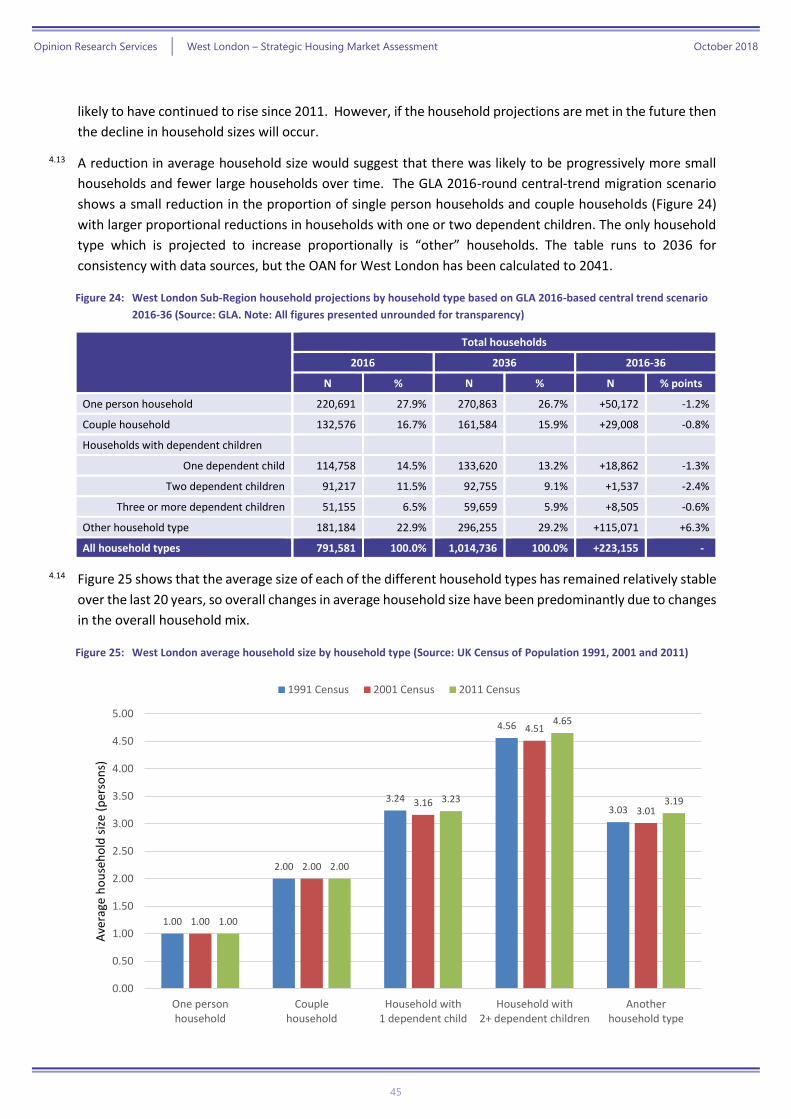
Opinion Research Services | West London – Strategic Housing Market Assessment October 2018
45
likely to have continued to rise since 2011. However, if the household projections are met in the future then
the decline in household sizes will occur.
4.13 A reduction in average household size would suggest that there was likely to be progressively more small
households and fewer large households over time. The GLA 2016-round central-trend migration scenario
shows a small reduction in the proportion of single person households and couple households (Figure 24)
with larger proportional reductions in households with one or two dependent children. The only household
type which is projected to increase proportionally is “other” households. The table runs to 2036 for
consistency with data sources, but the OAN for West London has been calculated to 2041.
Figure 24: West London Sub-Region household projections by household type based on GLA 2016-based central trend scenario
2016-36 (Source: GLA. Note: All figures presented unrounded for transparency)
Total households
2016 2036 2016-36
N % N % N % points
One person household 220,691 27.9% 270,863 26.7% +50,172 -1.2%
Couple household 132,576 16.7% 161,584 15.9% +29,008 -0.8%
Households with dependent children
One dependent child 114,758 14.5% 133,620 13.2% +18,862 -1.3%
Two dependent children 91,217 11.5% 92,755 9.1% +1,537 -2.4%
Three or more dependent children 51,155 6.5% 59,659 5.9% +8,505 -0.6%
Other household type 181,184 22.9% 296,255 29.2% +115,071 +6.3%
All household types 791,581 100.0% 1,014,736 100.0% +223,155 -
4.14 Figure 25 shows that the average size of each of the different household types has remained relatively stable
over the last 20 years, so overall changes in average household size have been predominantly due to changes
in the overall household mix.
Figure 25: West London average household size by household type (Source: UK Census of Population 1991, 2001 and 2011)
1.00
2.00
3.24
4.56
3.03
1.00
2.00
3.16
4.51
3.01
1.00
2.00
3.23
4.65
3.19
0.00
0.50
1.00
1.50
2.00
2.50
3.00
3.50
4.00
4.50
5.00
One personhousehold
Couplehousehold
Household with1 dependent child
Household with2+ dependent children
Anotherhousehold type
Ave
rage
ho
use
ho
ld s
ize
(per
son
s)
1991 Census 2001 Census 2011 Census
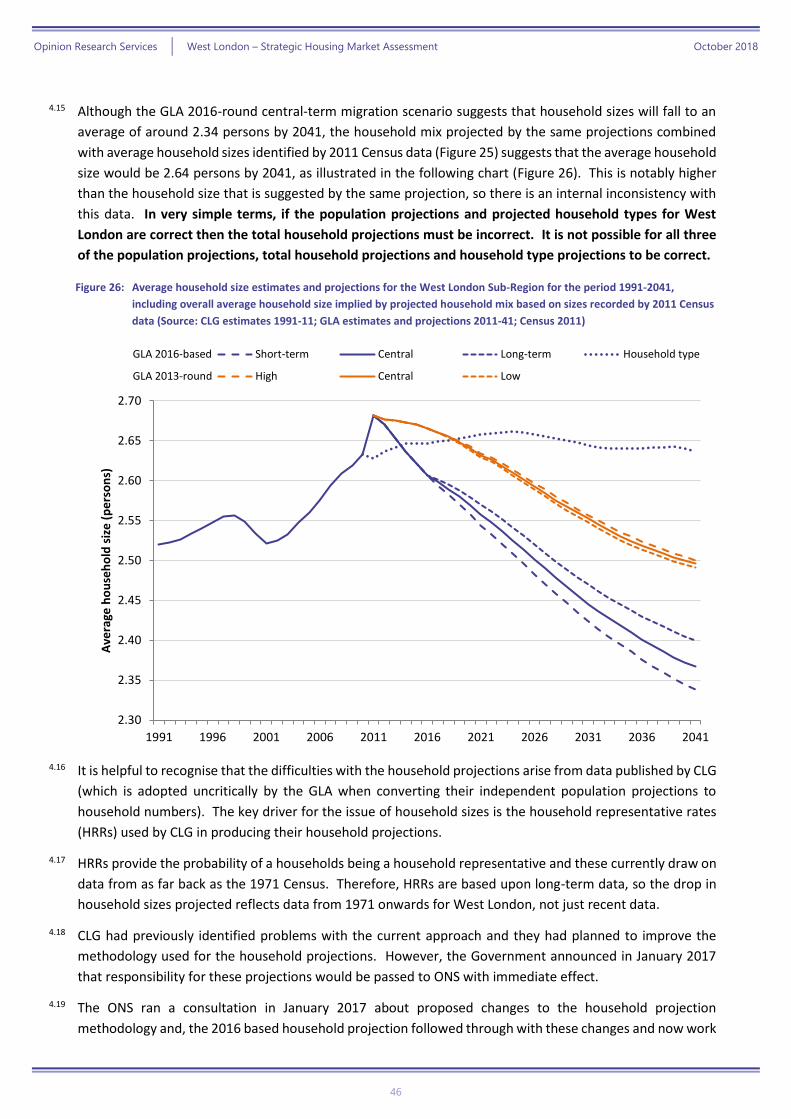
Opinion Research Services | West London – Strategic Housing Market Assessment October 2018
46
4.15 Although the GLA 2016-round central-term migration scenario suggests that household sizes will fall to an
average of around 2.34 persons by 2041, the household mix projected by the same projections combined
with average household sizes identified by 2011 Census data (Figure 25) suggests that the average household
size would be 2.64 persons by 2041, as illustrated in the following chart (Figure 26). This is notably higher
than the household size that is suggested by the same projection, so there is an internal inconsistency with
this data. In very simple terms, if the population projections and projected household types for West
London are correct then the total household projections must be incorrect. It is not possible for all three
of the population projections, total household projections and household type projections to be correct.
Figure 26: Average household size estimates and projections for the West London Sub-Region for the period 1991-2041,
including overall average household size implied by projected household mix based on sizes recorded by 2011 Census
data (Source: CLG estimates 1991-11; GLA estimates and projections 2011-41; Census 2011)
4.16 It is helpful to recognise that the difficulties with the household projections arise from data published by CLG
(which is adopted uncritically by the GLA when converting their independent population projections to
household numbers). The key driver for the issue of household sizes is the household representative rates
(HRRs) used by CLG in producing their household projections.
4.17 HRRs provide the probability of a households being a household representative and these currently draw on
data from as far back as the 1971 Census. Therefore, HRRs are based upon long-term data, so the drop in
household sizes projected reflects data from 1971 onwards for West London, not just recent data.
4.18 CLG had previously identified problems with the current approach and they had planned to improve the
methodology used for the household projections. However, the Government announced in January 2017
that responsibility for these projections would be passed to ONS with immediate effect.
4.19 The ONS ran a consultation in January 2017 about proposed changes to the household projection
methodology and, the 2016 based household projection followed through with these changes and now work
2.30
2.35
2.40
2.45
2.50
2.55
2.60
2.65
2.70
1991 1996 2001 2006 2011 2016 2021 2026 2031 2036 2041
Ave
rage
ho
use
ho
ld s
ize
(p
ers
on
s)
GLA 2016-based Short-term Central Long-term Household type
GLA 2013-round High Central Low
Opinion Research Services | West London – Strategic Housing Market Assessment October 2018
47
with only data from the 2001 Census onwards. It is possible to show the impact of these changes now, as we
have done in Figure 9 and they reduce the overall household need for Greater London by around 23,000
dwellings per annum since September 2017, with 5,000 of these being in West London.
4.20 What is evident at this stage is that there are inherent uncertainties surrounding both the population and
household projections, due in large part to the difficulties of establishing reliable trends at a local area. This
is particularly difficult when working with data for London boroughs; primarily due to the high levels of
migration and turnover found in them.
Establishing Objectively Assessed Need for the West London Sub-Region
4.21 The earlier part of this Chapter sets out the context for calculating OAN. Our approach for this section follows
the format of the earlier section, with specific reference to the West London Sub-Region. Essentially,
therefore, this section is concerned with:
» CLG 2014-based household projections (the starting point);
» GLA 2016 based household projections
» Market signals, incorporating an uplift for concealed families;
» Converting from household growth to a requirement for dwellings, taking account of
vacancies and second homes.
CLG Household Projections
4.22 The “starting point” estimate for OAN is the CLG household projections, and the latest published data is the
2014-based projections for period 2014-39. These projections suggest that household numbers across the
West London Sub-Region will increase by 299,500 over the 25-year period 2014-39, an average of 11,980 per
year.
4.23 However, the notes accompanying the CLG Household Projections explicitly state that:
“The 2014-based household projections are linked to the Office for National Statistics 2014-
based sub-national population projections. They are not an assessment of housing need or
do not take account of future policies, they are an indication of the likely increase in
households given the continuation of recent demographic trends.”
4.24 The ONS 2014-based sub-national population projections are based on migration trends from the 5-year
period before the projection base date; so use trends for the period 2009-2014. Short-term migration trends
are generally not appropriate for long-term planning, as they risk rolling-forward rates that are unduly high
or unduly low. Projections based on long-term migration trends are likely to provide a more reliable estimate
of future households.
4.25 The London Plan is based on a region-wide SHMA produced by the GLA, and this is informed by household
projections developed by the GLA. The London Housing SPG (March 2016) advises that the GLA projections
are more relevant to London boroughs when establishing housing need.

Opinion Research Services | West London – Strategic Housing Market Assessment October 2018
48
GLA Adjustments
4.26 The GLA have calculated 2016 based household projections also include scenarios using 5, 10 and 15-year
migration trends. On the basis of 10-year migration trends, household numbers in the West London Sub-
Region are projected to increase by 266,751 households over the 25-year period 2016-41, an average of
10,670 per year.
4.27 Whilst this projection is lower than the CLG 2014-based household projection to 2036 (11,980 p.a.), as this
scenario is based on longer-term migration trends it gives the most reliable and appropriate demographic
projection for establishing future housing need.
4.28 However, we would still note our concerns around the GLA demographic data and as an alternative scenario,
taking forward the ‘Household Type’ line in Figure 26 would show a growth in household numbers for 2016-
41 of around 168,400 households (6,700 per annum). We have therefore included this figure as an
alternative scenario in the OAN figures set out below.
Employment Trends
4.29 While demographic trends are key to the assessment of OAN, it is also important to consider current
Employment Trends and how the projected growth of the economically active population fits with the future
changes in job numbers.
Plan makers should make an assessment of the likely change in job numbers based on past trends
and/or economic forecasts as appropriate and also having regard to the growth of the working age
population in the housing market area.
Where the supply of working age population that is economically active (labour force supply) is less
than the projected job growth, this could result in unsustainable commuting patterns (depending on
public transport accessibility or other sustainable options such as walking or cycling) and could
reduce the resilience of local businesses. In such circumstances, plan makers will need to consider
how the location of new housing or infrastructure development could help address these problems.
Planning Practice Guidance (March 2014), ID 2a-018
4.30 As noted in Chapter 2, it is not possible to define an HMA that is smaller than Greater London that is self-
contained in terms of commuting – so if jobs and workers are to be in balance, the analysis must be
undertaken for the whole of Greater London. A lower-tier HMA will therefore contribute to balancing jobs
and workers across the Greater London HMA, consistent with the London Plan.
Planned Employment Growth
4.31 GLA figures estimate that the West London area is to deliver 210,000 extra jobs over the 25-year period
2016-41, equivalent to an average of 8,400 jobs per year. This number is lower than the previous 10 year
average; the number of jobs recorded for West London increased from 945,00 jobs in 2006 to 1,051,000 jobs
in 2016, an average over the previous ten years of 10,600 jobs per year.
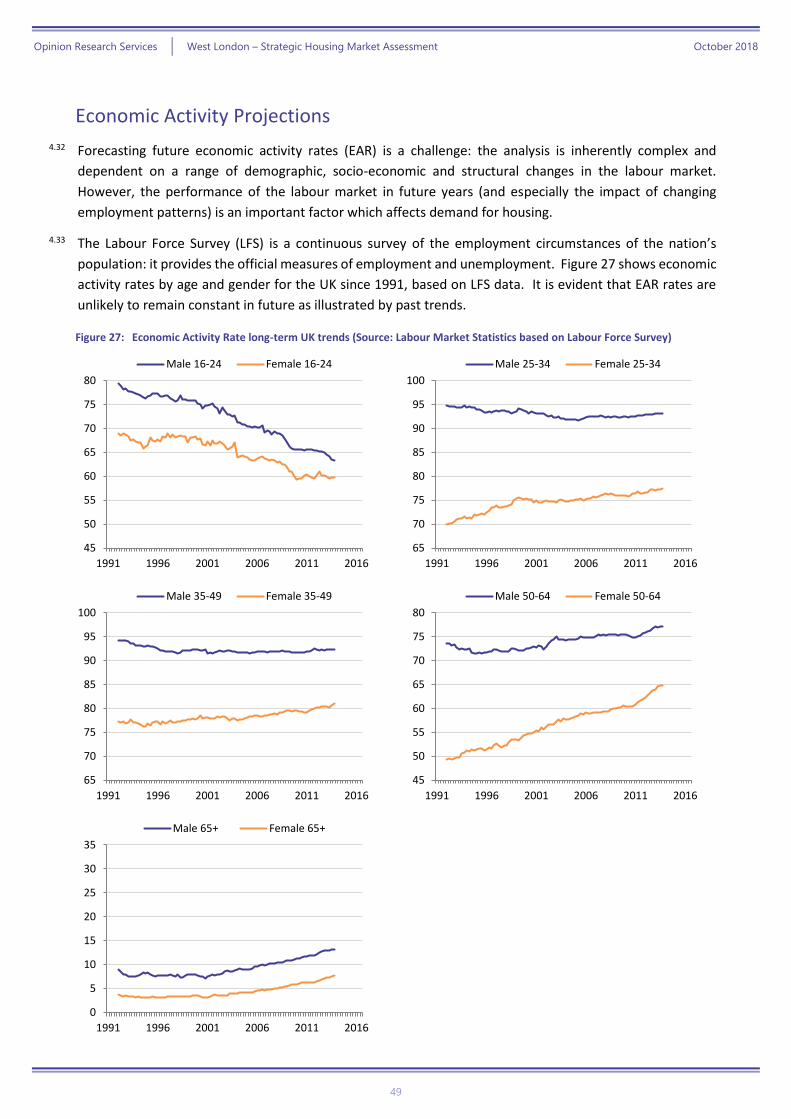
Opinion Research Services | West London – Strategic Housing Market Assessment October 2018
49
Economic Activity Projections
4.32 Forecasting future economic activity rates (EAR) is a challenge: the analysis is inherently complex and
dependent on a range of demographic, socio-economic and structural changes in the labour market.
However, the performance of the labour market in future years (and especially the impact of changing
employment patterns) is an important factor which affects demand for housing.
4.33 The Labour Force Survey (LFS) is a continuous survey of the employment circumstances of the nation’s
population: it provides the official measures of employment and unemployment. Figure 27 shows economic
activity rates by age and gender for the UK since 1991, based on LFS data. It is evident that EAR rates are
unlikely to remain constant in future as illustrated by past trends.
Figure 27: Economic Activity Rate long-term UK trends (Source: Labour Market Statistics based on Labour Force Survey)
45
50
55
60
65
70
75
80
1991 1996 2001 2006 2011 2016
Male 16-24 Female 16-24
65
70
75
80
85
90
95
100
1991 1996 2001 2006 2011 2016
Male 25-34 Female 25-34
65
70
75
80
85
90
95
100
1991 1996 2001 2006 2011 2016
Male 35-49 Female 35-49
45
50
55
60
65
70
75
80
1991 1996 2001 2006 2011 2016
Male 50-64 Female 50-64
0
5
10
15
20
25
30
35
1991 1996 2001 2006 2011 2016
Male 65+ Female 65+
Opinion Research Services | West London – Strategic Housing Market Assessment October 2018
50
4.34 There are a number of notable trends evident:
» Economic activity rates for people aged under 25 have steadily declined, primarily as a consequence
of the increased numbers remaining in full-time education;
» Economic activity rates for women in all groups aged 25+ have tended to increase, in particular
those aged 50-64 where the rate has increased by almost a third (from 49% to 65%); and
» Economic activity rates for men and women aged 50+ have tended to increase, in particular over
the period since 2001.
4.35 These changes in participation identified by the Labour Force Survey have been confirmed by Census data,
which also shows that national trends are typically reflected at a local level.
4.36 The most recent economic activity rate projections produced by ONS were published in January 2006 and
covered the period to 202011; however, these figures suggested substantially lower changes in activity rates
than actually experienced over the last decade. However, the performance of the labour market is important
for national government, particularly in terms of forecasting the long term sustainability of tax revenues. As
part of their scrutiny of Government finances, the Office for Budget Responsibility (OBR) provide an
independent and authoritative analysis of the UK’s public finances for Government, which includes detailed
analysis of past and future labour market trends12.
Labour Market Participation Projections
4.37 The labour market participation projections produced by the OBR are based on historic profiles of different
cohorts of the overall population – subsets that are grouped by year of birth and gender. Their analysis is
not based on simplistic trends but is designed to capture dynamics that are specific to particular ages and
those that cut across generations:
“We project each cohort into the future using age-specific labour market entry and exit rates as they age
across time. These exit and entry rates are generally held constant, although we adjust entry rates for
younger cohorts (discussed further below), and exit rates for people approaching the State Pension age
(SPA), since the SPA rises over our projection period.”
4.38 Their analysis concludes:
» Older people; economic activity rates of older people will increase in future years, mainly from a
combination of factors including changes to State Pension age, less generous final salary pensions
and increasing healthy longevity;
» Female participation; in addition to changes to state pension age, economic activity rates for
women will also increase due to cohort change: more women born in the 1980s will work compared
to those born in the 1970s across all comparable ages, and the rates for women born in the 1970s
will be higher than for those born in the 1960s and so on; and
» Young people; economic activity rates of younger people will stop declining, although young people
will continue to stay longer in education and the lower participation rates recently observed are not
assumed to increase in future.
11 Projections of the UK labour force, 2006 to 2020 by Vassilis Madouros; published in ONS Labour Market Trends, January 2006 12 OBR Fiscal Sustainability Report, July 2014: http://cdn.budgetresponsibility.org.uk/41298-OBR-accessible.pdf
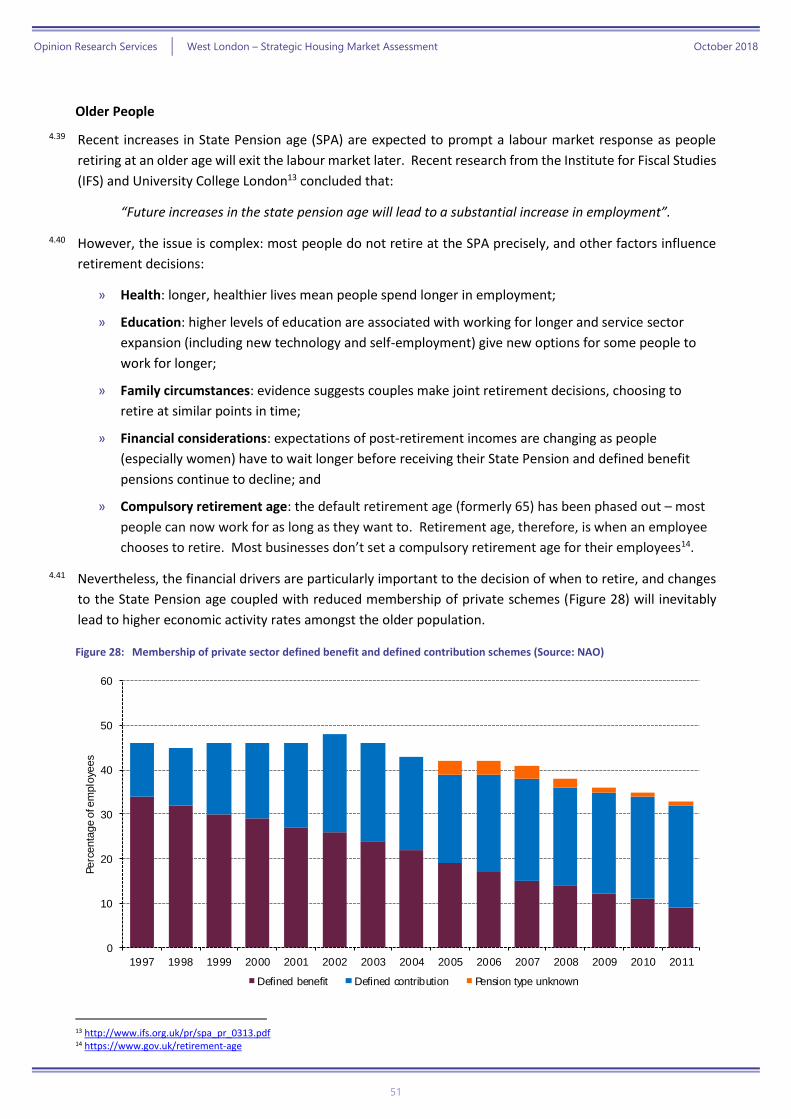
Opinion Research Services | West London – Strategic Housing Market Assessment October 2018
51
Older People
4.39 Recent increases in State Pension age (SPA) are expected to prompt a labour market response as people
retiring at an older age will exit the labour market later. Recent research from the Institute for Fiscal Studies
(IFS) and University College London13 concluded that:
“Future increases in the state pension age will lead to a substantial increase in employment”.
4.40 However, the issue is complex: most people do not retire at the SPA precisely, and other factors influence
retirement decisions:
» Health: longer, healthier lives mean people spend longer in employment;
» Education: higher levels of education are associated with working for longer and service sector
expansion (including new technology and self-employment) give new options for some people to
work for longer;
» Family circumstances: evidence suggests couples make joint retirement decisions, choosing to
retire at similar points in time;
» Financial considerations: expectations of post-retirement incomes are changing as people
(especially women) have to wait longer before receiving their State Pension and defined benefit
pensions continue to decline; and
» Compulsory retirement age: the default retirement age (formerly 65) has been phased out – most
people can now work for as long as they want to. Retirement age, therefore, is when an employee
chooses to retire. Most businesses don’t set a compulsory retirement age for their employees14.
4.41 Nevertheless, the financial drivers are particularly important to the decision of when to retire, and changes
to the State Pension age coupled with reduced membership of private schemes (Figure 28) will inevitably
lead to higher economic activity rates amongst the older population.
Figure 28: Membership of private sector defined benefit and defined contribution schemes (Source: NAO)
13 http://www.ifs.org.uk/pr/spa_pr_0313.pdf 14 https://www.gov.uk/retirement-age
0
10
20
30
40
50
60
1997 1998 1999 2000 2001 2002 2003 2004 2005 2006 2007 2008 2009 2010 2011
Perc
enta
ge o
f em
plo
yees
Defined benefit Defined contribution Pension type unknown
Source: NAO
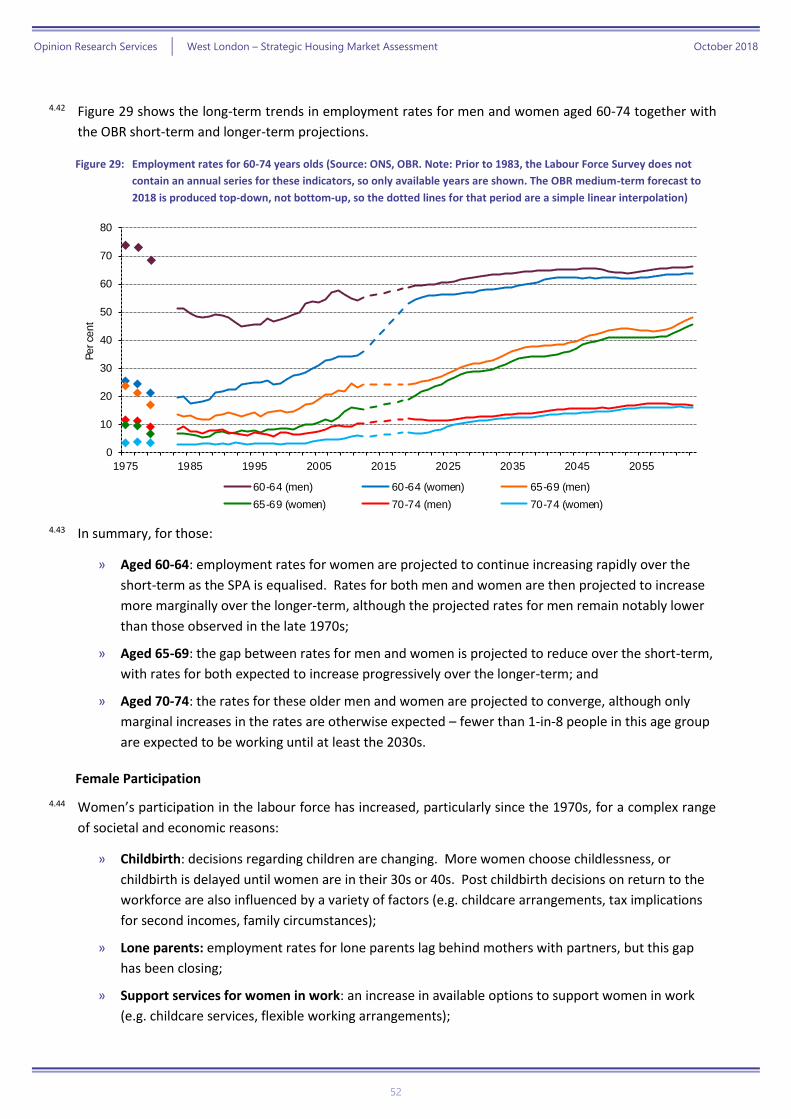
Opinion Research Services | West London – Strategic Housing Market Assessment October 2018
52
4.42 Figure 29 shows the long-term trends in employment rates for men and women aged 60-74 together with
the OBR short-term and longer-term projections.
Figure 29: Employment rates for 60-74 years olds (Source: ONS, OBR. Note: Prior to 1983, the Labour Force Survey does not
contain an annual series for these indicators, so only available years are shown. The OBR medium-term forecast to
2018 is produced top-down, not bottom-up, so the dotted lines for that period are a simple linear interpolation)
4.43 In summary, for those:
» Aged 60-64: employment rates for women are projected to continue increasing rapidly over the
short-term as the SPA is equalised. Rates for both men and women are then projected to increase
more marginally over the longer-term, although the projected rates for men remain notably lower
than those observed in the late 1970s;
» Aged 65-69: the gap between rates for men and women is projected to reduce over the short-term,
with rates for both expected to increase progressively over the longer-term; and
» Aged 70-74: the rates for these older men and women are projected to converge, although only
marginal increases in the rates are otherwise expected – fewer than 1-in-8 people in this age group
are expected to be working until at least the 2030s.
Female Participation
4.44 Women’s participation in the labour force has increased, particularly since the 1970s, for a complex range
of societal and economic reasons:
» Childbirth: decisions regarding children are changing. More women choose childlessness, or
childbirth is delayed until women are in their 30s or 40s. Post childbirth decisions on return to the
workforce are also influenced by a variety of factors (e.g. childcare arrangements, tax implications
for second incomes, family circumstances);
» Lone parents: employment rates for lone parents lag behind mothers with partners, but this gap
has been closing;
» Support services for women in work: an increase in available options to support women in work
(e.g. childcare services, flexible working arrangements);
0
10
20
30
40
50
60
70
80
1975 1985 1995 2005 2015 2025 2035 2045 2055
Per ce
nt
60-64 (men) 60-64 (women) 65-69 (men)
65-69 (women) 70-74 (men) 70-74 (women)
Prior to 1983, the Labour Fource Survey does not containt an annual series for these indicators, so only available years are shown.
Our medium-term forecast is producted top-down, not bottom-up, so the dotted lines for that period are a simple linear interpolation.
Source: ONS, OBR
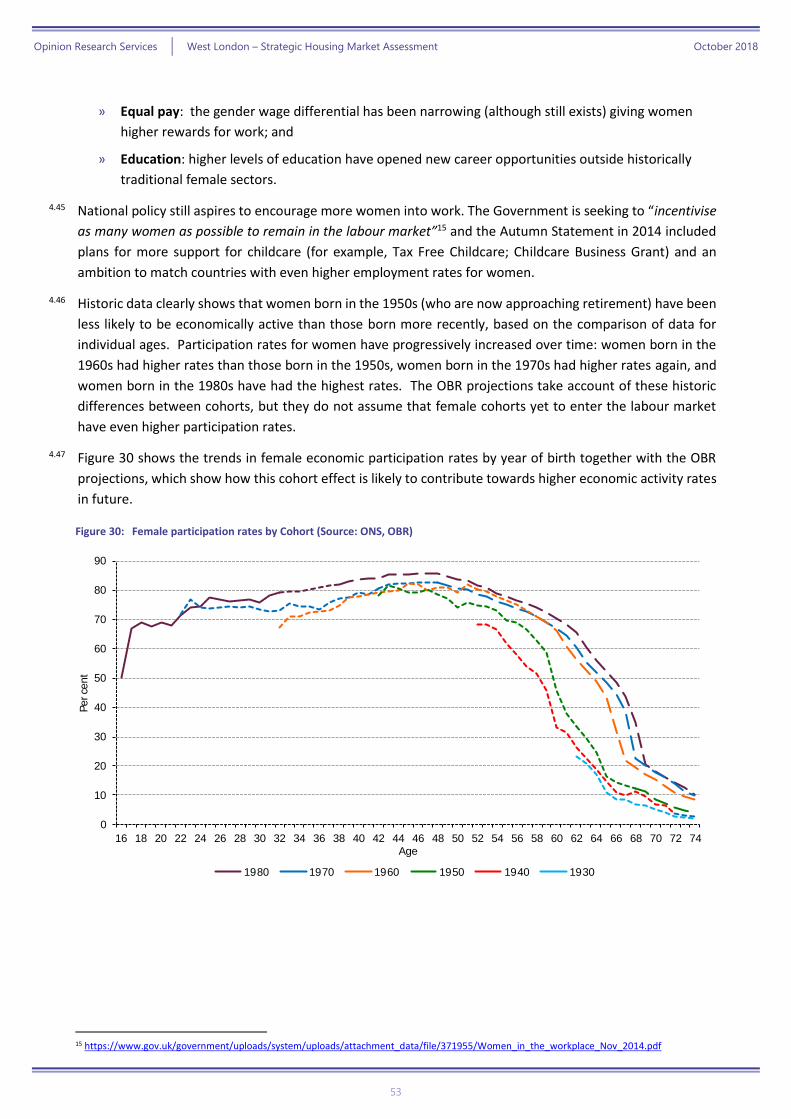
Opinion Research Services | West London – Strategic Housing Market Assessment October 2018
53
» Equal pay: the gender wage differential has been narrowing (although still exists) giving women
higher rewards for work; and
» Education: higher levels of education have opened new career opportunities outside historically
traditional female sectors.
4.45 National policy still aspires to encourage more women into work. The Government is seeking to “incentivise
as many women as possible to remain in the labour market”15 and the Autumn Statement in 2014 included
plans for more support for childcare (for example, Tax Free Childcare; Childcare Business Grant) and an
ambition to match countries with even higher employment rates for women.
4.46 Historic data clearly shows that women born in the 1950s (who are now approaching retirement) have been
less likely to be economically active than those born more recently, based on the comparison of data for
individual ages. Participation rates for women have progressively increased over time: women born in the
1960s had higher rates than those born in the 1950s, women born in the 1970s had higher rates again, and
women born in the 1980s have had the highest rates. The OBR projections take account of these historic
differences between cohorts, but they do not assume that female cohorts yet to enter the labour market
have even higher participation rates.
4.47 Figure 30 shows the trends in female economic participation rates by year of birth together with the OBR
projections, which show how this cohort effect is likely to contribute towards higher economic activity rates
in future.
Figure 30: Female participation rates by Cohort (Source: ONS, OBR)
15 https://www.gov.uk/government/uploads/system/uploads/attachment_data/file/371955/Women_in_the_workplace_Nov_2014.pdf
0
10
20
30
40
50
60
70
80
90
16 18 20 22 24 26 28 30 32 34 36 38 40 42 44 46 48 50 52 54 56 58 60 62 64 66 68 70 72 74
Per ce
nt
Age
1980 1970 1960 1950 1940 1930Source: ONS, OBR
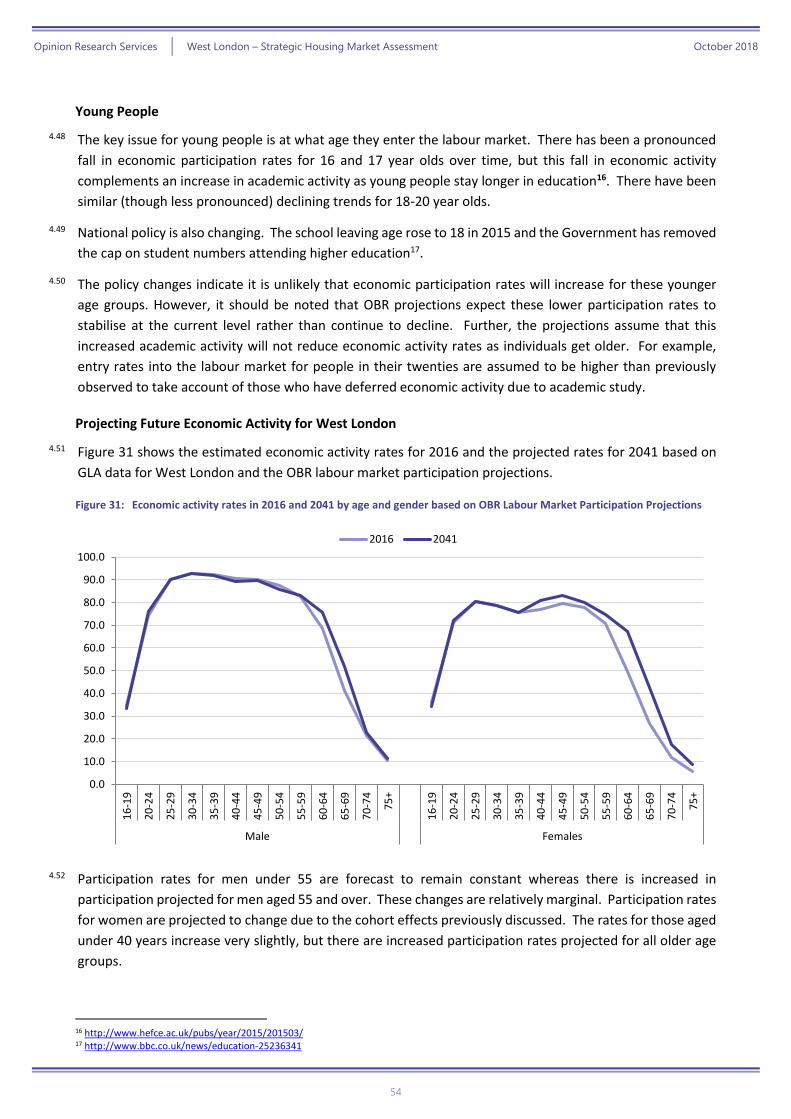
Opinion Research Services | West London – Strategic Housing Market Assessment October 2018
54
Young People
4.48 The key issue for young people is at what age they enter the labour market. There has been a pronounced
fall in economic participation rates for 16 and 17 year olds over time, but this fall in economic activity
complements an increase in academic activity as young people stay longer in education16. There have been
similar (though less pronounced) declining trends for 18-20 year olds.
4.49 National policy is also changing. The school leaving age rose to 18 in 2015 and the Government has removed
the cap on student numbers attending higher education17.
4.50 The policy changes indicate it is unlikely that economic participation rates will increase for these younger
age groups. However, it should be noted that OBR projections expect these lower participation rates to
stabilise at the current level rather than continue to decline. Further, the projections assume that this
increased academic activity will not reduce economic activity rates as individuals get older. For example,
entry rates into the labour market for people in their twenties are assumed to be higher than previously
observed to take account of those who have deferred economic activity due to academic study.
Projecting Future Economic Activity for West London
4.51 Figure 31 shows the estimated economic activity rates for 2016 and the projected rates for 2041 based on
GLA data for West London and the OBR labour market participation projections.
Figure 31: Economic activity rates in 2016 and 2041 by age and gender based on OBR Labour Market Participation Projections
4.52 Participation rates for men under 55 are forecast to remain constant whereas there is increased in
participation projected for men aged 55 and over. These changes are relatively marginal. Participation rates
for women are projected to change due to the cohort effects previously discussed. The rates for those aged
under 40 years increase very slightly, but there are increased participation rates projected for all older age
groups.
16 http://www.hefce.ac.uk/pubs/year/2015/201503/ 17 http://www.bbc.co.uk/news/education-25236341
0.0
10.0
20.0
30.0
40.0
50.0
60.0
70.0
80.0
90.0
100.0
16
-19
20
-24
25
-29
30
-34
35
-39
40
-44
45
-49
50
-54
55
-59
60
-64
65
-69
70
-74
75
+
16
-19
20
-24
25
-29
30
-34
35
-39
40
-44
45
-49
50
-54
55
-59
60
-64
65
-69
70
-74
75
+
Male Females
2016 2041
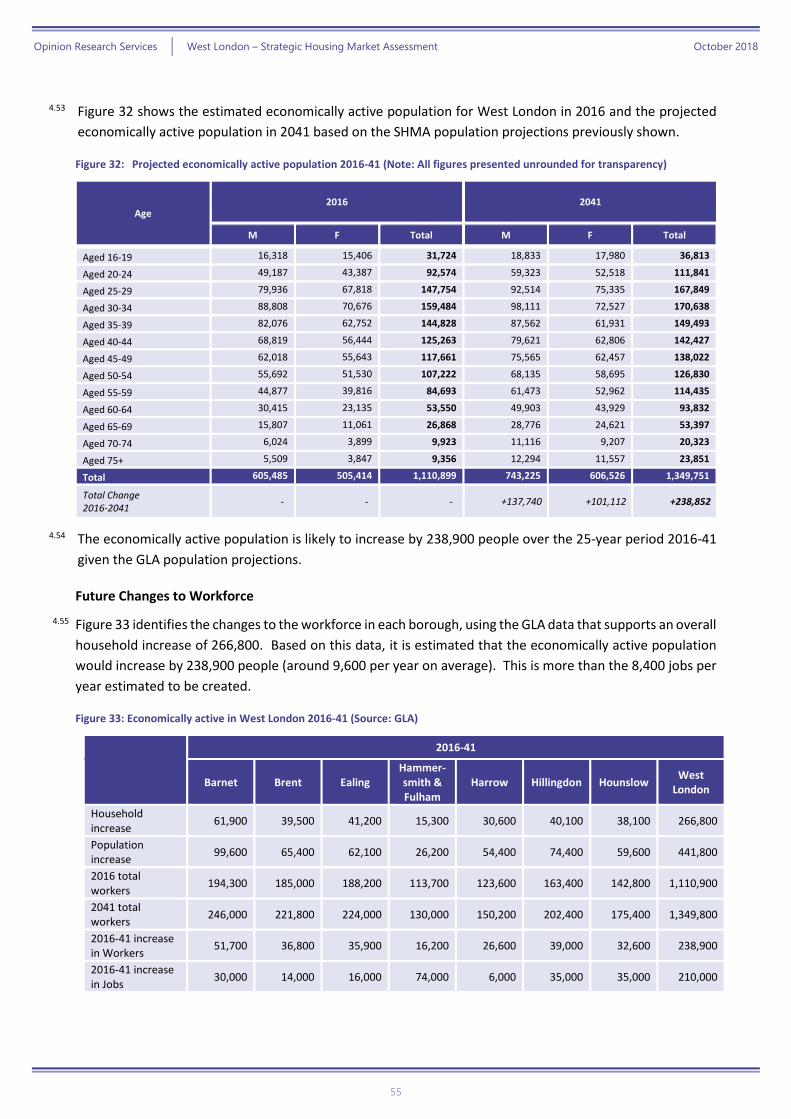
Opinion Research Services | West London – Strategic Housing Market Assessment October 2018
55
4.53 Figure 32 shows the estimated economically active population for West London in 2016 and the projected
economically active population in 2041 based on the SHMA population projections previously shown.
Figure 32: Projected economically active population 2016-41 (Note: All figures presented unrounded for transparency)
Age 2016 2041
M F Total M F Total
Aged 16-19 16,318 15,406 31,724 18,833 17,980 36,813
Aged 20-24 49,187 43,387 92,574 59,323 52,518 111,841
Aged 25-29 79,936 67,818 147,754 92,514 75,335 167,849
Aged 30-34 88,808 70,676 159,484 98,111 72,527 170,638
Aged 35-39 82,076 62,752 144,828 87,562 61,931 149,493
Aged 40-44 68,819 56,444 125,263 79,621 62,806 142,427
Aged 45-49 62,018 55,643 117,661 75,565 62,457 138,022
Aged 50-54 55,692 51,530 107,222 68,135 58,695 126,830
Aged 55-59 44,877 39,816 84,693 61,473 52,962 114,435
Aged 60-64 30,415 23,135 53,550 49,903 43,929 93,832
Aged 65-69 15,807 11,061 26,868 28,776 24,621 53,397
Aged 70-74 6,024 3,899 9,923 11,116 9,207 20,323
Aged 75+ 5,509 3,847 9,356 12,294 11,557 23,851
Total 605,485 505,414 1,110,899 743,225 606,526 1,349,751
Total Change 2016-2041
- - - +137,740 +101,112 +238,852
4.54 The economically active population is likely to increase by 238,900 people over the 25-year period 2016-41
given the GLA population projections.
Future Changes to Workforce
4.55 Figure 33 identifies the changes to the workforce in each borough, using the GLA data that supports an overall
household increase of 266,800. Based on this data, it is estimated that the economically active population
would increase by 238,900 people (around 9,600 per year on average). This is more than the 8,400 jobs per
year estimated to be created.
Figure 33: Economically active in West London 2016-41 (Source: GLA)
2016-41
Barnet Brent Ealing Hammer-smith & Fulham
Harrow Hillingdon Hounslow West
London
Household increase
61,900 39,500 41,200 15,300 30,600 40,100 38,100 266,800
Population increase
99,600 65,400 62,100 26,200 54,400 74,400 59,600 441,800
2016 total workers
194,300 185,000 188,200 113,700 123,600 163,400 142,800 1,110,900
2041 total workers
246,000 221,800 224,000 130,000 150,200 202,400 175,400 1,349,800
2016-41 increase in Workers
51,700 36,800 35,900 16,200 26,600 39,000 32,600 238,900
2016-41 increase in Jobs
30,000 14,000 16,000 74,000 6,000 35,000 35,000 210,000
Opinion Research Services | West London – Strategic Housing Market Assessment October 2018
56
4.56 However, there are a number of factors which should be considered when relating jobs to workers,
particularly the issue of commuting:
» Second Jobs: It is important to make a distinction between “main” jobs as opposed to second or
part-time jobs. Data from the Labour Force Survey (2016 Q2) suggests that currently 2.7% of
jobs in the area are part time/second jobs. As such, the 210,000 new jobs are expected to
consist of 204,300 main jobs and 25,700 part-time/second jobs.
» Out-commuting: Based on 2011 Census commuting flows, 61.3% of working residents in West
London are also employed in the local area. This implies that 38.7% commuted to jobs outside
the area. Therefore, of the additional 238,900 workers projected to live in the area, we would
expect 146,400 (61.3%) would work locally and 92,500 (38.7%) would commute outside of the
area. On this basis, we have assumed that the number of workers that out-commute from West
London to work elsewhere will increase by 92,500 over the 25-year period 2016-41.
» In-commuting: at the time of the 2011 Census, 32.9% of main jobs in West London were filled
by people travelling in from other authorities. Therefore, a jobs growth of 210,000 is likely to
include 204,300 main jobs, and draw in 67,100 (32.9%) additional in-commuters; but this still
implies a likely increase of 24,90018 in net out-commuting (assuming no change in the
commuting rates for the area), and would mean that 137,200 jobs would need to be filled by
workers living in the area.
4.57 When all of these factors are properly considered, we can conclude that the demographic projections
(without any uplift for market signals) would provide 146,400 extra workers locally whereas there is forecast
to be 137,200 extra main jobs that need to be filled by workers living in the area. There is therefore alignment
between the planned jobs growth and the projected future changes to the workforce over the 25-year period
2016-2041.
Conclusions on Jobs and Workers
4.58 The GLA projects that West London will deliver 210,000 extra jobs over the 25-year period 2016-41; the
SHMA has considered the alignment with workers based on employment growth at this rate (8,400 jobs per
year), assuming levels of unemployment do not change.
4.59 This combined increase of 210,000 jobs across the area would suggest broad alignment with the projected
increase in workers given second job and current commuting patterns. On this basis, there is no need to
uplift housing delivery to align the increase in workers with the increase in jobs.
4.60 This does not take account of any additional population as a consequence of any uplift for market signals.
Providing more housing than identified by the household projections is likely to yield a larger population,
which would include additional workers. This could therefore yield a surplus in workers which would lead to
larger increases in net out-commuting than projected above.
Market Signals
4.61 As previously noted, PPG suggests that “household projections should be adjusted to reflect appropriate
market signals” where there is a “worsening trend in any of these indicators” (paragraphs 19-20). As
18 Note that these numbers are rounded to the nearest 100, so may not sum.
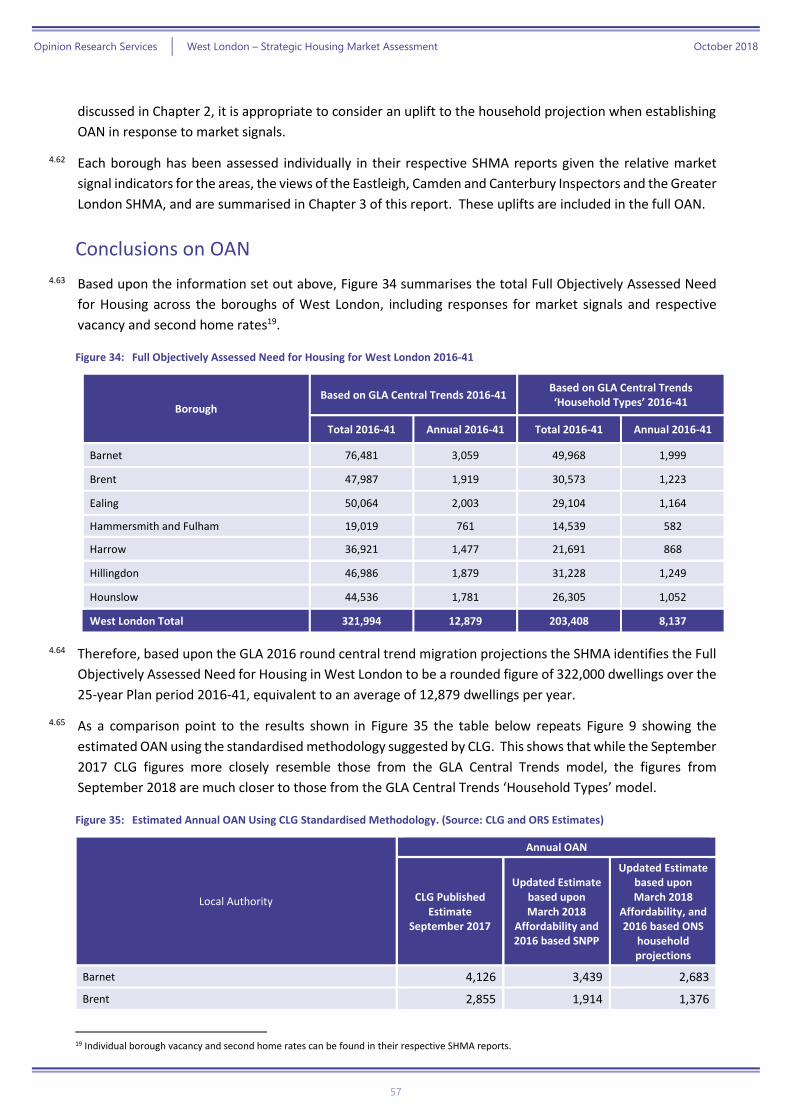
Opinion Research Services | West London – Strategic Housing Market Assessment October 2018
57
discussed in Chapter 2, it is appropriate to consider an uplift to the household projection when establishing
OAN in response to market signals.
4.62 Each borough has been assessed individually in their respective SHMA reports given the relative market
signal indicators for the areas, the views of the Eastleigh, Camden and Canterbury Inspectors and the Greater
London SHMA, and are summarised in Chapter 3 of this report. These uplifts are included in the full OAN.
Conclusions on OAN
4.63 Based upon the information set out above, Figure 34 summarises the total Full Objectively Assessed Need
for Housing across the boroughs of West London, including responses for market signals and respective
vacancy and second home rates19.
Figure 34: Full Objectively Assessed Need for Housing for West London 2016-41
Borough Based on GLA Central Trends 2016-41
Based on GLA Central Trends ‘Household Types’ 2016-41
Total 2016-41 Annual 2016-41 Total 2016-41 Annual 2016-41
Barnet 76,481 3,059 49,968 1,999
Brent 47,987 1,919 30,573 1,223
Ealing 50,064 2,003 29,104 1,164
Hammersmith and Fulham 19,019 761 14,539 582
Harrow 36,921 1,477 21,691 868
Hillingdon 46,986 1,879 31,228 1,249
Hounslow 44,536 1,781 26,305 1,052
West London Total 321,994 12,879 203,408 8,137
4.64 Therefore, based upon the GLA 2016 round central trend migration projections the SHMA identifies the Full
Objectively Assessed Need for Housing in West London to be a rounded figure of 322,000 dwellings over the
25-year Plan period 2016-41, equivalent to an average of 12,879 dwellings per year.
4.65 As a comparison point to the results shown in Figure 35 the table below repeats Figure 9 showing the
estimated OAN using the standardised methodology suggested by CLG. This shows that while the September
2017 CLG figures more closely resemble those from the GLA Central Trends model, the figures from
September 2018 are much closer to those from the GLA Central Trends ‘Household Types’ model.
Figure 35: Estimated Annual OAN Using CLG Standardised Methodology. (Source: CLG and ORS Estimates)
Local Authority
Annual OAN
CLG Published Estimate
September 2017
Updated Estimate based upon March 2018
Affordability and 2016 based SNPP
Updated Estimate based upon March 2018
Affordability, and 2016 based ONS
household projections
Barnet 4,126 3,439 2,683
Brent 2,855 1,914 1,376
19 Individual borough vacancy and second home rates can be found in their respective SHMA reports.
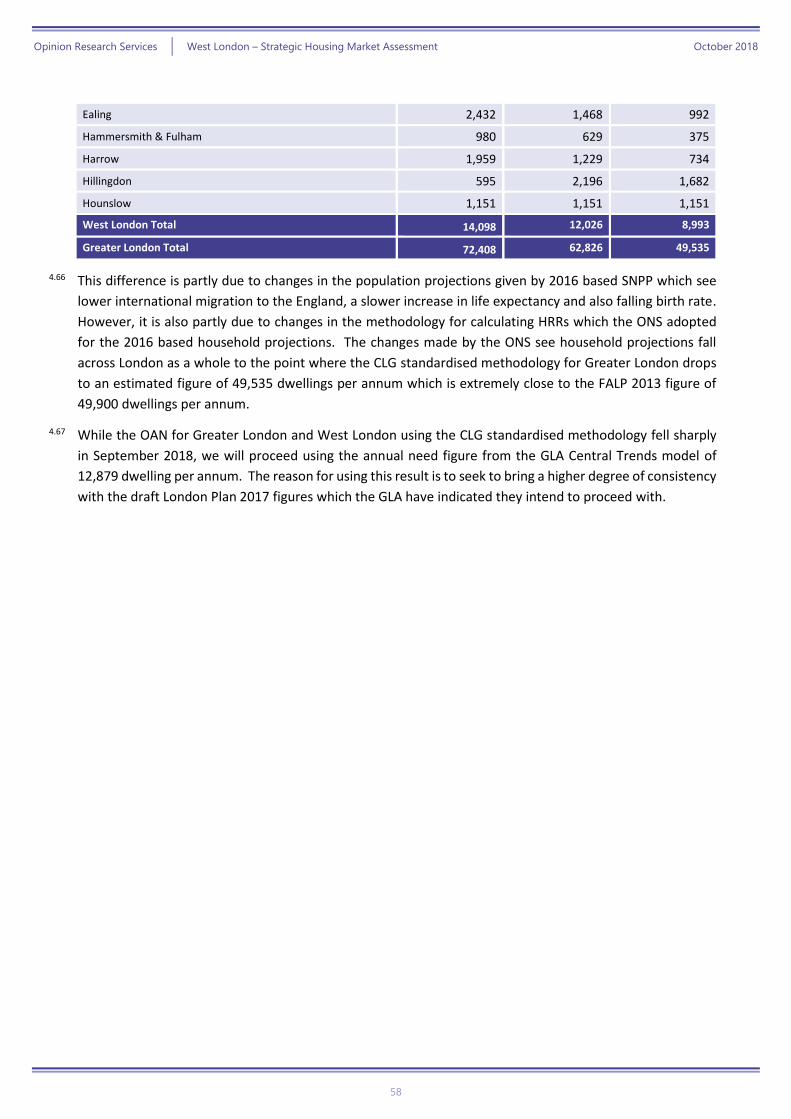
Opinion Research Services | West London – Strategic Housing Market Assessment October 2018
58
Ealing 2,432 1,468 992
Hammersmith & Fulham 980 629 375
Harrow 1,959 1,229 734
Hillingdon 595 2,196 1,682
Hounslow 1,151 1,151 1,151
West London Total 14,098 12,026 8,993
Greater London Total 72,408 62,826 49,535
4.66 This difference is partly due to changes in the population projections given by 2016 based SNPP which see
lower international migration to the England, a slower increase in life expectancy and also falling birth rate.
However, it is also partly due to changes in the methodology for calculating HRRs which the ONS adopted
for the 2016 based household projections. The changes made by the ONS see household projections fall
across London as a whole to the point where the CLG standardised methodology for Greater London drops
to an estimated figure of 49,535 dwellings per annum which is extremely close to the FALP 2013 figure of
49,900 dwellings per annum.
4.67 While the OAN for Greater London and West London using the CLG standardised methodology fell sharply
in September 2018, we will proceed using the annual need figure from the GLA Central Trends model of
12,879 dwelling per annum. The reason for using this result is to seek to bring a higher degree of consistency
with the draft London Plan 2017 figures which the GLA have indicated they intend to proceed with.
Opinion Research Services | West London – Strategic Housing Market Assessment October 2018
59
5. Affordable Housing Need Identifying households who cannot afford market housing
Introduction
5.1 This chapter considers the need for affordable housing, taking into account homeless households, concealed
households, overcrowded households and other households living in unsuitable housing that cannot afford
their own home. Newly forming households are then considered. It also provides initial estimates of the
size mix of affordable housing required.
5.2 Demographic projections provide the basis for identifying the Objectively Assessed Need for all types of
housing, including both market housing and affordable housing.
5.3 PPG notes that affordable housing need is based on households “who lack their own housing or live in
unsuitable housing and who cannot afford to meet their housing needs in the market” (paragraph 22) and
identifies a number of different types of household which may be included:
What types of households are considered in housing need?
The types of households to be considered in housing need are:
» Homeless households or insecure tenure (e.g. housing that is too expensive compared to
disposable income)
» Households where there is a mismatch between the housing needed and the actual
dwelling (e.g. overcrowded households)
» Households containing people with social or physical impairment or other specific needs
living in unsuitable dwellings (e.g. accessed via steps) which cannot be made suitable in-
situ
» Households that lack basic facilities (e.g. a bathroom or kitchen) and those subject to
major disrepair or that are unfit for habitation
» Households containing people with particular social needs (e.g. escaping harassment)
which cannot be resolved except through a move
Planning Practice Guidance (March 2014), ID 2a-023
5.4 PPG also suggests a number of data sources for assessing past trends and recording current estimates for
establishing the need for affordable housing (paragraph 24):
» Local authorities will hold data on the number of homeless households, those in temporary
accommodation and extent of overcrowding.
» The Census also provides data on concealed households and overcrowding which can be
compared with trends contained in the English Housing Survey.
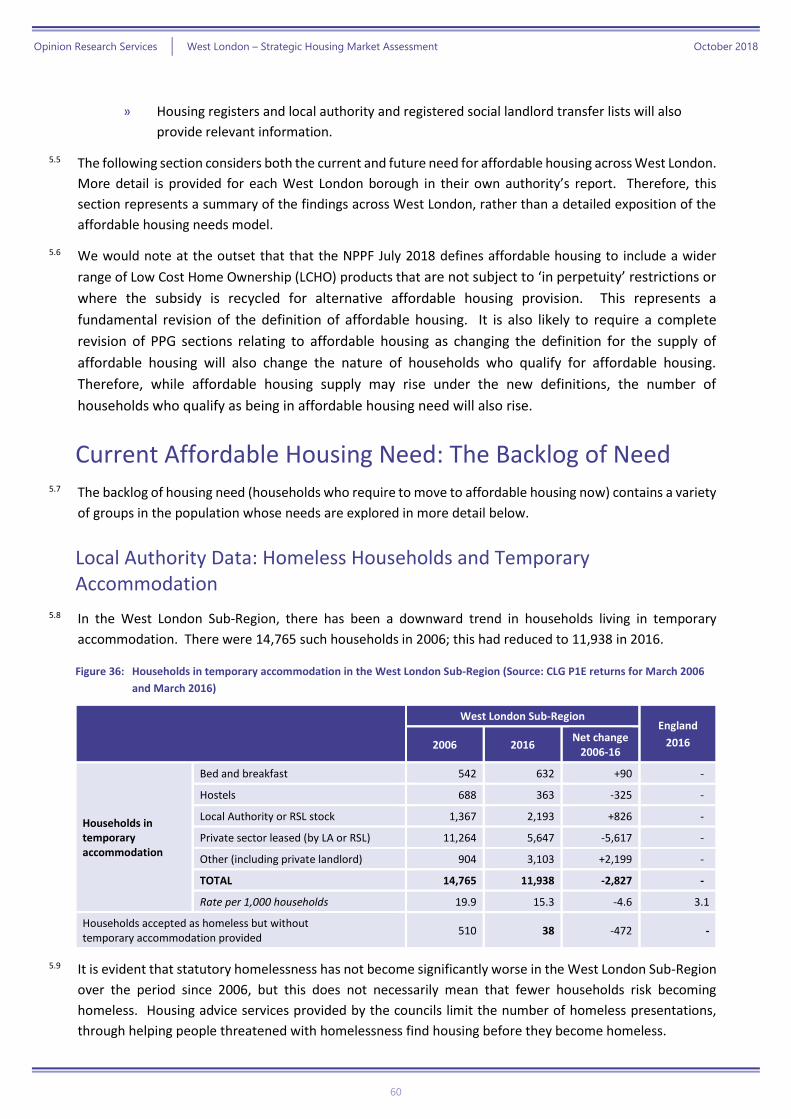
Opinion Research Services | West London – Strategic Housing Market Assessment October 2018
60
» Housing registers and local authority and registered social landlord transfer lists will also
provide relevant information.
5.5 The following section considers both the current and future need for affordable housing across West London.
More detail is provided for each West London borough in their own authority’s report. Therefore, this
section represents a summary of the findings across West London, rather than a detailed exposition of the
affordable housing needs model.
5.6 We would note at the outset that that the NPPF July 2018 defines affordable housing to include a wider
range of Low Cost Home Ownership (LCHO) products that are not subject to ‘in perpetuity’ restrictions or
where the subsidy is recycled for alternative affordable housing provision. This represents a
fundamental revision of the definition of affordable housing. It is also likely to require a complete
revision of PPG sections relating to affordable housing as changing the definition for the supply of
affordable housing will also change the nature of households who qualify for affordable housing.
Therefore, while affordable housing supply may rise under the new definitions, the number of
households who qualify as being in affordable housing need will also rise.
Current Affordable Housing Need: The Backlog of Need 5.7 The backlog of housing need (households who require to move to affordable housing now) contains a variety
of groups in the population whose needs are explored in more detail below.
Local Authority Data: Homeless Households and Temporary Accommodation
5.8 In the West London Sub-Region, there has been a downward trend in households living in temporary
accommodation. There were 14,765 such households in 2006; this had reduced to 11,938 in 2016.
Figure 36: Households in temporary accommodation in the West London Sub-Region (Source: CLG P1E returns for March 2006
and March 2016)
West London Sub-Region England
2016 2006 2016 Net change
2006-16
Households in temporary accommodation
Bed and breakfast 542 632 +90 -
Hostels 688 363 -325 -
Local Authority or RSL stock 1,367 2,193 +826 -
Private sector leased (by LA or RSL) 11,264 5,647 -5,617 -
Other (including private landlord) 904 3,103 +2,199 -
TOTAL 14,765 11,938 -2,827 -
Rate per 1,000 households 19.9 15.3 -4.6 3.1
Households accepted as homeless but without temporary accommodation provided
510 38 -472 -
5.9 It is evident that statutory homelessness has not become significantly worse in the West London Sub-Region
over the period since 2006, but this does not necessarily mean that fewer households risk becoming
homeless. Housing advice services provided by the councils limit the number of homeless presentations,
through helping people threatened with homelessness find housing before they become homeless.
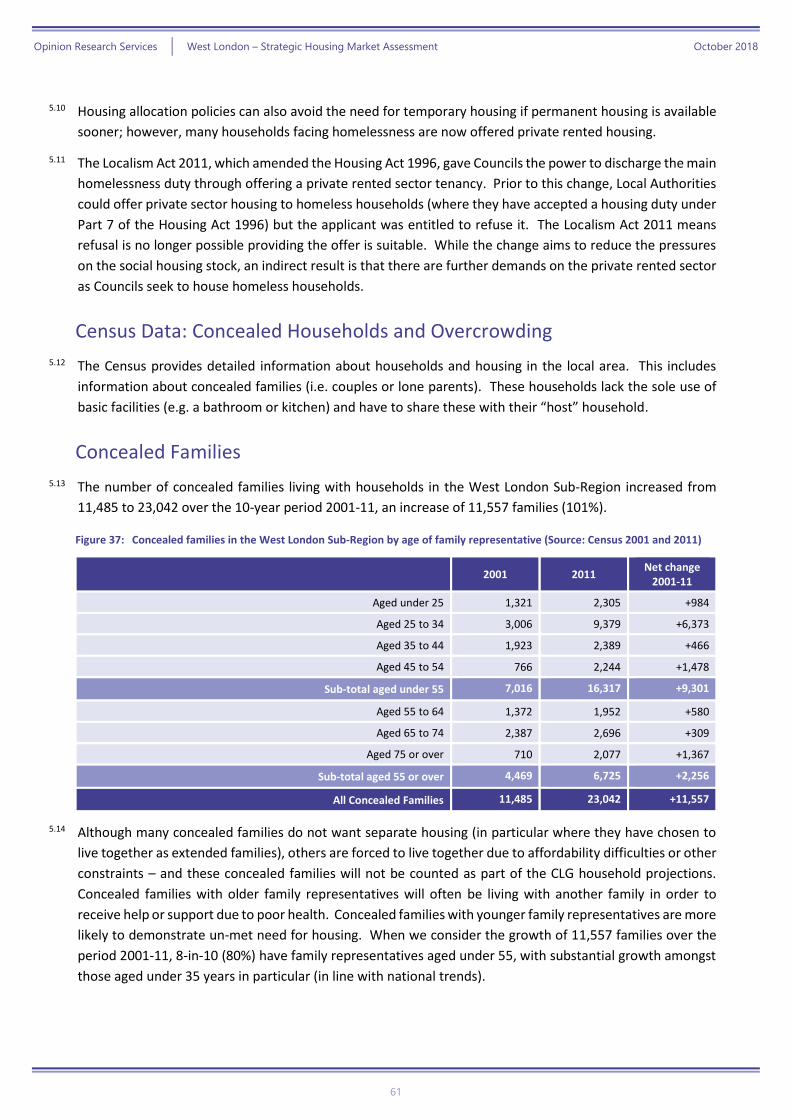
Opinion Research Services | West London – Strategic Housing Market Assessment October 2018
61
5.10 Housing allocation policies can also avoid the need for temporary housing if permanent housing is available
sooner; however, many households facing homelessness are now offered private rented housing.
5.11 The Localism Act 2011, which amended the Housing Act 1996, gave Councils the power to discharge the main
homelessness duty through offering a private rented sector tenancy. Prior to this change, Local Authorities
could offer private sector housing to homeless households (where they have accepted a housing duty under
Part 7 of the Housing Act 1996) but the applicant was entitled to refuse it. The Localism Act 2011 means
refusal is no longer possible providing the offer is suitable. While the change aims to reduce the pressures
on the social housing stock, an indirect result is that there are further demands on the private rented sector
as Councils seek to house homeless households.
Census Data: Concealed Households and Overcrowding
5.12 The Census provides detailed information about households and housing in the local area. This includes
information about concealed families (i.e. couples or lone parents). These households lack the sole use of
basic facilities (e.g. a bathroom or kitchen) and have to share these with their “host” household.
Concealed Families
5.13 The number of concealed families living with households in the West London Sub-Region increased from
11,485 to 23,042 over the 10-year period 2001-11, an increase of 11,557 families (101%).
Figure 37: Concealed families in the West London Sub-Region by age of family representative (Source: Census 2001 and 2011)
2001 2011 Net change
2001-11
Aged under 25 1,321 2,305 +984
Aged 25 to 34 3,006 9,379 +6,373
Aged 35 to 44 1,923 2,389 +466
Aged 45 to 54 766 2,244 +1,478
Sub-total aged under 55 7,016 16,317 +9,301
Aged 55 to 64 1,372 1,952 +580
Aged 65 to 74 2,387 2,696 +309
Aged 75 or over 710 2,077 +1,367
Sub-total aged 55 or over 4,469 6,725 +2,256
All Concealed Families 11,485 23,042 +11,557
5.14 Although many concealed families do not want separate housing (in particular where they have chosen to
live together as extended families), others are forced to live together due to affordability difficulties or other
constraints – and these concealed families will not be counted as part of the CLG household projections.
Concealed families with older family representatives will often be living with another family in order to
receive help or support due to poor health. Concealed families with younger family representatives are more
likely to demonstrate un-met need for housing. When we consider the growth of 11,557 families over the
period 2001-11, 8-in-10 (80%) have family representatives aged under 55, with substantial growth amongst
those aged under 35 years in particular (in line with national trends).
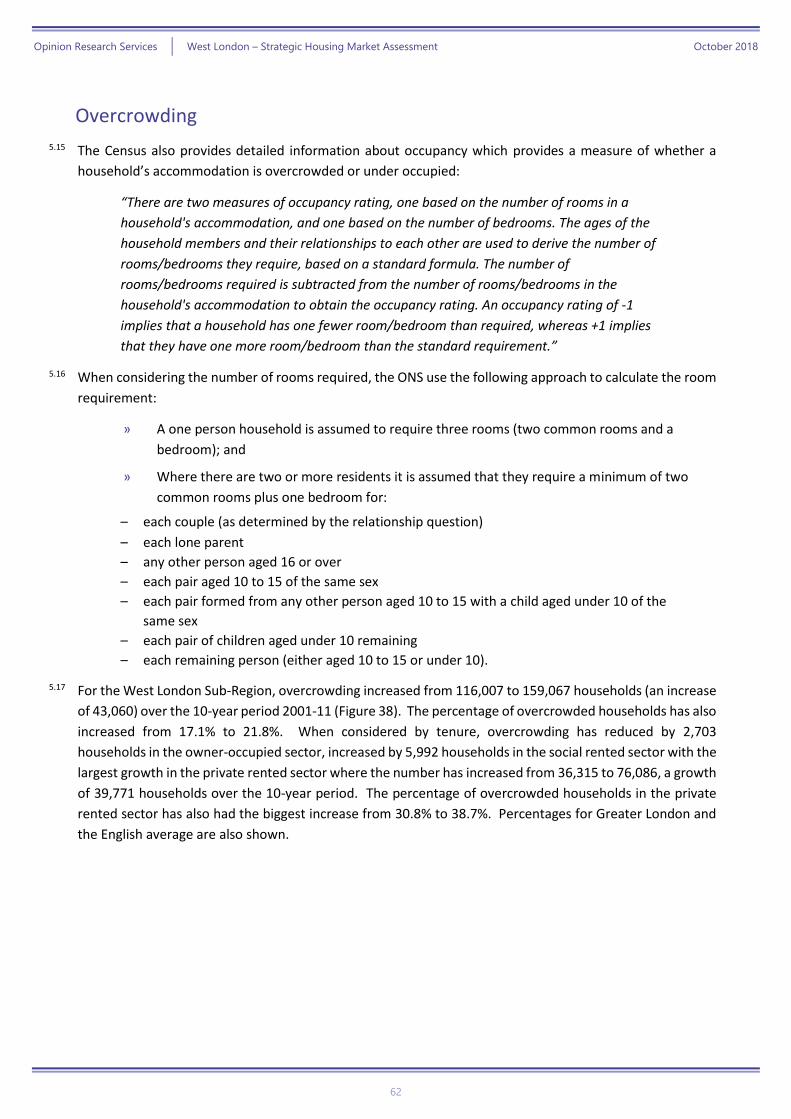
Opinion Research Services | West London – Strategic Housing Market Assessment October 2018
62
Overcrowding
5.15 The Census also provides detailed information about occupancy which provides a measure of whether a
household’s accommodation is overcrowded or under occupied:
“There are two measures of occupancy rating, one based on the number of rooms in a
household's accommodation, and one based on the number of bedrooms. The ages of the
household members and their relationships to each other are used to derive the number of
rooms/bedrooms they require, based on a standard formula. The number of
rooms/bedrooms required is subtracted from the number of rooms/bedrooms in the
household's accommodation to obtain the occupancy rating. An occupancy rating of -1
implies that a household has one fewer room/bedroom than required, whereas +1 implies
that they have one more room/bedroom than the standard requirement.”
5.16 When considering the number of rooms required, the ONS use the following approach to calculate the room
requirement:
» A one person household is assumed to require three rooms (two common rooms and a
bedroom); and
» Where there are two or more residents it is assumed that they require a minimum of two
common rooms plus one bedroom for:
– each couple (as determined by the relationship question)
– each lone parent
– any other person aged 16 or over
– each pair aged 10 to 15 of the same sex
– each pair formed from any other person aged 10 to 15 with a child aged under 10 of the
same sex
– each pair of children aged under 10 remaining
– each remaining person (either aged 10 to 15 or under 10).
5.17 For the West London Sub-Region, overcrowding increased from 116,007 to 159,067 households (an increase
of 43,060) over the 10-year period 2001-11 (Figure 38). The percentage of overcrowded households has also
increased from 17.1% to 21.8%. When considered by tenure, overcrowding has reduced by 2,703
households in the owner-occupied sector, increased by 5,992 households in the social rented sector with the
largest growth in the private rented sector where the number has increased from 36,315 to 76,086, a growth
of 39,771 households over the 10-year period. The percentage of overcrowded households in the private
rented sector has also had the biggest increase from 30.8% to 38.7%. Percentages for Greater London and
the English average are also shown.
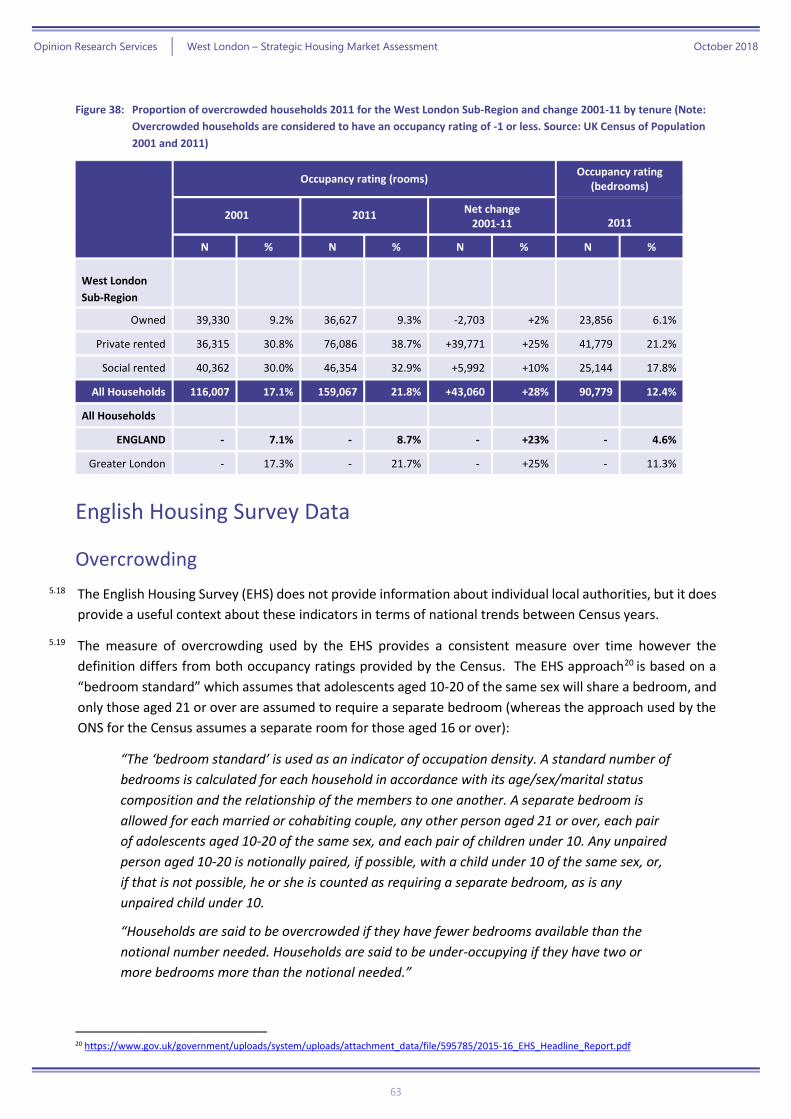
Opinion Research Services | West London – Strategic Housing Market Assessment October 2018
63
Figure 38: Proportion of overcrowded households 2011 for the West London Sub-Region and change 2001-11 by tenure (Note:
Overcrowded households are considered to have an occupancy rating of -1 or less. Source: UK Census of Population
2001 and 2011)
Occupancy rating (rooms) Occupancy rating
(bedrooms)
2001 2011 Net change
2001-11 2011
N % N % N % N %
West London
Sub-Region
Owned 39,330 9.2% 36,627 9.3% -2,703 +2% 23,856 6.1%
Private rented 36,315 30.8% 76,086 38.7% +39,771 +25% 41,779 21.2%
Social rented 40,362 30.0% 46,354 32.9% +5,992 +10% 25,144 17.8%
All Households 116,007 17.1% 159,067 21.8% +43,060 +28% 90,779 12.4%
All Households
ENGLAND - 7.1% - 8.7% - +23% - 4.6%
Greater London - 17.3% - 21.7% - +25% - 11.3%
English Housing Survey Data
Overcrowding
5.18 The English Housing Survey (EHS) does not provide information about individual local authorities, but it does
provide a useful context about these indicators in terms of national trends between Census years.
5.19 The measure of overcrowding used by the EHS provides a consistent measure over time however the
definition differs from both occupancy ratings provided by the Census. The EHS approach20 is based on a
“bedroom standard” which assumes that adolescents aged 10-20 of the same sex will share a bedroom, and
only those aged 21 or over are assumed to require a separate bedroom (whereas the approach used by the
ONS for the Census assumes a separate room for those aged 16 or over):
“The ‘bedroom standard’ is used as an indicator of occupation density. A standard number of
bedrooms is calculated for each household in accordance with its age/sex/marital status
composition and the relationship of the members to one another. A separate bedroom is
allowed for each married or cohabiting couple, any other person aged 21 or over, each pair
of adolescents aged 10-20 of the same sex, and each pair of children under 10. Any unpaired
person aged 10-20 is notionally paired, if possible, with a child under 10 of the same sex, or,
if that is not possible, he or she is counted as requiring a separate bedroom, as is any
unpaired child under 10.
“Households are said to be overcrowded if they have fewer bedrooms available than the
notional number needed. Households are said to be under-occupying if they have two or
more bedrooms more than the notional needed.”
20 https://www.gov.uk/government/uploads/system/uploads/attachment_data/file/595785/2015-16_EHS_Headline_Report.pdf
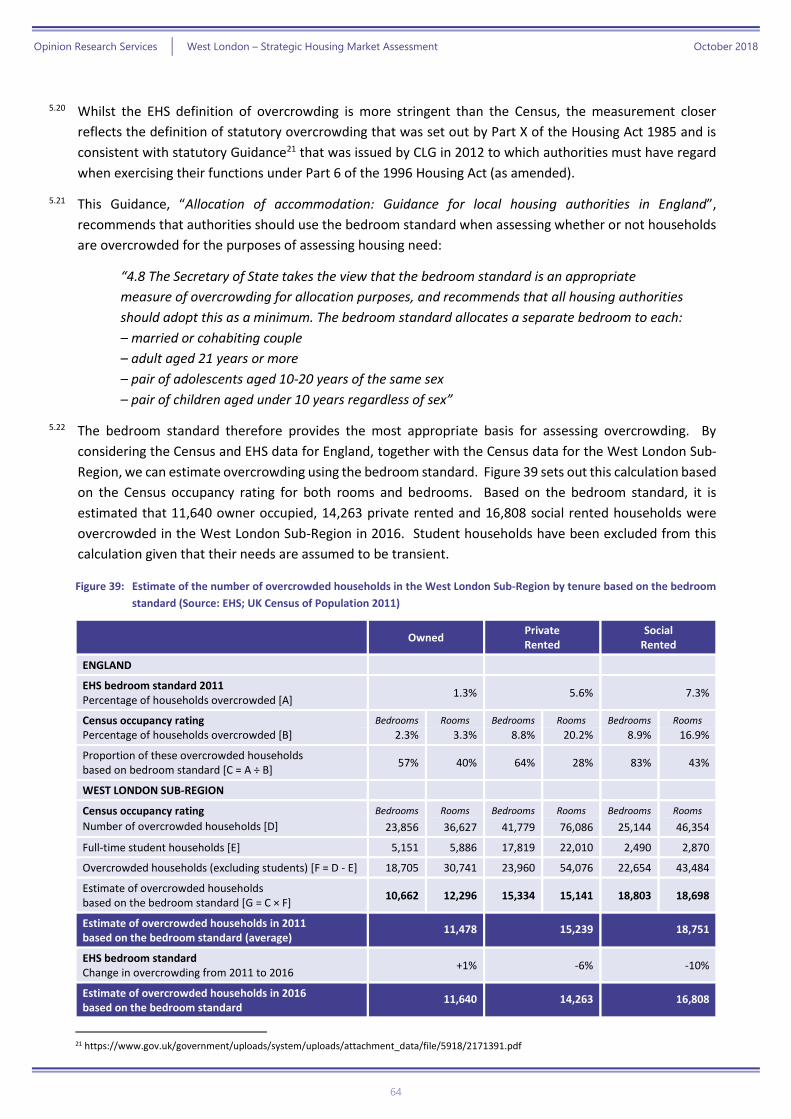
Opinion Research Services | West London – Strategic Housing Market Assessment October 2018
64
5.20 Whilst the EHS definition of overcrowding is more stringent than the Census, the measurement closer
reflects the definition of statutory overcrowding that was set out by Part X of the Housing Act 1985 and is
consistent with statutory Guidance21 that was issued by CLG in 2012 to which authorities must have regard
when exercising their functions under Part 6 of the 1996 Housing Act (as amended).
5.21 This Guidance, “Allocation of accommodation: Guidance for local housing authorities in England”,
recommends that authorities should use the bedroom standard when assessing whether or not households
are overcrowded for the purposes of assessing housing need:
“4.8 The Secretary of State takes the view that the bedroom standard is an appropriate
measure of overcrowding for allocation purposes, and recommends that all housing authorities
should adopt this as a minimum. The bedroom standard allocates a separate bedroom to each:
– married or cohabiting couple
– adult aged 21 years or more
– pair of adolescents aged 10-20 years of the same sex
– pair of children aged under 10 years regardless of sex”
5.22 The bedroom standard therefore provides the most appropriate basis for assessing overcrowding. By
considering the Census and EHS data for England, together with the Census data for the West London Sub-
Region, we can estimate overcrowding using the bedroom standard. Figure 39 sets out this calculation based
on the Census occupancy rating for both rooms and bedrooms. Based on the bedroom standard, it is
estimated that 11,640 owner occupied, 14,263 private rented and 16,808 social rented households were
overcrowded in the West London Sub-Region in 2016. Student households have been excluded from this
calculation given that their needs are assumed to be transient.
Figure 39: Estimate of the number of overcrowded households in the West London Sub-Region by tenure based on the bedroom
standard (Source: EHS; UK Census of Population 2011)
Owned Private Rented
Social Rented
ENGLAND
EHS bedroom standard 2011 Percentage of households overcrowded [A]
1.3% 5.6% 7.3%
Census occupancy rating Bedrooms Rooms Bedrooms Rooms Bedrooms Rooms
Percentage of households overcrowded [B] 2.3% 3.3% 8.8% 20.2% 8.9% 16.9%
Proportion of these overcrowded households based on bedroom standard [C = A ÷ B]
57% 40% 64% 28% 83% 43%
WEST LONDON SUB-REGION
Census occupancy rating Bedrooms Rooms Bedrooms Rooms Bedrooms Rooms
Number of overcrowded households [D] 23,856 36,627 41,779 76,086 25,144 46,354
Full-time student households [E] 5,151 5,886 17,819 22,010 2,490 2,870
Overcrowded households (excluding students) [F = D - E] 18,705 30,741 23,960 54,076 22,654 43,484
Estimate of overcrowded households based on the bedroom standard [G = C × F]
10,662 12,296 15,334 15,141 18,803 18,698
Estimate of overcrowded households in 2011 based on the bedroom standard (average)
11,478 15,239 18,751
EHS bedroom standard Change in overcrowding from 2011 to 2016
+1% -6% -10%
Estimate of overcrowded households in 2016 based on the bedroom standard
11,640 14,263 16,808
21 https://www.gov.uk/government/uploads/system/uploads/attachment_data/file/5918/2171391.pdf
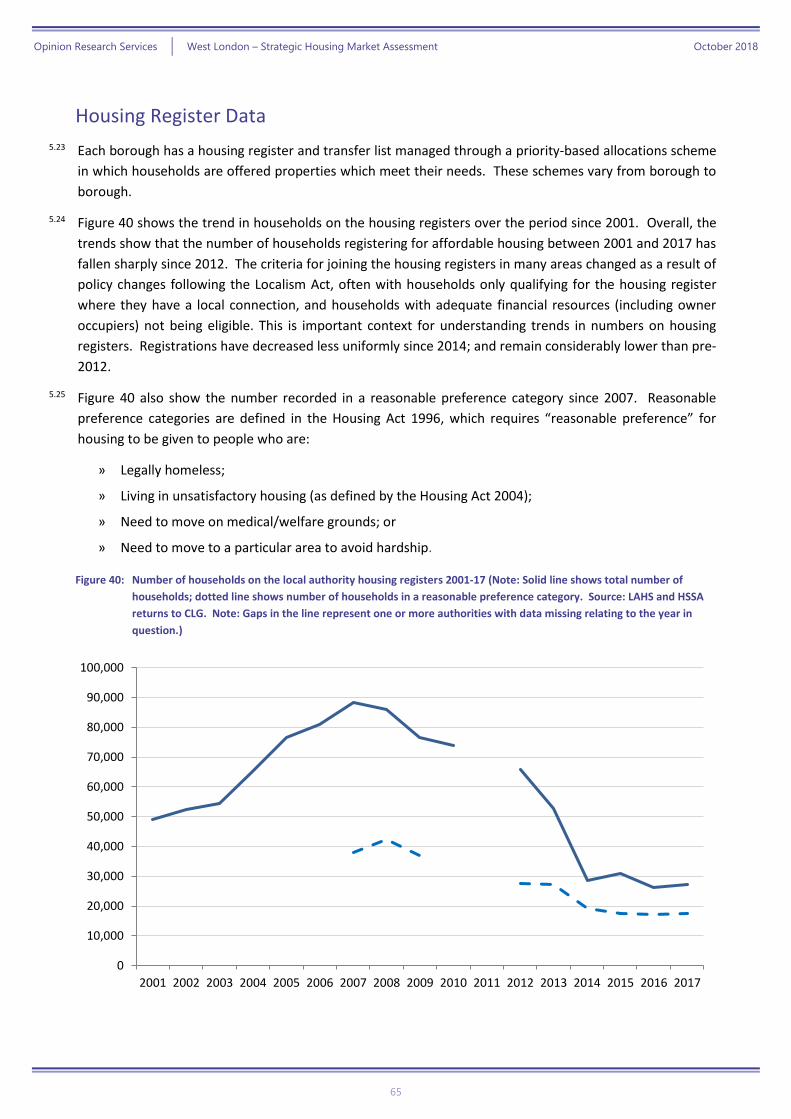
Opinion Research Services | West London – Strategic Housing Market Assessment October 2018
65
Housing Register Data
5.23 Each borough has a housing register and transfer list managed through a priority-based allocations scheme
in which households are offered properties which meet their needs. These schemes vary from borough to
borough.
5.24 Figure 40 shows the trend in households on the housing registers over the period since 2001. Overall, the
trends show that the number of households registering for affordable housing between 2001 and 2017 has
fallen sharply since 2012. The criteria for joining the housing registers in many areas changed as a result of
policy changes following the Localism Act, often with households only qualifying for the housing register
where they have a local connection, and households with adequate financial resources (including owner
occupiers) not being eligible. This is important context for understanding trends in numbers on housing
registers. Registrations have decreased less uniformly since 2014; and remain considerably lower than pre-
2012.
5.25 Figure 40 also show the number recorded in a reasonable preference category since 2007. Reasonable
preference categories are defined in the Housing Act 1996, which requires “reasonable preference” for
housing to be given to people who are:
» Legally homeless;
» Living in unsatisfactory housing (as defined by the Housing Act 2004);
» Need to move on medical/welfare grounds; or
» Need to move to a particular area to avoid hardship.
Figure 40: Number of households on the local authority housing registers 2001-17 (Note: Solid line shows total number of
households; dotted line shows number of households in a reasonable preference category. Source: LAHS and HSSA
returns to CLG. Note: Gaps in the line represent one or more authorities with data missing relating to the year in
question.)
0
10,000
20,000
30,000
40,000
50,000
60,000
70,000
80,000
90,000
100,000
2001 2002 2003 2004 2005 2006 2007 2008 2009 2010 2011 2012 2013 2014 2015 2016 2017
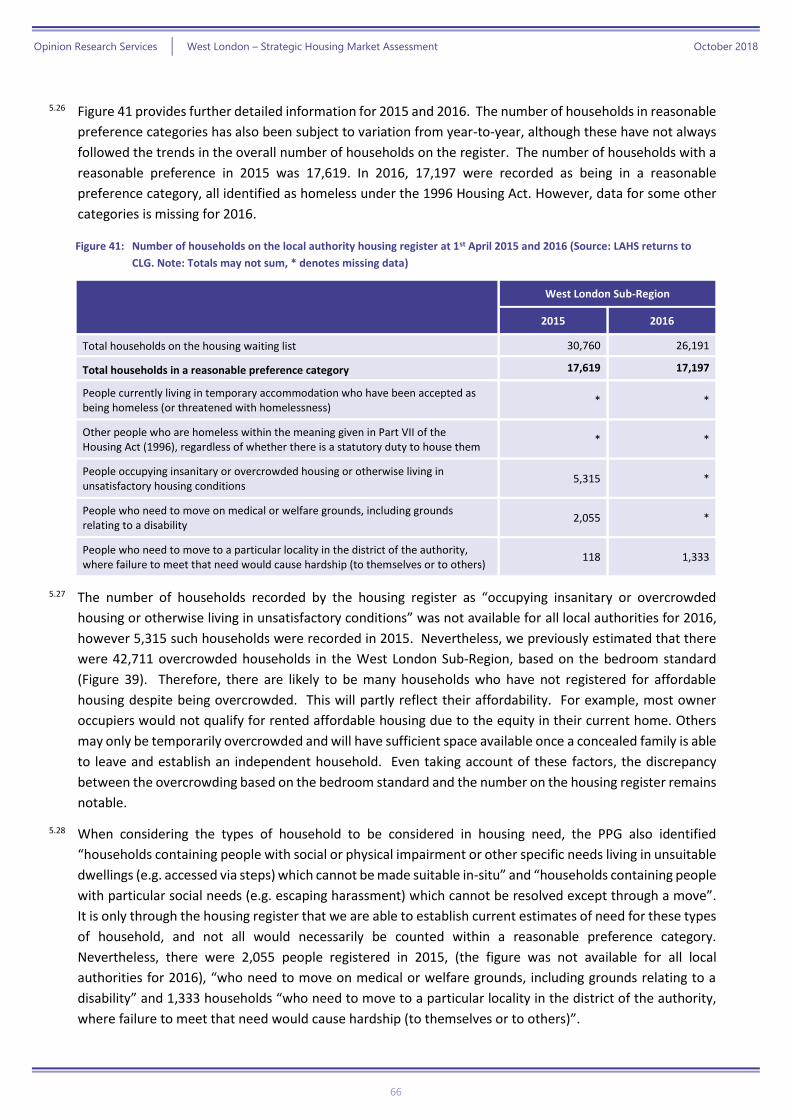
Opinion Research Services | West London – Strategic Housing Market Assessment October 2018
66
5.26 Figure 41 provides further detailed information for 2015 and 2016. The number of households in reasonable
preference categories has also been subject to variation from year-to-year, although these have not always
followed the trends in the overall number of households on the register. The number of households with a
reasonable preference in 2015 was 17,619. In 2016, 17,197 were recorded as being in a reasonable
preference category, all identified as homeless under the 1996 Housing Act. However, data for some other
categories is missing for 2016.
Figure 41: Number of households on the local authority housing register at 1st April 2015 and 2016 (Source: LAHS returns to
CLG. Note: Totals may not sum, * denotes missing data)
West London Sub-Region
2015 2016
Total households on the housing waiting list 30,760 26,191
Total households in a reasonable preference category 17,619 17,197
People currently living in temporary accommodation who have been accepted as being homeless (or threatened with homelessness)
* *
Other people who are homeless within the meaning given in Part VII of the Housing Act (1996), regardless of whether there is a statutory duty to house them
* *
People occupying insanitary or overcrowded housing or otherwise living in unsatisfactory housing conditions
5,315 *
People who need to move on medical or welfare grounds, including grounds relating to a disability
2,055 *
People who need to move to a particular locality in the district of the authority, where failure to meet that need would cause hardship (to themselves or to others)
118 1,333
5.27 The number of households recorded by the housing register as “occupying insanitary or overcrowded
housing or otherwise living in unsatisfactory conditions” was not available for all local authorities for 2016,
however 5,315 such households were recorded in 2015. Nevertheless, we previously estimated that there
were 42,711 overcrowded households in the West London Sub-Region, based on the bedroom standard
(Figure 39). Therefore, there are likely to be many households who have not registered for affordable
housing despite being overcrowded. This will partly reflect their affordability. For example, most owner
occupiers would not qualify for rented affordable housing due to the equity in their current home. Others
may only be temporarily overcrowded and will have sufficient space available once a concealed family is able
to leave and establish an independent household. Even taking account of these factors, the discrepancy
between the overcrowding based on the bedroom standard and the number on the housing register remains
notable.
5.28 When considering the types of household to be considered in housing need, the PPG also identified
“households containing people with social or physical impairment or other specific needs living in unsuitable
dwellings (e.g. accessed via steps) which cannot be made suitable in-situ” and “households containing people
with particular social needs (e.g. escaping harassment) which cannot be resolved except through a move”.
It is only through the housing register that we are able to establish current estimates of need for these types
of household, and not all would necessarily be counted within a reasonable preference category.
Nevertheless, there were 2,055 people registered in 2015, (the figure was not available for all local
authorities for 2016), “who need to move on medical or welfare grounds, including grounds relating to a
disability” and 1,333 households “who need to move to a particular locality in the district of the authority,
where failure to meet that need would cause hardship (to themselves or to others)”.
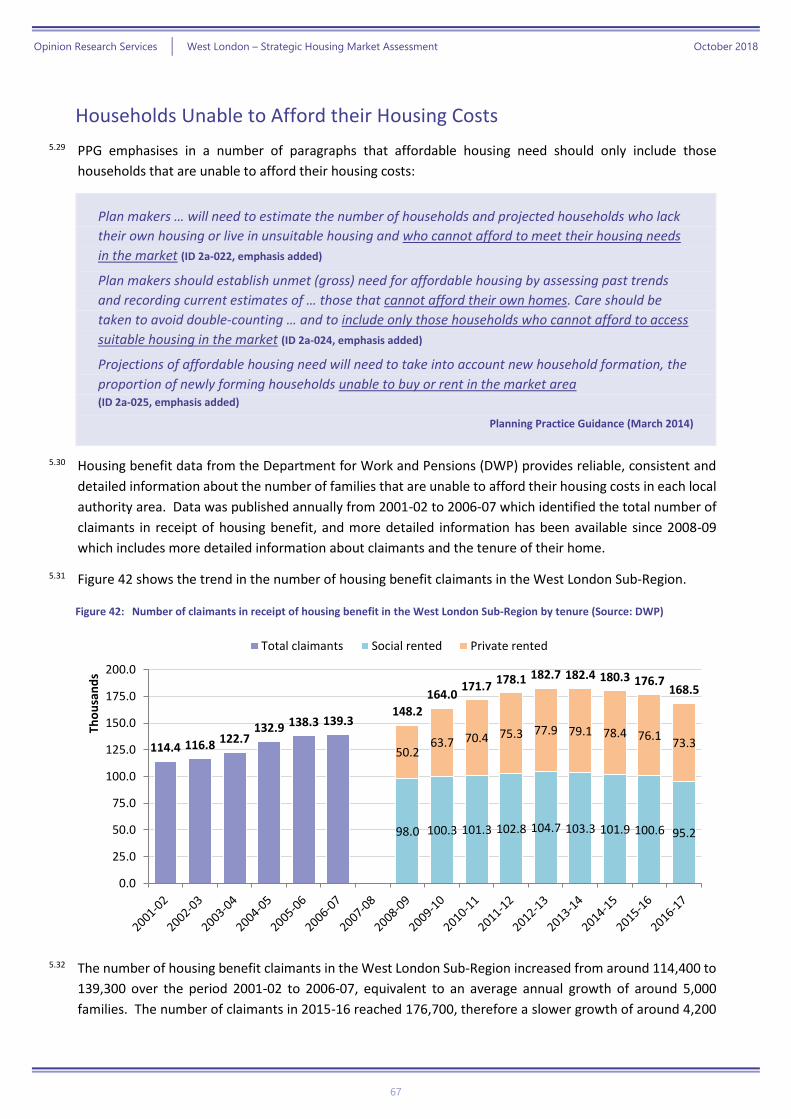
Opinion Research Services | West London – Strategic Housing Market Assessment October 2018
67
Households Unable to Afford their Housing Costs
5.29 PPG emphasises in a number of paragraphs that affordable housing need should only include those
households that are unable to afford their housing costs:
Plan makers … will need to estimate the number of households and projected households who lack
their own housing or live in unsuitable housing and who cannot afford to meet their housing needs
in the market (ID 2a-022, emphasis added)
Plan makers should establish unmet (gross) need for affordable housing by assessing past trends
and recording current estimates of … those that cannot afford their own homes. Care should be
taken to avoid double-counting … and to include only those households who cannot afford to access
suitable housing in the market (ID 2a-024, emphasis added)
Projections of affordable housing need will need to take into account new household formation, the
proportion of newly forming households unable to buy or rent in the market area (ID 2a-025, emphasis added)
Planning Practice Guidance (March 2014)
5.30 Housing benefit data from the Department for Work and Pensions (DWP) provides reliable, consistent and
detailed information about the number of families that are unable to afford their housing costs in each local
authority area. Data was published annually from 2001-02 to 2006-07 which identified the total number of
claimants in receipt of housing benefit, and more detailed information has been available since 2008-09
which includes more detailed information about claimants and the tenure of their home.
5.31 Figure 42 shows the trend in the number of housing benefit claimants in the West London Sub-Region.
Figure 42: Number of claimants in receipt of housing benefit in the West London Sub-Region by tenure (Source: DWP)
5.32 The number of housing benefit claimants in the West London Sub-Region increased from around 114,400 to
139,300 over the period 2001-02 to 2006-07, equivalent to an average annual growth of around 5,000
families. The number of claimants in 2015-16 reached 176,700, therefore a slower growth of around 4,200
98.0 100.3 101.3 102.8 104.7 103.3 101.9 100.6 95.2
50.263.7 70.4 75.3 77.9 79.1 78.4 76.1
73.3114.4 116.8 122.7132.9 138.3 139.3
148.2
164.0171.7
178.1 182.7 182.4 180.3 176.7168.5
0.0
25.0
50.0
75.0
100.0
125.0
150.0
175.0
200.0
Tho
usa
nd
s
Total claimants Social rented Private rented
Opinion Research Services | West London – Strategic Housing Market Assessment October 2018
68
families each year on average over the period from 2006-07. The largest growth was experienced between
2008-09 and 2009-10 when the number of claimants increased by about 15,800 families.
5.33 Considering the information on tenure, it is evident that the number of claimants in social rented housing
increased from around 98,000 to 100,600 over the period 2008-09 to 2015-16 – an increase of around 2,600
families (3%); however, over the same period the number of claimants in private rented housing increased
from 50,200 to 76,100 families – an increase of 25,900 families (52%).
5.34 The information published by DWP provides the detailed information needed for understanding the number
of households unable to afford their housing costs. Of course, there will be other households occupying
affordable housing who do not need housing benefit to pay discounted social or affordable rents but who
would not be able to afford market rents. Similarly, there will be others who are not claiming housing benefit
support as they have stayed living with parents or other family or friends and not formed independent
households. However, providing that appropriate adjustments are made to take account of these
exceptions, the DWP data provides the most reliable basis for establishing the number of households unable
to afford their housing costs and estimating affordable housing need.
Establishing Affordable Housing Need
5.35 In establishing the Objectively Assessed Need for affordable housing, it is necessary to draw together the full
range of information that has already been considered in this report. PPG sets out the framework for this
calculation, considering both the current unmet housing need and the projected future housing need in the
context of the existing affordable housing stock:
How should affordable housing need be calculated?
This calculation involves adding together the current unmet housing need and the projected future
housing need and then subtracting this from the current supply of affordable housing stock.
Planning Practice Guidance (March 2014), ID 2a-022
Establishing the Current Unmet Need for Affordable Housing
5.36 Households assumed to be unable to afford housing include:
» All households that are currently homeless;
» All those currently housed in temporary accommodation; and
» People in a reasonable preference category on the housing register, where their needs have
not already been counted.
5.37 Given this context, our analysis counts the needs of all of these households when establishing the Objectively
Assessed Need for affordable housing at a base date of 2016. All households who reside in bed and breakfast
and private sector temporary accommodation are assumed to require affordable housing and these
dwellings return to the private sector, with the exception of the bed and breakfast accommodation which
we do not assume provides private sector accommodation. Therefore, temporary accommodation makes
no contribution to the supply of affordable housing.
5.38 Only around one-in-ten households currently living in overcrowded housing (based on the bedroom
standard) are registered in a reasonable preference category, which will partly reflect their affordability. It
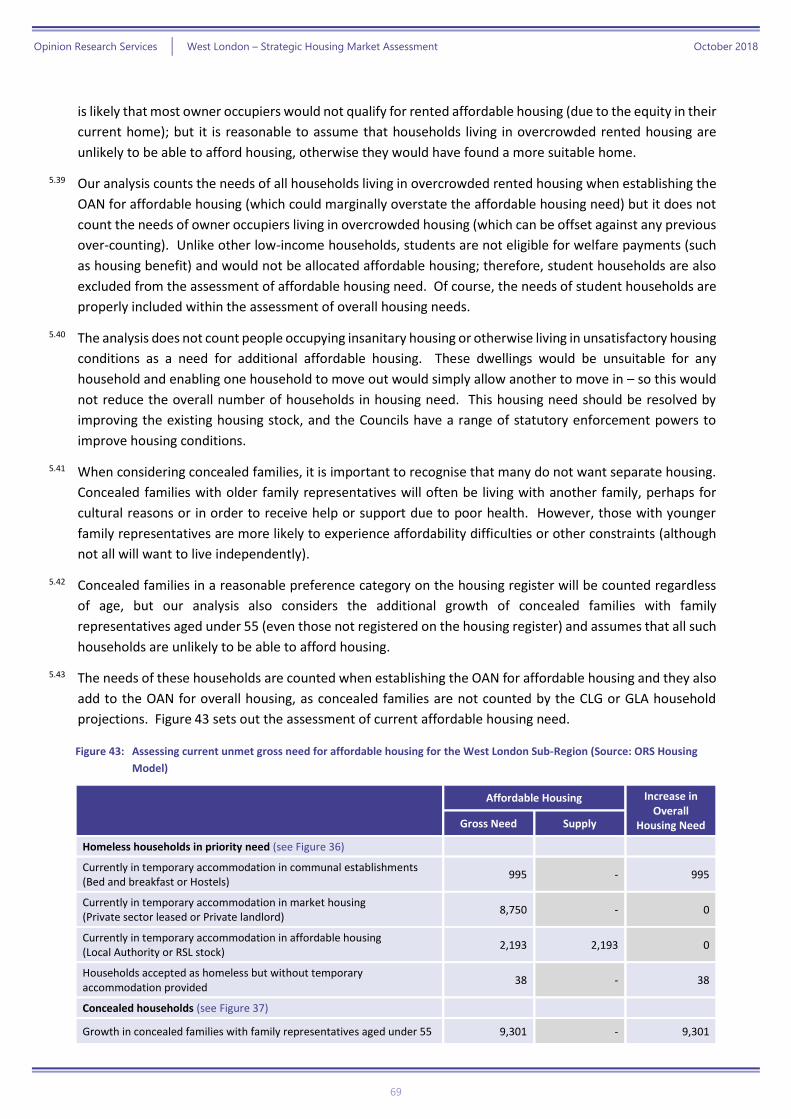
Opinion Research Services | West London – Strategic Housing Market Assessment October 2018
69
is likely that most owner occupiers would not qualify for rented affordable housing (due to the equity in their
current home); but it is reasonable to assume that households living in overcrowded rented housing are
unlikely to be able to afford housing, otherwise they would have found a more suitable home.
5.39 Our analysis counts the needs of all households living in overcrowded rented housing when establishing the
OAN for affordable housing (which could marginally overstate the affordable housing need) but it does not
count the needs of owner occupiers living in overcrowded housing (which can be offset against any previous
over-counting). Unlike other low-income households, students are not eligible for welfare payments (such
as housing benefit) and would not be allocated affordable housing; therefore, student households are also
excluded from the assessment of affordable housing need. Of course, the needs of student households are
properly included within the assessment of overall housing needs.
5.40 The analysis does not count people occupying insanitary housing or otherwise living in unsatisfactory housing
conditions as a need for additional affordable housing. These dwellings would be unsuitable for any
household and enabling one household to move out would simply allow another to move in – so this would
not reduce the overall number of households in housing need. This housing need should be resolved by
improving the existing housing stock, and the Councils have a range of statutory enforcement powers to
improve housing conditions.
5.41 When considering concealed families, it is important to recognise that many do not want separate housing.
Concealed families with older family representatives will often be living with another family, perhaps for
cultural reasons or in order to receive help or support due to poor health. However, those with younger
family representatives are more likely to experience affordability difficulties or other constraints (although
not all will want to live independently).
5.42 Concealed families in a reasonable preference category on the housing register will be counted regardless
of age, but our analysis also considers the additional growth of concealed families with family
representatives aged under 55 (even those not registered on the housing register) and assumes that all such
households are unlikely to be able to afford housing.
5.43 The needs of these households are counted when establishing the OAN for affordable housing and they also
add to the OAN for overall housing, as concealed families are not counted by the CLG or GLA household
projections. Figure 43 sets out the assessment of current affordable housing need.
Figure 43: Assessing current unmet gross need for affordable housing for the West London Sub-Region (Source: ORS Housing
Model)
Affordable Housing Increase in
Overall Housing Need Gross Need Supply
Homeless households in priority need (see Figure 36)
Currently in temporary accommodation in communal establishments (Bed and breakfast or Hostels)
995 - 995
Currently in temporary accommodation in market housing (Private sector leased or Private landlord)
8,750 - 0
Currently in temporary accommodation in affordable housing (Local Authority or RSL stock)
2,193 2,193 0
Households accepted as homeless but without temporary accommodation provided
38 - 38
Concealed households (see Figure 37)
Growth in concealed families with family representatives aged under 55 9,301 - 9,301
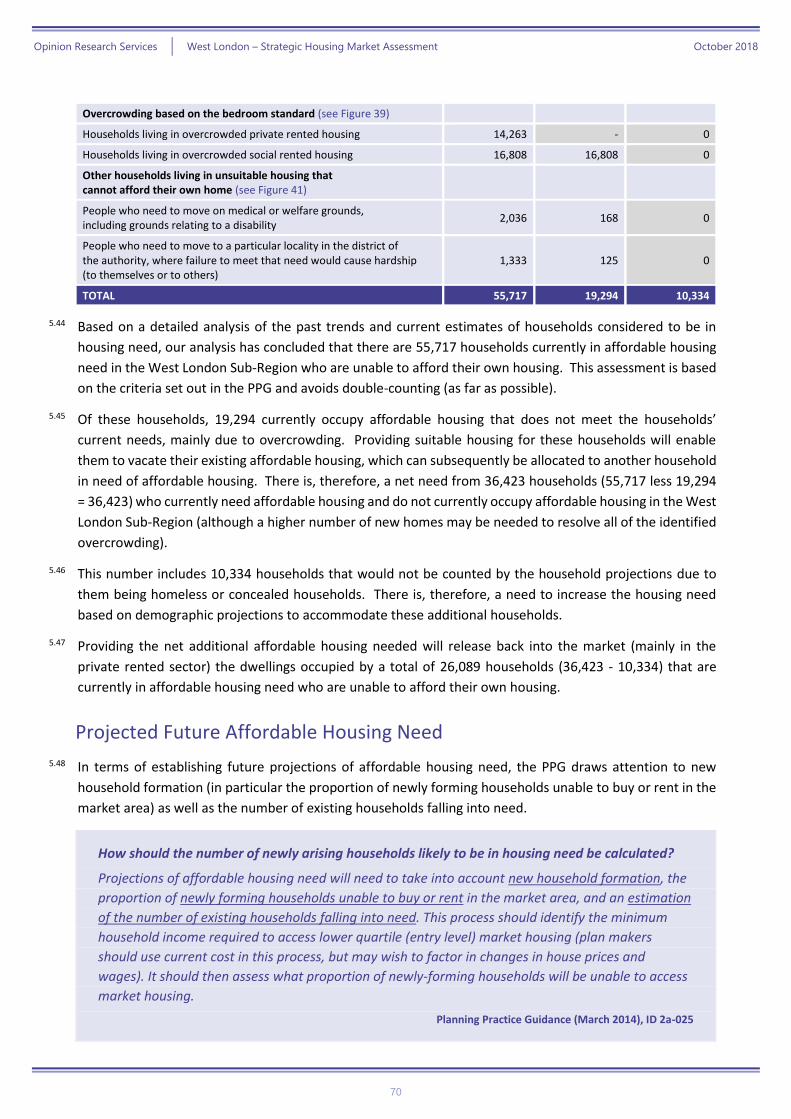
Opinion Research Services | West London – Strategic Housing Market Assessment October 2018
70
Overcrowding based on the bedroom standard (see Figure 39)
Households living in overcrowded private rented housing 14,263 - 0
Households living in overcrowded social rented housing 16,808 16,808 0
Other households living in unsuitable housing that cannot afford their own home (see Figure 41)
People who need to move on medical or welfare grounds, including grounds relating to a disability
2,036 168 0
People who need to move to a particular locality in the district of the authority, where failure to meet that need would cause hardship (to themselves or to others)
1,333 125 0
TOTAL 55,717 19,294 10,334
5.44 Based on a detailed analysis of the past trends and current estimates of households considered to be in
housing need, our analysis has concluded that there are 55,717 households currently in affordable housing
need in the West London Sub-Region who are unable to afford their own housing. This assessment is based
on the criteria set out in the PPG and avoids double-counting (as far as possible).
5.45 Of these households, 19,294 currently occupy affordable housing that does not meet the households’
current needs, mainly due to overcrowding. Providing suitable housing for these households will enable
them to vacate their existing affordable housing, which can subsequently be allocated to another household
in need of affordable housing. There is, therefore, a net need from 36,423 households (55,717 less 19,294
= 36,423) who currently need affordable housing and do not currently occupy affordable housing in the West
London Sub-Region (although a higher number of new homes may be needed to resolve all of the identified
overcrowding).
5.46 This number includes 10,334 households that would not be counted by the household projections due to
them being homeless or concealed households. There is, therefore, a need to increase the housing need
based on demographic projections to accommodate these additional households.
5.47 Providing the net additional affordable housing needed will release back into the market (mainly in the
private rented sector) the dwellings occupied by a total of 26,089 households (36,423 - 10,334) that are
currently in affordable housing need who are unable to afford their own housing.
Projected Future Affordable Housing Need
5.48 In terms of establishing future projections of affordable housing need, the PPG draws attention to new
household formation (in particular the proportion of newly forming households unable to buy or rent in the
market area) as well as the number of existing households falling into need.
How should the number of newly arising households likely to be in housing need be calculated?
Projections of affordable housing need will need to take into account new household formation, the
proportion of newly forming households unable to buy or rent in the market area, and an estimation
of the number of existing households falling into need. This process should identify the minimum
household income required to access lower quartile (entry level) market housing (plan makers
should use current cost in this process, but may wish to factor in changes in house prices and
wages). It should then assess what proportion of newly-forming households will be unable to access
market housing.
Planning Practice Guidance (March 2014), ID 2a-025
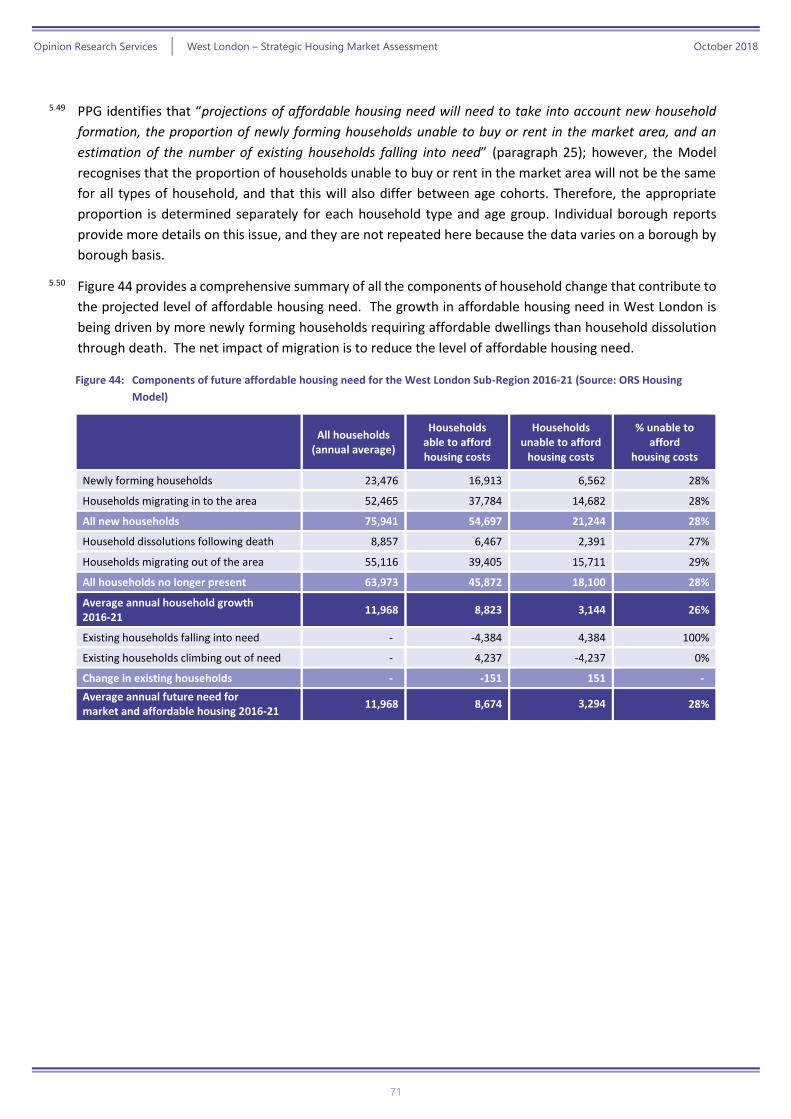
Opinion Research Services | West London – Strategic Housing Market Assessment October 2018
71
5.49 PPG identifies that “projections of affordable housing need will need to take into account new household
formation, the proportion of newly forming households unable to buy or rent in the market area, and an
estimation of the number of existing households falling into need” (paragraph 25); however, the Model
recognises that the proportion of households unable to buy or rent in the market area will not be the same
for all types of household, and that this will also differ between age cohorts. Therefore, the appropriate
proportion is determined separately for each household type and age group. Individual borough reports
provide more details on this issue, and they are not repeated here because the data varies on a borough by
borough basis.
5.50 Figure 44 provides a comprehensive summary of all the components of household change that contribute to
the projected level of affordable housing need. The growth in affordable housing need in West London is
being driven by more newly forming households requiring affordable dwellings than household dissolution
through death. The net impact of migration is to reduce the level of affordable housing need.
Figure 44: Components of future affordable housing need for the West London Sub-Region 2016-21 (Source: ORS Housing
Model)
All households
(annual average)
Households able to afford housing costs
Households unable to afford
housing costs
% unable to afford
housing costs
Newly forming households 23,476 16,913 6,562 28%
Households migrating in to the area 52,465 37,784 14,682 28%
All new households 75,941 54,697 21,244 28%
Household dissolutions following death 8,857 6,467 2,391 27%
Households migrating out of the area 55,116 39,405 15,711 29%
All households no longer present 63,973 45,872 18,100 28%
Average annual household growth 2016-21
11,968 8,823 3,144 26%
Existing households falling into need - -4,384 4,384 100%
Existing households climbing out of need - 4,237 -4,237 0%
Change in existing households - -151 151 -
Average annual future need for market and affordable housing 2016-21
11,968 8,674 3,294 28%
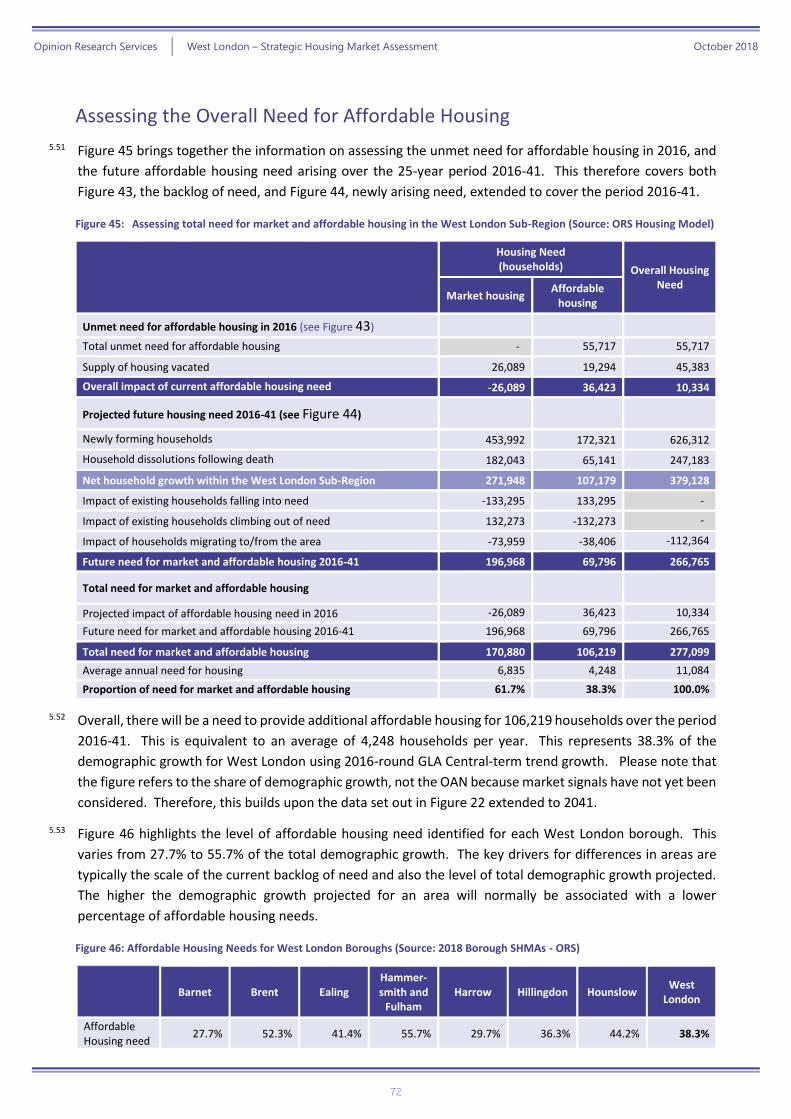
Opinion Research Services | West London – Strategic Housing Market Assessment October 2018
72
Assessing the Overall Need for Affordable Housing
5.51 Figure 45 brings together the information on assessing the unmet need for affordable housing in 2016, and
the future affordable housing need arising over the 25-year period 2016-41. This therefore covers both
Figure 43, the backlog of need, and Figure 44, newly arising need, extended to cover the period 2016-41.
Figure 45: Assessing total need for market and affordable housing in the West London Sub-Region (Source: ORS Housing Model)
Housing Need (households) Overall Housing
Need Market housing
Affordable housing
Unmet need for affordable housing in 2016 (see Figure 43)
Total unmet need for affordable housing - 55,717 55,717
Supply of housing vacated 26,089 19,294 45,383
Overall impact of current affordable housing need -26,089 36,423 10,334
Projected future housing need 2016-41 (see Figure 44)
Newly forming households 453,992 172,321 626,312
Household dissolutions following death 182,043 65,141 247,183
Net household growth within the West London Sub-Region 271,948 107,179 379,128
Impact of existing households falling into need -133,295 133,295 -
Impact of existing households climbing out of need 132,273 -132,273 -
Impact of households migrating to/from the area -73,959 -38,406 -112,364
Future need for market and affordable housing 2016-41 196,968 69,796 266,765
Total need for market and affordable housing
Projected impact of affordable housing need in 2016 -26,089 36,423 10,334
Future need for market and affordable housing 2016-41 196,968 69,796 266,765
Total need for market and affordable housing 170,880 106,219 277,099
Average annual need for housing 6,835 4,248 11,084
Proportion of need for market and affordable housing 61.7% 38.3% 100.0%
5.52 Overall, there will be a need to provide additional affordable housing for 106,219 households over the period
2016-41. This is equivalent to an average of 4,248 households per year. This represents 38.3% of the
demographic growth for West London using 2016-round GLA Central-term trend growth. Please note that
the figure refers to the share of demographic growth, not the OAN because market signals have not yet been
considered. Therefore, this builds upon the data set out in Figure 22 extended to 2041.
5.53 Figure 46 highlights the level of affordable housing need identified for each West London borough. This
varies from 27.7% to 55.7% of the total demographic growth. The key drivers for differences in areas are
typically the scale of the current backlog of need and also the level of total demographic growth projected.
The higher the demographic growth projected for an area will normally be associated with a lower
percentage of affordable housing needs.
Figure 46: Affordable Housing Needs for West London Boroughs (Source: 2018 Borough SHMAs - ORS)
Barnet Brent Ealing Hammer-smith and
Fulham Harrow Hillingdon Hounslow
West London
Affordable Housing need
27.7% 52.3% 41.4% 55.7% 29.7% 36.3% 44.2% 38.3%
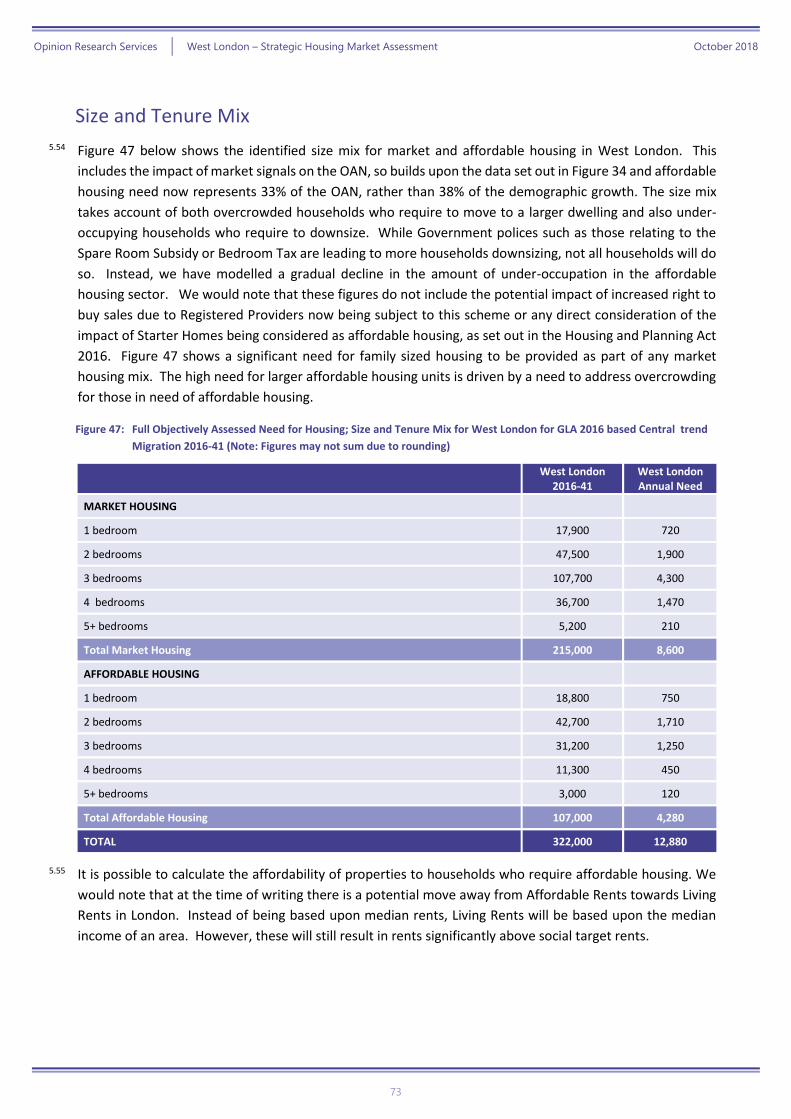
Opinion Research Services | West London – Strategic Housing Market Assessment October 2018
73
Size and Tenure Mix
5.54 Figure 47 below shows the identified size mix for market and affordable housing in West London. This
includes the impact of market signals on the OAN, so builds upon the data set out in Figure 34 and affordable
housing need now represents 33% of the OAN, rather than 38% of the demographic growth. The size mix
takes account of both overcrowded households who require to move to a larger dwelling and also under-
occupying households who require to downsize. While Government polices such as those relating to the
Spare Room Subsidy or Bedroom Tax are leading to more households downsizing, not all households will do
so. Instead, we have modelled a gradual decline in the amount of under-occupation in the affordable
housing sector. We would note that these figures do not include the potential impact of increased right to
buy sales due to Registered Providers now being subject to this scheme or any direct consideration of the
impact of Starter Homes being considered as affordable housing, as set out in the Housing and Planning Act
2016. Figure 47 shows a significant need for family sized housing to be provided as part of any market
housing mix. The high need for larger affordable housing units is driven by a need to address overcrowding
for those in need of affordable housing.
Figure 47: Full Objectively Assessed Need for Housing; Size and Tenure Mix for West London for GLA 2016 based Central trend
Migration 2016-41 (Note: Figures may not sum due to rounding)
West London
2016-41 West London Annual Need
MARKET HOUSING
1 bedroom 17,900 720
2 bedrooms 47,500 1,900
3 bedrooms 107,700 4,300
4 bedrooms 36,700 1,470
5+ bedrooms 5,200 210
Total Market Housing 215,000 8,600
AFFORDABLE HOUSING
1 bedroom 18,800 750
2 bedrooms 42,700 1,710
3 bedrooms 31,200 1,250
4 bedrooms 11,300 450
5+ bedrooms 3,000 120
Total Affordable Housing 107,000 4,280
TOTAL 322,000 12,880
5.55 It is possible to calculate the affordability of properties to households who require affordable housing. We
would note that at the time of writing there is a potential move away from Affordable Rents towards Living
Rents in London. Instead of being based upon median rents, Living Rents will be based upon the median
income of an area. However, these will still result in rents significantly above social target rents.
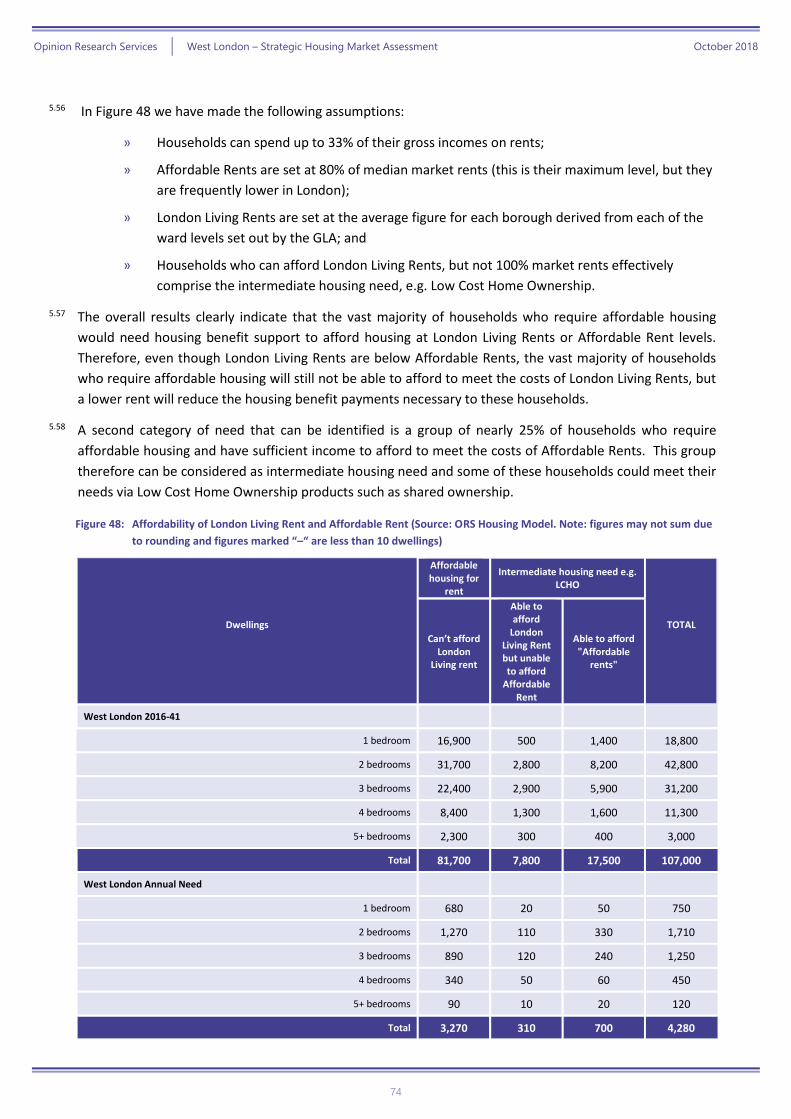
Opinion Research Services | West London – Strategic Housing Market Assessment October 2018
74
5.56 In Figure 48 we have made the following assumptions:
» Households can spend up to 33% of their gross incomes on rents;
» Affordable Rents are set at 80% of median market rents (this is their maximum level, but they
are frequently lower in London);
» London Living Rents are set at the average figure for each borough derived from each of the
ward levels set out by the GLA; and
» Households who can afford London Living Rents, but not 100% market rents effectively
comprise the intermediate housing need, e.g. Low Cost Home Ownership.
5.57 The overall results clearly indicate that the vast majority of households who require affordable housing
would need housing benefit support to afford housing at London Living Rents or Affordable Rent levels.
Therefore, even though London Living Rents are below Affordable Rents, the vast majority of households
who require affordable housing will still not be able to afford to meet the costs of London Living Rents, but
a lower rent will reduce the housing benefit payments necessary to these households.
5.58 A second category of need that can be identified is a group of nearly 25% of households who require
affordable housing and have sufficient income to afford to meet the costs of Affordable Rents. This group
therefore can be considered as intermediate housing need and some of these households could meet their
needs via Low Cost Home Ownership products such as shared ownership.
Figure 48: Affordability of London Living Rent and Affordable Rent (Source: ORS Housing Model. Note: figures may not sum due
to rounding and figures marked “–“ are less than 10 dwellings)
Dwellings
Affordable housing for
rent
Intermediate housing need e.g. LCHO
TOTAL Can’t afford
London Living rent
Able to afford
London Living Rent but unable to afford
Affordable Rent
Able to afford "Affordable
rents"
West London 2016-41
1 bedroom 16,900 500 1,400 18,800
2 bedrooms 31,700 2,800 8,200 42,800
3 bedrooms 22,400 2,900 5,900 31,200
4 bedrooms 8,400 1,300 1,600 11,300
5+ bedrooms 2,300 300 400 3,000
Total 81,700 7,800 17,500 107,000
West London Annual Need
1 bedroom 680 20 50 750
2 bedrooms 1,270 110 330 1,710
3 bedrooms 890 120 240 1,250
4 bedrooms 340 50 60 450
5+ bedrooms 90 10 20 120
Total 3,270 310 700 4,280
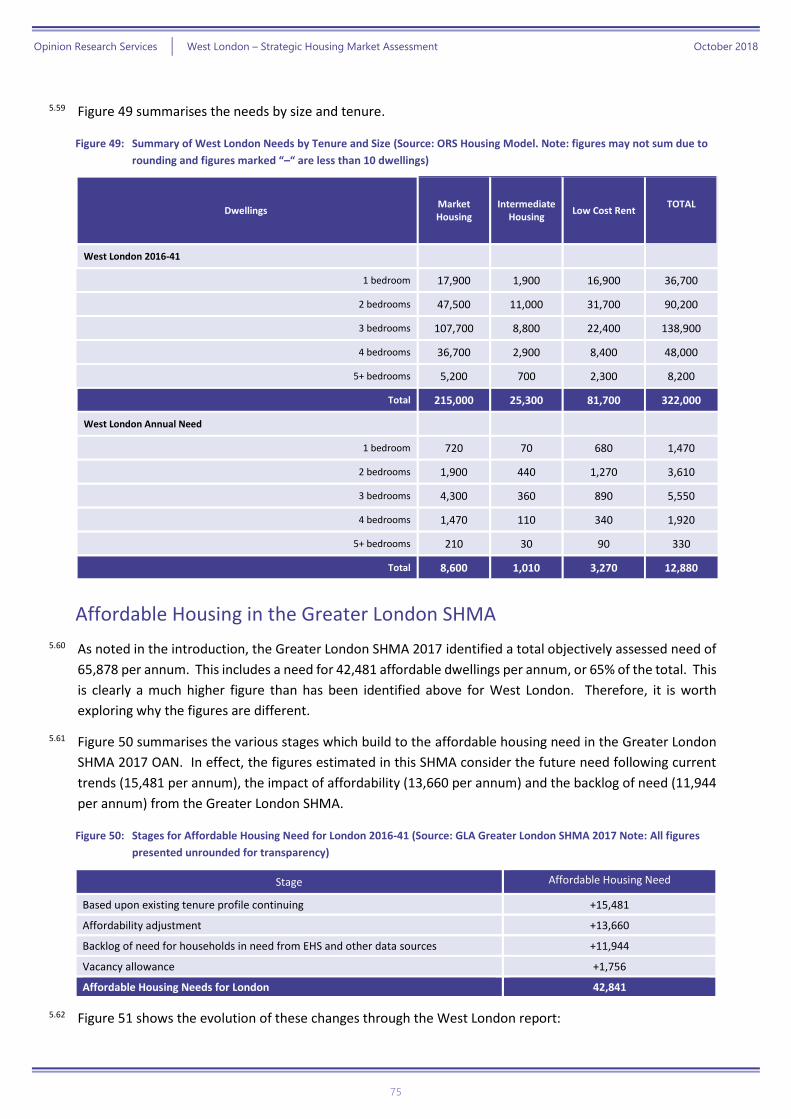
Opinion Research Services | West London – Strategic Housing Market Assessment October 2018
75
5.59 Figure 49 summarises the needs by size and tenure.
Figure 49: Summary of West London Needs by Tenure and Size (Source: ORS Housing Model. Note: figures may not sum due to
rounding and figures marked “–“ are less than 10 dwellings)
Dwellings Market Housing
Intermediate Housing
Low Cost Rent TOTAL
West London 2016-41
1 bedroom 17,900 1,900 16,900 36,700
2 bedrooms 47,500 11,000 31,700 90,200
3 bedrooms 107,700 8,800 22,400 138,900
4 bedrooms 36,700 2,900 8,400 48,000
5+ bedrooms 5,200 700 2,300 8,200
Total 215,000 25,300 81,700 322,000
West London Annual Need
1 bedroom 720 70 680 1,470
2 bedrooms 1,900 440 1,270 3,610
3 bedrooms 4,300 360 890 5,550
4 bedrooms 1,470 110 340 1,920
5+ bedrooms 210 30 90 330
Total 8,600 1,010 3,270 12,880
Affordable Housing in the Greater London SHMA
5.60 As noted in the introduction, the Greater London SHMA 2017 identified a total objectively assessed need of
65,878 per annum. This includes a need for 42,481 affordable dwellings per annum, or 65% of the total. This
is clearly a much higher figure than has been identified above for West London. Therefore, it is worth
exploring why the figures are different.
5.61 Figure 50 summarises the various stages which build to the affordable housing need in the Greater London
SHMA 2017 OAN. In effect, the figures estimated in this SHMA consider the future need following current
trends (15,481 per annum), the impact of affordability (13,660 per annum) and the backlog of need (11,944
per annum) from the Greater London SHMA.
Figure 50: Stages for Affordable Housing Need for London 2016-41 (Source: GLA Greater London SHMA 2017 Note: All figures
presented unrounded for transparency)
Stage Affordable Housing Need
Based upon existing tenure profile continuing +15,481
Affordability adjustment +13,660
Backlog of need for households in need from EHS and other data sources +11,944
Vacancy allowance +1,756
Affordable Housing Needs for London 42,841
5.62 Figure 51 shows the evolution of these changes through the West London report:
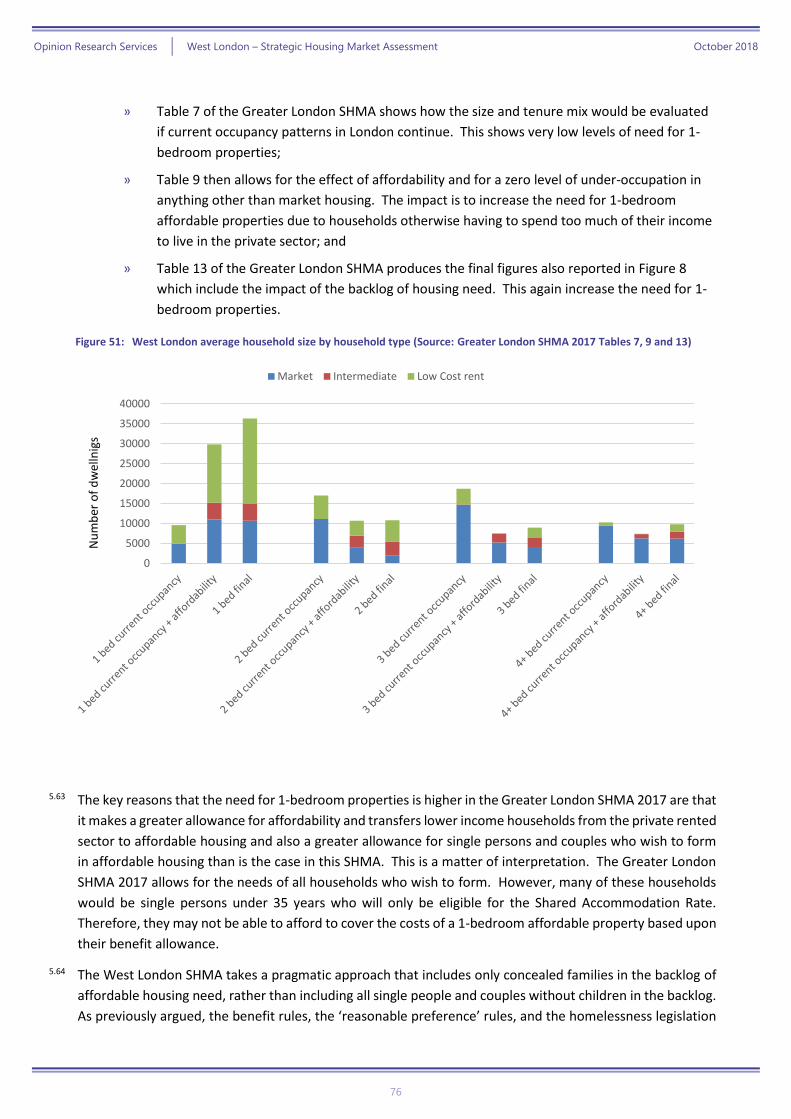
Opinion Research Services | West London – Strategic Housing Market Assessment October 2018
76
» Table 7 of the Greater London SHMA shows how the size and tenure mix would be evaluated
if current occupancy patterns in London continue. This shows very low levels of need for 1-
bedroom properties;
» Table 9 then allows for the effect of affordability and for a zero level of under-occupation in
anything other than market housing. The impact is to increase the need for 1-bedroom
affordable properties due to households otherwise having to spend too much of their income
to live in the private sector; and
» Table 13 of the Greater London SHMA produces the final figures also reported in Figure 8
which include the impact of the backlog of housing need. This again increase the need for 1-
bedroom properties.
Figure 51: West London average household size by household type (Source: Greater London SHMA 2017 Tables 7, 9 and 13)
5.63 The key reasons that the need for 1-bedroom properties is higher in the Greater London SHMA 2017 are that
it makes a greater allowance for affordability and transfers lower income households from the private rented
sector to affordable housing and also a greater allowance for single persons and couples who wish to form
in affordable housing than is the case in this SHMA. This is a matter of interpretation. The Greater London
SHMA 2017 allows for the needs of all households who wish to form. However, many of these households
would be single persons under 35 years who will only be eligible for the Shared Accommodation Rate.
Therefore, they may not be able to afford to cover the costs of a 1-bedroom affordable property based upon
their benefit allowance.
5.64 The West London SHMA takes a pragmatic approach that includes only concealed families in the backlog of
affordable housing need, rather than including all single people and couples without children in the backlog.
As previously argued, the benefit rules, the ‘reasonable preference’ rules, and the homelessness legislation
0
5000
10000
15000
20000
25000
30000
35000
40000
Nu
mb
er o
f d
wel
lnig
s
Market Intermediate Low Cost rent
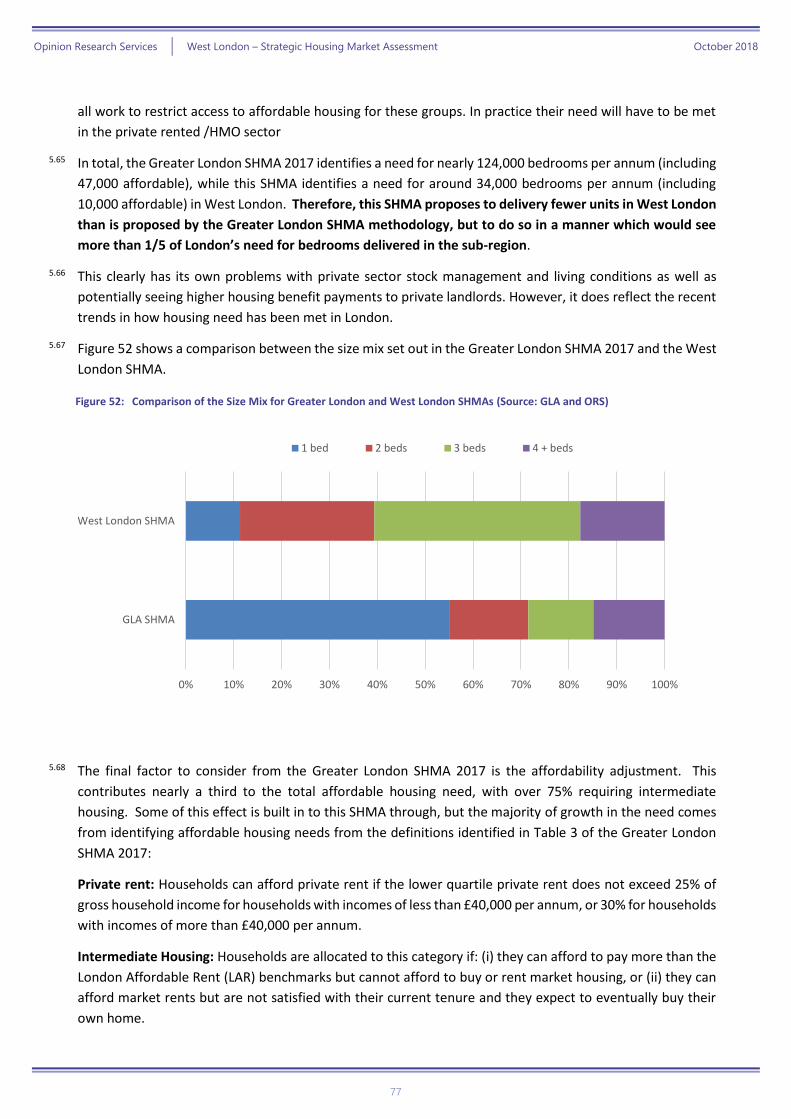
Opinion Research Services | West London – Strategic Housing Market Assessment October 2018
77
all work to restrict access to affordable housing for these groups. In practice their need will have to be met
in the private rented /HMO sector
5.65 In total, the Greater London SHMA 2017 identifies a need for nearly 124,000 bedrooms per annum (including
47,000 affordable), while this SHMA identifies a need for around 34,000 bedrooms per annum (including
10,000 affordable) in West London. Therefore, this SHMA proposes to delivery fewer units in West London
than is proposed by the Greater London SHMA methodology, but to do so in a manner which would see
more than 1/5 of London’s need for bedrooms delivered in the sub-region.
5.66 This clearly has its own problems with private sector stock management and living conditions as well as
potentially seeing higher housing benefit payments to private landlords. However, it does reflect the recent
trends in how housing need has been met in London.
5.67 Figure 52 shows a comparison between the size mix set out in the Greater London SHMA 2017 and the West
London SHMA.
Figure 52: Comparison of the Size Mix for Greater London and West London SHMAs (Source: GLA and ORS)
5.68 The final factor to consider from the Greater London SHMA 2017 is the affordability adjustment. This
contributes nearly a third to the total affordable housing need, with over 75% requiring intermediate
housing. Some of this effect is built in to this SHMA through, but the majority of growth in the need comes
from identifying affordable housing needs from the definitions identified in Table 3 of the Greater London
SHMA 2017:
Private rent: Households can afford private rent if the lower quartile private rent does not exceed 25% of
gross household income for households with incomes of less than £40,000 per annum, or 30% for households
with incomes of more than £40,000 per annum.
Intermediate Housing: Households are allocated to this category if: (i) they can afford to pay more than the
London Affordable Rent (LAR) benchmarks but cannot afford to buy or rent market housing, or (ii) they can
afford market rents but are not satisfied with their current tenure and they expect to eventually buy their
own home.
0% 10% 20% 30% 40% 50% 60% 70% 80% 90% 100%
GLA SHMA
West London SHMA
1 bed 2 beds 3 beds 4 + beds
Opinion Research Services | West London – Strategic Housing Market Assessment October 2018
78
5.69 The test set out for being able to afford private rent in the Greater London SHMA 2017 is much stricter than
that used in this SHMA and also the definition of intermediate housing allows for household who can afford
to rent private, but who want to own being considered in affordable housing need. This group are now
considered in the next section.
Affordable Housing to Own
5.70 As noted earlier, the National Planning Policy Framework 2012 (NPPF) definition of affordable housing
identifies that it is “provided to eligible households whose needs are not met by the market” (Annex 2) and
Planning Practice Guidance (PPG) confirms that affordable housing need should be counted based on those
“who cannot afford to meet their needs in the market” (ID 2a-022) and notes that “care should be taken … to
only include those households who cannot afford to access suitable market housing” (ID 2a-024).
5.71 Therefore, when considering households in need of affordable housing, the PPG March 2014 has a clear
focus on those households with a priority need who are unable to afford housing. Neither the NPPF nor PPG
make specific reference to tenure in terms of the overall affordable housing need; however, to reiterate
from earlier in this chapter, PPG states that when considering affordable housing need in the context of new
household formation, it is necessary to consider “the proportion of newly forming households unable to buy
or rent in the market area” (ID 2a-025, emphasis added).
5.72 To this point within this SHMA, where households could afford to rent privately without Housing Benefit (HB)
support, they were not counted as part of the affordable housing need; only households unable to afford
market rent are assessed to need affordable housing. Households able to afford market rent were counted
within the need for market housing, regardless of whether or not they wanted to own or rent or whether
they could or could not afford home ownership.
5.73 However, it is also important to consider the role of other affordable housing products in the West London
sub-region. This section concentrates upon the potential role which could be played by shared ownership,
low cost home ownership (LCHO) and Starter Home dwellings in meeting the overall housing needs of the
area.
5.74 Annex 2 of the NPPF July 2018 contains an updated definition of affordable housing which also considers
households as needing affordable housing if they cannot afford to own.
5.75 Many households who can afford Starter Homes and other LCHO schemes will be able to afford a private
rented property. On the previous definition of households in affordable housing need they would be able to
meet their needs in the market and therefore would not require affordable housing. Figure 53 illustrates
the breakdown of overall housing need under current NPPF and PPG definitions and highlights that it is
fundamentally based on those households unable to afford market rent and who therefore are likely to need
a rented affordable product. This includes those households who require HB support to pay their rent
regardless of tenure, alongside those who can only afford social or affordable rented housing without HB
support.
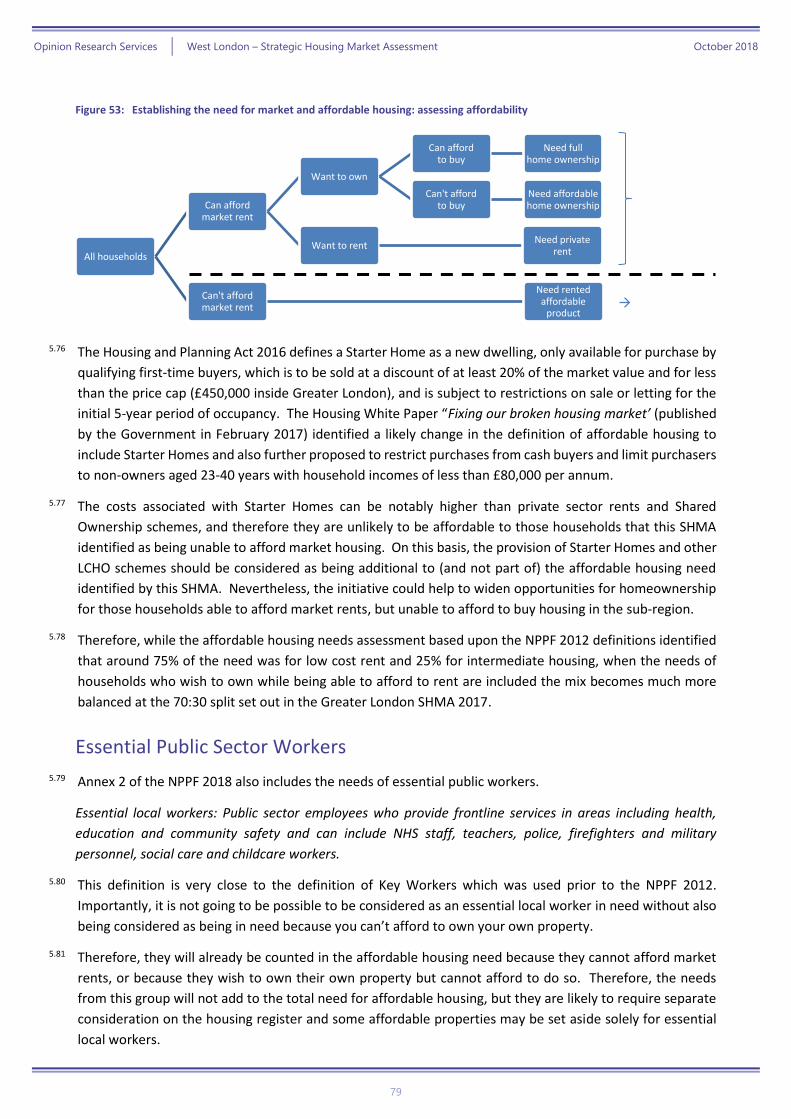
Opinion Research Services | West London – Strategic Housing Market Assessment October 2018
79
Figure 53: Establishing the need for market and affordable housing: assessing affordability
→
5.76 The Housing and Planning Act 2016 defines a Starter Home as a new dwelling, only available for purchase by
qualifying first-time buyers, which is to be sold at a discount of at least 20% of the market value and for less
than the price cap (£450,000 inside Greater London), and is subject to restrictions on sale or letting for the
initial 5-year period of occupancy. The Housing White Paper “Fixing our broken housing market’ (published
by the Government in February 2017) identified a likely change in the definition of affordable housing to
include Starter Homes and also further proposed to restrict purchases from cash buyers and limit purchasers
to non-owners aged 23-40 years with household incomes of less than £80,000 per annum.
5.77 The costs associated with Starter Homes can be notably higher than private sector rents and Shared
Ownership schemes, and therefore they are unlikely to be affordable to those households that this SHMA
identified as being unable to afford market housing. On this basis, the provision of Starter Homes and other
LCHO schemes should be considered as being additional to (and not part of) the affordable housing need
identified by this SHMA. Nevertheless, the initiative could help to widen opportunities for homeownership
for those households able to afford market rents, but unable to afford to buy housing in the sub-region.
5.78 Therefore, while the affordable housing needs assessment based upon the NPPF 2012 definitions identified
that around 75% of the need was for low cost rent and 25% for intermediate housing, when the needs of
households who wish to own while being able to afford to rent are included the mix becomes much more
balanced at the 70:30 split set out in the Greater London SHMA 2017.
Essential Public Sector Workers
5.79 Annex 2 of the NPPF 2018 also includes the needs of essential public workers.
Essential local workers: Public sector employees who provide frontline services in areas including health,
education and community safety and can include NHS staff, teachers, police, firefighters and military
personnel, social care and childcare workers.
5.80 This definition is very close to the definition of Key Workers which was used prior to the NPPF 2012.
Importantly, it is not going to be possible to be considered as an essential local worker in need without also
being considered as being in need because you can’t afford to own your own property.
5.81 Therefore, they will already be counted in the affordable housing need because they cannot afford market
rents, or because they wish to own their own property but cannot afford to do so. Therefore, the needs
from this group will not add to the total need for affordable housing, but they are likely to require separate
consideration on the housing register and some affordable properties may be set aside solely for essential
local workers.
All households
Can afford market rent
Want to own
Can afford to buy
Need full home ownership
Can't affordto buy
Need affordable home ownership
Want to rentNeed private
rent
Can't afford market rent
Need rented affordable
product
Opinion Research Services | West London – Strategic Housing Market Assessment October 2018
80
Conclusions
5.82 Based on the household projections previously established, we have established the balance between the
need for market housing and the need for affordable housing. This analysis has identified a need to increase
the overall housing need by 10,334 households to take account of concealed families and homeless
households that would not be captured by the household projections.
5.83 The housing mix analysis identified a need to provide 106,219 additional affordable dwellings over the 25-
year period 2016-41 (an average of 4,250 per year), representing 33% of the overall OAN for the West London
sub-region. In summary:
» Based upon affordability being assessed against the ability to afford market rents there is a
need for 67% of the new dwelling stock to be market housing and 33% to be affordable.
Among this affordable housing need there is a need for around 25% to be intermediate and
75% low cost rent; and
» The change is definition to affordable housing set out in the NPPF 2018 will see affordable
housing being assessed against the ability to want and afford owner occupation. This will see
households would otherwise be able to afford market rent being in need of affordable
housing because they wish to become owner occupiers. The impact of this change would be
to see a share of the market housing need move to intermediate housing need as households
who cannot afford to be owner occupiers are counted in the affordable housing need
category.
5.84 This would provide for the current unmet needs for affordable housing in addition to the projected future
growth in affordable housing need; but assumes that the level of housing benefit support provided to
households living in the private rented sector remains constant.
Opinion Research Services | West London – Strategic Housing Market Assessment October 2018
81
6. Needs of different groups Addressing the need for all types of housing
The Private Rented Sector
6.1 The English Housing Survey (EHS) 2016-17 identified that 20% (4.7 million) of households were renting from
a private landlord, much higher than the rate of 14% almost a decade earlier in 2008-09. The EHS also shows
that households aged 25-34 were more likely to be renting privately (46%) than buying a home, up from 27%
in 2006-07. Owner occupation in this age group dropped from 57% to 37% over the same 10-year period. In
Greater London, 30% of households rent privately compared to 25% outright ownership (25%), 22% buying
with a mortgage (22%), and 22% renting in the social sector. Outside of London, private rented is the third
largest tenure and is now larger than social rented; 36% outright ownership, 30% buying with a mortgage,
19% private renting, and 16% social renting.
6.2 Growth in the Sector seems likely to continue, driven by a combination of demand and supply factors:
» Increasing demand from more households;
» Recent reductions in incomes (in real terms);
» Affordability of owner occupation reducing;
» Changing Bank lending practices;
» Pensions reform: pension drawdowns invested in BTL property.
6.3 The growth of the Sector has been acknowledged as both a growing and long-term option for meeting the
nation’s housing need. CLG (with the Intermediary Mortgage Lenders Association forecast) that the private
rented sector will increase in size to 35% nationally by 203222. On this basis, the number of households
renting privately could double again over the next twenty years.
6.4 Given this context, PPG recognises the importance of understanding the likely future role of the private
rented sector:
The private rented sector
Tenure data from the Office of National Statistics can be used to understand the future need for
private rented sector housing. However, this will be based on past trends. Market signals in the
demand for private rented sector housing could be indicated from a change in rents.
Planning Practice Guidance (March 2014), ID 2a-021
22 http://news.rla.org.uk/rpi-rent-revolution/
Opinion Research Services | West London – Strategic Housing Market Assessment October 2018
82
National Context
6.5 As the PRS expands and other sectors contract, it is clear that many households who would traditionally
meet their housing needs in other sectors are now renting privately. This includes many households
currently unable to afford their housing costs, which can be seen from the expansion of families receiving
Housing Benefit in the sector, in particular since the start of the most recent recession.
6.6 The Office for Budget Responsibility analysis of the UK’s public finances for Government explicitly recognises
a likely growth in the share of housing benefit claimants in the private rented sector in its Economic and
Fiscal Outlook (March 2014)23:
“The share of [housing benefit] spending accounted for by the private rented sector is
forecast to rise from 30 per cent in 2007-08 to 40 per cent by 2018-19. … We expect the
share of claimants in the private rented sector to continue rising over the forecast period,
but for average awards to rise more slowly than nominal GDP per capita due to policy,
including on uprating.” (paragraphs 4.152-154)
6.7 Importantly, the Government sees the PRS having an important and long-term role in meeting the housing
need of the nation; and although the NPPF and PPG do not mention the current or future role of housing
benefit, the policy to support low-income households in the private rented sector with housing benefit is
long-standing and housing benefit is explicitly factored into the long-term forecasts for public spending.
6.8 Policy by both Government and Local Authorities is focused on improving Management and Maintenance in
the sector (via licensing or self-regulation schemes) and expanding supply24 (including the Build to Rent
investment scheme25). The Government published “Improving the Private Rented Sector and Tackling Bad
Practice: A guide for local authorities” in March 201526, and the Foreword by the Minister stated:
“The private rented sector is an important and growing part of our housing market, housing
4.4 million households in England. The quality of housing in the sector has improved
dramatically over the last decade. It is now the second largest tenure and this growth is
forecast to continue growing. I am proud of this growth as it shows increasing choice,
improving standards whilst helping to keep rents affordable. The Government supports a
bigger and better private rented sector and wants to see this growth continue.”
6.9 Given this context, it is important for local authorities to recognise the role of the private rented sector at a
local level. Assuming the release back into the market of many dwellings in the private rented sector
currently occupied by tenants in receipt of housing benefit would have significant consequences for the
wider housing market as more properties come on to the market; therefore it remains appropriate to
recognise that the private rented sector will continue to make an important contribution towards providing
housing options for households unable to afford their housing costs in future. Nevertheless, it is essential
for local authorities to understand the full extent of the need for affordable housing in their areas and
consider their policy responses accordingly.
23 http://cdn.budgetresponsibility.org.uk/37839-OBR-Cm-8820-accessible-web-v2.pdf 24 https://www.gov.uk/government/publications/private-rented-homes-review-of-the-barriers-to-institutional-investment 25 https://www.gov.uk/government/publications/build-to-rent-round-2-initial-due-diligence 26 https://www.gov.uk/government/uploads/system/uploads/attachment_data/file/412921/Improving_private_rented_sector.pdf
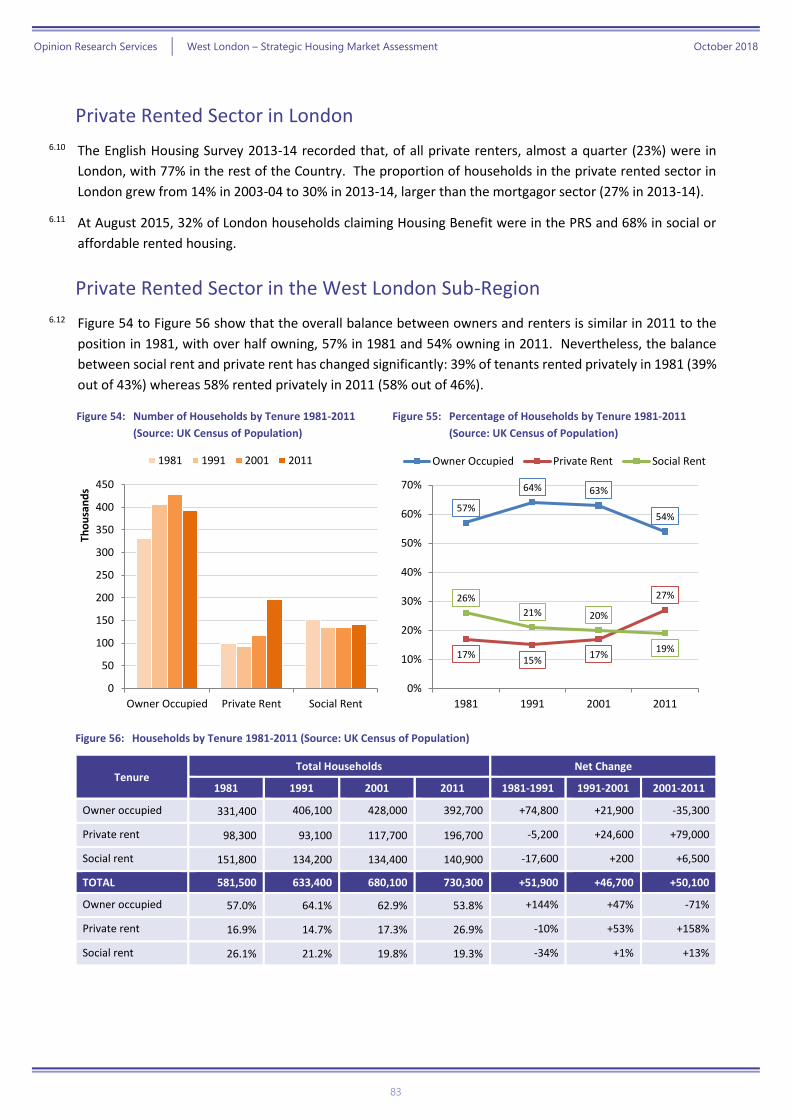
Opinion Research Services | West London – Strategic Housing Market Assessment October 2018
83
Private Rented Sector in London
6.10 The English Housing Survey 2013-14 recorded that, of all private renters, almost a quarter (23%) were in
London, with 77% in the rest of the Country. The proportion of households in the private rented sector in
London grew from 14% in 2003-04 to 30% in 2013-14, larger than the mortgagor sector (27% in 2013-14).
6.11 At August 2015, 32% of London households claiming Housing Benefit were in the PRS and 68% in social or
affordable rented housing.
Private Rented Sector in the West London Sub-Region
6.12 Figure 54 to Figure 56 show that the overall balance between owners and renters is similar in 2011 to the
position in 1981, with over half owning, 57% in 1981 and 54% owning in 2011. Nevertheless, the balance
between social rent and private rent has changed significantly: 39% of tenants rented privately in 1981 (39%
out of 43%) whereas 58% rented privately in 2011 (58% out of 46%).
Figure 54: Number of Households by Tenure 1981-2011
(Source: UK Census of Population)
Figure 55: Percentage of Households by Tenure 1981-2011
(Source: UK Census of Population)
Figure 56: Households by Tenure 1981-2011 (Source: UK Census of Population)
Tenure Total Households Net Change
1981 1991 2001 2011 1981-1991 1991-2001 2001-2011
Owner occupied 331,400 406,100 428,000 392,700 +74,800 +21,900 -35,300
Private rent 98,300 93,100 117,700 196,700 -5,200 +24,600 +79,000
Social rent 151,800 134,200 134,400 140,900 -17,600 +200 +6,500
TOTAL 581,500 633,400 680,100 730,300 +51,900 +46,700 +50,100
Owner occupied 57.0% 64.1% 62.9% 53.8% +144% +47% -71%
Private rent 16.9% 14.7% 17.3% 26.9% -10% +53% +158%
Social rent 26.1% 21.2% 19.8% 19.3% -34% +1% +13%
0
50
100
150
200
250
300
350
400
450
Owner Occupied Private Rent Social Rent
Tho
usa
nd
s
1981 1991 2001 2011
57%
64% 63%
54%
17%15%
17%
27%26%
21% 20%
19%
0%
10%
20%
30%
40%
50%
60%
70%
1981 1991 2001 2011
Owner Occupied Private Rent Social Rent
Opinion Research Services | West London – Strategic Housing Market Assessment October 2018
84
The Future Role of the Private Rented Sector
6.13 PRS is an important tenure that has grown since 1991 to house a significant proportion of households in
London. At the same time, young households have been less likely to meet their housing need in affordable
housing given the various constraints in accessing local authority and housing association rented housing.
Recent changes to letting polices and the reality of pressures on the housing stock make it less likely that
single persons aged under 35 years will be allocated to a 1 bedroom social rented or affordable rented
property.
6.14 Further, there have been other recently announced changes (Starter Homes, Right to Buy for housing
association tenants) which may influence the demand for Private Rented Sector accommodation. The
Housing and Planning Act 2016 contains proposals to further the Government’s policy of encouraging home
ownership through promoting Starter Homes to provide affordable property for first time buyers. This
proposed duty to promote the supply of Starter Homes alongside other statements from Government
ministers suggesting that Starter Homes will be considered as ‘affordable housing’ has led to speculation
that the promotion of Starter Homes will restrict the supply of affordable housing for rent for reasons such
as a preference among developers to develop Starter Home property for sale rather than affordable housing
for rent.
6.15 If the new supply of affordable homes changes to include Starter Homes, and if existing affordable supply in
net terms reduces (i.e. if new affordable supply does not exceed stock sold under RTB), then demand for PRS
stock may continue or increase further. This means that much of the increased demand for PRS property is
likely to continue, driven by young households with few other options should they wish to establish their
own household.
6.16 In practice this implies that unless current trends are reversed there will be a further growth in HMOs in
London with the management and enforcement issues they attract. One very startling statistic from the
2016 round GLA household projections is that the number of single person households aged 16-24 years in
West London is projected to fall by 3,400 between 2016 and 2041. This sharp projected decline in young
single persons in the area follows the recent trends where the increasing pressures for social housing and
rising private rents have seen fewer young households living on their own and more living in HMO type
accommodation.
6.17 The GLA SHMA seeks to address this issue by calculating their backlog of affordable housing need on the
basis that many single persons wish to have their own affordable property. However, this runs in to the
issues outline earlier in the report in paragraph 1.27 around the practicalities of delivering 1 bedroom
affordable homes for those who are only entitled to the Shared Accommodation Rate.
6.18 One type of dwelling which may address this issue is shared housing-with small purpose units with shared
amenity spaces. Given that the West London area is projected to see a sharp decline in single young persons
then the household projections would envisage little role for this type of dwelling. However, as a policy led
response to the increasing lack of housing for younger people in the area the scheme offers greater
opportunities for groups such as recent graduates looking to establish themselves in London.
Projected Population Age Profile
6.19 Population projections based on GLA 2016 based central trend migration were considered in the SHMA.
These projections show that the population is likely to increase from 2,062,800 persons to 2,504,600 persons
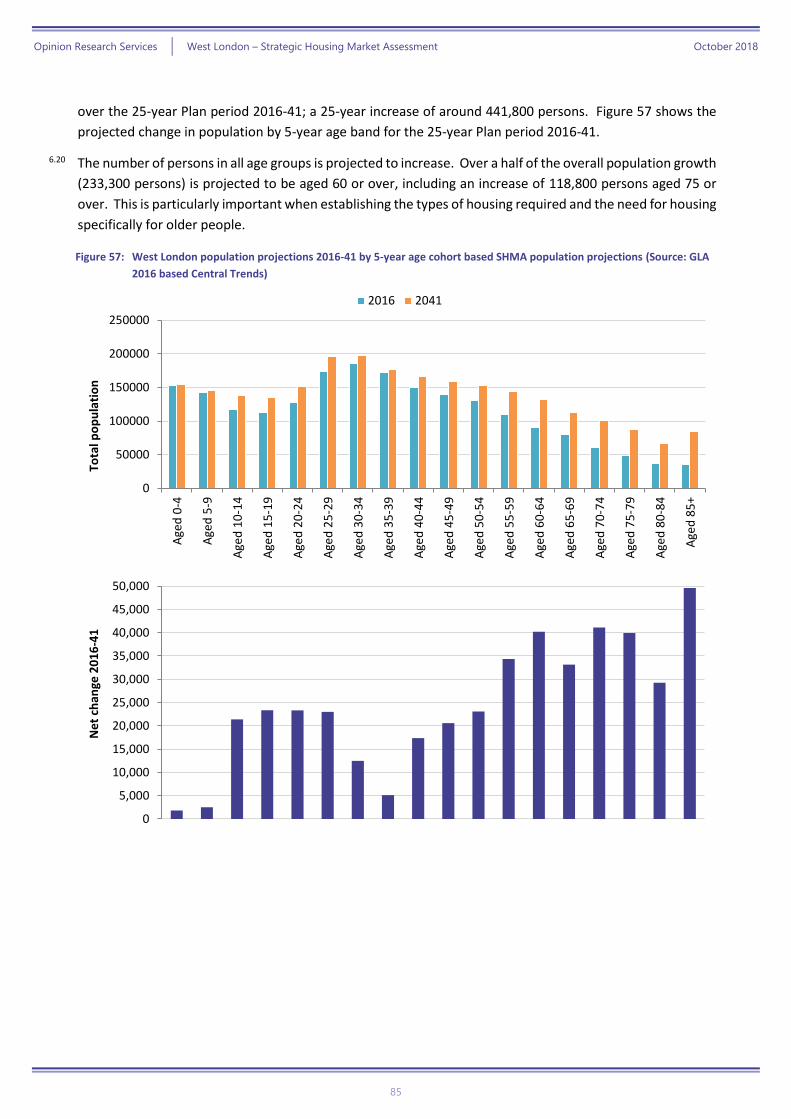
Opinion Research Services | West London – Strategic Housing Market Assessment October 2018
85
over the 25-year Plan period 2016-41; a 25-year increase of around 441,800 persons. Figure 57 shows the
projected change in population by 5-year age band for the 25-year Plan period 2016-41.
6.20 The number of persons in all age groups is projected to increase. Over a half of the overall population growth
(233,300 persons) is projected to be aged 60 or over, including an increase of 118,800 persons aged 75 or
over. This is particularly important when establishing the types of housing required and the need for housing
specifically for older people.
Figure 57: West London population projections 2016-41 by 5-year age cohort based SHMA population projections (Source: GLA
2016 based Central Trends)
0
50000
100000
150000
200000
250000
Age
d 0
-4
Age
d 5
-9
Age
d 1
0-1
4
Age
d 1
5-1
9
Age
d 2
0-2
4
Age
d 2
5-2
9
Age
d 3
0-3
4
Age
d 3
5-3
9
Age
d 4
0-4
4
Age
d 4
5-4
9
Age
d 5
0-5
4
Age
d 5
5-5
9
Age
d 6
0-6
4
Age
d 6
5-6
9
Age
d 7
0-7
4
Age
d 7
5-7
9
Age
d 8
0-8
4
Age
d 8
5+
Tota
l po
pu
lati
on
2016 2041
0
5,000
10,000
15,000
20,000
25,000
30,000
35,000
40,000
45,000
50,000
Ne
t ch
ange
20
16
-41
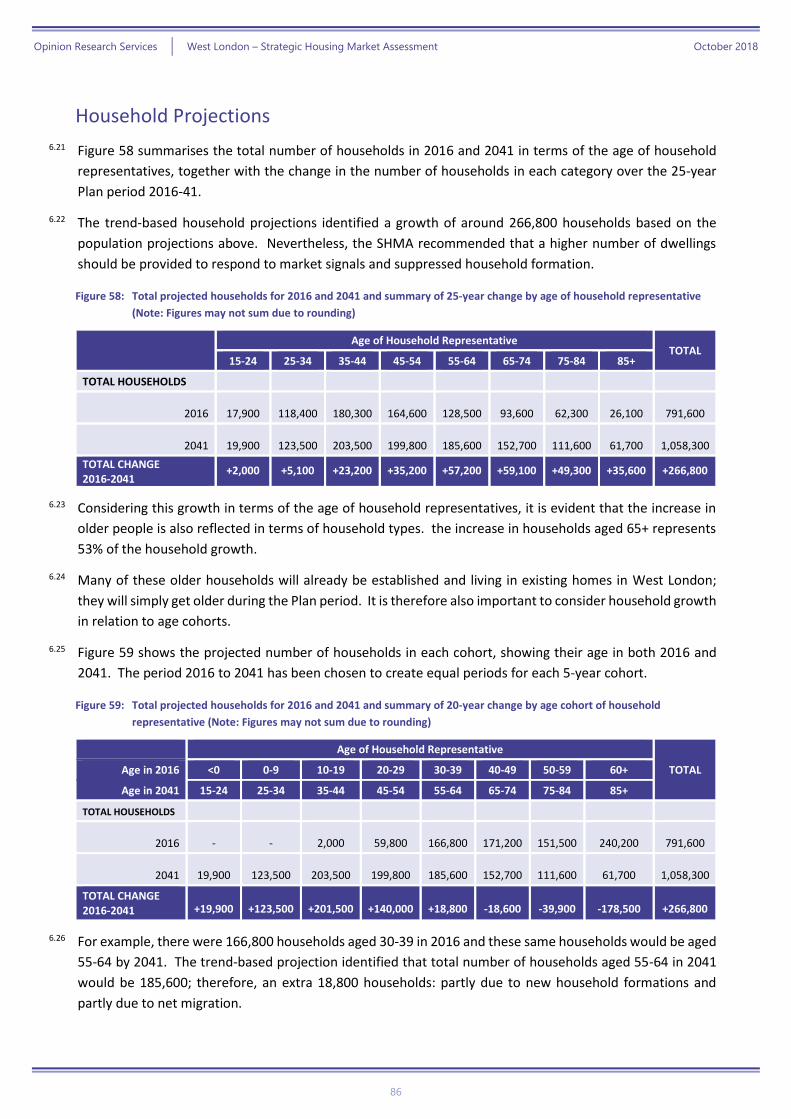
Opinion Research Services | West London – Strategic Housing Market Assessment October 2018
86
Household Projections
6.21 Figure 58 summarises the total number of households in 2016 and 2041 in terms of the age of household
representatives, together with the change in the number of households in each category over the 25-year
Plan period 2016-41.
6.22 The trend-based household projections identified a growth of around 266,800 households based on the
population projections above. Nevertheless, the SHMA recommended that a higher number of dwellings
should be provided to respond to market signals and suppressed household formation.
Figure 58: Total projected households for 2016 and 2041 and summary of 25-year change by age of household representative
(Note: Figures may not sum due to rounding)
Age of Household Representative
TOTAL 15-24 25-34 35-44 45-54 55-64 65-74 75-84 85+
TOTAL HOUSEHOLDS
2016 17,900 118,400 180,300 164,600 128,500 93,600 62,300 26,100 791,600
2041 19,900 123,500 203,500 199,800 185,600 152,700 111,600 61,700 1,058,300
TOTAL CHANGE 2016-2041
+2,000 +5,100 +23,200 +35,200 +57,200 +59,100 +49,300 +35,600 +266,800
6.23 Considering this growth in terms of the age of household representatives, it is evident that the increase in
older people is also reflected in terms of household types. the increase in households aged 65+ represents
53% of the household growth.
6.24 Many of these older households will already be established and living in existing homes in West London;
they will simply get older during the Plan period. It is therefore also important to consider household growth
in relation to age cohorts.
6.25 Figure 59 shows the projected number of households in each cohort, showing their age in both 2016 and
2041. The period 2016 to 2041 has been chosen to create equal periods for each 5-year cohort.
Figure 59: Total projected households for 2016 and 2041 and summary of 20-year change by age cohort of household
representative (Note: Figures may not sum due to rounding)
Age of Household Representative
TOTAL Age in 2016 <0 0-9 10-19 20-29 30-39 40-49 50-59 60+
Age in 2041 15-24 25-34 35-44 45-54 55-64 65-74 75-84 85+
TOTAL HOUSEHOLDS
2016 - - 2,000 59,800 166,800 171,200 151,500 240,200 791,600
2041 19,900 123,500 203,500 199,800 185,600 152,700 111,600 61,700 1,058,300
TOTAL CHANGE 2016-2041 +19,900 +123,500 +201,500 +140,000 +18,800 -18,600 -39,900 -178,500 +266,800
6.26 For example, there were 166,800 households aged 30-39 in 2016 and these same households would be aged
55-64 by 2041. The trend-based projection identified that total number of households aged 55-64 in 2041
would be 185,600; therefore, an extra 18,800 households: partly due to new household formations and
partly due to net migration.
Opinion Research Services | West London – Strategic Housing Market Assessment October 2018
87
6.27 Based on the cohort analysis, it is apparent that around 503,700 extra households aged under 65 (in 2041)
will be likely to form in West London over the 25-year period 2016-31. We previously noted that the overall
growth was 266,800 households over the 25-year Plan period, which is lower than the number of new
households forming. Nevertheless, the 503,700 extra household aged under 65 are offset against a
reduction of 237,000 households aged 65 or over (in 2041). Most of this reduction is due to household
dissolution following death (although some may be due to net migration):
» 240,200 households were aged 60+ in 2016, who would be aged 85+ in 2041 if they had
survived;
» The projected number of households aged 85+ in 2041 is 61,700, which represents a
reduction of 178,500 households whose existing homes would be vacated.
6.28 Whilst the increase in overall households is largely amongst those aged 60+, most of the new households
seeking housing will actually be in their twenties and thirties at the time that they form. However, the total
number of new households is likely to be over double the overall household growth; so it is also important
to recognise that many new households will buy or rent existing housing, and not all new housing will be
occupied by new households.
Projected Household Types
6.29 When considering future need for different types of housing, it is important to recognise that households of
different ages are likely to have different housing needs. Similarly, households of different types (singles,
couples and families) within each age group will also have different housing needs.
6.30 Figure 60 shows the household numbers for 2016 and 2041 based on the trend-based projections by
household type and age; together with the net change for each group. This is based on the number in each
age category rather than the number in each age cohort, as it is assumed that the housing needs are more
likely to be influenced by the actual age rather than the year of birth.
6.31 In summary:
» Single person households represent less than 20% of the overall household growth: an
increase of 50,000 over the 25-year period, including 12,200 extra single person households
aged 85 or over;
» Couples without dependent children represent 11% of the growth: an increase of 40,700
households aged 75+ offset against a reduction of 12,200 younger couples without children;
» Families with dependent children represent less than 20% of the overall growth: an increase
of 53,100 households; and
» “Other” households represent 50% of the total, with an increase of 135,100 households over
the 25-year Plan period.
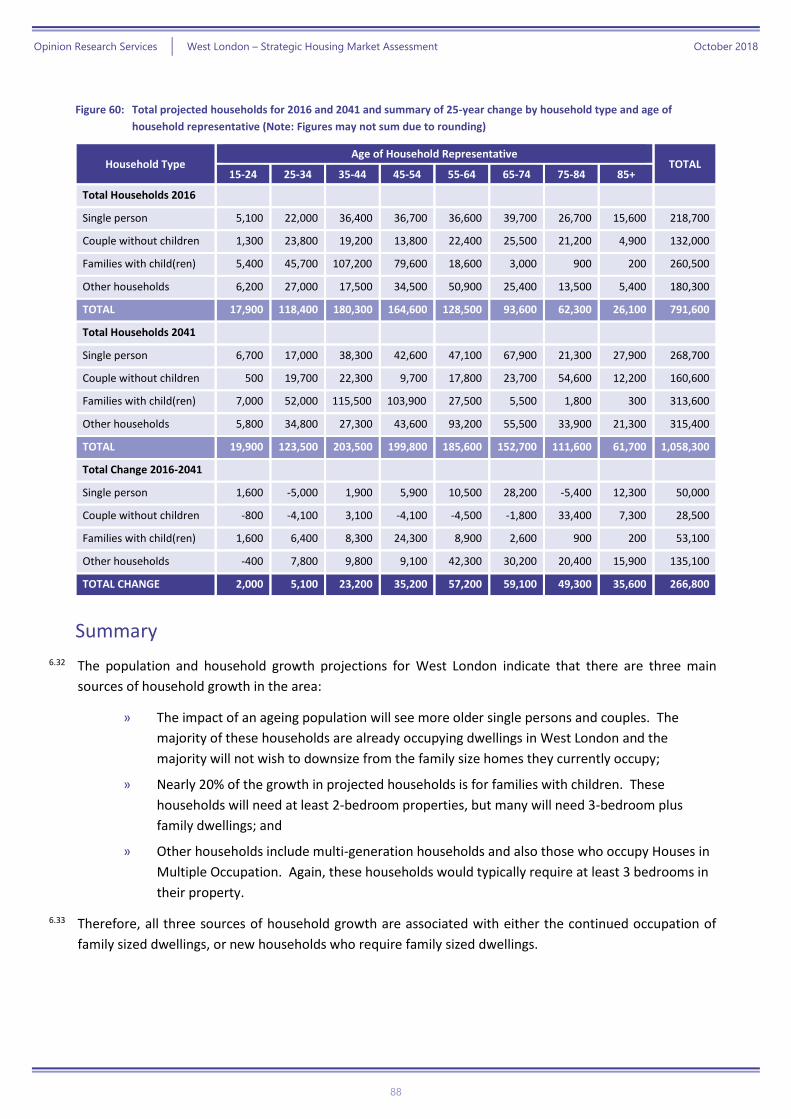
Opinion Research Services | West London – Strategic Housing Market Assessment October 2018
88
Figure 60: Total projected households for 2016 and 2041 and summary of 25-year change by household type and age of
household representative (Note: Figures may not sum due to rounding)
Household Type Age of Household Representative
TOTAL 15-24 25-34 35-44 45-54 55-64 65-74 75-84 85+
Total Households 2016
Single person 5,100 22,000 36,400 36,700 36,600 39,700 26,700 15,600 218,700
Couple without children 1,300 23,800 19,200 13,800 22,400 25,500 21,200 4,900 132,000
Families with child(ren) 5,400 45,700 107,200 79,600 18,600 3,000 900 200 260,500
Other households 6,200 27,000 17,500 34,500 50,900 25,400 13,500 5,400 180,300
TOTAL 17,900 118,400 180,300 164,600 128,500 93,600 62,300 26,100 791,600
Total Households 2041
Single person 6,700 17,000 38,300 42,600 47,100 67,900 21,300 27,900 268,700
Couple without children 500 19,700 22,300 9,700 17,800 23,700 54,600 12,200 160,600
Families with child(ren) 7,000 52,000 115,500 103,900 27,500 5,500 1,800 300 313,600
Other households 5,800 34,800 27,300 43,600 93,200 55,500 33,900 21,300 315,400
TOTAL 19,900 123,500 203,500 199,800 185,600 152,700 111,600 61,700 1,058,300
Total Change 2016-2041
Single person 1,600 -5,000 1,900 5,900 10,500 28,200 -5,400 12,300 50,000
Couple without children -800 -4,100 3,100 -4,100 -4,500 -1,800 33,400 7,300 28,500
Families with child(ren) 1,600 6,400 8,300 24,300 8,900 2,600 900 200 53,100
Other households -400 7,800 9,800 9,100 42,300 30,200 20,400 15,900 135,100
TOTAL CHANGE 2,000 5,100 23,200 35,200 57,200 59,100 49,300 35,600 266,800
Summary
6.32 The population and household growth projections for West London indicate that there are three main
sources of household growth in the area:
» The impact of an ageing population will see more older single persons and couples. The
majority of these households are already occupying dwellings in West London and the
majority will not wish to downsize from the family size homes they currently occupy;
» Nearly 20% of the growth in projected households is for families with children. These
households will need at least 2-bedroom properties, but many will need 3-bedroom plus
family dwellings; and
» Other households include multi-generation households and also those who occupy Houses in
Multiple Occupation. Again, these households would typically require at least 3 bedrooms in
their property.
6.33 Therefore, all three sources of household growth are associated with either the continued occupation of
family sized dwellings, or new households who require family sized dwellings.
Opinion Research Services | West London – Strategic Housing Market Assessment October 2018
89
People Wishing to Build their Own Homes
6.34 Paragraph 50 of the NPPF identifies that local planning authorities should plan for people wishing to build
their own homes, and PPG states:
Self-build and custom housebuilding
The government wants to enable more people to build or commission their own home and wants to
make this form of housing a mainstream housing option. From 1 April 2016, most local planning
authorities (including all district councils and National Park Authorities) are required to keep a
register of individuals and associations of individuals who are seeking to acquire serviced plots of
land in their area in order to build homes for those individuals to occupy. The Self-build and Custom
Housebuilding (Register) Regulations 2016 set out the requirements. See guidance on self-build and
custom housebuilding registers. In order to obtain a robust assessment of demand for this type of
housing in their area, local planning authorities should supplement the data from the registers with
secondary data sources such as: building plot search websites, ‘Need-a-Plot’ information available
from the Self Build Portal; and enquiries for building plots from local estate agents.
Planning Practice Guidance (March 2014, Updated April 2016), ID: 2a-021
6.35 It is important to recognise that anyone seeking to build their own property does not add to the Objectively
Assessed Needs for an area. Instead, self-build represents a mechanism for helping to meet the identified
need for market and affordable housing of an area.
6.36 Over half of the population (53%) say that they would consider building their own home27 (either directly or
using the services of architects and contractors); but it’s likely that this figure conflates aspiration with
effective market demand. Recent surveys undertaken by ORS have also identified a high level of interest in
self and custom build, but again this may have been conflating an aspiration with effective demand. Self-
build currently represents only around 10% of housing completions in the UK, compared to rates of around
40% in France and 70 to 80% elsewhere in Europe.
6.37 “Laying the Foundations – a Housing Strategy for England” (HM Government, 2011)28 redefined self-build as
‘Custom Build’ and aimed to double the size of this market, creating up to 100,000 additional homes over
the decade. “Build-it-yourself? Understanding the changing landscape of the UK self-build market”
(University of York, 2013) subsequently set out the main challenges to self-build projects and made a number
of recommendations for establishing self-build as a significant contributor to housing supply. The previous
Government also established a network of 11 Right to Build ‘Vanguards’ to test how the ‘Right to Build’ could
work in practice in a range of different circumstances.
6.38 In May 2012 a Self-Build Portal29 run by the National Custom and Self Build Association (NCaSBA) was
launched. Figure 61 shows the current registrations from groups and individuals looking for land in the West
London Sub-Region on the ‘Need-a-Plot’ section of the portal. Whilst there is clearly some interest in self-
build across West London, this represents only a very limited number of people and an exceptionally small
proportion of the overall housing need identified each year over the area.
27 Building Societies Association Survey of 2,051 UK consumers 2011 28 https://www.gov.uk/government/publications/laying-the-foundations-a-housing-strategy-for-england--2 29 http://www.selfbuildportal.org.uk/
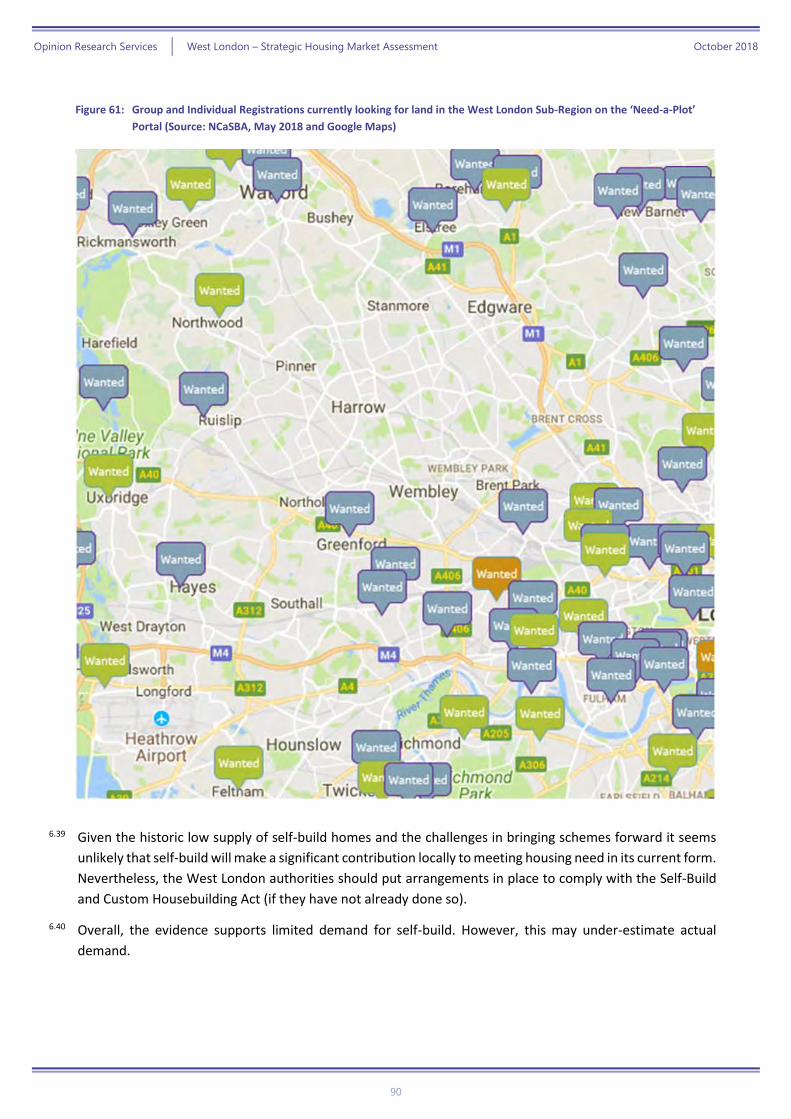
Opinion Research Services | West London – Strategic Housing Market Assessment October 2018
90
Figure 61: Group and Individual Registrations currently looking for land in the West London Sub-Region on the ‘Need-a-Plot’
Portal (Source: NCaSBA, May 2018 and Google Maps)
6.39 Given the historic low supply of self-build homes and the challenges in bringing schemes forward it seems
unlikely that self-build will make a significant contribution locally to meeting housing need in its current form.
Nevertheless, the West London authorities should put arrangements in place to comply with the Self-Build
and Custom Housebuilding Act (if they have not already done so).
6.40 Overall, the evidence supports limited demand for self-build. However, this may under-estimate actual
demand.
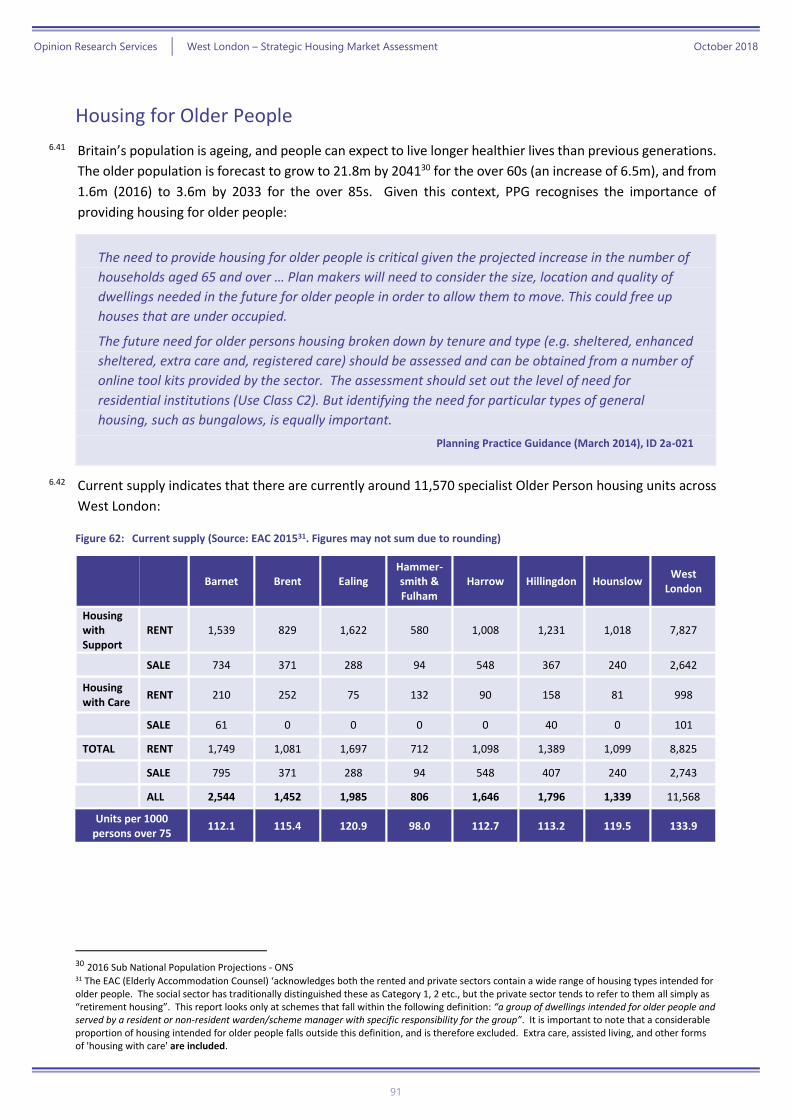
Opinion Research Services | West London – Strategic Housing Market Assessment October 2018
91
Housing for Older People
6.41 Britain’s population is ageing, and people can expect to live longer healthier lives than previous generations.
The older population is forecast to grow to 21.8m by 204130 for the over 60s (an increase of 6.5m), and from
1.6m (2016) to 3.6m by 2033 for the over 85s. Given this context, PPG recognises the importance of
providing housing for older people:
The need to provide housing for older people is critical given the projected increase in the number of
households aged 65 and over … Plan makers will need to consider the size, location and quality of
dwellings needed in the future for older people in order to allow them to move. This could free up
houses that are under occupied.
The future need for older persons housing broken down by tenure and type (e.g. sheltered, enhanced
sheltered, extra care and, registered care) should be assessed and can be obtained from a number of
online tool kits provided by the sector. The assessment should set out the level of need for
residential institutions (Use Class C2). But identifying the need for particular types of general
housing, such as bungalows, is equally important.
Planning Practice Guidance (March 2014), ID 2a-021
6.42 Current supply indicates that there are currently around 11,570 specialist Older Person housing units across
West London:
Figure 62: Current supply (Source: EAC 201531. Figures may not sum due to rounding)
Barnet Brent Ealing Hammer-smith & Fulham
Harrow Hillingdon Hounslow West
London
Housing with Support
RENT 1,539 829 1,622 580 1,008 1,231 1,018 7,827
SALE 734 371 288 94 548 367 240 2,642
Housing with Care
RENT 210 252 75 132 90 158 81 998
SALE 61 0 0 0 0 40 0 101
TOTAL RENT 1,749 1,081 1,697 712 1,098 1,389 1,099 8,825
SALE 795 371 288 94 548 407 240 2,743
ALL 2,544 1,452 1,985 806 1,646 1,796 1,339 11,568
Units per 1000 persons over 75
112.1 115.4 120.9 98.0 112.7 113.2 119.5 133.9
30 2016 Sub National Population Projections - ONS 31 The EAC (Elderly Accommodation Counsel) ‘acknowledges both the rented and private sectors contain a wide range of housing types intended for older people. The social sector has traditionally distinguished these as Category 1, 2 etc., but the private sector tends to refer to them all simply as “retirement housing”. This report looks only at schemes that fall within the following definition: “a group of dwellings intended for older people and served by a resident or non-resident warden/scheme manager with specific responsibility for the group”. It is important to note that a considerable proportion of housing intended for older people falls outside this definition, and is therefore excluded. Extra care, assisted living, and other forms of 'housing with care' are included.
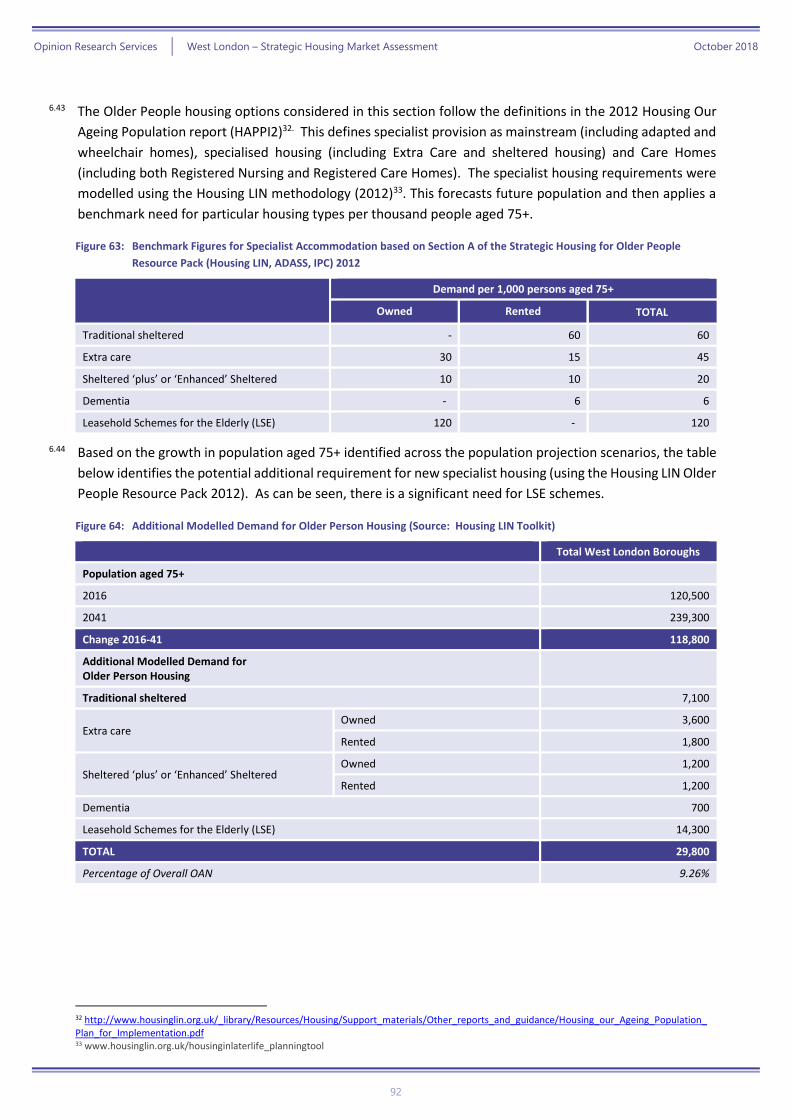
Opinion Research Services | West London – Strategic Housing Market Assessment October 2018
92
6.43 The Older People housing options considered in this section follow the definitions in the 2012 Housing Our
Ageing Population report (HAPPI2)32. This defines specialist provision as mainstream (including adapted and
wheelchair homes), specialised housing (including Extra Care and sheltered housing) and Care Homes
(including both Registered Nursing and Registered Care Homes). The specialist housing requirements were
modelled using the Housing LIN methodology (2012)33. This forecasts future population and then applies a
benchmark need for particular housing types per thousand people aged 75+.
Figure 63: Benchmark Figures for Specialist Accommodation based on Section A of the Strategic Housing for Older People
Resource Pack (Housing LIN, ADASS, IPC) 2012
Demand per 1,000 persons aged 75+
Owned Rented TOTAL
Traditional sheltered - 60 60
Extra care 30 15 45
Sheltered ‘plus’ or ‘Enhanced’ Sheltered 10 10 20
Dementia - 6 6
Leasehold Schemes for the Elderly (LSE) 120 - 120
6.44 Based on the growth in population aged 75+ identified across the population projection scenarios, the table
below identifies the potential additional requirement for new specialist housing (using the Housing LIN Older
People Resource Pack 2012). As can be seen, there is a significant need for LSE schemes.
Figure 64: Additional Modelled Demand for Older Person Housing (Source: Housing LIN Toolkit)
Total West London Boroughs
Population aged 75+
2016 120,500
2041 239,300
Change 2016-41 118,800
Additional Modelled Demand for Older Person Housing
Traditional sheltered 7,100
Extra care Owned 3,600
Rented 1,800
Sheltered ‘plus’ or ‘Enhanced’ Sheltered Owned 1,200
Rented 1,200
Dementia 700
Leasehold Schemes for the Elderly (LSE) 14,300
TOTAL 29,800
Percentage of Overall OAN 9.26%
32 http://www.housinglin.org.uk/_library/Resources/Housing/Support_materials/Other_reports_and_guidance/Housing_our_Ageing_Population_ Plan_for_Implementation.pdf 33 www.housinglin.org.uk/housinginlaterlife_planningtool
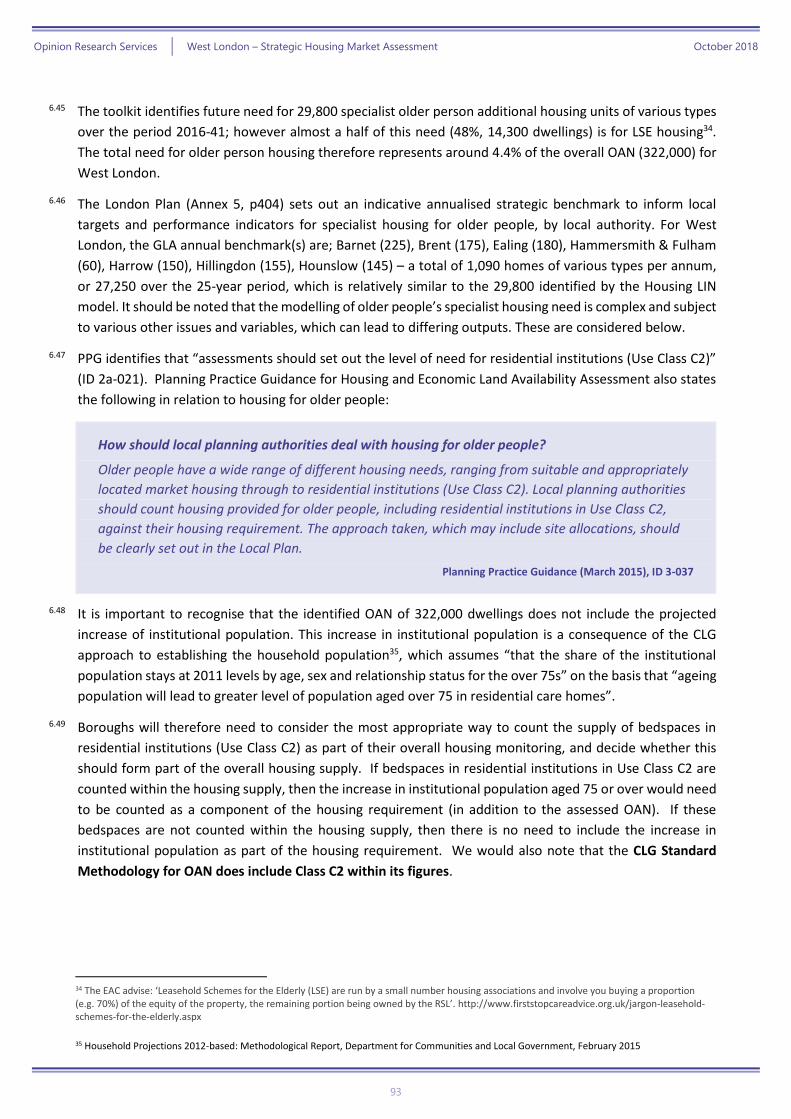
Opinion Research Services | West London – Strategic Housing Market Assessment October 2018
93
6.45 The toolkit identifies future need for 29,800 specialist older person additional housing units of various types
over the period 2016-41; however almost a half of this need (48%, 14,300 dwellings) is for LSE housing34.
The total need for older person housing therefore represents around 4.4% of the overall OAN (322,000) for
West London.
6.46 The London Plan (Annex 5, p404) sets out an indicative annualised strategic benchmark to inform local
targets and performance indicators for specialist housing for older people, by local authority. For West
London, the GLA annual benchmark(s) are; Barnet (225), Brent (175), Ealing (180), Hammersmith & Fulham
(60), Harrow (150), Hillingdon (155), Hounslow (145) – a total of 1,090 homes of various types per annum,
or 27,250 over the 25-year period, which is relatively similar to the 29,800 identified by the Housing LIN
model. It should be noted that the modelling of older people’s specialist housing need is complex and subject
to various other issues and variables, which can lead to differing outputs. These are considered below.
6.47 PPG identifies that “assessments should set out the level of need for residential institutions (Use Class C2)”
(ID 2a-021). Planning Practice Guidance for Housing and Economic Land Availability Assessment also states
the following in relation to housing for older people:
How should local planning authorities deal with housing for older people?
Older people have a wide range of different housing needs, ranging from suitable and appropriately
located market housing through to residential institutions (Use Class C2). Local planning authorities
should count housing provided for older people, including residential institutions in Use Class C2,
against their housing requirement. The approach taken, which may include site allocations, should
be clearly set out in the Local Plan.
Planning Practice Guidance (March 2015), ID 3-037
6.48 It is important to recognise that the identified OAN of 322,000 dwellings does not include the projected
increase of institutional population. This increase in institutional population is a consequence of the CLG
approach to establishing the household population35, which assumes “that the share of the institutional
population stays at 2011 levels by age, sex and relationship status for the over 75s” on the basis that “ageing
population will lead to greater level of population aged over 75 in residential care homes”.
6.49 Boroughs will therefore need to consider the most appropriate way to count the supply of bedspaces in
residential institutions (Use Class C2) as part of their overall housing monitoring, and decide whether this
should form part of the overall housing supply. If bedspaces in residential institutions in Use Class C2 are
counted within the housing supply, then the increase in institutional population aged 75 or over would need
to be counted as a component of the housing requirement (in addition to the assessed OAN). If these
bedspaces are not counted within the housing supply, then there is no need to include the increase in
institutional population as part of the housing requirement. We would also note that the CLG Standard
Methodology for OAN does include Class C2 within its figures.
34 The EAC advise: ‘Leasehold Schemes for the Elderly (LSE) are run by a small number housing associations and involve you buying a proportion (e.g. 70%) of the equity of the property, the remaining portion being owned by the RSL’. http://www.firststopcareadvice.org.uk/jargon-leasehold-schemes-for-the-elderly.aspx
35 Household Projections 2012-based: Methodological Report, Department for Communities and Local Government, February 2015
Opinion Research Services | West London – Strategic Housing Market Assessment October 2018
94
6.50 Although the institutional population is projected to increase by around 7,700 persons over the Plan period
2016-41 (based on the CLG assumption that there will be a “greater level of population aged over 75 in
residential care homes”), it does not necessarily follow that all of this need should be provided as additional
bedspaces in residential institutions in Use Class C2 – but any reduction in the growth of institutional
population aged 75 or over would need to be offset against higher growth for these age groups in the
household population; which would yield more households than assumed when establishing the OAN.
6.51 As a consequence, if fewer older people are expected to live in communal establishments than is currently
projected, the needs of any additional older people in the household population would need to be counted
in addition to the assessed OAN.
Housing for People with Disabilities
6.52 Paragraph 50 of the NPPF identifies that local planning authorities should plan households with specific
needs, and PPG states:
Households with specific needs
There is no one source of information about disabled people who require adaptations in the home,
either now or in the future.
The Census provides information on the number of people with long-term limiting illness and plan
makers can access information from the Department of Work and Pensions on the numbers of
Disability Living Allowance/Attendance Allowance benefit claimants. Whilst these data can provide
a good indication of the number of disabled people, not all of the people included within these
counts will require adaptations in the home.
Applications for Disabled Facilities Grant will provide an indication of levels of expressed need,
although this could underestimate total need. If necessary, plan makers can engage with partners
to better understand their housing requirements.
Planning Practice Guidance (March 2015), ID 2a-021
6.53 Personal Independence Payments started to replace the Disability Living Allowance from April 2013, and
these are awarded to people aged under 65 years who incur extra costs due to disability (although there is
no upper age limit once awarded, providing that applicants continue to satisfy either the care or mobility
conditions). Attendance Allowance contributes to the cost of personal care for people who are physically or
mentally disabled and who are aged 65 or over. Nevertheless, PPG recognises that neither of these sources
provides information about the need for adapted homes as “not all of the people included within these counts
will require adaptations in the home”.
6.54 Disabled Facilities Grants (DFG) are normally provided by Councils and housing associations to adapt
properties for individuals with health and/or mobility needs who are owner occupiers, or renting from a
private landlord, housing association or council. Grants cover a range of works, ranging from major building
works, major adaptations to the property and minor adaptations,
6.55 However, PPG notes that whilst patterns of DFG applications “provide an indication of expressed need” it
cautions that this could “underestimate need”. Of course, it is also important to recognise that DFGs typically
relate to adaptations to the existing housing stock rather than new housing provision.
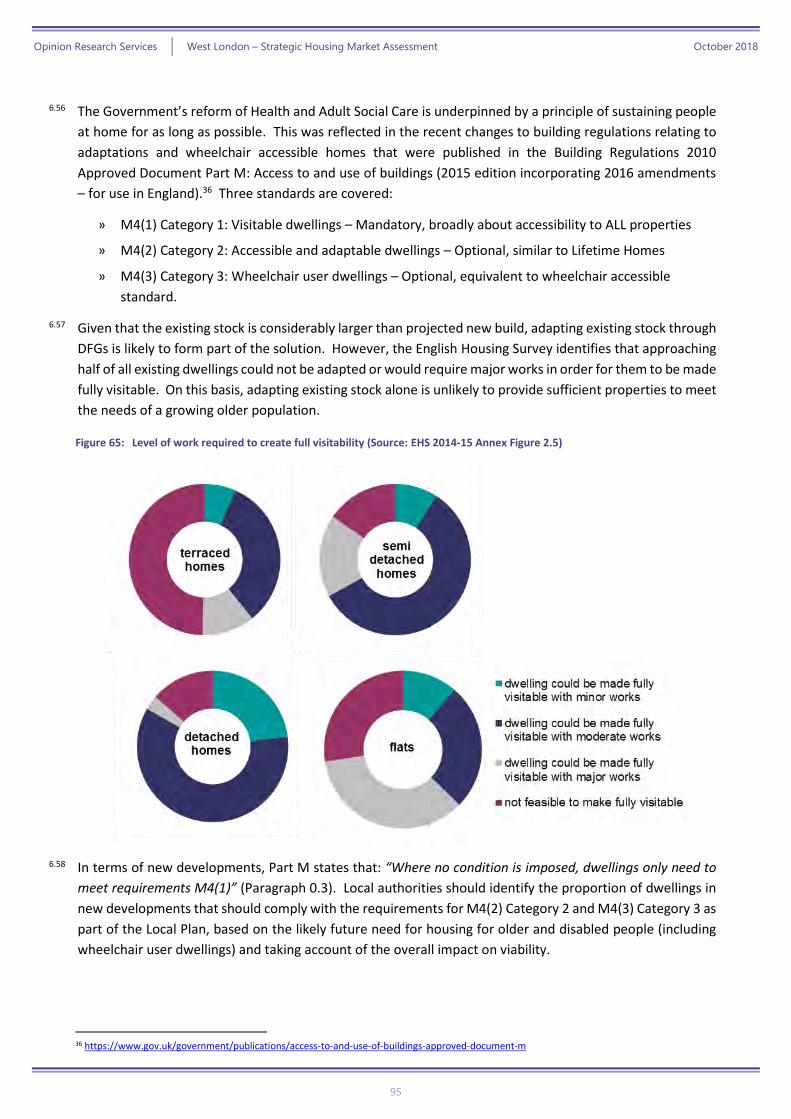
Opinion Research Services | West London – Strategic Housing Market Assessment October 2018
95
6.56 The Government’s reform of Health and Adult Social Care is underpinned by a principle of sustaining people
at home for as long as possible. This was reflected in the recent changes to building regulations relating to
adaptations and wheelchair accessible homes that were published in the Building Regulations 2010
Approved Document Part M: Access to and use of buildings (2015 edition incorporating 2016 amendments
– for use in England).36 Three standards are covered:
» M4(1) Category 1: Visitable dwellings – Mandatory, broadly about accessibility to ALL properties
» M4(2) Category 2: Accessible and adaptable dwellings – Optional, similar to Lifetime Homes
» M4(3) Category 3: Wheelchair user dwellings – Optional, equivalent to wheelchair accessible
standard.
6.57 Given that the existing stock is considerably larger than projected new build, adapting existing stock through
DFGs is likely to form part of the solution. However, the English Housing Survey identifies that approaching
half of all existing dwellings could not be adapted or would require major works in order for them to be made
fully visitable. On this basis, adapting existing stock alone is unlikely to provide sufficient properties to meet
the needs of a growing older population.
Figure 65: Level of work required to create full visitability (Source: EHS 2014-15 Annex Figure 2.5)
6.58 In terms of new developments, Part M states that: “Where no condition is imposed, dwellings only need to
meet requirements M4(1)” (Paragraph 0.3). Local authorities should identify the proportion of dwellings in
new developments that should comply with the requirements for M4(2) Category 2 and M4(3) Category 3 as
part of the Local Plan, based on the likely future need for housing for older and disabled people (including
wheelchair user dwellings) and taking account of the overall impact on viability.
36 https://www.gov.uk/government/publications/access-to-and-use-of-buildings-approved-document-m
Opinion Research Services | West London – Strategic Housing Market Assessment October 2018
96
6.59 Planning Practice Guidance for Housing optional technical standards states:
Based on their housing needs assessment and other available datasets it will be for local planning
authorities to set out how they intend to approach demonstrating the need for Requirement M4(2)
(accessible and adaptable dwellings), and / or M4(3) (wheelchair user dwellings), of the Building
Regulations.
To assist local planning authorities in appraising this data the Government has produced a
summary data sheet. This sets out in one place useful data and sources of further information which
planning authorities can draw from to inform their assessments. It will reduce the time needed for
undertaking the assessment and thereby avoid replicating some elements of the work.
Planning Practice Guidance (March 2015), ID 56-007
6.60 Building Regulations for M4(2) Category 2: Accessible and adaptable dwellings states that reasonable
provision should be made for people to gain access to and use the facilities of the dwelling and that:
“The provision made must be sufficient to-
(a) meet the needs of occupants with differing needs, including some older or
disabled people, and;
(b) to allow adaptation of the dwelling to meet the changing needs of occupants
over time.” (Page 10)
6.61 On this basis, in establishing the need for M4(2) Category 2 housing it is important to consider the population
projections and health demographics of the area.
6.62 When considering the housing mix, the SHMA identified that many households moving into new housing are
likely to be younger at the time that they form. However, these will include some households with mobility
problems. Furthermore, it is likely that the needs of these households will change over time – partly through
progressive change as health deteriorates with households get older, but also immediate change following
an accident or health condition impacting mobility. Some households may also gain additional members
with existing conditions, including children born with disabilities.
6.63 The SHMA also identified a substantial growth in older households, although many of these will not move
from their current home and will make adaptations as required to meet their needs. However, a large
number of older households will still choose to move to an accessible home and others may have to move
where it is not viable for their current home to be adapted. Not all of these households want to live in
specialist older person housing, so it is important to ensure that accessible general needs housing that is
suitable for older people is also provided. This will often free up family housing occupied by older
households.
6.64 Not all health problems will affect households’ housing needs. Data from the English Housing Survey
identifies that 70.9% of households have no limiting long-term illness or disability with a further 20.3% where
there is a household member with an illness or disability but this does not affect their housing need.
Nevertheless, around 8.8% of households (around 1 in every 12) have one or more persons with a health
problem which requires adaptations to their home. The proportion is markedly higher in affordable housing
than in market housing (19.8% and 6.5% respectively).
6.65 Within this group, the substantial majority of households (82.6%) live in a home that is suitable for their
needs (either having already moved or adapted their existing home). Nevertheless, just over 17% of
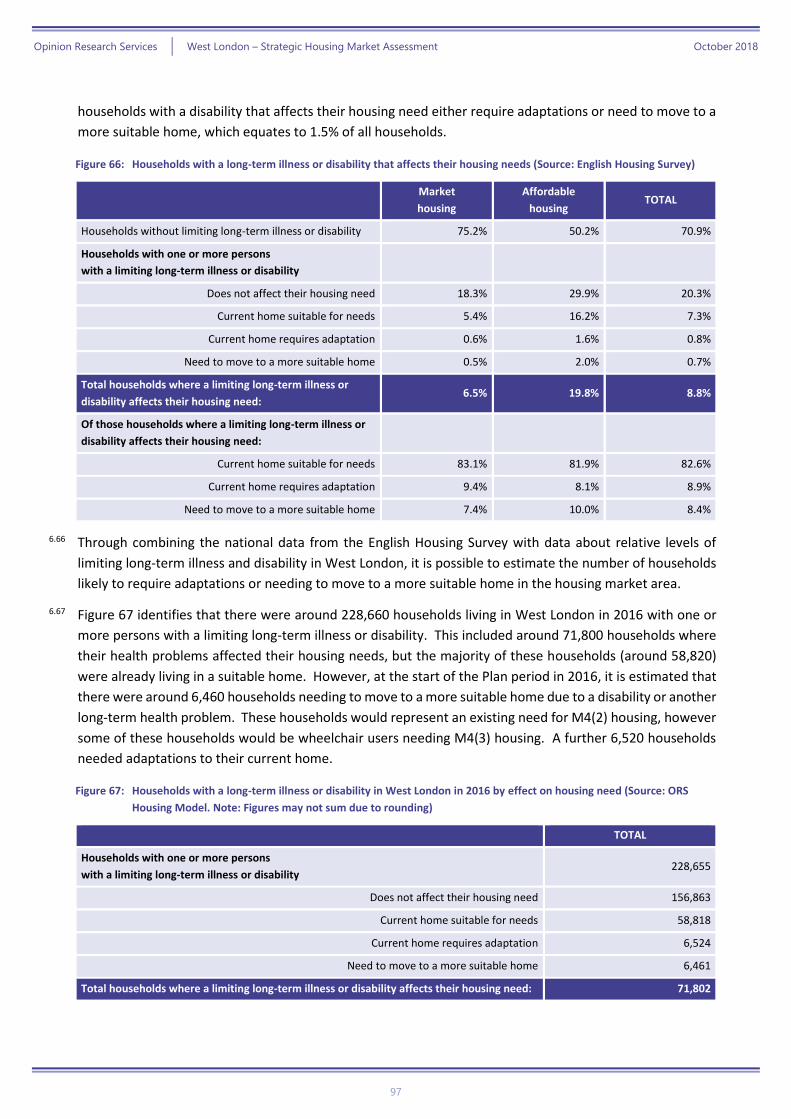
Opinion Research Services | West London – Strategic Housing Market Assessment October 2018
97
households with a disability that affects their housing need either require adaptations or need to move to a
more suitable home, which equates to 1.5% of all households.
Figure 66: Households with a long-term illness or disability that affects their housing needs (Source: English Housing Survey)
Market
housing
Affordable
housing TOTAL
Households without limiting long-term illness or disability 75.2% 50.2% 70.9%
Households with one or more persons
with a limiting long-term illness or disability
Does not affect their housing need 18.3% 29.9% 20.3%
Current home suitable for needs 5.4% 16.2% 7.3%
Current home requires adaptation 0.6% 1.6% 0.8%
Need to move to a more suitable home 0.5% 2.0% 0.7%
Total households where a limiting long-term illness or
disability affects their housing need: 6.5% 19.8% 8.8%
Of those households where a limiting long-term illness or
disability affects their housing need:
Current home suitable for needs 83.1% 81.9% 82.6%
Current home requires adaptation 9.4% 8.1% 8.9%
Need to move to a more suitable home 7.4% 10.0% 8.4%
6.66 Through combining the national data from the English Housing Survey with data about relative levels of
limiting long-term illness and disability in West London, it is possible to estimate the number of households
likely to require adaptations or needing to move to a more suitable home in the housing market area.
6.67 Figure 67 identifies that there were around 228,660 households living in West London in 2016 with one or
more persons with a limiting long-term illness or disability. This included around 71,800 households where
their health problems affected their housing needs, but the majority of these households (around 58,820)
were already living in a suitable home. However, at the start of the Plan period in 2016, it is estimated that
there were around 6,460 households needing to move to a more suitable home due to a disability or another
long-term health problem. These households would represent an existing need for M4(2) housing, however
some of these households would be wheelchair users needing M4(3) housing. A further 6,520 households
needed adaptations to their current home.
Figure 67: Households with a long-term illness or disability in West London in 2016 by effect on housing need (Source: ORS
Housing Model. Note: Figures may not sum due to rounding)
TOTAL
Households with one or more persons
with a limiting long-term illness or disability 228,655
Does not affect their housing need 156,863
Current home suitable for needs 58,818
Current home requires adaptation 6,524
Need to move to a more suitable home 6,461
Total households where a limiting long-term illness or disability affects their housing need: 71,802
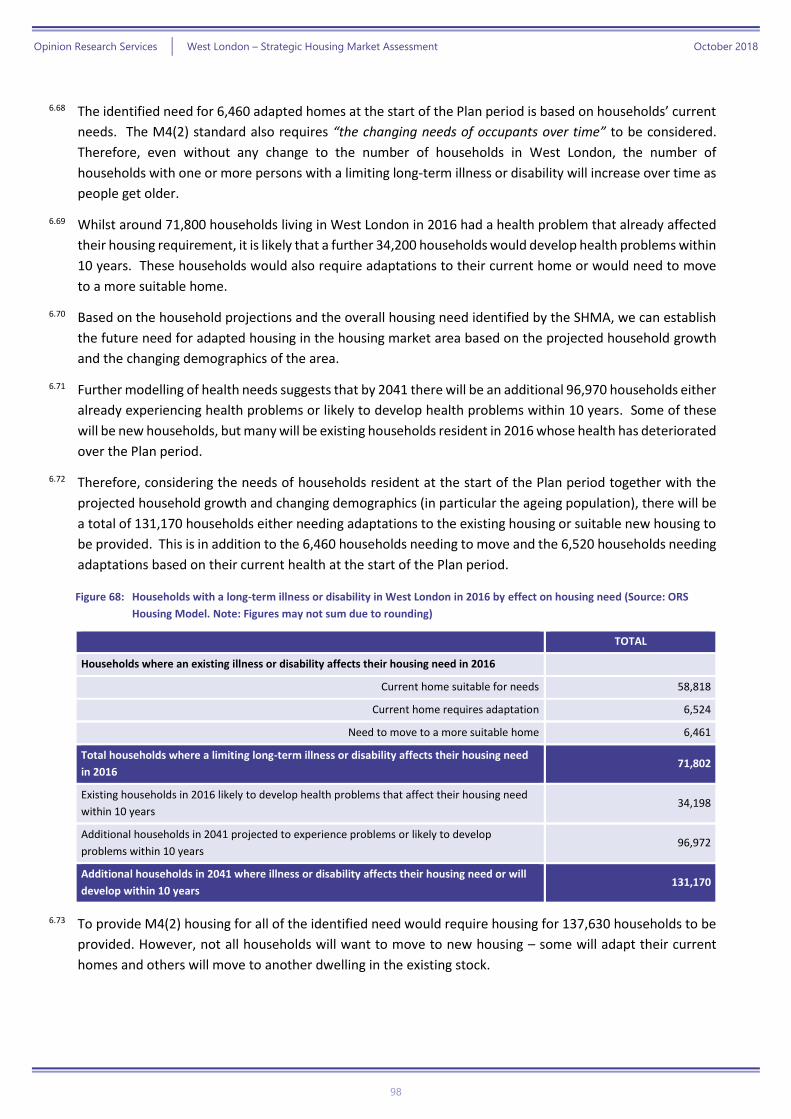
Opinion Research Services | West London – Strategic Housing Market Assessment October 2018
98
6.68 The identified need for 6,460 adapted homes at the start of the Plan period is based on households’ current
needs. The M4(2) standard also requires “the changing needs of occupants over time” to be considered.
Therefore, even without any change to the number of households in West London, the number of
households with one or more persons with a limiting long-term illness or disability will increase over time as
people get older.
6.69 Whilst around 71,800 households living in West London in 2016 had a health problem that already affected
their housing requirement, it is likely that a further 34,200 households would develop health problems within
10 years. These households would also require adaptations to their current home or would need to move
to a more suitable home.
6.70 Based on the household projections and the overall housing need identified by the SHMA, we can establish
the future need for adapted housing in the housing market area based on the projected household growth
and the changing demographics of the area.
6.71 Further modelling of health needs suggests that by 2041 there will be an additional 96,970 households either
already experiencing health problems or likely to develop health problems within 10 years. Some of these
will be new households, but many will be existing households resident in 2016 whose health has deteriorated
over the Plan period.
6.72 Therefore, considering the needs of households resident at the start of the Plan period together with the
projected household growth and changing demographics (in particular the ageing population), there will be
a total of 131,170 households either needing adaptations to the existing housing or suitable new housing to
be provided. This is in addition to the 6,460 households needing to move and the 6,520 households needing
adaptations based on their current health at the start of the Plan period.
Figure 68: Households with a long-term illness or disability in West London in 2016 by effect on housing need (Source: ORS
Housing Model. Note: Figures may not sum due to rounding)
TOTAL
Households where an existing illness or disability affects their housing need in 2016
Current home suitable for needs 58,818
Current home requires adaptation 6,524
Need to move to a more suitable home 6,461
Total households where a limiting long-term illness or disability affects their housing need
in 2016 71,802
Existing households in 2016 likely to develop health problems that affect their housing need
within 10 years 34,198
Additional households in 2041 projected to experience problems or likely to develop
problems within 10 years 96,972
Additional households in 2041 where illness or disability affects their housing need or will
develop within 10 years 131,170
6.73 To provide M4(2) housing for all of the identified need would require housing for 137,630 households to be
provided. However, not all households will want to move to new housing – some will adapt their current
homes and others will move to another dwelling in the existing stock.
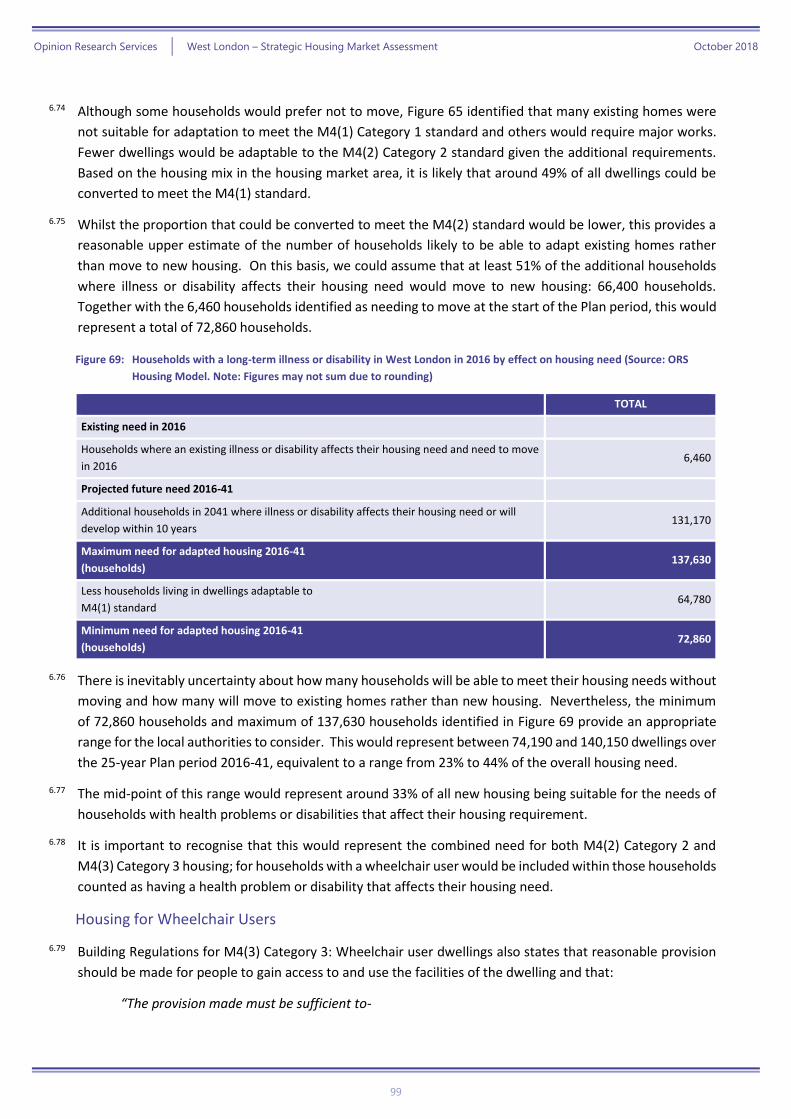
Opinion Research Services | West London – Strategic Housing Market Assessment October 2018
99
6.74 Although some households would prefer not to move, Figure 65 identified that many existing homes were
not suitable for adaptation to meet the M4(1) Category 1 standard and others would require major works.
Fewer dwellings would be adaptable to the M4(2) Category 2 standard given the additional requirements.
Based on the housing mix in the housing market area, it is likely that around 49% of all dwellings could be
converted to meet the M4(1) standard.
6.75 Whilst the proportion that could be converted to meet the M4(2) standard would be lower, this provides a
reasonable upper estimate of the number of households likely to be able to adapt existing homes rather
than move to new housing. On this basis, we could assume that at least 51% of the additional households
where illness or disability affects their housing need would move to new housing: 66,400 households.
Together with the 6,460 households identified as needing to move at the start of the Plan period, this would
represent a total of 72,860 households.
Figure 69: Households with a long-term illness or disability in West London in 2016 by effect on housing need (Source: ORS
Housing Model. Note: Figures may not sum due to rounding)
TOTAL
Existing need in 2016
Households where an existing illness or disability affects their housing need and need to move
in 2016 6,460
Projected future need 2016-41
Additional households in 2041 where illness or disability affects their housing need or will
develop within 10 years 131,170
Maximum need for adapted housing 2016-41
(households) 137,630
Less households living in dwellings adaptable to
M4(1) standard 64,780
Minimum need for adapted housing 2016-41
(households) 72,860
6.76 There is inevitably uncertainty about how many households will be able to meet their housing needs without
moving and how many will move to existing homes rather than new housing. Nevertheless, the minimum
of 72,860 households and maximum of 137,630 households identified in Figure 69 provide an appropriate
range for the local authorities to consider. This would represent between 74,190 and 140,150 dwellings over
the 25-year Plan period 2016-41, equivalent to a range from 23% to 44% of the overall housing need.
6.77 The mid-point of this range would represent around 33% of all new housing being suitable for the needs of
households with health problems or disabilities that affect their housing requirement.
6.78 It is important to recognise that this would represent the combined need for both M4(2) Category 2 and
M4(3) Category 3 housing; for households with a wheelchair user would be included within those households
counted as having a health problem or disability that affects their housing need.
Housing for Wheelchair Users
6.79 Building Regulations for M4(3) Category 3: Wheelchair user dwellings also states that reasonable provision
should be made for people to gain access to and use the facilities of the dwelling and that:
“The provision made must be sufficient to-
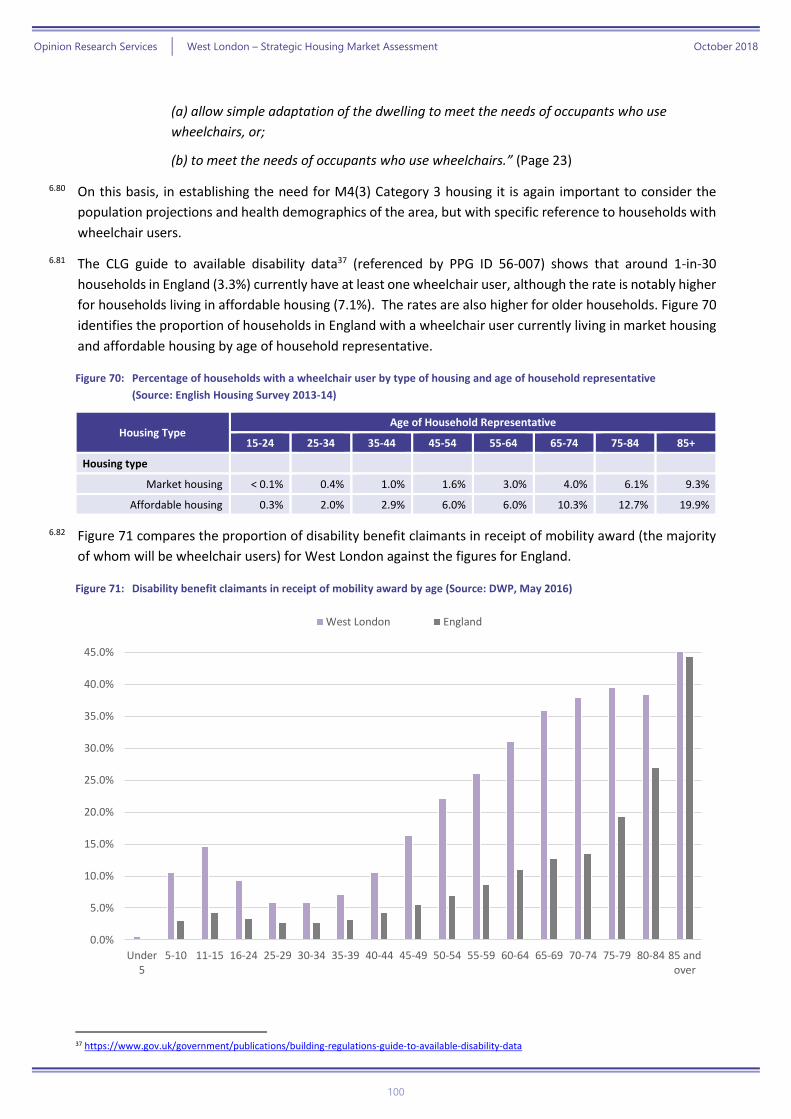
Opinion Research Services | West London – Strategic Housing Market Assessment October 2018
100
(a) allow simple adaptation of the dwelling to meet the needs of occupants who use
wheelchairs, or;
(b) to meet the needs of occupants who use wheelchairs.” (Page 23)
6.80 On this basis, in establishing the need for M4(3) Category 3 housing it is again important to consider the
population projections and health demographics of the area, but with specific reference to households with
wheelchair users.
6.81 The CLG guide to available disability data37 (referenced by PPG ID 56-007) shows that around 1-in-30
households in England (3.3%) currently have at least one wheelchair user, although the rate is notably higher
for households living in affordable housing (7.1%). The rates are also higher for older households. Figure 70
identifies the proportion of households in England with a wheelchair user currently living in market housing
and affordable housing by age of household representative.
Figure 70: Percentage of households with a wheelchair user by type of housing and age of household representative
(Source: English Housing Survey 2013-14)
Housing Type Age of Household Representative
15-24 25-34 35-44 45-54 55-64 65-74 75-84 85+
Housing type
Market housing < 0.1% 0.4% 1.0% 1.6% 3.0% 4.0% 6.1% 9.3%
Affordable housing 0.3% 2.0% 2.9% 6.0% 6.0% 10.3% 12.7% 19.9%
6.82 Figure 71 compares the proportion of disability benefit claimants in receipt of mobility award (the majority
of whom will be wheelchair users) for West London against the figures for England.
Figure 71: Disability benefit claimants in receipt of mobility award by age (Source: DWP, May 2016)
37 https://www.gov.uk/government/publications/building-regulations-guide-to-available-disability-data
0.0%
5.0%
10.0%
15.0%
20.0%
25.0%
30.0%
35.0%
40.0%
45.0%
Under5
5-10 11-15 16-24 25-29 30-34 35-39 40-44 45-49 50-54 55-59 60-64 65-69 70-74 75-79 80-84 85 andover
West London England
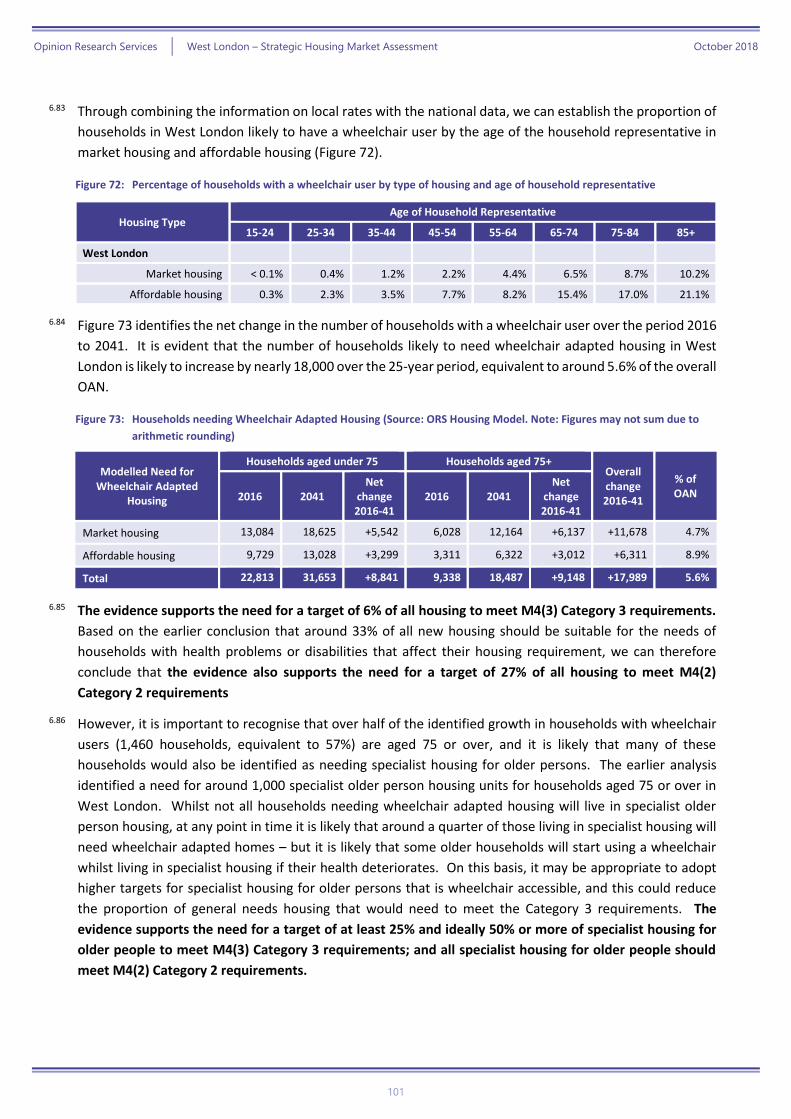
Opinion Research Services | West London – Strategic Housing Market Assessment October 2018
101
6.83 Through combining the information on local rates with the national data, we can establish the proportion of
households in West London likely to have a wheelchair user by the age of the household representative in
market housing and affordable housing (Figure 72).
Figure 72: Percentage of households with a wheelchair user by type of housing and age of household representative
Housing Type Age of Household Representative
15-24 25-34 35-44 45-54 55-64 65-74 75-84 85+
West London
Market housing < 0.1% 0.4% 1.2% 2.2% 4.4% 6.5% 8.7% 10.2%
Affordable housing 0.3% 2.3% 3.5% 7.7% 8.2% 15.4% 17.0% 21.1%
6.84 Figure 73 identifies the net change in the number of households with a wheelchair user over the period 2016
to 2041. It is evident that the number of households likely to need wheelchair adapted housing in West
London is likely to increase by nearly 18,000 over the 25-year period, equivalent to around 5.6% of the overall
OAN.
Figure 73: Households needing Wheelchair Adapted Housing (Source: ORS Housing Model. Note: Figures may not sum due to
arithmetic rounding)
Modelled Need for Wheelchair Adapted
Housing
Households aged under 75 Households aged 75+ Overall change 2016-41
% of OAN 2016 2041
Net change 2016-41
2016 2041 Net
change 2016-41
Market housing 13,084 18,625 +5,542 6,028 12,164 +6,137 +11,678 4.7%
Affordable housing 9,729 13,028 +3,299 3,311 6,322 +3,012 +6,311 8.9%
Total 22,813 31,653 +8,841 9,338 18,487 +9,148 +17,989 5.6%
6.85 The evidence supports the need for a target of 6% of all housing to meet M4(3) Category 3 requirements.
Based on the earlier conclusion that around 33% of all new housing should be suitable for the needs of
households with health problems or disabilities that affect their housing requirement, we can therefore
conclude that the evidence also supports the need for a target of 27% of all housing to meet M4(2)
Category 2 requirements
6.86 However, it is important to recognise that over half of the identified growth in households with wheelchair
users (1,460 households, equivalent to 57%) are aged 75 or over, and it is likely that many of these
households would also be identified as needing specialist housing for older persons. The earlier analysis
identified a need for around 1,000 specialist older person housing units for households aged 75 or over in
West London. Whilst not all households needing wheelchair adapted housing will live in specialist older
person housing, at any point in time it is likely that around a quarter of those living in specialist housing will
need wheelchair adapted homes – but it is likely that some older households will start using a wheelchair
whilst living in specialist housing if their health deteriorates. On this basis, it may be appropriate to adopt
higher targets for specialist housing for older persons that is wheelchair accessible, and this could reduce
the proportion of general needs housing that would need to meet the Category 3 requirements. The
evidence supports the need for a target of at least 25% and ideally 50% or more of specialist housing for
older people to meet M4(3) Category 3 requirements; and all specialist housing for older people should
meet M4(2) Category 2 requirements.
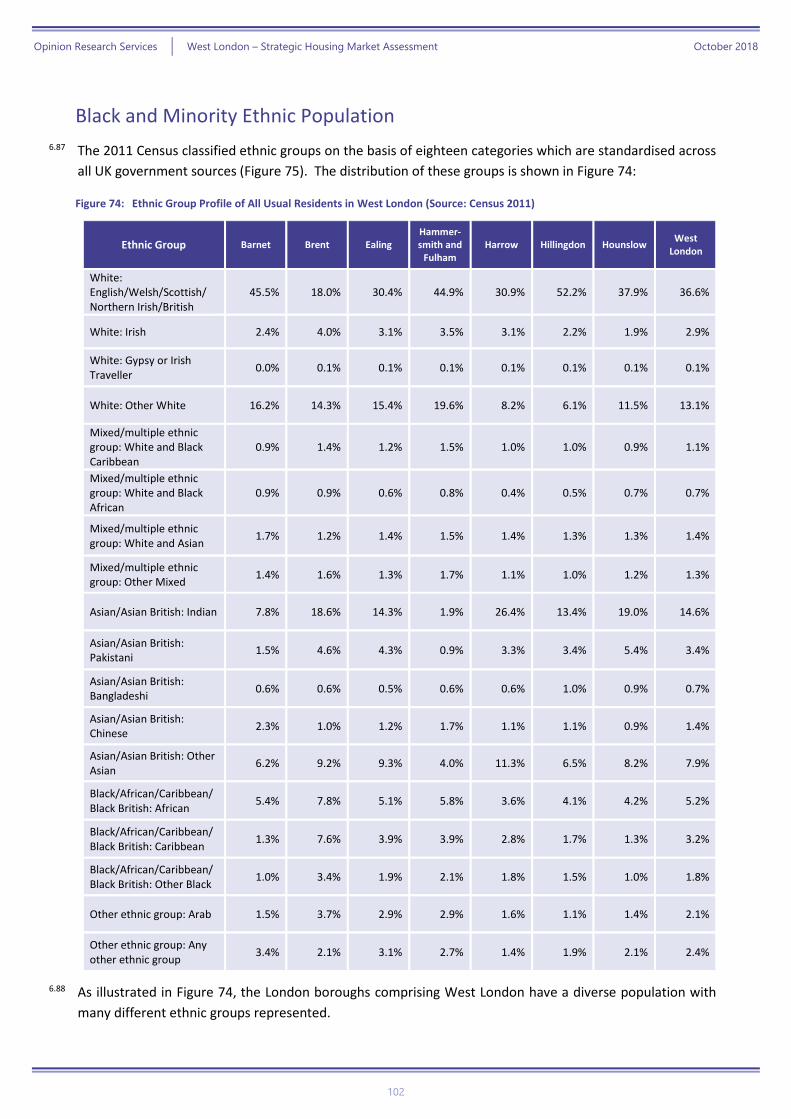
Opinion Research Services | West London – Strategic Housing Market Assessment October 2018
102
Black and Minority Ethnic Population
6.87 The 2011 Census classified ethnic groups on the basis of eighteen categories which are standardised across
all UK government sources (Figure 75). The distribution of these groups is shown in Figure 74:
Figure 74: Ethnic Group Profile of All Usual Residents in West London (Source: Census 2011)
Ethnic Group Barnet Brent Ealing Hammer-smith and
Fulham Harrow Hillingdon Hounslow
West London
White: English/Welsh/Scottish/ Northern Irish/British
45.5% 18.0% 30.4% 44.9% 30.9% 52.2% 37.9% 36.6%
White: Irish 2.4% 4.0% 3.1% 3.5% 3.1% 2.2% 1.9% 2.9%
White: Gypsy or Irish Traveller
0.0% 0.1% 0.1% 0.1% 0.1% 0.1% 0.1% 0.1%
White: Other White 16.2% 14.3% 15.4% 19.6% 8.2% 6.1% 11.5% 13.1%
Mixed/multiple ethnic group: White and Black Caribbean
0.9% 1.4% 1.2% 1.5% 1.0% 1.0% 0.9% 1.1%
Mixed/multiple ethnic group: White and Black African
0.9% 0.9% 0.6% 0.8% 0.4% 0.5% 0.7% 0.7%
Mixed/multiple ethnic group: White and Asian
1.7% 1.2% 1.4% 1.5% 1.4% 1.3% 1.3% 1.4%
Mixed/multiple ethnic group: Other Mixed
1.4% 1.6% 1.3% 1.7% 1.1% 1.0% 1.2% 1.3%
Asian/Asian British: Indian 7.8% 18.6% 14.3% 1.9% 26.4% 13.4% 19.0% 14.6%
Asian/Asian British: Pakistani
1.5% 4.6% 4.3% 0.9% 3.3% 3.4% 5.4% 3.4%
Asian/Asian British: Bangladeshi
0.6% 0.6% 0.5% 0.6% 0.6% 1.0% 0.9% 0.7%
Asian/Asian British: Chinese
2.3% 1.0% 1.2% 1.7% 1.1% 1.1% 0.9% 1.4%
Asian/Asian British: Other Asian
6.2% 9.2% 9.3% 4.0% 11.3% 6.5% 8.2% 7.9%
Black/African/Caribbean/Black British: African
5.4% 7.8% 5.1% 5.8% 3.6% 4.1% 4.2% 5.2%
Black/African/Caribbean/Black British: Caribbean
1.3% 7.6% 3.9% 3.9% 2.8% 1.7% 1.3% 3.2%
Black/African/Caribbean/Black British: Other Black
1.0% 3.4% 1.9% 2.1% 1.8% 1.5% 1.0% 1.8%
Other ethnic group: Arab 1.5% 3.7% 2.9% 2.9% 1.6% 1.1% 1.4% 2.1%
Other ethnic group: Any other ethnic group
3.4% 2.1% 3.1% 2.7% 1.4% 1.9% 2.1% 2.4%
6.88 As illustrated in Figure 74, the London boroughs comprising West London have a diverse population with
many different ethnic groups represented.
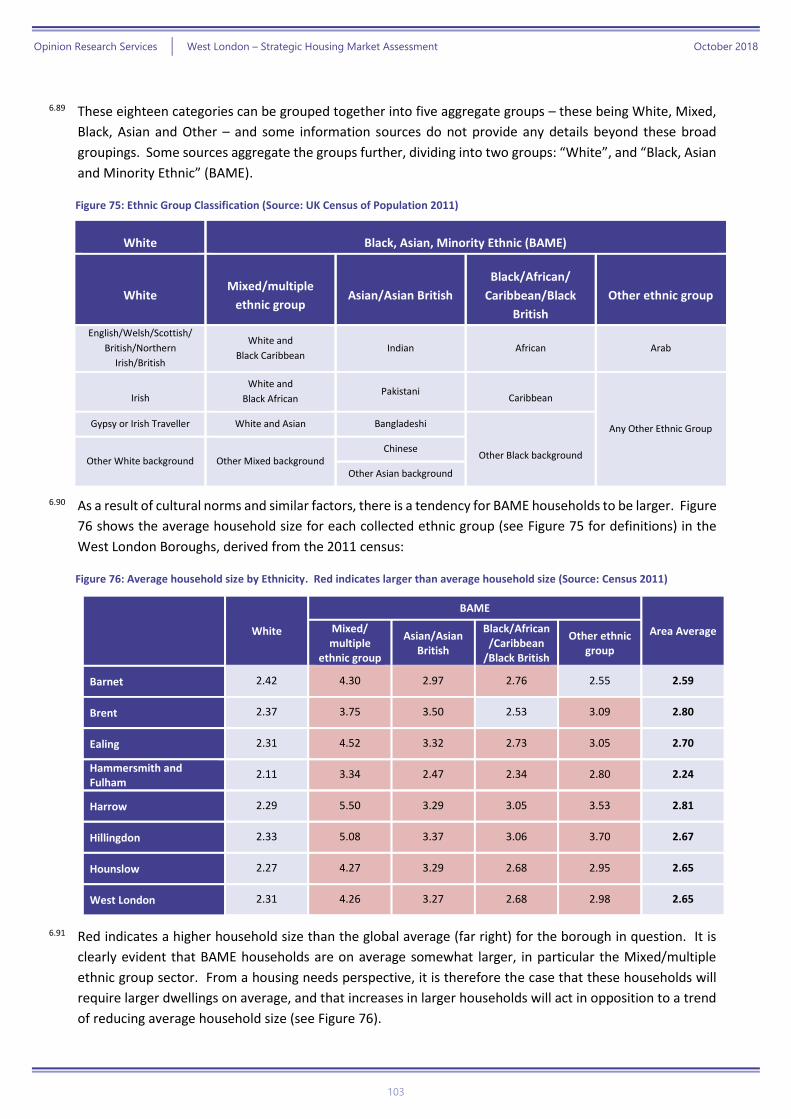
Opinion Research Services | West London – Strategic Housing Market Assessment October 2018
103
6.89 These eighteen categories can be grouped together into five aggregate groups – these being White, Mixed,
Black, Asian and Other – and some information sources do not provide any details beyond these broad
groupings. Some sources aggregate the groups further, dividing into two groups: “White”, and “Black, Asian
and Minority Ethnic” (BAME).
Figure 75: Ethnic Group Classification (Source: UK Census of Population 2011)
White Black, Asian, Minority Ethnic (BAME)
White Mixed/multiple
ethnic group Asian/Asian British
Black/African/
Caribbean/Black
British
Other ethnic group
English/Welsh/Scottish/
British/Northern
Irish/British
White and
Black Caribbean Indian African Arab
Irish
White and
Black African Pakistani
Caribbean
Any Other Ethnic Group Gypsy or Irish Traveller White and Asian Bangladeshi
Other Black background Other White background Other Mixed background
Chinese
Other Asian background
6.90 As a result of cultural norms and similar factors, there is a tendency for BAME households to be larger. Figure
76 shows the average household size for each collected ethnic group (see Figure 75 for definitions) in the
West London Boroughs, derived from the 2011 census:
Figure 76: Average household size by Ethnicity. Red indicates larger than average household size (Source: Census 2011)
White
BAME
Area Average Mixed/ multiple
ethnic group
Asian/Asian British
Black/African/Caribbean
/Black British
Other ethnic group
Barnet 2.42 4.30 2.97 2.76 2.55 2.59
Brent 2.37 3.75 3.50 2.53 3.09 2.80
Ealing 2.31 4.52 3.32 2.73 3.05 2.70
Hammersmith and Fulham
2.11 3.34 2.47 2.34 2.80 2.24
Harrow 2.29 5.50 3.29 3.05 3.53 2.81
Hillingdon 2.33 5.08 3.37 3.06 3.70 2.67
Hounslow 2.27 4.27 3.29 2.68 2.95 2.65
West London 2.31 4.26 3.27 2.68 2.98 2.65
6.91 Red indicates a higher household size than the global average (far right) for the borough in question. It is
clearly evident that BAME households are on average somewhat larger, in particular the Mixed/multiple
ethnic group sector. From a housing needs perspective, it is therefore the case that these households will
require larger dwellings on average, and that increases in larger households will act in opposition to a trend
of reducing average household size (see Figure 76).
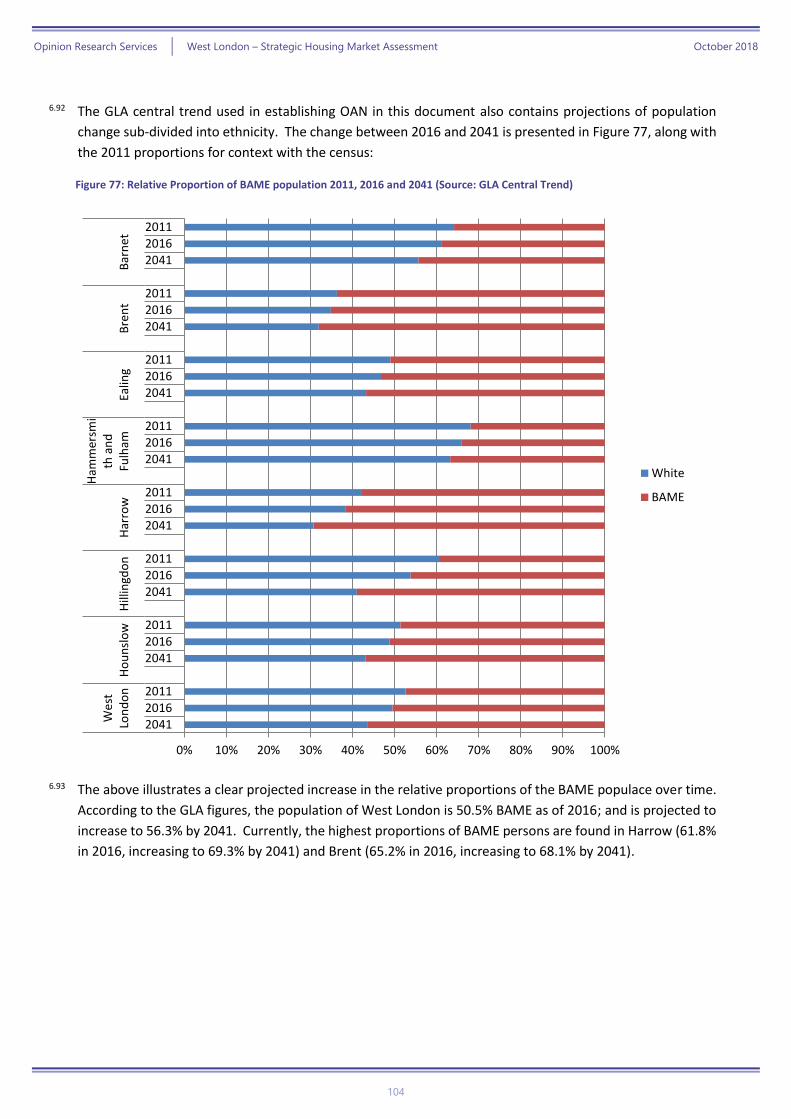
Opinion Research Services | West London – Strategic Housing Market Assessment October 2018
104
6.92 The GLA central trend used in establishing OAN in this document also contains projections of population
change sub-divided into ethnicity. The change between 2016 and 2041 is presented in Figure 77, along with
the 2011 proportions for context with the census:
Figure 77: Relative Proportion of BAME population 2011, 2016 and 2041 (Source: GLA Central Trend)
6.93 The above illustrates a clear projected increase in the relative proportions of the BAME populace over time.
According to the GLA figures, the population of West London is 50.5% BAME as of 2016; and is projected to
increase to 56.3% by 2041. Currently, the highest proportions of BAME persons are found in Harrow (61.8%
in 2016, increasing to 69.3% by 2041) and Brent (65.2% in 2016, increasing to 68.1% by 2041).
0% 10% 20% 30% 40% 50% 60% 70% 80% 90% 100%
20112016
2041
2011
2016
2041
2011
2016
2041
2011
2016
2041
2011
2016
2041
2011
2016
2041
2011
2016
2041
2011
20162041
Bar
ne
tB
ren
tEa
ling
Ham
mer
smi
th a
nd
Fulh
amH
arro
wH
illin
gdo
nH
ou
nsl
ow
We
stLo
nd
on
White
BAME
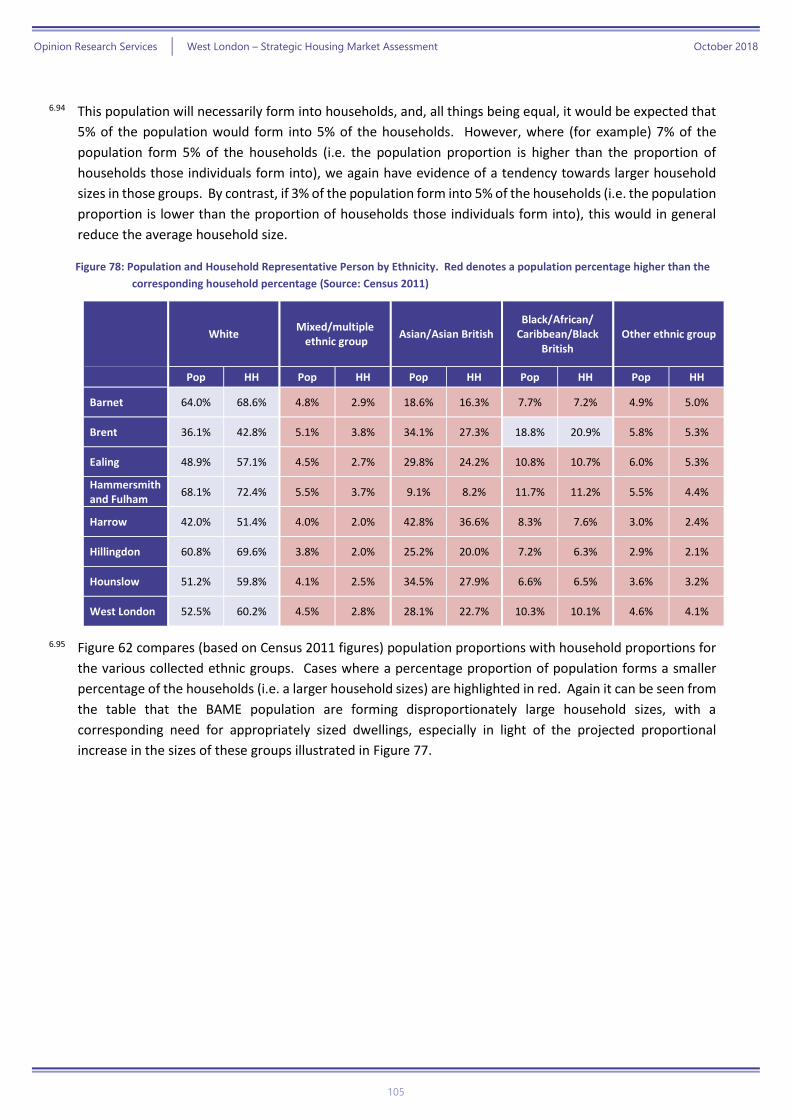
Opinion Research Services | West London – Strategic Housing Market Assessment October 2018
105
6.94 This population will necessarily form into households, and, all things being equal, it would be expected that
5% of the population would form into 5% of the households. However, where (for example) 7% of the
population form 5% of the households (i.e. the population proportion is higher than the proportion of
households those individuals form into), we again have evidence of a tendency towards larger household
sizes in those groups. By contrast, if 3% of the population form into 5% of the households (i.e. the population
proportion is lower than the proportion of households those individuals form into), this would in general
reduce the average household size.
Figure 78: Population and Household Representative Person by Ethnicity. Red denotes a population percentage higher than the
corresponding household percentage (Source: Census 2011)
White Mixed/multiple
ethnic group Asian/Asian British
Black/African/ Caribbean/Black
British Other ethnic group
Pop HH Pop HH Pop HH Pop HH Pop HH
Barnet 64.0% 68.6% 4.8% 2.9% 18.6% 16.3% 7.7% 7.2% 4.9% 5.0%
Brent 36.1% 42.8% 5.1% 3.8% 34.1% 27.3% 18.8% 20.9% 5.8% 5.3%
Ealing 48.9% 57.1% 4.5% 2.7% 29.8% 24.2% 10.8% 10.7% 6.0% 5.3%
Hammersmith and Fulham
68.1% 72.4% 5.5% 3.7% 9.1% 8.2% 11.7% 11.2% 5.5% 4.4%
Harrow 42.0% 51.4% 4.0% 2.0% 42.8% 36.6% 8.3% 7.6% 3.0% 2.4%
Hillingdon 60.8% 69.6% 3.8% 2.0% 25.2% 20.0% 7.2% 6.3% 2.9% 2.1%
Hounslow 51.2% 59.8% 4.1% 2.5% 34.5% 27.9% 6.6% 6.5% 3.6% 3.2%
West London 52.5% 60.2% 4.5% 2.8% 28.1% 22.7% 10.3% 10.1% 4.6% 4.1%
6.95 Figure 62 compares (based on Census 2011 figures) population proportions with household proportions for
the various collected ethnic groups. Cases where a percentage proportion of population forms a smaller
percentage of the households (i.e. a larger household sizes) are highlighted in red. Again it can be seen from
the table that the BAME population are forming disproportionately large household sizes, with a
corresponding need for appropriately sized dwellings, especially in light of the projected proportional
increase in the sizes of these groups illustrated in Figure 77.
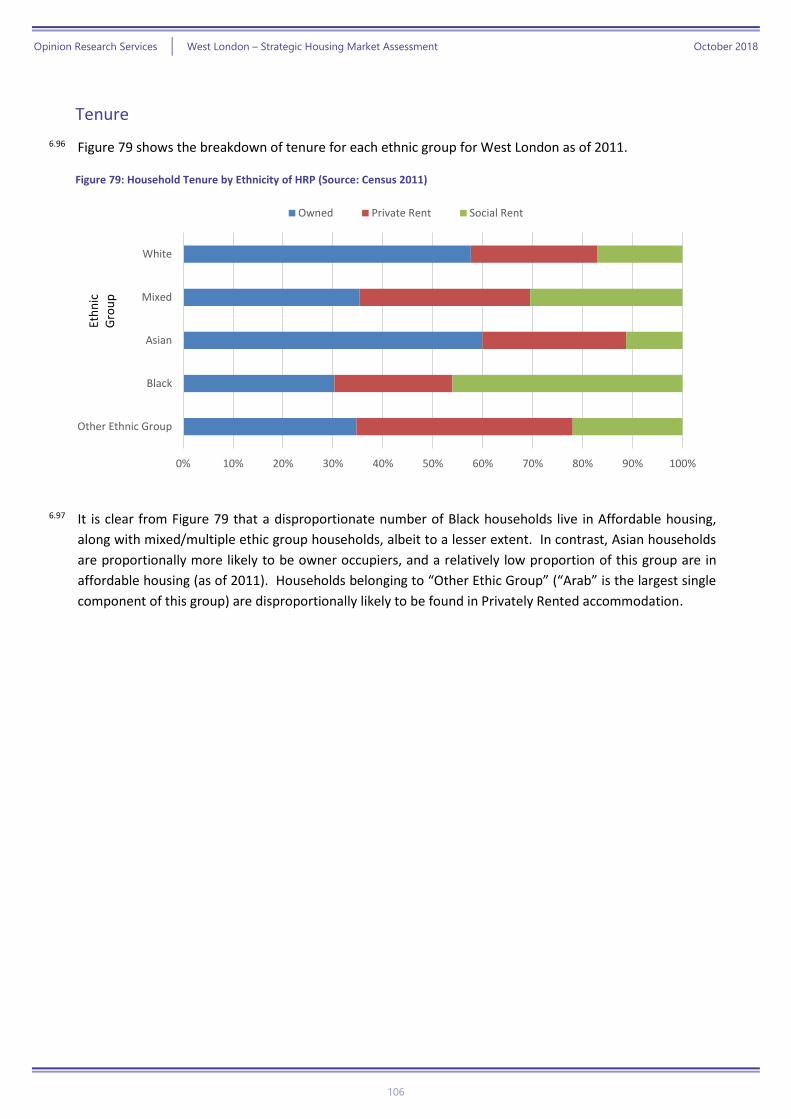
Opinion Research Services | West London – Strategic Housing Market Assessment October 2018
106
Tenure
6.96 Figure 79 shows the breakdown of tenure for each ethnic group for West London as of 2011.
Figure 79: Household Tenure by Ethnicity of HRP (Source: Census 2011)
6.97 It is clear from Figure 79 that a disproportionate number of Black households live in Affordable housing,
along with mixed/multiple ethic group households, albeit to a lesser extent. In contrast, Asian households
are proportionally more likely to be owner occupiers, and a relatively low proportion of this group are in
affordable housing (as of 2011). Households belonging to “Other Ethic Group” (“Arab” is the largest single
component of this group) are disproportionally likely to be found in Privately Rented accommodation.
0% 10% 20% 30% 40% 50% 60% 70% 80% 90% 100%
Other Ethnic Group
Black
Asian
Mixed
White
Eth
nic
G
rou
p
Owned Private Rent Social Rent
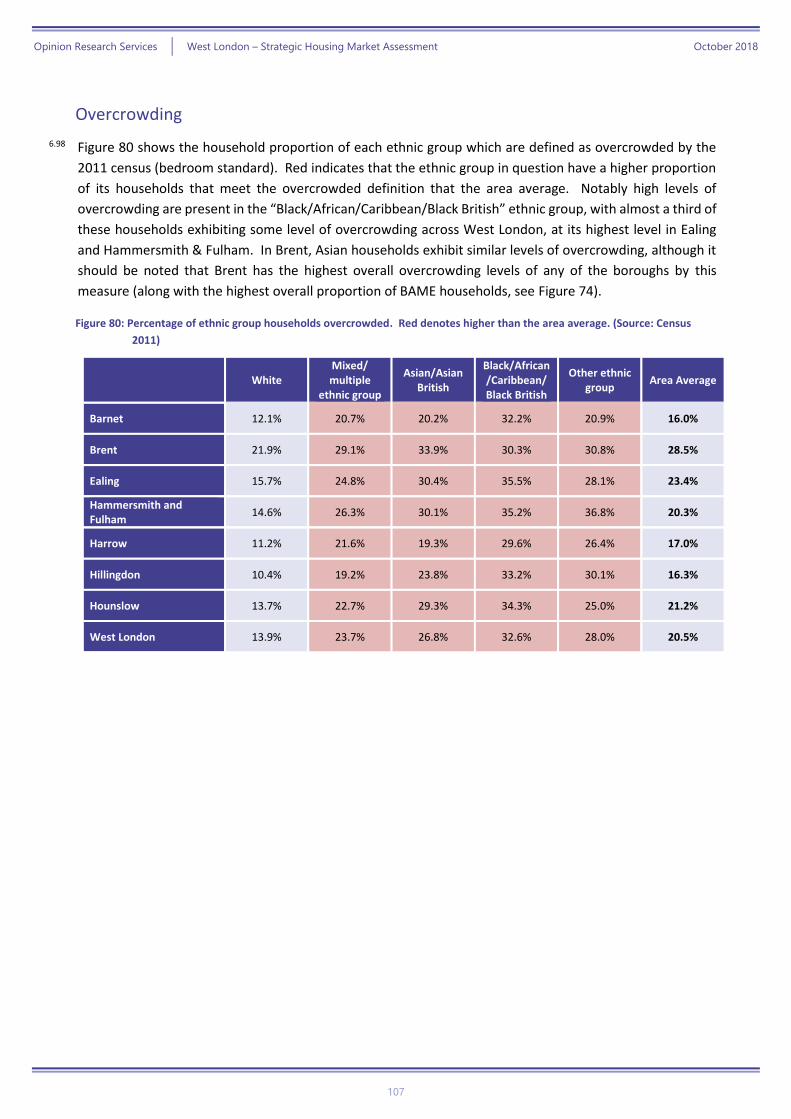
Opinion Research Services | West London – Strategic Housing Market Assessment October 2018
107
Overcrowding
6.98 Figure 80 shows the household proportion of each ethnic group which are defined as overcrowded by the
2011 census (bedroom standard). Red indicates that the ethnic group in question have a higher proportion
of its households that meet the overcrowded definition that the area average. Notably high levels of
overcrowding are present in the “Black/African/Caribbean/Black British” ethnic group, with almost a third of
these households exhibiting some level of overcrowding across West London, at its highest level in Ealing
and Hammersmith & Fulham. In Brent, Asian households exhibit similar levels of overcrowding, although it
should be noted that Brent has the highest overall overcrowding levels of any of the boroughs by this
measure (along with the highest overall proportion of BAME households, see Figure 74).
Figure 80: Percentage of ethnic group households overcrowded. Red denotes higher than the area average. (Source: Census
2011)
White Mixed/ multiple
ethnic group
Asian/Asian British
Black/African/Caribbean/ Black British
Other ethnic group
Area Average
Barnet 12.1% 20.7% 20.2% 32.2% 20.9% 16.0%
Brent 21.9% 29.1% 33.9% 30.3% 30.8% 28.5%
Ealing 15.7% 24.8% 30.4% 35.5% 28.1% 23.4%
Hammersmith and Fulham
14.6% 26.3% 30.1% 35.2% 36.8% 20.3%
Harrow 11.2% 21.6% 19.3% 29.6% 26.4% 17.0%
Hillingdon 10.4% 19.2% 23.8% 33.2% 30.1% 16.3%
Hounslow 13.7% 22.7% 29.3% 34.3% 25.0% 21.2%
West London 13.9% 23.7% 26.8% 32.6% 28.0% 20.5%
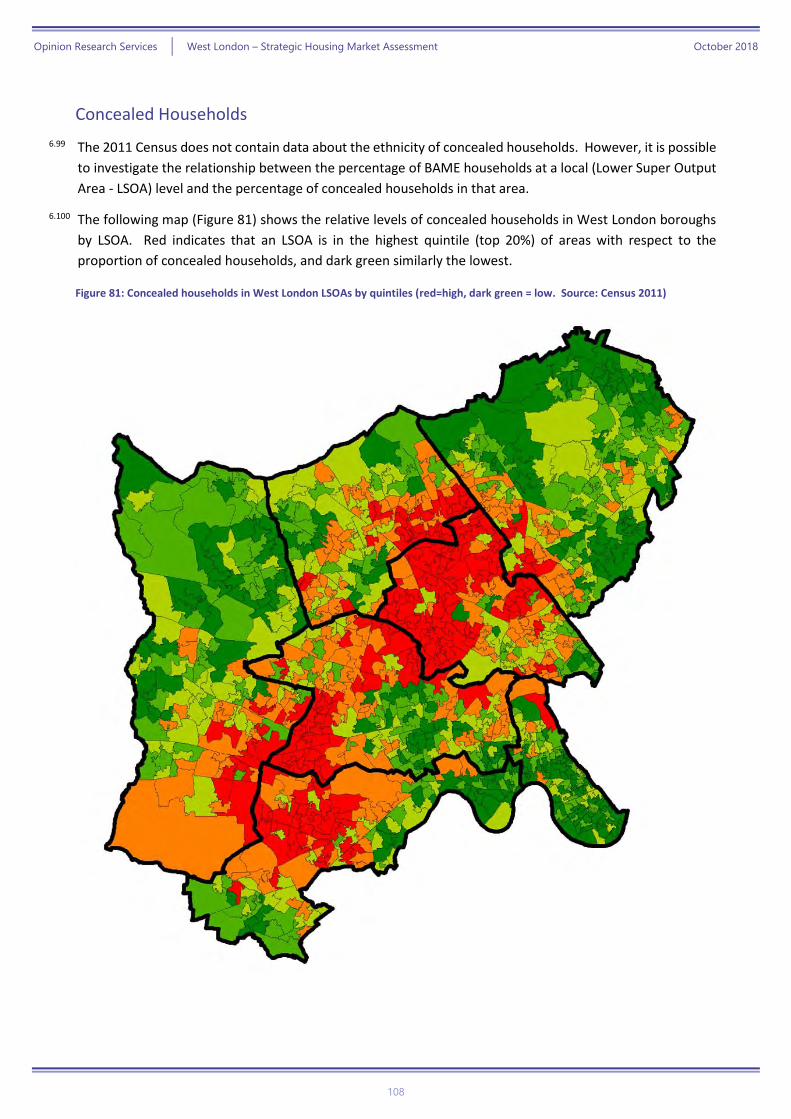
Opinion Research Services | West London – Strategic Housing Market Assessment October 2018
108
Concealed Households
6.99 The 2011 Census does not contain data about the ethnicity of concealed households. However, it is possible
to investigate the relationship between the percentage of BAME households at a local (Lower Super Output
Area - LSOA) level and the percentage of concealed households in that area.
6.100 The following map (Figure 81) shows the relative levels of concealed households in West London boroughs
by LSOA. Red indicates that an LSOA is in the highest quintile (top 20%) of areas with respect to the
proportion of concealed households, and dark green similarly the lowest.
Figure 81: Concealed households in West London LSOAs by quintiles (red=high, dark green = low. Source: Census 2011)
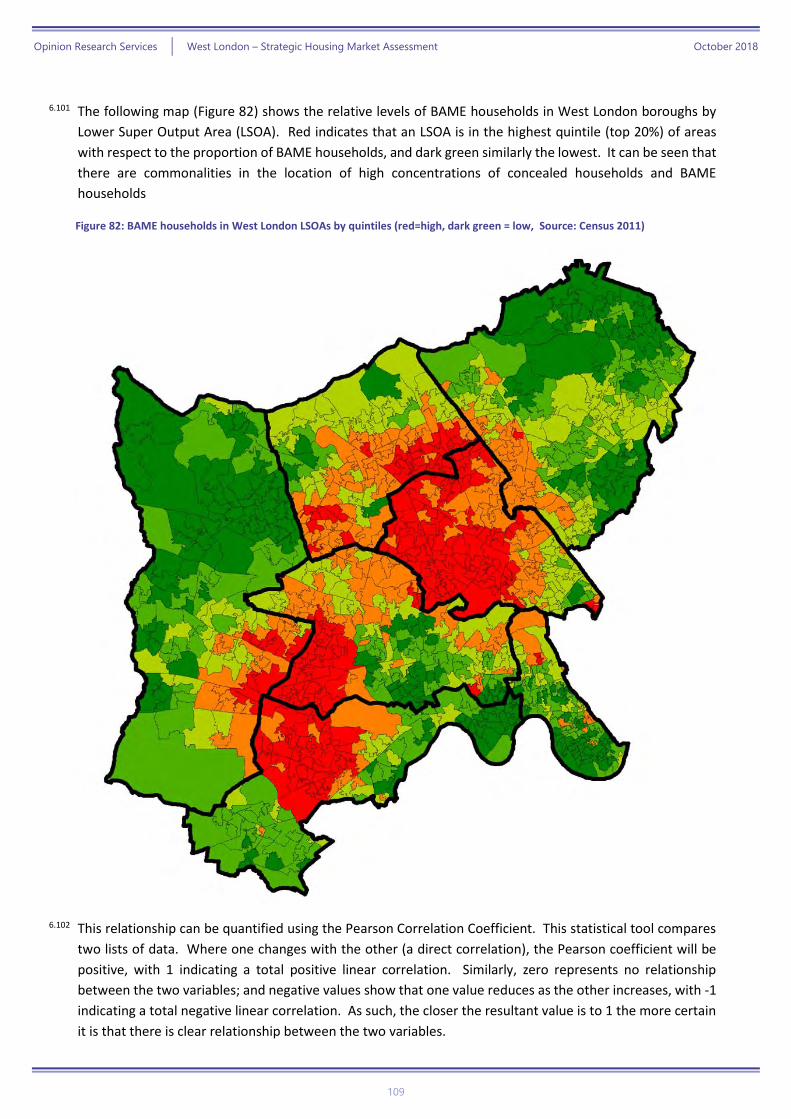
Opinion Research Services | West London – Strategic Housing Market Assessment October 2018
109
6.101 The following map (Figure 82) shows the relative levels of BAME households in West London boroughs by
Lower Super Output Area (LSOA). Red indicates that an LSOA is in the highest quintile (top 20%) of areas
with respect to the proportion of BAME households, and dark green similarly the lowest. It can be seen that
there are commonalities in the location of high concentrations of concealed households and BAME
households
Figure 82: BAME households in West London LSOAs by quintiles (red=high, dark green = low, Source: Census 2011)
6.102 This relationship can be quantified using the Pearson Correlation Coefficient. This statistical tool compares
two lists of data. Where one changes with the other (a direct correlation), the Pearson coefficient will be
positive, with 1 indicating a total positive linear correlation. Similarly, zero represents no relationship
between the two variables; and negative values show that one value reduces as the other increases, with -1
indicating a total negative linear correlation. As such, the closer the resultant value is to 1 the more certain
it is that there is clear relationship between the two variables.
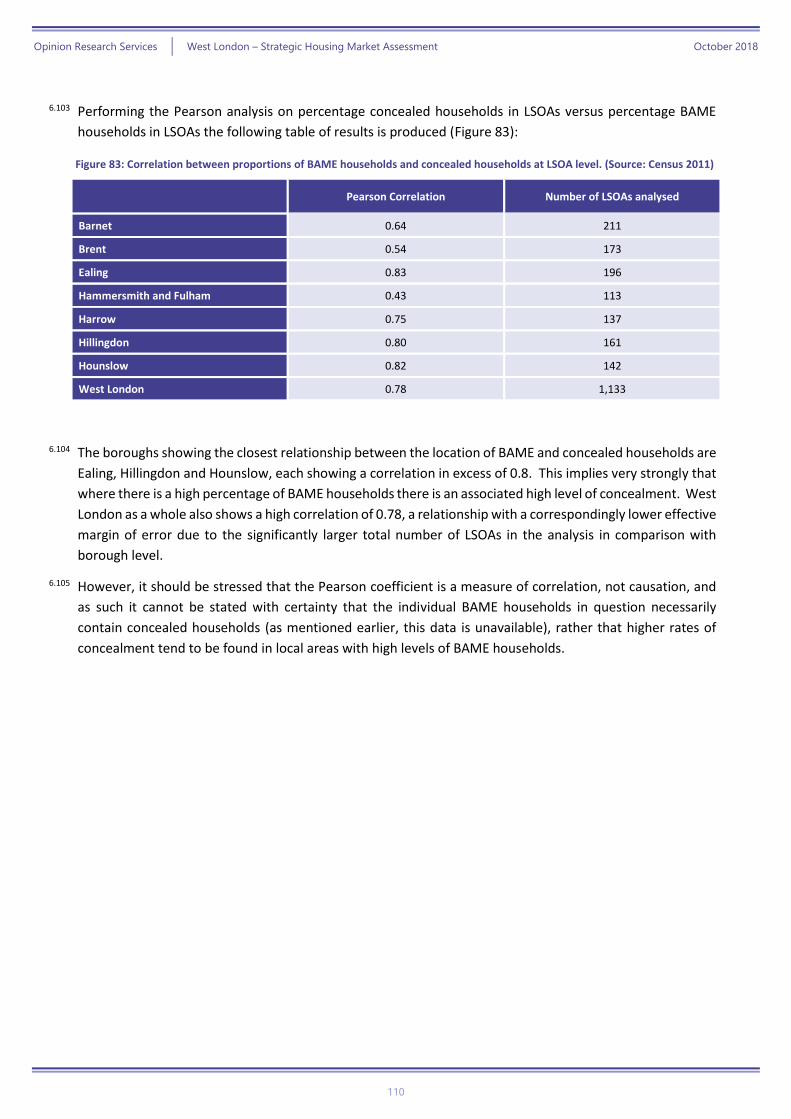
Opinion Research Services | West London – Strategic Housing Market Assessment October 2018
110
6.103 Performing the Pearson analysis on percentage concealed households in LSOAs versus percentage BAME
households in LSOAs the following table of results is produced (Figure 83):
Figure 83: Correlation between proportions of BAME households and concealed households at LSOA level. (Source: Census 2011)
Pearson Correlation Number of LSOAs analysed
Barnet 0.64 211
Brent 0.54 173
Ealing 0.83 196
Hammersmith and Fulham 0.43 113
Harrow 0.75 137
Hillingdon 0.80 161
Hounslow 0.82 142
West London 0.78 1,133
6.104 The boroughs showing the closest relationship between the location of BAME and concealed households are
Ealing, Hillingdon and Hounslow, each showing a correlation in excess of 0.8. This implies very strongly that
where there is a high percentage of BAME households there is an associated high level of concealment. West
London as a whole also shows a high correlation of 0.78, a relationship with a correspondingly lower effective
margin of error due to the significantly larger total number of LSOAs in the analysis in comparison with
borough level.
6.105 However, it should be stressed that the Pearson coefficient is a measure of correlation, not causation, and
as such it cannot be stated with certainty that the individual BAME households in question necessarily
contain concealed households (as mentioned earlier, this data is unavailable), rather that higher rates of
concealment tend to be found in local areas with high levels of BAME households.
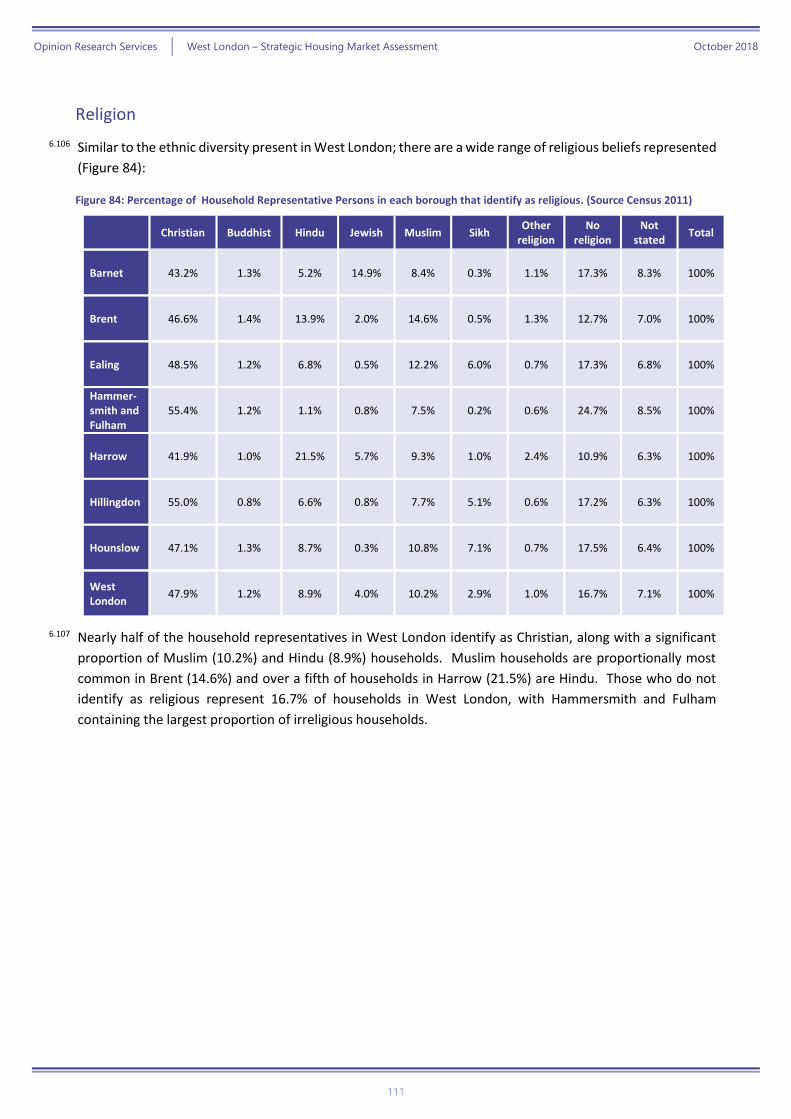
Opinion Research Services | West London – Strategic Housing Market Assessment October 2018
111
Religion
6.106 Similar to the ethnic diversity present in West London; there are a wide range of religious beliefs represented
(Figure 84):
Figure 84: Percentage of Household Representative Persons in each borough that identify as religious. (Source Census 2011)
Christian Buddhist Hindu Jewish Muslim Sikh Other
religion No
religion Not
stated Total
Barnet 43.2% 1.3% 5.2% 14.9% 8.4% 0.3% 1.1% 17.3% 8.3% 100%
Brent 46.6% 1.4% 13.9% 2.0% 14.6% 0.5% 1.3% 12.7% 7.0% 100%
Ealing 48.5% 1.2% 6.8% 0.5% 12.2% 6.0% 0.7% 17.3% 6.8% 100%
Hammer-smith and Fulham
55.4% 1.2% 1.1% 0.8% 7.5% 0.2% 0.6% 24.7% 8.5% 100%
Harrow 41.9% 1.0% 21.5% 5.7% 9.3% 1.0% 2.4% 10.9% 6.3% 100%
Hillingdon 55.0% 0.8% 6.6% 0.8% 7.7% 5.1% 0.6% 17.2% 6.3% 100%
Hounslow 47.1% 1.3% 8.7% 0.3% 10.8% 7.1% 0.7% 17.5% 6.4% 100%
West London
47.9% 1.2% 8.9% 4.0% 10.2% 2.9% 1.0% 16.7% 7.1% 100%
6.107 Nearly half of the household representatives in West London identify as Christian, along with a significant
proportion of Muslim (10.2%) and Hindu (8.9%) households. Muslim households are proportionally most
common in Brent (14.6%) and over a fifth of households in Harrow (21.5%) are Hindu. Those who do not
identify as religious represent 16.7% of households in West London, with Hammersmith and Fulham
containing the largest proportion of irreligious households.
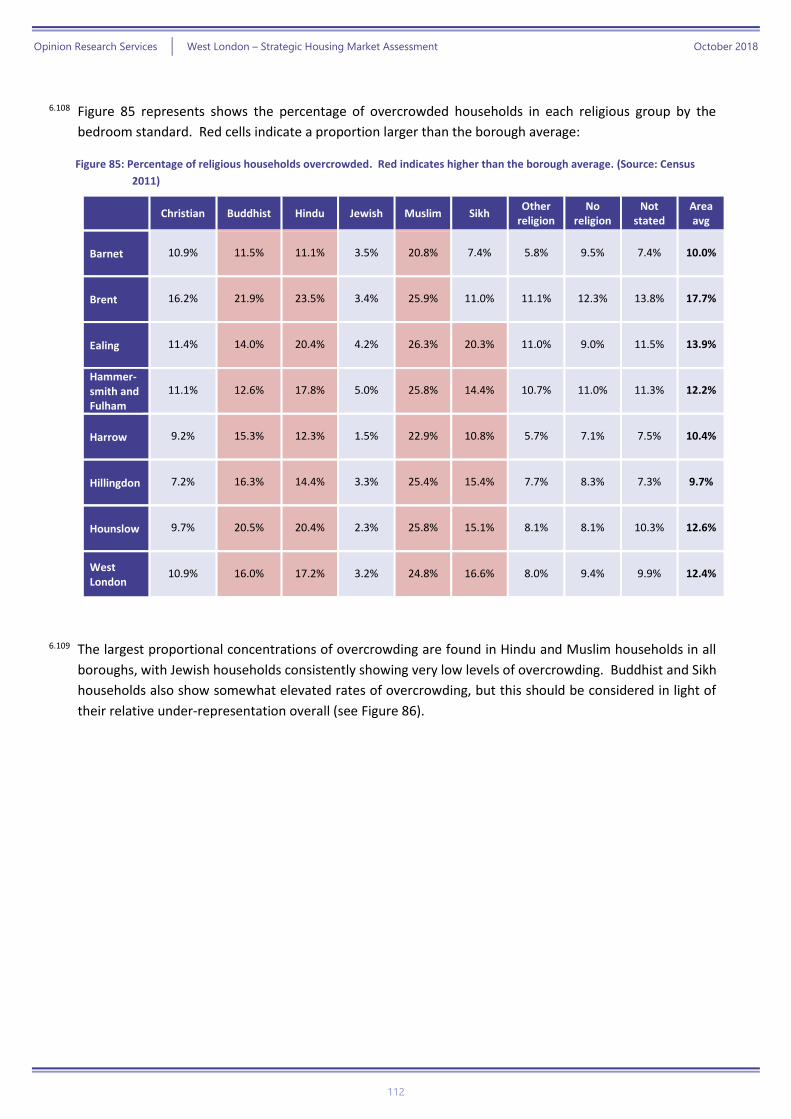
Opinion Research Services | West London – Strategic Housing Market Assessment October 2018
112
6.108 Figure 85 represents shows the percentage of overcrowded households in each religious group by the
bedroom standard. Red cells indicate a proportion larger than the borough average:
Figure 85: Percentage of religious households overcrowded. Red indicates higher than the borough average. (Source: Census
2011)
Christian Buddhist Hindu Jewish Muslim Sikh Other
religion No
religion Not
stated Area avg
Barnet 10.9% 11.5% 11.1% 3.5% 20.8% 7.4% 5.8% 9.5% 7.4% 10.0%
Brent 16.2% 21.9% 23.5% 3.4% 25.9% 11.0% 11.1% 12.3% 13.8% 17.7%
Ealing 11.4% 14.0% 20.4% 4.2% 26.3% 20.3% 11.0% 9.0% 11.5% 13.9%
Hammer-smith and Fulham
11.1% 12.6% 17.8% 5.0% 25.8% 14.4% 10.7% 11.0% 11.3% 12.2%
Harrow 9.2% 15.3% 12.3% 1.5% 22.9% 10.8% 5.7% 7.1% 7.5% 10.4%
Hillingdon 7.2% 16.3% 14.4% 3.3% 25.4% 15.4% 7.7% 8.3% 7.3% 9.7%
Hounslow 9.7% 20.5% 20.4% 2.3% 25.8% 15.1% 8.1% 8.1% 10.3% 12.6%
West London
10.9% 16.0% 17.2% 3.2% 24.8% 16.6% 8.0% 9.4% 9.9% 12.4%
6.109 The largest proportional concentrations of overcrowding are found in Hindu and Muslim households in all
boroughs, with Jewish households consistently showing very low levels of overcrowding. Buddhist and Sikh
households also show somewhat elevated rates of overcrowding, but this should be considered in light of
their relative under-representation overall (see Figure 86).
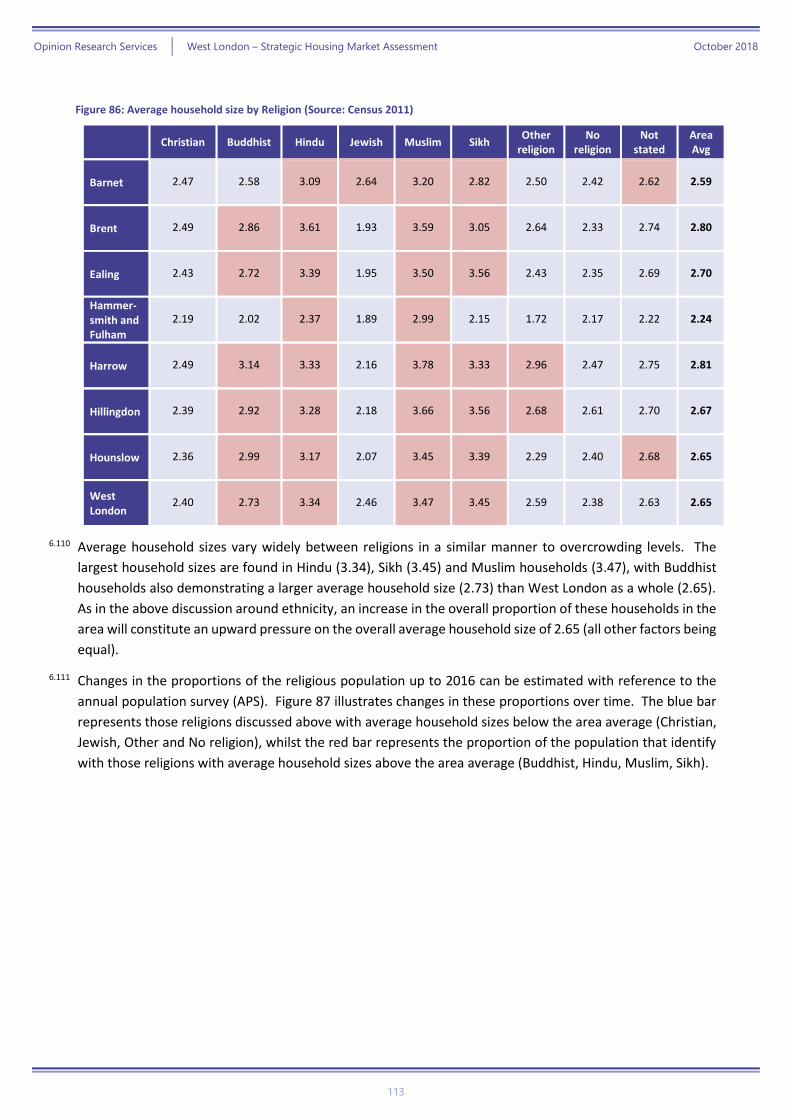
Opinion Research Services | West London – Strategic Housing Market Assessment October 2018
113
Figure 86: Average household size by Religion (Source: Census 2011)
Christian Buddhist Hindu Jewish Muslim Sikh Other
religion No
religion Not
stated Area Avg
Barnet 2.47 2.58 3.09 2.64 3.20 2.82 2.50 2.42 2.62 2.59
Brent 2.49 2.86 3.61 1.93 3.59 3.05 2.64 2.33 2.74 2.80
Ealing 2.43 2.72 3.39 1.95 3.50 3.56 2.43 2.35 2.69 2.70
Hammer-smith and Fulham
2.19 2.02 2.37 1.89 2.99 2.15 1.72 2.17 2.22 2.24
Harrow 2.49 3.14 3.33 2.16 3.78 3.33 2.96 2.47 2.75 2.81
Hillingdon 2.39 2.92 3.28 2.18 3.66 3.56 2.68 2.61 2.70 2.67
Hounslow 2.36 2.99 3.17 2.07 3.45 3.39 2.29 2.40 2.68 2.65
West London
2.40 2.73 3.34 2.46 3.47 3.45 2.59 2.38 2.63 2.65
6.110 Average household sizes vary widely between religions in a similar manner to overcrowding levels. The
largest household sizes are found in Hindu (3.34), Sikh (3.45) and Muslim households (3.47), with Buddhist
households also demonstrating a larger average household size (2.73) than West London as a whole (2.65).
As in the above discussion around ethnicity, an increase in the overall proportion of these households in the
area will constitute an upward pressure on the overall average household size of 2.65 (all other factors being
equal).
6.111 Changes in the proportions of the religious population up to 2016 can be estimated with reference to the
annual population survey (APS). Figure 87 illustrates changes in these proportions over time. The blue bar
represents those religions discussed above with average household sizes below the area average (Christian,
Jewish, Other and No religion), whilst the red bar represents the proportion of the population that identify
with those religions with average household sizes above the area average (Buddhist, Hindu, Muslim, Sikh).
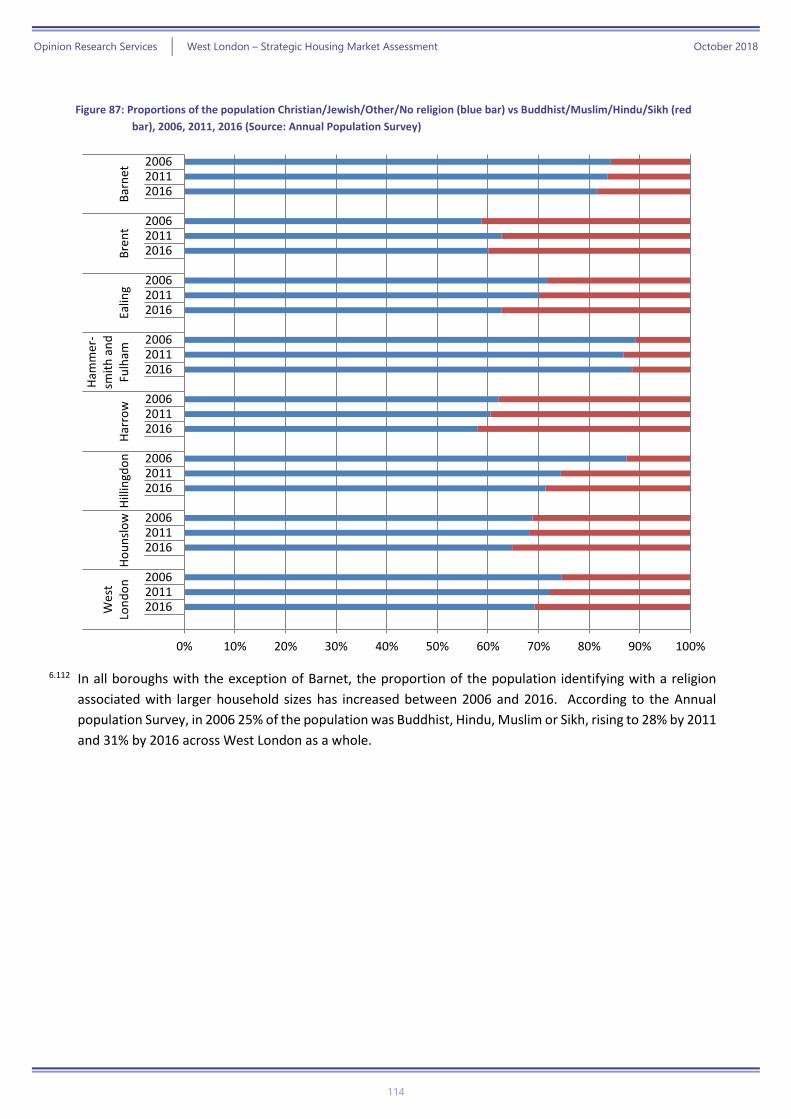
Opinion Research Services | West London – Strategic Housing Market Assessment October 2018
114
Figure 87: Proportions of the population Christian/Jewish/Other/No religion (blue bar) vs Buddhist/Muslim/Hindu/Sikh (red
bar), 2006, 2011, 2016 (Source: Annual Population Survey)
6.112 In all boroughs with the exception of Barnet, the proportion of the population identifying with a religion
associated with larger household sizes has increased between 2006 and 2016. According to the Annual
population Survey, in 2006 25% of the population was Buddhist, Hindu, Muslim or Sikh, rising to 28% by 2011
and 31% by 2016 across West London as a whole.
0% 10% 20% 30% 40% 50% 60% 70% 80% 90% 100%
201620112006
201620112006
201620112006
201620112006
201620112006
201620112006
201620112006
201620112006
We
stLo
nd
on
Ho
un
slo
wH
illin
gdo
nH
arro
w
Ham
mer
-sm
ith
an
dFu
lham
Ealin
gB
ren
tB
arn
et
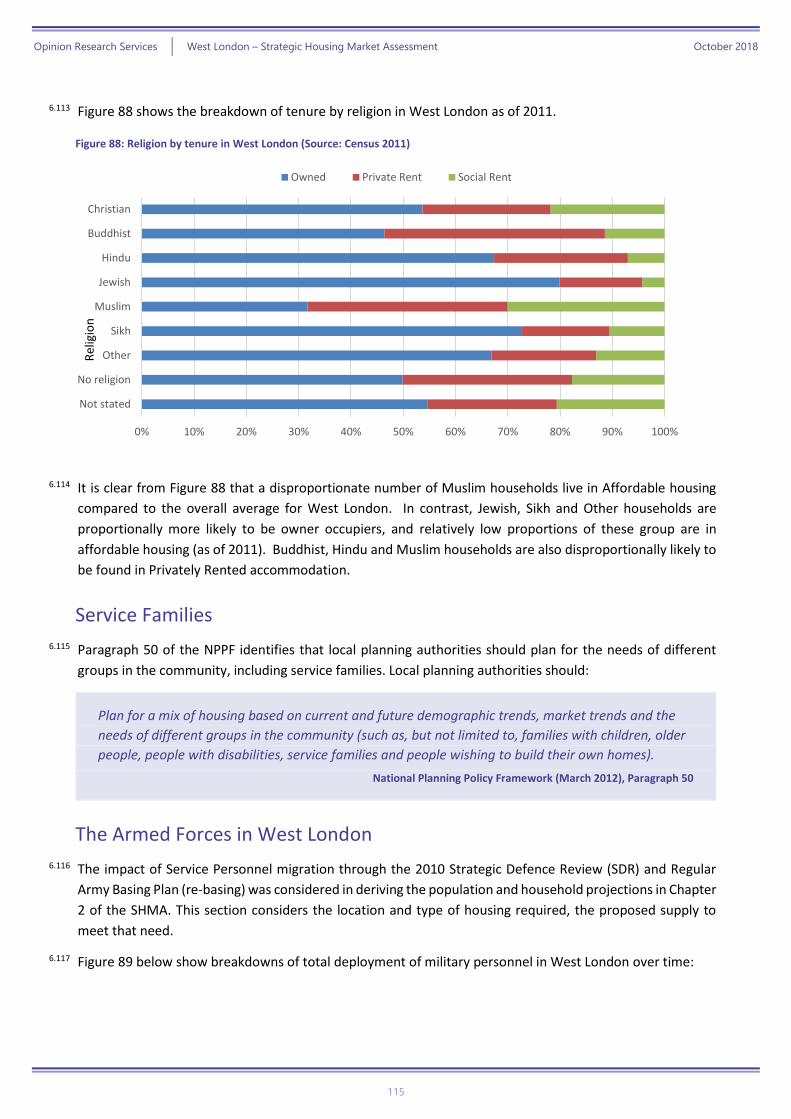
Opinion Research Services | West London – Strategic Housing Market Assessment October 2018
115
6.113 Figure 88 shows the breakdown of tenure by religion in West London as of 2011.
Figure 88: Religion by tenure in West London (Source: Census 2011)
6.114 It is clear from Figure 88 that a disproportionate number of Muslim households live in Affordable housing
compared to the overall average for West London. In contrast, Jewish, Sikh and Other households are
proportionally more likely to be owner occupiers, and relatively low proportions of these group are in
affordable housing (as of 2011). Buddhist, Hindu and Muslim households are also disproportionally likely to
be found in Privately Rented accommodation.
Service Families
6.115 Paragraph 50 of the NPPF identifies that local planning authorities should plan for the needs of different
groups in the community, including service families. Local planning authorities should:
Plan for a mix of housing based on current and future demographic trends, market trends and the
needs of different groups in the community (such as, but not limited to, families with children, older
people, people with disabilities, service families and people wishing to build their own homes).
National Planning Policy Framework (March 2012), Paragraph 50
The Armed Forces in West London
6.116 The impact of Service Personnel migration through the 2010 Strategic Defence Review (SDR) and Regular
Army Basing Plan (re-basing) was considered in deriving the population and household projections in Chapter
2 of the SHMA. This section considers the location and type of housing required, the proposed supply to
meet that need.
6.117 Figure 89 below show breakdowns of total deployment of military personnel in West London over time:
0% 10% 20% 30% 40% 50% 60% 70% 80% 90% 100%
Not stated
No religion
Other
Sikh
Muslim
Jewish
Hindu
Buddhist
Christian
Rel
igio
n
Owned Private Rent Social Rent
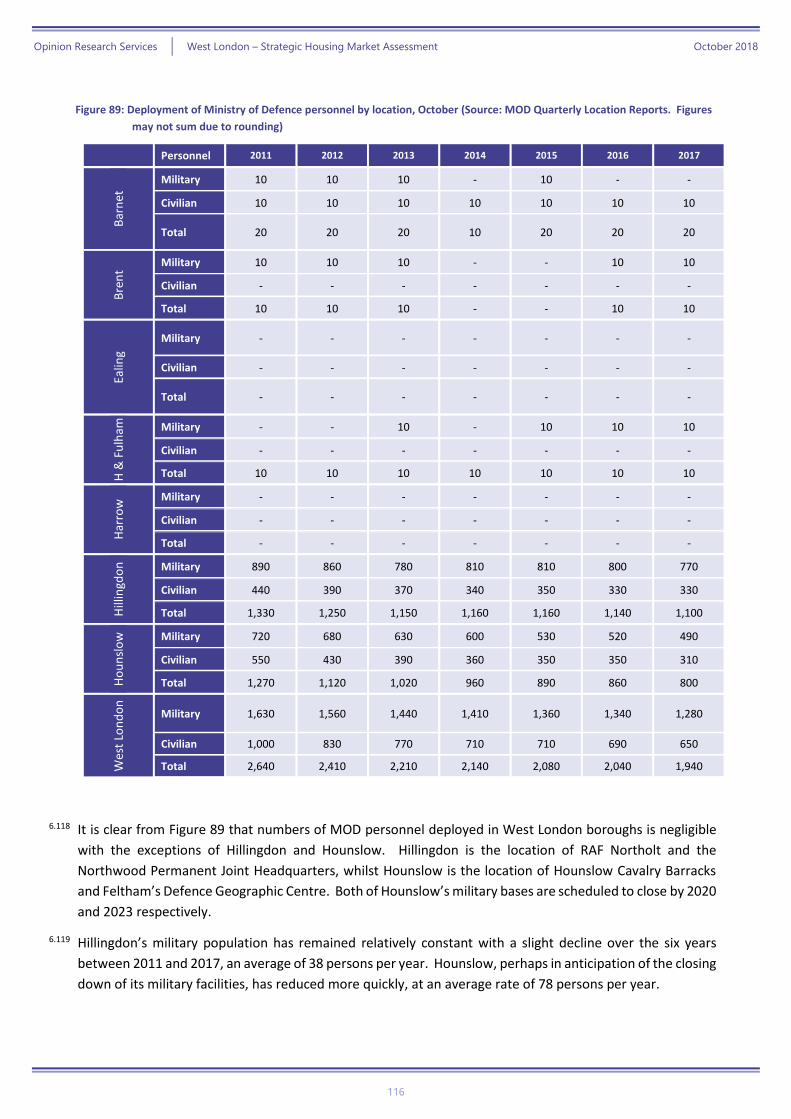
Opinion Research Services | West London – Strategic Housing Market Assessment October 2018
116
Figure 89: Deployment of Ministry of Defence personnel by location, October (Source: MOD Quarterly Location Reports. Figures
may not sum due to rounding)
Personnel 2011 2012 2013 2014 2015 2016 2017
Bar
net
Military 10 10 10 - 10 - -
Civilian 10 10 10 10 10 10 10
Total 20 20 20 10 20 20 20
Bre
nt
Military 10 10 10 - - 10 10
Civilian - - - - - - -
Total 10 10 10 - - 10 10
Ealin
g
Military - - - - - - -
Civilian - - - - - - -
Total - - - - - - -
H &
Fu
lham
Military - - 10 - 10 10 10
Civilian - - - - - - -
Total 10 10 10 10 10 10 10
Har
row
Military - - - - - - -
Civilian - - - - - - -
Total - - - - - - -
Hill
ingd
on
Military 890 860 780 810 810 800 770
Civilian 440 390 370 340 350 330 330
Total 1,330 1,250 1,150 1,160 1,160 1,140 1,100
Ho
un
slo
w
Military 720 680 630 600 530 520 490
Civilian 550 430 390 360 350 350 310
Total 1,270 1,120 1,020 960 890 860 800
Wes
t Lo
nd
on
Military 1,630 1,560 1,440 1,410 1,360 1,340 1,280
Civilian 1,000 830 770 710 710 690 650
Total 2,640 2,410 2,210 2,140 2,080 2,040 1,940
6.118 It is clear from Figure 89 that numbers of MOD personnel deployed in West London boroughs is negligible
with the exceptions of Hillingdon and Hounslow. Hillingdon is the location of RAF Northolt and the
Northwood Permanent Joint Headquarters, whilst Hounslow is the location of Hounslow Cavalry Barracks
and Feltham’s Defence Geographic Centre. Both of Hounslow’s military bases are scheduled to close by 2020
and 2023 respectively.
6.119 Hillingdon’s military population has remained relatively constant with a slight decline over the six years
between 2011 and 2017, an average of 38 persons per year. Hounslow, perhaps in anticipation of the closing
down of its military facilities, has reduced more quickly, at an average rate of 78 persons per year.

Opinion Research Services | West London – Strategic Housing Market Assessment October 2018
117
6.120 Demographically speaking, the small reduction in Hillingdon’s population has very little effect on its overall
housing needs, the ultimate closure of Hounslow’s facilities will also have a small effect upon its demographic
drivers.
Student Housing
6.121 PPG was updated in March 2015 to include specific reference to identifying the needs of students:
Local planning authorities should plan for sufficient student accommodation whether it consists of
communal halls of residence or self-contained dwellings, and whether or not it is on campus.
Student housing provided by private landlords is often a lower-cost form of housing. Encouraging
more dedicated student accommodation may provide low cost housing that takes pressure off the
private rented sector and increases the overall housing stock. Plan makers are encouraged to
consider options which would support both the needs of the student population as well as local
residents before imposing caps or restrictions on students living outside of university-provided
accommodation. Plan makers should engage with universities and other higher educational
establishments to better understand their student accommodation requirements.
Planning Practice Guidance 2014, paragraph 21
6.122 There are several higher education establishments in the West London area including (but not limited to):
» Barnet contains Barnet and Southgate College Campus;
» Brent does not have any higher education establishments (e.g. Universities) within the
Borough, and, consequently, student households are relatively modest in number (0.5%);
» Ealing and Hammersmith & Fulham have a Higher Education college which specialises in
University access courses focuses on students aged under 19. Hammersmith & Fulham also
contains the London Film Academy;
» Harrow is home to a large University of Westminster campus;
» Hillingdon contains within the borough both Brunel University and Uxbridge College's
Uxbridge and Hayes campuses; and
» Hounslow has two West Thames College campuses (Further and higher Education up to
Foundation Degrees and HNDs)

Opinion Research Services | West London – Strategic Housing Market Assessment October 2018
118
6.123 The household projections for the SHMA did not assume any growth of students living in communal
establishments, so any net increase in bedspaces provided in specialist accommodation could reduce the
demand from student households. PPG highlights how encouraging more dedicated student
accommodation may provide low cost housing that takes the pressure off the private rented sector and
increases the overall housing stock.
6.124 In establishing the OAN for West London, students were included in the trend-based analysis; therefore the
needs of student households are counted as part of the overall OAN. The household projections assume
that the number of any students living in communal establishments (including university halls of residence
and student housing provided by private sector providers) remains constant over the Plan period. On this
basis, it will be necessary to consider how the supply of any additional student bedspaces will be counted
within the overall housing supply. The Greater London SHMA 2017 assumes that 3 additional bedspaces
equates to the provision of 1 additional dwelling.
Gypsies and Travellers
6.125 Planning Policy for Traveller Sites (PPTS) came into force in March 2012 and was updated in August 2015.
This document sets out the Government’s policy for Gypsies and Travellers and represents the only policy
for a particular household group which is not directly covered by the NPPF. However, at paragraph 1 PPTS
notes that:
This document sets out the Government’s planning policy for traveller sites. It should be read in
conjunction with the National Planning Policy Framework.
Planning Policy for Traveller Sites, paragraph 1
6.126 An April 2015 High Court Judgement, ‘Wenman v SSCLG and Waverley Borough Council’, has clarified the
relationship between Gypsy and Traveller and Travelling Showpeople Needs Assessments and OAN. At
paragraphs 42 and 43, the Judgement notes:
“42. However, under the PPTS, there is specific provision for local planning authorities to
assess the need for gypsy pitches, and to provide sites to meet that need, which includes the
requirement to “identify, and update annually, a supply of specific deliverable sites sufficient
to provide five years’ worth of sites against their local set targets” (paragraph 9(a)). These
provisions have a direct parallel in paragraph 47 NPPF which requires local planning
authorities to use their evidence base to ensure that the policies in their Local Plan meet the
full objectively assessed needs for housing in their area, and requires, inter alia, that they
“identify and update annually a supply of specific deliverable sites sufficient to provide five
years’ worth of housing”.
“43. The rationale behind the specific requirement for a five-year supply figure under
paragraph 9 PPTS must have been to ensure that attention was given to meeting the special
needs of travellers. Housing provision for this sub-group was not just to be subsumed within
the general housing supply figures for the area. Therefore it seems to me most unlikely that
the housing needs and supply figures for travellers assessed under the PPTS are to be
included in the housing needs and supply figures under paragraph 47 NPPF, as this would
amount to double counting.”
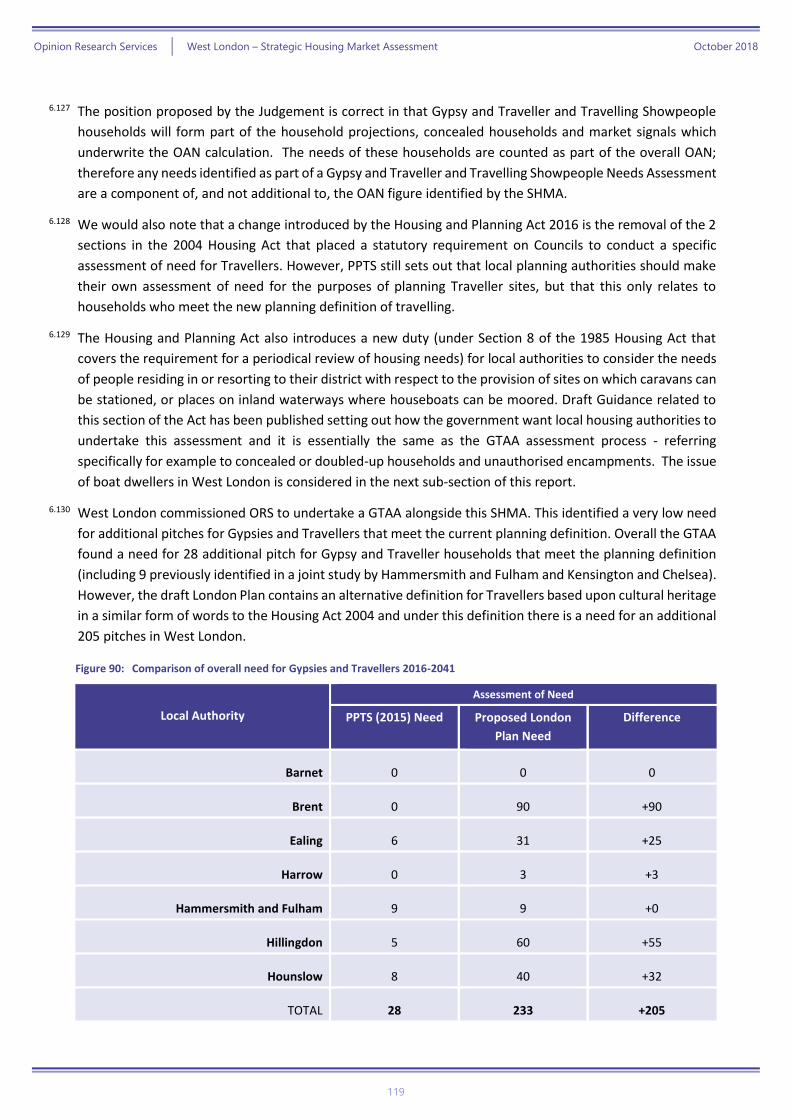
Opinion Research Services | West London – Strategic Housing Market Assessment October 2018
119
6.127 The position proposed by the Judgement is correct in that Gypsy and Traveller and Travelling Showpeople
households will form part of the household projections, concealed households and market signals which
underwrite the OAN calculation. The needs of these households are counted as part of the overall OAN;
therefore any needs identified as part of a Gypsy and Traveller and Travelling Showpeople Needs Assessment
are a component of, and not additional to, the OAN figure identified by the SHMA.
6.128 We would also note that a change introduced by the Housing and Planning Act 2016 is the removal of the 2
sections in the 2004 Housing Act that placed a statutory requirement on Councils to conduct a specific
assessment of need for Travellers. However, PPTS still sets out that local planning authorities should make
their own assessment of need for the purposes of planning Traveller sites, but that this only relates to
households who meet the new planning definition of travelling.
6.129 The Housing and Planning Act also introduces a new duty (under Section 8 of the 1985 Housing Act that
covers the requirement for a periodical review of housing needs) for local authorities to consider the needs
of people residing in or resorting to their district with respect to the provision of sites on which caravans can
be stationed, or places on inland waterways where houseboats can be moored. Draft Guidance related to
this section of the Act has been published setting out how the government want local housing authorities to
undertake this assessment and it is essentially the same as the GTAA assessment process - referring
specifically for example to concealed or doubled-up households and unauthorised encampments. The issue
of boat dwellers in West London is considered in the next sub-section of this report.
6.130 West London commissioned ORS to undertake a GTAA alongside this SHMA. This identified a very low need
for additional pitches for Gypsies and Travellers that meet the current planning definition. Overall the GTAA
found a need for 28 additional pitch for Gypsy and Traveller households that meet the planning definition
(including 9 previously identified in a joint study by Hammersmith and Fulham and Kensington and Chelsea).
However, the draft London Plan contains an alternative definition for Travellers based upon cultural heritage
in a similar form of words to the Housing Act 2004 and under this definition there is a need for an additional
205 pitches in West London.
Figure 90: Comparison of overall need for Gypsies and Travellers 2016-2041
Local Authority
Assessment of Need
PPTS (2015) Need Proposed London
Plan Need
Difference
Barnet 0 0 0
Brent 0 90 +90
Ealing 6 31 +25
Harrow 0 3 +3
Hammersmith and Fulham 9 9 +0
Hillingdon 5 60 +55
Hounslow 8 40 +32
TOTAL 28 233 +205
Opinion Research Services | West London – Strategic Housing Market Assessment October 2018
120
Boat Dwellers
6.131 Draft CLG Guidance provides advice on how to consider the needs of people residing in or resorting to
moorings for houseboats. This draft guidance was issued in March 2016 with no consultation attached to it;
but has still yet to be issued as official guidance.
6.132 As with Gypsies and Travellers who do not meet the planning definition of Travellers, houseboat residents
form part of the OAN because they will be included in the population and household projections. Data
release by the VOA in June 2016 shows that there were a total of 300 households paying Council Tax to West
London Councils as their main address.
6.133 However, there are many more than 300 houseboats occupied at any one time in the boroughs. For example,
some households only spend part of the year on their boat and would not pay Council Tax as a main
residence, while others are continuous cruisers who move regularly from location to location with stays of
no more than 14 days in one location. The Canal and Rivers Trust38 report that the total number of
continuous cruiser licences rose from 4,400 in 5,400 in 2014. Out of those 5,400 boats 16% moved less than
5 kilometres, and 66% moved under 20 kilometres in a year, so a high number of boats are moving around
relatively small areas of the canal network. The Canal and River Trust suggest that this is due to affordability
as much as preference, with many households moving on to houseboats to find cheaper accommodation.
6.134 The current draft Guidance is not particularly relevant or helpful when it comes to assessing need for boat
dwellers. The first issue to consider is the definition of a houseboat. The Housing and Planning Act defines a
“houseboat” as a boat or similar structure designed or adapted for use as a place to live. However, this
conflicts with the definition of a houseboat under waterways legislation (for example Section 3 of the British
Waterways Act 1971). This suggests that a houseboat is a static vessel and is not used for navigation, as
opposed to more mobile boat dwellers who do travel either from permanent moorings or as continual
cruisers.
6.135 In terms of surveys of boat dwellers, the Canal and Rivers Trust undertook a detailed survey of London’s
houseboat dwellers39 between September and October 2016. In total they received responses from 1,323
of 3,675 who had been recorded in London’s waterways in the previous year. In summary the survey found
that
» 58% of respondents to the survey say they use their boats as their primary home.
» 50% of those who responded said that affordability / financial reasons what a motivation for living
on a boat.
» 50% have been living on boats on London’s waterways for three years or less.
» Over 70% of respondents to the survey said that they owned their boats outright, a further 11% said
they owned their boat with a loan or mortgage.
» The top three specific improvement people want to see on the London waterways are (1) more
mooring places, (2) more mooring rings, (3) water points.
» 45% responding said they would have some or definite interest in a mooring if permanent / long-
term moorings were more readily available in the London
38 https://canalrivertrust.org.uk/media/library/2305.pdf 39 https://canalrivertrust.org.uk/refresh/media/thumbnail/30901-whos-on-londons-boats-survey-summary-report.pdf
Opinion Research Services | West London – Strategic Housing Market Assessment October 2018
121
6.136 Overall then, a half of all respondents to the survey reported that they lived on a houseboat because of
affordability issues, but that nearly half would be interested in a permanent mooring if one was available
and the largest issues raised by household dwellers was a lack of moorings.
6.137 Putting all of this together for West London we have a situation which requires a careful consideration of the
word ‘need’. West London already has many houseboat dwellers, and if more mooring were to be made
available then there is clearly a demand for them. However, this is not need in the sense of households who
wish to live on houseboats through personal preference; but is instead a reflection of wider housing market
pressures which have made houseboats a cheaper location to live London than bricks and mortar housing.
In this context, additional houseboat mooring should be seen in the context of providing for a more diverse
set of housing options in West London and as part of the wider housing delivery.
6.138 We therefore, do not consider that there is a direct need for more moorings in West London, but instead
that more mooring would help to address the wider housing needs of the area. We would suggest the role
of additional mooring in meeting housing needs in West London is likely to be small, but even at 0.1% of the
total OAN this would amount to 320 more mooring being made available to houseboat dwellers. This figure
would form part of the existing OAN and, as such, is not an additional to it. Furthermore, the needs of the
household fall within the wider housing duties of the Councils. This means that a separate 5-year land supply
is not requirement for planning purposes.
Opinion Research Services | West London – Strategic Housing Market Assessment October 2018
122
Appendix A Table of Figures
Figure 1: Process for establishing a Housing Number for the HMA (Source: ORS based on NPPF and PPG) .........................................8
Figure 2: Market Signals Uplifts for West London Boroughs (Source 2018 SHMA reports, ORS) ..........................................................10
Figure 3: Full Objectively Assessed Need for Housing for West London 2016-41 ...............................................................................11
Figure 4: Affordability of London Living Rent and Affordable Rent (Source: ORS Housing Model. Note: figures may not
sum due to rounding and figures marked “–“ are less than 10 dwellings) ...........................................................................12
Figure 5: Summary of Housing Needs and Supply Figures for West London) ......................................................................................13
Figure 6: 10-year Housing Completion Targets for West London Boroughs 2018/19-2028/29 (Source: GLA. Note: All
figures presented unrounded for transparency) ..................................................................................................................18
Figure 7: Stages for objectively Assessed need for London 2016-41 (Source: GLA Greater London SHMA 2017 Note: All
figures presented unrounded for transparency) ..................................................................................................................19
Figure 8: Greater London SHMA 2013 and 2017 Housing Needs Size and Tenure (Source: Greater London SHMA 2013
and 2017) ..............................................................................................................................................................................19
Figure 9: Estimated Annual OAN Using CLG Standardised Methodology. (Source: CLG and ORS Estimates) ......................................21
Figure 10: NHPAU Study - PAS OAN technical advice note 'Starting Point ............................................................................................26
Figure 11: ONS Travel To Work Areas (Source: ONS 2015) ....................................................................................................................27
Figure 12: Migration between London Boroughs (Source: Census 2011) ..............................................................................................30
Figure 13: House Prices in London by Broad Rental Market Area (Source: Land Registry 2014) ...........................................................31
Figure 14: West London Broad Rental Market Areas including percentage of each borough contained within BRMA .......................32
Figure 15: Overview Map of West London Boroughs (Source: Google Maps 2018) ..............................................................................35
Figure 16: Dwellings in West London (Source: MHCLG Live Table 615 [Oct ‘16], Live Table 100 [Mar ‘16]) .........................................36
Figure 17: Property as a Percentage of the Stock (Source: UK Census of Population 2011) .................................................................36
Figure 18: Tenure in West London as a Percentage of the Stock (Source: UK Census of Population 2011) ..........................................37
Figure 19: Summary of Market Signals ..................................................................................................................................................39
Figure 20: Market Signals Uplifts for West London Boroughs (Source 2018 SHMA reports, ORS) ........................................................41
Figure 21: Process for establishing the housing number for the HMA (Source: ORS based on NPPF and PPG) ....................................42
Figure 22: West London Sub-Region household projections 2016-36 (Source: GLA; CLG. Note: All figures presented
unrounded for transparency) ...............................................................................................................................................43
Figure 23: Average household size estimates and projections for the West London Sub-Region for the period 1991-2041
(Source: CLG estimates 1991-2011; GLA estimates and projections 2011-41) .....................................................................44
Figure 24: West London Sub-Region household projections by household type based on GLA 2016-based central trend
scenario 2016-36 (Source: GLA. Note: All figures presented unrounded for transparency) ................................................45
Figure 25: West London average household size by household type (Source: UK Census of Population 1991, 2001 and
2011) .....................................................................................................................................................................................45
Figure 26: Average household size estimates and projections for the West London Sub-Region for the period 1991-2041,
including overall average household size implied by projected household mix based on sizes recorded by
2011 Census data (Source: CLG estimates 1991-11; GLA estimates and projections 2011-41; Census 2011)......................46
Figure 27: Economic Activity Rate long-term UK trends (Source: Labour Market Statistics based on Labour Force Survey) ................49
Figure 28: Membership of private sector defined benefit and defined contribution schemes (Source: NAO) .....................................51
Opinion Research Services | West London – Strategic Housing Market Assessment October 2018
123
Figure 29: Employment rates for 60-74 years olds (Source: ONS, OBR. Note: Prior to 1983, the Labour Force Survey does
not contain an annual series for these indicators, so only available years are shown. The OBR medium-term
forecast to 2018 is produced top-down, not bottom-up, so the dotted lines for that period are a simple linear
interpolation) ........................................................................................................................................................................52
Figure 30: Female participation rates by Cohort (Source: ONS, OBR) ...................................................................................................53
Figure 31: Economic activity rates in 2016 and 2041 by age and gender based on OBR Labour Market Participation
Projections ............................................................................................................................................................................54
Figure 32: Projected economically active population 2016-41 (Note: All figures presented unrounded for transparency) .................55
Figure 33: Economically active in West London 2016-41 (Source: GLA)................................................................................................55
Figure 34: Full Objectively Assessed Need for Housing for West London 2016-41 ...............................................................................57
Figure 35: Estimated Annual OAN Using CLG Standardised Methodology. (Source: CLG and ORS Estimates) ......................................57
Figure 36: Households in temporary accommodation in the West London Sub-Region (Source: CLG P1E returns for
March 2006 and March 2016) ..............................................................................................................................................60
Figure 37: Concealed families in the West London Sub-Region by age of family representative (Source: Census 2001 and
2011) .....................................................................................................................................................................................61
Figure 38: Proportion of overcrowded households 2011 for the West London Sub-Region and change 2001-11 by tenure
(Note: Overcrowded households are considered to have an occupancy rating of -1 or less. Source: UK Census
of Population 2001 and 2011) ..............................................................................................................................................63
Figure 39: Estimate of the number of overcrowded households in the West London Sub-Region by tenure based on the
bedroom standard (Source: EHS; UK Census of Population 2011) .......................................................................................64
Figure 40: Number of households on the local authority housing registers 2001-17 (Note: Solid line shows total number
of households; dotted line shows number of households in a reasonable preference category. Source: LAHS
and HSSA returns to CLG. Note: Gaps in the line represent one or more authorities with data missing relating
to the year in question.) .......................................................................................................................................................65
Figure 41: Number of households on the local authority housing register at 1st April 2015 and 2016 (Source: LAHS
returns to CLG. Note: Totals may not sum, * denotes missing data) ....................................................................................66
Figure 42: Number of claimants in receipt of housing benefit in the West London Sub-Region by tenure (Source: DWP) ..................67
Figure 43: Assessing current unmet gross need for affordable housing for the West London Sub-Region (Source: ORS
Housing Model) ....................................................................................................................................................................69
Figure 44: Components of future affordable housing need for the West London Sub-Region 2016-21 (Source: ORS
Housing Model) ....................................................................................................................................................................71
Figure 45: Assessing total need for market and affordable housing in the West London Sub-Region (Source: ORS Housing
Model) ..................................................................................................................................................................................72
Figure 46: Affordable Housing Needs for West London Boroughs (Source: 2018 Borough SHMAs - ORS) ...........................................72
Figure 47: Full Objectively Assessed Need for Housing; Size and Tenure Mix for West London for GLA 2016 based Central
trend Migration 2016-41 (Note: Figures may not sum due to rounding) .............................................................................73
Figure 48: Affordability of London Living Rent and Affordable Rent (Source: ORS Housing Model. Note: figures may not
sum due to rounding and figures marked “–“ are less than 10 dwellings) ...........................................................................74
Figure 49: Summary of West London Needs by Tenure and Size (Source: ORS Housing Model. Note: figures may not sum
due to rounding and figures marked “–“ are less than 10 dwellings) ...................................................................................75
Figure 50: Stages for Affordable Housing Need for London 2016-41 (Source: GLA Greater London SHMA 2017 Note: All
figures presented unrounded for transparency) ..................................................................................................................75
Figure 51: West London average household size by household type (Source: Greater London SHMA 2017 Tables 7, 9 and
13) .........................................................................................................................................................................................76
Figure 52: Comparison of the Size Mix for Greater London and West London SHMAs (Source: GLA and ORS) ....................................77
Figure 53: Establishing the need for market and affordable housing: assessing affordability ..............................................................79
Opinion Research Services | West London – Strategic Housing Market Assessment October 2018
124
Figure 54: Number of Households by Tenure 1981-2011 (Source: UK Census of Population) ..............................................................83
Figure 55: Percentage of Households by Tenure 1981-2011 (Source: UK Census of Population) .........................................................83
Figure 56: Households by Tenure 1981-2011 (Source: UK Census of Population) ................................................................................83
Figure 57: West London population projections 2016-41 by 5-year age cohort based SHMA population projections
(Source: GLA 2016 based Central Trends) ............................................................................................................................85
Figure 58: Total projected households for 2016 and 2041 and summary of 25-year change by age of household
representative (Note: Figures may not sum due to rounding) .............................................................................................86
Figure 59: Total projected households for 2016 and 2041 and summary of 20-year change by age cohort of household
representative (Note: Figures may not sum due to rounding) .............................................................................................86
Figure 60: Total projected households for 2016 and 2041 and summary of 25-year change by household type and age of
household representative (Note: Figures may not sum due to rounding) ...........................................................................88
Figure 61: Group and Individual Registrations currently looking for land in the West London Sub-Region on the ‘Need-a-
Plot’ Portal (Source: NCaSBA, May 2018 and Google Maps) ................................................................................................90
Figure 62: Current supply (Source: EAC 2015. Figures may not sum due to rounding) .........................................................................91
Figure 63: Benchmark Figures for Specialist Accommodation based on Section A of the Strategic Housing for Older
People Resource Pack (Housing LIN, ADASS, IPC) 2012 ........................................................................................................92
Figure 64: Additional Modelled Demand for Older Person Housing (Source: Housing LIN Toolkit) .....................................................92
Figure 65: Level of work required to create full visitability (Source: EHS 2014-15 Annex Figure 2.5) ...................................................95
Figure 66: Households with a long-term illness or disability that affects their housing needs (Source: English Housing
Survey) ..................................................................................................................................................................................97
Figure 67: Households with a long-term illness or disability in West London in 2016 by effect on housing need (Source:
ORS Housing Model. Note: Figures may not sum due to rounding) .....................................................................................97
Figure 68: Households with a long-term illness or disability in West London in 2016 by effect on housing need (Source:
ORS Housing Model. Note: Figures may not sum due to rounding) .....................................................................................98
Figure 69: Households with a long-term illness or disability in West London in 2016 by effect on housing need (Source:
ORS Housing Model. Note: Figures may not sum due to rounding) .....................................................................................99
Figure 70: Percentage of households with a wheelchair user by type of housing and age of household representative
(Source: English Housing Survey 2013-14) ..........................................................................................................................100
Figure 71: Disability benefit claimants in receipt of mobility award by age (Source: DWP, May 2016) ..............................................100
Figure 72: Percentage of households with a wheelchair user by type of housing and age of household representative ...................101
Figure 73: Households needing Wheelchair Adapted Housing (Source: ORS Housing Model. Note: Figures may not sum
due to arithmetic rounding) ...............................................................................................................................................101
Figure 74: Ethnic Group Profile of All Usual Residents in West London (Source: Census 2011) ..........................................................102
Figure 75: Ethnic Group Classification (Source: UK Census of Population 2011) .................................................................................103
Figure 76: Average household size by Ethnicity. Red indicates larger than average household size (Source: Census 2011) .............103
Figure 77: Relative Proportion of BAME population 2011, 2016 and 2041 (Source: GLA Central Trend) ...........................................104
Figure 78: Population and Household Representative Person by Ethnicity. Red denotes a population percentage higher
than the corresponding household percentage (Source: Census 2011) .............................................................................105
Figure 79: Household Tenure by Ethnicity of HRP (Source: Census 2011) ...........................................................................................106
Figure 80: Percentage of ethnic group households overcrowded. Red denotes higher than the area average. (Source:
Census 2011) ......................................................................................................................................................................107
Figure 81: Concealed households in West London LSOAs by quintiles (red=high, dark green = low. Source: Census 2011) .............108
Figure 82: BAME households in West London LSOAs by quintiles (red=high, dark green = low, Source: Census 2011) ....................109
Figure 83: Correlation between proportions of BAME households and concealed households at LSOA level. (Source:
Census 2011) ......................................................................................................................................................................110

Opinion Research Services | West London – Strategic Housing Market Assessment October 2018
125
Figure 84: Percentage of Household Representative Persons in each borough that identify as religious. (Source Census
2011) ...................................................................................................................................................................................111
Figure 85: Percentage of religious households overcrowded. Red indicates higher than the borough average. (Source:
Census 2011) ......................................................................................................................................................................112
Figure 86: Average household size by Religion (Source: Census 2011) ...............................................................................................113
Figure 87: Proportions of the population Christian/Jewish/Other/No religion (blue bar) vs Buddhist/Muslim/Hindu/Sikh
(red bar), 2006, 2011, 2016 (Source: Annual Population Survey) .......................................................................................114
Figure 88: Religion by tenure in West London (Source: Census 2011) ................................................................................................115
Figure 89: Deployment of Ministry of Defence personnel by location, October (Source: MOD Quarterly Location Reports.
Figures may not sum due to rounding) ...............................................................................................................................116
Figure 90: Comparison of overall need for Gypsies and Travellers 2016-2041 ...................................................................................119

Opinion Research Services | West London – Strategic Housing Market Assessment October 2018
126
Appendix B Glossary of Terms
Definitions
Affordability is a measure of whether housing may be afforded by certain groups of households.
Affordable housing includes social rented and intermediate housing, provided to specified eligible
households whose needs are not met by the market. For the purpose of this report we have used the
definition in the National Planning Policy Framework 2012
Category 2 and 3 are classifications of wheelchair accessible housing. They refer to building regulations
Approved Document M (2015) which introduced three categories of accessible dwellings. Category 1
(visitable dwellings) relates to accessibility of all properties and, being mandatory, is not assessed in the
SHMA. Category 2 (accessible and adaptable dwellings) is optional and similar to Lifetime Homes. Category
3 (wheelchair user dwellings) is optional and equivalent to wheelchair accessible standard.
Census Output Area is the smallest area for which UK Census of Population statistics are produced. Each
Census Output Area had a population of around 250 people with around 100 dwellings at the time of the
2001 Census.
Concealed families are defined as; “family units or single adults living within other households, who may be
regarded as potential separate households which may wish to form given appropriate opportunity”40.
ECO underpins the Green Deal and places obligations on energy companies to facilitate installation of
energy efficiency measures in homes. ECO fits within the Green Deal framework where Green Deal finance
alone is not enough.
Equity is the difference between the selling price of a house and the value of the outstanding mortgage.
Green Deal is a market led framework that will allow individuals and businesses to make energy efficiency
improvements to their buildings at no upfront cost. Finance needed for the improvements is repaid, in
instalments, attached to an electricity bill.
Headship rates are defined by CLG as: “the proportion of people in each age group and household type who
are the ‘head’ of a household”41
A household is one person living alone, or two or more people living together at the same address who share
at least one meal a day together or who share a living room.
40 https://www.gov.uk/government/uploads/system/uploads/attachment_data/file/6338/1776873.pdf 41 https://www.gov.uk/government/uploads/system/uploads/attachment_data/file/182417/MethodologyFinalDraft.pdf
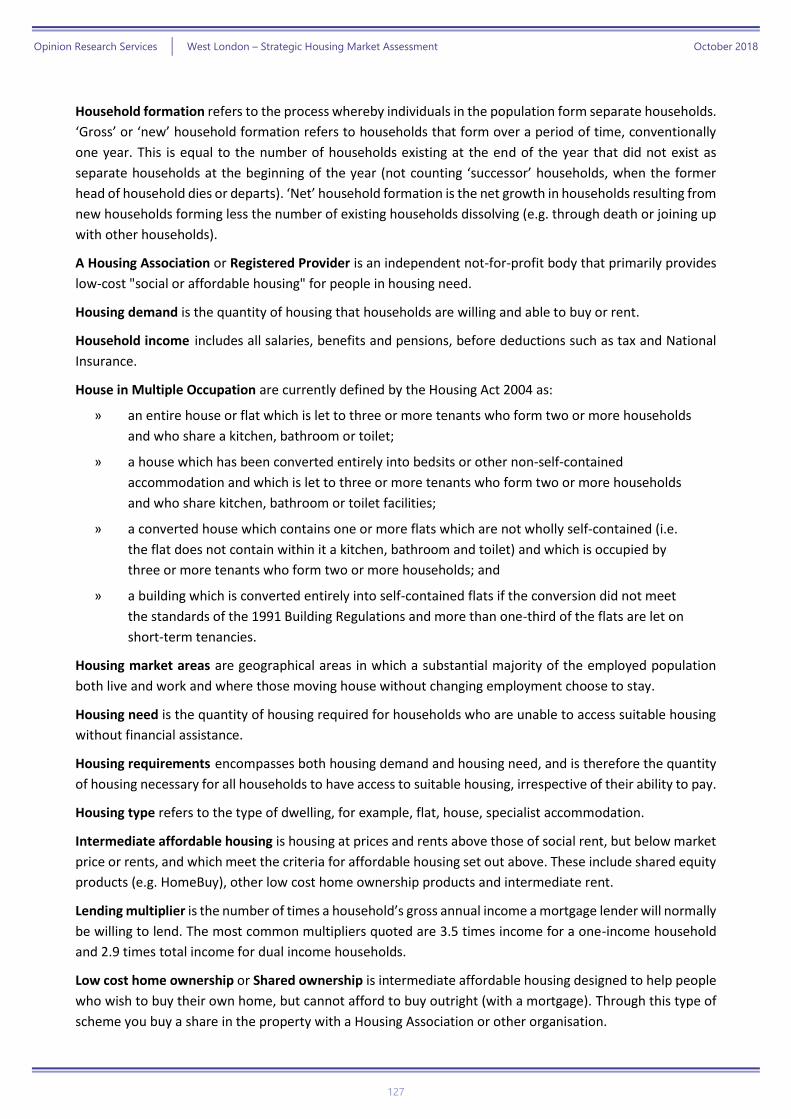
Opinion Research Services | West London – Strategic Housing Market Assessment October 2018
127
Household formation refers to the process whereby individuals in the population form separate households.
‘Gross’ or ‘new’ household formation refers to households that form over a period of time, conventionally
one year. This is equal to the number of households existing at the end of the year that did not exist as
separate households at the beginning of the year (not counting ‘successor’ households, when the former
head of household dies or departs). ‘Net’ household formation is the net growth in households resulting from
new households forming less the number of existing households dissolving (e.g. through death or joining up
with other households).
A Housing Association or Registered Provider is an independent not-for-profit body that primarily provides
low-cost "social or affordable housing" for people in housing need.
Housing demand is the quantity of housing that households are willing and able to buy or rent.
Household income includes all salaries, benefits and pensions, before deductions such as tax and National
Insurance.
House in Multiple Occupation are currently defined by the Housing Act 2004 as:
» an entire house or flat which is let to three or more tenants who form two or more households
and who share a kitchen, bathroom or toilet;
» a house which has been converted entirely into bedsits or other non-self-contained
accommodation and which is let to three or more tenants who form two or more households
and who share kitchen, bathroom or toilet facilities;
» a converted house which contains one or more flats which are not wholly self-contained (i.e.
the flat does not contain within it a kitchen, bathroom and toilet) and which is occupied by
three or more tenants who form two or more households; and
» a building which is converted entirely into self-contained flats if the conversion did not meet
the standards of the 1991 Building Regulations and more than one-third of the flats are let on
short-term tenancies.
Housing market areas are geographical areas in which a substantial majority of the employed population
both live and work and where those moving house without changing employment choose to stay.
Housing need is the quantity of housing required for households who are unable to access suitable housing
without financial assistance.
Housing requirements encompasses both housing demand and housing need, and is therefore the quantity
of housing necessary for all households to have access to suitable housing, irrespective of their ability to pay.
Housing type refers to the type of dwelling, for example, flat, house, specialist accommodation.
Intermediate affordable housing is housing at prices and rents above those of social rent, but below market
price or rents, and which meet the criteria for affordable housing set out above. These include shared equity
products (e.g. HomeBuy), other low cost home ownership products and intermediate rent.
Lending multiplier is the number of times a household’s gross annual income a mortgage lender will normally
be willing to lend. The most common multipliers quoted are 3.5 times income for a one-income household
and 2.9 times total income for dual income households.
Low cost home ownership or Shared ownership is intermediate affordable housing designed to help people
who wish to buy their own home, but cannot afford to buy outright (with a mortgage). Through this type of
scheme you buy a share in the property with a Housing Association or other organisation.
Opinion Research Services | West London – Strategic Housing Market Assessment October 2018
128
Lower quartile means the value below which one quarter of the cases falls. In relation to house prices, it
means the price of the house that is one-quarter of the way up the ranking from the cheapest to the most
expensive.
Lower Super Output Area is a group of around 5-6 Census Output Areas and is the smallest geography for
many Government statistics. Each Lower Super Output Area had a population of around 1,250 people with
around 500 dwellings at the time of the 2001 Census.
Market housing is private housing for rent or for sale, where the price is set in the open market.
Market signals are indicators that supply and demand are not in balance for a local housing market.
Possible market signals are listed in PPG and the following are the most pertinent; house prices, private
sector rents, affordability, rate of development and overcrowding.
Migration is the movement of people between geographical areas. In this context it could be either local
authority districts, or wider housing market areas. The rate of migration is usually measured as an annual
number of individuals, living in the defined area at a point in time, who were not resident there one year
earlier. Gross migration refers to the number of individuals moving into or out of the authority. Net migration
is the difference between gross in-migration and gross out-migration.
A projection of housing needs or requirements is a calculation of numbers expected in some future year or
years based on the extrapolation of existing conditions and assumptions. For example, household projections
calculate the number and composition of households expected at some future date(s) given the projected
number of residents, broken down by age, sex and marital status, and an extrapolation of recent trends in
the propensity of different groups to form separate households.
Registered Social Landlord/Registered Provider see Housing Association.
Secondary data is existing information that someone else has collected. Data from administrative systems
and some research projects are made available for others to summarise and analyse for their own purposes
(e.g. Census, national surveys).
Shared ownership see Low Cost Home Ownership.
Social rented housing is provided by social landlords and rented for less than would be paid if renting
privately.
Specialised housing refers to specially designed housing (such as mobility or wheelchair accommodation,
hostels or group homes) or housing specifically designated for particular groups (such as retirement housing).
Opinion Research Services | West London – Strategic Housing Market Assessment October 2018
129
Acronyms and Initials
ASHE Annual Survey of Hours and Earnings
BME Black and Minority Ethnic
BRMA Broad Rental Market Area
CACI Private sector company providing modelled data
CORE The Continuous Recording System (for Housing Association and Local Authority lettings)
DEFRA Department for Environment, Food and Rural Affairs
DWP Department of Work and Pensions
GIS Geographical Information Systems
HBF Home Builders Federation
HMO House in Multiple Occupation
IMD Indices of Multiple Deprivation
LA Local Authority
LDF Local Development Framework
LDP Local Development Plan
LHA Local Housing Allowance
NHSCR National Health Service Central Register
NPPF National Planning Policy Framework
ONS Office for National Statistics
ORS Opinion Research Services
POPPI Projecting Older Person Population Information
REIT Real Estate Investment Trust
RSL Registered Social Landlord
SAR Share Accommodation Rate
SHMA Strategic Housing Market Assessment
UDP Unitary Development Plan


![fall housing [Recovered] - London Properties](https://img.pdfslide.us/doc/110x75/6270cc02189738378c04df6e/fall-housing-recovered-london-properties.jpg)