Embed Size (px)
Citation preview
Please give credit to St. Pete – Clearwater IBD Meetup group – Michael D. Hicks for welcome packet inspiration
West Linn, Oregon and Surrounding Area – Investor’s Business Daily Meetup Group
Index of Materials
1) Welcome Letter
2) How you think is Everything – Move beyond tough stuff
3) Recommended Reading Books
4) Q & A with Successful Investor
5) Online Education Page on Investors.com
6) Tracking the Daily Market Averages
7) Quick intro to Chart Reading – cup and handle chart (one of many)
8) Tip sheet for navigating Investors.com

Please give credit to St. Pete – Clearwater IBD Meetup group – Michael D. Hicks for welcome packet inspiration
West Linn, Oregon and Surrounding Area – Investor’s Business Daily Meetup Group
http://www.meetup.com/westlinnibd/
New Member: Welcome Packet
Dear New Member:
Thank you for the pleasure of your company and we look forward to seeing you at your first meeting. I have uploaded in the files section of our Meetup site (see link above) a collection of new member materials for your review. You can access the files section by navigating across the menu bar, hover over the word “MORE”, when additional options appear click “Files” then select the file “Welcome Packet – West Linn Area.pdf”
This collection is especially useful for those new to the CANSLIM® methodology and Investor’s Business Daily (IBD) and is comprised of various IBD materials. I believe these materials contain key principles that bring out the essence of the CAN SLIM® investment methodology. If used as your key initial resource, I believe these materials will accelerate your understanding of CAN SLIM® investing techniques. To gain a full and comprehensive understanding, it is imperative that you read what I refer to as “The Book”, How to make Money in Stocks – Complete Investing System, by William J. O’Neil as well as his other works.
The West Linn, Oregon and Surrounding Area’s IBD Meetup Group is an informal association of fellow IBD subscribers and those interested in learning more about IBD and the CAN SLIM® methodology. The purpose of the Meetup is to exchange stock investment ideas and promote the study of CANSLIM investing principles. Please feel free to email me as well as other members whom you may meet through the Meetup website if you have questions about CAN SLIM® investing (the use of message board is highly recommended on the meetup website). This Meetup is Not-For-Profit – I (we) am not a professional(s) and my purpose is not to render any type of investment advice.
The meetings will normally be held once per month in the Community Room at the West Linn location of Pacific West Bank. As we grow in membership we will determine the best times and days for our meetings. The format for discussions will also be determined by the group’s feedback as we have many options (review CAN SLIM® lessons, discuss overall market conditions, individual stocks, IBD tools, review submitted topics by group members, and even hold stock investing contests, etc.). In addition, I can usually stay past the meeting time to further explain CAN SLIM® investing principles, answer member questions, and analyze stock charts not covered during the formal meeting time.
Welcome aboard. I am glad that you have joined this group and I hope that this Meetup can aid in your quest to better understand CAN SLIM® growth stock investment principles.
Sincerely,
Eric Schmidt, Founder/Co-Organizer

Print Close
© 2011 Investor's Business Daily, Inc. All rights reserved. Investor's Business Daily, IBD and CAN SLIM and their corresponding logos are registered
trademarks of Data Analysis Inc. Copyright and Trademark Notice | Privacy Statement Terms | Conditions of Use
MANAGEMENT
HOW YOU THINK IS EVERYTHING Move Beyond Tough Stuff
By CORD COOPER
Posted 09/12/2005 03:00 AM ET
1 They might not realize it, but successful people are everyday heroes. Like heroes in the classic sense, they look beyond adversity to their
destiny, mission or goal, says attorney and executive trainer Dan Castro. In many cases, they face seemingly insurmountable hurdles and
crippling self-doubt -- and go on to achieve things they never thought possible, he notes in the new book, "Critical Choices That Change
Lives." "Two of those choices involve looking beyond circumstances and staying focused," Castro said in an interview. "What you focus on
determines what you believe. What you believe determines what you expect." And what you expect determines the possibilities you see and
the options you'll pursue. How do you keep focusing forward? ** Don't get hamstrung by the past or present. In short, take control. "Our mind
is the steering wheel of our lives. No matter what the subject matter is, if you focus on it long enough, your entire life will eventually turn in that
direction," Castro wrote in "Critical Choices." "Control what you read, what you watch and who you associate with" and you'll start to reshape
your life, he said. The key is being open to opportunity, even amid loss or serious challenges. Castro quotes cyclist Lance Armstrong: "There
aren't many clearly marked, signpost moments in your life, but occasionally they come along, and you have a choice. You can either do
something the same old way, or you can make a better decision. "You have to be able to recognize the moment and to act on it at the risk of
saying later, "That's when it all could've been different.' " Forget feeling trapped in circumstances, Castro urges. "It might be a bad
employment situation," he said. "It might be a bad personal relationship." His message: Don't stay where you are. Our circumstances often
result from decisions we make moment by moment. Something to think about: Do your everyday decisions align with long-term goals? ** See
the past differently. Formula 409 got its name because the first 408 attempts to make the cleansing agent were failures, Castro notes. The
409 team and others who eventually achieved success saw failure as a process, not a verdict. ** Keep going. "No matter what you've
achieved in the past, you've only just begun. No matter how great your victories have been in the past, they serve only as evidence of what
you could accomplish in the future," said Castro, who's spent years mentoring young people. "Don't ever be satisfied with last year's victories.
Last year's victories don't pay today's bills," Castro said. "Last year's victories don't fulfill tomorrow's dreams." ** Don't just make a name; make
a difference. "The impact we have on the lives of others is our only true legacy. This is the only thing that truly lasts when we are gone,"
Castro said. "Walk softly and gently through the sand of other people's lives. The footprints we leave behind will be there forever."
HOW YOU THINK IS EVERYTHING Move Beyond Tough Stuff - IBD - ... http://www.investors.com/NewsAndAnalysis/ArticlePrint.aspx?id=411583
1 of 1 7/29/2011 10:39 AM
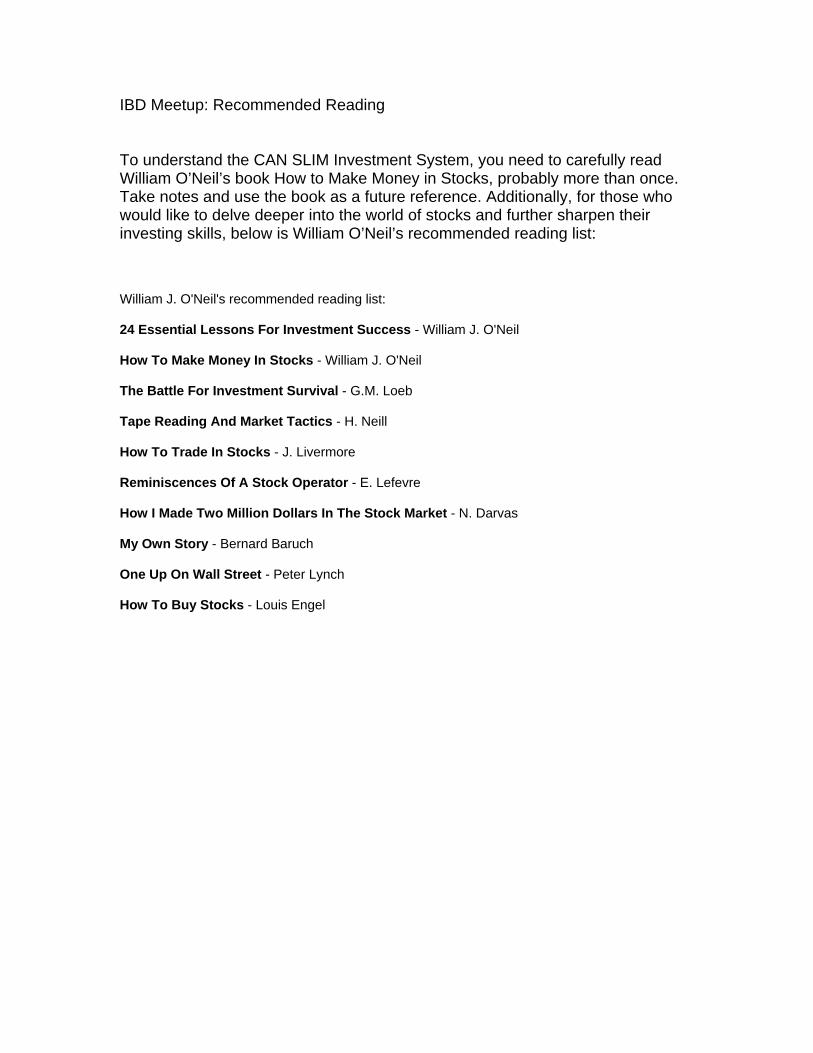
IBD Meetup: Recommended Reading To understand the CAN SLIM Investment System, you need to carefully read William O’Neil’s book How to Make Money in Stocks, probably more than once. Take notes and use the book as a future reference. Additionally, for those who would like to delve deeper into the world of stocks and further sharpen their investing skills, below is William O’Neil’s recommended reading list: William J. O'Neil's recommended reading list: 24 Essential Lessons For Investment Success - William J. O'Neil How To Make Money In Stocks - William J. O'Neil The Battle For Investment Survival - G.M. Loeb Tape Reading And Market Tactics - H. Neill How To Trade In Stocks - J. Livermore Reminiscences Of A Stock Operator - E. Lefevre How I Made Two Million Dollars In The Stock Market - N. Darvas My Own Story - Bernard Baruch One Up On Wall Street - Peter Lynch How To Buy Stocks - Louis Engel
B16 FRIDAY, FEBRUARY 22, 2008 INVESTORS.COM
B Y T R A N G H OINVESTOR'S BUSINESS DAILY
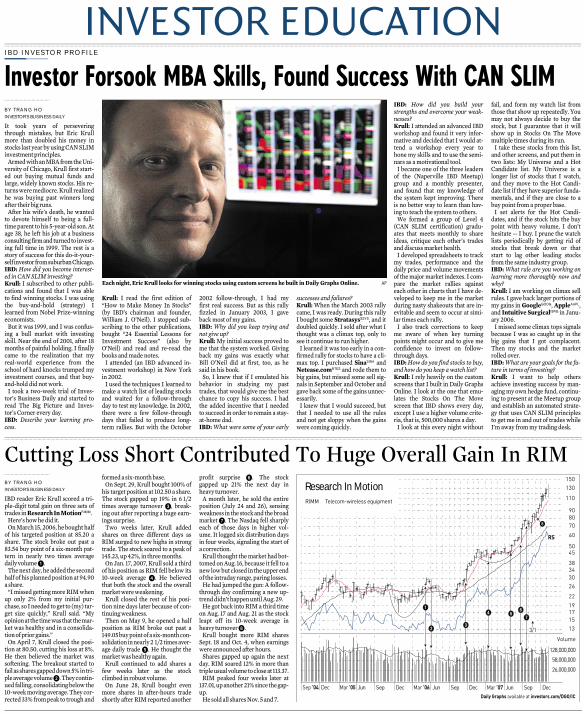
IBD reader Eric Krull scored a tri-ple-digit total gain on three sets oftrades inResearchInMotionRIMM.
Here’s how he did it.On March 15, 2006, he bought half
of his targeted position at 85.20 ashare. The stock broke out past a83.54 buy point of a six-month pat-tern in nearly two times averagedaily volume �.
The next day, he added the secondhalf of his planned position at 94.90a share.
“I missed getting more RIM whenup only 2% from my initial pur-chase, so I needed to get to (my) tar-get size quickly,” Krull said. “Myopinion atthe time was that the mar-ket was healthy and in a consolida-tion of prior gains.”
On April 7, Krull closed the posi-tion at 80.50, cutting his loss at 8%.He then believed the market wassoftening. The breakout started tofail as shares gapped down 5% in tri-ple average volume�. They contin-ued falling, consolidating below the10-week moving average. They cor-rected 33% from peak to trough and
formed a six-month base.On Sept. 29, Krull bought 100% of
his target position at 102.50 a share.The stock gapped up 19% in 6 1/2times average turnover �, break-ing out after reporting a huge earn-ings surprise.
Two weeks later, Krull addedshares on three different days asRIM surged to new highs in strongtrade. The stock soared to a peak of145.23, up 42%, in three months.
On Jan. 17, 2007, Krull sold a thirdof his position as RIM fell below its10-week average �. He believedthat both the stock and the overallmarket were weakening.
Krull closed the rest of his posi-tion nine days later because of con-tinuing weakness.
Then on May 9, he opened a halfposition as RIM broke out past a149.05 buy point of a six-month con-solidation in nearly 2 1/2 times aver-age daily trade �. He thought themarket was healthy again.
Krull continued to add shares afew weeks later as the stockclimbed in robust volume.
On June 28, Krull bought evenmore shares in after-hours tradeshortly after RIM reported another
profit surprise �. The stockgapped up 21% the next day inheavy turnover.
A month later, he sold the entireposition (July 24 and 26), sensingweakness in the stock and the broadmarket �. The Nasdaq fell sharplyeach of those days in higher vol-ume. It logged six distribution daysin four weeks, signaling the start ofa correction.
Krull thought the market had bot-tomed on Aug. 16, because it fell to anew low but closed in the upper endof the intraday range, paring losses.
He had jumped the gun: A follow-through day confirming a new up-trend didn’t happen until Aug. 29.
He got back into RIM a third timeon Aug. 17 and Aug. 21 as the stockleapt off its 10-week average inheavy turnover �.
Krull bought more RIM sharesSept. 18 and Oct. 4, when earningswere announced after hours.
Shares gapped up again the nextday. RIM soared 12% in more thantriple usual volume to close at113.37.
RIM peaked four weeks later at137.01,up another 21% sincethe gap-up.
He sold all shares Nov. 5 and 7.
B Y T R A N G H OINVESTOR'S BUSINESS DAILY
It took years of perseveringthrough mistakes, but Eric Krullmore than doubled his money instocks last year by using CAN SLIMinvestment principles.
Armed with an MBA from the Uni-versity of Chicago, Krull first start-ed out buying mutual funds andlarge, widely known stocks. His re-turns were mediocre. Krull realizedhe was buying past winners longafter their big runs.
After his wife’s death, he wantedto devote himself to being a full-time parent to his 5-year-old son. Atage 38, he left his job at a businessconsultingfirmand turned toinvest-ing full time in 1999. The rest is astory of success for this do-it-your-selfinvestorfromsuburbanChicago.IBD:How did you become interest-ed in CANSLIM investing?Krull: I subscribed to other publi-cations and found that I was ableto find winning stocks. I was usingthe buy-and-hold (strategy) Ilearned from Nobel Prize-winningeconomists.
But it was 1999, and I was confus-ing a bull market with investingskill. Near the end of 2001, after 18months of painful holding, I finallycame to the realization that myreal-world experience from theschool of hard knocks trumped myinvestment courses, and that buy-and-hold did not work.
I took a two-week trial of Inves-tor’s Business Daily and started toread The Big Picture and Inves-tor’s Corner every day.IBD: Describe your learning pro-cess.
Krull: I read the first edition of“How to Make Money In Stocks”(by IBD’s chairman and founder,William J. O’Neil). I stopped sub-scribing to the other publications,bought “24 Essential Lessons forInvestment Success” (also byO’Neil) and read and re-read thebooks and made notes.
I attended (an IBD advanced in-vestment workshop) in New Yorkin 2002.
I used the techniques I learned tomake a watch list of leading stocksand waited for a follow-throughday to test my knowledge. In 2002,there were a few follow-throughdays that failed to produce long-term rallies. But with the October
2002 follow-through, I had myfirst real success. But as this rallyfizzled in January 2003, I gaveback most of my gains.IBD: Why did you keep trying andnot give up?Krull:My initial success proved tome that the system worked. Givingback my gains was exactly whatBill O’Neil did at first, too, as hesaid in his book.
So, I knew that if I emulated hisbehavior in studying my pasttrades, that would give me the bestchance to copy his success. I hadthe added incentive that I neededto succeed in order to remain a stay-at-home dad.IBD:What were some of your early
successes and failures?Krull:When the March 2003 rallycame, I was ready. During this rallyI bought some StratasysSSYS, and itdoubled quickly. I sold after what Ithought was a climax top, only tosee it continue to run higher.
I learned it was too early in a con-firmed rally for stocks to have a cli-max top. I purchased SinaSINA andNetease.comNTES and rode them tobig gains, but missed some sell sig-nals in September and October andgave back some of the gains unnec-essarily.
I knew that I would succeed, butthat I needed to use all the rulesand not get sloppy when the gainswere coming quickly.
IBD: How did you build yourstrengths and overcome your weak-nesses?Krull: I attended an advanced IBDworkshop and found it very infor-mative and decided that I would at-tend a workshop every year tohone my skills and to use the semi-nars as a motivational tool.
I became one of the three leadersof the (Naperville IBD Meetup)group and a monthly presenter,and found that my knowledge ofthe system kept improving. Thereis no better way to learn than hav-ing to teach the system to others.
We formed a group of Level 4(CAN SLIM certification) gradu-ates that meets monthly to shareideas, critique each other’s tradesand discuss market health.
I developed spreadsheets to trackmy trades, performance and thedaily price and volume movementsof the major market indexes. I com-pare the market rallies againsteach other in charts that I have de-veloped to keep me in the marketduring nasty shakeouts that are in-evitable and seem to occur at simi-lar times each rally.
I also track corrections to keepme aware of when key turningpoints might occur and to give meconfidence to invest on follow-through days.IBD:How do you find stocks to buy,and how do you keep awatch list?Krull: I rely heavily on the customscreens that I built in Daily GraphsOnline. I look at the one that emu-lates the Stocks On The Movescreen that IBD shows every day,except I use a higher volume crite-ria, that is, 500,000 shares a day.
I look at this every night without
fail, and form my watch list fromthose that show up repeatedly. Youmay not always decide to buy thestock, but I guarantee that it willshow up in Stocks On The Movemultiple times during its run.
I take these stocks from this list,and other screens, and put them intwo lists: My Universe and a HotCandidate list. My Universe is alonger list of stocks that I watch,and they move to the Hot Candi-date list if they have superior funda-mentals, and if they are close to abuy point from a proper base.
I set alerts for the Hot Candi-dates, and if the stock hits the buypoint with heavy volume, I don’thesitate — I buy. I prune the watchlists periodically by getting rid ofstocks that break down or thatstart to lag other leading stocksfrom the same industry group.IBD:What rule are you working onlearning more thoroughly now andwhy?Krull: I am working on climax sellrules. I gave back larger portions ofmy gains in GoogleGOOG,AppleAAPL,and Intuitive SurgicalISRG in Janu-ary 2006.
I missed some climax tops signalsbecause I was so caught up in thebig gains that I got complacent.Then my stocks and the marketrolled over.IBD:What are your goals for the fu-ture in terms of investing?Krull: I want to help othersachieve investing success by man-aging my own hedge fund, continu-ing to present at the Meetup groupand establish an automated strate-gy that uses CAN SLIM principlesto get me in and out of trades whileI’m away from my trading desk.
Daily Graphs available at investors.com/DGO/IC
RS
31517191
22
62034383
5405
06
070809
011
031051
ceDpeS nuJ Mar ’07 ceD peS nuJ Mar ’06 ceD peS nuJ Mar ’05 ceD Sep ’04
000,000,62
000,000,85
000,000,821
Volume
Research In MotionRIMM Telecom-wireless equipment
3/1
INVESTOR EDUCATION
Cutting Loss Short Contributed To Huge Overall Gain In RIM
I B D I N V E S T O R P R O F I L E
Investor Forsook MBA Skills, Found Success With CAN SLIM
Each night, Eric Krull looks forwinning stocks using custom screens he built in Daily Graphs Online. AP
© 2008 Investor’s Business Daily, Inc. Investor’s Business Daily, IBD and CAN vSLIM and corresponding logos are registered trademarks owned by Data Analysis, Inc., an affi liate of Investor’s Business Daily.
Discover new option investing ideas Access premium option screens and over 20 current reports.
Exclusive daily options columnBenefi t from “Options in Focus”, a daily column focusing on options strategies, education and more!
Learn how to become a more successful option investor Learn about option basics, puts & calls, LEAPS, and strategies to help you succeed.
Visit investors.com/optioncenter today!
Option Center
Sponsored by:
New from
1
Tracking the market’s direction is a powerful key to successful investing. If you trade in sync with the market, take advantage of new uptrends, and learn to reduce investments at the beginning of new downtrends, you can make, and keep, a lot of money. If you don’t acquire these skills, you’ll be fighting the market and find it much more difficult to buy big winners and retain most of your profits.
There are many market and economic indicators out there, but nothing is more valuable than what the market is actually doing. What difference does it make what the bull/bear ratio is if the market is telling you what is going on? These other indicators can be dangerous, because you may choose the metrics that support your view of the market. But, your opinion doesn’t determine market direction. The market is telling you what it’s doing, why not listen?
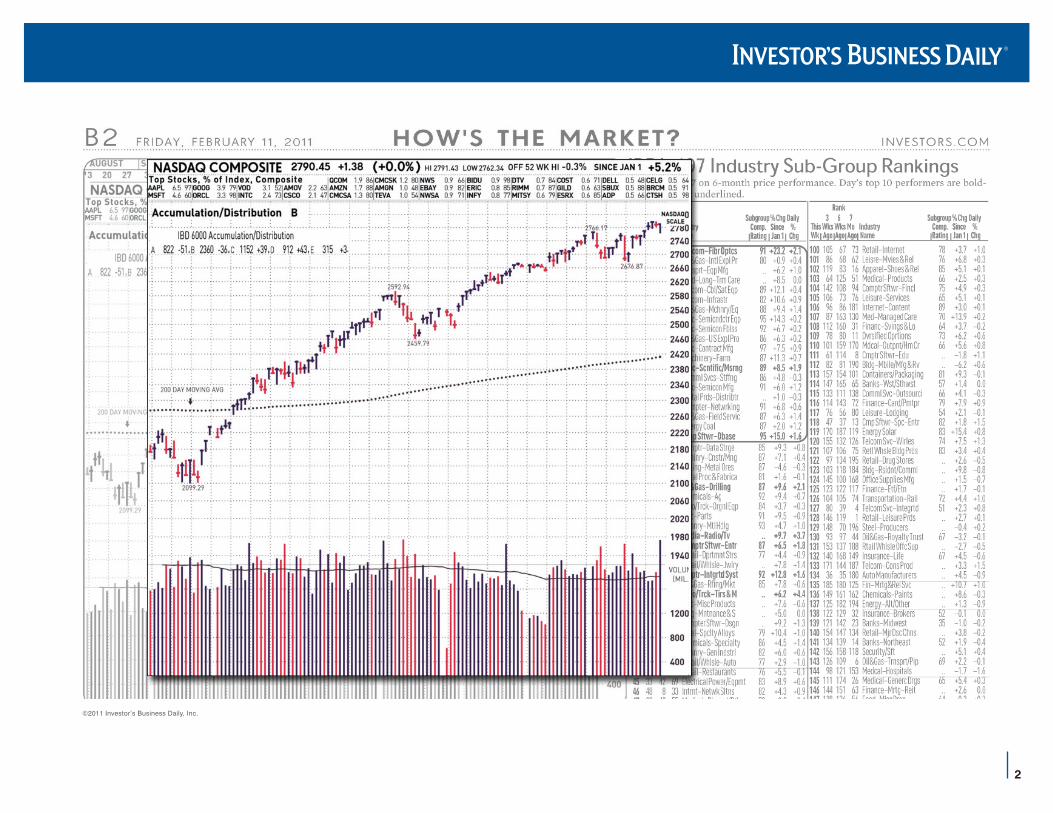
Daily Tracking of the Market
You need to track the market’s activity every day. Whether the market is in a roaring bull or extended bear, you need to know what the market is doing day-to-day, to ensure you are making the correct decisions regarding your hard earned money. To help you with this, you should be looking at the general market charts on B2 (see chart on next page) of Investor’s Business Daily® and eIBD™. These oversized charts for the Nasdaq, S&P 500 and NYSE, make it easier to spot price and volume clues, and the critical distribution days, rally attempts, and follow-though days.
Tracking the Daily Market AveragesYour Most Important and Profitable Investing Skill
2
©2011 Investor’s Business Daily, Inc.
3
Learning to read these charts with knowledge and skill will help you protect your cash before a big market downturn and start buying the big winners right away in a new confirmed uptrend. By using these charts, you’ll begin to recog-nize where the market is, and what it is actually doing. We’ll discuss the benefits of doing this in three parts:
Part 1 — Market Tops and Distribution Days (recognizing six distribution days over a five week period at the top of the market)
Part 2 — Rally Attempts (how to interpret each attempted rally)
Part 3 — Follow-Through Days (recognizing follow-through days - time to begin buying)
Part 1: Market Tops and Distribution DaysMost people don’t recognize market tops because they don’t know exactly what to look for. Some do know the clues of a market top, but ignore them since most distribution days occur while the market is still going up. Everyone is happy. Their stocks are going up. So, they do not pay attention and count the number of tell-tale distribution days. You must recognize these distributions days and how they will help you sell and raise some cash as the market tops, lock-in your gains, and reduce your risk exposure.
Distribution Days
Distribution in the market takes two forms:
Distribution Day – This occurs when one of the major indexes (Nasdaq, S&P 500, NYSE), closes more than 0.2% lower on higher volume than the day before. It doesn’t matter how much higher the volume is, as long as it is higher. It’s that simple to spot and count the number of days. You can do it!
Stalling Day – This occurs when one of the indexes listed above shows a volume increase from the day before, but the index itself shows a significantly smaller price increase compared to the larger price increase on either of the two days before, and/or barely finishes up for the day.
4
6
5
4
3
2
1
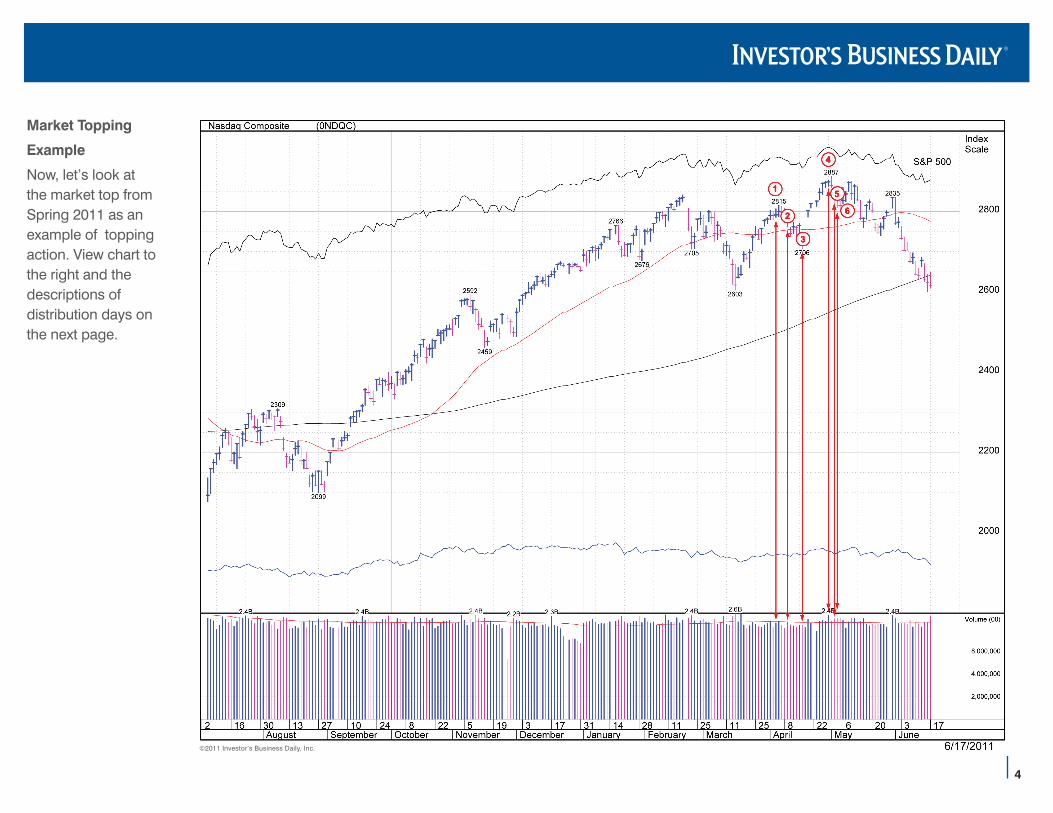
Market Topping
Example
Now, let’s look at the market top from Spring 2011 as an example of topping action. View chart to the right and the descriptions of distribution days on the next page.
©2011 Investor’s Business Daily, Inc.
5
Distribution Day #1 - The market is moving along, and all of a sudden, you get a distribution day. The first day doesn’t mean a whole lot. They occur naturally in a strong market.
Distribution Day #2 - A few days later, you may get a second. And, that doesn’t mean much either.
Distribution Day #3 - However, when a third distribution day occurs, that’s when you really must start paying attention. Now, you have to begin thinking, could this lead to 5 or 6 distribution days which almost always marks the top of a market?
The top could last 5 to 7 weeks, 6 months or longer. But, the probability for a decline that will affect most stocks is very high.
Distribution Day #4 - When you get a fourth distribution day, you may now want to consider selling shares or begin to lighten up some positions. You don’t want to argue with what the market is beginning to tell you.
Distribution Day #5 - On the fifth distribution day, you should consider selling more of your holdings, since now we are nearing the sixth distribution day, which typically confirms this is topping action.
At this time, the market is still going up and people are happy as a lark, since things appear to be working and the news is probably pretty good. They have certain opinions, and they really like this stock or that stock. So, most people simply don’t want to think about selling. It’s all about human psychology.
Distribution Day #6 - Then, you get the sixth distribution day which tells you definitively that the market is now being overcome by supply about ready to correct. At this point you should be off margin, if you use it, and have safely raised more cash. This is when you want to start building your watch lists with leading stocks that hold up relatively better during the correction and leading stocks that correct and begin forming new bases. Virtually all sound bases are created during market corrections. So, this is no time to go to sleep on the job. You’re now watching the market every day, looking for a rally attempt that, in time, leads to a follow-through day. That is your crucial signal to begin buying fundamentally strong stocks that start coming out of proper bases.
6
Part 2: Evaluating Each Rally AttemptWhen the market is in a correction, it doesn’t go straight down. There will be up days here and there, and there will also be several up days strung together. These signify an attempted rally. There are several signs to look for in a rally attempt to determine:
a) if it’s for real and may lead to a strong follow-through day starting a new uptrend
or
b) if it is just the standard ups and downs of a market continuing to sink lower.
If you learn to differentiate between these and spot key clues, it can be very profitable. There are several factors you want to measure carefully when the market begins each new rally attempt.
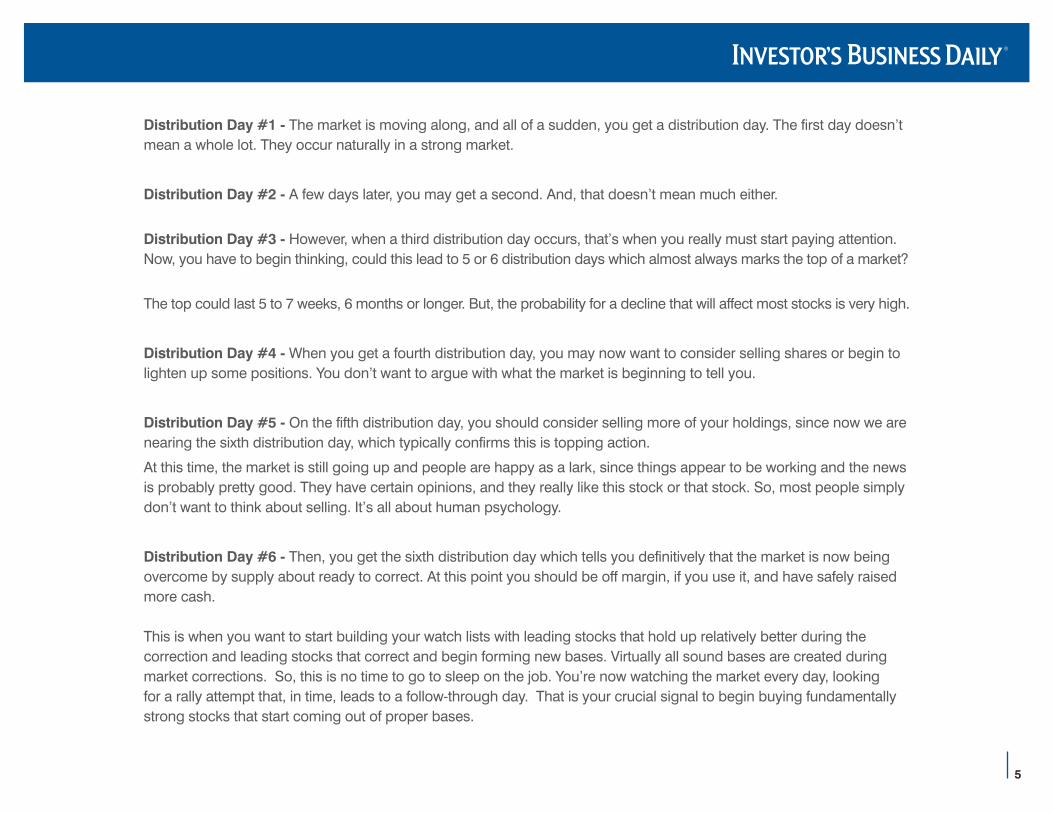
Volume: Is it increasing or decreasing?
On the way up, is volume increasing each day as the market goes higher in price?
If so, you may have something. But, you still need to wait for confirmation of a new uptrend with a strong follow-through day.
Volume increasing on up days
©2011 Investor’s Business Daily, Inc.
7
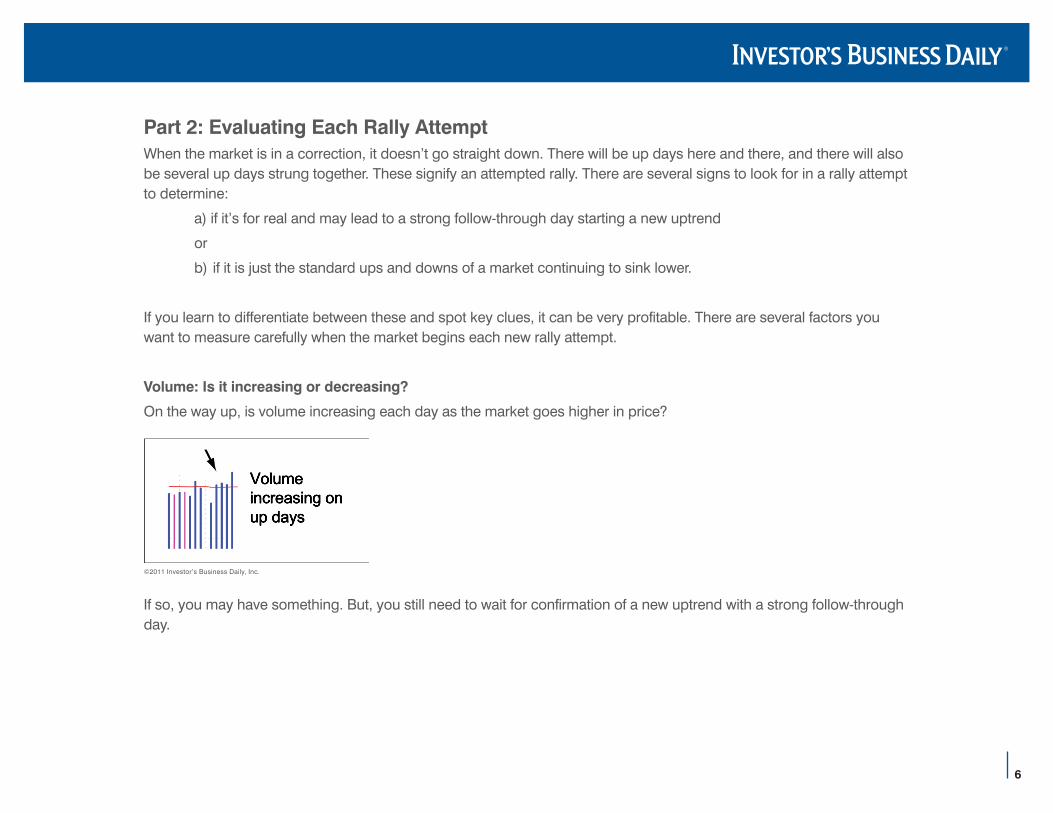
or Is volume declining each day on the way up?
This indicates no real demand for shares as the market rises. This is not a good indicator for a rally attempt, since the price rise increasingly lacks conviction, it can be short-lived before a new leg down.
Volume: Is it above average or below average?
Is volume on the way up above average or below average?
For example, as the market is drifting lower, are your seeing above average volume on several down days in a row, then when it turns up for a few days the volume is below average? That’s telling you there’s more supply than demand, which usually indicates the days up may be temporary and the general trend is still down.
Above average down days, below average up days
©2011 Investor’s Business Daily, Inc.
Volume decreasing on up days
©2011 Investor’s Business Daily, Inc.
8
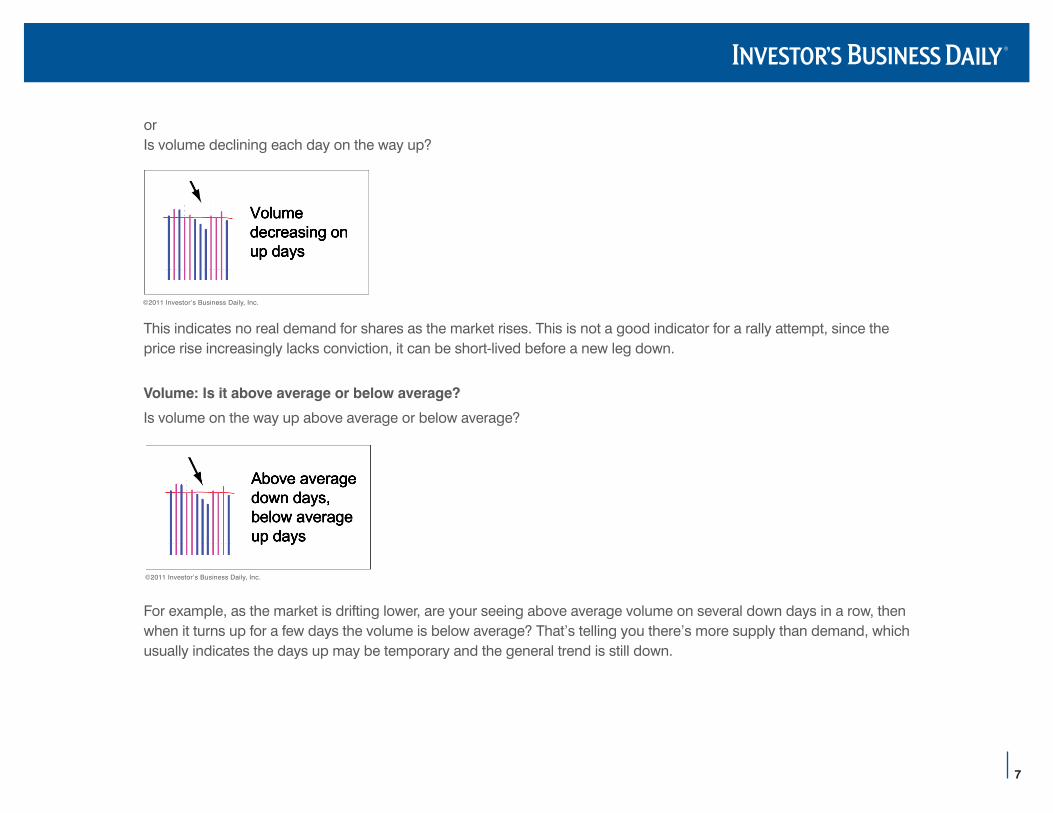
Volume: Is it higher on the way up or on the way down?
Is volume on the way up higher than it was on the way down?
For example, you may have a few up days on above average volume, but if the previous four or five down days were on even higher volume, that indicates the rally may soon fail.
Does the Market Have a Personality?
When the market is drifting lower, it can start developing a personality. There may be a leg down on heavy volume, then a three day rally attempt in lower volume. Then, another leg down in heavy volume and another three day rally attempt on lower volume.
When you learn to recognize this, you can better stay in sync with the market.
Above average up days, preceded by even higher down days
©2011 Investor’s Business Daily, Inc.
Weak rally personality
©2011 Investor’s Business Daily, Inc.
9
Plus, if you’re shorting, this may be a great clue. If the market is rallying up on light and/or decreasing volume for a few days, then the first day it turns lower on heavy, increasing volume, that’s where you may (before new lows are made) want to short.
Eventually, the market will have the strength to start a real move higher, so the attempted rally will be successful and confirmed by a strong follow-through day on the fourth attempted rally day or even several days beyond the fourth day.
Part 3: Follow-Through DaysSuccessful investors understand the different stages of a normal stock market cycle and pay special attention to the importance of market corrections. Market downtrends can help you find new leaders since most chart patterns are created during market declines. It’s easy to give up and throw in the towel during a weak market, but investors must remember that the market will turn on some out-of-the-blue news, and a whole new uptrend may start with a strong, valid follow-through day. It’s important to note: new winners will emerge right on a follow-through day, so you need to be prepared, on the job and mentally ready to take advantage of a sudden developing new uptrend.
Follow-Through Definition
Follow-through days mark the start of all new market uptrends. After a period of market weakness, the market will mark a bottom, that’s the start of a rally attempt when a major index (Nasdaq, S&P 500, NYSE) will close higher in price.
Then, the first two or three days of the rally are disregarded, as it has not yet proven it will succeed and follow-through with power and conviction to confirm this rally is a real new uptrend in the market.
Therefore, the follow-through day needs to come on or after the fourth day of a rally attempt. A follow-through day occurs when one of the major indexes listed above closes up usually around 1.5% to 2% or more for the day on increased volume vs. the day before. This indicates that the market, in the majority of cases, has changed direction and is probably beginning a new uptrend.
10
Follow-Through Days Occur When You Least Expect Them (Again, it’s all about human psychology.)
When the follow-through does occur, it comes when you’re probably not feeling great about the market, the market has been declining for weeks or months, maybe you lost a little money at the end of the last rally, and the news is almost all negative. The “experts” will be saying the economy is poor and the market is terrible. Most people listen to the news and not the market. It defies human nature to buck the trend or resist popular opinion, but you must watch and care-fully track the day-to-day market averages and when the follow-through occurs, you need to take some action.
The Big Winners Can Come Out Fast
The big stock leaders that go up 100% to 200% or more can break out ON the follow-through day or immediately after. This is why you never want to give up on the stock market or cancel your subscription to save a few dollars and end up missing out on $10,000, $50,000, $100,000, or more. You always want to be there ready to act. If you buy at the right time, you can enjoy the entire run, plus, you’ll be in a position to better execute proper add-on purchases to increase your potential profits even more. If you wait, you could be chasing a stock and get shaken-out during a normal pullback.
You may say: “what if the follow-through fails?” Well, then the CAN SLIM® Investing System’s many sell rules will help you get out quickly. Then, you get ready for the next follow-through. Remember, a new bull market has never started without a follow-through day. And, every time there is a successful follow-through, the big new leaders break out quickly, typically on the first day or during the first 10 to 15 days. This fact has been proven through 27 different stock market cycles over decades.
This is something you want to learn how to always spot and never miss in the future. Why? Because, there will be many strong follow-through days and hundreds of dramatic new leaders in every future uptrend. America’s innovators and inventors lead each new market cycle due to our unlimited freedom and opportunity for virtually everyone. That’s why so many people the world over continually come here. So, learn how to recognize and capitalize on our never-ending parade of new innovators.
Examples from the September 1, 2010 Follow-Through
Many leading stocks broke out on, or right after the 9/1/2010 follow-through day. Here are examples of just three of them:
11
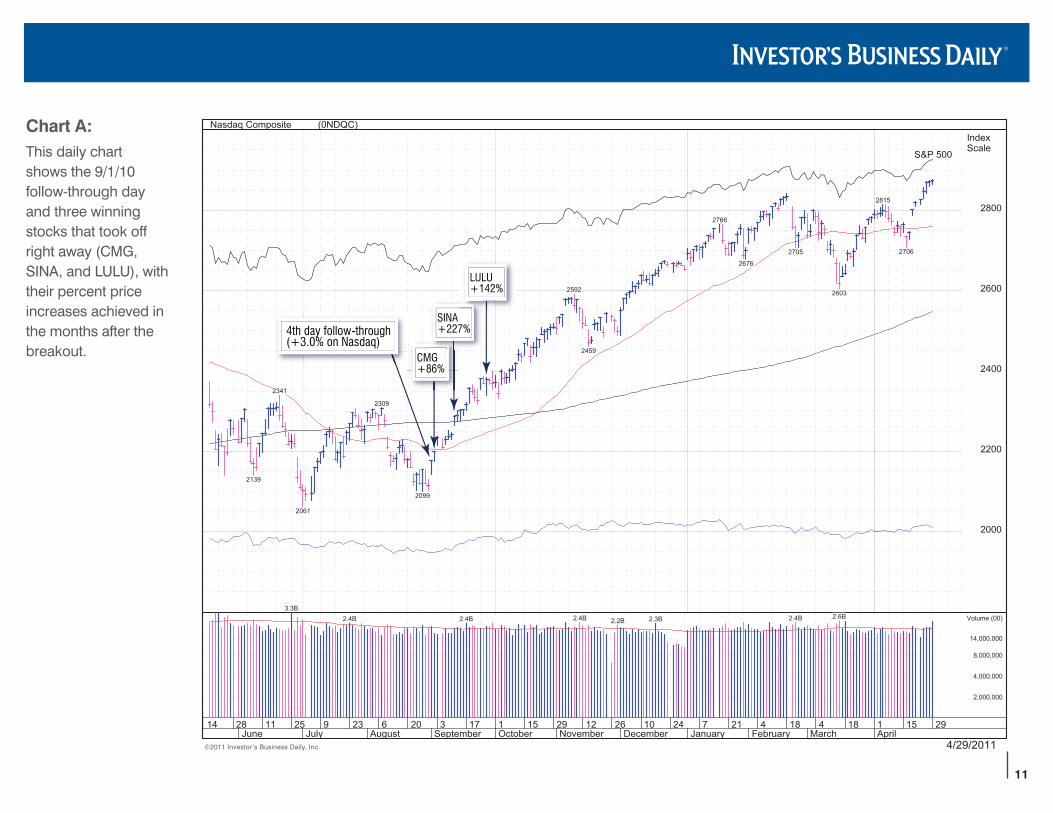
Chart A:This daily chart shows the 9/1/10 follow-through day and three winning stocks that took off right away (CMG, SINA, and LULU), with their percent price increases achieved in the months after the breakout.
4/29/2011
Nasdaq Composite (0NDQC)IndexScale
2000
2200
2400
2600
2800
29151184184217241026122915117320623925112814AprilMarchFebruaryJanuaryDecemberNovemberOctoberSeptemberAugustJulyJune
S&P 500
2,000,000
4,000,000
8,000,000
14,000,000
Volume (00)
2706
2815
2603
2.6B
2705
2.4B
2676
2766
2.3B2.2B
2459
2.4B
2592
2.4B
2099
2309
2.4B
2061
3.3B
2341
2139
4th day follow-through(+3.0% on Nasdaq)
CMG+86%
SINA+227%
LULU+142%
©2011 Investor’s Business Daily, Inc.
12
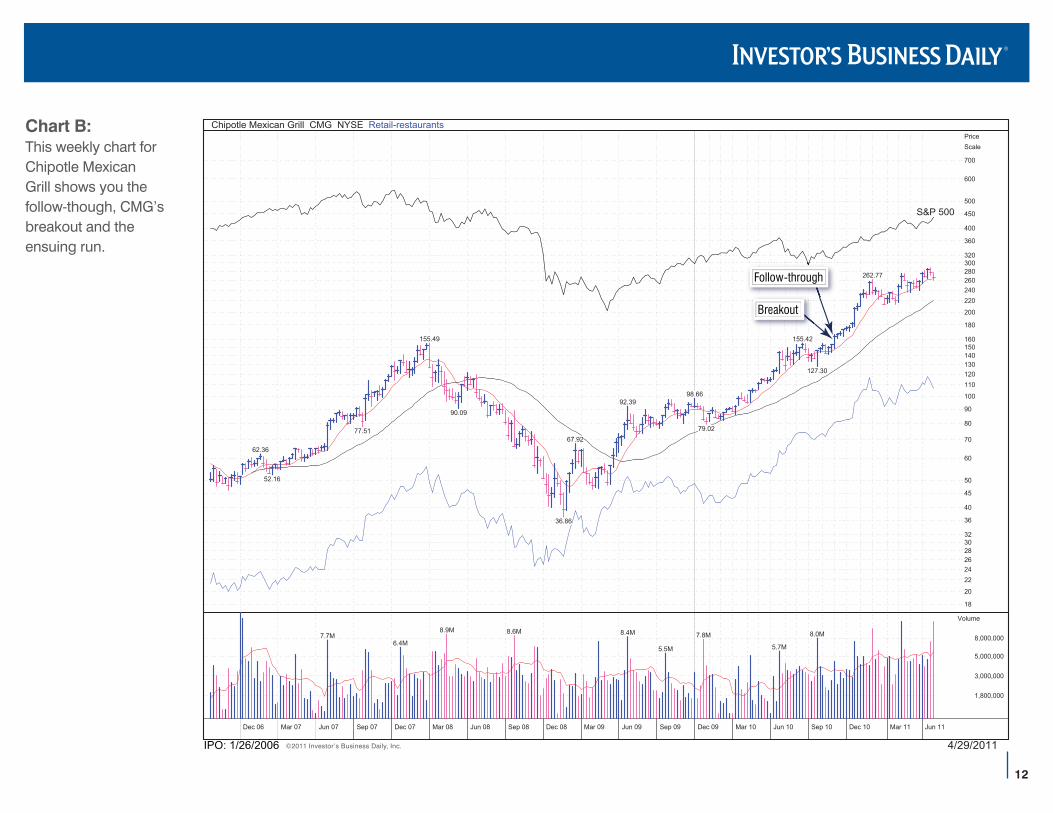
Chart B:This weekly chart for Chipotle Mexican Grill shows you the follow-though, CMG’s breakout and the ensuing run.
4/29/2011IPO: 1/26/2006
Chipotle Mexican Grill CMG NYSE Retail-restaurantsPriceScale
18
20
222426283032
36
40
45
50
60
70
80
90
100
110120130140150160
180
200
220240260280300320
360
400
450
500
600
700
Jun 11Mar 11Dec 10Sep 10Jun 10Mar 10Dec 09Sep 09Jun 09Mar 09Dec 08Sep 08Jun 08Mar 08Dec 07Sep 07Jun 07Mar 07Dec 06
S&P 500
1,800,000
3,000,000
5,000,000
8,000,000
Volume
262.77
127.30
8.0M
155.42
5.7M
79.02
7.8M
98.66
5.5M
92.39
8.4M
67.92
36.86
8.6M
90.09
8.9M
155.49
6.4M
77.51
7.7M
52.16
62.36
Breakout
Follow-through
©2011 Investor’s Business Daily, Inc.
13
4/29/2011IPO: 4/13/2000
Sina Corporation SINA NASDAQ Internet-contentPriceScale
9
10
111213141516
18
20
222426283032
36
40
45
50
60
70
80
90
100
110120130140150160
180
200
220240260280300320
Jun 11Mar 11Dec 10Sep 10Jun 10Mar 10Dec 09Sep 09Jun 09Mar 09Dec 08Sep 08Jun 08Mar 08Dec 07Sep 07Jun 07Mar 07Dec 06
S&P 500
2,000,000
4,000,000
7,000,000
12,000,000
Volume
14.9M10.4M
32.00
35.26
47.95
10.9M
17.89
15.6M
58.60
22.6M
32.00
13.0M
59.27
34.65
10.9M
31.53
37.73
17.7M
8.1M
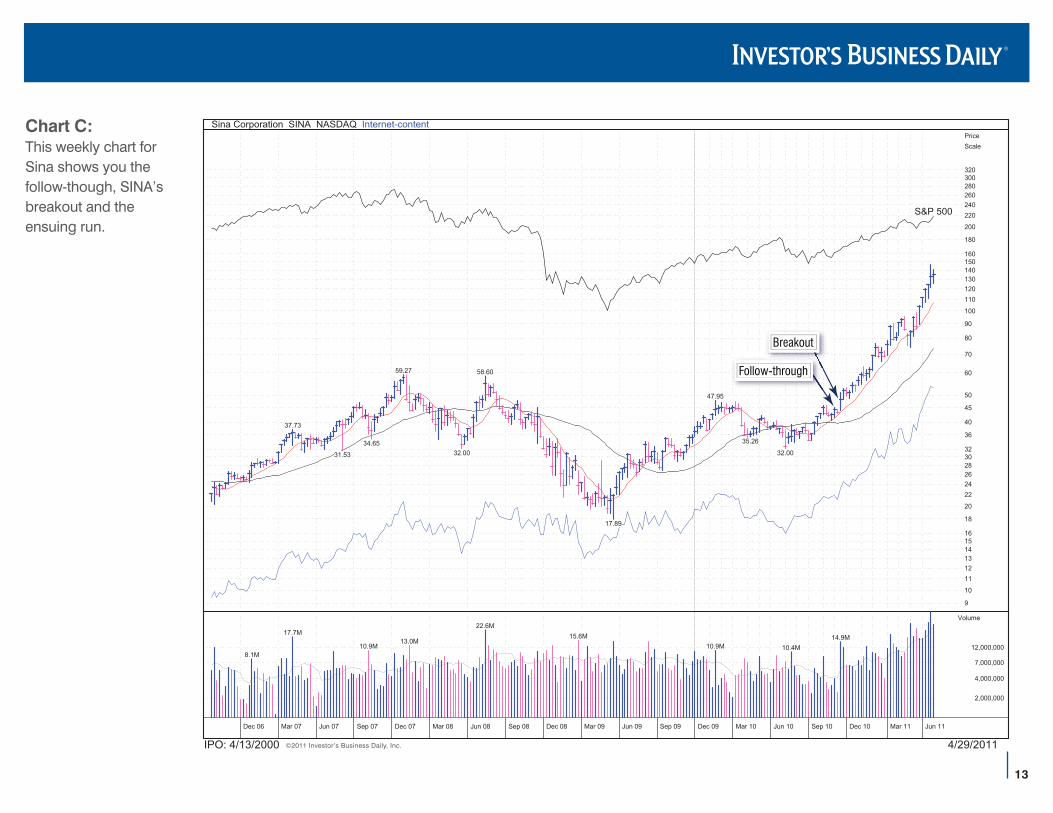
Breakout
Follow-through
Chart C: This weekly chart for Sina shows you the follow-though, SINA’s breakout and the ensuing run.
©2011 Investor’s Business Daily, Inc.
14©2011 Investor’s Business Daily, Inc. Investor’s Business Daily, IBD, CAN SLIM and corresponding logos are owned by Investor’s Business Daily Inc.
©2011 Investor’s Business Daily, Inc. 4/29/2011IPO: 7/30/2007
Lululemon Athletica LULU NASDAQ Retail-apparel/shoes/accPriceScale
3.8
4.5
5
6
7
8
9
10
111213141516
18
20
222426283032
36
40
45
50
60
70
80
90
100
110120130140
Jun 11Mar 11Dec 10Sep 10Jun 10Mar 10Dec 09Sep 09Jun 09Mar 09Dec 08Sep 08Jun 08Mar 08Dec 07Sep 07Jun 07Mar 07Dec 06
S&P 500
1,800,000
3,000,000
5,000,000
8,000,000
Volume22.2M
31.08
15.5M
46.49
10.5M7.9M
10.4M
15.64
4.33
10.7M10.3M
37.33
21.25
60.70
15.4M
New Issue $18.0
Breakout
Follow-through
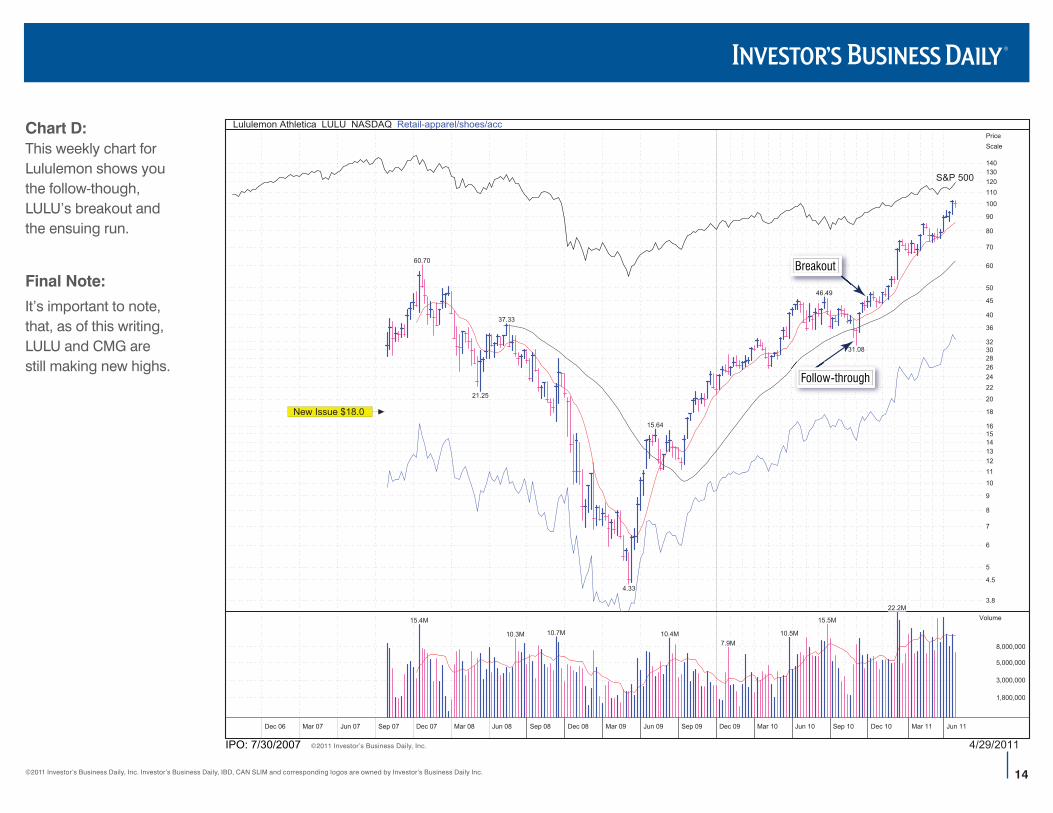
Chart D:This weekly chart for Lululemon shows you the follow-though, LULU’s breakout and the ensuing run.
Final Note:
It’s important to note, that, as of this writing, LULU and CMG are still making new highs.
© 2010 Investor’s Business Daily. All rights reserved.
5
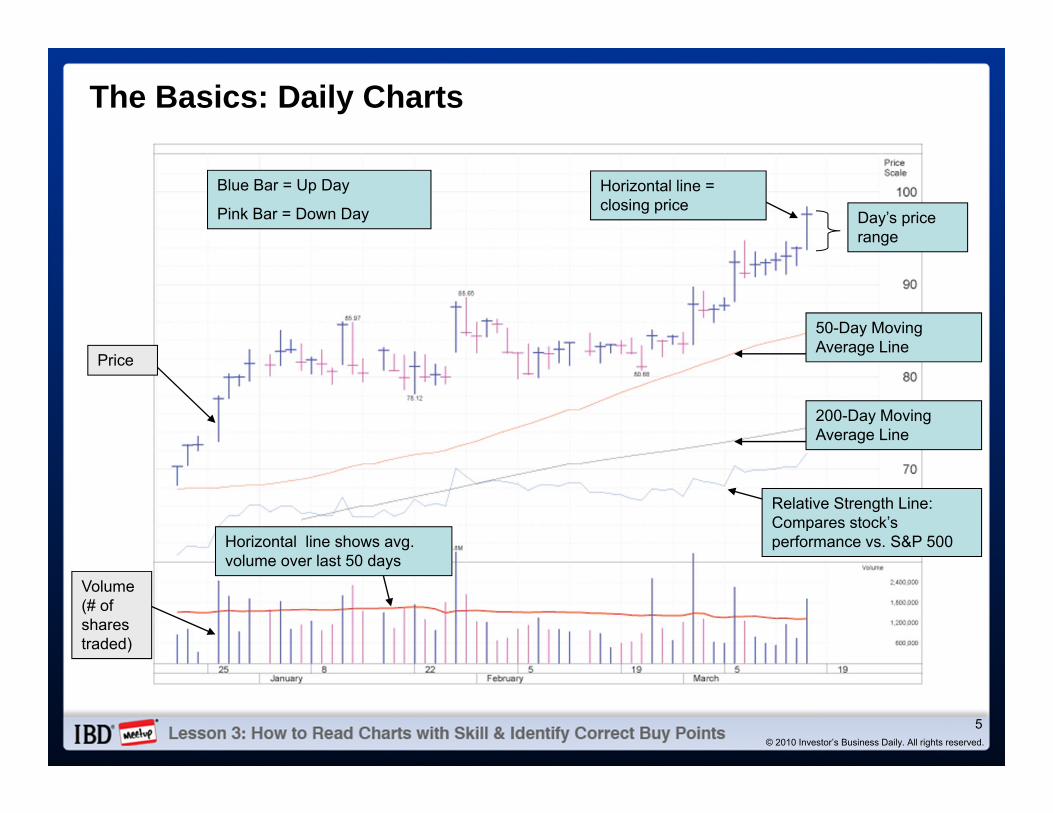
The Basics: Daily Charts
Blue Bar = Up Day
Pink Bar = Down Day Day’s price range
Horizontal line = closing price
50-Day Moving Average Line
200-Day Moving Average Line
Relative Strength Line: Compares stock’s performance vs. S&P 500Horizontal line shows avg.
volume over last 50 days
Price
Volume (# of shares traded)
© 2010 Investor’s Business Daily. All rights reserved.
6
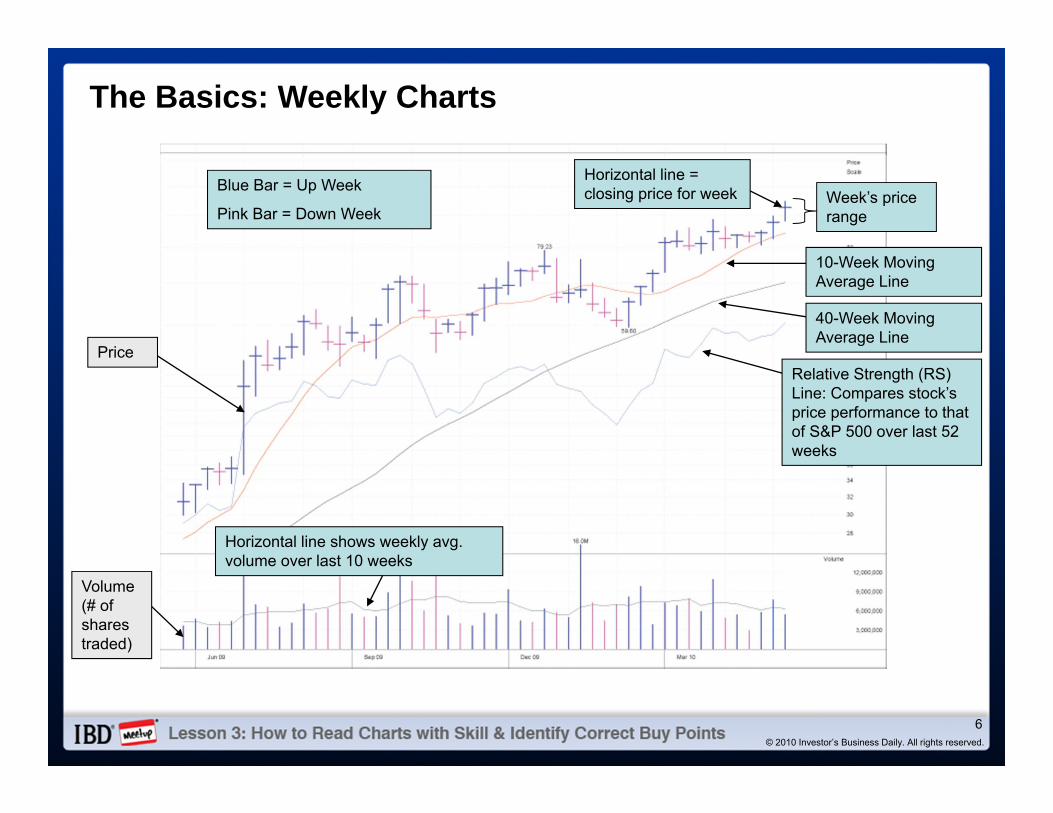
The Basics: Weekly Charts
Blue Bar = Up Week
Pink Bar = Down WeekWeek’s price range
Horizontal line = closing price for week
10-Week Moving Average Line
40-Week Moving Average Line
Relative Strength (RS) Line: Compares stock’s price performance to that of S&P 500 over last 52 weeks
Horizontal line shows weekly avg. volume over last 10 weeks
Price
Volume (# of shares traded)
© 2010 Investor’s Business Daily. All rights reserved.
7
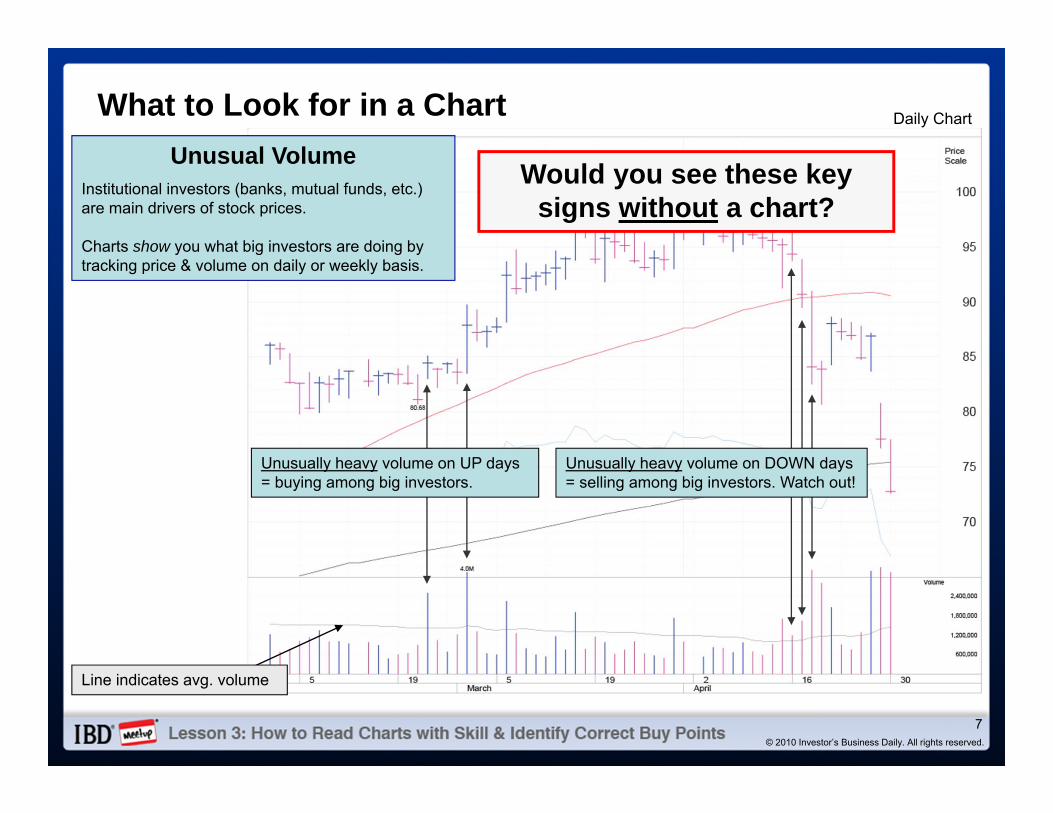
What to Look for in a Chart
Unusual VolumeInstitutional investors (banks, mutual funds, etc.) are main drivers of stock prices.
Charts show you what big investors are doing by tracking price & volume on daily or weekly basis.
Would you see these key signs without a chart?
Daily Chart
Line indicates avg. volume
Unusually heavy volume on DOWN days = selling among big investors. Watch out!
Unusually heavy volume on UP days = buying among big investors.
© 2010 Investor’s Business Daily. All rights reserved.
8
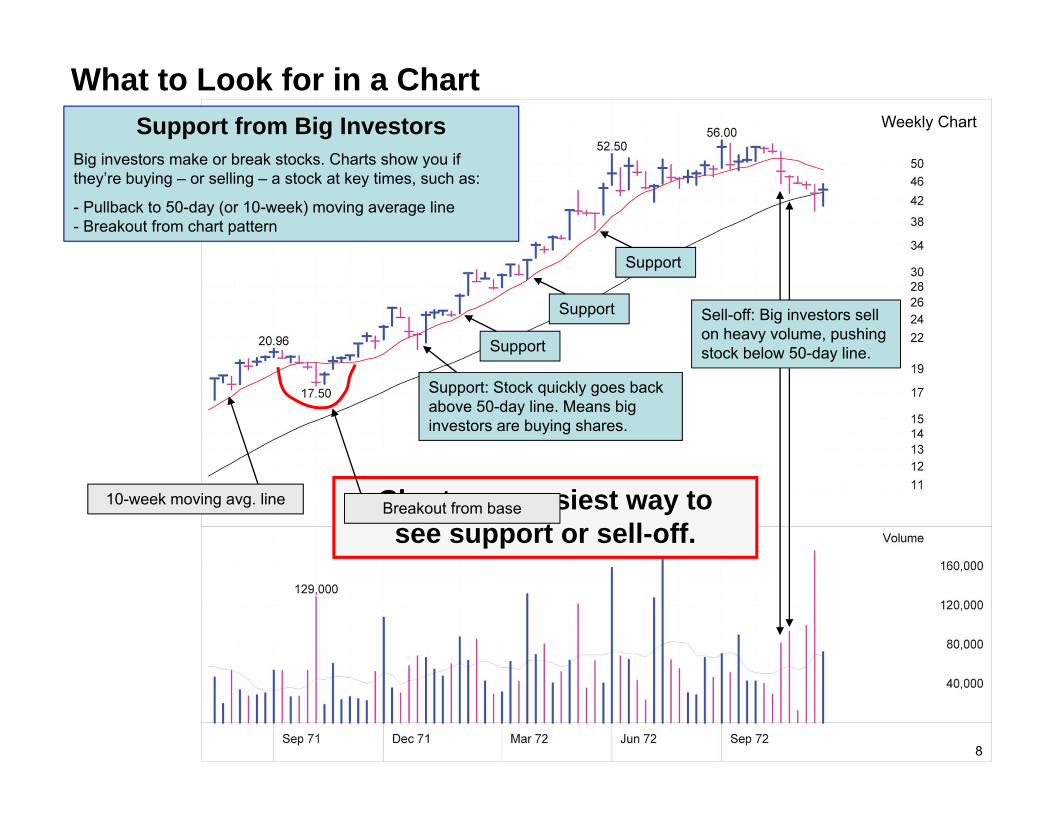
Weekly Chart
What to Look for in a ChartSupport from Big Investors
Big investors make or break stocks. Charts show you if they’re buying – or selling – a stock at key times, such as:
- Pullback to 50-day (or 10-week) moving average line- Breakout from chart pattern
10-week moving avg. line
Support
Support: Stock quickly goes back above 50-day line. Means big investors are buying shares.
Charts are easiest way to see support or sell-off.
Support
Support
Sell-off: Big investors sell on heavy volume, pushing stock below 50-day line.
Breakout from base
8
© 2010 Investor’s Business Daily. All rights reserved.
9
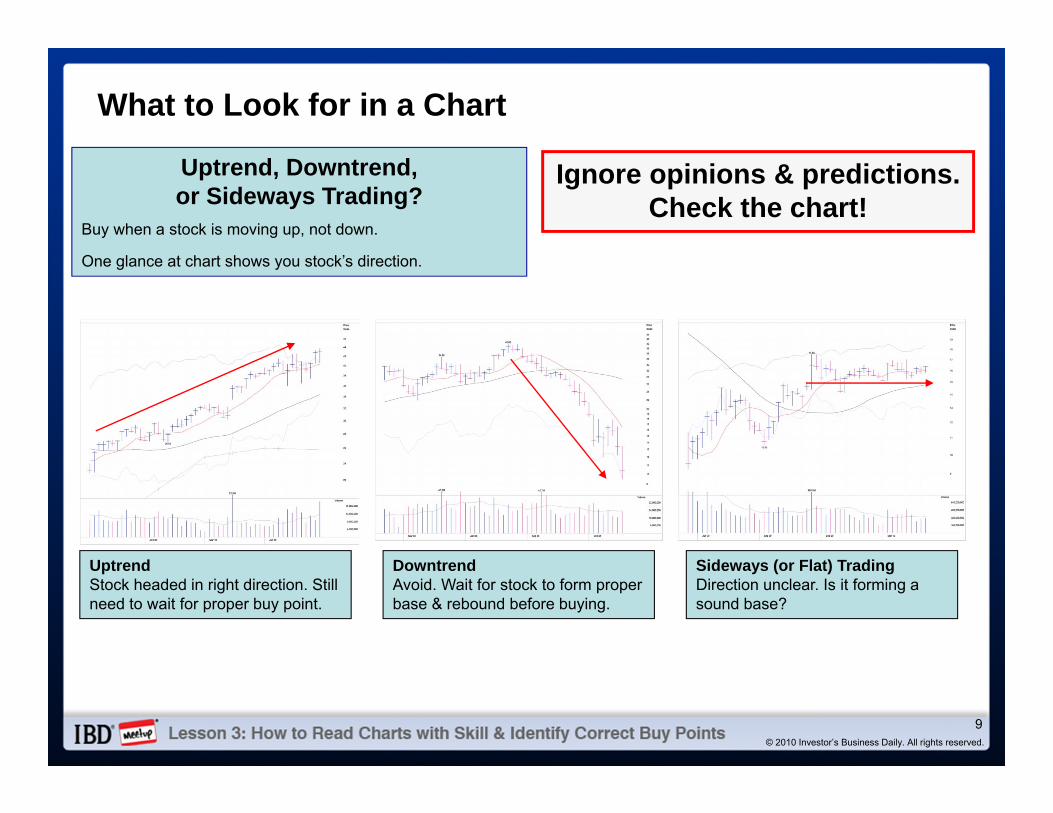
What to Look for in a Chart
Uptrend, Downtrend, or Sideways Trading?
Buy when a stock is moving up, not down.
One glance at chart shows you stock’s direction.
Ignore opinions & predictions.Check the chart!
DowntrendAvoid. Wait for stock to form proper base & rebound before buying.
UptrendStock headed in right direction. Still need to wait for proper buy point.
Sideways (or Flat) TradingDirection unclear. Is it forming a sound base?
© 2010 Investor’s Business Daily. All rights reserved.
10
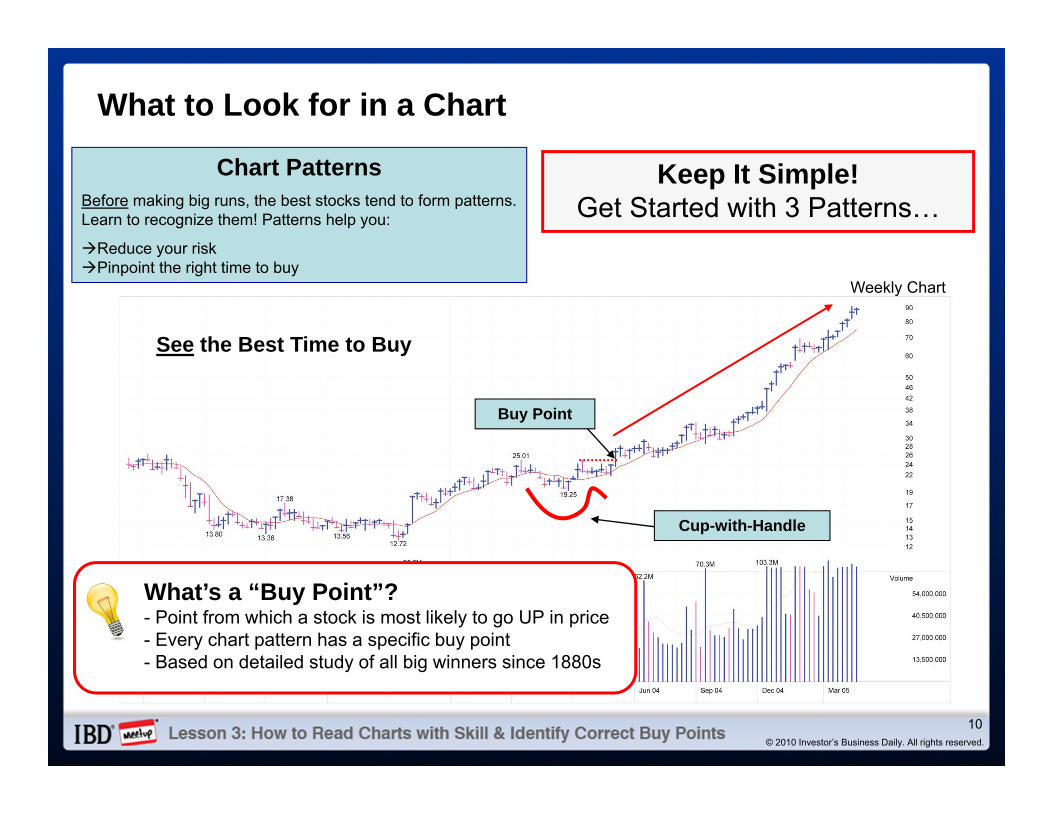
What to Look for in a Chart
Chart PatternsBefore making big runs, the best stocks tend to form patterns. Learn to recognize them! Patterns help you:
Reduce your riskPinpoint the right time to buy
Keep It Simple!Get Started with 3 Patterns…
See the Best Time to Buy
Cup-with-Handle
Buy Point
Weekly Chart
What’s a “Buy Point”?- Point from which a stock is most likely to go UP in price- Every chart pattern has a specific buy point- Based on detailed study of all big winners since 1880s
© 2010 Investor’s Business Daily. All rights reserved.
12
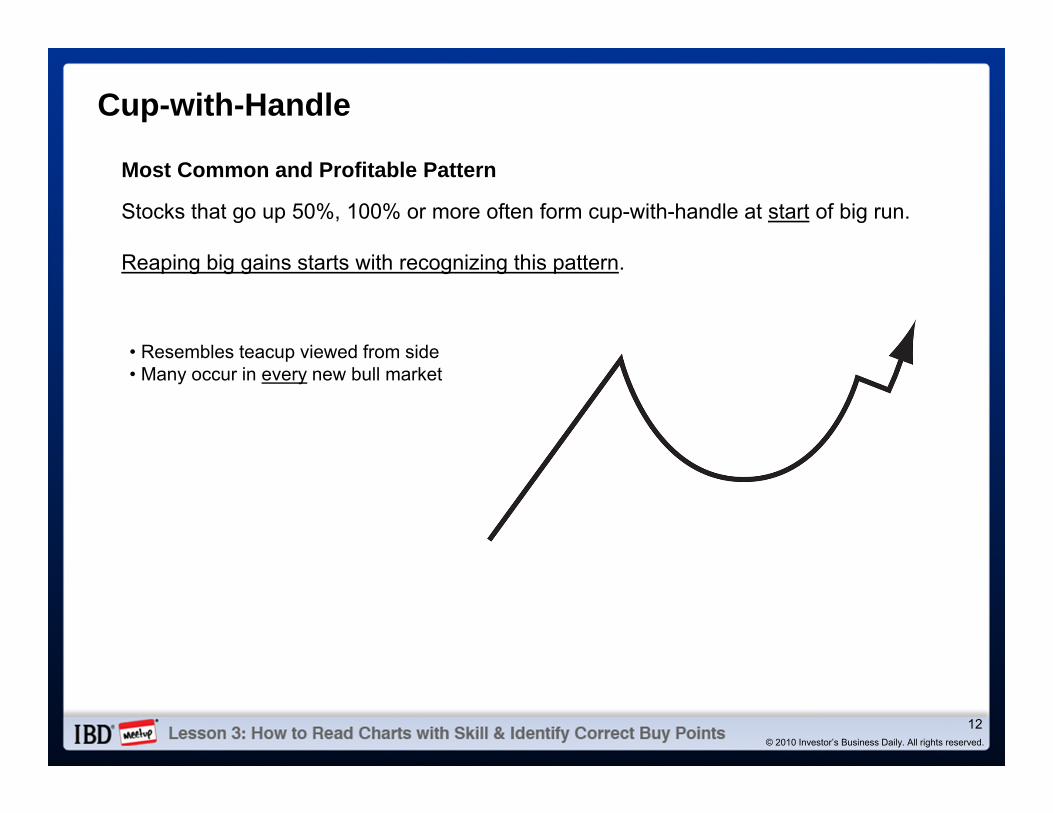
Cup-with-Handle
• Resembles teacup viewed from side• Many occur in every new bull market
Most Common and Profitable Pattern
Stocks that go up 50%, 100% or more often form cup-with-handle at start of big run.
Reaping big gains starts with recognizing this pattern.
© 2010 Investor’s Business Daily. All rights reserved.
13
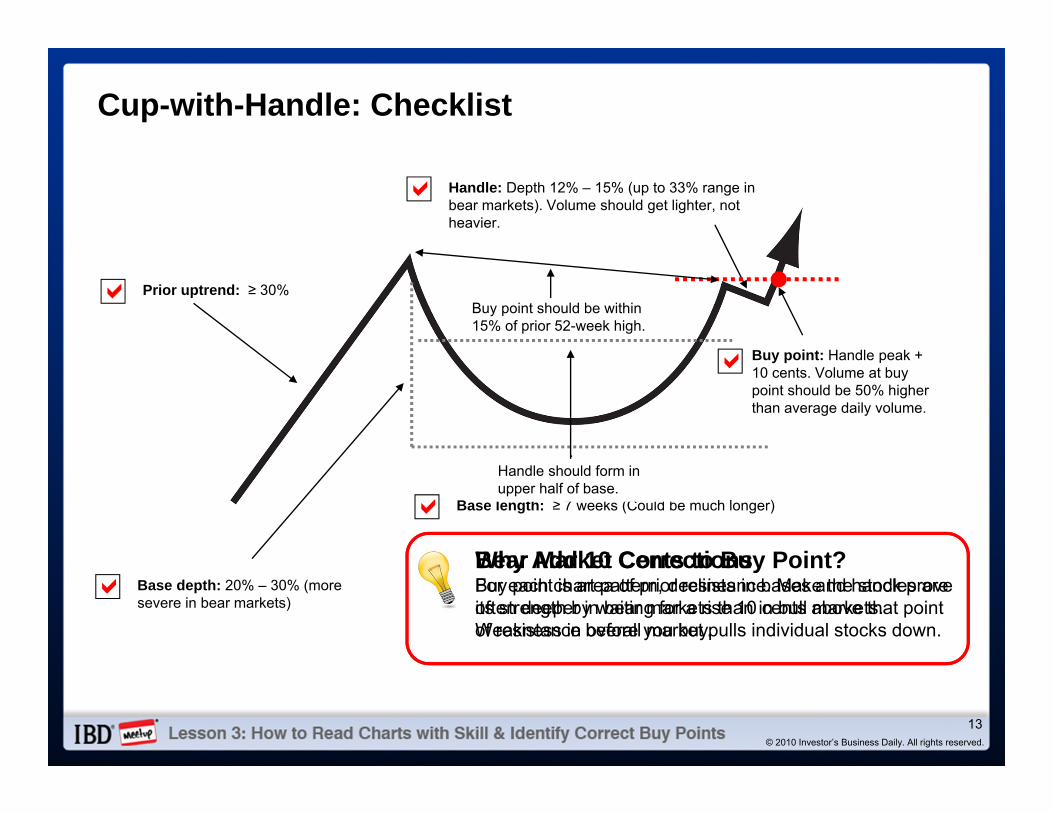
Cup-with-Handle: Checklist
Prior uptrend: ≥ 30%
Base length: ≥ 7 weeks (Could be much longer)
Base depth: 20% – 30% (more severe in bear markets)
Handle: Depth 12% – 15% (up to 33% range in bear markets). Volume should get lighter, not heavier.
Buy point: Handle peak + 10 cents. Volume at buy point should be 50% higher than average daily volume.
Why Add 10 Cents to Buy Point?Buy point is area of prior resistance. Make the stock prove its strength by waiting for a rise 10 cents above that point of resistance before you buy.
Bear Market CorrectionsFor each chart pattern, declines in bases and handles are often deeper in bear markets than in bull markets. Weakness in overall market pulls individual stocks down.
Buy point should be within 15% of prior 52-week high.
Handle should form in upper half of base.
© 2010 Investor’s Business Daily. All rights reserved.
14
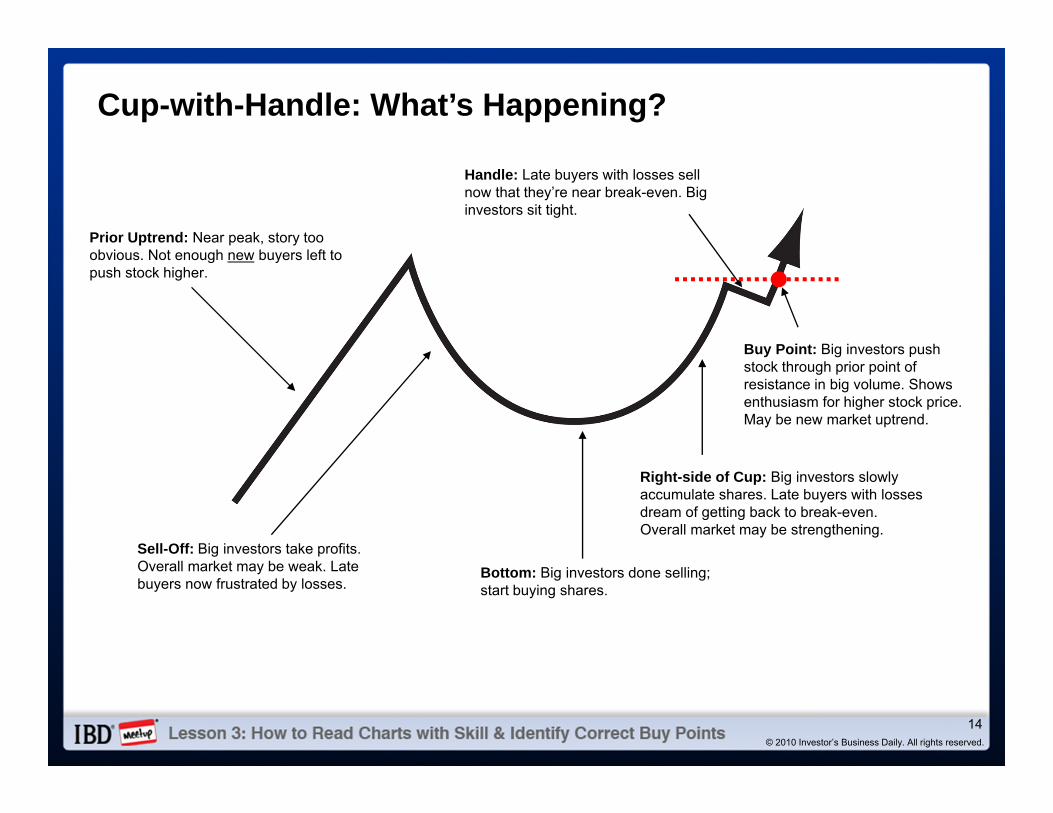
Cup-with-Handle: What’s Happening?
Prior Uptrend: Near peak, story too obvious. Not enough new buyers left to push stock higher.
Sell-Off: Big investors take profits. Overall market may be weak. Late buyers now frustrated by losses.
Bottom: Big investors done selling; start buying shares.
Right-side of Cup: Big investors slowly accumulate shares. Late buyers with losses dream of getting back to break-even. Overall market may be strengthening.
Handle: Late buyers with losses sell now that they’re near break-even. Big investors sit tight.
Buy Point: Big investors push stock through prior point of resistance in big volume. Shows enthusiasm for higher stock price.May be new market uptrend.
© 2010 Investor’s Business Daily. All rights reserved.
15
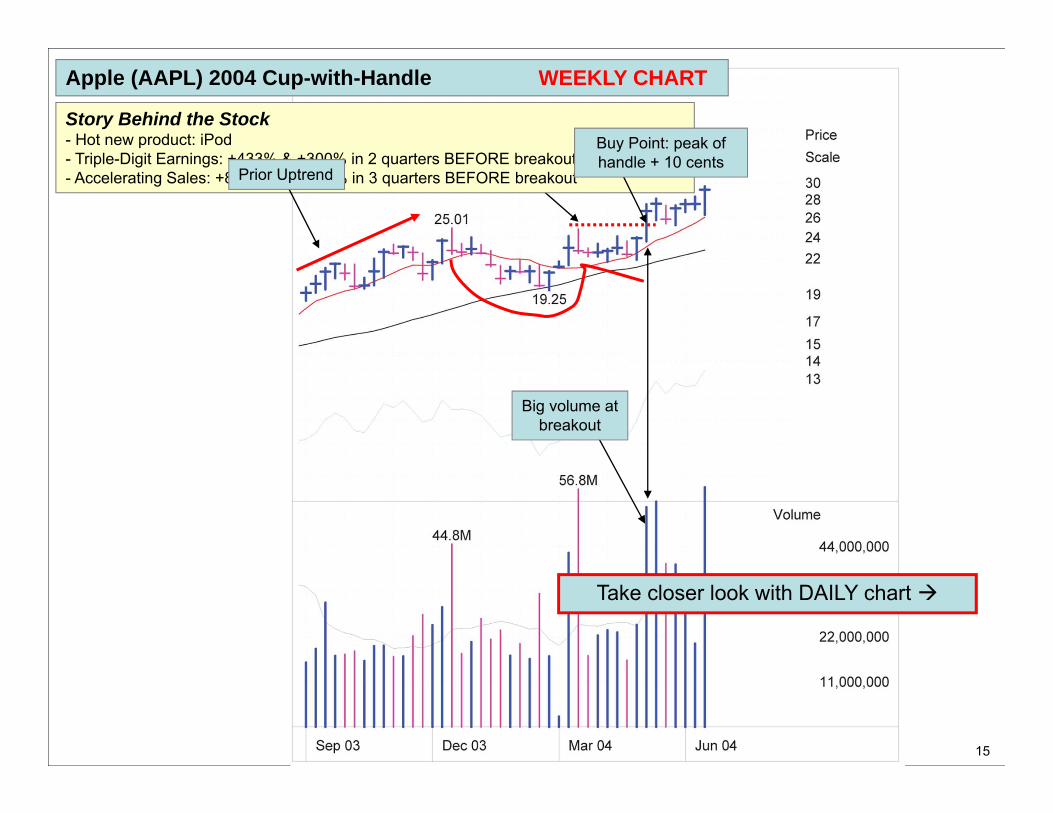
Peak of handle
Story Behind the Stock- Hot new product: iPod- Triple-Digit Earnings: +433% & +300% in 2 quarters BEFORE breakout- Accelerating Sales: +8%, +19%, +36% in 3 quarters BEFORE breakout
Apple (AAPL) 2004 Cup-with-Handle WEEKLY CHART
Prior Uptrend
Buy Point: peak of handle + 10 cents
Big volume at breakout
Take closer look with DAILY chart
15
© 2010 Investor’s Business Daily. All rights reserved.
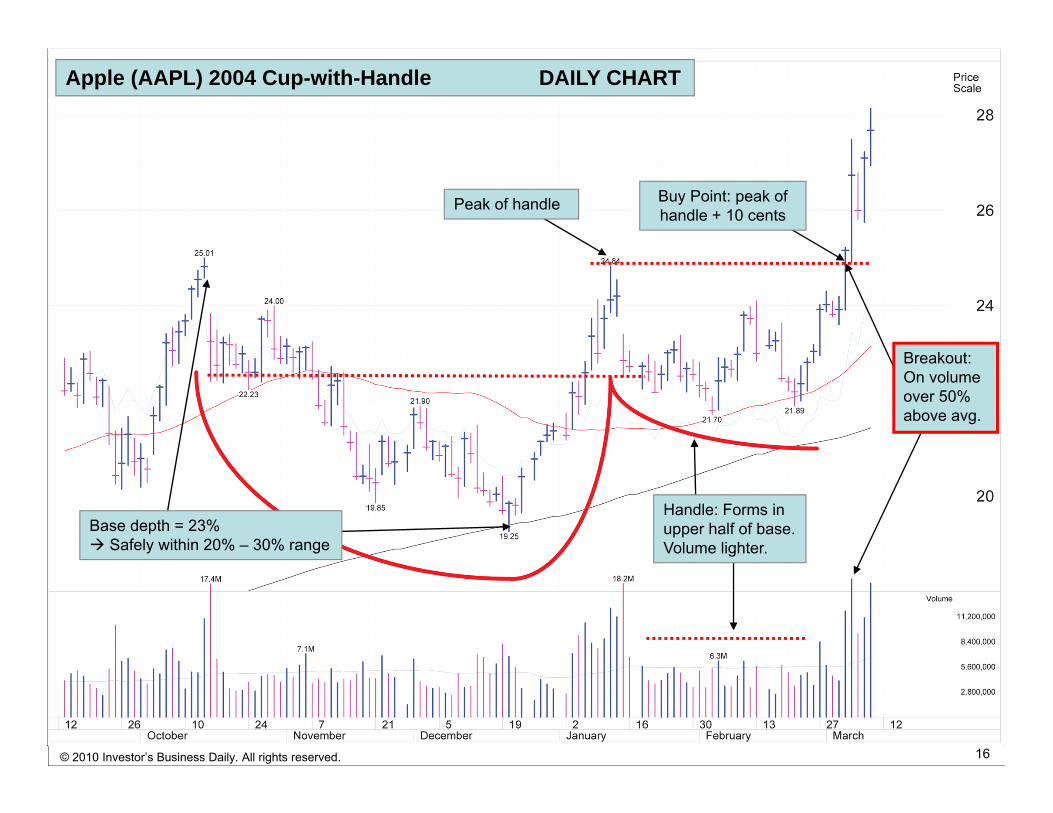
16
Apple (AAPL) 2004 Cup-with-Handle DAILY CHART
Peak of handle
Handle: Forms in upper half of base. Volume lighter.
Breakout:On volume over 50% above avg.
Base depth = 23% Safely within 20% – 30% range
Buy Point: peak of handle + 10 cents
16© 2010 Investor’s Business Daily. All rights reserved.
© 2010 Investor’s Business Daily. All rights reserved.
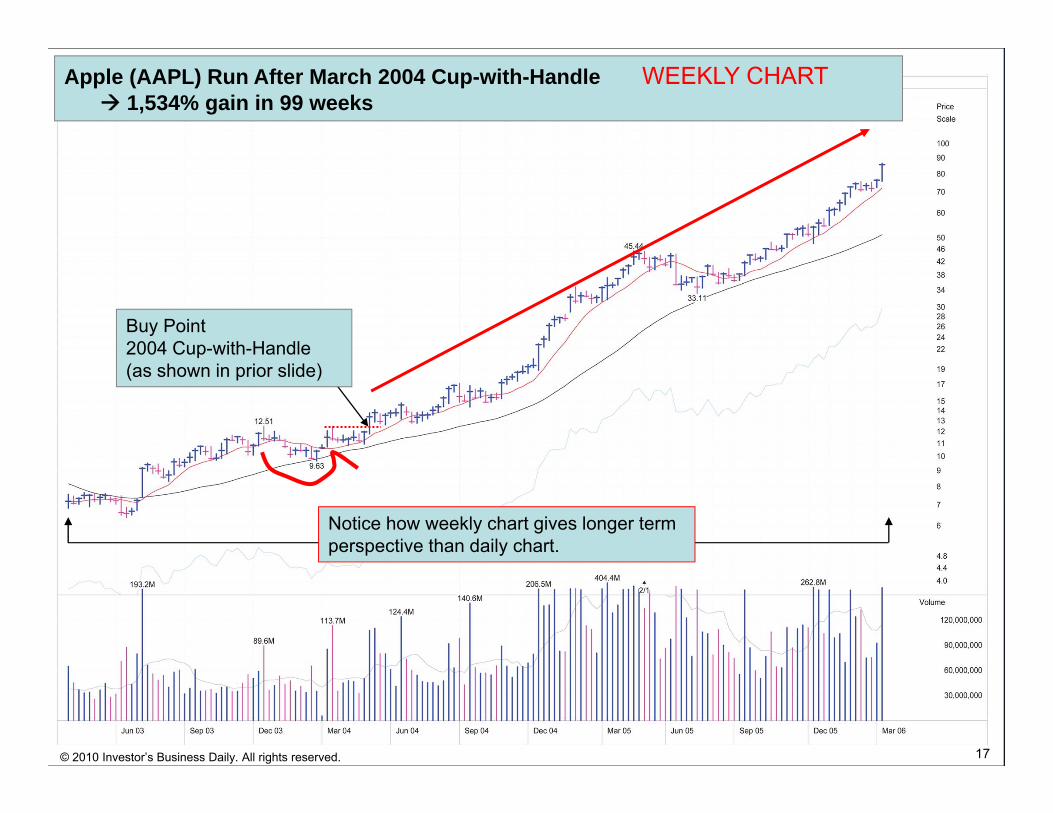
17
Apple (AAPL) Run After March 2004 Cup-with-Handle WEEKLY CHART 1,534% gain in 99 weeks
Buy Point2004 Cup-with-Handle(as shown in prior slide)
Notice how weekly chart gives longer term perspective than daily chart.
17© 2010 Investor’s Business Daily. All rights reserved.
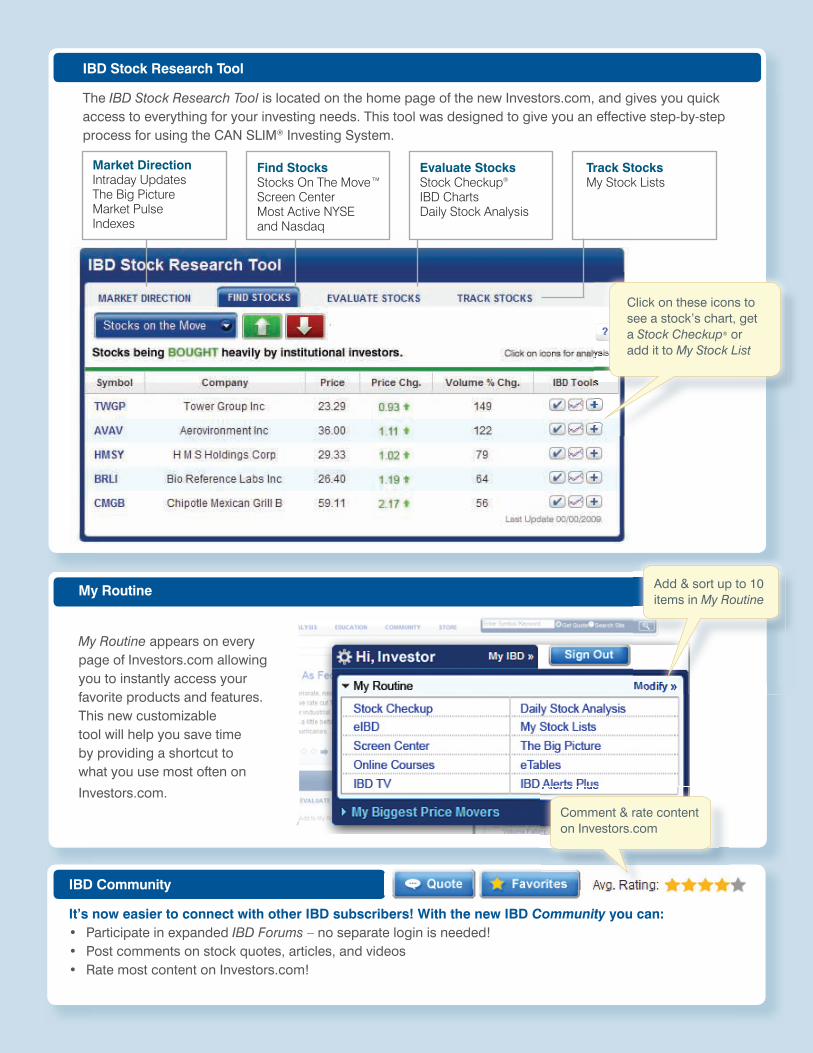
IBD Community
It’s now easier to connect with other IBD subscribers! With the new IBD Community you can:• Participate in expanded IBD Forums – no separate login is needed!• Post comments on stock quotes, articles, and videos• Rate most content on Investors.com!
My Routine
My Routine appears on every page of Investors.com allowing you to instantly access your favorite products and features. This new customizable tool will help you save time by providing a shortcut to what you use most often on
Investors.com.
IBD Stock Research Tool The IBD Stock Research Tool is located on the home page of the new Investors.com, and gives you quick access to everything for your investing needs. This tool was designed to give you an effective step-by-step process for using the CAN SLIM® Investing System.
Market Direction Intraday UpdatesThe Big PictureMarket PulseIndexes
Find Stocks Stocks On The Move™Screen Center Most Active NYSE and Nasdaq
Evaluate StocksStock Checkup®
IBD ChartsDaily Stock Analysis
Track StocksMy Stock Lists
Click on these icons to see a stock’s chart, get a Stock Checkup® or add it to My Stock List
Add & sort up to 10 items in My Routine
Comment & rate content on Investors.com
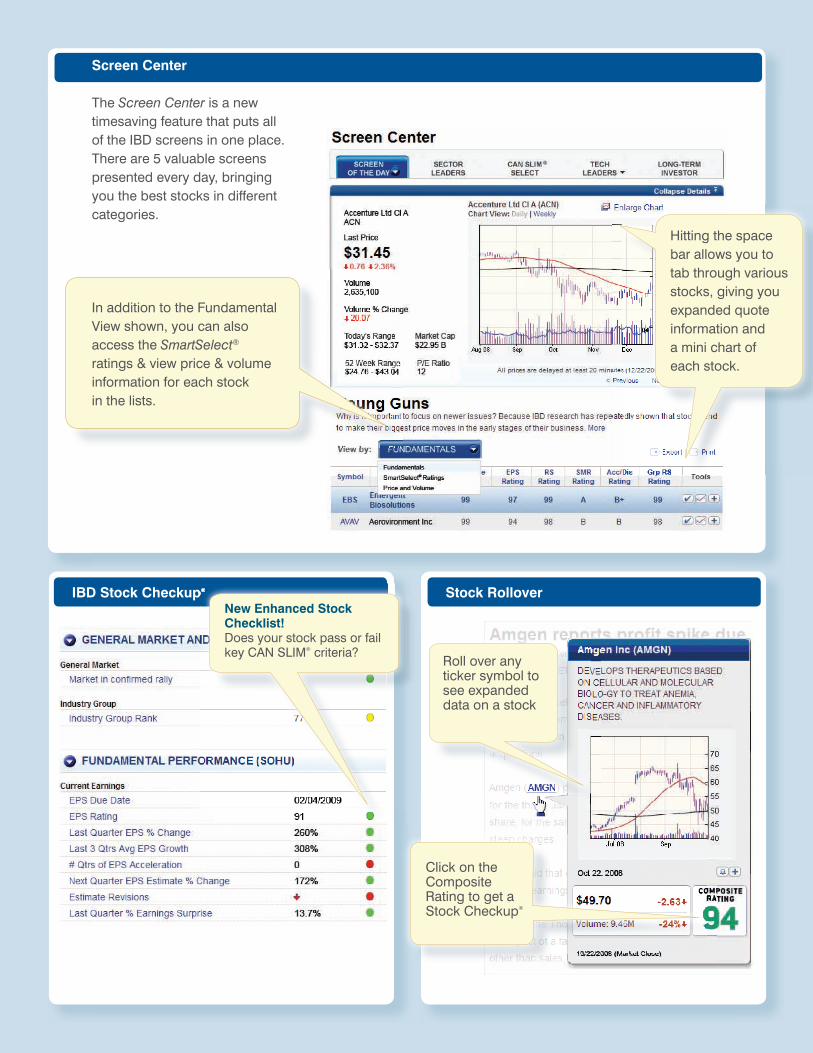
IBD Stock Checkup® Stock Rollover
Roll over any ticker symbol to see expanded data on a stock
IBD Stock Checkup®
New Enhanced Stock Checklist!Does your stock pass or fail key CAN SLIM® criteria?
Click on the Composite Rating to get a Stock Checkup®
Hitting the space bar allows you to tab through various stocks, giving you expanded quote information and a mini chart of each stock.
Screen Center
The Screen Center is a new timesaving feature that puts all of the IBD screens in one place. There are 5 valuable screens presented every day, bringing you the best stocks in different categories.
In addition to the Fundamental View shown, you can also access the SmartSelect® ratings & view price & volume information for each stock in the lists.
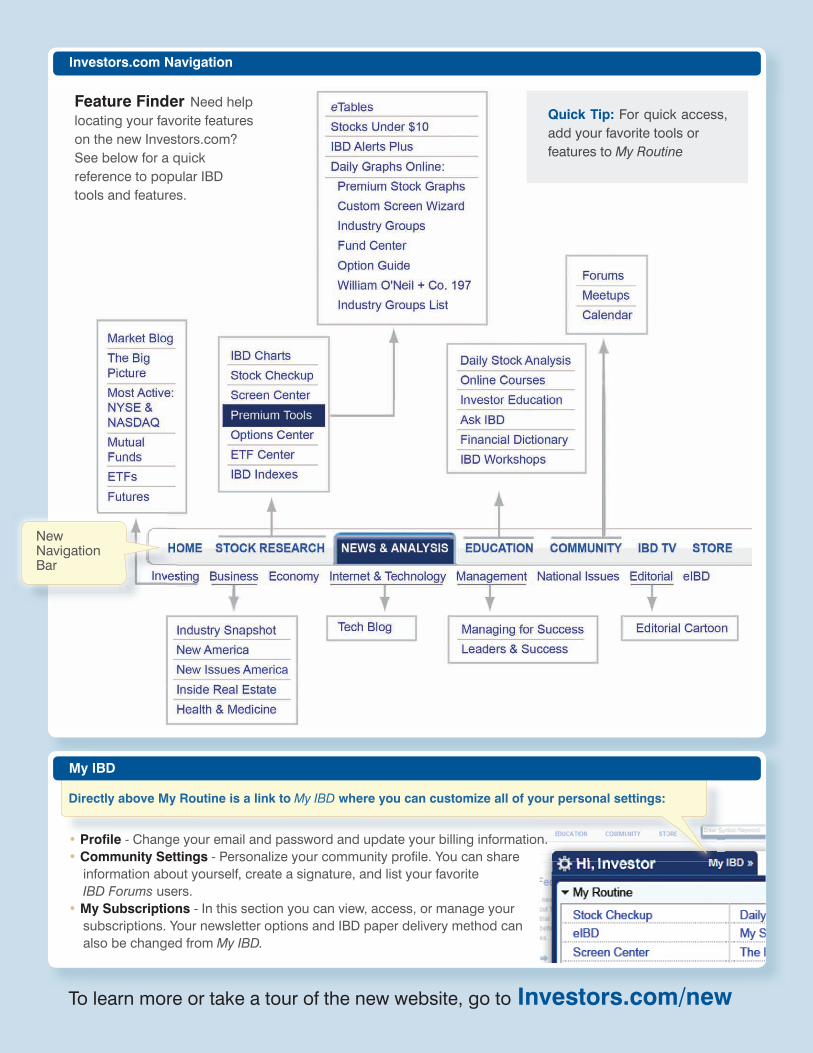
Investors.com Navigation
Other
Investors.com Navigation
Feature Finder Need help locating your favorite features on the new Investors.com? See below for a quick reference to popular IBD tools and features.
My IBD
Directly above My Routine is a link to My IBD where you can customize all of your personal settings:
• Profile - Change your email and password and update your billing information.• Community Settings - Personalize your community profile. You can share information about yourself, create a signature, and list your favorite IBD Forums users.• My Subscriptions - In this section you can view, access, or manage your subscriptions. Your newsletter options and IBD paper delivery method can also be changed from My IBD.
To learn more or take a tour of the new website, go to Investors.com/new
Quick Tip: For quick access, add your favorite tools or features to My Routine
OtherNew Navigation Bar