Embed Size (px)
Citation preview
ANNUAL REPORT 2017Including Annual Information FormDated: February 14, 2018
WEST FRASER
LUMBER U.S. 14. Joyce 15. Huttig 16. Henderson 17. New Boston 18. Leola 19. Mansfield 20. Russellville 21. Maplesville 22. Opelika 23. McDavid 24. Perry 25. Lake Butler 26. Maxville 27. Whitehouse 28. Blackshear 29. Fitzgerald 30. Dudley 31. Augusta 32. Newberry 33. Armour 34. Seaboard
LUMBER Canada 1. Quesnel 2. Williams Lake 3. Smithers 4. Chetwynd 5. Fraser Lake 6. Chasm 7. 100 Mile House 8. Blue Ridge 9. Hinton 10. Edson 11. Sundre 12. High Prairie 13. Manning
0
0
PULP & PAPER 35. Hinton 36. Quesnel (2) 37. Slave Lake 38. Whitecourt
PLYWOOD 39. Edmonton 40. Quesnel 41. Williams Lake
MDF 42. Blue Ridge 43. Quesnel
VENEER & LVL 44. Rocky Mountain House 45. Slave Lake
0
0
0
0
16
1718
15
14
27
21 22
31
32
34
TEXAS
ARKANSAS
LOUISIANA
TENNESSEENORTH CAROLINA
GEORGIA
ALABAMA
FLORIDA
MEMPHIS
23
19 20 33SOUTH
CAROLINA
24 2526
3029 28
38
B R I T I S HC O L U M B I A
A L B E R T A
VANCOUVER
QUESNEL1
2
34
5
364041
944
37
39
42
12
13
8
45
11
10
6
35
7
EDMONTON
43
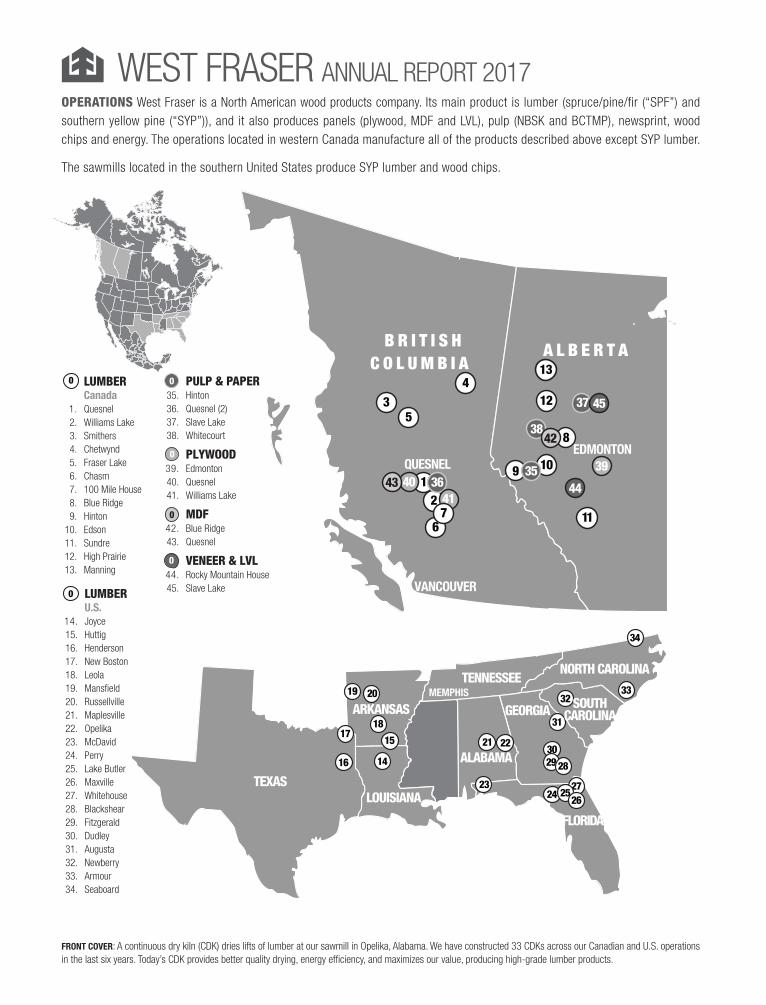
OPERATIONS West Fraser is a North American wood products company. Its main product is lumber (spruce/pine/fir (“SPF”) and southern yellow pine (“SYP”)), and it also produces panels (plywood, MDF and LVL), pulp (NBSK and BCTMP), newsprint, wood chips and energy. The operations located in western Canada manufacture all of the products described above except SYP lumber.
The sawmills located in the southern United States produce SYP lumber and wood chips.
WEST FRASER ANNUAL REPORT 2017
FRONT COVER: A continuous dry kiln (CDK) dries lifts of lumber at our sawmill in Opelika, Alabama. We have constructed 33 CDKs across our Canadian and U.S. operations in the last six years. Today’s CDK provides better quality drying, energy efficiency, and maximizes our value, producing high-grade lumber products.
- 1 -
TABLE OF CONTENTS FINANCIAL AND OPERATING HIGHLIGHTS ................................................................................................... 3 REPORT TO SHAREHOLDERS .............................................................................................................................. 5 ANNUAL INFORMATION FORM .......................................................................................................................... 8
BUSINESS OVERVIEW ............................................................................................................................................... 8 CORPORATE STRATEGY........................................................................................................................................... 9 CORPORATE STRUCTURE ...................................................................................................................................... 10 HISTORY AND DEVELOPMENT OF BUSINESS ......................................................................................................... 11 FIBRE SUPPLY ........................................................................................................................................................ 12 CAPITAL EXPENDITURES AND ACQUISITIONS ....................................................................................................... 16 HUMAN RESOURCES .............................................................................................................................................. 17 MARKETS ............................................................................................................................................................... 17 RESEARCH AND DEVELOPMENT ............................................................................................................................ 18 LUMBER .................................................................................................................................................................. 18 PANELS ................................................................................................................................................................... 19 PULP & PAPER ....................................................................................................................................................... 20 NEWSPRINT ............................................................................................................................................................ 20 EXTERNAL FACTORS AFFECTING WEST FRASER’S BUSINESS IN 2017 ................................................................ 21 RISK FACTORS ....................................................................................................................................................... 22 CAPITAL STRUCTURE ............................................................................................................................................ 23 RATINGS ................................................................................................................................................................. 23 EXPERTS ................................................................................................................................................................. 24 DIRECTORS AND OFFICERS.................................................................................................................................... 25 GOVERNANCE......................................................................................................................................................... 27 AUDIT COMMITTEE ............................................................................................................................................... 28 FEES PAID TO AUDITORS ....................................................................................................................................... 29 MATERIAL CONTRACTS ......................................................................................................................................... 29 ADDITIONAL INFORMATION .................................................................................................................................. 30 SCHEDULE 1 – AUDIT COMMITTEE CHARTER ...................................................................................................... 31
MANAGEMENT’S DISCUSSION & ANALYSIS ................................................................................................. 34 RECENT DEVELOPMENTS ...................................................................................................................................... 35 SUMMARY INFORMATION - ANNUAL RESULTS ..................................................................................................... 37 SELECTED QUARTERLY INFORMATION ................................................................................................................ 38 ADJUSTED EARNINGS AND ADJUSTED BASIC EARNINGS PER SHARE .................................................................. 38 DISCUSSION & ANALYSIS BY PRODUCT SEGMENT ............................................................................................... 40 4TH QUARTER RESULTS .......................................................................................................................................... 44 SALES AND EARNINGS COMPARISON .................................................................................................................... 44 ADJUSTED EARNINGS AND ADJUSTED BASIC EARNINGS PER SHARE .................................................................. 44 DISCUSSION & ANALYSIS OF QUARTERLY NON-OPERATIONAL ITEMS ............................................................... 45 DISCUSSION & ANALYSIS BY PRODUCT SEGMENT ............................................................................................... 46 CAPITAL EXPENDITURES ....................................................................................................................................... 49 BUSINESS OUTLOOK .............................................................................................................................................. 49 OPERATIONS .......................................................................................................................................................... 49 ESTIMATED EARNINGS SENSITIVITY TO KEY VARIABLES ................................................................................... 51 CAPITAL STRUCTURE AND LIQUIDITY .................................................................................................................. 51 SUMMARY OF FINANCIAL POSITION ..................................................................................................................... 52 DEBT RATINGS ....................................................................................................................................................... 52 SELECTED CASH FLOW ITEMS .............................................................................................................................. 53 CONTRACTUAL OBLIGATIONS ............................................................................................................................... 54 SIGNIFICANT MANAGEMENT JUDGMENTS AFFECTING FINANCIAL RESULTS ..................................................... 54 ACCOUNTING STANDARDS ISSUED BUT NOT YET APPLIED ................................................................................. 56 NON-IFRS MEASURES ........................................................................................................................................... 57
- 2 -
RISKS AND UNCERTAINTIES .................................................................................................................................. 59 DISCLOSURE CONTROLS AND INTERNAL CONTROLS OVER FINANCIAL REPORTING......................................... 68
RESPONSIBILITY OF MANAGEMENT .............................................................................................................. 69 INDEPENDENT AUDITOR’S REPORT ............................................................................................................... 70
CONSOLIDATED BALANCE SHEETS ....................................................................................................................... 71 CONSOLIDATED STATEMENTS OF EARNINGS AND COMPREHENSIVE EARNINGS ................................................ 72 CONSOLIDATED STATEMENTS OF CHANGES IN SHAREHOLDERS’ EQUITY ......................................................... 73 CONSOLIDATED STATEMENTS OF CASH FLOWS ................................................................................................... 74 NOTES TO CONSOLIDATED FINANCIAL STATEMENTS .......................................................................................... 75
FIVE-YEAR FINANCIAL REVIEW .................................................................................................................... 107 CORPORATE INFORMATION ........................................................................................................................... 109 GLOSSARY OF INDUSTRY TERMS .................................................................................................................. 112
- 3 -
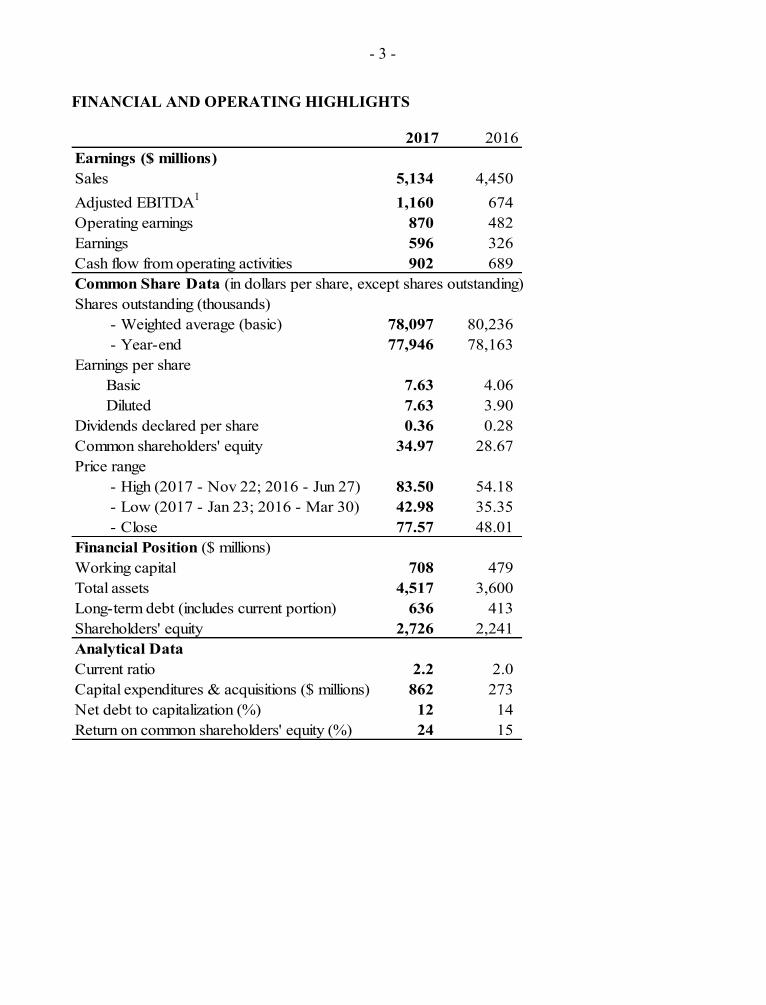
FINANCIAL AND OPERATING HIGHLIGHTS
2017 2016Earnings ($ millions)Sales 5,134 4,450 Adjusted EBITDA1 1,160 674 Operating earnings 870 482 Earnings 596 326 Cash flow from operating activities 902 689 Common Share Data (in dollars per share, except shares outstanding)Shares outstanding (thousands)
- Weighted average (basic) 78,097 80,236 - Year-end 77,946 78,163
Earnings per shareBasic 7.63 4.06 Diluted 7.63 3.90
Dividends declared per share 0.36 0.28 Common shareholders' equity 34.97 28.67 Price range
- High (2017 - Nov 22; 2016 - Jun 27) 83.50 54.18 - Low (2017 - Jan 23; 2016 - Mar 30) 42.98 35.35 - Close 77.57 48.01
Financial Position ($ millions)Working capital 708 479 Total assets 4,517 3,600 Long-term debt (includes current portion) 636 413 Shareholders' equity 2,726 2,241 Analytical DataCurrent ratio 2.2 2.0 Capital expenditures & acquisitions ($ millions) 862 273 Net debt to capitalization (%) 12 14 Return on common shareholders' equity (%) 24 15
- 4 -
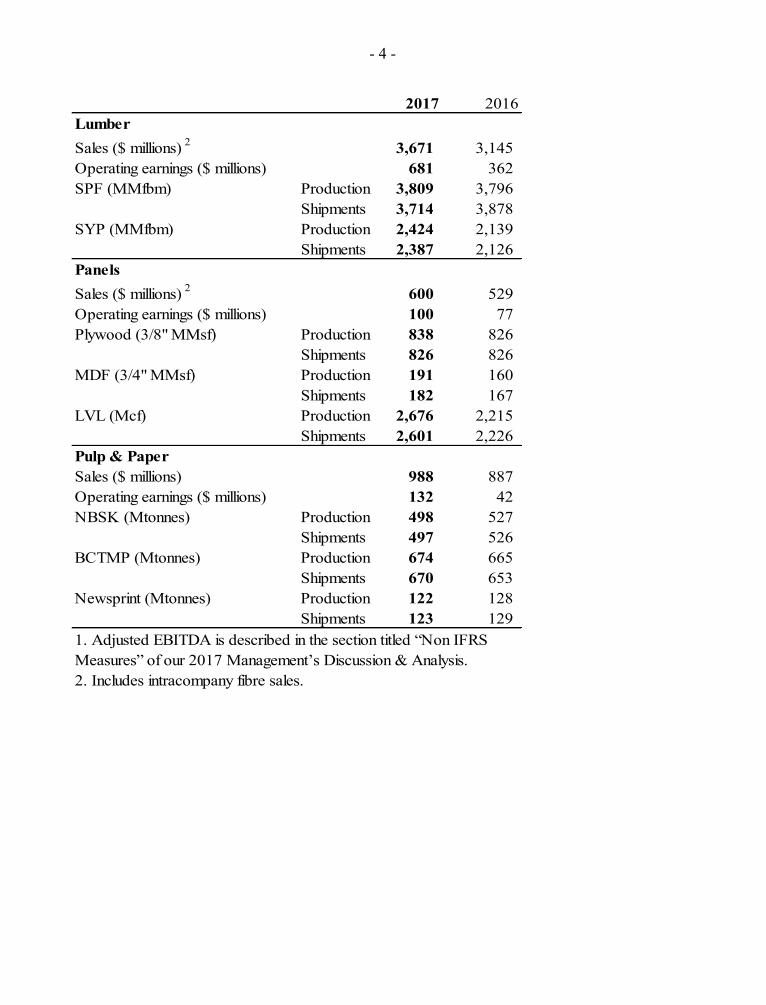
2017 2016LumberSales ($ millions) 2 3,671 3,145 Operating earnings ($ millions) 681 362 SPF (MMfbm) Production 3,809 3,796
Shipments 3,714 3,878 SYP (MMfbm) Production 2,424 2,139
Shipments 2,387 2,126 PanelsSales ($ millions) 2 600 529 Operating earnings ($ millions) 100 77 Plywood (3/8" MMsf) Production 838 826
Shipments 826 826 MDF (3/4" MMsf) Production 191 160
Shipments 182 167 LVL (Mcf) Production 2,676 2,215
Shipments 2,601 2,226 Pulp & PaperSales ($ millions) 988 887 Operating earnings ($ millions) 132 42 NBSK (Mtonnes) Production 498 527
Shipments 497 526 BCTMP (Mtonnes) Production 674 665
Shipments 670 653 Newsprint (Mtonnes) Production 122 128
Shipments 123 129 1. Adjusted EBITDA is described in the section titled “Non IFRS Measures” of our 2017 Management’s Discussion & Analysis.2. Includes intracompany fibre sales.
- 5 -
REPORT TO SHAREHOLDERS
Message from our President and Chief Executive Officer
For more than 60 years West Fraser has been guided by a straight forward business strategy, to be the low-cost, high margin producer in each of our product lines and geographic regions, maintain a conservative financial position to manage cyclical markets and continuously reinvest in the business. We believe these three pillars are the cornerstones to our success.
In 2017 we saw the return of the softwood lumber dispute between Canada and the U.S. for the fifth time in the last 30 years. We believe these duties are unwarranted and without merit and along with our industry and government partners will defend our position. During the last ten years of managed trade we have been preparing for the potential expiration of the Softwood Lumber Agreement. Since the last dispute was settled in 2006, we have invested significant capital in our Canadian facilities to ensure they are low-cost and a highly competitive source of lumber. We have also expanded our presence in the U.S. South. Growing our presence in this low cost timber region also acts as a hedge against trade actions. After our acquisition of six additional sawmills in 2017, 42% of our capacity is now in the U.S.
The economic factors that drive demand for our solid wood products continue to indicate favorable supply and demand fundamentals. New home inventories remain low and housing starts have continued to grow in North America. Spending on repairs, renovation and remodeling activities also has continued to perform well. Offshore lumber markets that have been developed by the western Canadian lumber producers remain strong and will continue to be important markets for West Fraser. With the exception of the U.S. South, most of the key lumber producing regions in North America are approaching peak production levels and growth in some of these regions may be constrained due to declining timber availability. Pulp markets were particularly strong in the second half of 2017 due to significant demand growth in China. We expect that new capacity will have an impact on the global supply-demand balance but we continue to be positive about the long-term growth prospects from China and other Asian markets.
Despite our strong results, we experienced a number of challenges in 2017. The fire season in British Columbia was the worst in recorded history, destroying nearly a million hectares of forests and causing us to curtail a number of our operations for a period of time. While a certain amount of the timber lost due to the fires was mountain pine beetle killed timber that was already beyond salvage, the loss of green timber is concerning and the impact of the fires will play out over the next several years in reductions in the annual allowable cut after salvage operations are complete. All of this is likely to continue to present headwinds on log costs in British Columbia. Weather conditions at the start and end of the year along with a robust economy impacted the availability of transportation resources to ship finished products by rail and truck to our end customers.
I am proud of the achievements we have made with our focus on people who are the cornerstone of our organization and what I believe sets us apart culturally. We continued to make improvements in safety, with serious injuries declining by 12% compared to 2016. We still have much more work to do to achieve our goal of eliminating serious incidents and injuries, and are
- 6 -
targeting further improvements in 2018 through investments in our facilities along with training and development activities. At West Fraser we work hard to create a positive work environment in all our facilities and have been recognized again in 2017 with several awards, being named as one of Canada’s Top 100 Employers, one of B.C.’s Top Employers, and one of Canada’s Top Employers for Young People. In addition, West Fraser was recognized once again for having one of Canada’s Most Admired Corporate Cultures.
Being responsible to our environment and the resources that we consume is important for our long-term success. Following the fire season in B.C., we quickly mobilized our teams to begin seeking ways to salvage as much burned timber as possible so the land base could be restored and replanted. We are also partnering with Pinnacle Renewable energy on the construction of a new pellet production facility in Smithers, B.C. as an alternative use for our sawmill residuals. The pellets from this new facility will be used in the production of energy in overseas markets.
West Fraser is a strong supporter of the communities in which we operate. In 2017 our major contributions were to the new ice arena at the West Fraser Centre in Quesnel, B.C., the expansion of the West Fraser Aquatics Centre in Williams Lake, B.C., and the West Fraser Guild, home to the Performing Arts Theatre of Hinton, Alberta. West Fraser also provided building materials to a number of community projects including Habitat for Humanity’s Carter Work Project in Edmonton, Alberta. We continue to award scholarships to post-secondary students in more than 10 communities across western Canada and the southern U.S.
There were a number of milestone accomplishments for West Fraser in 2017. We increased our lumber production by 298 mmfbm though improvement in our own operations and additions through acquisitions in the U.S. South. We completed the rebuild and restart of our WestPine MDF facility following a fire in 2016. We recorded the highest Adjusted EBITDA in company history, growing Adjusted EBITDA by $486 million and 72% over 2016. In August we completed the acquisition of six sawmills in Florida and Georgia, complementing our existing U.S. South footprint and adding 700 mmfbm of high margin production to our base. Our teams continued to execute well on significant capital projects that will benefit us in 2018 and years to come. We commissioned a complete sawmill rebuild in High Prairie, Alberta, and made significant upgrades at our Fraser Lake, B.C. planer mill and have several continuous drying kilns under construction. In the U.S. among our more notable upgrades were major equipment centres at our mills in Russellville, Arkansas; Newberry, South Carolina; and Seaboard, North Carolina. We are also making good progress on the construction of a replacement sawmill at our Opelika, Alabama facility which is expected to start operations in the third quarter of 2018. The new facility will almost double our capacity at the site bringing it to 190 million board feet. This is another step forward in our extensive capital program that will deploy the latest mill technology and work environment improvements for our talented team at Opelika. We also had strong contributions from our panels and pulp business as strong pricing and improved operating performance over 2016 contributed to improved results.
While 2017 was a record year for the company in Adjusted EBITDA, we remain convinced of the untapped potential for further improvement in all our operations. Our consistent business approach, diversified operating footprint, focus on reinvesting in our business and development of high-performance teams puts us in a strong position to compete in our sector and product markets.
- 7 -
With the support, dedication and effort of all our employees, their families, our Board of Directors, our customers and communities, I am optimistic about the opportunities for continued success in 2018. Our strong financial position backs our commitment to safe, modern, efficient operations driven by a low-cost culture which positions us well for the years ahead.
Ted Seraphim President and Chief Executive Officer
- 8 -
ANNUAL INFORMATION FORM
Date
This Annual Information Form of West Fraser Timber Co. Ltd. (“West Fraser”, “we”, “us”, “our” or the “Company”) is dated as of February 14, 2018. Except as otherwise indicated, the information contained in it is as of December 31, 2017.
All financial information in this Annual Information Form is presented in Canadian dollars, unless otherwise indicated.
Forward-looking Statements
This Annual Information Form, and the Annual Report of which it forms a part, contain historical information, descriptions of current circumstances and statements about potential future developments. The latter, which are forward-looking statements, are presented to provide reasonable guidance to the reader but their accuracy depends on a number of assumptions and are subject to various risks and uncertainties. Forward-looking statements are included under the headings “Fibre Supply – Mountain Pine Beetle and B.C. Wildfires” (the timing of AAC reductions and the effect on our AACs), “Fibre Supply – Caribou Recovery Planning” (impact on our access to timber supply), “Fibre Supply - Aboriginal Matters” (the potential effect of aboriginal title or rights), “Capital Structure – Cash dividends” and “Risks and Uncertainties” in the 2017 Management’s Discussion & Analysis incorporated herein. Actual outcomes and results will depend on a number of factors that could affect the ability of the Company to execute its business plans, including the matters described in these sections and under “Risk Factors”, and may differ materially from those anticipated or projected. Accordingly, readers should exercise caution in relying upon forward-looking statements which reflect management’s estimates, projections and views only as of the date hereof. The Company undertakes no obligation to publicly revise these statements to reflect subsequent events or changes in circumstances except as required by applicable securities laws.
Business Overview
We are a North American diversified wood products company which produces lumber (SPF and SYP), panels (plywood, MDF and LVL), pulp (NBSK and BCTMP), newsprint, wood chips and energy. We hold rights to timber resources that are sufficient to supply a significant amount of the fibre required by our Canadian operations and have long-term agreements for the supply of a portion of the fibre required by our United States operations. We carry on our operations through subsidiaries and joint operations in British Columbia, Alberta and the southern United States. Our operations located in western Canada manufacture all of the products described above except SYP lumber. Our sawmills located in the southern U.S. produce SYP lumber and wood chips.
- 9 -
The annual production capacities of our wholly-owned facilities and our share of the capacities of our 50%-owned operations are as follows:
Lumber (MMfbm) SPF 4,150 SYP 3,050 Total 7,200 Panels Plywood (MMsf 3/8”) 860 MDF (MMsf 3/4") 250 LVL (Mcf) 3,200 Pulp (Mtonnes) BCTMP 690 NBSK 570 Newsprint (Mtonnes) 135
Corporate Strategy
Our goal at West Fraser is to generate strong financial results through the business cycle, relying on our committed work force, the quality of our assets and our well-established corporate culture. This culture emphasizes cost control in all aspects of the business and internal and external competitiveness. In our approach to employee relations, we emphasize employee involvement and favour internal promotions whenever possible.
We are a diversified producer of wood products with access to extensive timber resources. Our Canadian lumber, plywood, LVL and veneer operations are directly or indirectly the primary source of raw material for our pulp & paper, MDF and energy operations.
We are committed to operating in a financially conservative and prudent manner. The North American wood products industry is cyclical and periodically faces difficult market conditions and serious challenges. During such cyclical downturns, we focus on financial discipline, which may include reduction or deferral of non-essential capital expenditures. As market conditions improve we will typically undertake an expanded capital investment program in order to catch up on expenditures that were reduced or deferred during the downturn. We believe that maintaining a strong balance sheet provides the ability to react to growth opportunities and is a key tool in managing our operations through a business cycle.
Acquisitions and expansions are considered with a view to extending our existing business lines, particularly in lumber operations, and to product and geographic diversification. Our earnings over the business cycle have enabled us to make significant and ongoing capital investments in our facilities with the goal of achieving, maintaining or improving an overall low-cost position.
- 10 -
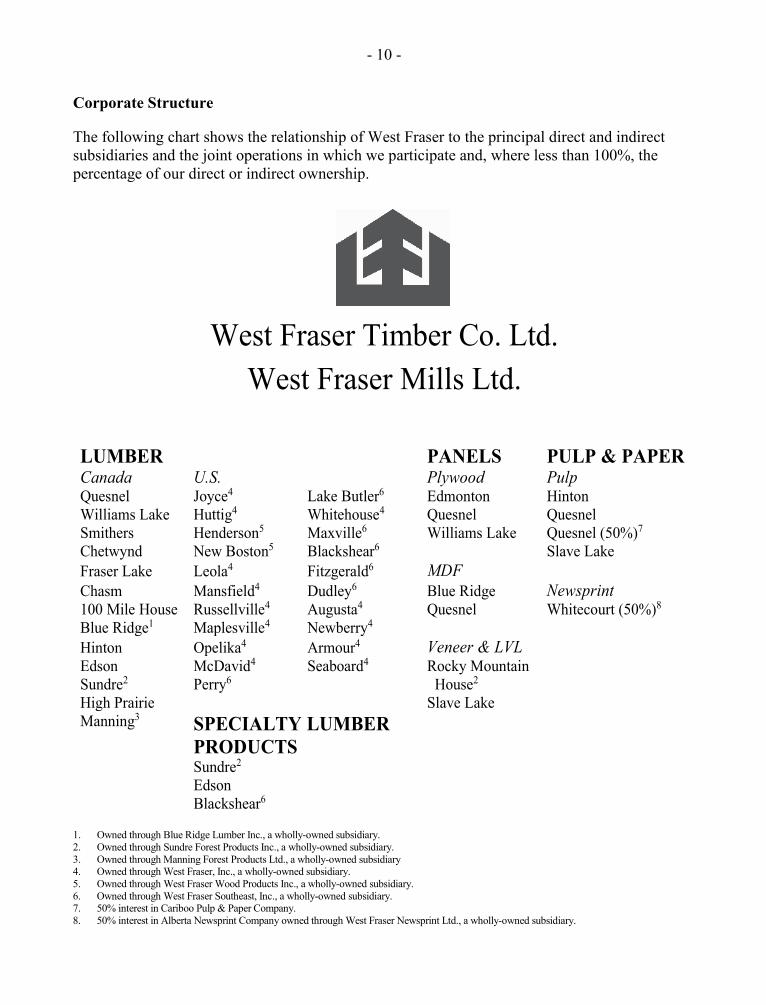
Corporate Structure
The following chart shows the relationship of West Fraser to the principal direct and indirect subsidiaries and the joint operations in which we participate and, where less than 100%, the percentage of our direct or indirect ownership.
West Fraser Timber Co. Ltd. West Fraser Mills Ltd.
LUMBER PANELS PULP & PAPER Canada U.S. Plywood Pulp Quesnel Joyce4 Lake Butler6 Edmonton Hinton Williams Lake Huttig4 Whitehouse4 Quesnel Quesnel Smithers Henderson5 Maxville6 Williams Lake Quesnel (50%)7
Chetwynd New Boston5 Blackshear6 Slave Lake Fraser Lake Leola4 Fitzgerald6 MDF Chasm Mansfield4 Dudley6 Blue Ridge Newsprint 100 Mile House Russellville4 Augusta4 Quesnel Whitecourt (50%)8
Blue Ridge1 Maplesville4 Newberry4 Hinton Opelika4 Armour4 Veneer & LVL Edson McDavid4 Seaboard4 Rocky Mountain Sundre2 Perry6 House2 High Prairie Slave Lake Manning3 SPECIALTY LUMBER
PRODUCTS
Sundre2 Edson Blackshear6
1. Owned through Blue Ridge Lumber Inc., a wholly-owned subsidiary. 2. Owned through Sundre Forest Products Inc., a wholly-owned subsidiary. 3. Owned through Manning Forest Products Ltd., a wholly-owned subsidiary 4. Owned through West Fraser, Inc., a wholly-owned subsidiary. 5. Owned through West Fraser Wood Products Inc., a wholly-owned subsidiary. 6. Owned through West Fraser Southeast, Inc., a wholly-owned subsidiary. 7. 50% interest in Cariboo Pulp & Paper Company. 8. 50% interest in Alberta Newsprint Company owned through West Fraser Newsprint Ltd., a wholly-owned subsidiary.
- 11 -
West Fraser is organized under the Business Corporations Act (British Columbia) and assumed its present form in 1966 by the amalgamation of a group of companies under the laws of B.C. The principal operating subsidiary, West Fraser Mills Ltd., assumed its present form on January 1, 2005 by amalgamation under those laws. West Fraser, Inc., West Fraser Wood Products Inc. and West Fraser Southeast, Inc. are Delaware corporations, while Blue Ridge Lumber Inc., Manning Forest Products Ltd. and Sundre Forest Products Inc. are Alberta corporations. West Fraser Newsprint Ltd. subsists under the laws of Canada. Alberta Newsprint Company (“ANC”) and Cariboo Pulp & Paper Company are unincorporated 50%-owned operations governed, respectively, by the laws of Alberta and B.C.
Our executive office is located at 858 Beatty Street, Suite 501, Vancouver, B.C., Canada, V6B 1C1 and our registered office is located at 1500 – 1055 West Georgia Street, Vancouver, B.C., Canada, V6E 4N7.
History and Development of Business
West Fraser originated in 1955 when three brothers, Pete, Bill and Sam Ketcham, acquired a lumber planing mill located in Quesnel, B.C. (“Quesnel”). From 1955 through 2017 the business expanded through the acquisition of a number of sawmills and related timber harvesting rights and the acquisition or development of lumber, panel and pulp & paper businesses.
Major developments for West Fraser during the last four years include the following:
2014 Acquired two sawmills in Arkansas and one in High Prairie, Alberta.
Permanently closed our Houston, B.C., Slave Lake, Alberta and Folkston, Georgia sawmills.
Capital investment sets new annual record at $410 million. Completed six continuous kilns, two planer projects and four major
sawmill upgrades. Completed a low consistency refiner project at our BCTMP mill in
Quesnel.
2015 Acquired a sawmill in Manning, Alberta. Completed co-generation projects at two of our B.C. sawmills to
generate electricity from wood waste to be sold under long-term contracts.
Completed biogas-electricity generation project at our Slave Lake, Alberta pulp mill. First electricity generated January 2016.
Completed three continuous kilns, two planer projects and one major sawmill upgrade.
- 12 -
2016 Terminated power purchase agreements that had provided us with a portion of the electricity generated from two power plants in Alberta at substantially predetermined rates.
MDF facility in Quesnel was closed for repairs following a fire on March 9.
A coalition of U.S. lumber producers petitioned the U.S. Department of Commerce and the U.S. International Trade Commission to investigate alleged subsidies to Canadian producers and levy duties against Canadian imports.
Completed three continuous kilns.
2017 MDF facility in Quesnel damaged by fire in 2016 was repaired and began producing board on April 29.
Acquired six sawmills and a finger-joint (specialty lumber) mill in Florida and Georgia as well as an administrative office in St. Marys, Georgia (the “Gilman Acquisition”).
On December 4 the U.S. Department of Commerce determined final duty rates for West Fraser of 23.56%.
Completed four continuous kilns and two major sawmill upgrades. Sales Revenue ($ millions)
Year ended December 31 2017 2016 2015 2014 2013 Lumber 3,671 3,145 2,764 2,622 2,315 Panels 600 529 554 526 467 Pulp & Paper 988 887 900 812 780 Intracompany fibre sales (125) (111) (118) (104) (88) 5,134 4,450 4,100 3,856 3,474
Fibre Supply
Our operations are dependent on the consistent supply of substantial quantities of wood fibre in various forms. The primary manufacturing facilities, which produce lumber, plywood and LVL, consume whole logs while the pulp & paper and MDF facilities mostly consume wood by-products in the form of wood chips, shavings and sawdust resulting from the production of lumber, plywood or LVL. Many facilities also consume hog fuel and wood waste in energy systems.
In B.C. and Alberta substantially all timberlands are publicly owned and the right to harvest timber is acquired through provincially-granted licences. Licences grant the holder the right to harvest up to a specified quantity of timber annually and either have a term of 15 to 25 years and are replaceable or have a shorter term but are not replaceable. Government objectives in granting licenses include responsible management of timber, soils, wildlife, water and fish resources and the preservation of biodiversity and the protection of cultural values. The
- 13 -
objectives also include achieving the fullest possible economic utilization of the forest resources and employment in local communities.
Timber tenures in B.C. and Alberta require the payment of a fee, commonly known as stumpage, for timber harvested pursuant to its terms. Stumpage in Alberta is product-price specific and varies with the sales price of the product into which the logs will be converted. Stumpage in B.C. is substantially based on the results of certain publicly-auctioned timber harvesting rights.
Timber tenures in B.C. and Alberta require the holder to carry out reforestation to ensure re-establishment of the forest after harvesting. Reforestation projects are planned and supervised by our woodlands staff and are subject to approval by relevant government authorities. Our timber harvesting operations are carried out by independent contractors under the supervision of our woodlands staff.
The following table summarizes the timber tenures, as at December 31, 2017, which supply the Canadian mills that we own or in which we have an interest, as well as our AAC for such tenures.
Timber Tenures (thousand m3) Location Tenure1 Expiry AAC
B.C. Coniferous Long-term 2022 - 2035 5,621 Coniferous Short-term 2018 200 Alberta Coniferous Long-term 2018 - 2033 6,910 Deciduous Long-term 2019 - 2033 1,301
1. Long-term tenures include TFLs, FMAs, timber quotas and forest licences, which are renewable timber tenures. Short-term tenures include non-replaceable forest licences.
We do not own or manage any timberlands in the U.S.
Log Supply
Annual log requirements for our Canadian sawmills, plywood facilities and LVL plant, all operating at the capacities described herein, would total approximately 16 million m3. Approximately 80% of these requirements can be obtained from the tenures described in the above table and the balance is typically acquired from third parties holding short or long-term timber harvesting rights, including independent logging contractors, aboriginal groups, communities and woodlot owners. We do not necessarily consume the maximum permitted volume of logs that may be harvested from our tenures annually but will adjust between tenure and purchase logs depending on circumstances including the availability of purchase logs.
Our U.S. operations, which produce SYP lumber, would consume approximately 13 million tons of logs per year if operating at the capacity described herein. Our U.S. operations as a whole have access to approximately 17% of their log requirements under certain long-term supply contracts, and the balance is purchased on the open market. Open market purchases come from timber real estate investment trusts, timberland investment management organizations and private land owners.
- 14 -
Mountain Pine Beetle and B.C. Wildfires
The mountain pine beetle infestation in the B.C. interior reached a peak, in terms of the annual timber mortality rate, more than 12 years ago. Approximately 40% of B.C.’s crown forest is within the timber harvesting land base (“THLB”), and approximately 29% of the THLB is pine. When assessing the THLB of B.C.’s interior, approximately 37% is pine. The damage to the mature pine forests within our operating areas is significant.
We continue to focus on the salvage and processing of dead pine in order to utilize as much of the resource as possible and to ensure that affected sites are promptly reforested. The Province of B.C. increased the AAC on dead pine stands and limited the harvest of non-pine species until the salvage of dead pine stands comes to a conclusion. The AAC has been or will be reduced to reflect lower mature inventories as dead pine stands are harvested or when they are no longer economic to harvest. The Province has reduced the AAC in B.C.’s central interior by approximately 32% in the past five years and we expect this process to continue over the next several years. To date, B.C.’s Chief Forester has announced reductions of the AAC in six of our operating areas in the interior. No reductions are expected in 2018.
Wildfires in B.C. burned nearly a million hectares of forest land in 2017. Our Cariboo region operating areas were significantly impacted. Salvage of fire damaged trees has begun and is expected to continue for 2-4 years.
As the timing of future AAC reductions and the effect on our AACs will depend on a variety of factors, including the impact of wildfires and the amount of non-pine species available for harvest, the full effect on our operations cannot reasonably be determined at this time.
In Alberta, the Minister and the forest industry continue to implement aggressive programs of early mountain pine beetle detection, single tree control and focussed harvesting activity. The mountain pine beetle infestation significantly expanded from Jasper National Park into our Hinton forest management area (“FMA”) in 2017. We continue to work aggressively to reduce the number of susceptible pine stands and conduct spread control activities across the region in concert with other forest industry participants and the Province of Alberta.
Caribou Recovery Planning
Draft mountain caribou recovery plans were released by the Alberta government in December 2017. The AAC impact from these plans will depend on the final location of conservation areas and the forest harvest regimes that are implemented. Plans are expected to be finalized in 2018.
A Draft Canada-British Columbia Conservation Agreement for Southern Mountain Caribou recovery of the Central Group (three herds in south Peace area) is currently undergoing consultation. This draft agreement is broad and involves identification of additional conservation areas. We expect this will have some impact on our access to timber supply, but we are unable to predict or quantify the impact at this stage in the planning process.
- 15 -
Forestry Certification
We obtain external certification from a number of accredited standard-setting certification bodies which offer independent verification of the measures that we take to mitigate the effects of our activities on the environment.
All of the Canadian woodlands operations directly managed by us are independently certified by the Sustainable Forestry Initiative (“SFI”), an internationally-recognized sustainable forest management certification program.
We also subscribe to the chain-of-custody certification Programme for Endorsement of Forest Certification (“PEFC”) standard for our Canadian-produced forest products. PEFC chain of custody assures customers that the fibre in the supply chain comes from sources that comply with applicable laws, regulations and sustainable resource standards. The standard also demonstrates avoidance of sourcing fibre from controversial sources.
PEFC is a global organization that provides a mutual recognition framework for national certification systems. PEFC recognizes more than 25 national certification systems, including SFI, and assures customers that differing systems provide a consistent level of sustainable forest management.
Our pulp operations and MDF mills are registered to the Forest Stewardship Council’s (“FSC”) Standard for Chain of Custody Certification and the Standard for Company Evaluation of FSC Controlled Wood. This standard independently verifies that these operations do not source fibre from wood harvested (i) illegally, (ii) in violation of traditional and civil rights, (iii) in forests where high conservation values are threatened by management activities, (iv) in forests being converted to plantations or non-forest use, (v) from forests in which genetically modified trees are planted, or (vi) in violation of any of the ILO Core Conventions, as defined in the ILO Declaration on Fundamental Principles and Rights at Work, 1988.
We do not own or manage any forestlands in the United States. However, our U.S. sawmills procure wood from a variety of sources normally within an approximate 70-mile radius of each mill. All of our U.S. mills except those purchased with the Gilman Acquisition are certified under the SFI Fiber Sourcing Standard.
For more information concerning our sustainable and environmentally sound forest practices see our Responsibility Report at www.westfraser.com.
Aboriginal Matters
Our continued access to the forest resource in Canada could be adversely affected by right and title (or claims thereto) and treaties involving various aboriginal groups, including First Nations, Métis and others. The obligations of Canadian provincial governments to consult and accommodate aboriginal groups regarding asserted and established rights, as well as their obligations under existing treaties and ongoing treaty negotiations, could affect the issuance, validity, renewal and exercise and terms and conditions of Crown timber rights and authorizations to harvest, or the timeliness of obtaining such rights. If aboriginal title is proven
- 16 -
over any of the lands where we have interests or rights, it could result in aboriginal ownership of the resources on title lands.
To date there has been only one court case finding aboriginal title in B.C. where aboriginal title was found to be held by the Tsilhqot’in Nation in respect of an area that is less than 0.2% of B.C., but where we do not hold cutting permits.
As the jurisprudence and government policies respecting aboriginal title and rights and the consultation process continue to evolve, we cannot at this time predict whether aboriginal claims will have a material adverse effect on our timber harvesting rights or on our ability to exercise, renew or transfer them, or secure other timber harvesting rights.
Residual Fibre Supply
In Canada substantially all our requirements for wood chips, shavings and sawdust and hog fuel are supplied from our own operations, either directly or indirectly through trades. This reduces our exposure to risks associated with price fluctuations and supply shortages of these products.
Our B.C. sawmills and plywood plants produce substantially all of the fibre requirements of our B.C. pulp operations and MDF plant. The Alberta MDF plant obtains its fibre from the adjacent Blue Ridge sawmill and other sawmills in the area. The Hinton pulp mill obtains its fibre from the adjacent Hinton sawmill and other sawmills in the area owned by us. At times we produce whole log chips at the Hinton facility to supplement the supply of residual chips from our various sawmills. The fibre requirements of our newsprint mill are obtained from local sawmills, including our sawmill in Blue Ridge and the Slave Lake veneer operation, through chip purchase agreements and log-for-chip trades using logs harvested from the newsprint mill’s tenures. The Slave Lake deciduous FMA provides most of the fibre requirements of the Slave Lake pulp mill, with the balance being obtained from logs purchased from local suppliers.
The majority of the wood chips produced by our U.S. operations are sold to pulp mills and pellet plants at market prices pursuant to long-term contracts.
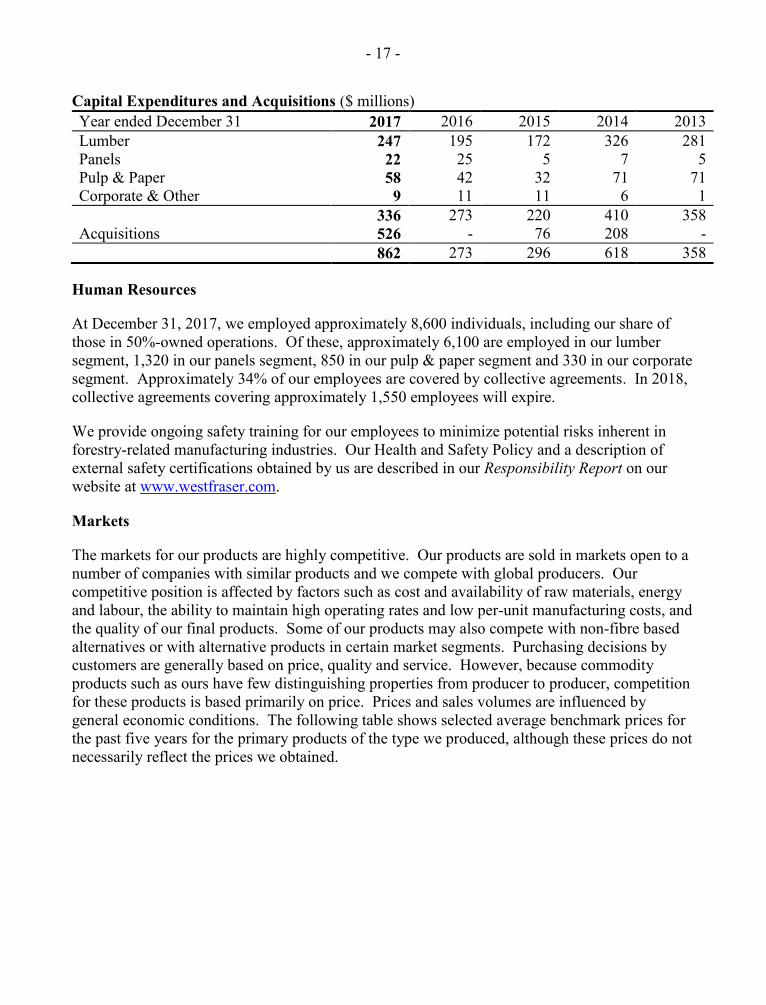
Capital Expenditures and Acquisitions
We regularly invest in upgrading and expanding our facilities and operations. However, during periods when earnings are weak, we may reduce capital and other expenditures in order to preserve liquidity. The following table shows the capital expenditures and acquisitions during the past five years.
- 17 -
Capital Expenditures and Acquisitions ($ millions) Year ended December 31 2017 2016 2015 2014 2013
Lumber 247 195 172 326 281 Panels 22 25 5 7 5 Pulp & Paper 58 42 32 71 71 Corporate & Other 9 11 11 6 1 336 273 220 410 358 Acquisitions 526 - 76 208 - 862 273 296 618 358
Human Resources
At December 31, 2017, we employed approximately 8,600 individuals, including our share of those in 50%-owned operations. Of these, approximately 6,100 are employed in our lumber segment, 1,320 in our panels segment, 850 in our pulp & paper segment and 330 in our corporate segment. Approximately 34% of our employees are covered by collective agreements. In 2018, collective agreements covering approximately 1,550 employees will expire.
We provide ongoing safety training for our employees to minimize potential risks inherent in forestry-related manufacturing industries. Our Health and Safety Policy and a description of external safety certifications obtained by us are described in our Responsibility Report on our website at www.westfraser.com.
Markets
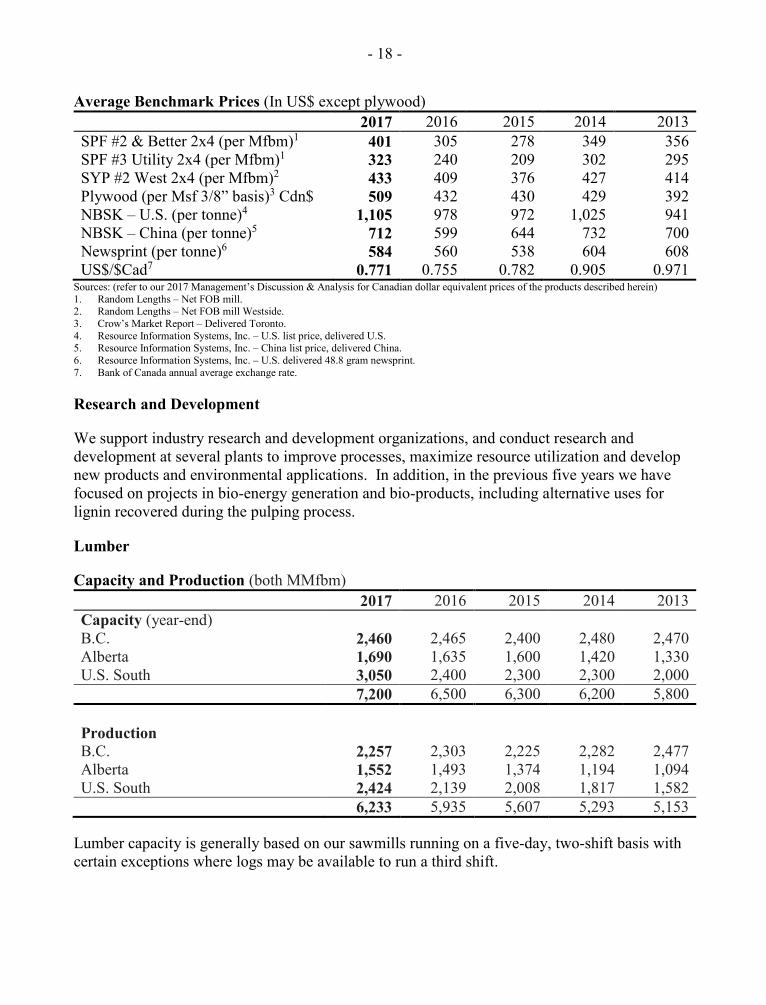
The markets for our products are highly competitive. Our products are sold in markets open to a number of companies with similar products and we compete with global producers. Our competitive position is affected by factors such as cost and availability of raw materials, energy and labour, the ability to maintain high operating rates and low per-unit manufacturing costs, and the quality of our final products. Some of our products may also compete with non-fibre based alternatives or with alternative products in certain market segments. Purchasing decisions by customers are generally based on price, quality and service. However, because commodity products such as ours have few distinguishing properties from producer to producer, competition for these products is based primarily on price. Prices and sales volumes are influenced by general economic conditions. The following table shows selected average benchmark prices for the past five years for the primary products of the type we produced, although these prices do not necessarily reflect the prices we obtained.
- 18 -
Average Benchmark Prices (In US$ except plywood) 2017 2016 2015 2014 2013 SPF #2 & Better 2x4 (per Mfbm)1 401 305 278 349 356 SPF #3 Utility 2x4 (per Mfbm)1 323 240 209 302 295 SYP #2 West 2x4 (per Mfbm)2 433 409 376 427 414 Plywood (per Msf 3/8” basis)3 Cdn$ 509 432 430 429 392 NBSK – U.S. (per tonne)4 1,105 978 972 1,025 941 NBSK – China (per tonne)5 712 599 644 732 700 Newsprint (per tonne)6 584 560 538 604 608 US$/$Cad7 0.771 0.755 0.782 0.905 0.971
Sources: (refer to our 2017 Management’s Discussion & Analysis for Canadian dollar equivalent prices of the products described herein) 1. Random Lengths – Net FOB mill. 2. Random Lengths – Net FOB mill Westside. 3. Crow’s Market Report – Delivered Toronto. 4. Resource Information Systems, Inc. – U.S. list price, delivered U.S. 5. Resource Information Systems, Inc. – China list price, delivered China. 6. Resource Information Systems, Inc. – U.S. delivered 48.8 gram newsprint. 7. Bank of Canada annual average exchange rate.
Research and Development
We support industry research and development organizations, and conduct research and development at several plants to improve processes, maximize resource utilization and develop new products and environmental applications. In addition, in the previous five years we have focused on projects in bio-energy generation and bio-products, including alternative uses for lignin recovered during the pulping process.
Lumber
Capacity and Production (both MMfbm) 2017 2016 2015 2014 2013
Capacity (year-end) B.C. 2,460 2,465 2,400 2,480 2,470 Alberta 1,690 1,635 1,600 1,420 1,330 U.S. South 3,050 2,400 2,300 2,300 2,000 7,200 6,500 6,300 6,200 5,800 Production B.C. 2,257 2,303 2,225 2,282 2,477 Alberta 1,552 1,493 1,374 1,194 1,094 U.S. South 2,424 2,139 2,008 1,817 1,582 6,233 5,935 5,607 5,293 5,153
Lumber capacity is generally based on our sawmills running on a five-day, two-shift basis with certain exceptions where logs may be available to run a third shift.
- 19 -
Operations
We operate 34 sawmills, a wood-treating facility at the Sundre sawmill, a specialty manufacturing plant at the Edson sawmill and a finger joint facility at the Blackshear sawmill. Our Canadian sawmills, of which 7 are in B.C. and 6 are in Alberta, produce spruce, pine, fir lumber of various grades and dimensions. Our 21 U.S. sawmills produce southern yellow pine lumber of various grades and dimensions.
Sales
Lumber produced at our Canadian sawmills and sold to North American customers is marketed and sold from our sales office in Quesnel, while sales to offshore markets are made from our export sales office in Vancouver, B.C. Offshore sales activities are complemented by a customer service office in Japan. Lumber produced at our U.S. sawmills is marketed by our sales group in Memphis, Tennessee and St. Marys, Georgia. From time to time, we purchase lumber for resale in order to meet requirements of customers.
In 2017, sales of lumber from our Canadian and U.S. operations were made to customers in the U.S. and Canada and to customers offshore, predominantly in China and Japan. Most lumber shipments to North American customers by our Canadian operations were made by rail and the balance by truck. Most lumber shipments to North American customers by our U.S. operations were delivered by truck and the balance by rail. Offshore shipments from both Canada and the U.S. were made through various public terminals in bulk or container vessels.
Panels
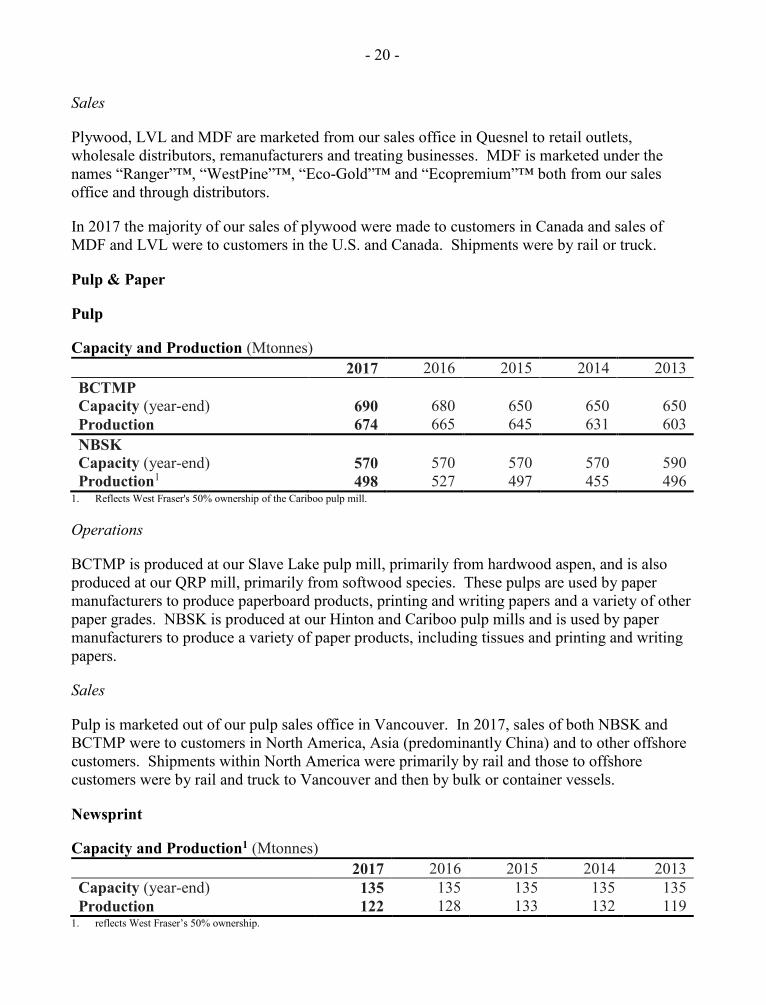
Capacity and Production 2017 2016 2015 2014 2013 Plywood (MMsf 3/8” basis) Capacity (year-end) 860 850 830 830 830 Production 838 826 797 771 781 MDF (MMsf 3/4” basis) Capacity (year-end) 250 250 250 300 300 Production 191 160 220 206 204 LVL (Mcf) Capacity (year-end) 3,200 3,200 3,200 3,200 3,200 Production 2,676 2,215 1,627 1,796 1,848
Operations
Our panel operations include three plywood mills that primarily produce standard softwood sheathing plywood, two MDF mills, each with the flexibility to manufacture varying thicknesses and sizes, an LVL mill, and a veneer mill that produces veneer for use in our Edmonton plywood mill. A fire at our MDF plant in Quesnel on March 9, 2016 resulted in the closure of the plant while repairs and reconstruction took place. The plant began producing board April 29, 2017 and returned to normal production levels by year end. This reduced 2016 and 2017 MDF production compared to prior years.
- 20 -
Sales
Plywood, LVL and MDF are marketed from our sales office in Quesnel to retail outlets, wholesale distributors, remanufacturers and treating businesses. MDF is marketed under the names “Ranger”™, “WestPine”™, “Eco-Gold”™ and “Ecopremium”™ both from our sales office and through distributors.
In 2017 the majority of our sales of plywood were made to customers in Canada and sales of MDF and LVL were to customers in the U.S. and Canada. Shipments were by rail or truck.
Pulp & Paper
Pulp
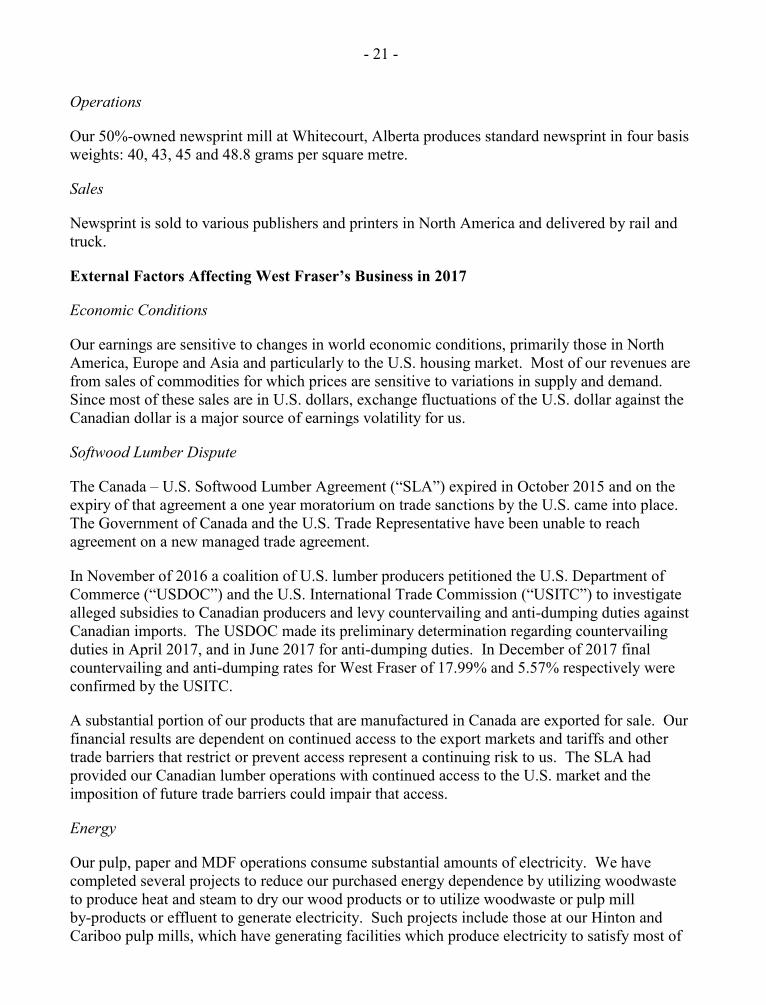
Capacity and Production (Mtonnes) 2017 2016 2015 2014 2013 BCTMP Capacity (year-end) 690 680 650 650 650 Production 674 665 645 631 603 NBSK Capacity (year-end) 570 570 570 570 590 Production1 498 527 497 455 496
1. Reflects West Fraser's 50% ownership of the Cariboo pulp mill.
Operations
BCTMP is produced at our Slave Lake pulp mill, primarily from hardwood aspen, and is also produced at our QRP mill, primarily from softwood species. These pulps are used by paper manufacturers to produce paperboard products, printing and writing papers and a variety of other paper grades. NBSK is produced at our Hinton and Cariboo pulp mills and is used by paper manufacturers to produce a variety of paper products, including tissues and printing and writing papers.
Sales
Pulp is marketed out of our pulp sales office in Vancouver. In 2017, sales of both NBSK and BCTMP were to customers in North America, Asia (predominantly China) and to other offshore customers. Shipments within North America were primarily by rail and those to offshore customers were by rail and truck to Vancouver and then by bulk or container vessels.
Newsprint
Capacity and Production1 (Mtonnes) 2017 2016 2015 2014 2013 Capacity (year-end) 135 135 135 135 135 Production 122 128 133 132 119
1. reflects West Fraser’s 50% ownership.
- 21 -
Operations
Our 50%-owned newsprint mill at Whitecourt, Alberta produces standard newsprint in four basis weights: 40, 43, 45 and 48.8 grams per square metre.
Sales
Newsprint is sold to various publishers and printers in North America and delivered by rail and truck.
External Factors Affecting West Fraser’s Business in 2017
Economic Conditions
Our earnings are sensitive to changes in world economic conditions, primarily those in North America, Europe and Asia and particularly to the U.S. housing market. Most of our revenues are from sales of commodities for which prices are sensitive to variations in supply and demand. Since most of these sales are in U.S. dollars, exchange fluctuations of the U.S. dollar against the Canadian dollar is a major source of earnings volatility for us.
Softwood Lumber Dispute
The Canada – U.S. Softwood Lumber Agreement (“SLA”) expired in October 2015 and on the expiry of that agreement a one year moratorium on trade sanctions by the U.S. came into place. The Government of Canada and the U.S. Trade Representative have been unable to reach agreement on a new managed trade agreement.
In November of 2016 a coalition of U.S. lumber producers petitioned the U.S. Department of Commerce (“USDOC”) and the U.S. International Trade Commission (“USITC”) to investigate alleged subsidies to Canadian producers and levy countervailing and anti-dumping duties against Canadian imports. The USDOC made its preliminary determination regarding countervailing duties in April 2017, and in June 2017 for anti-dumping duties. In December of 2017 final countervailing and anti-dumping rates for West Fraser of 17.99% and 5.57% respectively were confirmed by the USITC.
A substantial portion of our products that are manufactured in Canada are exported for sale. Our financial results are dependent on continued access to the export markets and tariffs and other trade barriers that restrict or prevent access represent a continuing risk to us. The SLA had provided our Canadian lumber operations with continued access to the U.S. market and the imposition of future trade barriers could impair that access.
Energy
Our pulp, paper and MDF operations consume substantial amounts of electricity. We have completed several projects to reduce our purchased energy dependence by utilizing woodwaste to produce heat and steam to dry our wood products or to utilize woodwaste or pulp mill by-products or effluent to generate electricity. Such projects include those at our Hinton and Cariboo pulp mills, which have generating facilities which produce electricity to satisfy most of
- 22 -
their energy requirements and can contribute to earnings by selling any excess electricity. In addition, our Slave Lake pulp mill produces electricity for its own use from bio-gas reclaimed from effluent treatment.
Co-generation projects at our Fraser Lake and Chetwynd, B.C. sawmills produce electricity from woodwaste. The electricity is sold under long-term contracts.
In B.C., electricity is purchased from the provincial utility at regulated prices based largely on generation costs. In Alberta, electricity is purchased at market prices through the Alberta power pool.
In Alberta, we operate a natural gas-fired peaking power price plant at our 50%-owned newsprint mill which provides a partial hedge for that mill against high prices of electricity and transmission costs. Our exposure to energy costs includes the cost to purchase electricity, natural gas, gasoline, diesel fuels, carbon taxes and fuel surcharges on purchased transportation.
Environment
Our manufacturing operations are subject to environmental protection laws and regulations. We have developed and apply internal programs and policies to help ensure that our operations are in compliance with applicable laws and standards and to address any instances of non-compliance. We are committed to responsible stewardship of the environment and to the continual improvement of our forest practices and manufacturing procedures so we can optimize the use of resources and minimize the impact of our operations on the environment.
We have incurred, and will continue to incur, capital expenditures and operating costs to comply with environmental laws and regulations, which are not expected to have material financial or operational effects on us or our competitive position. We are required to carry out remediation activities, including site decommissioning, under applicable environmental protection laws and regulations. In addition, we are required to carry out reforestation activities under our various timber licenses. We maintain accruals in our financial statements for certain environmental, reforestation and decommissioning obligations.
We have adopted and follow an Environmental Policy, a copy of which is available on our website at www.westfraser.com. Additional information is available in our Responsibility Report, also available on our website at www.westfraser.com.
Risk Factors
A detailed discussion of risk factors is included under the heading “Risks and Uncertainties” in Management's Discussion & Analysis for the year ended December 31, 2017, which is incorporated herein by reference. Our Management’s Discussion & Analysis is available on SEDAR at www.sedar.com.
- 23 -
Capital Structure
Share Capital
Our authorized share capital consists of 430,000,000 shares divided into:
(a) 400,000,000 Common shares,
(b) 20,000,000 Class B Common shares, and
(c) 10,000,000 Preferred shares, issuable in series.
The Common shares and Class B Common shares are equal in all respects, including the right to dividends, rights upon dissolution or winding up and the right to vote, except that each Class B Common share may at any time be exchanged for one Common share. The Common shares are listed and traded on the Toronto Stock Exchange under the symbol WFT while our Class B Common shares are not. Certain circumstances or corporate transactions may require the approval of the holders of our Common shares and Class B Common shares on a separate class by class basis.
As at December 31, 2017, the issued share capital consisted of 75,664,558 Common shares and 2,281,478 Class B Common shares for a total of 77,946,036 shares (as at December 31, 2016 –78,162,568 shares).
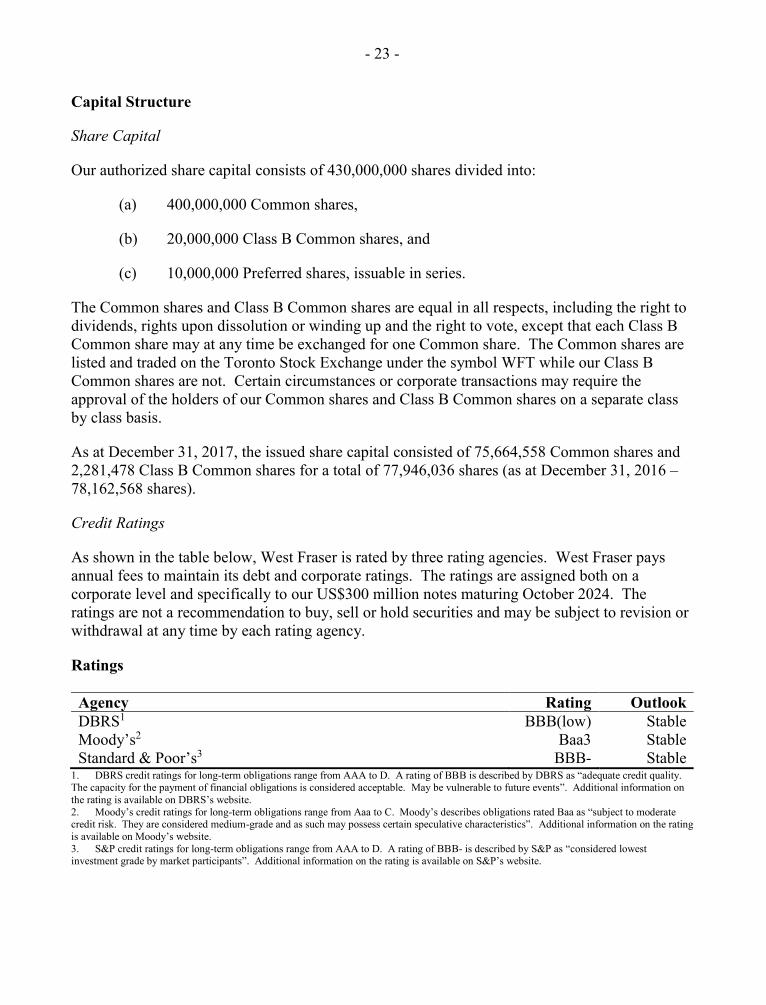
Credit Ratings
As shown in the table below, West Fraser is rated by three rating agencies. West Fraser pays annual fees to maintain its debt and corporate ratings. The ratings are assigned both on a corporate level and specifically to our US$300 million notes maturing October 2024. The ratings are not a recommendation to buy, sell or hold securities and may be subject to revision or withdrawal at any time by each rating agency.
Ratings Agency Rating Outlook DBRS1 BBB(low) Stable Moody’s2 Baa3 Stable Standard & Poor’s3 BBB- Stable
1. DBRS credit ratings for long-term obligations range from AAA to D. A rating of BBB is described by DBRS as “adequate credit quality. The capacity for the payment of financial obligations is considered acceptable. May be vulnerable to future events”. Additional information on the rating is available on DBRS’s website. 2. Moody’s credit ratings for long-term obligations range from Aaa to C. Moody’s describes obligations rated Baa as “subject to moderate credit risk. They are considered medium-grade and as such may possess certain speculative characteristics”. Additional information on the rating is available on Moody’s website. 3. S&P credit ratings for long-term obligations range from AAA to D. A rating of BBB- is described by S&P as “considered lowest investment grade by market participants”. Additional information on the rating is available on S&P’s website.
- 24 -
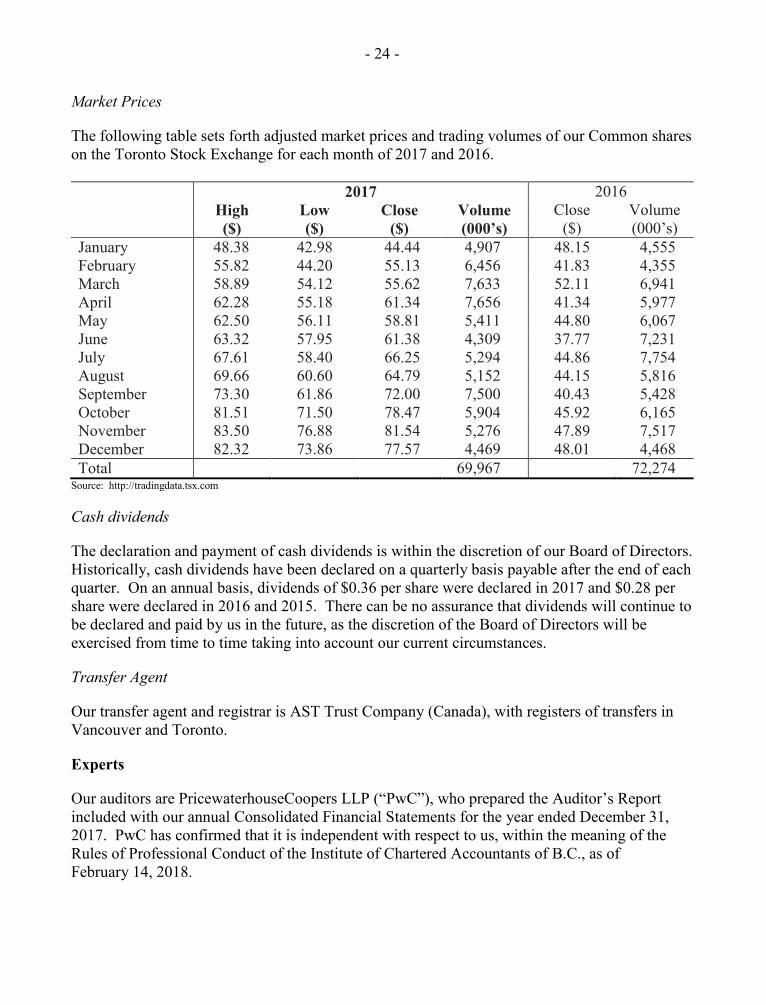
Market Prices
The following table sets forth adjusted market prices and trading volumes of our Common shares on the Toronto Stock Exchange for each month of 2017 and 2016. 2017 2016 High Low Close Volume Close Volume ($) ($) ($) (000’s) ($) (000’s) January 48.38 42.98 44.44 4,907 48.15 4,555 February 55.82 44.20 55.13 6,456 41.83 4,355 March 58.89 54.12 55.62 7,633 52.11 6,941 April 62.28 55.18 61.34 7,656 41.34 5,977 May 62.50 56.11 58.81 5,411 44.80 6,067 June 63.32 57.95 61.38 4,309 37.77 7,231 July 67.61 58.40 66.25 5,294 44.86 7,754 August 69.66 60.60 64.79 5,152 44.15 5,816 September 73.30 61.86 72.00 7,500 40.43 5,428 October 81.51 71.50 78.47 5,904 45.92 6,165 November 83.50 76.88 81.54 5,276 47.89 7,517 December 82.32 73.86 77.57 4,469 48.01 4,468 Total 69,967 72,274
Source: http://tradingdata.tsx.com
Cash dividends
The declaration and payment of cash dividends is within the discretion of our Board of Directors. Historically, cash dividends have been declared on a quarterly basis payable after the end of each quarter. On an annual basis, dividends of $0.36 per share were declared in 2017 and $0.28 per share were declared in 2016 and 2015. There can be no assurance that dividends will continue to be declared and paid by us in the future, as the discretion of the Board of Directors will be exercised from time to time taking into account our current circumstances.
Transfer Agent
Our transfer agent and registrar is AST Trust Company (Canada), with registers of transfers in Vancouver and Toronto.
Experts
Our auditors are PricewaterhouseCoopers LLP (“PwC”), who prepared the Auditor’s Report included with our annual Consolidated Financial Statements for the year ended December 31, 2017. PwC has confirmed that it is independent with respect to us, within the meaning of the Rules of Professional Conduct of the Institute of Chartered Accountants of B.C., as of February 14, 2018.
- 25 -
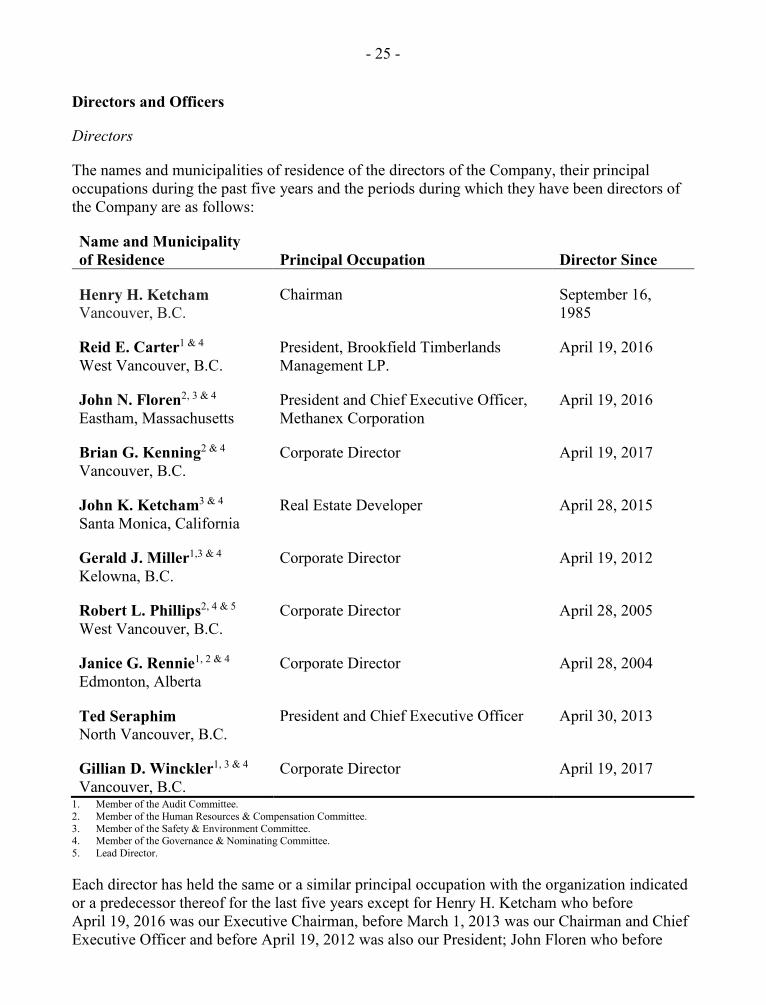
Directors and Officers
Directors
The names and municipalities of residence of the directors of the Company, their principal occupations during the past five years and the periods during which they have been directors of the Company are as follows:
Name and Municipality of Residence Principal Occupation Director Since
Henry H. Ketcham Vancouver, B.C.
Chairman September 16, 1985
Reid E. Carter1 & 4 West Vancouver, B.C.
President, Brookfield Timberlands Management LP.
April 19, 2016
John N. Floren2, 3 & 4 Eastham, Massachusetts
President and Chief Executive Officer, Methanex Corporation
April 19, 2016
Brian G. Kenning2 & 4 Vancouver, B.C.
Corporate Director April 19, 2017
John K. Ketcham3 & 4 Santa Monica, California
Real Estate Developer April 28, 2015
Gerald J. Miller1,3 & 4 Kelowna, B.C.
Corporate Director April 19, 2012
Robert L. Phillips2, 4 & 5 West Vancouver, B.C.
Corporate Director April 28, 2005
Janice G. Rennie1, 2 & 4 Edmonton, Alberta
Corporate Director April 28, 2004
Ted Seraphim North Vancouver, B.C.
President and Chief Executive Officer April 30, 2013
Gillian D. Winckler1, 3 & 4 Vancouver, B.C.
Corporate Director April 19, 2017
1. Member of the Audit Committee. 2. Member of the Human Resources & Compensation Committee. 3. Member of the Safety & Environment Committee. 4. Member of the Governance & Nominating Committee. 5. Lead Director.
Each director has held the same or a similar principal occupation with the organization indicated or a predecessor thereof for the last five years except for Henry H. Ketcham who before April 19, 2016 was our Executive Chairman, before March 1, 2013 was our Chairman and Chief Executive Officer and before April 19, 2012 was also our President; John Floren who before
- 26 -
January 2013 was Senior Vice President, Global Marketing and Logistics of Methanex Corporation; Ted Seraphim who before March 1, 2013 was President and Chief Operating Officer, before April 19, 2012 was Executive Vice-President and Chief Operating Officer; and Gillian Winckler who before June 2015 was CEO and President, as well as CFO for a brief period of Coalspur Limited. The term of office of each director will expire at the conclusion of the Company’s next annual general meeting.
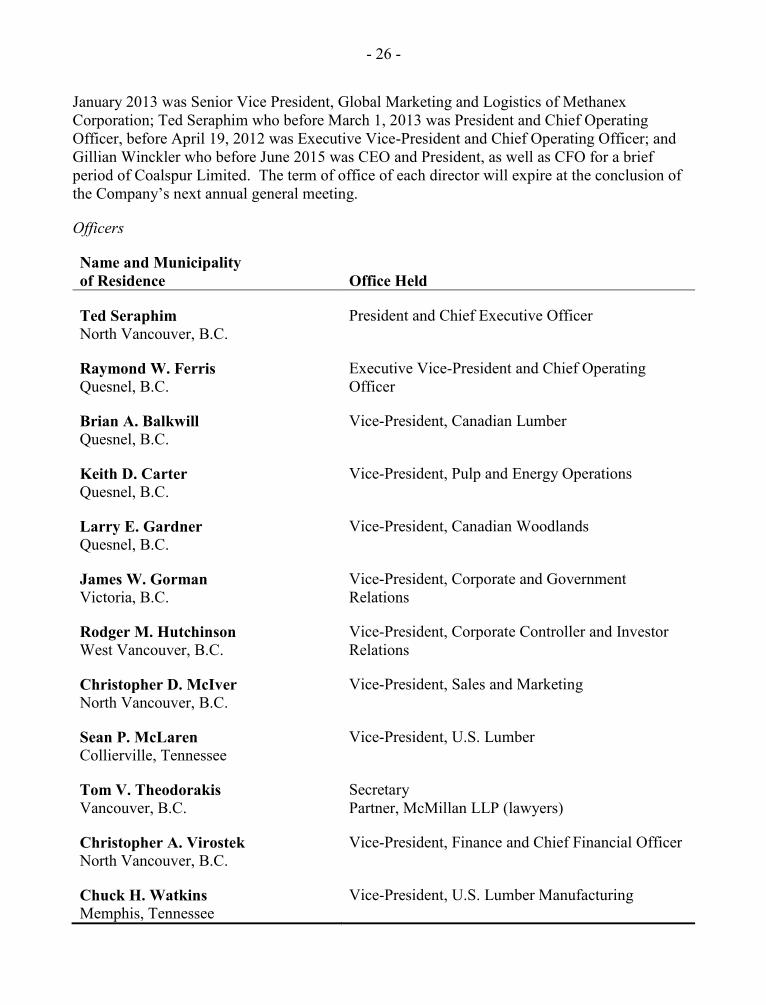
Officers
Name and Municipality of Residence Office Held
Ted Seraphim North Vancouver, B.C.
President and Chief Executive Officer
Raymond W. Ferris Quesnel, B.C.
Executive Vice-President and Chief Operating Officer
Brian A. Balkwill Quesnel, B.C.
Vice-President, Canadian Lumber
Keith D. Carter Quesnel, B.C.
Vice-President, Pulp and Energy Operations
Larry E. Gardner Quesnel, B.C.
Vice-President, Canadian Woodlands
James W. Gorman Victoria, B.C.
Vice-President, Corporate and Government Relations
Rodger M. Hutchinson West Vancouver, B.C.
Vice-President, Corporate Controller and Investor Relations
Christopher D. McIver North Vancouver, B.C.
Vice-President, Sales and Marketing
Sean P. McLaren Collierville, Tennessee
Vice-President, U.S. Lumber
Tom V. Theodorakis Vancouver, B.C.
Secretary Partner, McMillan LLP (lawyers)
Christopher A. Virostek North Vancouver, B.C.
Vice-President, Finance and Chief Financial Officer
Chuck H. Watkins Memphis, Tennessee
Vice-President, U.S. Lumber Manufacturing
- 27 -
Each officer has held the same or a similar office with the organization indicated or a predecessor thereof for the last five years except for Ted Seraphim (see disclosure under “Directors”); Raymond W. Ferris, who before February 15, 2016 was our Vice-President, Wood Products; Brian A. Balkwill, who before February 15, 2016 was our General Manager, Canadian Lumber, before December 1, 2014 was our General Manager, Engineered Wood and before April 1, 2012 was our General Manager, Sundre sawmill; Keith D. Carter, who before February 15, 2016 was our General Manager, Pulp Operations, before September 1, 2014 was our Operations Manager, Mechanical Pulp and before February 1, 2014 was our General Manager, Quesnel River Pulp; Larry E. Gardner, who before February 16, 2016 was our General Manager, Canadian Woodlands and before December 1, 2014 was our Chief Forester, British Columbia; James W. Gorman, who before May 19, 2015 was President and Chief Executive Officer of the Council of Forest Industries and before September 16, 2013 served in a number of senior leadership roles with the Government of British Columbia; Rodger M. Hutchinson, who before February 13, 2014 was our Vice-President, Corporate Controller; Christopher D. McIver, who before February 16, 2016 was our Vice-President, Lumber Sales and Corporate Development; Sean P. McLaren, who before February 15, 2016 was our Vice-President, U.S. Lumber Operations; Christopher A. Virostek, who before April 1, 2017 was the Senior Vice-President of Strategy and Corporate Development of Masonite International Corporation; and Chuck H. Watkins, who before February 15, 2016 was our General Manager, U.S. Lumber Manufacturing, before August 18, 2015 was our Regional Manager, U.S. Lumber, before December 6, 2013 was our Engineering and Technical Manager, U.S. lumber and before September 24, 2012 was Director of Operations at Rex Lumber Corporation.
Shareholdings of Directors and Officers
The directors and officers of the Company as a group, beneficially owned or controlled or directed, directly or indirectly, the following shares of the Company: December 31, 2017 December 31, 2016 Common shares 1,395,821 1,461,762 % of total Common shares 2% 2% Class B Common shares 78,728 78,728 % of total Class B Common shares 3% 3% % of all shares outstanding 2% 2%
Governance
Corporate governance is guided by our Corporate Governance Policy, a copy of which may be viewed on our web site: www.westfraser.com. The Board of Directors has established a Governance & Nominating Committee comprised of all non-management directors. The Committee provides support for the stewardship and governance role of the Board in reviewing and making recommendations on the composition of the Board, the functioning of the Board and its committees, succession planning and all other corporate governance matters and practices. On the occasion of each regularly-scheduled meeting of the Board in 2017, the Committee met without management representatives present and reviewed these and other issues.
- 28 -
The Corporate Governance Policy includes a Code of Conduct which sets out our policies and requirements relating to, among other categories, legal compliance, safety, environmental stewardship, human rights, anti-corruption and whistleblowing. Additional information is available on our website www.westfraser.com under Corporate Governance.
Audit Committee
The Audit Committee of our Board of Directors assists the Board in fulfilling its responsibility to oversee our financial reporting and audit process. The full text of the Audit Committee’s Charter is attached as Schedule 1.
Members
The following identifies each current member of the Audit Committee, and the education and experience of each member that is relevant to the performance of the member’s responsibilities as an Audit Committee member. All members of the Audit Committee are considered “independent” and “financially literate” within the meaning of NI 52-110.
Reid E. Carter
Mr. Carter holds a combined undergraduate degree in Forestry and Biology and a master’s degree in Forest Soils. He is president of a large timberlands investment firm and has been involved with that firm and related firms in various senior roles for the last 14 years. Prior to that he served as National Bank Financial’s Paper and Forest Products Analyst.
Gerald J. Miller
Mr. Miller, who holds a Bachelor of Commerce, is a Chartered Professional Accountant, Chartered Accountant. He spent 25 years in various roles at West Fraser until his retirement in 2011. While at West Fraser he served in a number of executive positions including Vice-President Finance and Chief Financial Officer. Mr. Miller is currently the Chair of the audit committee of Granite Real Estate Investment Trust.
Janice G. Rennie
Ms. Rennie, who holds a Bachelor of Commerce, is a Chartered Professional Accountant, Chartered Accountant. She was elected as Fellow of the Chartered Accountants in 1998. Ms. Rennie has chaired or been a member of several audit committees of public companies in the past and currently is a member of the audit committees of Methanex Corporation, Major Drilling Group International Inc. and WestJet Airlines Ltd.
Gillian D. Winckler
Ms. Winckler, who holds a Bachelor of Science and Bachelor of Commerce obtained in South Africa, is a Chartered Accountant (South Africa). Ms. Winckler worked in the audit profession for five years, in corporate finance for five years, and in a number of executive positions with Coalspur Limited and BHP Billiton. Ms. Winckler is currently a member of the audit committee of Pan American Silver Corporation.
- 29 -
Pre-Approval Policies and Procedures
The Audit Committee has adopted a policy that sets out the pre-approval requirements related to services to be performed by our independent auditors. The policy provides that the Committee will annually review proposed audit, audit-related, tax and other services (to be submitted by the Chief Financial Officer and the independent auditor), and will provide general approval of described services, usually including specific maximum fee amounts.
Unless a service has received general pre-approval, it will require specific pre-approval by the Committee. The Committee is permitted to delegate pre-approval authority to any of its members. The Committee reports on the pre-approval process to the full Board of Directors from time to time.
Fees Paid to Auditors ($ thousands) 2017 2016 Audit Fees1 854 833 Audit-Related Fees2 162 160 Tax Fees 548 326 Other 50 85
1. Represents actual and estimated fees related to fiscal year ends. 2. For assurance and related services that are reasonably related to the performance of the audit but are not reported as “Audit Fees”.
Material Contracts
1. On October 15, 2014, we issued US$300 million of fixed-rate senior unsecured notes due October 15, 2024 pursuant to a private placement in the U.S. The notes bear interest of 4.35% with semi-annual payments commencing on April 15, 2015 and are redeemable, in whole or in part, at our option at any time. In the event of a change in control in respect of the Company which is followed within 60 days by ratings downgrades to below investment grade in certain circumstances, unless we have exercised the right to redeem all of the notes, each holder will have the right to require us to repurchase all or any part of such holder’s notes at a purchase price in cash equal to 101% of the principal amount of the notes plus any accrued and unpaid interest.
2. On August 25, 2017, we replaced our existing 2007 Credit Agreement with a new 2017 Credit Agreement. The new credit agreement is comprised of a CDN$500 million committed revolving credit facility and a US$200 million five year non-revolving term acquisition facility which expires on August 25, 2022. The committed revolving credit facility provides for floating rates of interest based on Prime, Base Rate Advances, Bankers’ Acceptances or LIBOR Advances at our option. The five year non-revolving term facility provides for floating rates of interest based on Base Rate Advances or LIBOR Advances at our option. On August 28, 2017 we borrowed US$200 million under the non-revolving term facility to fund part of the Gilman Acquisition. These borrowings are repayable at any time, in whole or in part, at our option and without penalty but cannot be redrawn after payment.
3. On July 26, 2017, we entered into a share purchase agreement to acquire from the Howard Gilman Foundation and other shareholders, the Gilman Companies which owned six sawmills and a finger joint mill in Florida and Georgia as well as an administrative office in St.
- 30 -
Marys, Georgia. The Gilman Acquisition was completed on August 31, 2017 for net cash consideration of $526 million (US$419 million).
Additional Information
Additional information, including directors’ and officers’ remuneration and indebtedness, principal holders of our securities and securities authorized for issuance under equity compensation plans, will be contained in the Information Circular for the annual general meeting of the Company to be held on April 19, 2018. Additional financial information is provided in our annual consolidated financial statements and Management’s Discussion & Analysis for the year ended December 31, 2017.
Copies of our Annual Report, which will include this Annual Information Form and the documents incorporated by reference herein, our annual consolidated financial statements (including the auditor’s report) for the year ended December 31, 2017 and our Information Circular may be obtained at any time upon request from us once these documents have been published, but we may require the payment of a reasonable charge if the request is made by a person who is not a security holder of the Company.
This Annual Information Form, our Annual Report (once published) and additional information concerning the Company may also be obtained on our website www.westfraser.com and on the System for Electronic Document Analysis and Retrieval (“SEDAR”) at www.sedar.com.
- 31 -
Schedule 1 – Audit Committee Charter
The Audit Committee Charter, which is set out below, was approved by the Board on September 12, 2017.
General Mandate
To assist the Board in fulfilling its responsibility to oversee the Company’s financial reporting and audit processes, its system of internal controls and its process for monitoring compliance with applicable financial reporting and disclosure laws and its own policies.
Responsibilities
The Committee will carry out the following responsibilities:
Financial Statements
Review significant accounting and financial reporting issues, including complex or unusual transactions, significant contingencies and highly judgmental areas, and recent professional and regulatory pronouncements, and understand their impact on the Company’s financial statements.
Review the interim financial reports (including financial statements, management’s discussion and analysis and related news releases) with management and the auditors, consider whether they are complete and consistent with the information known to Committee members and either provide a recommendation to the Board with respect to the approval of the interim financial reports or, if so delegated by the Board, approve the interim financial reports and the filing of the same together with all required documents and information with regulators.
Understand how management develops interim financial information, and the nature and extent of auditor involvement.
Review with management and the auditors the results of the audit, including any difficulties encountered.
Review the annual financial statements, the annual management discussion and analysis and related news releases, and consider whether they are complete, consistent with information known to Committee members, and reflect appropriate accounting principles, and provide a recommendation to the Board with respect to the approval of the statements, the management discussion and analysis and the news release.
Review with management and the auditors all matters required to be communicated to the Committee under generally accepted auditing standards.
Internal Control
Require management of the Company to implement and maintain appropriate internal control procedures over annual and interim financial reporting.
Review with management and auditors the adequacy and effectiveness of the Company’s internal control over annual and interim financial reporting, including information technology security and control and controls related to the prevention and detection of fraud and improper or illegal transactions or payments, the status of the remediation of any identified control deficiencies, and elicit recommendations for improvements.
Understand the scope of the auditors’ review of internal control over financial reporting, and obtain and review reports on significant findings and recommendations, including respecting the Company’s accounting principles or changes to such principles or their application and the treatment of financial information discussed with management, together with management’s responses.
- 32 -
Audit
Review the auditors’ proposed audit scope and approach.
Review the performance of the auditors, and provide a recommendation to the Board with respect to the nomination of the auditors for appointment and remuneration.
Review and confirm the independence of the auditors by obtaining statements from the auditors on relationships between the auditors and the Company, including non-audit services, and discussing the relationships with the auditors.
Periodically evaluate the need for the establishment of an internal audit function and make appropriate recommendations to the Board.
Compliance
Review with management the adequacy and effectiveness of the Company’s systems for monitoring compliance with financial reporting and disclosure laws, including the Company’s disclosure controls and procedures, and the results of management’s investigation and follow-up (including disciplinary action) of any instances of non-compliance.
Review the findings of any examinations by regulatory agencies, and any auditor observations.
Obtain regular updates from management and Company legal counsel regarding compliance matters.
Reporting Requirements
Regularly report to the Board about Committee activities, issues and related recommendations.
Provide an open avenue of communication between the auditors and the Board.
Review any reports the Company issues that relate to Committee responsibilities.
Other Responsibilities
Institute and oversee special investigations as needed.
Develop and implement a policy for the approval of the provision of non-audit services by the auditors and assessing the independence of the auditors in the context of these engagements.
Establish procedures for: (a) the receipt, retention and treatment of complaints received regarding non-compliance with the Company’s Code of Conduct, violations of laws or regulations, or concerns regarding accounting, internal accounting controls or auditing matters; and (b) the confidential, anonymous submission by officers or employees of the Company or by other persons of concerns regarding questionable accounting, auditing or financial reporting and disclosure matters or non-compliance with the Company’s Code of Conduct or other matters that are of a sensitive or “whistleblower” nature.
Assist the Board with its responsibility to, with the advice of management, identify the principal financial and audit risks of the Company and establish systems and procedures to ensure these principal financial and audit risks are monitored, and to make recommendations to the Board.
Annually review the expenses of the Chief Executive Officer.
Perform other activities related to this charter as requested by the Board.
- 33 -
Review and assess the adequacy of this charter annually, requesting Board approval for proposed changes.
Review terms of any Code of Conduct established by the Board and respond to any related compliance issues.
Confirm annually to the Board that all responsibilities outlined in this charter have been carried out.
Qualifications and Procedures
The composition of the Committee will comply with applicable laws including requirements for independence, unrelated to management, financial literacy and audit experience.
The Chair of the Committee will be designated by the Board.
The Committee will meet at least four times annually, and more frequently as circumstances dictate, and the CFO and a representative of the auditors should be available on request to attend all meetings.
The Committee should meet privately in executive session with representatives of each of management and of the auditors to discuss any matters of concern to the Committee or such members, including any post-audit management letter.
The Committee may retain any outside advisor at the expense of the Company, without the Board’s approval, at any time and has the authority to determine any such advisor’s fees and other retention terms.
Minutes of each meeting should be prepared, approved by the Committee and circulated to the full Board.
- 34 -
MANAGEMENT’S DISCUSSION & ANALYSIS
Introduction and Interpretation
This discussion and analysis by West Fraser’s management (“MD&A”) of West Fraser’s financial performance during 2017 and the fourth quarter of 2017 should be read in conjunction with the 2017 annual audited consolidated financial statements and accompanying notes (the “Financial Statements”). Dollar amounts are expressed in Canadian currency, unless otherwise indicated.
The financial information contained in this MD&A has been prepared in accordance with International Financial Reporting Standards (“IFRS”).
This MD&A contains historical information, descriptions of current circumstances and statements about potential future developments and anticipated financial results. The latter, which are forward-looking statements, are presented to provide reasonable guidance to the reader but their accuracy depends on a number of assumptions and is subject to various risks and uncertainties. Forward-looking statements are included under the headings “Recent Developments – Softwood lumber dispute” (administrative review and adjustments of duty rates), “Recent Developments – U.S. Tax Reform” (expectations for U.S. federal income tax payments and tax expense), “Capital Expenditures” (expected completion of sawmill rebuilds and upgrades) and “Business Outlook”. Actual outcomes and results of these statements will depend on a number of factors including those matters described under “Risks and Uncertainties”, and may differ materially from those anticipated or projected. Accordingly, readers should exercise caution in relying upon forward-looking statements and we undertake no obligation to publicly revise them to reflect subsequent events or circumstances except as required by applicable securities laws.
Throughout this MD&A reference is made to Adjusted EBITDA, Adjusted earnings and Adjusted earnings per share and net debt to total capital ratio (collectively “these measures”), calculated as shown under the heading “Non-IFRS Measures”. We believe that, in addition to earnings, these measures are useful performance indicators. These measures are not generally accepted earnings measures under IFRS and do not have standardized meanings prescribed by IFRS. Investors are cautioned that none of these measures should be considered as an alternative to earnings, earnings per share (“EPS”) or cash flow, as determined in accordance with IFRS. As there is no standardized method of calculating any of these measures, our method of calculating each of them may differ from the methods used by other entities and, accordingly, our use of any of these measures may not be directly comparable to similarly titled measures used by other entities.
This MD&A includes references to benchmark prices over selected periods for products of the type produced by West Fraser. These benchmark prices do not necessarily reflect the prices obtained by West Fraser for those products during such period. The information in this MD&A is as at February 14, 2018 unless otherwise indicated.
For definitions of various abbreviations and technical terms used in this MD&A please see the Glossary of Industry Terms found in our most recent Annual Report.
- 35 -
Recent Developments
Softwood lumber dispute
On November 25, 2016 a coalition of U.S. lumber producers petitioned the U.S. Department of Commerce (“USDOC”) and the U.S. International Trade Commission (“USITC”) to investigate alleged subsidies to Canadian softwood lumber producers and levy countervailing and antidumping duties against Canadian softwood lumber imports. We were chosen by the USDOC as a “mandatory respondent” to both the countervailing and antidumping investigations and as a result have received unique company specific rates.
On April 24, 2017, the USDOC issued its preliminary determination in the countervailing duty (“CVD”) investigation and imposed a company specific preliminary rate of 24.12% to be posted by cash deposits on the exports from Canada of softwood lumber to the U.S. on or after April 28, 2017. On June 26, 2017, the USDOC issued its preliminary determination in the antidumping duty (“ADD”) investigation and imposed a company specific preliminary rate of 6.76% to be posted by cash deposits on the exports from Canada of softwood lumber to the U.S. on or after June 30, 2017. The requirement that we deposit CVD was suspended on August 24, 2017 until final determination was published by the USITC. On December 4, 2017 the USDOC amended our CVD rate to 17.99% and our ADD rate to 5.57%. Effective December 28, 2017 we began posting cash deposits for CVD and effective December 4, 2017 we began posting cash deposits for ADD at the revised rates. The CVD and ADD rates are subject to further adjustment through administrative reviews to be completed by the USDOC. The administrative reviews for each of CVD and ADD are expected to commence in January 2019 and cover the periods from initiation of duties to December 31, 2017 for CVD and to November 30, 2018 for ADD. The reviews may not be finalized until June 2020 or later and the results are subject to appeals.
Duties of $48 million have been expensed for 2017 with an additional $37 million of duty deposits recorded as a long-term asset on our balance sheet. The expensed amount is comprised of CVD at the final rate assigned of 17.99% and ADD at our estimated rate. Our estimated rate was determined based on applying the USDOC methodology to our actual financial results for June 30, 2017 to December 31, 2017.
We, together with other Canadian forest product companies and the Canadian federal and provincial governments (the “Canadian Interests”) categorically deny the allegations by the coalition of U.S. lumber producers and disagree with the countervailing and antidumping determinations by the USDOC and the USITC. The Canadian Interests continue to aggressively defend the Canadian industry in this trade dispute and have appealed the decisions to North America Free Trade Agreement panels and the World Trade Organization.
The duty rates are subject to change based on administrative reviews and appeals available to us. Notwithstanding the deposit rates assigned under the investigations, our final liability for the assessment of CVD and ADD will not be determined until each annual administrative review process is complete and related appeal processes are concluded.
- 36 -
Forest fires in British Columbia
The 2017 wildfire season is considered to have been the worst in British Columbia’s history with the provincial state of emergency lasting from July 7 to September 15, 2017. Many communities were evacuated including those where our 100 Mile House, Williams Lake and Chasm facilities are located. We were fortunate that our facilities were undamaged but the disruption caused us to lose 55 MMFBM of lumber production and 15 MSF of plywood production while the mills were closed.
Throughout this period our British Columbia facilities faced logging restrictions, transportation delays and many of our employees were displaced. As a result of the interruptions, log inventories remain below target levels at many locations for this time of the year.
The province of British Columbia estimates that approximately 1 million hectares of timber has been lost due to the forest fires. We are working with the government to revise our current and long-term logging plans, including plans to access and salvage burned timber. At this time it is too early to gauge the long-term impact on lumber operations in British Columbia.
Gilman Acquisition
On August 31, 2017 we completed the acquisition of six sawmills and a finger-joint mill (the “Gilman Acquisition”) for net cash consideration of $526 million (US$419 million). These SYP mills are located in Florida and Georgia and have an annual lumber production capacity of approximately 700 million board feet. After considering estimated tax benefits, the purchase price represents approximately six times trailing 12 months EBITDA of the acquired operations.
The Gilman Acquisition was financed with cash on hand, borrowings under our revolving credit facility, and a new $250 million (US$200 million) acquisition term loan which matures on August 25, 2022, and is pre-payable at our option without penalty.
This acquisition represents an important step in increasing our geographic diversification through an expansion of our U.S. lumber operations. We are pleased to have acquired a group of high quality sawmills in a good timber basket, with high operating margins, close to a large customer base and with a strong management team that is excited to join West Fraser. Integration of the acquired mills is well underway with the migration of information technology systems and organizational alignment largely completed.
U.S. Tax Reform
On December 21, 2017 the U.S. federal government enacted the Tax Cuts and Jobs Act (“U.S. Tax Reform”). The significant features that impact us are the following:
1. The federal corporate tax rate is permanently reduced from 35% to 21% for tax years beginning after 2017;
2. Businesses will be allowed to immediately expense the cost of qualified property acquired and placed in service after September 27, 2017 and before January 1, 2023 (to be phased out thereafter); and
- 37 -
3. The deduction for certain related party payments will be denied.
U.S. Tax Reform is expected to be positive for us due to the tax rate reduction and our capital expenditure plans for our U.S. operations. With the immediate deduction for qualified expenditures and our remaining net operating loss carryforwards we expect federal income tax payments to be minimal over the near term. In addition the tax expense related to our U.S. operations will be reduced due to the lower tax rate. The benefit of the lower tax rate is offset in part by the elimination of the deduction of certain interest expenses.
Summary Information - Annual Results
Financial Comparisons ($millions, except as otherwise indicated) Year ended December 31 2017 2016 2015 Sales by segment Lumber 3,671 3,145 2,764 Panels 600 529 554 Pulp & Paper 988 887 900 Intracompany fibre sales (125) (111) (118) Total 5,134 4,450 4,100 Adjusted EBITDA 1,160 674 417 Export duties (48) - - Amortization (210) (197) (191) Equity-based compensation (32) 5 23 Operating earnings 870 482 249 Operating earnings by segment Lumber 681 362 105 Panels 100 77 82 Pulp & Paper 132 42 41 Corporate and Other (43) 1 21 Total 870 482 249 Earnings 596 326 104 Basic earnings per share ($) 7.63 4.06 1.25 Diluted earnings per share ($) 7.63 3.90 0.89 Cash dividends declared per share ($) 0.36 0.28 0.28 Total assets 4,517 3,600 3,635 Long-term debt1 636 413 423 Cdn$1.00 converted to US$ – average 0.771 0.755 0.782
1. Includes current portion of long-term debt.
- 38 -
Selected Quarterly Information ($millions, except earnings per share (“EPS”) amounts which are in $)
Q4-17 Q3-17 Q2-17 Q1-17 Q4-16 Q3-16 Q2-16 Q1-16 Sales 1,376 1,247 1,322 1,189 1,107 1,155 1,111 1,077 Earnings 207 120 146 123 79 107 98 42 Basic EPS 2.66 1.53 1.86 1.58 1.01 1.35 1.22 0.51 Diluted EPS 2.66 1.53 1.86 1.58 1.01 1.35 0.86 0.50
Adjusted Earnings and Adjusted Basic Earnings Per Share ($millions, except EPS amounts which are in $) 2017 2016 Earnings 596 326 Add: Export duties 48 - Equity-based compensation 32 (5) Exchange gain on long-term financing (10) (4) Loss on power agreements - 27 Insurance gain on disposal of equipment (7) (8) Net tax effect on the above adjustments (6) (6) Re-measurement of deferred income tax assets and
liabilities 6 - Adjusted earnings 659 330 Adjusted basic EPS1 8.44 4.11
1. Adjusted basic EPS is calculated by dividing Adjusted earnings by the basic weighted average shares outstanding.
Earnings in 2017 increased compared to results for 2016. Our results include several significant non-operational items that are identified as adjustments in the above table. After taking into account these adjustments, we generated Adjusted earnings of $659 million compared to $330 million in 2016. For a description of operational results see “Discussion & Analysis by Product Segment” which follows this section.
Export duties of $48 million were expensed in the year related to countervailing and antidumping duties levied by the USDOC in respect of U.S. lumber producers’ allegations of subsidies and dumping against Canadian softwood lumber imports. We believe the allegations are unwarranted and that the rates applied will be adjusted. See “Softwood lumber dispute” under the heading “Recent Developments” in this MD&A for further information.
In 2017 an expense of $32 million was recorded related to equity-based compensation compared to a recovery of $5 million in 2016. Our equity-based compensation includes our share purchase option, phantom share unit, and directors’ deferred share unit plans (the “Plans”), all of which have been partially hedged by an equity derivatives contract. The equity derivatives contract had the effect of hedging 1,000,000 equity-based securities at a share price of $46.02. The Plans are fair valued each period end and the resulting expense or recovery is recorded over the related vesting period. Our fair valuation models consider various factors with the most significant being the change in the market value of our shares from the beginning to the end of the relevant
- 39 -
period. The market value of the Company’s shares increased by 62%, from $48.01 per share at the end of 2016 to $77.57 per share at the end of 2017. The expense or recovery does not necessarily represent the actual amount that will ultimately be paid in respect of options and units.
Any change in the value of the Canadian dollar relative to the value of the U.S. dollar results in the revaluation of our U.S. dollar-denominated assets and liabilities. The results of these revaluations are included in other income. The Canadian dollar was stronger against the U.S. dollar at the close of 2017 compared to the close of 2016 resulting in a foreign exchange gain on long-term financing as shown in the above table. Exchange gains or losses on working capital are identified under “Other Non-operational Items” below.
During 2016 we terminated and finalized the settlement for our three-year power strip agreement and our Power Purchase Agreements. These agreements had provided us with a portion of the electricity generated from two power plants in Alberta at substantially predetermined prices. The termination resulted in a $27 million loss that was recorded in other income in 2016.
An insurance gain related to involuntary disposal of equipment was recorded in 2017 and 2016. The 2017 gain relates to equipment at our jointly-owned NBSK plant in Quesnel and the 2016 gain related to our WestPine MDF facility.
U.S. Tax Reform and an increase in the province of British Columbia tax rate from 11% to 12% were substantively enacted in 2017 resulting in a one-time increase to deferred income tax expense of $6 million associated with the re-measurement of deferred income tax assets and liabilities.
Other Non-operational Items
Other income includes an exchange loss on working capital of $10 million compared to $4 million in 2016.
The results of the current year include a provision for income tax of $250 million compared to $118 million in 2016. The effective tax rate was 30% in the current year compared to 27% in 2016. Note 18 to the Financial Statements provides a reconciliation of income taxes calculated at the British Columbia statutory rate to the income tax expense.
The funded position of our defined benefit pension plans and other retirement benefit plans is estimated at the end of each period. The funded position, as shown in Note 13 to the Financial Statements, is determined by subtracting the value of plan assets from the value of plan obligations. The effect of a decrease in the discount rate used to calculate plan liabilities from the beginning of the current year, partially offset by the actual rate of return on assets that was higher than the discount rate, resulted in an after-tax actuarial loss of $26 million which is included in other comprehensive earnings.
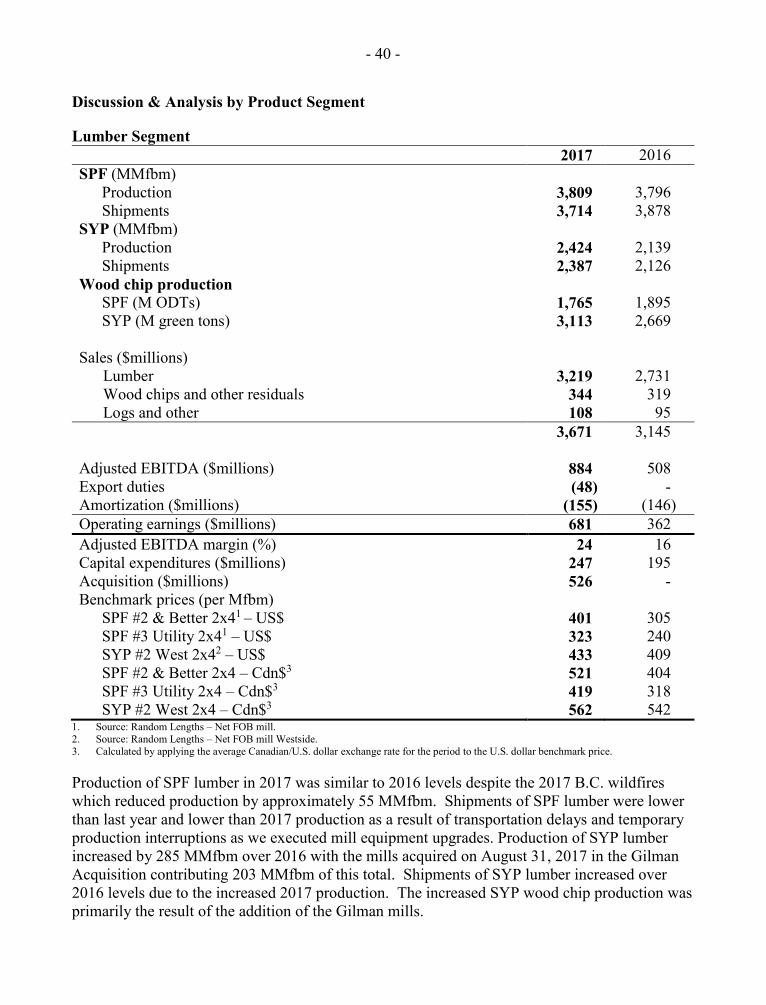
- 40 -
Discussion & Analysis by Product Segment
Lumber Segment 2017 2016 SPF (MMfbm) Production 3,809 3,796 Shipments 3,714 3,878 SYP (MMfbm) Production 2,424 2,139 Shipments 2,387 2,126 Wood chip production SPF (M ODTs) 1,765 1,895 SYP (M green tons) 3,113 2,669 Sales ($millions)
Lumber 3,219 2,731 Wood chips and other residuals 344 319 Logs and other 108 95
3,671 3,145 Adjusted EBITDA ($millions) 884 508 Export duties (48) - Amortization ($millions) (155) (146) Operating earnings ($millions) 681 362 Adjusted EBITDA margin (%) 24 16 Capital expenditures ($millions) 247 195 Acquisition ($millions) 526 - Benchmark prices (per Mfbm) SPF #2 & Better 2x41 – US$ 401 305 SPF #3 Utility 2x41 – US$ 323 240 SYP #2 West 2x42 – US$ 433 409 SPF #2 & Better 2x4 – Cdn$3 521 404 SPF #3 Utility 2x4 – Cdn$3 419 318 SYP #2 West 2x4 – Cdn$3 562 542
1. Source: Random Lengths – Net FOB mill. 2. Source: Random Lengths – Net FOB mill Westside. 3. Calculated by applying the average Canadian/U.S. dollar exchange rate for the period to the U.S. dollar benchmark price.
Production of SPF lumber in 2017 was similar to 2016 levels despite the 2017 B.C. wildfires which reduced production by approximately 55 MMfbm. Shipments of SPF lumber were lower than last year and lower than 2017 production as a result of transportation delays and temporary production interruptions as we executed mill equipment upgrades. Production of SYP lumber increased by 285 MMfbm over 2016 with the mills acquired on August 31, 2017 in the Gilman Acquisition contributing 203 MMfbm of this total. Shipments of SYP lumber increased over 2016 levels due to the increased 2017 production. The increased SYP wood chip production was primarily the result of the addition of the Gilman mills.
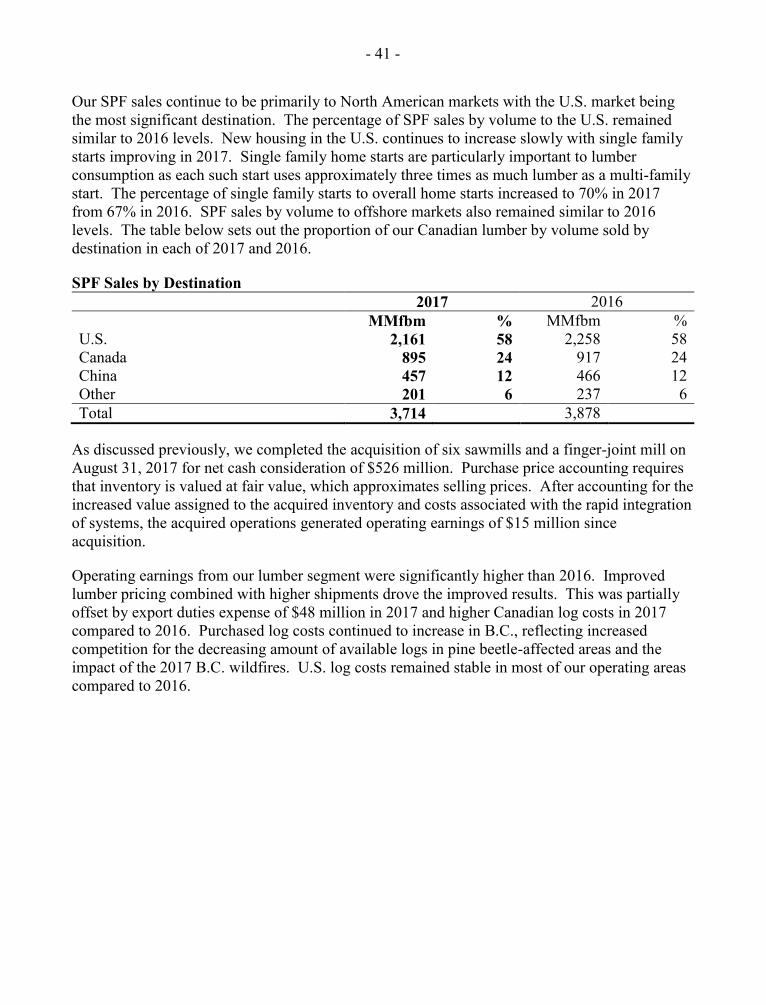
- 41 -
Our SPF sales continue to be primarily to North American markets with the U.S. market being the most significant destination. The percentage of SPF sales by volume to the U.S. remained similar to 2016 levels. New housing in the U.S. continues to increase slowly with single family starts improving in 2017. Single family home starts are particularly important to lumber consumption as each such start uses approximately three times as much lumber as a multi-family start. The percentage of single family starts to overall home starts increased to 70% in 2017 from 67% in 2016. SPF sales by volume to offshore markets also remained similar to 2016 levels. The table below sets out the proportion of our Canadian lumber by volume sold by destination in each of 2017 and 2016.
SPF Sales by Destination 2017 2016 MMfbm % MMfbm % U.S. 2,161 58 2,258 58 Canada 895 24 917 24 China 457 12 466 12 Other 201 6 237 6 Total 3,714 3,878
As discussed previously, we completed the acquisition of six sawmills and a finger-joint mill on August 31, 2017 for net cash consideration of $526 million. Purchase price accounting requires that inventory is valued at fair value, which approximates selling prices. After accounting for the increased value assigned to the acquired inventory and costs associated with the rapid integration of systems, the acquired operations generated operating earnings of $15 million since acquisition.
Operating earnings from our lumber segment were significantly higher than 2016. Improved lumber pricing combined with higher shipments drove the improved results. This was partially offset by export duties expense of $48 million in 2017 and higher Canadian log costs in 2017 compared to 2016. Purchased log costs continued to increase in B.C., reflecting increased competition for the decreasing amount of available logs in pine beetle-affected areas and the impact of the 2017 B.C. wildfires. U.S. log costs remained stable in most of our operating areas compared to 2016.
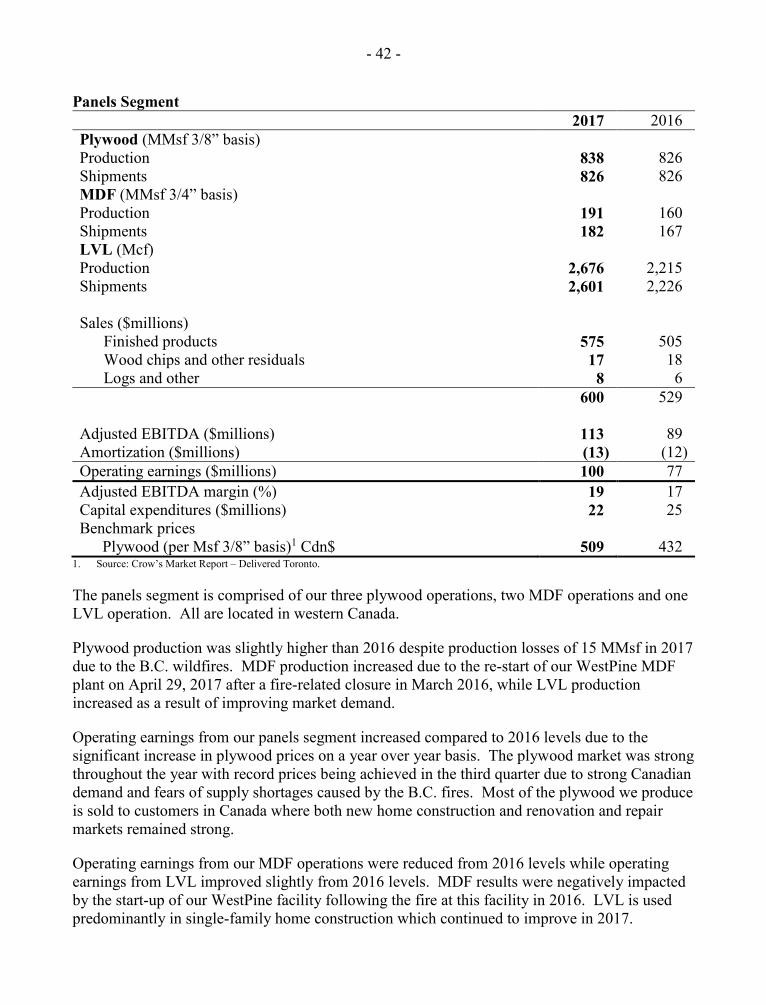
- 42 -
Panels Segment 2017 2016 Plywood (MMsf 3/8” basis) Production 838 826 Shipments 826 826 MDF (MMsf 3/4” basis) Production 191 160 Shipments 182 167 LVL (Mcf) Production 2,676 2,215 Shipments 2,601 2,226 Sales ($millions)
Finished products 575 505 Wood chips and other residuals 17 18 Logs and other 8 6
600 529 Adjusted EBITDA ($millions) 113 89 Amortization ($millions) (13) (12) Operating earnings ($millions) 100 77 Adjusted EBITDA margin (%) 19 17 Capital expenditures ($millions) 22 25 Benchmark prices Plywood (per Msf 3/8” basis)1 Cdn$ 509 432
1. Source: Crow’s Market Report – Delivered Toronto.
The panels segment is comprised of our three plywood operations, two MDF operations and one LVL operation. All are located in western Canada.
Plywood production was slightly higher than 2016 despite production losses of 15 MMsf in 2017 due to the B.C. wildfires. MDF production increased due to the re-start of our WestPine MDF plant on April 29, 2017 after a fire-related closure in March 2016, while LVL production increased as a result of improving market demand.
Operating earnings from our panels segment increased compared to 2016 levels due to the significant increase in plywood prices on a year over year basis. The plywood market was strong throughout the year with record prices being achieved in the third quarter due to strong Canadian demand and fears of supply shortages caused by the B.C. fires. Most of the plywood we produce is sold to customers in Canada where both new home construction and renovation and repair markets remained strong.
Operating earnings from our MDF operations were reduced from 2016 levels while operating earnings from LVL improved slightly from 2016 levels. MDF results were negatively impacted by the start-up of our WestPine facility following the fire at this facility in 2016. LVL is used predominantly in single-family home construction which continued to improve in 2017.
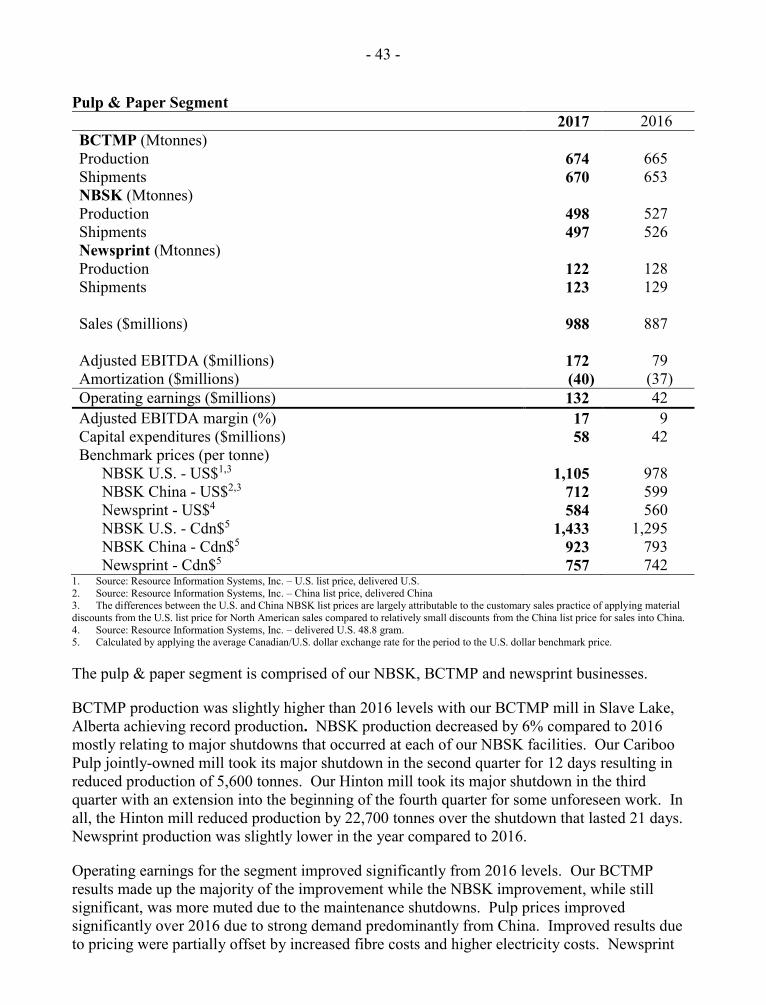
- 43 -
Pulp & Paper Segment 2017 2016 BCTMP (Mtonnes) Production 674 665 Shipments 670 653 NBSK (Mtonnes) Production 498 527 Shipments 497 526 Newsprint (Mtonnes) Production 122 128 Shipments 123 129 Sales ($millions) 988 887 Adjusted EBITDA ($millions) 172 79 Amortization ($millions) (40) (37) Operating earnings ($millions) 132 42 Adjusted EBITDA margin (%) 17 9 Capital expenditures ($millions) 58 42 Benchmark prices (per tonne) NBSK U.S. - US$1,3 1,105 978 NBSK China - US$2,3 712 599 Newsprint - US$4 584 560 NBSK U.S. - Cdn$5 1,433 1,295 NBSK China - Cdn$5 923 793 Newsprint - Cdn$5 757 742
1. Source: Resource Information Systems, Inc. – U.S. list price, delivered U.S. 2. Source: Resource Information Systems, Inc. – China list price, delivered China 3. The differences between the U.S. and China NBSK list prices are largely attributable to the customary sales practice of applying material discounts from the U.S. list price for North American sales compared to relatively small discounts from the China list price for sales into China. 4. Source: Resource Information Systems, Inc. – delivered U.S. 48.8 gram. 5. Calculated by applying the average Canadian/U.S. dollar exchange rate for the period to the U.S. dollar benchmark price.
The pulp & paper segment is comprised of our NBSK, BCTMP and newsprint businesses.
BCTMP production was slightly higher than 2016 levels with our BCTMP mill in Slave Lake, Alberta achieving record production. NBSK production decreased by 6% compared to 2016 mostly relating to major shutdowns that occurred at each of our NBSK facilities. Our Cariboo Pulp jointly-owned mill took its major shutdown in the second quarter for 12 days resulting in reduced production of 5,600 tonnes. Our Hinton mill took its major shutdown in the third quarter with an extension into the beginning of the fourth quarter for some unforeseen work. In all, the Hinton mill reduced production by 22,700 tonnes over the shutdown that lasted 21 days. Newsprint production was slightly lower in the year compared to 2016.
Operating earnings for the segment improved significantly from 2016 levels. Our BCTMP results made up the majority of the improvement while the NBSK improvement, while still significant, was more muted due to the maintenance shutdowns. Pulp prices improved significantly over 2016 due to strong demand predominantly from China. Improved results due to pricing were partially offset by increased fibre costs and higher electricity costs. Newsprint
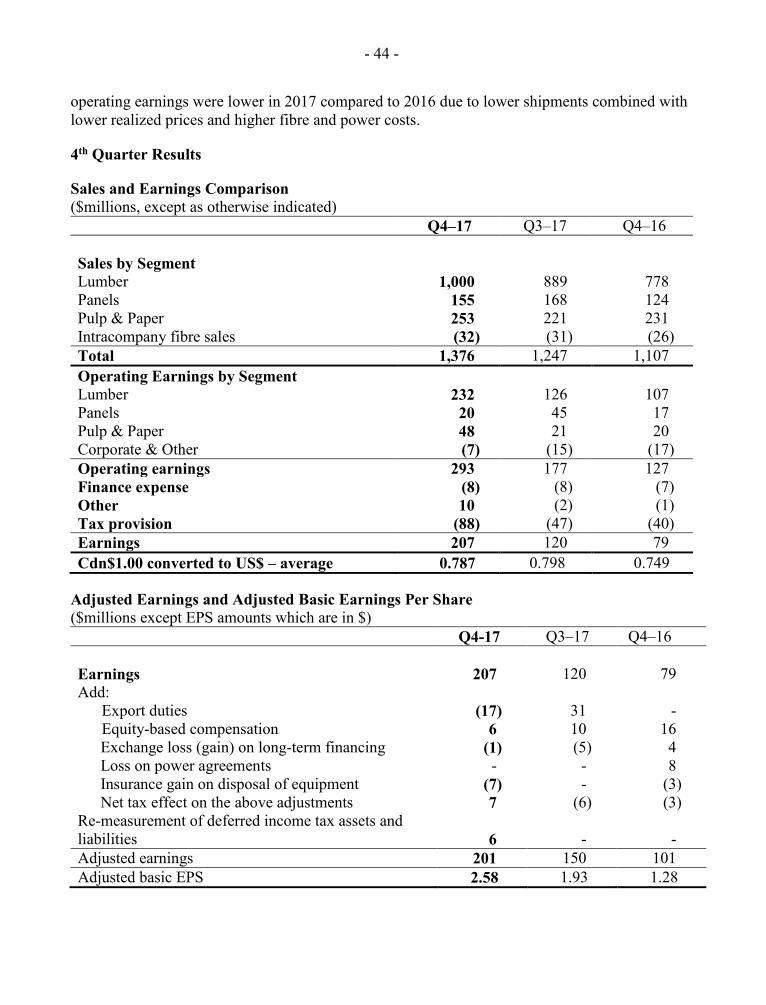
- 44 -
operating earnings were lower in 2017 compared to 2016 due to lower shipments combined with lower realized prices and higher fibre and power costs.
4th Quarter Results
Sales and Earnings Comparison ($millions, except as otherwise indicated) Q4–17 Q3–17 Q4–16 Sales by Segment Lumber 1,000 889 778 Panels 155 168 124 Pulp & Paper 253 221 231 Intracompany fibre sales (32) (31) (26) Total 1,376 1,247 1,107 Operating Earnings by Segment Lumber 232 126 107 Panels 20 45 17 Pulp & Paper 48 21 20 Corporate & Other (7) (15) (17) Operating earnings 293 177 127 Finance expense (8) (8) (7) Other 10 (2) (1) Tax provision (88) (47) (40) Earnings 207 120 79 Cdn$1.00 converted to US$ – average 0.787 0.798 0.749
Adjusted Earnings and Adjusted Basic Earnings Per Share ($millions except EPS amounts which are in $) Q4-17 Q3–17 Q4–16 Earnings 207 120 79 Add: Export duties (17) 31 - Equity-based compensation 6 10 16 Exchange loss (gain) on long-term financing (1) (5) 4 Loss on power agreements - - 8 Insurance gain on disposal of equipment (7) - (3) Net tax effect on the above adjustments 7 (6) (3) Re-measurement of deferred income tax assets and liabilities 6 - - Adjusted earnings 201 150 101 Adjusted basic EPS 2.58 1.93 1.28
- 45 -
Discussion & Analysis of Quarterly Non-operational Items
For a description of our quarterly operational results see “Discussion & Analysis by Product Segment” which follows this section.
Our results include several significant non-operational items that are identified as adjustments in the table immediately preceding this section. After taking into account the adjustments, we generated Adjusted earnings of $201 million in the fourth quarter of 2017 compared to Adjusted earnings of $150 million in the previous quarter and Adjusted earnings of $101 million in the fourth quarter of 2016.
During the fourth quarter of 2017 duty deposits of $20 million were made on account of CVD and ADD and a long-term export duty deposit receivable of $37 million was recorded. The combination of the receivable less the deposits resulted in a recovery of $17 million being recorded through income. The receivable reflects the reduction in the CVD rate from the preliminary rate of 24.12% to a final rate of 17.99% and an adjustment to reflect ADD at our estimated rate based on applying the USDOC methodology to our actual financial results for June 30, 2017 to December 31, 2017. See “Softwood lumber dispute” under the heading “Recent Developments” in this MD&A for further information.
For a description of the other key adjustments, see the corresponding section under “Annual Results” in this MD&A.
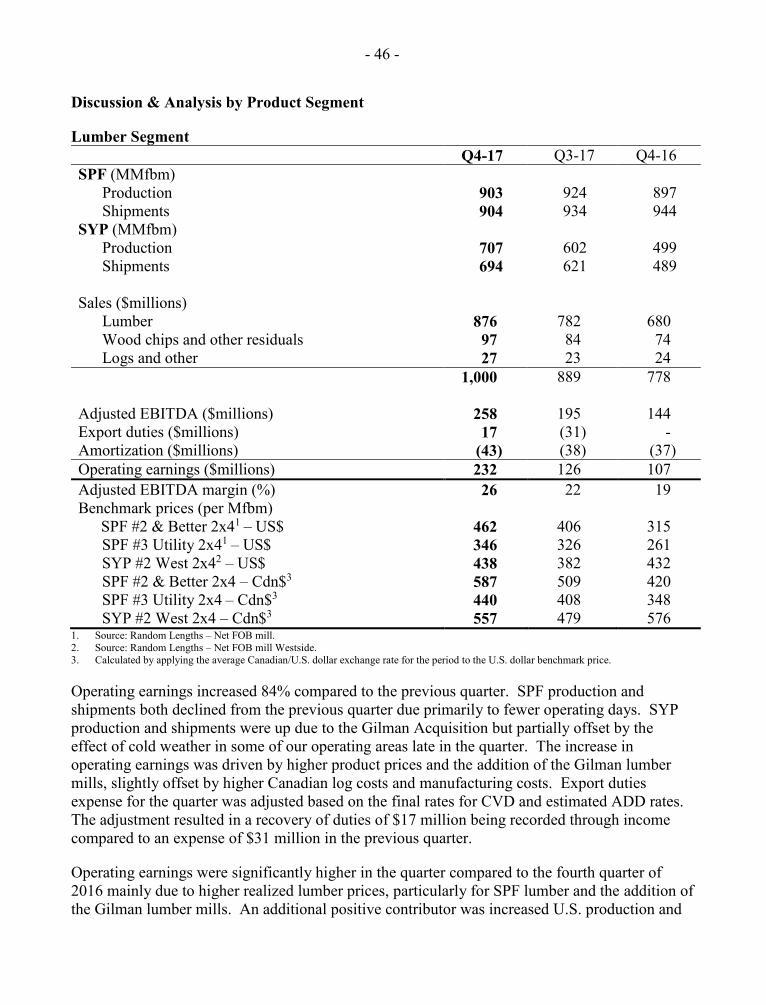
- 46 -
Discussion & Analysis by Product Segment
Lumber Segment Q4-17 Q3-17 Q4-16 SPF (MMfbm)
Production 903 924 897 Shipments 904 934 944
SYP (MMfbm) Production 707 602 499 Shipments 694 621 489
Sales ($millions)
Lumber 876 782 680 Wood chips and other residuals 97 84 74 Logs and other 27 23 24
1,000 889 778 Adjusted EBITDA ($millions) 258 195 144 Export duties ($millions) 17 (31) - Amortization ($millions) (43) (38) (37) Operating earnings ($millions) 232 126 107 Adjusted EBITDA margin (%) 26 22 19 Benchmark prices (per Mfbm) SPF #2 & Better 2x41 – US$ 462 406 315 SPF #3 Utility 2x41 – US$ 346 326 261 SYP #2 West 2x42 – US$ 438 382 432 SPF #2 & Better 2x4 – Cdn$3 587 509 420 SPF #3 Utility 2x4 – Cdn$3 440 408 348 SYP #2 West 2x4 – Cdn$3 557 479 576
1. Source: Random Lengths – Net FOB mill. 2. Source: Random Lengths – Net FOB mill Westside. 3. Calculated by applying the average Canadian/U.S. dollar exchange rate for the period to the U.S. dollar benchmark price.
Operating earnings increased 84% compared to the previous quarter. SPF production and shipments both declined from the previous quarter due primarily to fewer operating days. SYP production and shipments were up due to the Gilman Acquisition but partially offset by the effect of cold weather in some of our operating areas late in the quarter. The increase in operating earnings was driven by higher product prices and the addition of the Gilman lumber mills, slightly offset by higher Canadian log costs and manufacturing costs. Export duties expense for the quarter was adjusted based on the final rates for CVD and estimated ADD rates. The adjustment resulted in a recovery of duties of $17 million being recorded through income compared to an expense of $31 million in the previous quarter.
Operating earnings were significantly higher in the quarter compared to the fourth quarter of 2016 mainly due to higher realized lumber prices, particularly for SPF lumber and the addition of the Gilman lumber mills. An additional positive contributor was increased U.S. production and
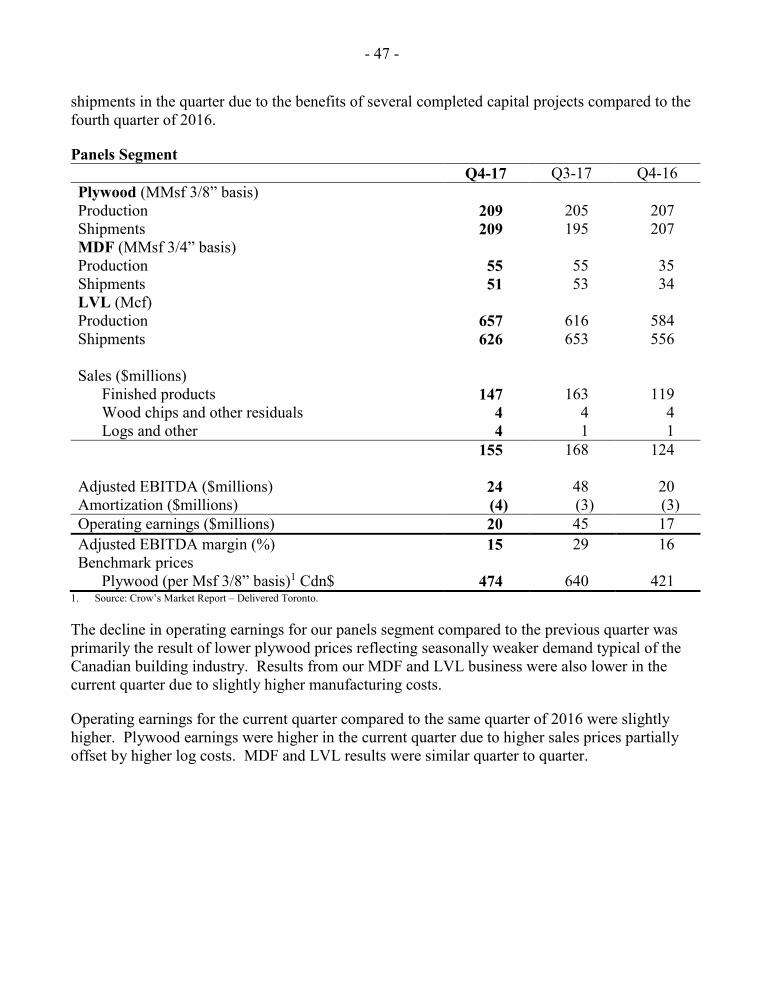
- 47 -
shipments in the quarter due to the benefits of several completed capital projects compared to the fourth quarter of 2016.
Panels Segment Q4-17 Q3-17 Q4-16 Plywood (MMsf 3/8” basis) Production 209 205 207 Shipments 209 195 207 MDF (MMsf 3/4” basis) Production 55 55 35 Shipments 51 53 34 LVL (Mcf) Production 657 616 584 Shipments 626 653 556 Sales ($millions)
Finished products 147 163 119 Wood chips and other residuals 4 4 4 Logs and other 4 1 1
155 168 124 Adjusted EBITDA ($millions) 24 48 20 Amortization ($millions) (4) (3) (3) Operating earnings ($millions) 20 45 17 Adjusted EBITDA margin (%) 15 29 16 Benchmark prices Plywood (per Msf 3/8” basis)1 Cdn$ 474 640 421
1. Source: Crow’s Market Report – Delivered Toronto.
The decline in operating earnings for our panels segment compared to the previous quarter was primarily the result of lower plywood prices reflecting seasonally weaker demand typical of the Canadian building industry. Results from our MDF and LVL business were also lower in the current quarter due to slightly higher manufacturing costs.
Operating earnings for the current quarter compared to the same quarter of 2016 were slightly higher. Plywood earnings were higher in the current quarter due to higher sales prices partially offset by higher log costs. MDF and LVL results were similar quarter to quarter.
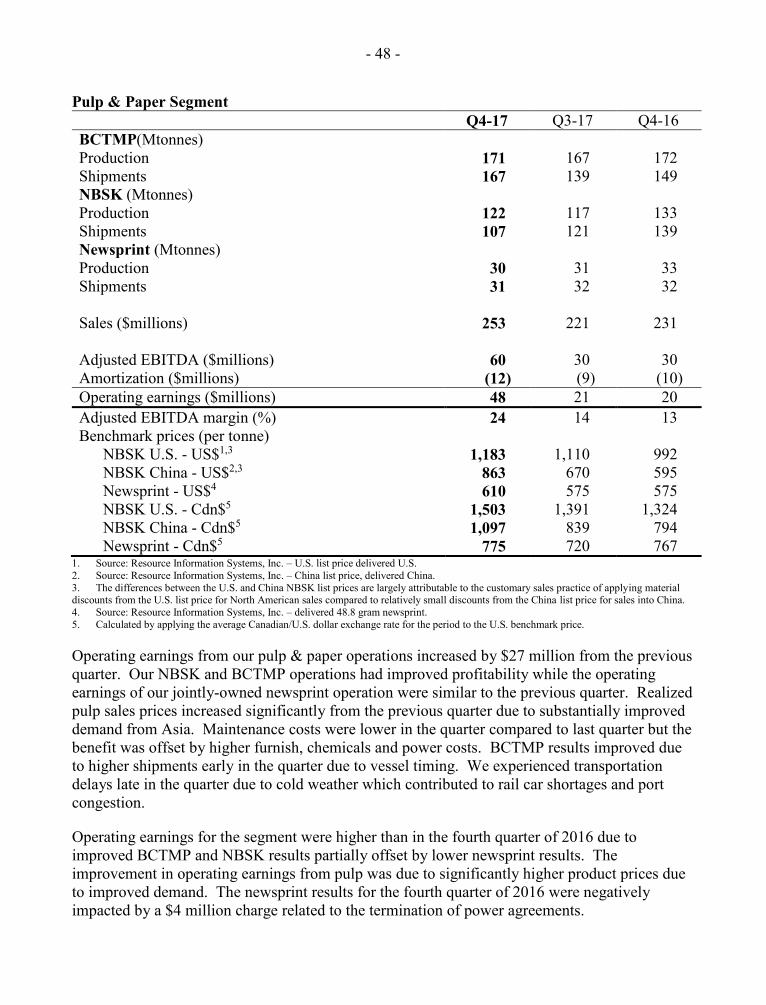
- 48 -
Pulp & Paper Segment Q4-17 Q3-17 Q4-16 BCTMP(Mtonnes) Production 171 167 172 Shipments 167 139 149 NBSK (Mtonnes) Production 122 117 133 Shipments 107 121 139 Newsprint (Mtonnes) Production 30 31 33 Shipments 31 32 32 Sales ($millions) 253 221 231 Adjusted EBITDA ($millions) 60 30 30 Amortization ($millions) (12) (9) (10) Operating earnings ($millions) 48 21 20 Adjusted EBITDA margin (%) 24 14 13 Benchmark prices (per tonne) NBSK U.S. - US$1,3 1,183 1,110 992 NBSK China - US$2,3 863 670 595 Newsprint - US$4 610 575 575 NBSK U.S. - Cdn$5 1,503 1,391 1,324 NBSK China - Cdn$5 1,097 839 794 Newsprint - Cdn$5 775 720 767
1. Source: Resource Information Systems, Inc. – U.S. list price delivered U.S. 2. Source: Resource Information Systems, Inc. – China list price, delivered China. 3. The differences between the U.S. and China NBSK list prices are largely attributable to the customary sales practice of applying material discounts from the U.S. list price for North American sales compared to relatively small discounts from the China list price for sales into China. 4. Source: Resource Information Systems, Inc. – delivered 48.8 gram newsprint. 5. Calculated by applying the average Canadian/U.S. dollar exchange rate for the period to the U.S. benchmark price.
Operating earnings from our pulp & paper operations increased by $27 million from the previous quarter. Our NBSK and BCTMP operations had improved profitability while the operating earnings of our jointly-owned newsprint operation were similar to the previous quarter. Realized pulp sales prices increased significantly from the previous quarter due to substantially improved demand from Asia. Maintenance costs were lower in the quarter compared to last quarter but the benefit was offset by higher furnish, chemicals and power costs. BCTMP results improved due to higher shipments early in the quarter due to vessel timing. We experienced transportation delays late in the quarter due to cold weather which contributed to rail car shortages and port congestion.
Operating earnings for the segment were higher than in the fourth quarter of 2016 due to improved BCTMP and NBSK results partially offset by lower newsprint results. The improvement in operating earnings from pulp was due to significantly higher product prices due to improved demand. The newsprint results for the fourth quarter of 2016 were negatively impacted by a $4 million charge related to the termination of power agreements.
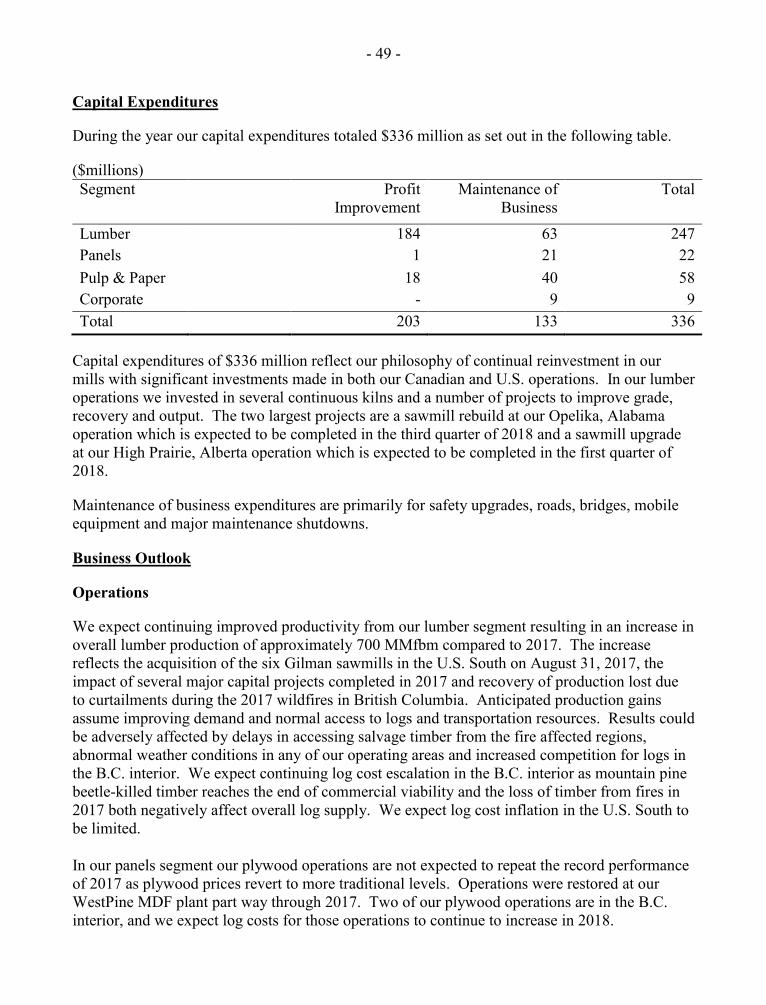
- 49 -
Capital Expenditures
During the year our capital expenditures totaled $336 million as set out in the following table.
($millions) Segment Profit
Improvement Maintenance of
Business Total
Lumber 184 63 247 Panels 1 21 22 Pulp & Paper 18 40 58 Corporate - 9 9 Total 203 133 336
Capital expenditures of $336 million reflect our philosophy of continual reinvestment in our mills with significant investments made in both our Canadian and U.S. operations. In our lumber operations we invested in several continuous kilns and a number of projects to improve grade, recovery and output. The two largest projects are a sawmill rebuild at our Opelika, Alabama operation which is expected to be completed in the third quarter of 2018 and a sawmill upgrade at our High Prairie, Alberta operation which is expected to be completed in the first quarter of 2018.
Maintenance of business expenditures are primarily for safety upgrades, roads, bridges, mobile equipment and major maintenance shutdowns.
Business Outlook
Operations
We expect continuing improved productivity from our lumber segment resulting in an increase in overall lumber production of approximately 700 MMfbm compared to 2017. The increase reflects the acquisition of the six Gilman sawmills in the U.S. South on August 31, 2017, the impact of several major capital projects completed in 2017 and recovery of production lost due to curtailments during the 2017 wildfires in British Columbia. Anticipated production gains assume improving demand and normal access to logs and transportation resources. Results could be adversely affected by delays in accessing salvage timber from the fire affected regions, abnormal weather conditions in any of our operating areas and increased competition for logs in the B.C. interior. We expect continuing log cost escalation in the B.C. interior as mountain pine beetle-killed timber reaches the end of commercial viability and the loss of timber from fires in 2017 both negatively affect overall log supply. We expect log cost inflation in the U.S. South to be limited.
In our panels segment our plywood operations are not expected to repeat the record performance of 2017 as plywood prices revert to more traditional levels. Operations were restored at our WestPine MDF plant part way through 2017. Two of our plywood operations are in the B.C. interior, and we expect log costs for those operations to continue to increase in 2018.
- 50 -
Both of our NBSK mills undertook major maintenance shutdowns in 2017 (our jointly-owned Cariboo mill in the second quarter and Hinton in the third quarter) and will not have a similar shutdown interruption in 2018. Improved productivity at these mills continues to be a key focus for us. Our BCTMP mills and our jointly-owned newsprint mill continued to operate well in 2017 and we expect generally similar operations in 2018, assuming adequate markets.
Markets
Our lumber segment’s most important market is the U.S. and particularly residential construction and repair and remodelling. In 2017, CVD and ADD were imposed on Canadian producers and we were required to make deposits in respect of these duties. Whether and to what extent duties can be passed along to consumers will largely depend on the strength of demand for softwood lumber, which is significantly influenced by the levels of new residential construction in the U.S. which has been gradually improving over the past several years. If duties can be passed through to consumers in whole or in part the price of Canadian softwood lumber will increase (although the increase will not necessarily be for the benefit of Canadian producers) which in turn could cause the price of SYP lumber, which would not be subject to the duty, to increase as well.
We are anticipating continued improvement in U.S. new residential construction and steady demand from China and Japan for Canadian softwood lumber, but it is currently very difficult to predict how and to what extent duties will affect lumber prices and the cost structure of our Canadian lumber business over the long term.
The major component of our panels segment is plywood which is sold mainly in Canada. Although demand for Canadian plywood has been strong over the past several years, we anticipate some downward pressure on plywood prices in 2018 as measures implemented by various governments across Canada have taken steps to attempt to moderate housing markets. MDF and LVL demand is heavily influenced by North American new home construction and we are expecting continuing improvement in U.S. residential construction which should help maintain price levels for these products.
We are anticipating that pulp markets will generally be flat to slightly weaker as the market adjusts to new production coming on line. Pulp demand will be heavily influenced by the pace of Chinese economic activity.
Cash flows
We are anticipating levels of cash flows, taking into account duties on Canadian softwood lumber exports to the U.S., to support between $300 and $350 million of capital spending in 2018 as well as to continue to support dividend payments. We have paid a dividend in every quarter since we became a public company in 1986. We expect to maintain our investment grade rating and intend to preserve sufficient liquidity to be able to take advantage of strategic growth opportunities that may arise. We are authorized under our normal course issuer bid, which expires in September of 2018, to purchase up to 5% of our outstanding Common shares and we will continue to consider share purchases with excess cash if we are satisfied that this will enhance shareholder value.
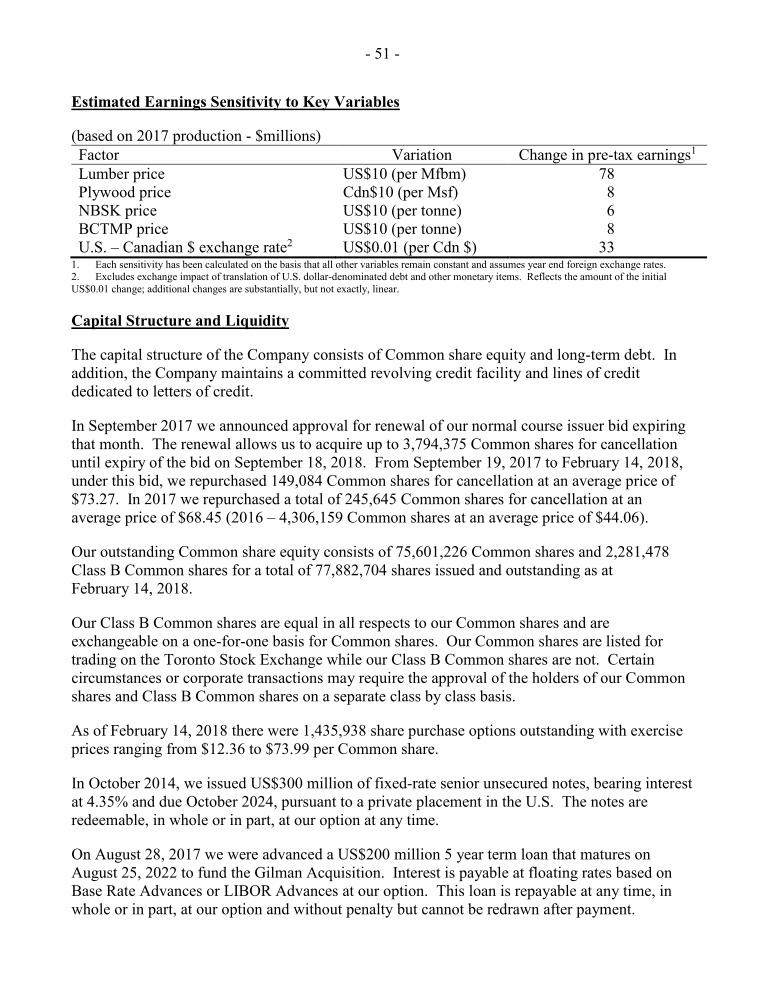
- 51 -
Estimated Earnings Sensitivity to Key Variables
(based on 2017 production - $millions) Factor Variation Change in pre-tax earnings1
Lumber price US$10 (per Mfbm) 78 Plywood price Cdn$10 (per Msf) 8 NBSK price US$10 (per tonne) 6 BCTMP price US$10 (per tonne) 8 U.S. – Canadian $ exchange rate2 US$0.01 (per Cdn $) 33
1. Each sensitivity has been calculated on the basis that all other variables remain constant and assumes year end foreign exchange rates. 2. Excludes exchange impact of translation of U.S. dollar-denominated debt and other monetary items. Reflects the amount of the initial US$0.01 change; additional changes are substantially, but not exactly, linear.
Capital Structure and Liquidity
The capital structure of the Company consists of Common share equity and long-term debt. In addition, the Company maintains a committed revolving credit facility and lines of credit dedicated to letters of credit.
In September 2017 we announced approval for renewal of our normal course issuer bid expiring that month. The renewal allows us to acquire up to 3,794,375 Common shares for cancellation until expiry of the bid on September 18, 2018. From September 19, 2017 to February 14, 2018, under this bid, we repurchased 149,084 Common shares for cancellation at an average price of $73.27. In 2017 we repurchased a total of 245,645 Common shares for cancellation at an average price of $68.45 (2016 – 4,306,159 Common shares at an average price of $44.06).
Our outstanding Common share equity consists of 75,601,226 Common shares and 2,281,478 Class B Common shares for a total of 77,882,704 shares issued and outstanding as at February 14, 2018.
Our Class B Common shares are equal in all respects to our Common shares and are exchangeable on a one-for-one basis for Common shares. Our Common shares are listed for trading on the Toronto Stock Exchange while our Class B Common shares are not. Certain circumstances or corporate transactions may require the approval of the holders of our Common shares and Class B Common shares on a separate class by class basis.
As of February 14, 2018 there were 1,435,938 share purchase options outstanding with exercise prices ranging from $12.36 to $73.99 per Common share.
In October 2014, we issued US$300 million of fixed-rate senior unsecured notes, bearing interest at 4.35% and due October 2024, pursuant to a private placement in the U.S. The notes are redeemable, in whole or in part, at our option at any time.
On August 28, 2017 we were advanced a US$200 million 5 year term loan that matures on August 25, 2022 to fund the Gilman Acquisition. Interest is payable at floating rates based on Base Rate Advances or LIBOR Advances at our option. This loan is repayable at any time, in whole or in part, at our option and without penalty but cannot be redrawn after payment.
- 52 -
On August 28, 2017 we extended the maturity date of our $500 million committed operating revolving credit facility to August 25, 2022. Our operating facilities include a $500 million committed revolving credit facility, a $31 million (US$25 million) demand line of credit dedicated to our U.S. operations and an $8 million demand line of credit dedicated to our jointly-owned newsprint operation. In addition, we have demand lines of credit totalling $59 million dedicated to letters of credit of which US$7 million is committed to our U.S. operations. These facilities are available to meet our funding requirements.
All debt is unsecured except the $8 million joint newsprint operation demand line of credit, which is secured by that joint operation’s current assets.
At December 31, 2017 there were no amounts outstanding under our revolving credit facility. Letters of credit in the amount of $47 million were supported by our facilities, leaving approximately $551 million of credit available for further use.
Our cash requirements, other than for operating purposes, are primarily for interest payments, repayment of debt, additions to property, plant, equipment and timber, acquisitions and payment of dividends. In normal business cycles and in years without a major acquisition or debt repayment, cash on hand and cash provided by operations have normally been sufficient to meet these requirements.
Summary of Financial Position ($millions, except as otherwise indicated) As at December 31 2017 2016 Cash1 258 50 Current assets 1,291 938 Current liabilities 583 459 Ratio of current assets to current liabilities 2.2 2.0 Net debt2 376 376 Shareholders’ equity 2,726 2,241 Net debt to total capital3 12% 14%
1. Cash consists of cash and short-term investments. 2. Total debt less deferred financing costs less cash plus cheques issued in excess of funds on deposit. 3. Non-IFRS measure. See “Non-IFRS Measures” below.
As shown in the table below, we are rated by three rating agencies. All three agencies maintained our investment grade ratings with a Stable Outlook.
Debt Ratings Agency Rating Outlook DBRS BBB(low) Stable Moody’s Baa3 Stable Standard & Poor’s BBB- Stable
These ratings are not a recommendation to buy, sell or hold securities and may be subject to revision or withdrawal at any time by the rating agencies.
- 53 -
Selected Cash Flow Items ($millions) For the year ended December 31 2017 2016 Operating Activities Earnings 596 326 Amortization 210 197 Foreign exchange gain on long-term financing (10) (4) Change in income taxes 177 111 Changes in non-cash working capital (62) 90 Other (9) (31) Cash provided by operating activities 902 689 Financing Activities Proceeds from long-term debt 250 - Repayment of operating loan - (181) Finance expense paid (23) (23) Dividends (28) (22) Common share repurchases (17) (190) Other (1) 2 Cash provided by (used in) financing activities 181 (414) Investing Activities Acquisition (526) - Additions to capital assets (336) (273) Other 8 10 Cash used in investing activities (854) (263) Increase in cash 229 12
Operating Activities
Cash provided by operating activities in 2017 was $902 million compared to $689 million in 2017. The table above shows the main components of cash generation for the year compared to 2016. Increased earnings combined with increased income taxes payable, partially offset by higher working capital balances were the significant factors affecting comparison between years. The cash generated from income taxes relates to current tax expense being higher than instalment payments in 2017, the 2017 payment of the 2016 income tax balance due and the impact of the change in deferred income tax balances. The main components of the working capital change relates to increased inventories and receivables.
Financing Activities
During the year we borrowed $250 million to partially finance the Gilman Acquisition. The significant uses of cash in 2016 were to repay operating loans and fund Common share repurchases.
- 54 -
Investing Activities
The cash used for investing activities in 2017 was related to the Gilman Acquisition for $526 million and additions to capital assets of $336 million. The main use of cash in 2016 was for capital asset additions of $273 million.
Contractual Obligations1
($millions, as at December 31, 2017) 2018 2019 2020 2021 Thereafter Total Long-term debt2 - - 10 - 631 641 Operating leases 4 3 3 3 3 16 Asset purchase commitments 53 - - - - 53 Total 57 3 13 3 634 710
1. Contractual obligations means an agreement related to debt, leases and enforceable agreements to purchase goods or services on specified terms, but does not include reforestation and decommissioning obligations, energy purchases under various agreements, pension contributions payable, accounts payable in the ordinary course of business or contingent amounts payable. 2. Includes U.S. dollar-denominated debt of US$500 million.
Significant Management Judgments Affecting Financial Results
The preparation of financial statements requires management to make estimates and assumptions, and to select accounting policies, that affect the amounts reported. The significant accounting policies followed by our Company are disclosed in our Financial Statements. The following judgments are considered the most significant:
Softwood Lumber Dispute
The current softwood lumber dispute is the fifth such dispute since 1982. In the case of previous disputes, the preliminary duties were subsequently reduced in the periods following the initial application.
On April 24, 2017, the USDOC issued its preliminary determination in the CVD investigation and imposed a Company specific rate of 24.12% to be posted by cash deposits on the exports from Canada of softwood lumber to the U.S. on or after April 28, 2017. The requirement that we deposit CVD was suspended on August 24, 2017. On December 4, 2017, the USDOC amended our CVD rate to 17.99% and effective December 28, 2017 we began posting cash deposits at the new rate. In the absence of additional information, we have expensed CVD deposits at the 17.99% final rate. The difference between deposits paid at 24.12% and the 17.99% final rate has been recorded as a long-term asset.
On June 26, 2017, the USDOC issued its preliminary determination in the ADD investigation and imposed a company specific rate of 6.76% to be posted by cash deposits on the exports from Canada of softwood lumber to the U.S. on or after June 30, 2017. On December 4, 2017 the USDOC amended our ADD rate to 5.57% and we began posting cash deposits at the new rate. The ADD rate determined by the USDOC was based on their preliminary investigation covering the period October 1, 2015 to September 30, 2016. This preliminary rate is expected to remain in place until our actual data is reviewed by the USDOC. The initial review by the USDOC, covering the period June 30, 2017 to November 30, 2018, is expected to be completed between January 2019 and June 2020. We have prepared an estimate of our ADD rate for 2017 using our
- 55 -
actual data and the methodology expected to be used by the USDOC and determined our best estimate of our rate to be 0.9%. In the absence of additional information, we have expensed ADD deposits at our estimated 0.9% rate. The difference between deposits paid and the 0.9% rate have been recorded as a long-term asset.
The duty rates are subject to change based on administrative reviews and appeals available to us. In addition we will update our ADD rate at each reporting date considering our actual results for each period of review. Changes to estimated rates may be material and any changes will be reflected through current results in the period of the change.
Recoverability of Long-lived Assets
We assess the carrying value of an asset when there are indicators of impairment. The assessment compares the estimated discounted future cash flows of the asset to the carrying value of the asset. If the carrying value of the asset exceeds the estimated discounted future cash flows relating to the asset, the carrying value is written down to the higher of fair value less costs to sell and value-in-use.
We review the amortization periods for our manufacturing equipment and machinery to ensure that the periods appropriately reflect anticipated obsolescence and technological change. Current amortization periods for manufacturing equipment range from 6 to 20 years. Timber licences are amortized over 40 years.
Goodwill is not amortized. We compare the carrying value of goodwill and related assets, at least once a year, to the estimated discounted cash flows that the assets are expected to generate. If it is determined that the carrying value is more than the estimated discounted cash flows, then a goodwill impairment will be recorded. We tested goodwill for impairment in 2017 and concluded that its carrying value is not impaired. The testing of goodwill for impairment involves significant estimates including future production and sales volumes, product selling prices, foreign currency exchange rates, operating costs, capital expenditures and the appropriate discount rate to apply. In all cases, we have used our best estimates of these projected amounts and values. Given the current global economic uncertainty and the volatility of the markets for our products, it is possible that our estimates will be adjusted in the future and that these adjusted estimates could result in the future impairment of goodwill.
We also review the carrying value of deferred income tax assets to ensure that the carrying value is appropriate. The key factors considered are the Company’s history of profitability, future expectations of profitability, the expected reversal of temporary differences and the timing of expiry of tax loss carry-forwards and limitations on their use.
Reforestation and Decommissioning Obligations
In Canada, provincial regulations require timber quota holders to carry out reforestation to ensure re-establishment of the forest after harvesting. Reforested areas must be tended for a period sufficient to ensure that they are well-established. The time needed to meet regulatory requirements depends on a variety of factors.
- 56 -
In our operating areas, the time to meet reforestation standards usually spans 12 to 15 years from the time of harvest. We record a liability for the estimated cost of the future reforestation activities when the harvesting takes place. This liability is reviewed, at least annually, and adjusted to our current estimate of the costs to complete the remainder of the reforestation activities. In 2017 the review of the reforestation obligation resulted in a decrease to the obligation of $7 million (2016 – decrease of $10 million).
We record the estimated fair value of a liability for decommissioning obligations, such as landfill closures, in the period when a reasonable estimate of fair value can be made. We review these estimates at least annually, and adjust the obligations as appropriate. In 2017 the review resulted in no change to the obligation (2016 – decrease of $4 million).
Defined Benefit Pension Plan (“D.B. Plan”) Assumptions
We maintain several D.B. Plans for many of our employees. The annual funding requirements and pension expenses are based on (i) various assumptions that we determine in consultation with our actuaries, (ii) actual investment returns on the pension fund assets, and (iii) changes to the employee groups in the pension plans. Note 13 to the Financial Statements provides the sensitivity of a change in key assumptions to our post-retirement obligations.
Accounting Standards Issued But Not Yet Applied
The International Accounting Standards Board periodically issues new standards and amendments or interpretations to existing standards. The new pronouncements listed below are ones we consider to be most significant.
IFRS 9 - Financial Instruments
In November 2009, IFRS 9 was issued and in October 2010 was further amended. IFRS 9 addresses classification and measurement of financial assets and replaces the multiple category and measurement models in International Accounting Standards (“IAS”) 39 - Financial Instruments: Recognition and Measurement for debt instruments with a new mixed measurement model having only two categories: amortized cost and fair value through profit or loss. IFRS 9 also replaces the models for measuring equity instruments and such instruments are either recognized at fair value through profit or loss or at fair value through other comprehensive earnings. This standard is effective for annual periods beginning on or after January 1, 2018. We do not expect this standard to have a significant effect on our consolidated financial statements.
IFRS 15 - Revenue from Contracts with Customers
In May 2014, IFRS 15 was issued. This standard addresses revenue recognition and establishes principles for reporting information about the nature, amount, timing and uncertainty of revenue and cash flows arising from an entity’s contracts with customers. Revenue is recognized when a customer obtains control of a good or service and thus has the ability to control its use and obtain the benefits from the good or service. The standard replaces IAS 18 - Revenue, IAS 11 - Construction Contracts and the related interpretations. The standard is effective for annual
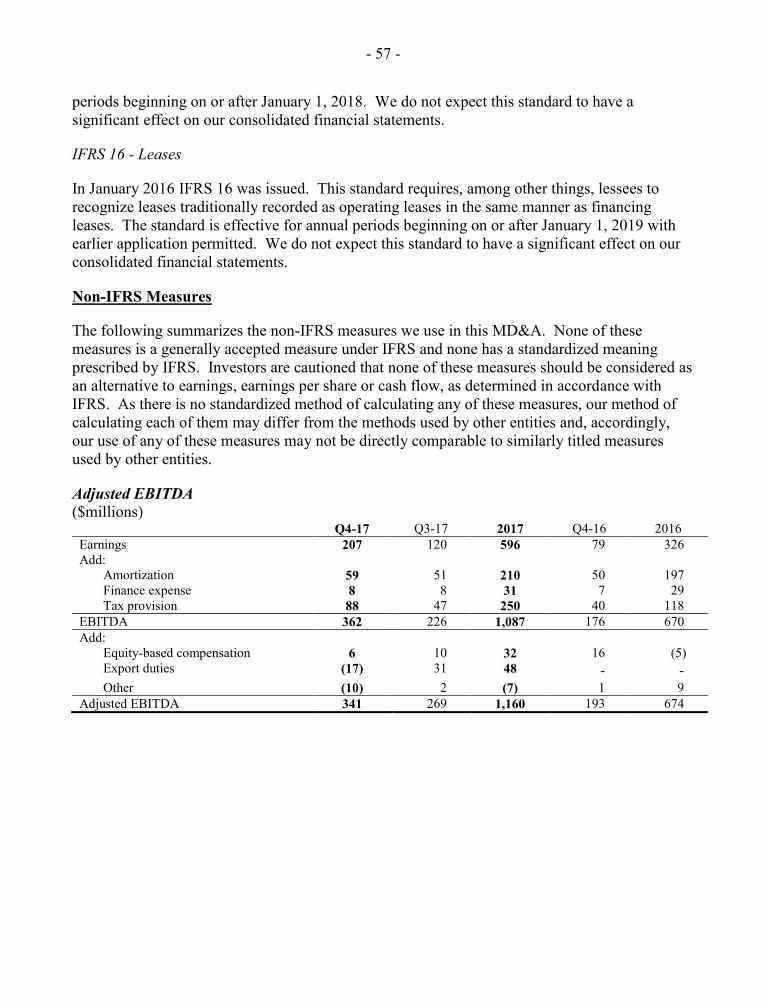
- 57 -
periods beginning on or after January 1, 2018. We do not expect this standard to have a significant effect on our consolidated financial statements.
IFRS 16 - Leases
In January 2016 IFRS 16 was issued. This standard requires, among other things, lessees to recognize leases traditionally recorded as operating leases in the same manner as financing leases. The standard is effective for annual periods beginning on or after January 1, 2019 with earlier application permitted. We do not expect this standard to have a significant effect on our consolidated financial statements.
Non-IFRS Measures
The following summarizes the non-IFRS measures we use in this MD&A. None of these measures is a generally accepted measure under IFRS and none has a standardized meaning prescribed by IFRS. Investors are cautioned that none of these measures should be considered as an alternative to earnings, earnings per share or cash flow, as determined in accordance with IFRS. As there is no standardized method of calculating any of these measures, our method of calculating each of them may differ from the methods used by other entities and, accordingly, our use of any of these measures may not be directly comparable to similarly titled measures used by other entities.
Adjusted EBITDA ($millions)
Q4-17 Q3-17 2017 Q4-16 2016 Earnings 207 120 596 79 326 Add: Amortization 59 51 210 50 197 Finance expense 8 8 31 7 29 Tax provision 88 47 250 40 118 EBITDA 362 226 1,087 176 670 Add: Equity-based compensation 6 10 32 16 (5) Export duties (17) 31 48 - - Other (10) 2 (7) 1 9 Adjusted EBITDA 341 269 1,160 193 674
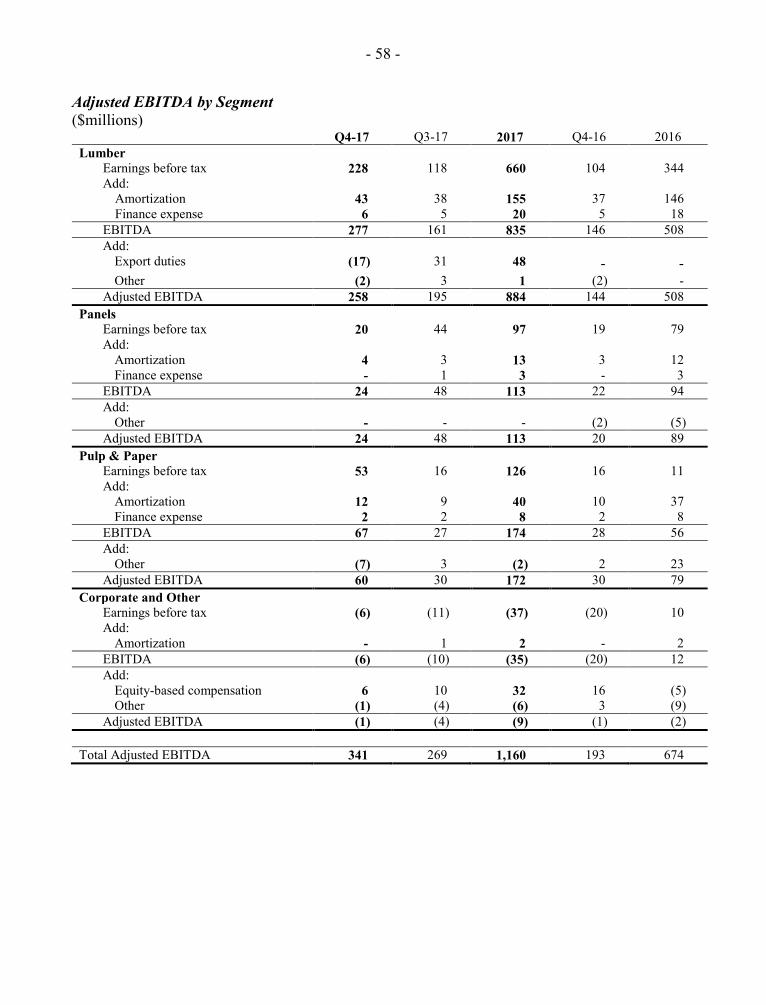
- 58 -
Adjusted EBITDA by Segment ($millions)
Q4-17 Q3-17 2017 Q4-16 2016 Lumber Earnings before tax 228 118 660 104 344 Add: Amortization 43 38 155 37 146 Finance expense 6 5 20 5 18 EBITDA 277 161 835 146 508 Add: Export duties (17) 31 48 - - Other (2) 3 1 (2) - Adjusted EBITDA 258 195 884 144 508 Panels Earnings before tax 20 44 97 19 79 Add: Amortization 4 3 13 3 12 Finance expense - 1 3 - 3 EBITDA 24 48 113 22 94 Add: Other - - - (2) (5) Adjusted EBITDA 24 48 113 20 89 Pulp & Paper Earnings before tax 53 16 126 16 11 Add: Amortization 12 9 40 10 37 Finance expense 2 2 8 2 8 EBITDA 67 27 174 28 56 Add: Other (7) 3 (2) 2 23 Adjusted EBITDA 60 30 172 30 79 Corporate and Other Earnings before tax (6) (11) (37) (20) 10 Add: Amortization - 1 2 - 2 EBITDA (6) (10) (35) (20) 12 Add: Equity-based compensation 6 10 32 16 (5) Other (1) (4) (6) 3 (9) Adjusted EBITDA (1) (4) (9) (1) (2) Total Adjusted EBITDA 341 269 1,160 193 674
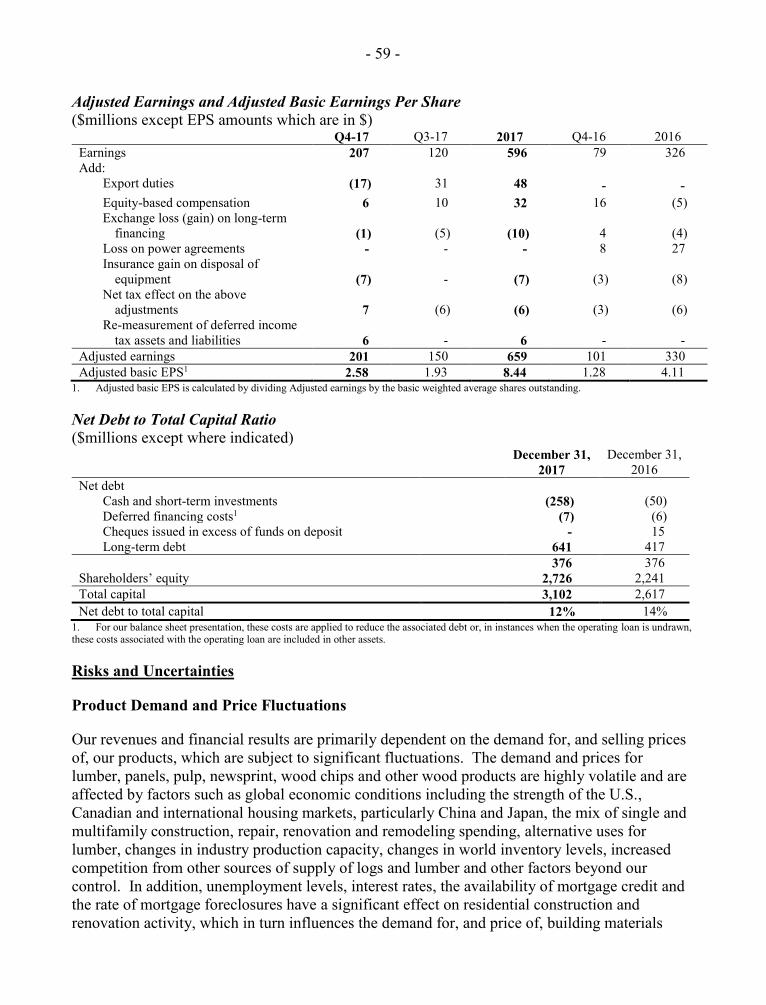
- 59 -
Adjusted Earnings and Adjusted Basic Earnings Per Share ($millions except EPS amounts which are in $)
Q4-17 Q3-17 2017 Q4-16 2016 Earnings 207 120 596 79 326 Add: Export duties (17) 31 48 - - Equity-based compensation 6 10 32 16 (5) Exchange loss (gain) on long-term
financing (1) (5) (10) 4 (4) Loss on power agreements - - - 8 27 Insurance gain on disposal of
equipment (7) - (7) (3) (8) Net tax effect on the above
adjustments 7 (6) (6) (3) (6) Re-measurement of deferred income
tax assets and liabilities 6 - 6 - - Adjusted earnings 201 150 659 101 330 Adjusted basic EPS1 2.58 1.93 8.44 1.28 4.11
1. Adjusted basic EPS is calculated by dividing Adjusted earnings by the basic weighted average shares outstanding.
Net Debt to Total Capital Ratio ($millions except where indicated)
December 31, 2017
December 31, 2016
Net debt Cash and short-term investments (258) (50) Deferred financing costs1 (7) (6) Cheques issued in excess of funds on deposit - 15 Long-term debt 641 417 376 376 Shareholders’ equity 2,726 2,241 Total capital 3,102 2,617 Net debt to total capital 12% 14%
1. For our balance sheet presentation, these costs are applied to reduce the associated debt or, in instances when the operating loan is undrawn, these costs associated with the operating loan are included in other assets.
Risks and Uncertainties
Product Demand and Price Fluctuations
Our revenues and financial results are primarily dependent on the demand for, and selling prices of, our products, which are subject to significant fluctuations. The demand and prices for lumber, panels, pulp, newsprint, wood chips and other wood products are highly volatile and are affected by factors such as global economic conditions including the strength of the U.S., Canadian and international housing markets, particularly China and Japan, the mix of single and multifamily construction, repair, renovation and remodeling spending, alternative uses for lumber, changes in industry production capacity, changes in world inventory levels, increased competition from other sources of supply of logs and lumber and other factors beyond our control. In addition, unemployment levels, interest rates, the availability of mortgage credit and the rate of mortgage foreclosures have a significant effect on residential construction and renovation activity, which in turn influences the demand for, and price of, building materials
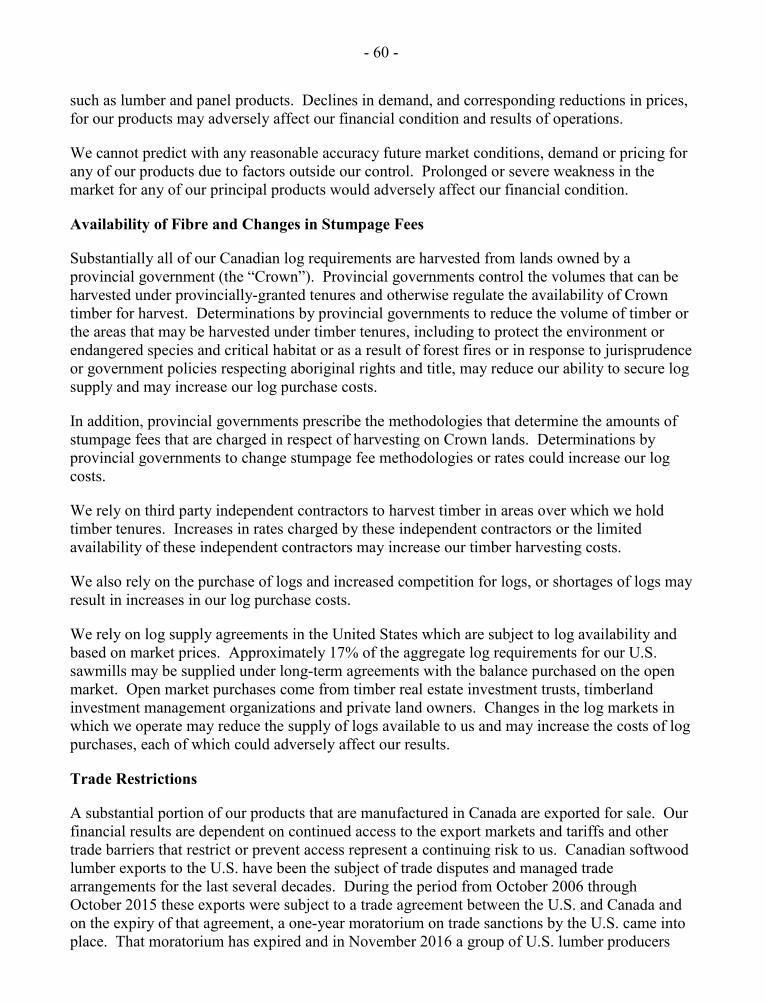
- 60 -
such as lumber and panel products. Declines in demand, and corresponding reductions in prices, for our products may adversely affect our financial condition and results of operations.
We cannot predict with any reasonable accuracy future market conditions, demand or pricing for any of our products due to factors outside our control. Prolonged or severe weakness in the market for any of our principal products would adversely affect our financial condition.
Availability of Fibre and Changes in Stumpage Fees
Substantially all of our Canadian log requirements are harvested from lands owned by a provincial government (the “Crown”). Provincial governments control the volumes that can be harvested under provincially-granted tenures and otherwise regulate the availability of Crown timber for harvest. Determinations by provincial governments to reduce the volume of timber or the areas that may be harvested under timber tenures, including to protect the environment or endangered species and critical habitat or as a result of forest fires or in response to jurisprudence or government policies respecting aboriginal rights and title, may reduce our ability to secure log supply and may increase our log purchase costs.
In addition, provincial governments prescribe the methodologies that determine the amounts of stumpage fees that are charged in respect of harvesting on Crown lands. Determinations by provincial governments to change stumpage fee methodologies or rates could increase our log costs.
We rely on third party independent contractors to harvest timber in areas over which we hold timber tenures. Increases in rates charged by these independent contractors or the limited availability of these independent contractors may increase our timber harvesting costs.
We also rely on the purchase of logs and increased competition for logs, or shortages of logs may result in increases in our log purchase costs.
We rely on log supply agreements in the United States which are subject to log availability and based on market prices. Approximately 17% of the aggregate log requirements for our U.S. sawmills may be supplied under long-term agreements with the balance purchased on the open market. Open market purchases come from timber real estate investment trusts, timberland investment management organizations and private land owners. Changes in the log markets in which we operate may reduce the supply of logs available to us and may increase the costs of log purchases, each of which could adversely affect our results.
Trade Restrictions
A substantial portion of our products that are manufactured in Canada are exported for sale. Our financial results are dependent on continued access to the export markets and tariffs and other trade barriers that restrict or prevent access represent a continuing risk to us. Canadian softwood lumber exports to the U.S. have been the subject of trade disputes and managed trade arrangements for the last several decades. During the period from October 2006 through October 2015 these exports were subject to a trade agreement between the U.S. and Canada and on the expiry of that agreement, a one-year moratorium on trade sanctions by the U.S. came into place. That moratorium has expired and in November 2016 a group of U.S. lumber producers
- 61 -
petitioned the USDOC and the USITC to impose trade sanctions against Canadian softwood lumber exports to the U.S. In 2017 duties were imposed on Canadian softwood lumber exports to the U.S. The duties are likely to remain in place until and unless some form of trade agreement can be reached between the U.S. and Canada or a final, binding determination is made as a result of litigation. Unless the additional costs imposed by duties can be passed along to lumber consumers, the duties will increase costs for Canadian producers and, in certain cases, could result in some Canadian production becoming unprofitable. Whether and to what extent duties can be passed along to consumers will largely depend on the strength of demand for softwood lumber, which is significantly influenced by the levels of new residential construction in the U.S. which has been gradually improving over the past several years. If duties can be passed through to consumers in whole or in part the price of Canadian softwood lumber will increase (although the increase will not necessarily be for the benefit of Canadian producers) which in turn could cause the price of SYP lumber, which would not be subject to the duty, to increase as well.
The application of U.S. trade laws could, in certain circumstances, create significant burdens on us. We are a mandatory respondent in current investigations being conducted by the USDOC into alleged subsidies and dumping of Canadian softwood lumber.
Natural and Man-Made Disasters
Our operations are subject to adverse natural or man-made events such as forest fires, flooding, severe weather conditions, climate change, timber diseases and insect infestations including those that may be associated with warmer climate conditions, and earthquake activity. These events could damage or destroy or adversely affect the operations at our physical facilities or our timber supply or our access to or availability of timber, and similar events could also affect the facilities of our suppliers or customers. Any such damage or destruction could adversely affect our financial results as a result of the reduced availability of timber, decreased production output or increased operating costs. Although we believe we have reasonable insurance arrangements in place to cover certain of such incidents related to damage or destruction, there can be no assurance that these arrangements will be sufficient to fully protect us against such losses. As is common in the industry, we do not insure loss of standing timber for any cause.
Mountain Pine Beetle
The long-term effect of the mountain pine beetle infestation on our Canadian operations is uncertain. The potential effects include a reduction of future Annual Allowable Cut (“AAC”) levels to below current and pre-infestation AAC levels. Many of our British Columbia operations are experiencing a diminished grade and volume of lumber recovered from beetle-killed logs and increased production costs. These effects are also present in some of our Alberta operations where the mountain pine beetle infestation has expanded. The timing and extent of the future effect on our timber supply, lumber grade and recovery, and production costs will depend on a variety of factors and at this time cannot be reasonably determined. The effects of the deterioration of beetle-killed logs could include increased costs, reduced operating rates due to shortages of commercially merchantable timber and mill closures.
- 62 -
Wood Dust
Our operations generate wood dust which has been recognized for many years as a potential health and safety hazard. The potential risks associated with wood dust have been increased in those of our British Columbia and Alberta facilities that have been processing mountain pine beetle-killed logs as the wood dust generated from these logs tends to be drier, lighter and finer than wood dust typically generated. We have adopted a variety of measures to reduce or eliminate the risks posed by the presence of wood dust in our facilities and we continue to work with industry and regulators to develop and adopt best mitigation practices. Any explosion or similar event at any of our facilities or any third-party facility could result in significant loss, increases in expenses and disruption of operations, each of which would have a material adverse effect on our business.
Financial
Our capital plans will include, from time to time, expansion, productivity improvement, technology upgrades, operating efficiency optimization and repair or replacement of our existing facilities and equipment. In addition, we may undertake the acquisition of facilities or the rebuilding or modernization of existing facilities. If the capital expenditures associated with these capital projects are greater than we have projected or if construction timelines are longer than anticipated, or if we fail to achieve the intended efficiencies, our financial condition, results of operations and cash flows may be adversely affected. In addition, our ability to expand production and improve operational efficiencies will be contingent on our ability to execute on our capital plans. Our capital plans may be adversely affected by availability of, and competition for, qualified workers and contractors, equipment lead times, changes in government regulations, unexpected delays and increases in costs of completing capital projects.
We believe our capital resources will be adequate to meet our current projected operating needs, capital expenditures and other cash requirements. Factors that could adversely affect our capital resources include prolonged and sustained declines in the demand and prices for our products, unanticipated significant increases in our operating expenses and unanticipated capital expenditures. If for any reason we are unable to provide for our operating needs, capital expenditures and other cash requirements on commercially reasonable terms, we could experience a material adverse effect to our business, financial condition, results of operations and cash flows.
We rely on long-term borrowings and access to revolving credit in order to finance our ongoing operations. Any change in availability of credit in the market, as could happen during an economic downturn, could affect our ability to access credit markets on commercially reasonable terms. In the future we may need to access public or private debt markets to issue new debt. Deteriorations or volatility in the credit markets could also adversely affect:
• our ability to secure financing to proceed with capital expenditures for the repair, replacement or expansion of our existing facilities and equipment;
• our ability to comply with covenants under our existing credit or debt agreements; • the ability of our customers to purchase our products; and • our ability to take advantage of growth, expansion or acquisition opportunities.
- 63 -
In addition, deteriorations or volatility in the credit market could result in increases in the interest rates that we pay on our outstanding non-fixed rate debt, which would increase our costs of borrowing and adversely affect our results.
Credit rating agencies rate our debt securities based on factors that include our operating results, actions that we take, their view of the general outlook for our industry and their view of the general outlook for the economy. Actions taken by the rating agencies can include maintaining, upgrading or downgrading the current rating or placing us on a watch list for possible future downgrading. Downgrading the credit rating of our debt securities or placing us on a watch list for possible future downgrading could limit our access to the credit markets, increase our cost of financing and have an adverse effect on our financial condition.
We rely heavily on certain raw materials, including logs, wood chips and chemicals, and energy sources, including natural gas and electricity, in our manufacturing processes. Increases in the costs of these raw materials and energy sources will increase our operating costs and will reduce our operating margins. There is no assurance that we will be able to fully offset the effects of higher raw material or energy costs through hedging arrangements, price increases, productivity improvements or cost-reduction programs.
Operational Curtailments
From time to time, we suspend or curtail operations at one or more of our facilities in response to market conditions, environmental risks, or other operational issues, including, but not limited to scheduled and unscheduled maintenance, temporary periods of high electricity prices, power failures, equipment breakdowns, adverse weather conditions, labour disruptions and fire hazards.
In addition, our ability to operate at full capacity may be affected by ongoing capital projects. As a result, our facilities may from time to time operate at less than full capacity. These operational suspensions could have a material adverse effect on our financial condition as a result of decreased revenues and lower operating margins.
In Canada, a substantial portion of the wood chip requirements of our Canadian pulp and paper operations are provided by our Canadian sawmills and plywood and LVL plants. If wood chip production is reduced because of production curtailments, improved manufacturing efficiencies or any other reason, our pulp and paper operations may incur additional costs to acquire or produce additional wood chips or be forced to reduce production. Conversely, pulp and paper mill production curtailments may require our sawmills and panel mills to find other ways to dispose of residual wood fibre and may result in curtailment or suspension of lumber, plywood or LVL production and increased costs.
Transportation Requirements
Our business depends on our ability to transport a high volume of products to our production facilities and on to both domestic and international markets. We rely primarily on third-party transportation providers for both the delivery of raw materials to our production facilities and the transportation of our products to market. These third-party transportation providers include truckers, bulk and container shippers and railways. Our ability to obtain transportation services from these transportation service providers is subject to risks which include, without limitation,
- 64 -
availability of equipment and operators, disruptions due to weather, natural disasters and labour disputes. Transportation costs are also subject to risks that include, without limitation, increased rates due to competition and increased fuel costs. Increases in transportation costs will increase our operating costs. If we are unable to obtain transportation services or if our transportation costs increase, our revenues may decrease due to our inability to deliver products to market and our operating expenses may increase, each of which would adversely affect our results of operations.
Labour and Services
Our operations rely on both skilled and unskilled workers as well as third party services such as logging and transportation. Because our operations are generally located away from major urban centres, we often face strong competition from our industry and others such as oil and gas production and mining for labour and services, particularly skilled trades. Shortages of key services or shortages of labour, including those caused by a failure to attract and retain a sufficient number of qualified employees and other personnel or high employee turnover could impair our operations by reducing production or increasing costs.
We employ a unionized workforce in a number of our operations. Walkouts or strikes by employees could result in lost production and sales, higher costs and supply constraints that could have a material adverse effect on our business. Also, we depend on a variety of third parties that employ unionized workers to provide critical services to us. Labour disputes experienced by these third parties could lead to disruptions at our facilities.
Environment
We are subject to regulation by federal, provincial, state, municipal and local environmental authorities, including, among other matters, environmental regulations relating to air emissions and pollutants, wastewater (effluent) discharges, solid and hazardous waste, landfill operations, forestry practices, permitting obligations, site remediation and the protection of threatened or endangered species and critical habitat. We have incurred, and will continue to incur, capital expenditures and operating costs to comply with environmental laws and regulations, including the U.S. Environmental Protection Agency’s Boiler MACT (maximum achievable control technology) regulations. No assurance can be given that changes in these laws and regulations or their application will not have a material adverse effect on our business, operations, financial condition and operational results. Similarly, no assurance can be given that capital expenditures necessary for future compliance with existing and new environmental laws and regulations could be financed from our available cash flow. We may discover currently unknown environmental problems, contamination, or conditions relating to our past or present operations. This or any failure to comply with environmental laws and regulations may require site or other remediation costs or result in governmental or private claims for damage to person, property, natural resources or the environment or governmental sanctions, including fines or the curtailment or suspension of our operations, which could have a material adverse effect on our business, financial condition and operational results.
We are currently involved in investigation and remediation activities and maintain accruals for certain environmental matters or obligations, as set out in the notes to our Financial Statements
- 65 -
for the year ended December 31, 2017. There can be no assurance that any costs associated with such obligations or other environmental matters will not exceed our accruals.
Our Canadian woodland operations, and the harvesting operations of our many key U.S. suppliers, in addition to being subject to various environmental protection laws, are subject to third-party certification as to compliance with internationally recognized, sustainable forest management standards. Demand for our products may be reduced if we are unable to achieve compliance, or are perceived by the public as failing to comply, with these applicable environmental protection laws and sustainable forest management standards, or if our customers require compliance with alternate forest management standards for which our operations are not certified. In addition, changes in sustainable forest management standards or our determination to seek certification for compliance with alternate sustainable forest management standards may increase our costs of operations.
Aboriginal Groups
Issues relating to aboriginal groups, including First Nations, Metis and others, have the potential for a significant adverse effect on resource companies operating in Canada including West Fraser. Risks include potential delays or effects of governmental decisions relating to Canadian Crown timber harvesting rights (including their grant, renewal or transfer or authorization to harvest) in light of the government’s duty to consult and accommodate aboriginal groups in respect of aboriginal rights or treaty rights, related terms and conditions of authorizations and potential findings of aboriginal title over land. The requirement to consult with aboriginal groups has also increased in recent years.
We participate, as requested by government, in the consultation process in support of the government fulfilling its duty to consult. We also seek to develop and maintain good relationships with aboriginal groups that may be affected by our business activities. However, as the jurisprudence and government policies respecting aboriginal rights and title and the consultation process continue to evolve, and as treaty negotiations continue, we cannot assure that aboriginal claims will not in the future have a material adverse effect on our timber harvesting rights or our ability to exercise or renew them or secure other timber harvesting rights.
In addition, the Canadian federal government and the provincial governments in Alberta and British Columbia have made commitments to renew their relationships with aboriginal groups and have expressed their support for the United Nations Declaration on the Rights of Indigenous Peoples (“UNDRIP”) and their intent to adopt and implement UNDRIP. At this time, it is unclear whether or how UNDRIP will be adopted into Canadian law and its impact on the Crown’s duty to consult with and accommodate aboriginal groups. At this time, we are unable to assess the effect, if any, that the adoption and implementation of UNDRIP by federal and provincial governments may have on land claims or consultation requirements or on our business, but the impact may be material.
On June 26, 2014 the Supreme Court of Canada (the “SCC”) released its reasons for judgment in Tsilhqot’in Nation v. British Columbia. The SCC declared that the Tsilhqot’in Nation had established aboriginal title over an area of British Columbia comprising approximately 1,750 square kilometres. The SCC also held that the provisions of the Forest Act (British Columbia)
- 66 -
dealing with the disposition or harvest of Crown timber, as presently drafted, no longer applied to timber located on those lands, by virtue of the definition of “Crown Timber” in the Forest Act. But the SCC also confirmed that provincial laws can apply on aboriginal title lands but only if the legislature so intends, and if the government can justify any infringement of aboriginal title (according to tests set out in the case law). It also confirmed that the existing Forest Act continues to apply to lands unless and until title is established.
We do not have any cutting permits in the area that was the subject of the Tsilhqot’in case. However, claims of aboriginal title have been asserted by many aboriginal groups throughout British Columbia (including lands in which we have interests or rights) and there is a risk that other aboriginal groups may pursue further rights or title claims through litigation, or treaty negotiations with governments. It is difficult to predict how quickly other claims will be litigated or negotiated and in what manner our Crown timber harvesting rights and log supply arrangements will be affected.
Regulatory
Our operations are subject to extensive general and industry-specific federal, provincial, state, municipal and other local laws and regulations and other requirements, including those governing forestry, exports, taxes (including, but not limited to, income, sales and carbon taxes), employees, labour standards, occupational health and safety, waste disposal, environmental protection and remediation, protection of endangered and protected species and land use and expropriation. We are required to obtain approvals, permits and licences for our operations, which may require advance consultation with potentially affected stakeholders including aboriginal groups and impose conditions that must be complied with. If we are unable to obtain, maintain, extend or renew, or are delayed in extending or renewing, a material approval, permit or licence, our operations or financial condition could be adversely affected. There is no assurance that these laws, regulations or government requirements, or the administrative interpretation or enforcement of existing laws and regulations, will not change in the future in a manner that may require us to incur significant capital expenditures, pay higher taxes or otherwise could adversely affect our operations or financial condition. Failure to comply with applicable laws or regulations, including approvals, permits and licences, could result in fines, penalties or enforcement actions, including orders suspending or curtailing our operations or requiring corrective measures or remedial actions.
Foreign Currency Exchange Rates
We sell the majority of our products at prices denominated in U.S. dollars or based on prevailing U.S. dollar prices. A significant portion of our operational costs and expenses are incurred in Canadian dollars. Therefore, an increase in the value of the Canadian dollar relative to the U.S. dollar reduces the revenue in Canadian dollar terms realized by us from sales made in U.S. dollars, which reduces operating margin and the cash flow available to fund operations. We are also exposed to the risk of exchange rate fluctuations in the period between sale and payment. We also have a substantial amount of long-term debt repayable in U.S. dollars which is valued in Canadian dollars at the end of each reporting period by applying the prevailing exchange rate. Exchange rate fluctuations result in exchange gains or losses. This results in significant earnings sensitivity to changes in the Canadian/U.S. dollar exchange rate. The Canadian/U.S. dollar
- 67 -
exchange rate is affected by a broad range of factors which makes future rates difficult to accurately predict.
Competition
We compete with global producers, some of which may have greater financial resources and lower production costs than we do. Currency devaluations can have the effect of reducing our competitors’ costs and making our products less competitive in certain markets. In addition, European lumber producers and South American panel producers may enter the North American market during periods of peak prices. Markets for our products are highly competitive. Our ability to maintain or improve the cost of producing and delivering products to those markets is crucial. Factors such as cost and availability of raw materials, energy and labour, the ability to maintain high operating rates and low per-unit manufacturing costs, and the quality of our final products and our customer service all affect our earnings. Some of our products are also particularly sensitive to other factors including innovation, quality and service, with varying emphasis on these factors depending on the product. To the extent that one or more of our competitors become more successful with respect to any key competitive factor, our ability to attract and retain customers could be materially adversely affected. If we are unable to compete effectively, such failure could have a material adverse effect on our business, financial condition and results of operations.
Our products may compete with non-fibre based alternatives or with alternative products in certain market segments. For example, steel, engineered wood products, plastic, wood/plastic or composite materials may be used by builders as alternatives to the products produced by our wood products businesses such as lumber, plywood and MDF products. Changes in prices for oil, chemicals and wood-based fibre can change the competitive position of our products relative to available alternatives and could increase substitution of those products for our products. As the use of these alternatives grows, demand for our products may further decline.
Because commodity products have few distinguishing properties from producer to producer, competition for these products is based primarily on price, which is determined by supply relative to demand and competition from substitute products. Prices for our products are affected by many factors outside of our control, and we have no influence over the timing and extent of price changes, which often are volatile. Accordingly, our revenues may be negatively affected by pricing decisions made by our competitors and by decisions of our customers to purchase products from our competitors.
Pension Plan Funding
We are the sponsor of several defined benefit pension plans which exposes us to market risks related to plan assets. Funding requirements for these plans are based on actuarial assumptions concerning expected return on plan assets, future salary increases, life expectancy and interest rates. If any of these assumptions differs from actual outcomes such that a funding deficiency occurs or increases, we would be required to increase cash funding contributions which would in turn reduce the availability of capital for other purposes. We are also subject to regulatory changes regarding these plans which may increase the funding requirements which would in turn reduce the availability of capital for other purposes.
- 68 -
Information Technology
We are reliant on our information and operations technology systems to operate our manufacturing facilities, access fibre, communicate internally and with suppliers and customers, to sell our products and to process payments and payroll as well as for other corporate purposes and financial reporting. An interruption or failure of our information and operations technology systems could result in a material adverse effect on our business, financial condition and results of operations.
In the ordinary course of our business, we collect and store sensitive data, including intellectual property, proprietary business and confidential financial information and identifiable personal information of our employees. We rely on industry accepted security measures and technology to protect our information systems and confidential and proprietary information.
However, our information and operations technology systems, including process control systems, are still subject to cyber security risks and are vulnerable to attacks by hackers or others or breaches due to employee error or other disruptions. Any such attack on or breach of our systems including through exposure to potential computer viruses or malware could compromise our systems and stored information may be accessed, publicly disclosed, lost or compromised, which could result in legal claims or proceedings, liability under laws that protect the privacy of personal information, regulatory penalties, disruptions to our operations, decreased performance and production, increased costs, and damage to our reputation, which could have a material adverse effect on our business, financial condition and results of operations.
Disclosure Controls and Internal Controls Over Financial Reporting
West Fraser’s management, including our President and Chief Executive Officer and our Vice-President, Finance and Chief Financial Officer, acknowledge responsibility for the design and operation of disclosure controls and procedures and internal controls over financial reporting, and the requirement to evaluate the effectiveness of these controls on an annual basis.
Management evaluated the effectiveness of these controls at the end of the reporting period and based on this evaluation concluded that our internal controls over financial reporting and the disclosure controls and procedures were effective as at December 31, 2017.
No Changes in Internal Controls Over Financial Reporting
There has been no change in our internal controls over financial reporting during the year ended December 31, 2017 that has materially affected, or is reasonably likely to materially affect, our internal controls over financial reporting.
Additional information relating to West Fraser, including our Annual Information Form, can be found on SEDAR at www.sedar.com.
- 69 -
RESPONSIBILITY OF MANAGEMENT
The management of West Fraser Timber Co. Ltd. (“West Fraser”, “we”, “us” or “our”) is responsible for the preparation, integrity, objectivity and reliability of the consolidated financial statements. The consolidated financial statements have been prepared in accordance with International Financial Reporting Standards and necessarily include amounts that represent the best estimates and judgments of management.
We maintain a system of internal controls over financial reporting that encompasses policies, procedures and controls to provide reasonable assurance that assets are safeguarded against loss or unauthorized use, transactions are executed and recorded with appropriate authorization and financial records are accurate and reliable.
Our independent auditor, which is appointed by the shareholders upon the recommendation of the Audit Committee and the Board of Directors, has completed its audit of the consolidated financial statements in accordance with generally accepted auditing standards in Canada and its report follows.
The Board of Directors provides oversight to the financial reporting process through its Audit Committee, which is comprised of four Directors, none of whom is an officer or employee of West Fraser. The Audit Committee meets regularly with representatives of management and of the auditor to review the consolidated financial statements and matters relating to the audit. The auditor has full and free access to the Audit Committee. The Audit Committee reports its findings to the Board of Directors for consideration in approving the consolidated financial statements for issuance to the shareholders.
Ted Seraphim Chris Virostek President and Vice-President, Finance Chief Executive Officer and Chief Financial Officer
February 14, 2018
- 70 -
INDEPENDENT AUDITOR’S REPORT
To the Shareholders of West Fraser Timber Co. Ltd.
We have audited the accompanying consolidated financial statements of West Fraser Timber Co. Ltd., which comprise the consolidated balance sheets as at December 31, 2017 and December 31, 2016 and the consolidated statements of earnings and comprehensive earnings, changes in shareholders’ equity and cash flows for the years then ended, and the related notes, which comprise a summary of significant accounting policies and other explanatory information.
Management’s responsibility for the consolidated financial statements
Management is responsible for the preparation and fair presentation of these consolidated financial statements in accordance with International Financial Reporting Standards, and for such internal control as management determines is necessary to enable the preparation of consolidated financial statements that are free from material misstatement, whether due to fraud or error.
Auditor’s responsibility
Our responsibility is to express an opinion on these consolidated financial statements based on our audits. We conducted our audits in accordance with Canadian generally accepted auditing standards. Those standards require that we comply with ethical requirements and plan and perform the audit to obtain reasonable assurance about whether the consolidated financial statements are free from material misstatement.
An audit involves performing procedures to obtain audit evidence about the amounts and disclosures in the consolidated financial statements. The procedures selected depend on the auditor’s judgment, including the assessment of the risks of material misstatement of the consolidated financial statements, whether due to fraud or error. In making those risk assessments, the auditor considers internal control relevant to the entity’s preparation and fair presentation of the consolidated financial statements in order to design audit procedures that are appropriate in the circumstances, but not for the purpose of expressing an opinion on the effectiveness of the entity’s internal control. An audit also includes evaluating the appropriateness of accounting policies used and the reasonableness of accounting estimates made by management, as well as evaluating the overall presentation of the consolidated financial statements.
We believe that the audit evidence we have obtained in our audits is sufficient and appropriate to provide a basis for our audit opinion.
Opinion
In our opinion, the consolidated financial statements present fairly, in all material respects, the financial position of West Fraser Timber Co. Ltd. as at December 31, 2017 and December 31, 2016 and its financial performance and its cash flows for the years then ended in accordance with International Financial Reporting Standards.
Chartered Professional Accountants Vancouver, British Columbia February 14, 2018
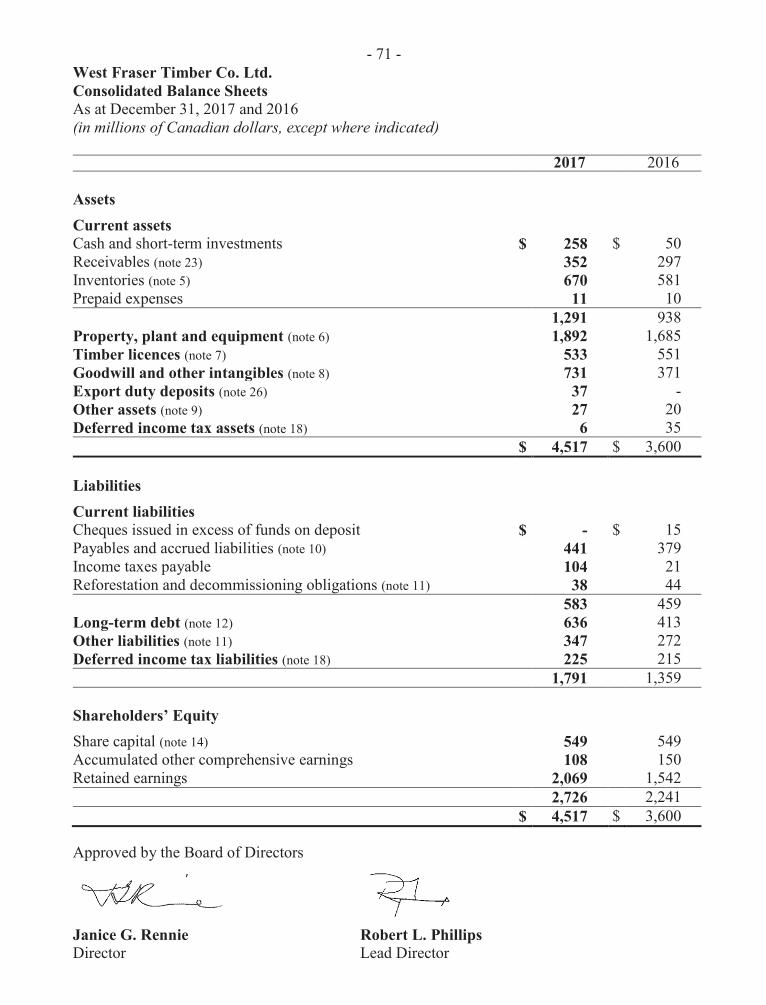
- 71 - West Fraser Timber Co. Ltd. Consolidated Balance Sheets As at December 31, 2017 and 2016 (in millions of Canadian dollars, except where indicated) 2017 2016 Assets Current assets Cash and short-term investments $ 258 $ 50 Receivables (note 23) 352 297 Inventories (note 5) 670 581 Prepaid expenses 11 10 1,291 938 Property, plant and equipment (note 6) 1,892 1,685 Timber licences (note 7) 533 551 Goodwill and other intangibles (note 8) 731 371 Export duty deposits (note 26) 37 - Other assets (note 9) 27 20 Deferred income tax assets (note 18) 6 35 $ 4,517 $ 3,600 Liabilities Current liabilities Cheques issued in excess of funds on deposit $ - $ 15 Payables and accrued liabilities (note 10) 441 379 Income taxes payable 104 21 Reforestation and decommissioning obligations (note 11) 38 44 583 459 Long-term debt (note 12) 636 413 Other liabilities (note 11) 347 272 Deferred income tax liabilities (note 18) 225 215 1,791 1,359 Shareholders’ Equity Share capital (note 14) 549 549 Accumulated other comprehensive earnings 108 150 Retained earnings 2,069 1,542 2,726 2,241 $ 4,517 $ 3,600
Approved by the Board of Directors
Janice G. Rennie Robert L. Phillips Director Lead Director
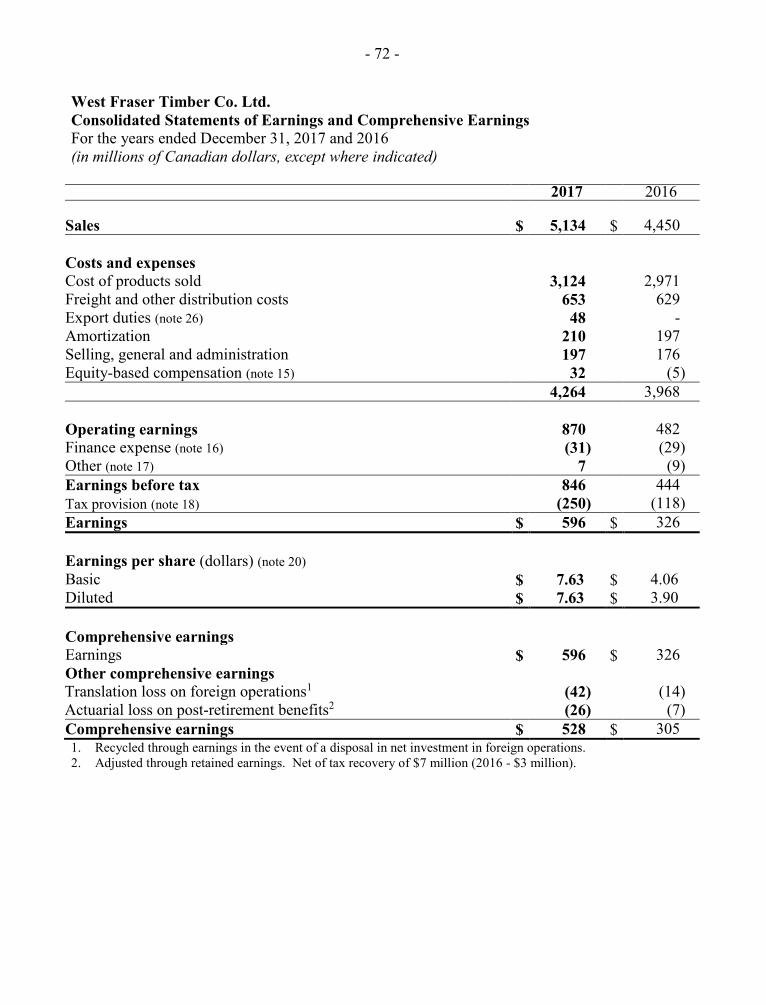
- 72 -
West Fraser Timber Co. Ltd. Consolidated Statements of Earnings and Comprehensive Earnings For the years ended December 31, 2017 and 2016 (in millions of Canadian dollars, except where indicated)
2017 2016 Sales $ 5,134 $ 4,450 Costs and expenses Cost of products sold 3,124 2,971 Freight and other distribution costs 653 629 Export duties (note 26) 48 - Amortization 210 197 Selling, general and administration 197 176 Equity-based compensation (note 15) 32 (5) 4,264 3,968 Operating earnings 870 482 Finance expense (note 16) (31) (29) Other (note 17) 7 (9) Earnings before tax 846 444 Tax provision (note 18) (250) (118) Earnings $ 596 $ 326 Earnings per share (dollars) (note 20) Basic $ 7.63 $ 4.06 Diluted $ 7.63 $ 3.90 Comprehensive earnings Earnings $ 596 $ 326 Other comprehensive earnings Translation loss on foreign operations1 (42) (14) Actuarial loss on post-retirement benefits2 (26) (7) Comprehensive earnings $ 528 $ 305 1. Recycled through earnings in the event of a disposal in net investment in foreign operations. 2. Adjusted through retained earnings. Net of tax recovery of $7 million (2016 - $3 million).
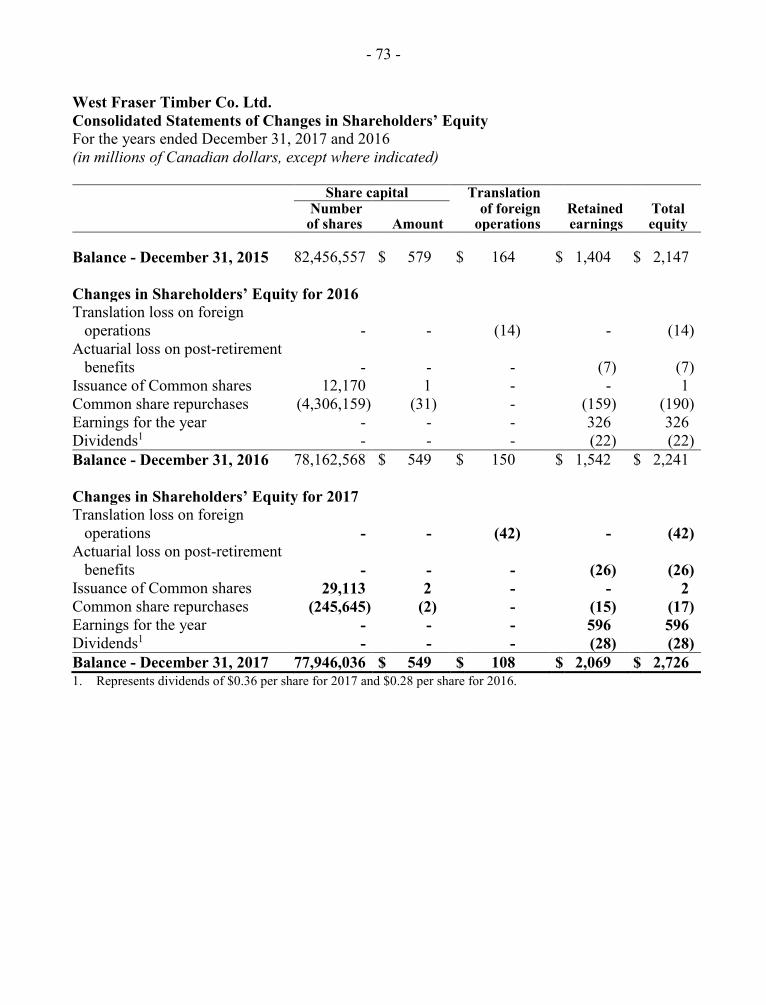
- 73 -
West Fraser Timber Co. Ltd. Consolidated Statements of Changes in Shareholders’ Equity For the years ended December 31, 2017 and 2016 (in millions of Canadian dollars, except where indicated)
Share capital Translation
Number
of shares Amount of foreign
operations Retained earnings
Total equity
Balance - December 31, 2015 82,456,557 $ 579 $ 164 $ 1,404 $ 2,147 Changes in Shareholders’ Equity for 2016 Translation loss on foreign
operations - - (14) - (14) Actuarial loss on post-retirement
benefits - - - (7) (7) Issuance of Common shares 12,170 1 - - 1 Common share repurchases (4,306,159) (31) - (159) (190) Earnings for the year - - - 326 326 Dividends1 - - - (22) (22) Balance - December 31, 2016 78,162,568 $ 549 $ 150 $ 1,542 $ 2,241 Changes in Shareholders’ Equity for 2017 Translation loss on foreign
operations - - (42) - (42) Actuarial loss on post-retirement
benefits - - - (26) (26) Issuance of Common shares 29,113 2 - - 2 Common share repurchases (245,645) (2) - (15) (17) Earnings for the year - - - 596 596 Dividends1 - - - (28) (28) Balance - December 31, 2017 77,946,036 $ 549 $ 108 $ 2,069 $ 2,726 1. Represents dividends of $0.36 per share for 2017 and $0.28 per share for 2016.
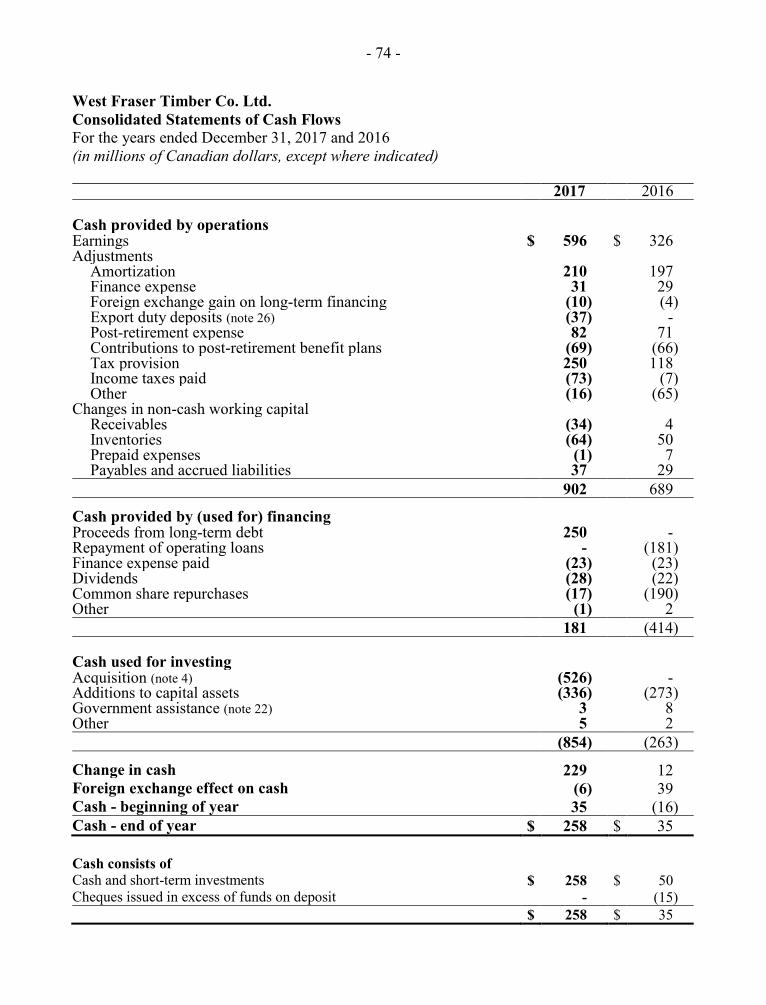
- 74 -
West Fraser Timber Co. Ltd. Consolidated Statements of Cash Flows For the years ended December 31, 2017 and 2016 (in millions of Canadian dollars, except where indicated)
2017 2016 Cash provided by operations Earnings $ 596 $ 326 Adjustments
Amortization 210 197 Finance expense 31 29 Foreign exchange gain on long-term financing (10) (4) Export duty deposits (note 26) (37) - Post-retirement expense 82 71 Contributions to post-retirement benefit plans (69) (66) Tax provision 250 118 Income taxes paid (73) (7) Other (16) (65)
Changes in non-cash working capital Receivables (34) 4 Inventories (64) 50 Prepaid expenses (1) 7 Payables and accrued liabilities 37 29
902 689 Cash provided by (used for) financing Proceeds from long-term debt 250 - Repayment of operating loans - (181) Finance expense paid (23) (23) Dividends (28) (22) Common share repurchases (17) (190) Other (1) 2 181 (414) Cash used for investing Acquisition (note 4) (526) - Additions to capital assets (336) (273) Government assistance (note 22) 3 8 Other 5 2 (854) (263) Change in cash 229 12 Foreign exchange effect on cash (6) 39 Cash - beginning of year 35 (16) Cash - end of year $ 258 $ 35 Cash consists of Cash and short-term investments $ 258 $ 50 Cheques issued in excess of funds on deposit - (15) $ 258 $ 35
- 75 -
West Fraser Timber Co. Ltd. Notes to Consolidated Financial Statements For the years ended December 31, 2017 and 2016 (in millions of Canadian dollars, except where indicated)
1. Nature of operations
West Fraser Timber Co. Ltd. (“West Fraser”, “we”, “us” or “our”) is a diversified wood products company producing lumber, LVL, MDF, plywood, pulp, newsprint, wood chips and energy with facilities in western Canada and the southern United States. Our executive office is located at 858 Beatty Street, Suite 501, Vancouver, British Columbia. West Fraser was formed by articles of amalgamation under the Business Corporations Act (British Columbia) and is registered in British Columbia, Canada. Our Common shares are listed for trading on the Toronto Stock Exchange under the symbol WFT.
2. Basis of presentation
These consolidated financial statements are prepared in accordance with International Financial Reporting Standards (“IFRS”) and were approved by our Board of Directors on February 14, 2018.
Our consolidated financial statements have been prepared under the historical cost basis, except for certain items as discussed in the applicable accounting policies.
Accounting policies that relate to the consolidated financial statements as a whole are incorporated in this note. Where an accounting policy is applicable to a specific note disclosure, the policy is described within the respective note.
Accounting policies
Basis of consolidation
These consolidated financial statements include the accounts of West Fraser and its wholly-owned subsidiaries after the elimination of intercompany transactions and balances. Principal operating subsidiaries are West Fraser Mills Ltd., West Fraser, Inc., West Fraser Wood Products Inc., West Fraser Southeast, Inc., Blue Ridge Lumber Inc., Sundre Forest Products Inc., Manning Forest Products Ltd. and West Fraser Newsprint Ltd.
Our 50% owned joint operations, Alberta Newsprint Company and Cariboo Pulp & Paper Company, are accounted for by the proportionate consolidation method.
Use of estimates and judgments
The preparation of consolidated financial statements requires management to make estimates and assumptions that affect the amounts reported in the consolidated financial statements and accompanying notes. It also requires management to exercise judgement in the process of applying accounting policies. Significant areas requiring estimates include recoverability of long-lived assets and goodwill, duty deposits related to the softwood lumber dispute, fair value
- 76 -
of derivatives, reforestation and decommissioning obligations, employee future benefits, equity-based compensation, income taxes and litigation. Actual amounts could differ materially from these and other estimates, the impact of which would be recorded in future periods. Management uses judgments and assumptions in assessing potential indicators of impairment, determining the appropriate cash generating unit level used in impairment testing and determining the accounting treatment for certain investments where we own less than 100% of the entity.
Revenue recognition
Revenues are derived from product sales and are recognized upon the transfer of significant risks and rewards of ownership, provided collectability is reasonably assured.
Foreign currency translation
Our functional and presentation currency is Canadian dollars.
U.S. operations
Assets and liabilities of our U.S. operations have a functional currency of U.S. dollars and are translated at the period-end exchange rate. Revenues and expenses are translated at average exchange rates during the reporting period. The resulting unrealized translation gains or losses are included in other comprehensive earnings.
Translation of other foreign currency balances and transactions
Monetary assets and liabilities denominated in foreign currencies, including long-term financing, are translated at the period-end exchange rate. Income and expense items are translated at the average or transaction date exchange rates during the reporting period. The resulting translation gains or losses are included in other income.
Cash and short-term investments
Cash and short-term investments consist of cash on deposit and short-term interest-bearing securities maturing within three months of the date of purchase.
Impairment of long-lived assets
We review property, plant, equipment, timber licences, goodwill and other intangibles for impairment whenever events or changes in circumstances indicate that the carrying amount may not be fully recoverable. Goodwill impairment testing is done at least once a year. For the purpose of impairment testing, assets are separated into cash generating units (“CGUs”). We have identified each of our mills as a CGU for impairment testing of property, plant, equipment and other intangibles unless there is economic interdependence of CGUs, in which case they are grouped for impairment testing. Timber licences and goodwill are tested for impairment by combining CGUs within the economic area of the related assets.
- 77 -
Recoverability is assessed by comparing the carrying amount of the CGU or grouped CGUs to the discounted estimated net future cash flows the assets are expected to generate. If the carrying amount exceeds the discounted estimated net future cash flows, the assets are written down to the higher of fair value less costs to sell and value-in-use (being the present value of the estimated net future cash flows of the relevant asset or CGU).
Goodwill impairment is assessed by comparing the fair value of its CGU to the underlying carrying amount of the CGU’s net assets, including goodwill. When the carrying amount of the CGU exceeds its fair value, the fair value of the CGU’s goodwill is compared with its carrying amount. An impairment loss is recognized for any excess of the carrying value of goodwill over its fair value.
Estimated net future cash flows are based on several assumptions concerning future circumstances including selling prices of products, U.S./Canadian dollar exchange rates, production rates, input costs and capital requirements. The estimated net future cash flows are discounted at rates reflective of market risk.
Where an impairment loss for long-lived assets, other than goodwill, subsequently reverses the carrying amount of the asset or CGU is increased to the lesser of the revised estimate of its recoverable amount and the carrying amount that would have been recorded had no impairment loss been previously recognized. Goodwill impairment is never reversed.
Fair value measurements
Fair value is the price that would be received to sell an asset or paid to transfer a liability in an orderly transaction between market participants at the measurement date, regardless of whether that price is directly observable or estimated using another valuation technique. For financial reporting purposes, fair value measurements are categorized into Level 1, 2 or 3 based on the degree to which the inputs to the fair value measurement are observable and the significance of the inputs. Our fair value hierarchy prioritizes the inputs to valuation techniques used to measure fair value.
The three levels of the fair value hierarchy are:
Level 1
Values based on unadjusted quoted prices in active markets that are accessible at the measurement date for identical assets or liabilities.
Level 2
Values based on quoted prices in markets that are not active or model inputs that are observable either directly or indirectly for substantially the full term of the asset or liability.
Level 3
Values based on prices or valuation techniques that require inputs which are both unobservable and significant to the overall fair value measurement.
- 78 -
3. Accounting standards issued but not yet applied
IFRS 9 - Financial Instruments
In November 2009, IFRS 9 was issued and in October 2010 was further amended. IFRS 9 addresses classification and measurement of financial assets and replaces the multiple category and measurement models in International Accounting Standards (“IAS”) 39 - Financial Instruments: Recognition and Measurement for debt instruments with a new mixed measurement model having only two categories: amortized cost and fair value through profit or loss. IFRS 9 also replaces the models for measuring equity instruments and such instruments are either recognized at fair value through profit or loss or at fair value through other comprehensive earnings. This standard is effective for annual periods beginning on or after January 1, 2018. We do not expect this standard to have a significant effect on our consolidated financial statements.
IFRS 15 - Revenue from Contracts with Customers
In May 2014, IFRS 15 was issued. This standard addresses revenue recognition and establishes principles for reporting information about the nature, amount, timing and uncertainty of revenue and cash flows arising from an entity’s contracts with customers. Revenue is recognized when a customer obtains control of a good or service and thus has the ability to control its use and obtain the benefits from the good or service. The standard replaces IAS 18 - Revenue, IAS 11 - Construction Contracts and the related interpretations. The standard is effective for annual periods beginning on or after January 1, 2018. We do not expect this standard to have a significant effect on our consolidated financial statements.
IFRS 16 - Leases
In January 2016, IFRS 16 was issued. This standard requires, among other things, lessees to recognize leases traditionally recorded as operating leases in the same manner as financing leases. The standard is effective for annual periods beginning on or after January 1, 2019 with earlier application permitted. We do not expect this standard to have a significant effect on our consolidated financial statements.
There are no other standards or amendments or interpretations to existing standards issued but not yet effective which are expected to have a material impact on our consolidated financial statements.
4. Acquisition
On August 31, 2017, we completed the acquisition of six sawmills that produce southern yellow pine lumber and a finger-joint mill in Florida and Georgia as well as an administrative office in Georgia (the “Gilman Acquisition”). The consideration paid, net of cash acquired, was $526 million (US$419 million) and the transaction was an acquisition of shares. The acquisition was financed with cash on hand, borrowings on our revolving credit facility and a $250 million (US$200 million) term loan.
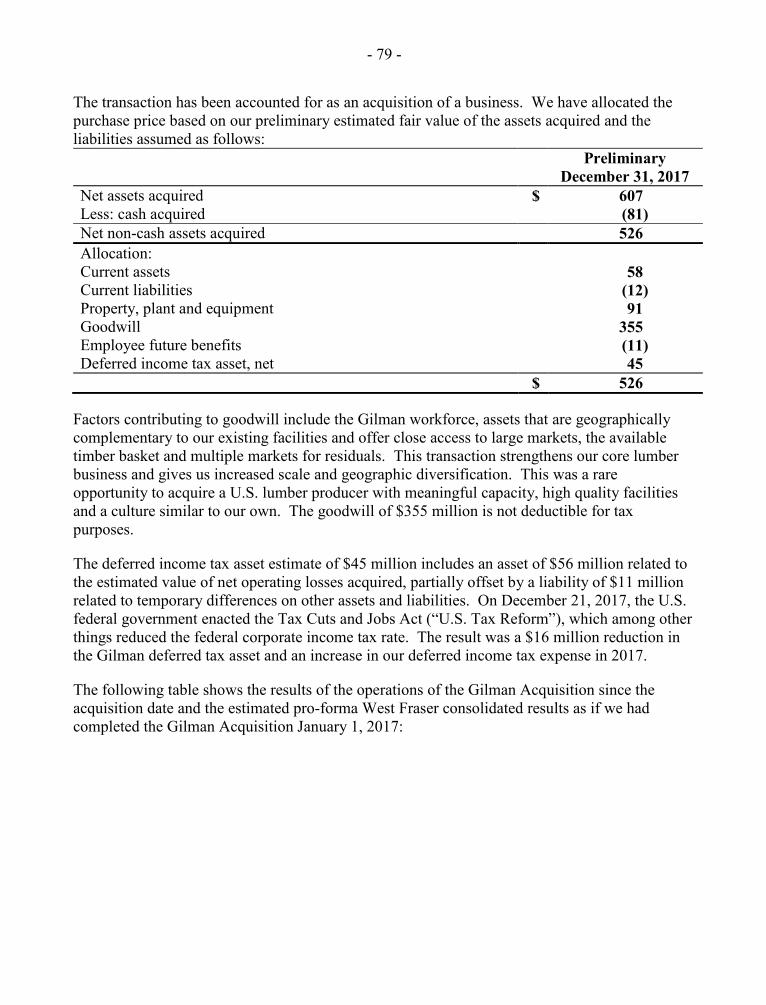
- 79 -
The transaction has been accounted for as an acquisition of a business. We have allocated the purchase price based on our preliminary estimated fair value of the assets acquired and the liabilities assumed as follows: Preliminary
December 31, 2017 Net assets acquired $ 607 Less: cash acquired (81) Net non-cash assets acquired 526 Allocation: Current assets 58 Current liabilities (12) Property, plant and equipment 91 Goodwill 355 Employee future benefits (11) Deferred income tax asset, net 45 $ 526
Factors contributing to goodwill include the Gilman workforce, assets that are geographically complementary to our existing facilities and offer close access to large markets, the available timber basket and multiple markets for residuals. This transaction strengthens our core lumber business and gives us increased scale and geographic diversification. This was a rare opportunity to acquire a U.S. lumber producer with meaningful capacity, high quality facilities and a culture similar to our own. The goodwill of $355 million is not deductible for tax purposes.
The deferred income tax asset estimate of $45 million includes an asset of $56 million related to the estimated value of net operating losses acquired, partially offset by a liability of $11 million related to temporary differences on other assets and liabilities. On December 21, 2017, the U.S. federal government enacted the Tax Cuts and Jobs Act (“U.S. Tax Reform”), which among other things reduced the federal corporate income tax rate. The result was a $16 million reduction in the Gilman deferred tax asset and an increase in our deferred income tax expense in 2017.
The following table shows the results of the operations of the Gilman Acquisition since the acquisition date and the estimated pro-forma West Fraser consolidated results as if we had completed the Gilman Acquisition January 1, 2017:
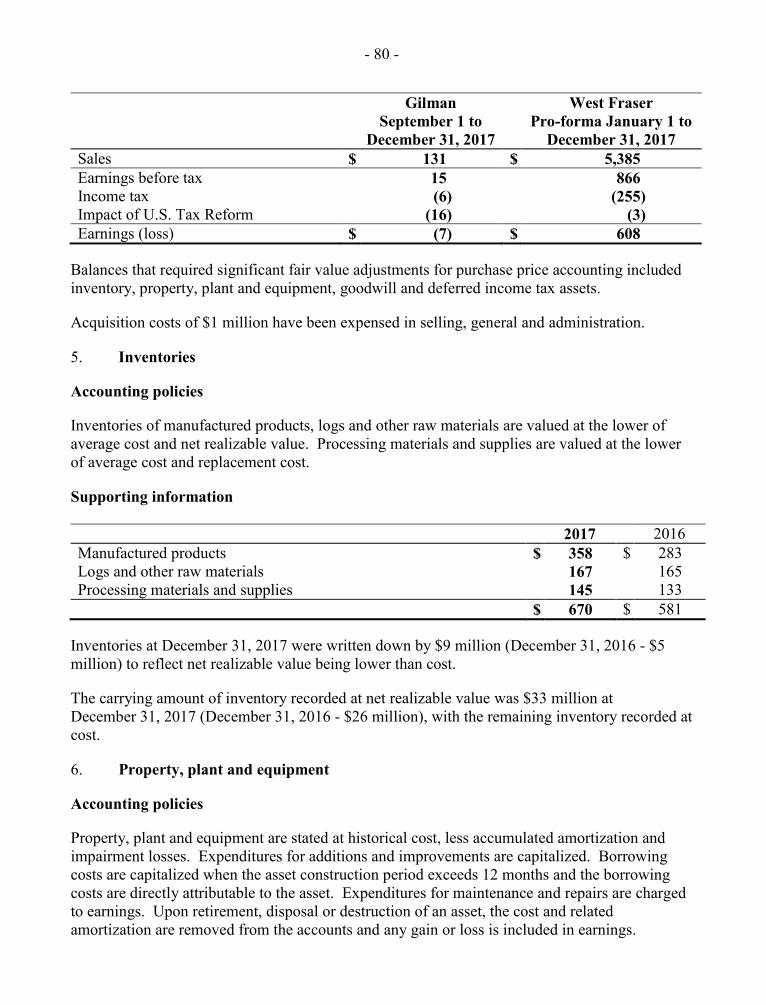
- 80 -
Gilman September 1 to
December 31, 2017
West Fraser Pro-forma January 1 to
December 31, 2017 Sales $ 131 $ 5,385 Earnings before tax 15 866 Income tax (6) (255) Impact of U.S. Tax Reform (16) (3) Earnings (loss) $ (7) $ 608
Balances that required significant fair value adjustments for purchase price accounting included inventory, property, plant and equipment, goodwill and deferred income tax assets.
Acquisition costs of $1 million have been expensed in selling, general and administration.
5. Inventories
Accounting policies
Inventories of manufactured products, logs and other raw materials are valued at the lower of average cost and net realizable value. Processing materials and supplies are valued at the lower of average cost and replacement cost.
Supporting information 2017 2016 Manufactured products $ 358 $ 283 Logs and other raw materials 167 165 Processing materials and supplies 145 133 $ 670 $ 581
Inventories at December 31, 2017 were written down by $9 million (December 31, 2016 - $5 million) to reflect net realizable value being lower than cost.
The carrying amount of inventory recorded at net realizable value was $33 million at December 31, 2017 (December 31, 2016 - $26 million), with the remaining inventory recorded at cost.
6. Property, plant and equipment
Accounting policies
Property, plant and equipment are stated at historical cost, less accumulated amortization and impairment losses. Expenditures for additions and improvements are capitalized. Borrowing costs are capitalized when the asset construction period exceeds 12 months and the borrowing costs are directly attributable to the asset. Expenditures for maintenance and repairs are charged to earnings. Upon retirement, disposal or destruction of an asset, the cost and related amortization are removed from the accounts and any gain or loss is included in earnings.
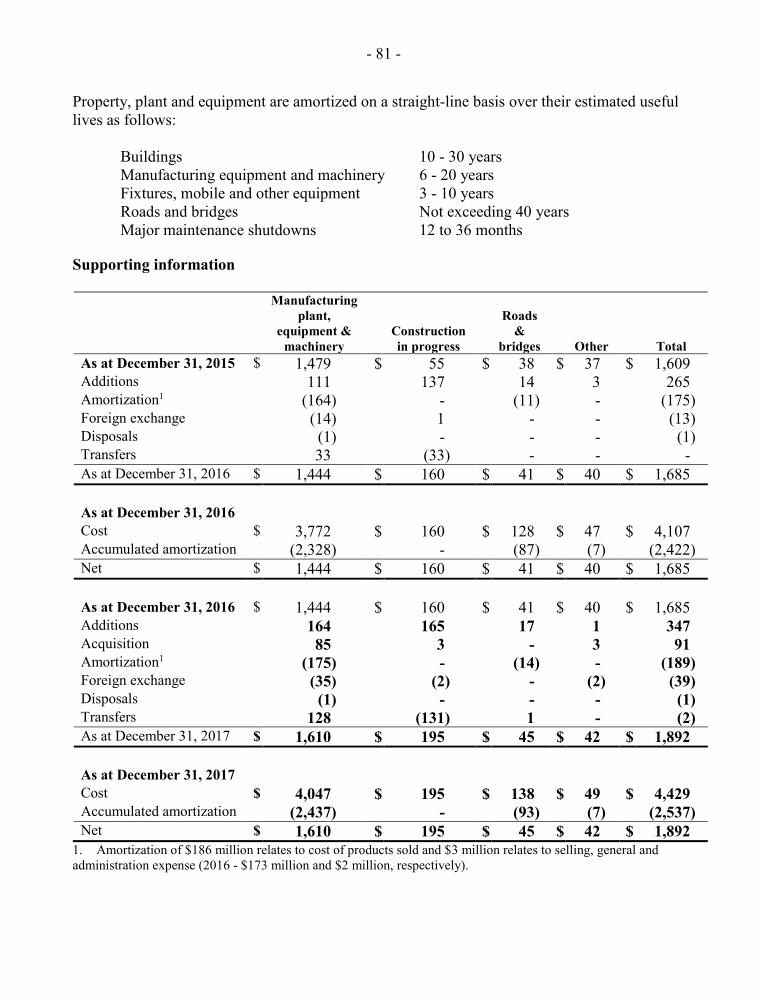
- 81 -
Property, plant and equipment are amortized on a straight-line basis over their estimated useful lives as follows:
Buildings 10 - 30 years Manufacturing equipment and machinery 6 - 20 years Fixtures, mobile and other equipment 3 - 10 years Roads and bridges Not exceeding 40 years Major maintenance shutdowns 12 to 36 months
Supporting information
Manufacturing plant,
equipment & machinery
Constructionin progress
Roads &
bridges Other Total As at December 31, 2015 $ 1,479 $ 55 $ 38 $ 37 $ 1,609 Additions 111 137 14 3 265 Amortization1 (164) - (11) - (175) Foreign exchange (14) 1 - - (13) Disposals (1) - - - (1) Transfers 33 (33) - - - As at December 31, 2016 $ 1,444 $ 160 $ 41 $ 40 $ 1,685 As at December 31, 2016 Cost $ 3,772 $ 160 $ 128 $ 47 $ 4,107 Accumulated amortization (2,328) - (87) (7) (2,422) Net $ 1,444 $ 160 $ 41 $ 40 $ 1,685 As at December 31, 2016 $ 1,444 $ 160 $ 41 $ 40 $ 1,685 Additions 164 165 17 1 347 Acquisition 85 3 - 3 91 Amortization1 (175) - (14) - (189) Foreign exchange (35) (2) - (2) (39) Disposals (1) - - - (1) Transfers 128 (131) 1 - (2) As at December 31, 2017 $ 1,610 $ 195 $ 45 $ 42 $ 1,892 As at December 31, 2017 Cost $ 4,047 $ 195 $ 138 $ 49 $ 4,429 Accumulated amortization (2,437) - (93) (7) (2,537) Net $ 1,610 $ 195 $ 45 $ 42 $ 1,892
1. Amortization of $186 million relates to cost of products sold and $3 million relates to selling, general and administration expense (2016 - $173 million and $2 million, respectively).
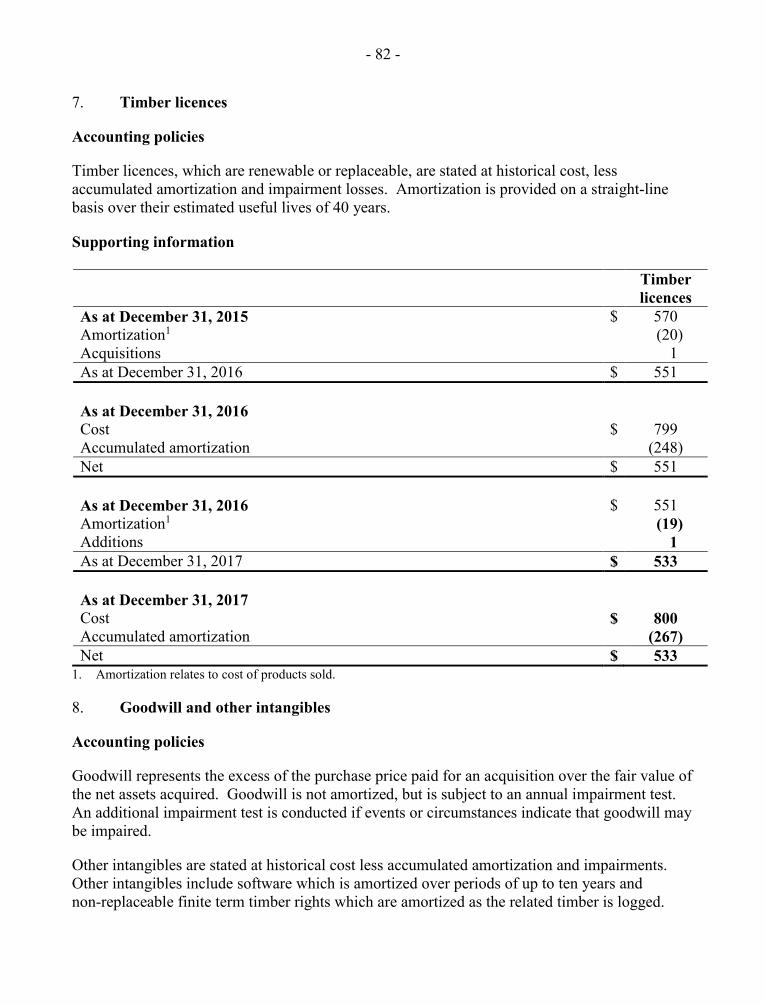
- 82 -
7. Timber licences
Accounting policies
Timber licences, which are renewable or replaceable, are stated at historical cost, less accumulated amortization and impairment losses. Amortization is provided on a straight-line basis over their estimated useful lives of 40 years.
Supporting information
Timber licences
As at December 31, 2015 $ 570 Amortization1 (20) Acquisitions 1 As at December 31, 2016 $ 551 As at December 31, 2016 Cost $ 799 Accumulated amortization (248) Net $ 551 As at December 31, 2016 $ 551 Amortization1 (19) Additions 1 As at December 31, 2017 $ 533 As at December 31, 2017 Cost $ 800 Accumulated amortization (267) Net $ 533
1. Amortization relates to cost of products sold.
8. Goodwill and other intangibles
Accounting policies
Goodwill represents the excess of the purchase price paid for an acquisition over the fair value of the net assets acquired. Goodwill is not amortized, but is subject to an annual impairment test. An additional impairment test is conducted if events or circumstances indicate that goodwill may be impaired.
Other intangibles are stated at historical cost less accumulated amortization and impairments. Other intangibles include software which is amortized over periods of up to ten years and non-replaceable finite term timber rights which are amortized as the related timber is logged.
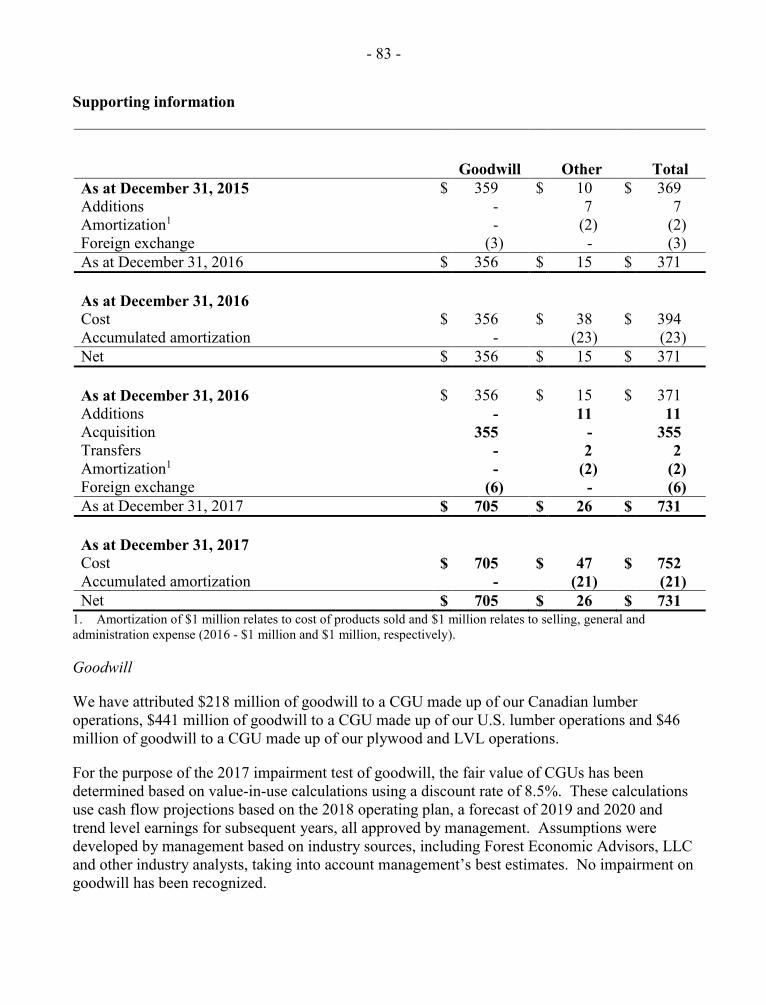
- 83 -
Supporting information
Goodwill Other Total As at December 31, 2015 $ 359 $ 10 $ 369 Additions - 7 7 Amortization1 - (2) (2) Foreign exchange (3) - (3) As at December 31, 2016 $ 356 $ 15 $ 371 As at December 31, 2016 Cost $ 356 $ 38 $ 394 Accumulated amortization - (23) (23) Net $ 356 $ 15 $ 371 As at December 31, 2016 $ 356 $ 15 $ 371 Additions - 11 11 Acquisition 355 - 355 Transfers - 2 2 Amortization1 - (2) (2) Foreign exchange (6) - (6) As at December 31, 2017 $ 705 $ 26 $ 731 As at December 31, 2017 Cost $ 705 $ 47 $ 752 Accumulated amortization - (21) (21) Net $ 705 $ 26 $ 731
1. Amortization of $1 million relates to cost of products sold and $1 million relates to selling, general and administration expense (2016 - $1 million and $1 million, respectively).
Goodwill
We have attributed $218 million of goodwill to a CGU made up of our Canadian lumber operations, $441 million of goodwill to a CGU made up of our U.S. lumber operations and $46 million of goodwill to a CGU made up of our plywood and LVL operations.
For the purpose of the 2017 impairment test of goodwill, the fair value of CGUs has been determined based on value-in-use calculations using a discount rate of 8.5%. These calculations use cash flow projections based on the 2018 operating plan, a forecast of 2019 and 2020 and trend level earnings for subsequent years, all approved by management. Assumptions were developed by management based on industry sources, including Forest Economic Advisors, LLC and other industry analysts, taking into account management’s best estimates. No impairment on goodwill has been recognized.
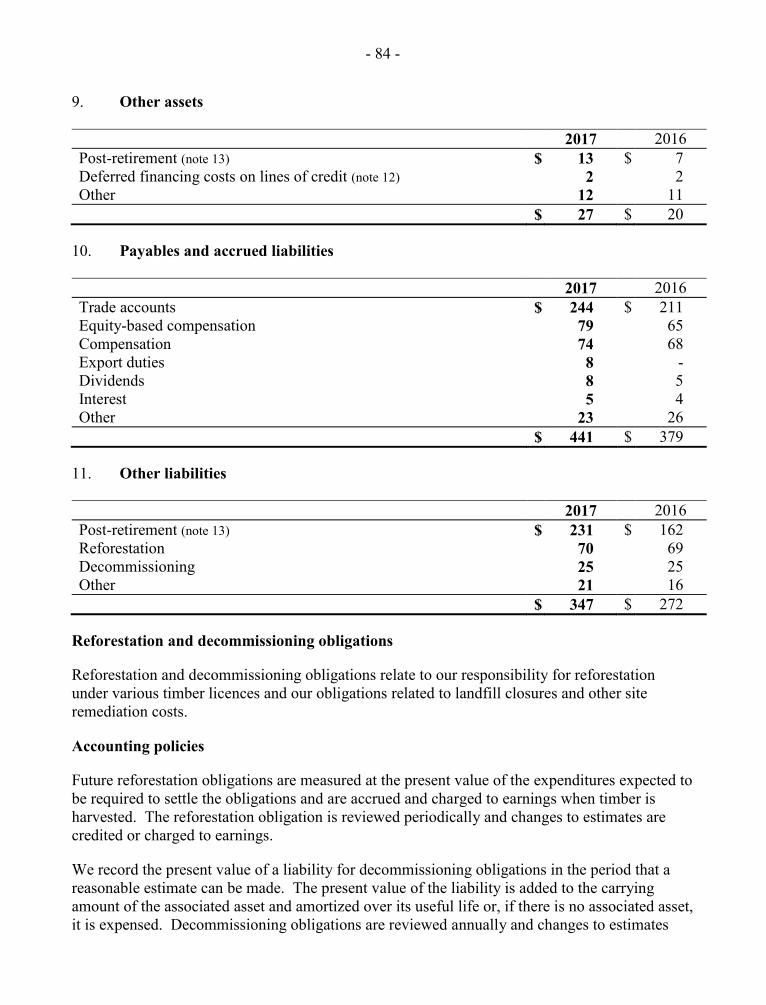
- 84 -
9. Other assets 2017 2016 Post-retirement (note 13) $ 13 $ 7 Deferred financing costs on lines of credit (note 12) 2 2 Other 12 11 $ 27 $ 20
10. Payables and accrued liabilities 2017 2016 Trade accounts $ 244 $ 211 Equity-based compensation 79 65 Compensation 74 68 Export duties 8 - Dividends 8 5 Interest 5 4 Other 23 26 $ 441 $ 379
11. Other liabilities 2017 2016 Post-retirement (note 13) $ 231 $ 162 Reforestation 70 69 Decommissioning 25 25 Other 21 16 $ 347 $ 272
Reforestation and decommissioning obligations
Reforestation and decommissioning obligations relate to our responsibility for reforestation under various timber licences and our obligations related to landfill closures and other site remediation costs.
Accounting policies
Future reforestation obligations are measured at the present value of the expenditures expected to be required to settle the obligations and are accrued and charged to earnings when timber is harvested. The reforestation obligation is reviewed periodically and changes to estimates are credited or charged to earnings.
We record the present value of a liability for decommissioning obligations in the period that a reasonable estimate can be made. The present value of the liability is added to the carrying amount of the associated asset and amortized over its useful life or, if there is no associated asset, it is expensed. Decommissioning obligations are reviewed annually and changes to estimates
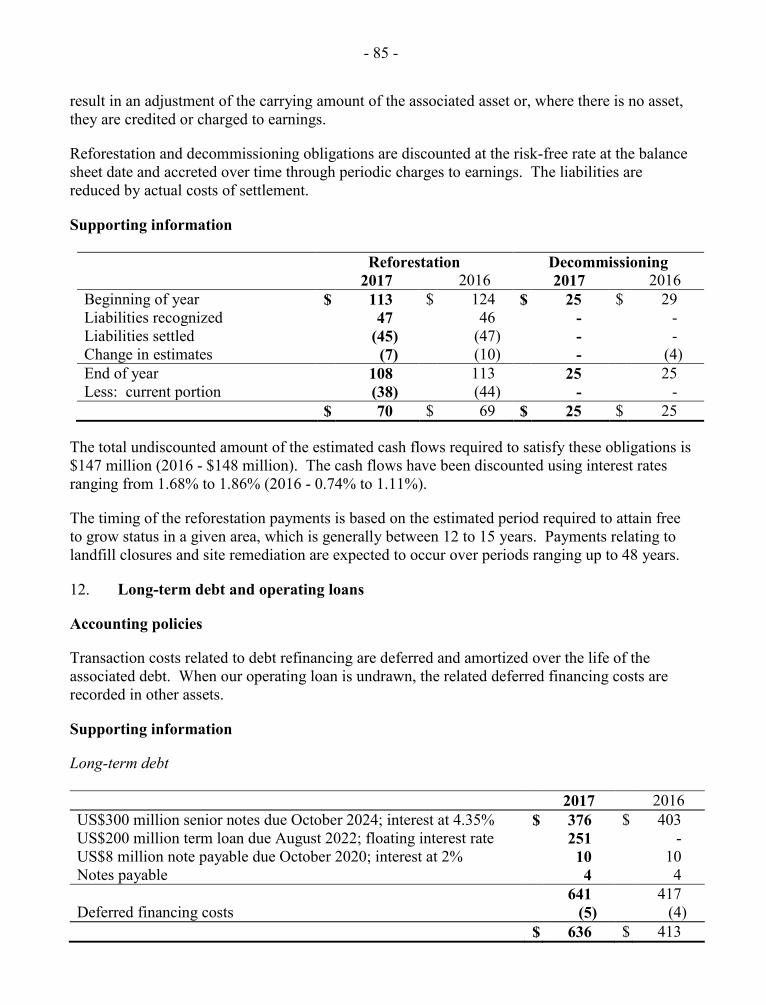
- 85 -
result in an adjustment of the carrying amount of the associated asset or, where there is no asset, they are credited or charged to earnings.
Reforestation and decommissioning obligations are discounted at the risk-free rate at the balance sheet date and accreted over time through periodic charges to earnings. The liabilities are reduced by actual costs of settlement.
Supporting information
Reforestation Decommissioning 2017 2016 2017 2016 Beginning of year $ 113 $ 124 $ 25 $ 29 Liabilities recognized 47 46 - - Liabilities settled (45) (47) - - Change in estimates (7) (10) - (4) End of year 108 113 25 25 Less: current portion (38) (44) - - $ 70 $ 69 $ 25 $ 25
The total undiscounted amount of the estimated cash flows required to satisfy these obligations is $147 million (2016 - $148 million). The cash flows have been discounted using interest rates ranging from 1.68% to 1.86% (2016 - 0.74% to 1.11%).
The timing of the reforestation payments is based on the estimated period required to attain free to grow status in a given area, which is generally between 12 to 15 years. Payments relating to landfill closures and site remediation are expected to occur over periods ranging up to 48 years.
12. Long-term debt and operating loans
Accounting policies
Transaction costs related to debt refinancing are deferred and amortized over the life of the associated debt. When our operating loan is undrawn, the related deferred financing costs are recorded in other assets.
Supporting information
Long-term debt 2017 2016 US$300 million senior notes due October 2024; interest at 4.35% $ 376 $ 403 US$200 million term loan due August 2022; floating interest rate 251 - US$8 million note payable due October 2020; interest at 2% 10 10 Notes payable 4 4 641 417 Deferred financing costs (5) (4) $ 636 $ 413
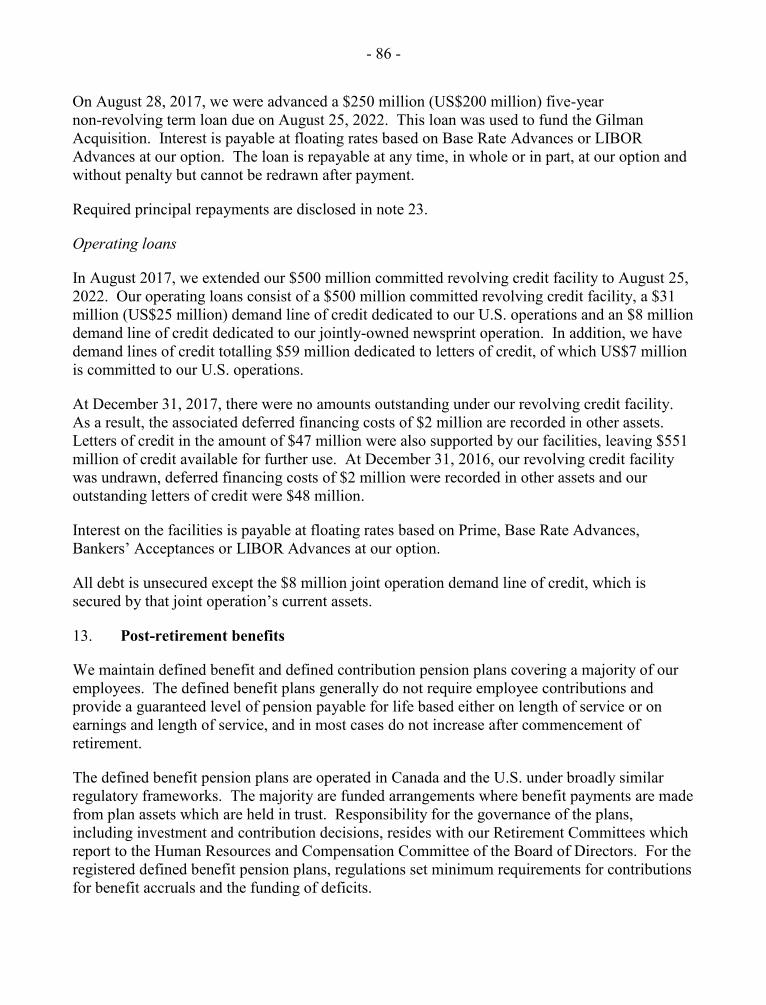
- 86 -
On August 28, 2017, we were advanced a $250 million (US$200 million) five-year non-revolving term loan due on August 25, 2022. This loan was used to fund the Gilman Acquisition. Interest is payable at floating rates based on Base Rate Advances or LIBOR Advances at our option. The loan is repayable at any time, in whole or in part, at our option and without penalty but cannot be redrawn after payment.
Required principal repayments are disclosed in note 23.
Operating loans
In August 2017, we extended our $500 million committed revolving credit facility to August 25, 2022. Our operating loans consist of a $500 million committed revolving credit facility, a $31 million (US$25 million) demand line of credit dedicated to our U.S. operations and an $8 million demand line of credit dedicated to our jointly-owned newsprint operation. In addition, we have demand lines of credit totalling $59 million dedicated to letters of credit, of which US$7 million is committed to our U.S. operations.
At December 31, 2017, there were no amounts outstanding under our revolving credit facility. As a result, the associated deferred financing costs of $2 million are recorded in other assets. Letters of credit in the amount of $47 million were also supported by our facilities, leaving $551 million of credit available for further use. At December 31, 2016, our revolving credit facility was undrawn, deferred financing costs of $2 million were recorded in other assets and our outstanding letters of credit were $48 million.
Interest on the facilities is payable at floating rates based on Prime, Base Rate Advances, Bankers’ Acceptances or LIBOR Advances at our option.
All debt is unsecured except the $8 million joint operation demand line of credit, which is secured by that joint operation’s current assets.
13. Post-retirement benefits
We maintain defined benefit and defined contribution pension plans covering a majority of our employees. The defined benefit plans generally do not require employee contributions and provide a guaranteed level of pension payable for life based either on length of service or on earnings and length of service, and in most cases do not increase after commencement of retirement.
The defined benefit pension plans are operated in Canada and the U.S. under broadly similar regulatory frameworks. The majority are funded arrangements where benefit payments are made from plan assets which are held in trust. Responsibility for the governance of the plans, including investment and contribution decisions, resides with our Retirement Committees which report to the Human Resources and Compensation Committee of the Board of Directors. For the registered defined benefit pension plans, regulations set minimum requirements for contributions for benefit accruals and the funding of deficits.
- 87 -
Accounting policies
We record a post-retirement asset or liability for our employee defined benefit pension and other retirement benefit plans by netting our plan assets with our plan obligations, on a plan-by-plan basis.
The cost of defined benefit pensions and other retirement benefits earned by employees is actuarially determined using the projected unit credit method. The present value of the defined benefit obligation is determined by discounting the estimated future cash outflows using market yields from high quality Canadian corporate bonds with cash flows that approximate expected benefit payments at the balance sheet date. Plan assets are valued at fair value at each balance sheet date.
Actuarial gains and losses arising from experience adjustments and changes in actuarial assumptions are charged or credited to equity in other comprehensive earnings in the period in which they arise.
Past service costs arising from plan amendments are recognized immediately.
The finance amount on net post-retirement balances is classified as finance expense.
For defined contribution plans, pension expense is the amount of contributions we are required to make in respect of services rendered by employees.
Supporting information
The actual return on plan assets for 2017 is a gain of $123 million (2016 - $112 million). The total pension expense for the defined benefit plans is $72 million (2016 - $61 million). In 2017, we made contributions of $52 million (2016 - $50 million). We expect to contribute approximately $75 million to our defined benefit pension plans during 2018. We also provide group life insurance, medical and extended health benefits to certain employee groups, for which we contributed $3 million (2016 - $3 million).
The total pension expense and funding contributions for the defined contribution pension plans is $14 million (2016 - $13 million).
In 2017, we settled the defined benefit obligation for two of our pension plans by purchasing annuities for the remaining defined benefit members of these plans. The difference between the cost of the annuity purchase and the liabilities held for these plans is reflected as a settlement cost.
Subsequent to year-end, we settled approximately $143 million of our defined benefit obligation by purchasing annuities using plan assets.
The status of the defined benefit pension plans and other retirement benefit plans, in aggregate, is as follows:
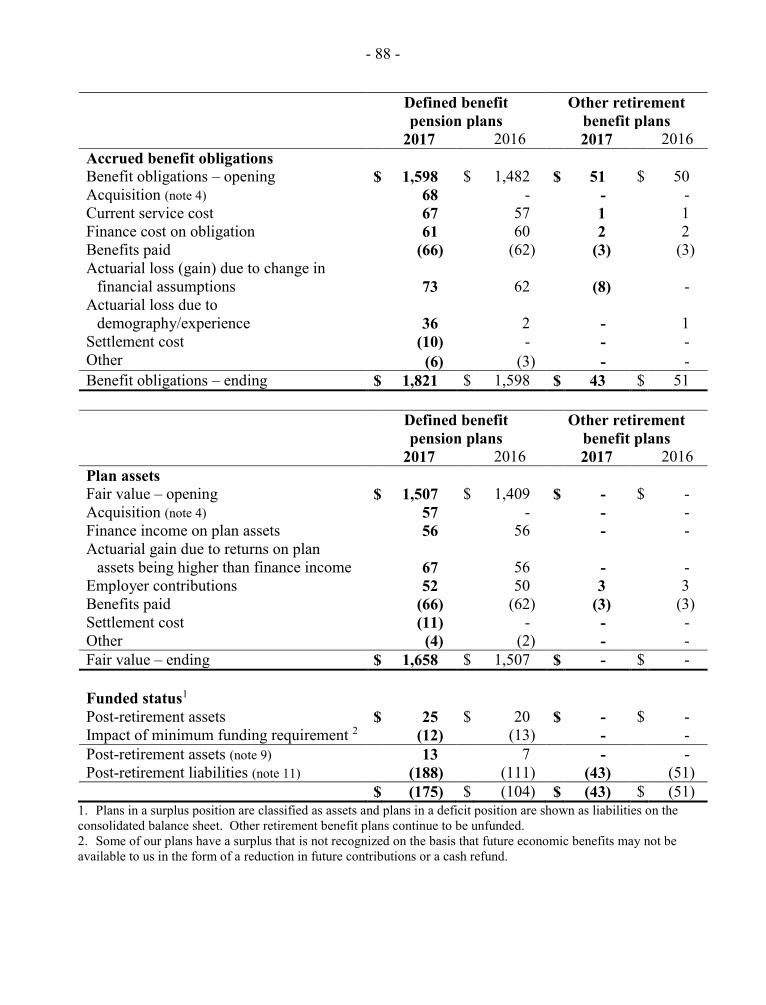
- 88 -
Defined benefit pension plans
Other retirement benefit plans
2017 2016 2017 2016 Accrued benefit obligations Benefit obligations – opening $ 1,598 $ 1,482 $ 51 $ 50 Acquisition (note 4) 68 - - - Current service cost 67 57 1 1 Finance cost on obligation 61 60 2 2 Benefits paid (66) (62) (3) (3) Actuarial loss (gain) due to change in
financial assumptions 73 62 (8) - Actuarial loss due to
demography/experience 36 2 - 1 Settlement cost (10) - - - Other (6) (3) - - Benefit obligations – ending $ 1,821 $ 1,598 $ 43 $ 51 Defined benefit
pension plans Other retirement
benefit plans 2017 2016 2017 2016 Plan assets Fair value – opening $ 1,507 $ 1,409 $ - $ - Acquisition (note 4) 57 - - - Finance income on plan assets 56 56 - - Actuarial gain due to returns on plan
assets being higher than finance income 67 56 - - Employer contributions 52 50 3 3 Benefits paid (66) (62) (3) (3) Settlement cost (11) - - - Other (4) (2) - - Fair value – ending $ 1,658 $ 1,507 $ - $ - Funded status1 Post-retirement assets $ 25 $ 20 $ - $ - Impact of minimum funding requirement 2 (12) (13) - - Post-retirement assets (note 9) 13 7 - - Post-retirement liabilities (note 11) (188) (111) (43) (51) $ (175) $ (104) $ (43) $ (51)
1. Plans in a surplus position are classified as assets and plans in a deficit position are shown as liabilities on the consolidated balance sheet. Other retirement benefit plans continue to be unfunded. 2. Some of our plans have a surplus that is not recognized on the basis that future economic benefits may not be available to us in the form of a reduction in future contributions or a cash refund.
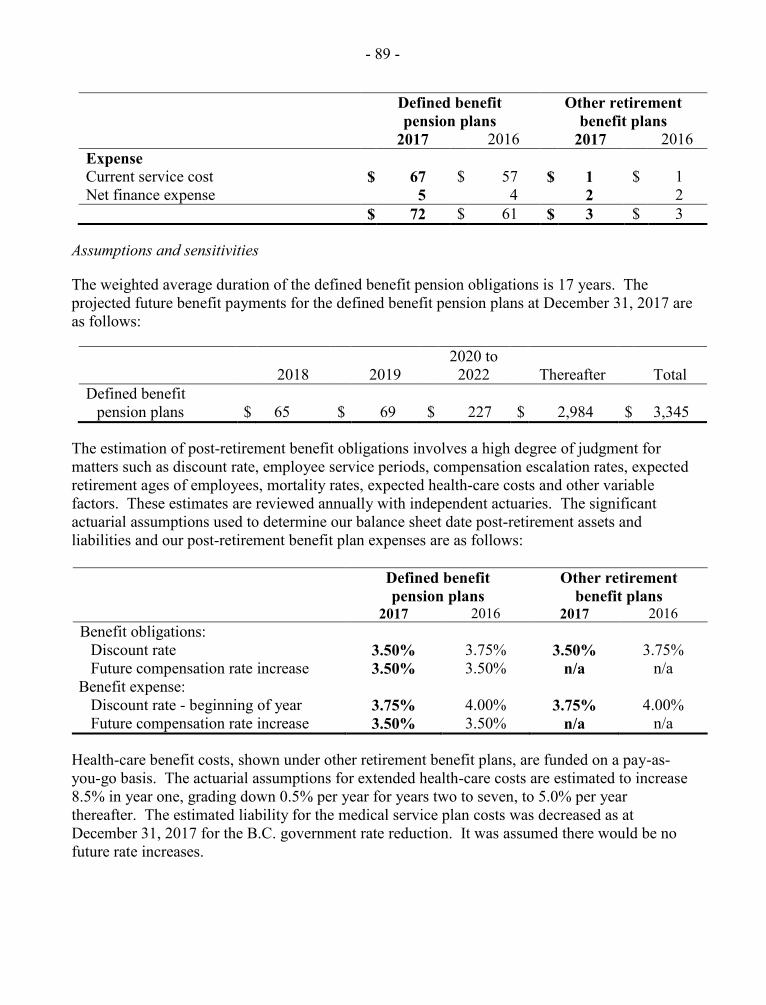
- 89 -
Defined benefit pension plans
Other retirement benefit plans
2017 2016 2017 2016 Expense Current service cost $ 67 $ 57 $ 1 $ 1 Net finance expense 5 4 2 2 $ 72 $ 61 $ 3 $ 3
Assumptions and sensitivities
The weighted average duration of the defined benefit pension obligations is 17 years. The projected future benefit payments for the defined benefit pension plans at December 31, 2017 are as follows:
2018 2019
2020 to 2022 Thereafter Total
Defined benefit pension plans $ 65 $ 69 $ 227 $ 2,984 $ 3,345
The estimation of post-retirement benefit obligations involves a high degree of judgment for matters such as discount rate, employee service periods, compensation escalation rates, expected retirement ages of employees, mortality rates, expected health-care costs and other variable factors. These estimates are reviewed annually with independent actuaries. The significant actuarial assumptions used to determine our balance sheet date post-retirement assets and liabilities and our post-retirement benefit plan expenses are as follows:
Defined benefit pension plans
Other retirement benefit plans
2017 2016 2017 2016 Benefit obligations:
Discount rate 3.50% 3.75% 3.50% 3.75% Future compensation rate increase 3.50% 3.50% n/a n/a
Benefit expense: Discount rate - beginning of year 3.75% 4.00% 3.75% 4.00% Future compensation rate increase 3.50% 3.50% n/a n/a
Health-care benefit costs, shown under other retirement benefit plans, are funded on a pay-as-you-go basis. The actuarial assumptions for extended health-care costs are estimated to increase 8.5% in year one, grading down 0.5% per year for years two to seven, to 5.0% per year thereafter. The estimated liability for the medical service plan costs was decreased as at December 31, 2017 for the B.C. government rate reduction. It was assumed there would be no future rate increases.
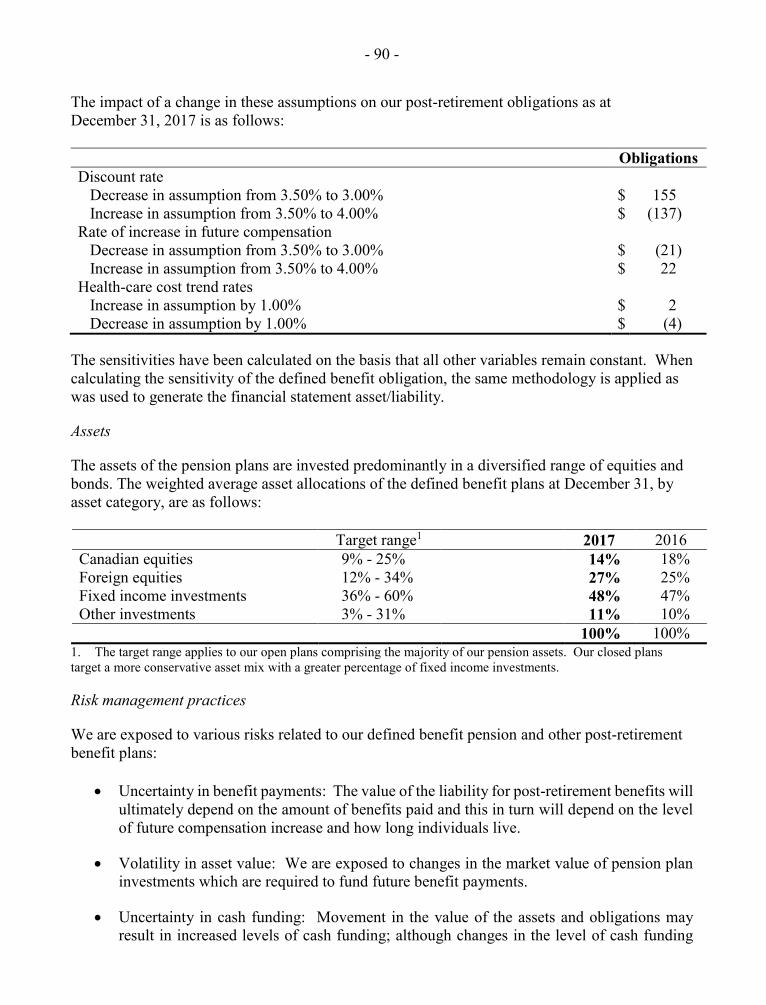
- 90 -
The impact of a change in these assumptions on our post-retirement obligations as at December 31, 2017 is as follows: Obligations Discount rate
Decrease in assumption from 3.50% to 3.00% $ 155 Increase in assumption from 3.50% to 4.00% $ (137)
Rate of increase in future compensation Decrease in assumption from 3.50% to 3.00% $ (21) Increase in assumption from 3.50% to 4.00% $ 22
Health-care cost trend rates Increase in assumption by 1.00% $ 2 Decrease in assumption by 1.00% $ (4)
The sensitivities have been calculated on the basis that all other variables remain constant. When calculating the sensitivity of the defined benefit obligation, the same methodology is applied as was used to generate the financial statement asset/liability.
Assets
The assets of the pension plans are invested predominantly in a diversified range of equities and bonds. The weighted average asset allocations of the defined benefit plans at December 31, by asset category, are as follows:
Target range1 2017 2016 Canadian equities 9% - 25% 14% 18% Foreign equities 12% - 34% 27% 25% Fixed income investments 36% - 60% 48% 47% Other investments 3% - 31% 11% 10% 100% 100%
1. The target range applies to our open plans comprising the majority of our pension assets. Our closed plans target a more conservative asset mix with a greater percentage of fixed income investments.
Risk management practices
We are exposed to various risks related to our defined benefit pension and other post-retirement benefit plans:
Uncertainty in benefit payments: The value of the liability for post-retirement benefits will ultimately depend on the amount of benefits paid and this in turn will depend on the level of future compensation increase and how long individuals live.
Volatility in asset value: We are exposed to changes in the market value of pension plan investments which are required to fund future benefit payments.
Uncertainty in cash funding: Movement in the value of the assets and obligations may result in increased levels of cash funding; although changes in the level of cash funding
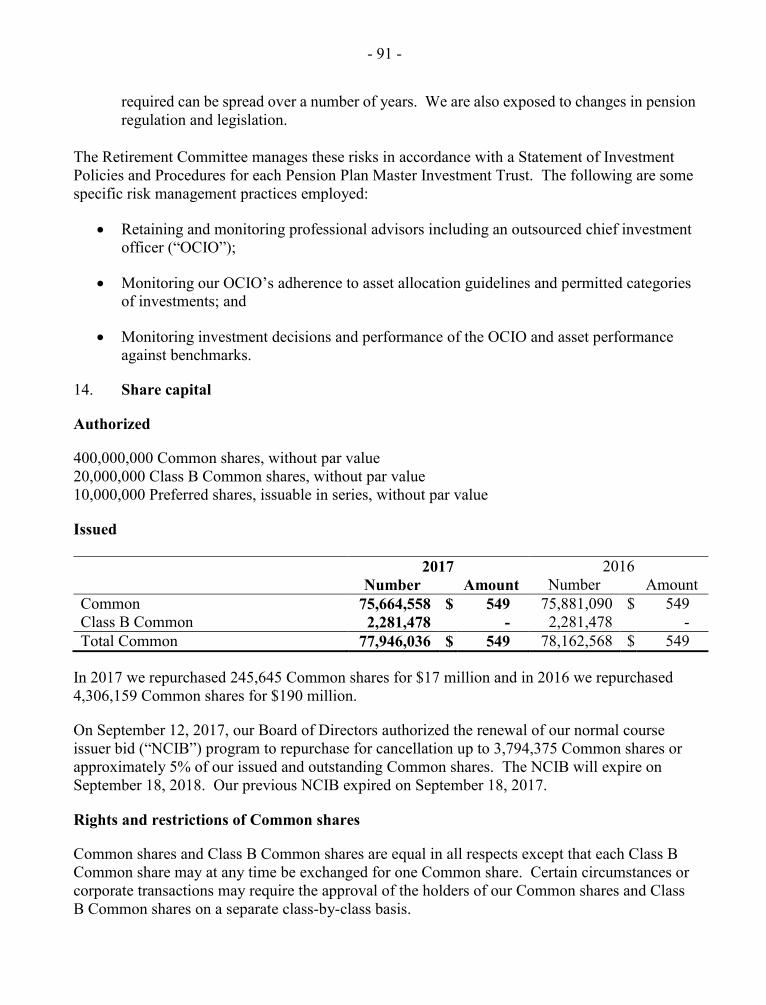
- 91 -
required can be spread over a number of years. We are also exposed to changes in pension regulation and legislation.
The Retirement Committee manages these risks in accordance with a Statement of Investment Policies and Procedures for each Pension Plan Master Investment Trust. The following are some specific risk management practices employed:
Retaining and monitoring professional advisors including an outsourced chief investment officer (“OCIO”);
Monitoring our OCIO’s adherence to asset allocation guidelines and permitted categories of investments; and
Monitoring investment decisions and performance of the OCIO and asset performance against benchmarks.
14. Share capital
Authorized
400,000,000 Common shares, without par value 20,000,000 Class B Common shares, without par value 10,000,000 Preferred shares, issuable in series, without par value
Issued 2017 2016 Number Amount Number Amount Common 75,664,558 $ 549 75,881,090 $ 549 Class B Common 2,281,478 - 2,281,478 - Total Common 77,946,036 $ 549 78,162,568 $ 549
In 2017 we repurchased 245,645 Common shares for $17 million and in 2016 we repurchased 4,306,159 Common shares for $190 million.
On September 12, 2017, our Board of Directors authorized the renewal of our normal course issuer bid (“NCIB”) program to repurchase for cancellation up to 3,794,375 Common shares or approximately 5% of our issued and outstanding Common shares. The NCIB will expire on September 18, 2018. Our previous NCIB expired on September 18, 2017.
Rights and restrictions of Common shares
Common shares and Class B Common shares are equal in all respects except that each Class B Common share may at any time be exchanged for one Common share. Certain circumstances or corporate transactions may require the approval of the holders of our Common shares and Class B Common shares on a separate class-by-class basis.
- 92 -
15. Equity-based compensation
We have share option, phantom share unit (“PSU”) and directors’ deferred share unit (“DSU”) plans. We have partially hedged our exposure under these plans with an equity derivative contract. The equity-based compensation expense included in earnings is $32 million (2016 - recovery of $5 million).
Accounting policies
We estimate the fair value of outstanding share options using the Black-Scholes valuation model and the fair value of our PSU plan and directors’ DSU plan using an intrinsic valuation model at each balance sheet date and record the resulting expense or recovery, over the related vesting period, through a charge to earnings.
From time to time, we enter into equity derivative contracts to provide a partial offset to our exposure to fluctuations in equity-based compensation from our stock option, PSU and DSU plans. These derivatives are fair valued at each balance sheet date using an intrinsic valuation model and the resulting expense or recovery is offset against the related equity-based compensation.
If a share option holder elects to acquire Common shares, both the exercise price and the accrued liability are credited to shareholders’ equity.
Supporting information
Share option plan
Under our share option plan, officers and employees may be granted options to purchase up to 7,295,940 Common shares, of which 587,521 remain available for issuance. The exercise price of a share option is the closing price of a Common share on the trading day immediately preceding the grant date. Our share option plan gives share option holders the right to elect to receive a cash payment in lieu of exercising an option to purchase Common shares. Options vest at the earlier of the date of retirement or death and 20% per year from the grant date, and expire after 10 years. We have recorded an expense of $52 million (2016 - recovery of $6 million) related to the share option plan.
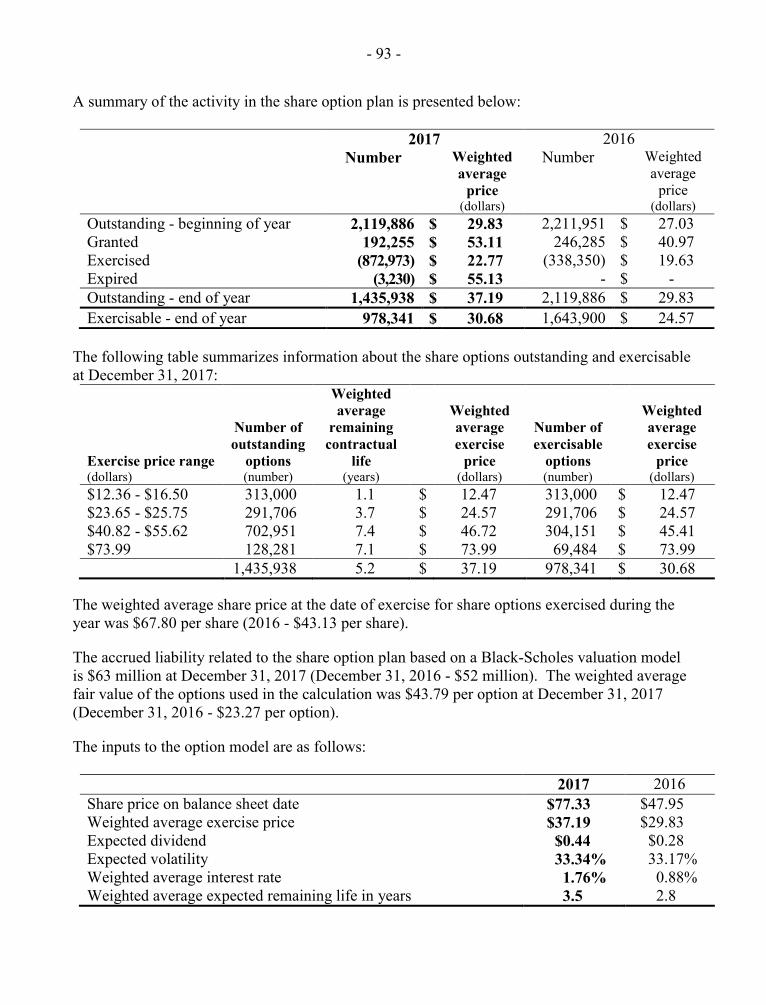
- 93 -
A summary of the activity in the share option plan is presented below:
2017 2016 Number Weighted
average price
(dollars)
Number Weighted average
price (dollars)
Outstanding - beginning of year 2,119,886 $ 29.83 2,211,951 $ 27.03 Granted 192,255 $ 53.11 246,285 $ 40.97 Exercised (872,973) $ 22.77 (338,350) $ 19.63 Expired (3,230) $ 55.13 - $ - Outstanding - end of year 1,435,938 $ 37.19 2,119,886 $ 29.83 Exercisable - end of year 978,341 $ 30.68 1,643,900 $ 24.57
The following table summarizes information about the share options outstanding and exercisable at December 31, 2017:
Exercise price range
Number of outstanding
options
Weighted average
remaining contractual
life
Weighted average exercise
price
Number of exercisable
options
Weighted average exercise
price (dollars) (number) (years) (dollars) (number) (dollars) $12.36 - $16.50 313,000 1.1 $ 12.47 313,000 $ 12.47 $23.65 - $25.75 291,706 3.7 $ 24.57 291,706 $ 24.57 $40.82 - $55.62 702,951 7.4 $ 46.72 304,151 $ 45.41 $73.99 128,281 7.1 $ 73.99 69,484 $ 73.99 1,435,938 5.2 $ 37.19 978,341 $ 30.68
The weighted average share price at the date of exercise for share options exercised during the year was $67.80 per share (2016 - $43.13 per share).
The accrued liability related to the share option plan based on a Black-Scholes valuation model is $63 million at December 31, 2017 (December 31, 2016 - $52 million). The weighted average fair value of the options used in the calculation was $43.79 per option at December 31, 2017 (December 31, 2016 - $23.27 per option).
The inputs to the option model are as follows:
2017 2016 Share price on balance sheet date $77.33 $47.95 Weighted average exercise price $37.19 $29.83 Expected dividend $0.44 $0.28 Expected volatility 33.34% 33.17% Weighted average interest rate 1.76% 0.88% Weighted average expected remaining life in years 3.5 2.8
- 94 -
The expected dividend on our shares was based on the annualized dividend rate at each period-end. Expected volatility was based on five years of historical data. The interest rate for the life of the options was based on the implied yield available on government bonds with an equivalent remaining term at each period-end. Historical data was used to estimate the expected life of the options and forfeiture rates.
The intrinsic value of options issued under the share option plan at December 31, 2017 was $56 million (December 31, 2016 - $43 million). The intrinsic value is determined based on the difference between the period-end share price and the exercise price, multiplied by the sum of the related vested options plus unvested options for those holders eligible to retire.
Phantom share unit plan
Our PSU plan is intended to supplement or, in whole or in part, replace the granting of share options as long-term incentives for officers and employees. The plan provides for two types of units which vest on the third anniversary of the grant date. A restricted share unit pays out based on the Common share price over the 20 trading days immediately preceding its vesting date (the “vesting date value”). A performance share unit pays out at a value between 0% and 200% of its vesting date value contingent upon our performance relative to a peer group of companies over the three-year performance period. Officers and employees granted units under the plan are also entitled to additional units to reflect cash dividends paid on Common shares from the applicable grant date until payout.
We have recorded an expense of $6 million (2016 - $3 million) related to the PSU plan. The number of units outstanding as at December 31, 2017 was 109,414 (December 31, 2016 - 182,770), including performance share units totalling 48,268 (December 31, 2016 - 77,674).
Directors’ deferred share unit plan
We have a DSU plan which provides a structure for non-employee directors to accumulate an equity-like holding in West Fraser. The DSU plan allows directors to participate in the growth of West Fraser by providing a deferred payment based on the value of a Common share at the time of redemption. Each director receives deferred share units (“Units”) in payment of an annual equity retainer until a minimum equity holding is reached and may elect to receive Units in payment of up to 100% of other fees earned. After a minimum equity holding is reached, directors may elect to receive the equity retainer in Units or cash. The Units are issued based on our Common share price at the time of issue. Additional Units are issued to take into account the value of dividends paid on Common shares from the date of issue to the date of redemption. Units are redeemable only after a director retires, resigns or otherwise leaves the board. The redemption value is equal to the Common share price at the date of redemption. A holder of Units may elect to redeem Units in cash or receive Common shares having an equivalent value.
We have recorded an expense of $4 million (2016 - nil) related to the DSU plan. The number of Units outstanding as at December 31, 2017 was 102,757 (December 31, 2016 - 155,593).
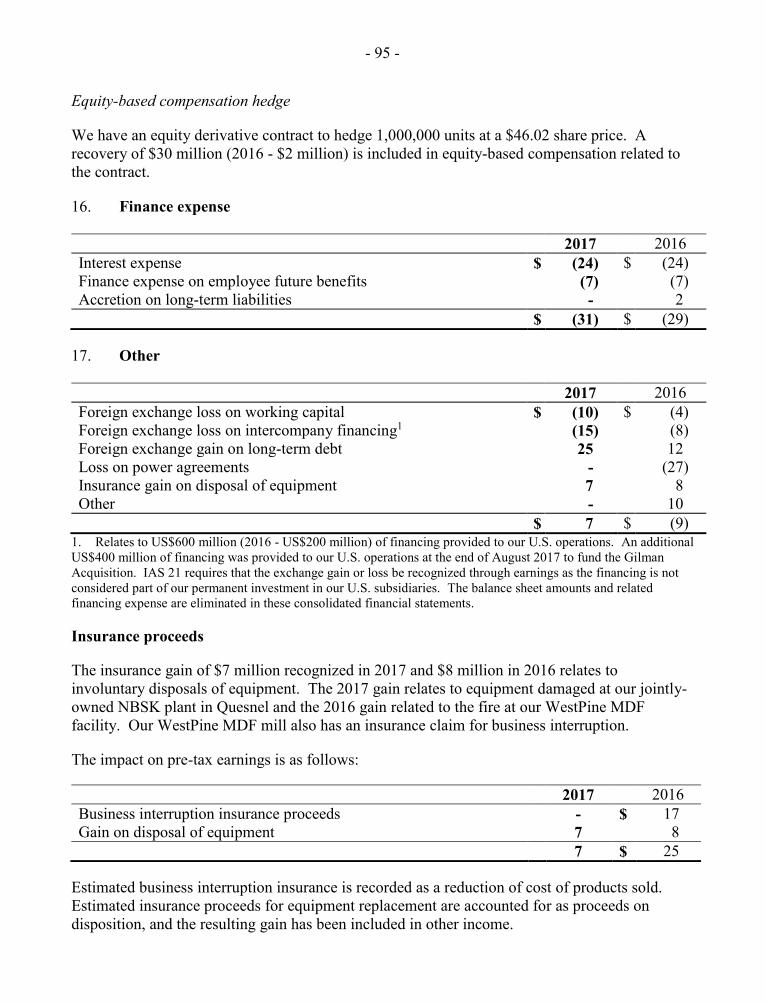
- 95 -
Equity-based compensation hedge
We have an equity derivative contract to hedge 1,000,000 units at a $46.02 share price. A recovery of $30 million (2016 - $2 million) is included in equity-based compensation related to the contract.
16. Finance expense 2017 2016 Interest expense $ (24) $ (24) Finance expense on employee future benefits (7) (7) Accretion on long-term liabilities - 2 $ (31) $ (29)
17. Other 2017 2016 Foreign exchange loss on working capital $ (10) $ (4) Foreign exchange loss on intercompany financing1 (15) (8) Foreign exchange gain on long-term debt 25 12 Loss on power agreements - (27) Insurance gain on disposal of equipment 7 8 Other - 10 $ 7 $ (9)
1. Relates to US$600 million (2016 - US$200 million) of financing provided to our U.S. operations. An additional US$400 million of financing was provided to our U.S. operations at the end of August 2017 to fund the Gilman Acquisition. IAS 21 requires that the exchange gain or loss be recognized through earnings as the financing is not considered part of our permanent investment in our U.S. subsidiaries. The balance sheet amounts and related financing expense are eliminated in these consolidated financial statements.
Insurance proceeds
The insurance gain of $7 million recognized in 2017 and $8 million in 2016 relates to involuntary disposals of equipment. The 2017 gain relates to equipment damaged at our jointly-owned NBSK plant in Quesnel and the 2016 gain related to the fire at our WestPine MDF facility. Our WestPine MDF mill also has an insurance claim for business interruption.
The impact on pre-tax earnings is as follows:
2017 2016 Business interruption insurance proceeds $ - $ 17 Gain on disposal of equipment 7 8 $ 7 $ 25
Estimated business interruption insurance is recorded as a reduction of cost of products sold. Estimated insurance proceeds for equipment replacement are accounted for as proceeds on disposition, and the resulting gain has been included in other income.
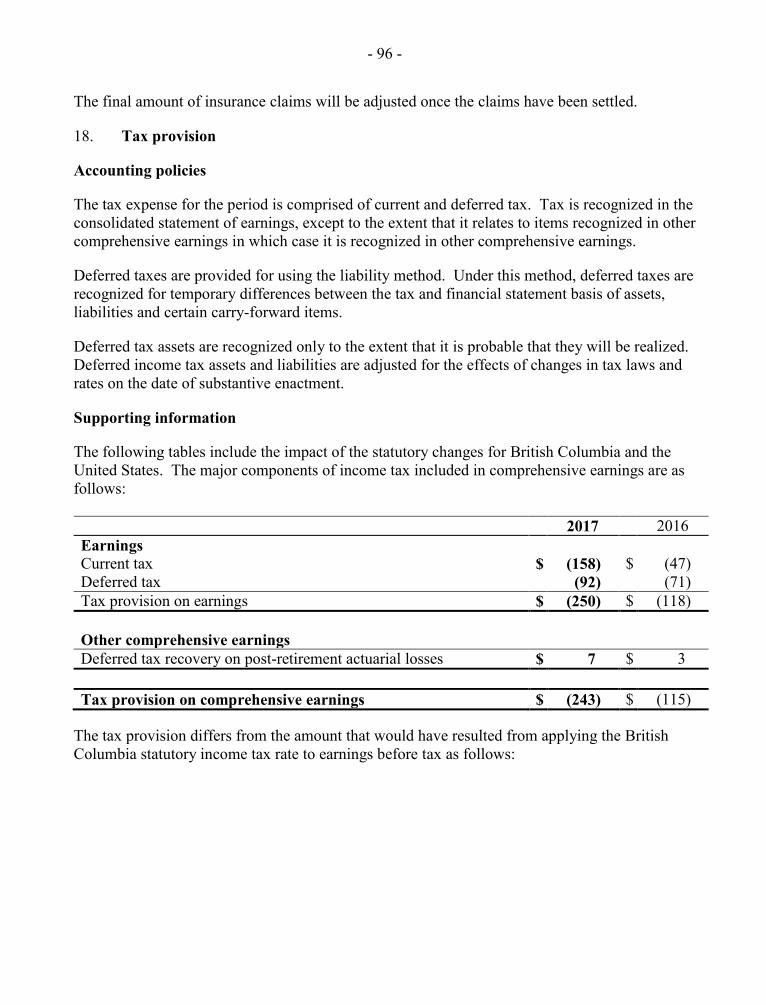
- 96 -
The final amount of insurance claims will be adjusted once the claims have been settled.
18. Tax provision
Accounting policies
The tax expense for the period is comprised of current and deferred tax. Tax is recognized in the consolidated statement of earnings, except to the extent that it relates to items recognized in other comprehensive earnings in which case it is recognized in other comprehensive earnings.
Deferred taxes are provided for using the liability method. Under this method, deferred taxes are recognized for temporary differences between the tax and financial statement basis of assets, liabilities and certain carry-forward items.
Deferred tax assets are recognized only to the extent that it is probable that they will be realized. Deferred income tax assets and liabilities are adjusted for the effects of changes in tax laws and rates on the date of substantive enactment.
Supporting information
The following tables include the impact of the statutory changes for British Columbia and the United States. The major components of income tax included in comprehensive earnings are as follows: 2017 2016 Earnings Current tax $ (158) $ (47) Deferred tax (92) (71) Tax provision on earnings $ (250) $ (118) Other comprehensive earnings Deferred tax recovery on post-retirement actuarial losses $ 7 $ 3 Tax provision on comprehensive earnings $ (243) $ (115)
The tax provision differs from the amount that would have resulted from applying the British Columbia statutory income tax rate to earnings before tax as follows:
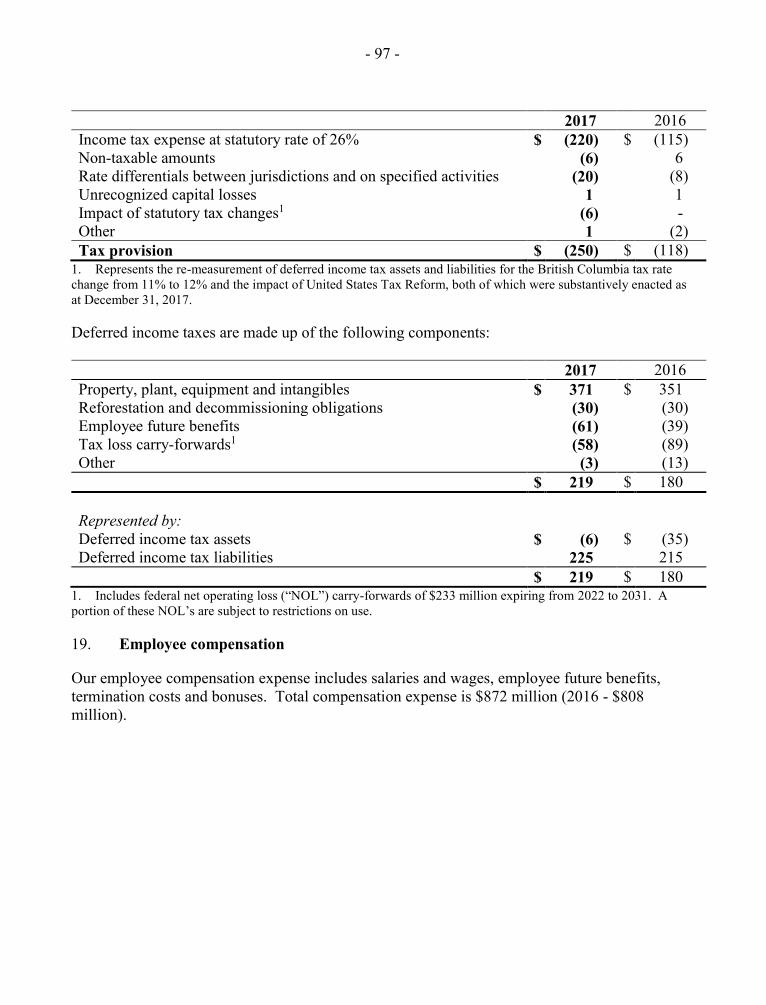
- 97 -
2017 2016 Income tax expense at statutory rate of 26% $ (220) $ (115) Non-taxable amounts (6) 6 Rate differentials between jurisdictions and on specified activities (20) (8) Unrecognized capital losses 1 1 Impact of statutory tax changes1 (6) - Other 1 (2) Tax provision $ (250) $ (118)
1. Represents the re-measurement of deferred income tax assets and liabilities for the British Columbia tax rate change from 11% to 12% and the impact of United States Tax Reform, both of which were substantively enacted as at December 31, 2017.
Deferred income taxes are made up of the following components: 2017 2016 Property, plant, equipment and intangibles $ 371 $ 351 Reforestation and decommissioning obligations (30) (30) Employee future benefits (61) (39) Tax loss carry-forwards1 (58) (89) Other (3) (13) $ 219 $ 180 Represented by: Deferred income tax assets $ (6) $ (35) Deferred income tax liabilities 225 215 $ 219 $ 180
1. Includes federal net operating loss (“NOL”) carry-forwards of $233 million expiring from 2022 to 2031. A portion of these NOL’s are subject to restrictions on use.
19. Employee compensation
Our employee compensation expense includes salaries and wages, employee future benefits, termination costs and bonuses. Total compensation expense is $872 million (2016 - $808 million).
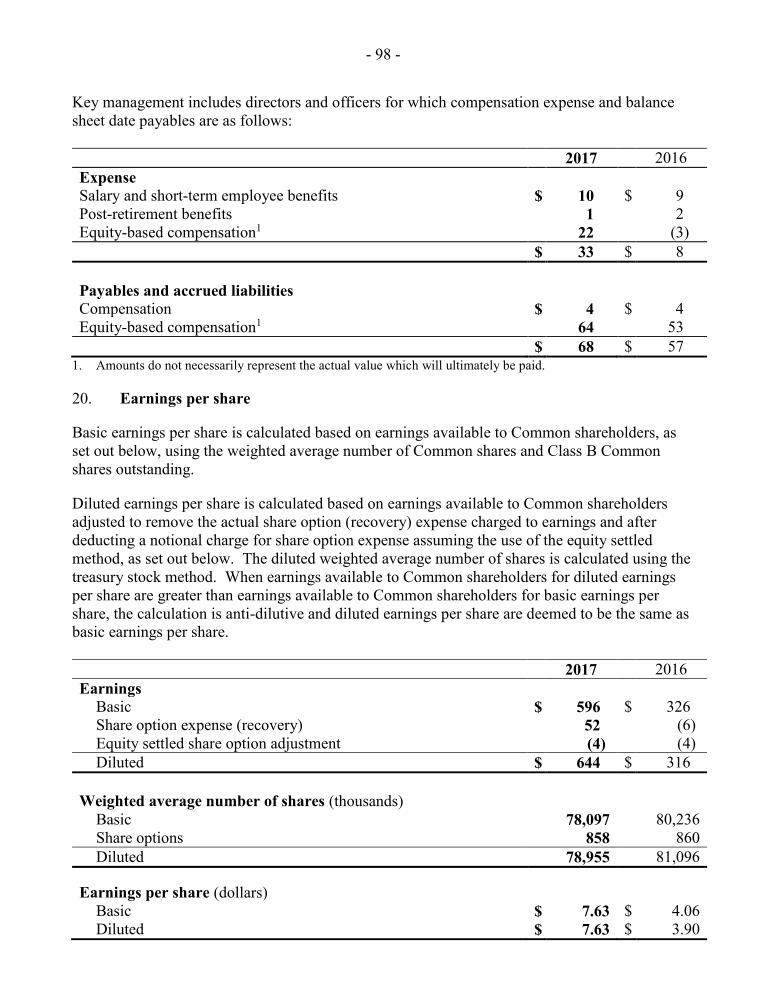
- 98 -
Key management includes directors and officers for which compensation expense and balance sheet date payables are as follows: 2017 2016 Expense Salary and short-term employee benefits $ 10 $ 9 Post-retirement benefits 1 2 Equity-based compensation1 22 (3) $ 33 $ 8 Payables and accrued liabilities Compensation $ 4 $ 4 Equity-based compensation1 64 53 $ 68 $ 57
1. Amounts do not necessarily represent the actual value which will ultimately be paid.
20. Earnings per share
Basic earnings per share is calculated based on earnings available to Common shareholders, as set out below, using the weighted average number of Common shares and Class B Common shares outstanding.
Diluted earnings per share is calculated based on earnings available to Common shareholders adjusted to remove the actual share option (recovery) expense charged to earnings and after deducting a notional charge for share option expense assuming the use of the equity settled method, as set out below. The diluted weighted average number of shares is calculated using the treasury stock method. When earnings available to Common shareholders for diluted earnings per share are greater than earnings available to Common shareholders for basic earnings per share, the calculation is anti-dilutive and diluted earnings per share are deemed to be the same as basic earnings per share. 2017 2016 Earnings
Basic $ 596 $ 326 Share option expense (recovery) 52 (6) Equity settled share option adjustment (4) (4) Diluted $ 644 $ 316
Weighted average number of shares (thousands)
Basic 78,097 80,236 Share options 858 860 Diluted 78,955 81,096
Earnings per share (dollars)
Basic $ 7.63 $ 4.06 Diluted $ 7.63 $ 3.90
- 99 -
21. Commitments
Operating leases
We are committed to make payments under certain operating leases for equipment, land, building and office space. Operating lease costs expensed during the year were $6 million (2016 - $7 million). The future payments required under operating leases are as follows:
2018 $ 4 2019 3 2020 3 2021 3 Thereafter 3 $ 16
Product purchase and sale commitments
We have long-term purchase and sale contracts with minimum annual volume commitments. All contracts are at market prices and on normal business terms.
Capital commitments
Capital commitments at December 31, 2017 are $53 million.
22. Government assistance
Accounting policies
Government assistance received that relates to the construction of manufacturing assets is applied to reduce the cost of those assets. Government assistance received that relates to operational expenses is applied to reduce the amount charged to earnings for the operating item.
Supporting information
Government assistance of $3 million (2016 - $8 million) was received for capital projects and recorded as a reduction to property, plant and equipment.
Government assistance of $14 million (2016 - $6 million) was recorded as a reduction to cost of products sold. The government assistance related primarily to bioenergy producer credits, research and development and apprentice tax credits.
23. Financial instruments
Accounting policies
Our financial assets are categorized as loans and receivables, our financial liabilities as other financial liabilities, and our derivatives as held for trading. All financial assets and liabilities, except for derivatives, are initially measured at fair value and subsequently measured at
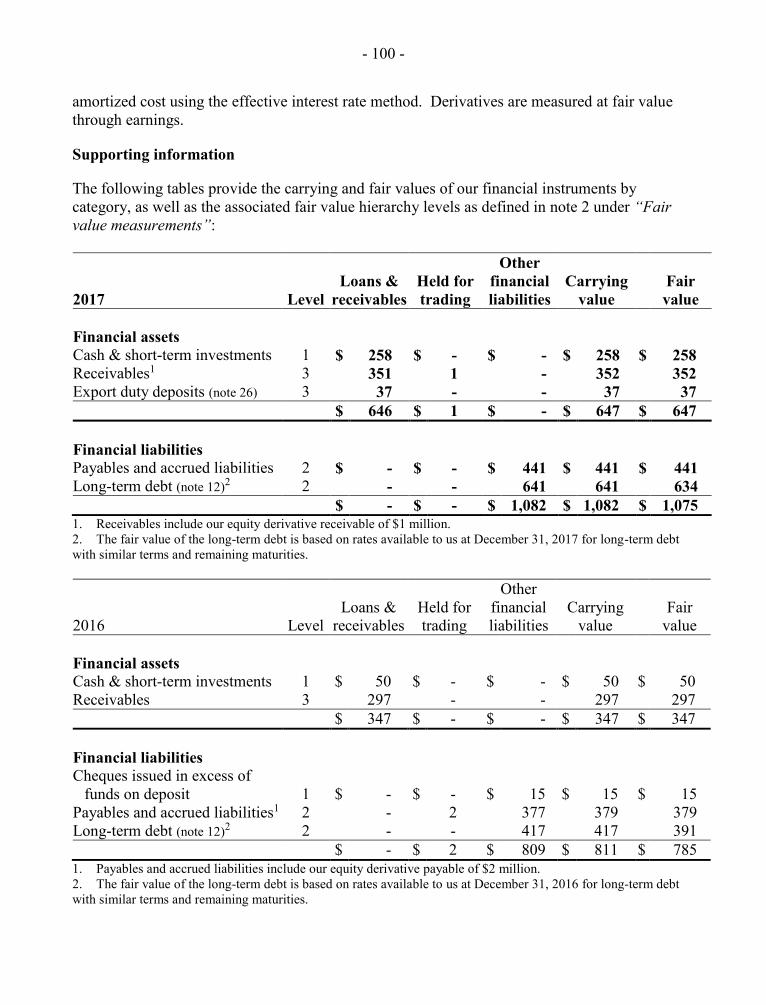
- 100 -
amortized cost using the effective interest rate method. Derivatives are measured at fair value through earnings.
Supporting information
The following tables provide the carrying and fair values of our financial instruments by category, as well as the associated fair value hierarchy levels as defined in note 2 under “Fair value measurements”:
2017 Level Loans &
receivables Held for trading
Other financial liabilities
Carrying value
Fair value
Financial assets Cash & short-term investments 1 $ 258 $ - $ - $ 258 $ 258 Receivables1 3 351 1 - 352 352 Export duty deposits (note 26) 3 37 - - 37 37 $ 646 $ 1 $ - $ 647 $ 647 Financial liabilities Payables and accrued liabilities 2 $ - $ - $ 441 $ 441 $ 441 Long-term debt (note 12)2 2 - - 641 641 634 $ - $ - $ 1,082 $ 1,082 $ 1,075 1. Receivables include our equity derivative receivable of $1 million. 2. The fair value of the long-term debt is based on rates available to us at December 31, 2017 for long-term debt with similar terms and remaining maturities.
2016 Level Loans &
receivables Held for trading
Other financial liabilities
Carrying value
Fair value
Financial assets Cash & short-term investments 1 $ 50 $ - $ - $ 50 $ 50 Receivables 3 297 - - 297 297 $ 347 $ - $ - $ 347 $ 347 Financial liabilities Cheques issued in excess of
funds on deposit 1 $ - $ - $ 15 $ 15 $ 15 Payables and accrued liabilities1 2 - 2 377 379 379 Long-term debt (note 12)2 2 - - 417 417 391 $ - $ 2 $ 809 $ 811 $ 785 1. Payables and accrued liabilities include our equity derivative payable of $2 million. 2. The fair value of the long-term debt is based on rates available to us at December 31, 2016 for long-term debt with similar terms and remaining maturities.
- 101 -
Financial risk management
Our activities result in exposure to a variety of financial risks including risks related to derivative contracts, currency fluctuation, credit, liquidity and interest rates.
The sensitivities provided give the effect of possible changes in the relevant prices and rates on earnings. The sensitivities are hypothetical and should not be considered to be predictive of future performance or earnings. Changes in fair values or cash flows based on market variable fluctuations cannot be extrapolated since the relationship between the change in the market variable and the change in fair value or cash flows may not be linear.
Derivative contracts
From time to time, we use derivatives to manage our exposure to U.S. dollar exchange fluctuations, commodity prices and equity-based compensation. Commodity contracts used by West Fraser include lumber futures and agreements related to Alberta electricity rates.
Based on the equity contract as at December 31, 2017 and holding all other variables constant, a $1.00 change in our share price would change its fair value by $1 million, which would partially offset the movement in our equity-based compensation.
No energy related derivatives were outstanding at December 31, 2017 or 2016.
No material lumber futures or foreign exchange contracts were outstanding at December 31, 2017 or 2016.
Currency fluctuation
Most of our products are sold at prices denominated in U.S. dollars or based on prevailing U.S. dollar prices, and significant portions of operational costs and expenses are incurred in Canadian dollars. Therefore, an increase in the value of the Canadian dollar relative to the U.S. dollar reduces the revenue in Canadian dollar terms realized by us from sales made in U.S. dollars, which reduces operating margin and the cash flow available to fund operations.
Impact of U.S. dollar currency fluctuation
The U.S. dollar foreign currency balance sheet exposure at December 31, 2017 is as follows:
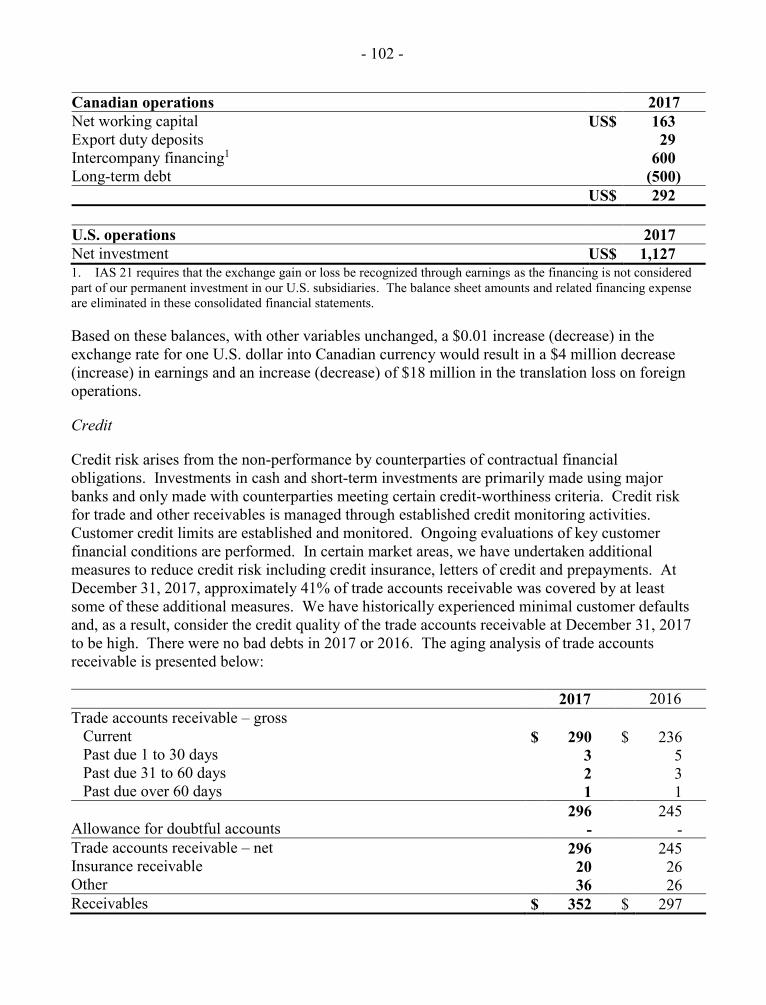
- 102 -
Canadian operations 2017 Net working capital US$ 163 Export duty deposits 29 Intercompany financing1 600 Long-term debt (500) US$ 292 U.S. operations 2017 Net investment US$ 1,127 1. IAS 21 requires that the exchange gain or loss be recognized through earnings as the financing is not considered part of our permanent investment in our U.S. subsidiaries. The balance sheet amounts and related financing expense are eliminated in these consolidated financial statements.
Based on these balances, with other variables unchanged, a $0.01 increase (decrease) in the exchange rate for one U.S. dollar into Canadian currency would result in a $4 million decrease (increase) in earnings and an increase (decrease) of $18 million in the translation loss on foreign operations.
Credit
Credit risk arises from the non-performance by counterparties of contractual financial obligations. Investments in cash and short-term investments are primarily made using major banks and only made with counterparties meeting certain credit-worthiness criteria. Credit risk for trade and other receivables is managed through established credit monitoring activities. Customer credit limits are established and monitored. Ongoing evaluations of key customer financial conditions are performed. In certain market areas, we have undertaken additional measures to reduce credit risk including credit insurance, letters of credit and prepayments. At December 31, 2017, approximately 41% of trade accounts receivable was covered by at least some of these additional measures. We have historically experienced minimal customer defaults and, as a result, consider the credit quality of the trade accounts receivable at December 31, 2017 to be high. There were no bad debts in 2017 or 2016. The aging analysis of trade accounts receivable is presented below:
2017 2016 Trade accounts receivable – gross
Current $ 290 $ 236 Past due 1 to 30 days 3 5 Past due 31 to 60 days 2 3 Past due over 60 days 1 1
296 245 Allowance for doubtful accounts - - Trade accounts receivable – net 296 245 Insurance receivable 20 26 Other 36 26 Receivables $ 352 $ 297
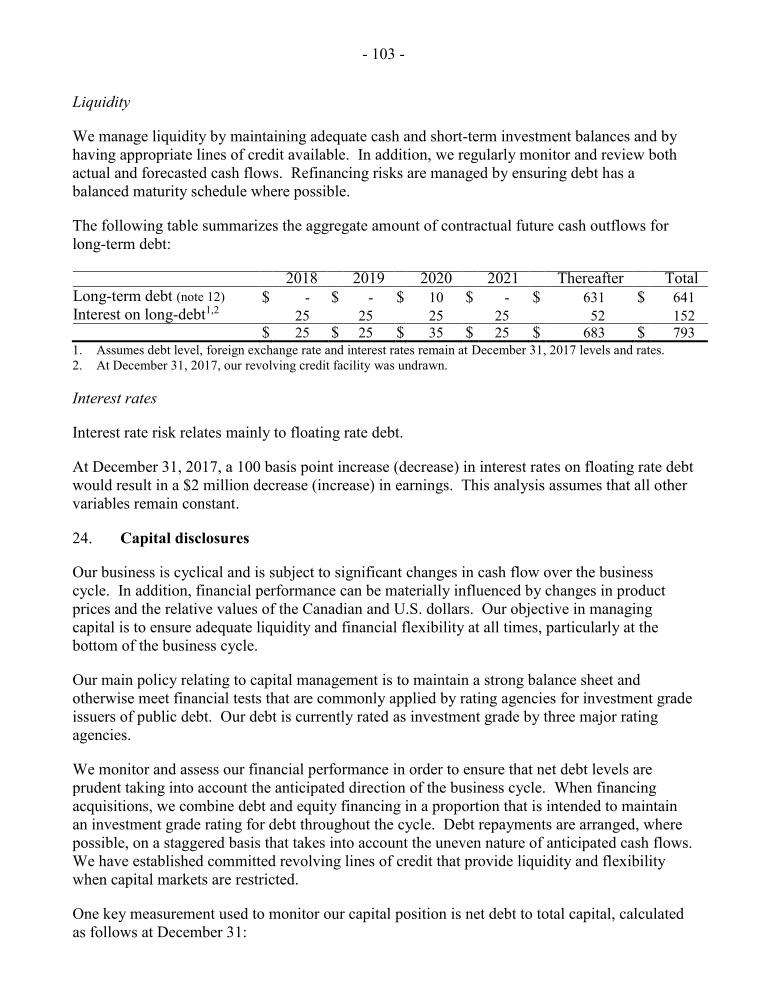
- 103 -
Liquidity
We manage liquidity by maintaining adequate cash and short-term investment balances and by having appropriate lines of credit available. In addition, we regularly monitor and review both actual and forecasted cash flows. Refinancing risks are managed by ensuring debt has a balanced maturity schedule where possible.
The following table summarizes the aggregate amount of contractual future cash outflows for long-term debt:
2018 2019 2020 2021 Thereafter Total Long-term debt (note 12) $ - $ - $ 10 $ - $ 631 $ 641 Interest on long-debt1,2 25 25 25 25 52 152
$ 25 $ 25 $ 35 $ 25 $ 683 $ 793 1. Assumes debt level, foreign exchange rate and interest rates remain at December 31, 2017 levels and rates. 2. At December 31, 2017, our revolving credit facility was undrawn.
Interest rates
Interest rate risk relates mainly to floating rate debt.
At December 31, 2017, a 100 basis point increase (decrease) in interest rates on floating rate debt would result in a $2 million decrease (increase) in earnings. This analysis assumes that all other variables remain constant.
24. Capital disclosures
Our business is cyclical and is subject to significant changes in cash flow over the business cycle. In addition, financial performance can be materially influenced by changes in product prices and the relative values of the Canadian and U.S. dollars. Our objective in managing capital is to ensure adequate liquidity and financial flexibility at all times, particularly at the bottom of the business cycle.
Our main policy relating to capital management is to maintain a strong balance sheet and otherwise meet financial tests that are commonly applied by rating agencies for investment grade issuers of public debt. Our debt is currently rated as investment grade by three major rating agencies.
We monitor and assess our financial performance in order to ensure that net debt levels are prudent taking into account the anticipated direction of the business cycle. When financing acquisitions, we combine debt and equity financing in a proportion that is intended to maintain an investment grade rating for debt throughout the cycle. Debt repayments are arranged, where possible, on a staggered basis that takes into account the uneven nature of anticipated cash flows. We have established committed revolving lines of credit that provide liquidity and flexibility when capital markets are restricted.
One key measurement used to monitor our capital position is net debt to total capital, calculated as follows at December 31:
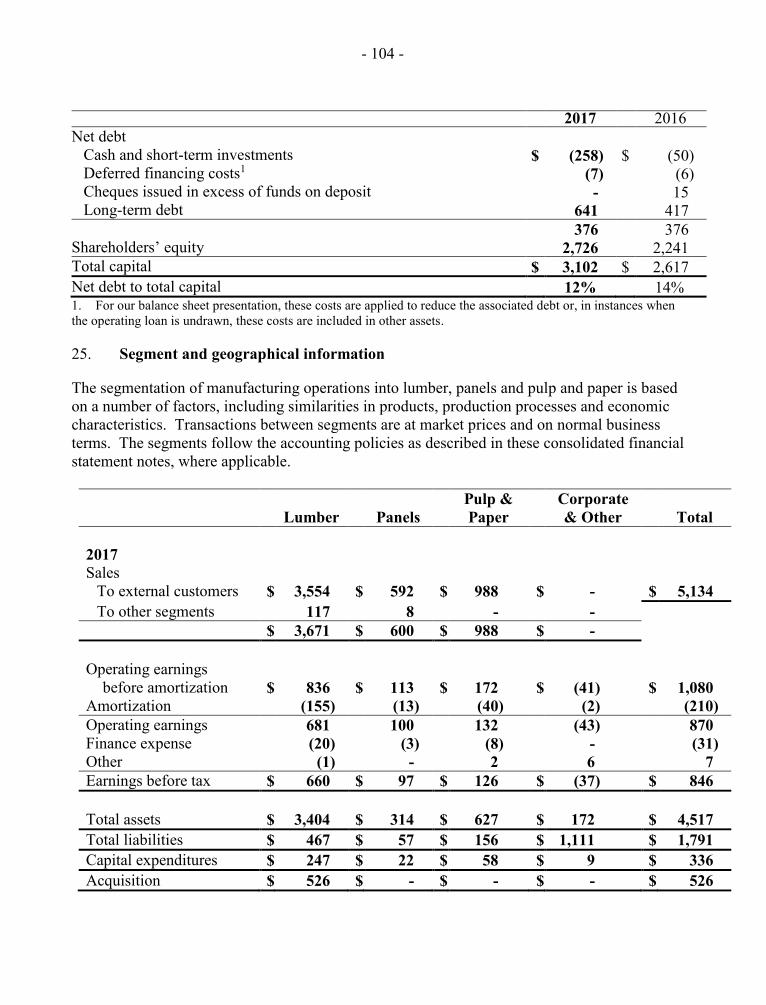
- 104 -
2017 2016
Net debt Cash and short-term investments $ (258) $ (50) Deferred financing costs1 (7) (6) Cheques issued in excess of funds on deposit - 15 Long-term debt 641 417
376 376 Shareholders’ equity 2,726 2,241 Total capital $ 3,102 $ 2,617 Net debt to total capital 12% 14% 1. For our balance sheet presentation, these costs are applied to reduce the associated debt or, in instances when the operating loan is undrawn, these costs are included in other assets.
25. Segment and geographical information
The segmentation of manufacturing operations into lumber, panels and pulp and paper is based on a number of factors, including similarities in products, production processes and economic characteristics. Transactions between segments are at market prices and on normal business terms. The segments follow the accounting policies as described in these consolidated financial statement notes, where applicable.
Lumber Panels Pulp & Paper
Corporate & Other Total
2017 Sales
To external customers $ 3,554 $ 592 $ 988 $ - $ 5,134 To other segments 117 8 - -
$ 3,671 $ 600 $ 988 $ - Operating earnings
before amortization $ 836 $ 113 $ 172 $ (41) $ 1,080 Amortization (155) (13) (40) (2) (210) Operating earnings 681 100 132 (43) 870 Finance expense (20) (3) (8) - (31) Other (1) - 2 6 7 Earnings before tax $ 660 $ 97 $ 126 $ (37) $ 846 Total assets $ 3,404 $ 314 $ 627 $ 172 $ 4,517 Total liabilities $ 467 $ 57 $ 156 $ 1,111 $ 1,791 Capital expenditures $ 247 $ 22 $ 58 $ 9 $ 336 Acquisition $ 526 $ - $ - $ - $ 526
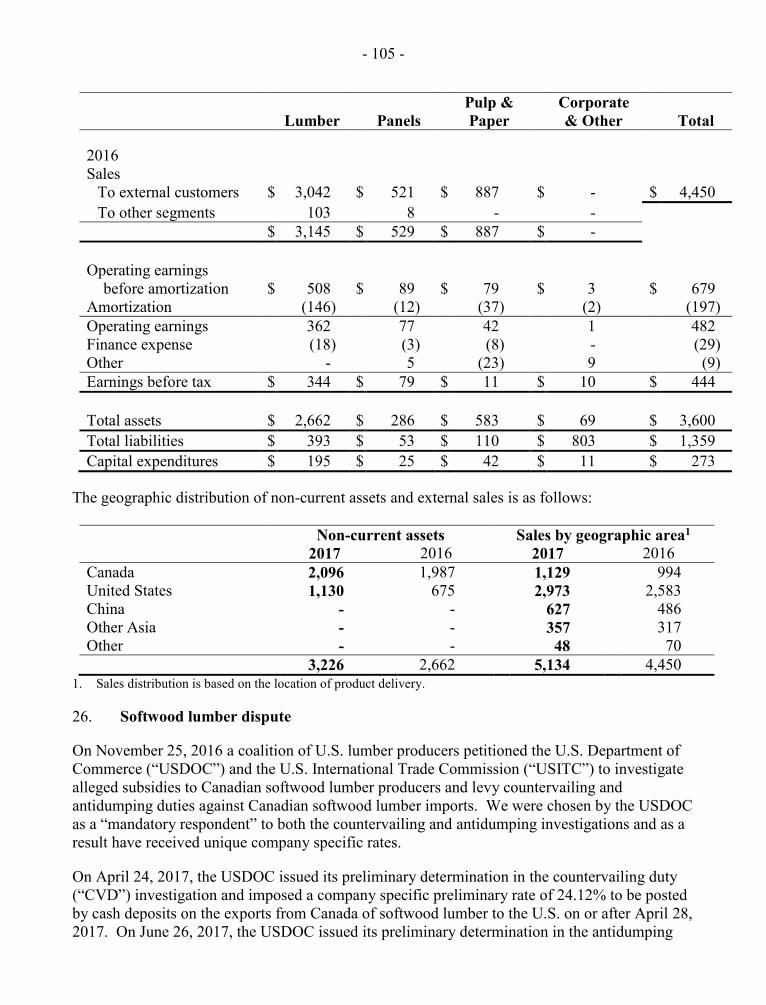
- 105 -
Lumber Panels Pulp & Paper
Corporate & Other Total
2016 Sales
To external customers $ 3,042 $ 521 $ 887 $ - $ 4,450 To other segments 103 8 - -
$ 3,145 $ 529 $ 887 $ - Operating earnings
before amortization $ 508 $ 89 $ 79 $ 3 $ 679 Amortization (146) (12) (37) (2) (197) Operating earnings 362 77 42 1 482 Finance expense (18) (3) (8) - (29) Other - 5 (23) 9 (9) Earnings before tax $ 344 $ 79 $ 11 $ 10 $ 444 Total assets $ 2,662 $ 286 $ 583 $ 69 $ 3,600 Total liabilities $ 393 $ 53 $ 110 $ 803 $ 1,359 Capital expenditures $ 195 $ 25 $ 42 $ 11 $ 273
The geographic distribution of non-current assets and external sales is as follows:
Non-current assets Sales by geographic area1 2017 2016 2017 2016 Canada $ 2,096 $ 1,987 $ 1,129 $ 994 United States 1,130 675 2,973 2,583 China - - 627 486 Other Asia - - 357 317 Other - - 48 70
$ 3,226 $ 2,662 $ 5,134 $ 4,450 1. Sales distribution is based on the location of product delivery.
26. Softwood lumber dispute
On November 25, 2016 a coalition of U.S. lumber producers petitioned the U.S. Department of Commerce (“USDOC”) and the U.S. International Trade Commission (“USITC”) to investigate alleged subsidies to Canadian softwood lumber producers and levy countervailing and antidumping duties against Canadian softwood lumber imports. We were chosen by the USDOC as a “mandatory respondent” to both the countervailing and antidumping investigations and as a result have received unique company specific rates.
On April 24, 2017, the USDOC issued its preliminary determination in the countervailing duty (“CVD”) investigation and imposed a company specific preliminary rate of 24.12% to be posted by cash deposits on the exports from Canada of softwood lumber to the U.S. on or after April 28, 2017. On June 26, 2017, the USDOC issued its preliminary determination in the antidumping
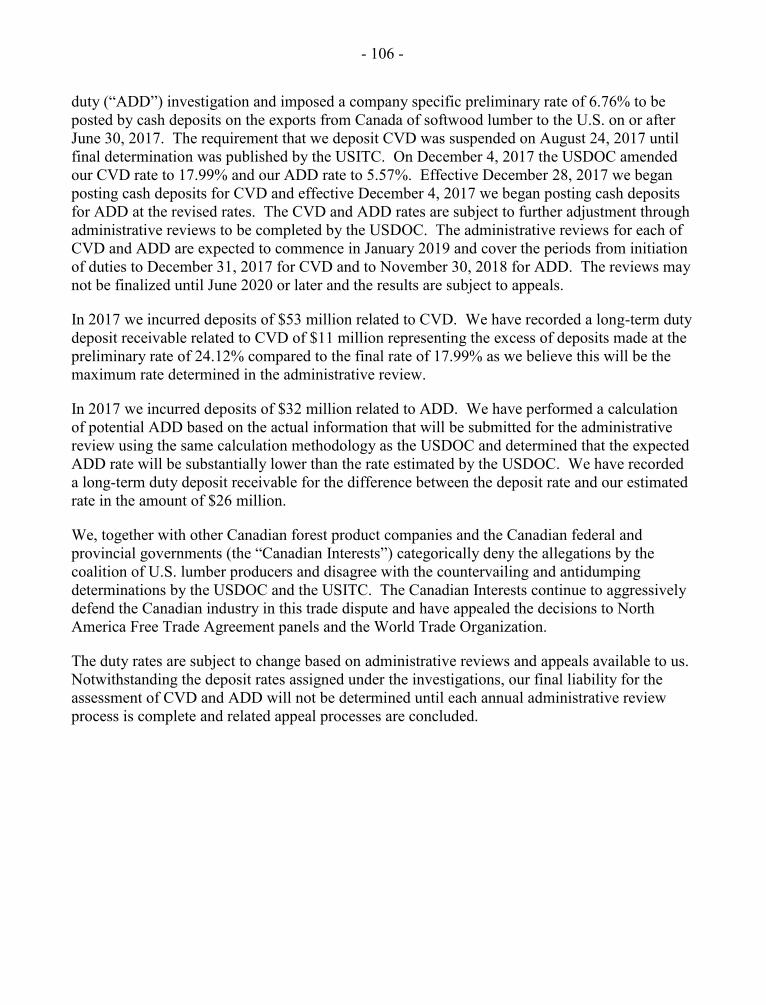
- 106 -
duty (“ADD”) investigation and imposed a company specific preliminary rate of 6.76% to be posted by cash deposits on the exports from Canada of softwood lumber to the U.S. on or after June 30, 2017. The requirement that we deposit CVD was suspended on August 24, 2017 until final determination was published by the USITC. On December 4, 2017 the USDOC amended our CVD rate to 17.99% and our ADD rate to 5.57%. Effective December 28, 2017 we began posting cash deposits for CVD and effective December 4, 2017 we began posting cash deposits for ADD at the revised rates. The CVD and ADD rates are subject to further adjustment through administrative reviews to be completed by the USDOC. The administrative reviews for each of CVD and ADD are expected to commence in January 2019 and cover the periods from initiation of duties to December 31, 2017 for CVD and to November 30, 2018 for ADD. The reviews may not be finalized until June 2020 or later and the results are subject to appeals.
In 2017 we incurred deposits of $53 million related to CVD. We have recorded a long-term duty deposit receivable related to CVD of $11 million representing the excess of deposits made at the preliminary rate of 24.12% compared to the final rate of 17.99% as we believe this will be the maximum rate determined in the administrative review.
In 2017 we incurred deposits of $32 million related to ADD. We have performed a calculation of potential ADD based on the actual information that will be submitted for the administrative review using the same calculation methodology as the USDOC and determined that the expected ADD rate will be substantially lower than the rate estimated by the USDOC. We have recorded a long-term duty deposit receivable for the difference between the deposit rate and our estimated rate in the amount of $26 million.
We, together with other Canadian forest product companies and the Canadian federal and provincial governments (the “Canadian Interests”) categorically deny the allegations by the coalition of U.S. lumber producers and disagree with the countervailing and antidumping determinations by the USDOC and the USITC. The Canadian Interests continue to aggressively defend the Canadian industry in this trade dispute and have appealed the decisions to North America Free Trade Agreement panels and the World Trade Organization.
The duty rates are subject to change based on administrative reviews and appeals available to us. Notwithstanding the deposit rates assigned under the investigations, our final liability for the assessment of CVD and ADD will not be determined until each annual administrative review process is complete and related appeal processes are concluded.
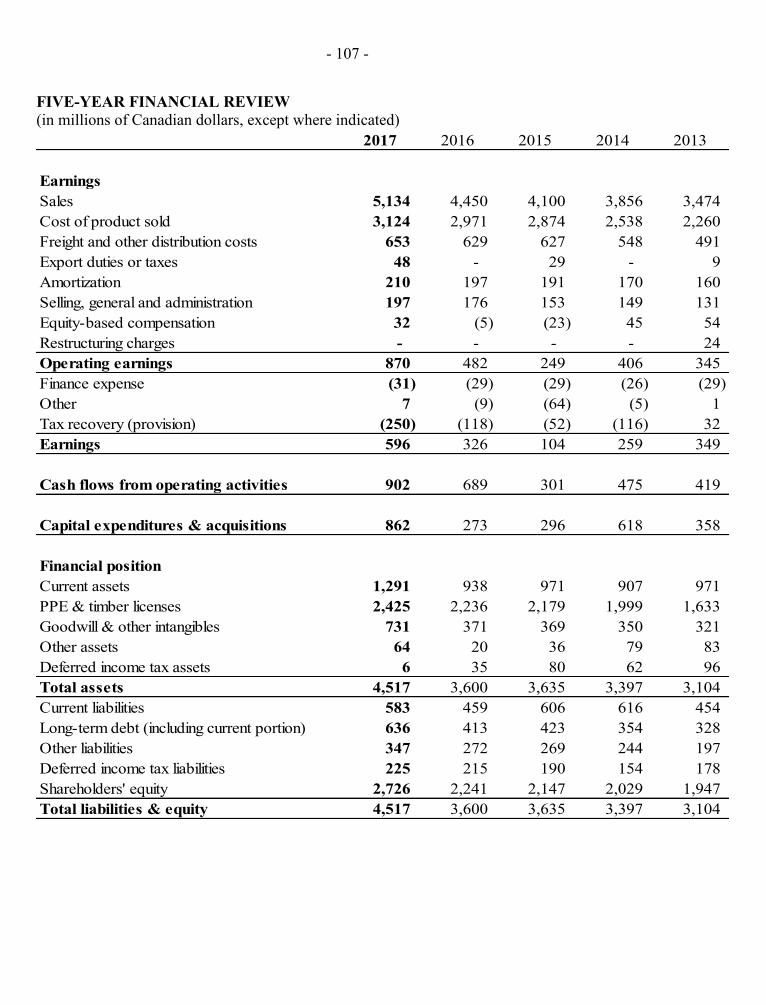
- 107 -
FIVE-YEAR FINANCIAL REVIEW (in millions of Canadian dollars, except where indicated)
2017 2016 2015 2014 2013
EarningsSales 5,134 4,450 4,100 3,856 3,474 Cost of product sold 3,124 2,971 2,874 2,538 2,260 Freight and other distribution costs 653 629 627 548 491 Export duties or taxes 48 - 29 - 9 Amortization 210 197 191 170 160 Selling, general and administration 197 176 153 149 131 Equity-based compensation 32 (5) (23) 45 54 Restructuring charges - - - - 24 Operating earnings 870 482 249 406 345 Finance expense (31) (29) (29) (26) (29) Other 7 (9) (64) (5) 1 Tax recovery (provision) (250) (118) (52) (116) 32 Earnings 596 326 104 259 349
Cash flows from operating activities 902 689 301 475 419
Capital expenditures & acquisitions 862 273 296 618 358
Financial positionCurrent assets 1,291 938 971 907 971 PPE & timber licenses 2,425 2,236 2,179 1,999 1,633 Goodwill & other intangibles 731 371 369 350 321 Other assets 64 20 36 79 83 Deferred income tax assets 6 35 80 62 96 Total assets 4,517 3,600 3,635 3,397 3,104 Current liabilities 583 459 606 616 454Long-term debt (including current portion) 636 413 423 354 328Other liabilities 347 272 269 244 197Deferred income tax liabilities 225 215 190 154 178Shareholders' equity 2,726 2,241 2,147 2,029 1,947Total liabilities & equity 4,517 3,600 3,635 3,397 3,104
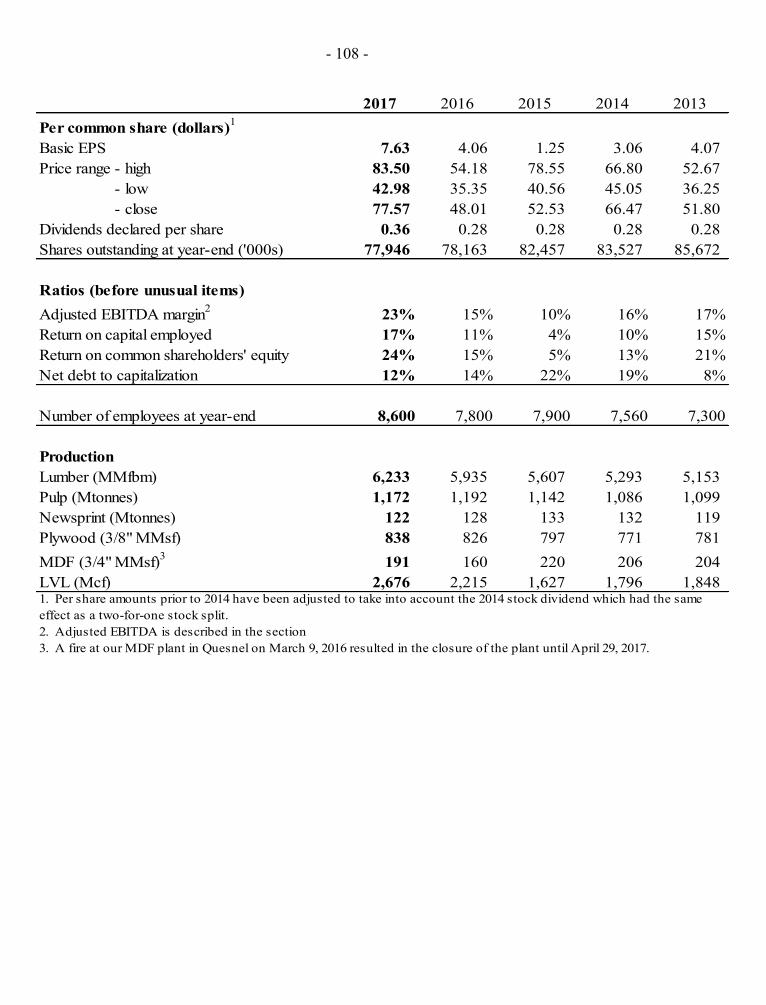
- 108 -
2017 2016 2015 2014 2013Per common share (dollars)1
Basic EPS 7.63 4.06 1.25 3.06 4.07Price range - high 83.50 54.18 78.55 66.80 52.67 - low 42.98 35.35 40.56 45.05 36.25 - close 77.57 48.01 52.53 66.47 51.80 Dividends declared per share 0.36 0.28 0.28 0.28 0.28Shares outstanding at year-end ('000s) 77,946 78,163 82,457 83,527 85,672
Ratios (before unusual items)Adjusted EBITDA margin2 23% 15% 10% 16% 17%Return on capital employed 17% 11% 4% 10% 15%Return on common shareholders' equity 24% 15% 5% 13% 21%Net debt to capitalization 12% 14% 22% 19% 8%
Number of employees at year-end 8,600 7,800 7,900 7,560 7,300
ProductionLumber (MMfbm) 6,233 5,935 5,607 5,293 5,153Pulp (Mtonnes) 1,172 1,192 1,142 1,086 1,099Newsprint (Mtonnes) 122 128 133 132 119Plywood (3/8" MMsf) 838 826 797 771 781MDF (3/4" MMsf)3 191 160 220 206 204LVL (Mcf) 2,676 2,215 1,627 1,796 1,848
2. Adjusted EBITDA is described in the section 3. A fire at our MDF plant in Quesnel on March 9, 2016 resulted in the closure of the plant until April 29, 2017.
1. Per share amounts prior to 2014 have been adjusted to take into account the 2014 stock dividend which had the same effect as a two-for-one stock split.
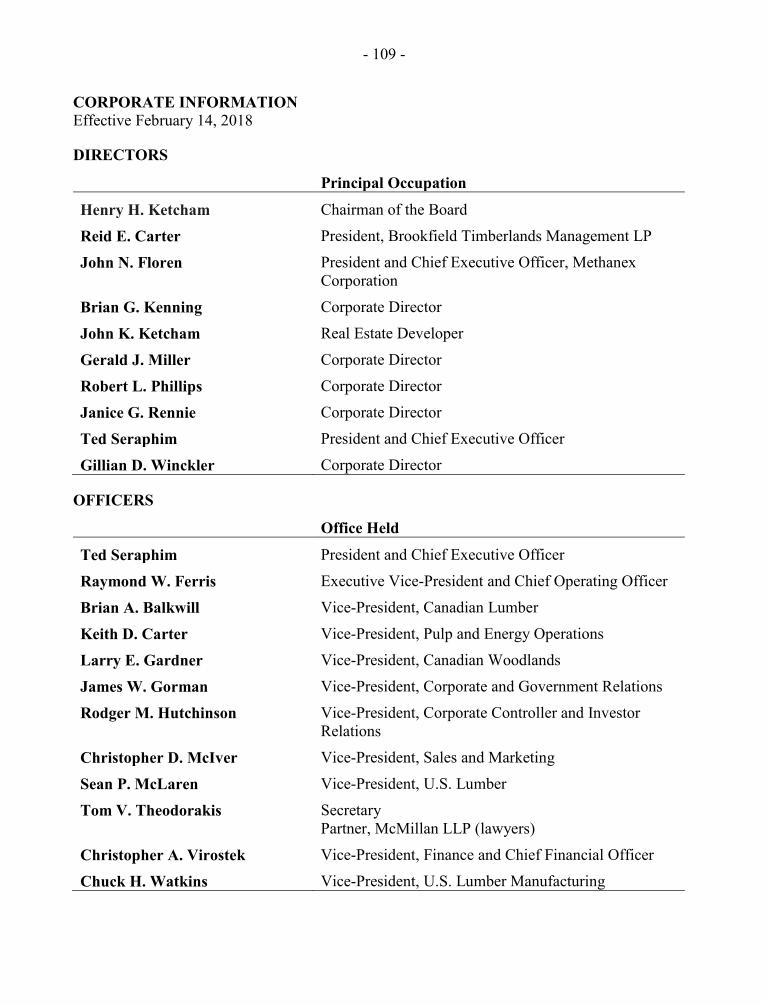
- 109 -
CORPORATE INFORMATION Effective February 14, 2018
DIRECTORS
Principal Occupation
Henry H. Ketcham Chairman of the Board
Reid E. Carter President, Brookfield Timberlands Management LP
John N. Floren President and Chief Executive Officer, Methanex Corporation
Brian G. Kenning Corporate Director
John K. Ketcham Real Estate Developer
Gerald J. Miller Corporate Director
Robert L. Phillips Corporate Director
Janice G. Rennie Corporate Director
Ted Seraphim President and Chief Executive Officer
Gillian D. Winckler Corporate Director
OFFICERS
Office Held
Ted Seraphim President and Chief Executive Officer
Raymond W. Ferris Executive Vice-President and Chief Operating Officer
Brian A. Balkwill Vice-President, Canadian Lumber
Keith D. Carter Vice-President, Pulp and Energy Operations
Larry E. Gardner Vice-President, Canadian Woodlands
James W. Gorman Vice-President, Corporate and Government Relations
Rodger M. Hutchinson Vice-President, Corporate Controller and Investor Relations
Christopher D. McIver Vice-President, Sales and Marketing
Sean P. McLaren Vice-President, U.S. Lumber
Tom V. Theodorakis Secretary Partner, McMillan LLP (lawyers)
Christopher A. Virostek Vice-President, Finance and Chief Financial Officer
Chuck H. Watkins Vice-President, U.S. Lumber Manufacturing
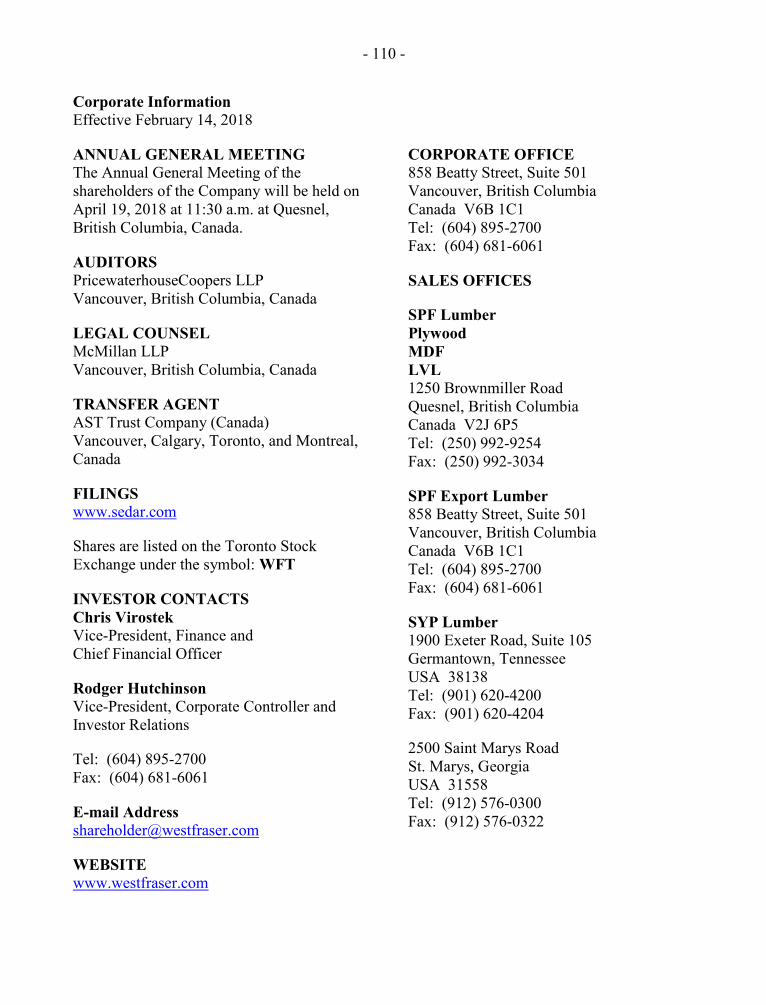
- 110 -
Corporate Information Effective February 14, 2018
ANNUAL GENERAL MEETING The Annual General Meeting of the shareholders of the Company will be held on April 19, 2018 at 11:30 a.m. at Quesnel, British Columbia, Canada.
AUDITORS PricewaterhouseCoopers LLP Vancouver, British Columbia, Canada
LEGAL COUNSEL McMillan LLP Vancouver, British Columbia, Canada
TRANSFER AGENT AST Trust Company (Canada) Vancouver, Calgary, Toronto, and Montreal, Canada
FILINGS www.sedar.com
Shares are listed on the Toronto Stock Exchange under the symbol: WFT
INVESTOR CONTACTS Chris Virostek Vice-President, Finance and Chief Financial Officer
Rodger Hutchinson Vice-President, Corporate Controller and Investor Relations
Tel: (604) 895-2700 Fax: (604) 681-6061
E-mail Address [email protected]
WEBSITE www.westfraser.com
CORPORATE OFFICE 858 Beatty Street, Suite 501 Vancouver, British Columbia Canada V6B 1C1 Tel: (604) 895-2700 Fax: (604) 681-6061
SALES OFFICES
SPF Lumber Plywood MDF LVL 1250 Brownmiller Road Quesnel, British Columbia Canada V2J 6P5 Tel: (250) 992-9254 Fax: (250) 992-3034
SPF Export Lumber 858 Beatty Street, Suite 501 Vancouver, British Columbia Canada V6B 1C1 Tel: (604) 895-2700 Fax: (604) 681-6061
SYP Lumber 1900 Exeter Road, Suite 105 Germantown, Tennessee USA 38138 Tel: (901) 620-4200 Fax: (901) 620-4204
2500 Saint Marys Road St. Marys, Georgia USA 31558 Tel: (912) 576-0300 Fax: (912) 576-0322
- 111 -
Pulp 858 Beatty Street, Suite 501 Vancouver, British Columbia Canada V6B 1C1 Tel: (604) 895-2700 Fax: (604) 681-6061
Newsprint 2900 – 650 West Georgia Street Vancouver, British Columbia Canada V6B 4N8 Tel: (604) 681-8817 Fax: (604) 681-8861
OPERATIONS
Lumber, Plywood and LVL
Canadian Operations 1250 Brownmiller Road Quesnel, British Columbia Canada V2J 6P5 Tel: (250) 992-9244 Fax: (250) 992-9233
US Operations 1900 Exeter Road, Suite 105 Germantown, Tennessee USA 38138 Tel: (901) 620-4200 Fax: (901) 620-4204
MDF
WestPine 300 Carradice Road Quesnel, British Columbia Canada V2J 5Z7 Tel: (250) 991-7100 Fax: (250) 991-7115
Ranger Board P.O. Box 6 Blue Ridge, Alberta Canada T0E 0B0 Tel: (780) 648-6333 Fax: (780) 648-6397
Pulp & Paper
Cariboo Pulp & Paper P.O. Box 7500 50 North Star Road Quesnel, British Columbia Canada V2J 3J6 Tel: (250) 992-0200 Fax: (250) 992-2164
Quesnel River Pulp 1000 Finning Road Quesnel, British Columbia Canada V2J 6A1 Tel: (250) 992-8919 Fax: (250) 992-2612
Hinton Pulp 760 Switzer Drive Hinton, Alberta Canada T7V 1V7 Tel: (780) 865-2251 Fax: (780) 865-6666
Slave Lake Pulp P.O. Box 1790 Slave Lake, Alberta Canada T0G 2A0 Tel: (780) 849-7777 Fax: (780) 849-7725
Alberta Newsprint Company Postal Bag 9000 Whitecourt, Alberta Canada T7S 1P9 Tel: (780) 778-7000 Fax: (780) 778-7070
- 112 -
GLOSSARY OF INDUSTRY TERMS
AAC Annual Allowable Cut The volume of timber that may be harvested annually from a specific timber tenure.
BCTMP Bleached Chemithermomechanical Pulp
Dimension Lumber Standard commodity lumber ranging in sizes from 1 x 3’s to 4 x 12’s, in various lengths.
FMA Forest Management Agreement An FMA is granted by the Alberta government and entitles the holder to establish, grow and harvest timber on specified lands.
LVL Laminated Veneer Lumber Large sheets of veneer bonded together with resin then cut to lumber equivalent sizes.
m3 A solid cubic metre, a unit of measure for timber, equal to approximately 35 cubic feet.
Mcf One thousand cubic feet. A unit of measure for laminated veneer lumber.
MDF Medium Density Fibreboard A composite product made from wood fibre.
Mfbm One thousand board feet (equivalent to one thousand square feet of lumber, one inch thick). MMfbm means one million board feet.
Msf A unit of measure for MDF and plywood equal to one thousand square feet on a 3/4 inch basis for MDF and on a 3/8 inch basis for plywood. MMsf means one million square feet.
NBSK Northern Bleached Softwood Kraft Pulp
Return on Capital Employed Earnings before after-tax financing expense divided by average assets less average current non-interest bearing liabilities.
Return on Common Shareholders' Equity Earnings available to common shareholders divided by average shareholders’ equity.
SPF Dimension lumber produced from spruce/pine/balsam fir species.
SYP Dimension lumber produced from southern yellow pine species.
Ton A unit of weight equal to 2,000 pounds, generally known as a U.S. ton.
Tonne A unit of weight in the metric system equal to one thousand kilograms or approximately 2,204 pounds. Mtonne means one thousand tonnes.


WEST FRASER TIMBER CO. LTD.Tel: 604.895.2700
Fax: 604.681.6061
westfraser.com