Embed Size (px)
Citation preview

WEST BENGAL
STATE AGRICULTURE PLAN XIIth Five Year Plan
(2012-17)
Prepared by
NABARD Consultancy Services Pvt. Ltd 6, Royd Street, Kolkata – 700016

DISCLAIMER
This document has been prepared by NABARD Consultancy Services
(NABCONS) on behalf of Agriculture Department, Govt. of West
Bengal based on the information furnished in C-DAPs, several rounds
of discussions held with the stakeholder departments and agencies,
and information provided by them during preparation of the
document. The views expressed in this report are advisory in nature.
It does not represent or reflect the policy or views of NABARD.
NABARD/NABCONS does not accept any financial liability to anyone
using this document for any purpose.

Acknowledgements
At the outset, we express our sincere thanks to Shri Sanjeev Chopra, Additional
Chief Secretary, Agriculture Department, Govt. of West Bengal for giving us an
opportunity to prepare the prestigious State Agriculture Plan and his guidance in
execution of the assignment.
We are thankful to the Secretaries of concerned departments for their suggestion
and guidance.
We also gratefully acknowledge the excellent cooperation received, especially
from Shri J. Roy, Joint Secretary, Department of Agriculture, GoWB and Shri N C
Das, State Nodal Officer, State RKVY Cell and his team in providing all basic
information, linkages and meaningful discussion during execution of the
assignment.
We are thankful to the officials of stakeholder departments who cooperated with
us providing deep insight into the developmental agenda, data, information etc.
We have referred all CDAPs, while preparing the report and gratefully
acknowledge the BCKV and UBKV, who have prepared the CDAPs. We also
extend our heartfelt thanks to functionaries in districts for the valuable inputs &
suggestions given for preparation of CDAPs which led to preparation of State
Agriculture Plan.
We have referred to different government publications, websites of concerned
departments, data from SLBC, NABARD etc. and other publications which has
provided insight required for development of a plan. We hereby acknowledge the
support thus received.
We also offer our special thanks to the ‘S N Bose Society for Sustainable
Development’, the outsourced consultant for painstakingly drafting and
formulating the plan.
ABBREVIATIONS
ACA Additional Central Assistance Schemes
ACABC Agri Clinic and Agri business Centre
AEZ Agriculture Export Zone
AI Artificial Insemination
APMA Agriculture Produce Market Act
APMC Agriculture Produce Market Committee
ARD Animal Resources Development
ATMA Agriculture Technology Management Agency
BCA Business Correspondent Agent
BENFISH West Bengal State Fishermen’s Co-operative Federation Ltd
BFDA Brackish Water Fish Farmers’ Development Agency
BGREI Bringing Green Revolution to Eastern India
C - DAP Comprehensive District Agricultural Plan
CAT Capacity Building for Adoption of Technology
CB Commercial Bank
CHC Custom Hiring Center
CIFRI Central Inland Fishery Research Institute
CISS Capital Investment Subsidy Scheme
CPCRI Central Plantation Crop Research Institute
CRIJAF Central Research Institute for Jute and Allied Fibers
CSSRI Central Soil Salinity Research Institute
CWC Central warehousing Corporation
DAR&AH Directorate of Animal Resources & Animal Health
DAIRPOUL West Bengal Dairy & Poultry Development Corporation Ltd.
DBTL Direct Benefit Transfer Limited
DCCB District Central Cooperative Bank
DPC District Planning Committee
DPR Detailed Project Report
FC Farmers' Club
FFDA Fish Farmers Development Agency

FIF Financial Inclusion Fund
FIPF Farm Innovation and Promotion Fund
FITF Financial Inclusion Technology Fund
FPO Farmer Producers' Organization
FTTF Farmers Technology Transfer Fund
FYM Farm Yard Manure
GIS Geographical Information System
GLC Ground level Credit
GOI Government of India
GSDP Gross State Domestic Product
HDTW High Capacity Deep Tube well
ICAR Indian Council of Agricultural Research
ICM Integrated Crop Management
ICT Information and Communication Technology
INM Integrated Nutrient Management
IPM Integrated Pest Management
IVRI Indian Veterinary Research Institute
JLG Joint Liability Group
KCC Kishan Credit Card
KVK Krishi Vikas Kendra
LD Line Departments
LDPE Low Density Poly Ethylene
LDTW Low Capacity Deep Tube well
LT Loan Long Term Loan
MDTW Medium Capacity Deep Tube well
MGNREGA Mahatma Gandhi National Rural Employment Guarantee Act
MIS Management Information System
MNAIS Modified National Agricultural Insurance Scheme
MSP Minimum Support Price
MGNREGS Mahatma Gandhi National Rural Employment Guarantee Scheme
NAAS National Academy of Agricultural Science

NMPS National Mission for Protein Supplements
WBFC West Bengal Fisheries Corporation Ltd.
NABARD National Bank For Agriculture And Rural Development
NABCONS NABARD Consultancy Services
NARS National Agriculture Research System
NBSS& LUP National Bureau of Soil Survey and Land Use Planning
NCIP National Crop Insurance Programme
NDRI National Dairy Research Institute
NFSM National Food Security Mission
NFSM National Food Security Mission
NGNBP Nijo Griha Nijo Bhumi Prakalpa
NGO Non Government Organisation
NHM National Horticulture Mission
NIRJAFT National Institute of Research on Jute and Allied Fiber Technology
NPCI National Payment Corporation of India
NRAA National Rainfed Area Authority
NSDP Net State Domestic Product
NSTIAM Netaji Subhas Training Institute of Agriculture Marketing
ODW Open Dug well
PACS Primary Agriculture Cooperative Society
PAMS Primary Agricultural Marketing Society
PBGSBS Paschim Banga Go Sampad Bikash Sanstha
PFCS Primary Fishermen Cooperative Societies
PHT Post Harvest Technology
PIA Project Implementing Agency
PMJDY Prime Minister's Jana Dhana Yojona
PRA Participatory Rural Appraisal
PRI Panchyati Raj Institution
RIDF Rural Infrastructure Development Fund
RKVY Rashtriya Krishi Vikas Yojana
RLI River Lift Irrigation

RMC Regulated Market Committee
RRB Regional Rural Bank
RUDSETI Rural Development Skill and Entrepreneurship Training Institute
RLI River Lift Irrigation
SDP Net State Domestic product
SFDC State Fisheries Development Corporation Ltd.
ST Loan Short Term Loan
ST Schedule Tribe
STW Shallow Tube well
SWC State Warehousing Corporation
SWOT Strength Weakness Opportunity Threat
SAMETI State Agriculture Management Extension and Training Institute
SAP State Agricultural Plan
SARP System of Assured Rice Production
SAU State Agriculture University
SC Schedule Caste
SCARDB State Cooperative Agriculture Rural Development Bank
SHG Self Help Group
SLBC State Level Bankers Committee
SPS Sanitary and Phyto Sanitary Measures
STCP Short Term Credit Programme
TSP Tribal Sub Plan
TFP Total Factor Productivity
WBLDC West Bengal Livestock Development Corporation Ltd.
WBSCB West Bengal State Cooperative Bank
WDF Watershed Development Fund
YOY Year on Year
ZP Zilla Parisad

INDEX
CHAPTER CONTENTS Page
No.
EXECUTIVE SUMMARY i - ix
I INTRODUCTION 1
1.1 Rashtriya Krishi Vikash Yojana 2
1.2 Vision 3
1.3 Objectives 3
1.4 Methodology 3
1.5 Challenges 4
II STATE PROFILE 7
2.1 Geographical Location 8
2.2 Socio Economic Profile 8
2.3 Physiography 11
2.4 Geology 11
2.5 Soil 12
2.6 Climate 13
2.7 Land Use 13
2.8 Forest Cover 14
2.9 Degraded Land 15
2.10 Agro-Climatic Region 16
2.11 Water Resources 18
2.12 Animal Resources 19
2.13 Fisheries 21
III SWOT Analysis 22
3.1 Agriculture 23
3.2 Horticulture 25
3.3 Agricultural Mechanization 27
3.4 Animal Resources Development 28
3.5 Fisheries 29
3.6 Sericulture 31
3.7 Forest 31
3.8 Water Resources Development 32
3.9 Agricultural Marketing 34
3.10 Co-operation 36
IV DEVELOPMENT IN AGRICULTURE SECTOR 38
4.1 Introduction 39
4.2 Crops and Cropping Pattern 40
4.3 Gap Analysis 42
4.4 Varietal Development and Seed Multiplication 44
4.5 Seed Replacement 48
4.6 Soil Fertility 49
4.7 Fertilizer use 50
4.7.1 Organic manure and bio pesticides 52
4.8 Agricultural Mechanization 53
4.8.1 Trends of Mechanization 54
4.8.2 Custom Hiring 55
4.9 Irrigation 56
4.9.1 Major and medium irrigation projects 57
4.9.2 Minor irrigation 57
4.9.3 XIIth Plan Achievement 59
4.10 Horticulture 59
4.10.1 Fruits 60
4.10.2 Vegetables 61
4.10.3 Spices 61
4.10.4 Flower 62
4.10.5 Plantation Crops 63
4.10.6 Projected Requirement of fruits and Vegetables 64
4.11 Agro Processing 65
4.12 Soil Conservation 66
4.12.1 Watershed Development 67
4.12.2 Rain water harvesting 68

4.13 Impact of Climate change 68
4.13.1 Climate Change Adaptation Activities in West
Bengal
71
4.13.2 NABARD’s Initiatives to Reduce the Impact of
Climate Change
78
4.14 Crop Insurance 80
V DEVELOPMENT IN ALLIED SECTOR 82
5.1 Animal Resource Development 83
5.1.1 Overview of Development 83
5.1.2 Achievement during XI Plan 84
5.1.3 Gap Analysis 85
5.1.4 Achievement in the XII Plan (2012-14) 87
5.2 Fisheries Sector 90
5.2.1 Overview of development 90
5.2.2 Achievement during XIth Plan 95
5.2.3 Gap Analysis 96
5.2.4 Achievements in XII Plan (2012-14) 97
5.3 Sericulture 99
5.3.1 Introduction 99
5.3.2 Overview of Development 100
5.4 Forest 101
5.4.1 Biosphere Reserve 102
5.4.2 Non timber forest produce 102
5.4.3 Joint Forest Management 103
5.4.4 Agro forestry 104
5.4.4.1 Agroforestry Models 105
VI AGRICULTURE SUPPORT SECTOR 106
6.1 Agricultural Marketing 107
6.1.1 Introduction 107
6.1.2 Nature of Markets in the State 107
6.1.3 Problems in agro marketing 107
6.1.4 Areas of Concerns 108

6.1.5 Agricultural Cooperative Marketing Societies 108
6.1.6 Development in the Agricultural Marketing 109
6.1.7 Development of Rural market infrastructure 109
6.1.8 Amendment of Marketing Act 111
6.1.9 Food Processing and Data Collection Centres 112
6.1.10 Gap Analysis 112
6.1.11 Performance during XIth & XIIth FY Plan 112
6.2 Cooperation 113
6.2.1 Introduction 113
6.2.2 Major Concerns 114
6.2.3 Vaidyanathan Committee Recommendations 114
6.2.4 Schemes of Co-operative Department 115
6.2.5 Performance during XIth & XIIth FY Plan 116
6.3 Institutional Credit 116
6.3.1 Banking Profile 166
6.3.2 Branch Network 117
6.3.3 Deposits 118
6.3.4 Loans and Advances 118
6.3.5 Agency-wise CD ratio 119
6.3.6 Ground Level Credit (GLC) flow 119
6.3.7 Kisan Credit Card and Farmers’ Welfare 121
6.3.8 Credit Flow to Agriculture Sector 121
6.3.9 Financing to Self Help Groups 121
6.3.10 Financial Inclusion 123
6.3.10.1 Roll out of Financial Inclusion Plan 123
6.3.10.2 Initiatives of NABARD / RBI / GOI
relating to Financial Inclusion
123
6.3.10.3 Status of Financial Inclusion in the
State
124
6.4 Agriculture Extension 125
6.4.1 State Extension Service 125
6.4.2 Education / Research Institutions 126

6.4.3 NABARD 127
6.4.3.1 Farmers’ Club 127
6.4.4 N.G.O 127
6.4.5 Major Concerns 128
6.4.6 Possible Interventions 128
6.5 Agricultural Research and Education 129
6.5.1 Agricultural Universities 129
6.5.2 ICAR Institutes 130
6.5.3 ICAR Regional Research Stations 131
6.6 Food and Civil Supplies 133
VII STATE PLAN : Strategies and Interventions 134
7.1 Agriculture 135
7.2 Horticulture 137
7.2.1 Vegetables 137
7.2.2 Fruits 139
7.2.3 Flowers 139
7.2.4 Spices 140
7.2.5 Plantations 140
7.3 Animal Resource Development 141
7.4 Fisheries 141
7.5 Agriculture Mechanization 143
7.6 Water Resource Development 144
7.7 Soil Conservation 145
7.8 Agro-Processing 146
7.9 Forest 146
7.10 Sericulture 147
7.11 Agri-Marketing 147
7.12 Co-operation 149
7.13 Agriculture Extension and Education 149
7.14 Credit 150
7.15 Strategies to address climate change concerns 151

VIII STATE PLAN : Financial Outlay and Outcome 162
8.1 Financial Outlay and Expenditure during XIth Plan 163
8.2 Financial Outlay during XIIth FYP 163
8.3 Broad Sector-wise Projection 164
8.4 Convergence 164
8.5 Flagship Programmes and Outlays 165
8.5.1 Agriculture 165
8.5.2 Horticulture 171
8.5.3 Animal Resource Department 171
8.5.4 Fisheries 172
8.6 Expected Outcome 173
Annexure Projects proposed in XIIth Plan with Budgetary
allocation
175
Appendix A Additional information in Appendix 1 to 21 237
Appendix B District Profiles 258
LIST OF TABLES
Table
No. Table Headings
Page
No.
2.1 Demographic Features of West Bengal 10
2.2 Status of Degraded Land in West Bengal 15
2.3 Water Resources in different districts of West Bengal 19
2.4 Livestock population in West Bengal 20
2.5 Fishery resources in West Bengal 21
4.1 Area, yield rate and production of principal crops in West Bengal 41
4.2 Estimated requirement (ER), Actual Production and Gap (%) of major crops
(in Lakh MT) in West Bengal for the years 2013-14, 2014-15 and 2015-16
42
4.3 Annual growth rate (%) of yield rate of different crops in West Bengal
during different years (Base year Tri-ending 2005-07*)
43
4.4 Varieties of some important crops in West Bengal 44
4.5 Seed replacement rate (SRR) (%) of different crops during 2011-14 48
4.6 Soil fertility status of districts of West Bengal 49

4.7 Trend in yearly fertilizer consumption (in ‘000 tons) in West Bengal 51
4.8 Production of different organic manures 53
4.9 Food grain production (kg/ha) with relation to farm power availability
((KW/ha)
55
4.10 Equipments procured/ subsidized by Govt. of W.B. through different
schemes during 2012-13.2013-14 and 2014-15 including those privately
owned
56
4.11 Status of minor irrigation in West Bengal (2013-14) 58
4.12 Minor irrigation potential created up to 2013-14 59
4.13 Area, Production and Productivity of Fruit Crops 60
4.14 Area, Production & Productivity of Vegetables in West Bengal 61
4.15 Area, Production & Productivity of Spices in West Bengal 62
4.16 Area, Production & Productivity of Flowers in West Bengal 63
4.17 Area, Production & Productivity of Plantation Crops in West Bengal 63
4.18 Area and Production of different horticulture produce [during 2013-14] 64
4.19 Projected Requirement of Fruits and Vegetables 65
4.20 Rainfall analysis (mm) for the year 2011-2013 69
5.1 Production and demand of major live stock products 83
5.2 Achievements Animal Resource Development during 2012-14 of XII Plan 87
5.3 Financial and Physical Achievements of Paschim Banga Go Sampad Bikash
Sanstha (PBGSBS) during 2012-14
87
5.4 Daily average and annual milk procurement from DCS / WDCS of the Milk
Unions during 2013-14
89
5.5 Manufacture and marketing of feed during 2013-14 89
5.6 Production, growth rate and demand of fish in West Bengal 90
5.7 Fish Seed Production (million) in West Bengal 92
5.8 Export of fish, prawn and other fishery produce 94
5.9 Areas under forest in different districts of West Bengal 101
5.10 Some important non timber forest products 103
5.11 Fruits and tree species recommended for agro forestry in West Bengal 105
6.1 Investment in Marketing Infrastructure and Plan Expenditure 113
6.2 Financial outlay in Agri Marketing during 2014-15 to 2016-17 113

6.3 Financial outlay of Cooperation sector during 2014-15 to 2016-17 116
6.4 Branch Network in West Bengal 117
6.5 Agency- wise Deposits in West Bengal 118
6.6 Agency-wise Loans and Advances in West Bengal 119
6.7 Agency-wise CD ratio in West Bengal 119
6.8 Sector-wise GLC flow in West Bengal (2010-11 to 2013-14) 120
6.9 Agency-wise GLC flow in West Bengal 2013-14 120
6.10 Progress on Kisan Credit Card and Credit Flow 121
6.11 SHG Bank Linkage Programme during last five years ending March, 2014 122
6.12 ICAR Regional stations in West Bengal 131
6.13 Present capacity and requirement of space in food and supply services 133
8.1 Financial Achievement of Agricultural and Allied Sectors compared to
Total Annual Plan size in XI FYP
163
8.2 Financial outlay during XIIth FYP 163
8.3 Consolidated sector-wise financial outlay during 2014-15 to 2016-17 of
XIIth FYP
164
LIST OF FIGURES
Fig.
No. Content
Page
No.
2.1 Map of West Bengal 9
2.2 Percent growth of per capita income at constant prices (2011-12 base) 11
2.3 Forest cover of West Bengal 14
4.1 Fertilizer Consumption in West Bengal 50
5.1 District wise water area (ha) of all sources except river, khal/canal and
reservoir and inland fish production in MT in West Bengal
91
5.2 Trend of district wise fish seed production in west Bengal 92
5.3 Trend of marine fish growth and production (lakh MT) in West Bengal 93

APPENDIX - A
Appendix
No. Content
Page
No.
1 Per Capita Income of Various Indian States 238
2 Average Monthly and Annual Rainfall and Rainy days in the
Districts of West Bengal
239
3 Average Daily Maximum and Minimum Temperature in 0C 240
4 District-wise Land Use Classification in West Bengal (Area in ha ) 241
5 District wise Area under Forests in West Bengal 242
6 District-wise Degraded Lands 243
7 Major Crops in the districts of West Bengal 244
8 Implements recommended for different crops in West Bengal 245
9 District wise net ground water availability, utilization and status of
groundwater development in West Bengal (in ham)
247
10 District wise Categorization of Blocks by Exploitation and Quality 248
11 Financial and physical targets for water resource development 249
12 Major horticulture crops growing districts 250
13 IWMP Projects in the State of West Bengal 252
14 The Achievements of IWMP in West Bengal 253
15 Changes in some agriculturally important weather components in
India over the last 60 years
254
16 District wise Mulberry Sericulture Status (2014-2015) 254
17 District wise Tasar Sericulture Status (2014-2015) 255
18 District wise Muga Sericulture Status (2014-2015) 255
19 District wise Eri Sericulture Status (2014-2015) 255
20 Silk Production and Target during XIIth Five Year Plan 256
21 District-wise Forest-cover of West Bengal 257

APPENDIX II
District Profile
Sl. No. District Page No.
1 Alipurduar 259
2 Bankura 261
3 Birbhum 262
4 Burdwan 264
5 Coochbehar 267
6 Dakshin Dinajpur 269
7 Darjeeling 271
8 Hoogly 273
9 Howrah 274
10 Jalpaiguri 276
11 Malda 278
12 Murshidabad 280
13 Nadia 282
14 North 24-Parganas 283
15 Paschim Medinipur 285
16 Purba Medinipur 287
17 Purulia 289
18 South 24-Parganas 291
19 Uttar Dinajpur 292

i
EXECUTIVE SUMMARY
State Agriculture Plan
XIIth FYP (2012-17)

ii
West Bengal, endowed with rich natural resources and having diverse agro-
climatic conditions offers unique opportunities for cultivation of various crops,
livestock rearing, fish culture etc. There is immense potential for increasing
agricultural production in the state, which may also impact food security in the
national level.
To provide an impetus to the growth in agriculture and allied sectors
Department of Agriculture and Cooperation, Ministry of Agriculture, Government of
India, launched the Rashtriya Krishi Vikash Yojana (RKVY) for facilitating enhanced
investments in agriculture and allied sectors. Norms of implementation of the scheme
necessitates that State and District level plans for development of agriculture and
allied sectors are prepared by the State Governments for the XIIth Five year plan
period ensuring a holistic approach and enabling optimal use of available resources.
The present plan is an effort towards that end to usher in planned development of
agriculture and allied sectors in West Bengal.
The statistical profile of the state; inputs from the Comprehensive District
Agriculture Plans (CDAPs) prepared for the XIIth Five year plan period; inputs,
suggestions and priorities of the stakeholder departments and various publications of
the government forms the basis for preparation of the present plan. RKVY guidelines
have been adhered to while drafting the plan.
Vision: ‘‘Doubling farmers’ income by 2020 through ensuring farmers’ access to
Skills, Technologies, Markets and Financial inclusion’’.
Objectives
1. To ensure Quantifiable improvement in Production & Productivity.
2. To Reduce yield gap with focused interventions.
3. To maximise returns to the farmers from Agriculture & Allied sectors.
4. To Augment Marketing interventions and export promotion.
5. To Promote Competitiveness in Agriculture and Allied Sector.
6. To meet the challenges of Climate change and evolve mechanisms for
effective drought and flood management.

iii
Present status, challenges and constraints; potential and upcoming opportunities,
threats and weaknesses, development needs and priorities for the state has been taken
into account while devising the strategy and formulating the plan to foster growth
through enhancing productivity of agriculture, livestock and fisheries; effective
management of natural resources; addressing climate risks in agriculture; emphasis on
diversification in agriculture, post-harvest management & value-addition; increased
investment in agriculture & infrastructure and improving the livelihood of resource
poor farmers.
The geography of the state, spread from the Himalayas in the north to the Bay
of Bengal in the south with the mangroves of the Sundarbans, provides unique
opportunities. Availability of different soil types, rich water resources provides
additional advantages.
West Bengal has 2.7 percent of the nation's total land and about 8% of the
country's population. It produces more than eight per cent of the food produced in the
country. The state is a leading producer of rice, potato, vegetables, fish, meat and also
significant producer of pineapple, litchi, flower, mango, mandarin orange. West
Bengal supplies about 33% of potato and 66% of jute requirement of the country.
With the aim of doubling income of farmers by 2020 a growth rate of 4% in
agriculture has been envisaged during the XIIth plan period.
Resource constraints incapacitate the poor farming majority from adoption of
modern technology. Small and fragmented holdings, risk factors in agriculture, high
input cost, inadequate market access, non-remunerative market price as well as
fluctuating and unfavourable market has resulted in farming gradually becoming non-
remunerative. Major constraints affecting agricultural productivity are:
Low factor productivity; unavailability of quality seed, planting materials and
other agricultural inputs on time.
Insufficient processing and marketing of agriculture produce.
Unexploited potential for commercialization of fruits and vegetables and poor
adoption of post-harvest technologies.

iv
Resource poor farmers with low per capita income, lowest per capita land
availability, small and fragmented land holdings.
Inadequacy of extension and other service delivery mechanism to
meaningfully reach poor farmers.
Poor infrastructure, road, communication and storage facility.
Lack of effective value chain management initiatives.
Inadequate alliances, partnership and linkages for research and development,
technology dissemination and commercialization
Inadequate manpower with proper knowledge base on impact, vulnerability
and adoption of climate change on agricultural production system.
Limitations on expansion of area under cultivation, need for increase in
productivity to make farming remunerative calls for integrated farming approaches by
combining farm enterprises such as horticulture, fishery, livestock, sericulture,
vegetables, floricultures etc. in the farming system.
Major cropping pattern of the state is rice based with potato, jute, sugarcane,
wheat, maize, pulses, oil seeds and vegetables being major crops grown. The
production of rice and cereals has been appreciable and production is in surplus. West
Bengal has been lagging behind in production of pulses and oilseeds and this calls for
immediate intervention to facilitate increase in area and prouction of oilseed and
pulses. Seed replacement rate for most of the crops are good and this necessitates the
need for ensuring timely availability of quality seed which also opens up seed
production as one of the upcoming commercial activity in the state. Necessary support
to facilitate seed production is envisaged to be attempted through the ‘seed mission’.
Land degradation is a major constraint and merits designing interventions for
reclamation of about 2 million ha of degraded land in West Bengal. Soil erosion has
been a major problem leading to loss of carrying capacity of soil; appropriate land and
water management approaches, measures for erosion control, checking runoff loss,
developing social forestry would be attempted. Though fertilizer consumption in the
state has been increasing poor use of organic manures has resulted in gradual
deterioration of soil health. Initiatives as issue of soil health cards, soil capability
classification, nutrient analysis based use of fertilizer, promotion of organic farming

v
on a large scale, encouraging PGS certification etc. are likely to result in maintenance
as well as development of soil health.
Climate change is one of the major threats especially in view of the
vulnerability of the poor farmers, higher dependence on agriculture and allied sectors
for livelihood by majority of the State’s population, geographical vulnerabilities of the
coastal, Himalayan and drier districts. West Bengal has been a forerunner in
developing the action plan for climate change. Initiatives enabling adaptation to
climate change is envisaged to enable the farmers to better cope with the eventualities
of climate change.
Use of location specific technology for increasing productivity across all the
sectors, bringing in fallow lands under cultivation, promotion of conservation
agriculture approaches such as Zero tillage, bringing more areas under irrigation to
facilitate enhancement of cropping intensity, promoting use of integrated farming
approaches, integrated nutrient and pest management, use of water saving methods as
SRI and other forms of systems of crop intensification would be taken up as an effort
towards attaining the plan objectives.
In Horticulture, the state is a leading producer of fruits and vegetables;
flowers, spices and plantation crops also have good acreage and production. The
growth in acreage and production has been positive. However, demand overshooting
production offers opportunities for increasing production. Specific initiatives are
envisaged to promote cultivation of horticultural crops, support technology transfer to
farmers, use of modern approaches, facilitate cultivation of exotic vegetables and
other crops having good market demand and fetching better price, facilitate
availability of planting materials, promote growth of processing centres to provide a
fillip to the horticultural sector.
Developments in animal husbandry sector have been appreciable. With a
contribution of 2.18% of Net State Domestic Products (SDP) in 2013-14 the sector
has emerged as one of the major sectors providing livelihood opportunities to the poor
in the state. The increase in production has been 4.5 times for Milk (49.06 lakh MT in
2013-14), five times for meat (6.50 lakh MT in 2013-14) and seven times for egg (to

vi
4746 million). It ranks second in goat and sheep meat production. However, there is
deficit in production to the tune of 21.61% in milk, 50.73% in egg, and 37.68% in
meat which indicates the opportunities in this sector. A rational target of higher
production to the extent of 21 61% milk, 20% egg, and 15 % meat is envisaged during
XIIth plan. Upgradation of cattle and buffalo population with the provision of one AI
centre for every 1000 breedable animals, development of milk routes and promotion
of commercial dairy farming is to be attempted for development of the dairy sector.
Proper animal health care facilities, development of fodder and feed production,
enhancing availability of breeding stock, provision of proper training and extension
support to farmers, development of poultry hubs, encouraging SHGs to take up
livestock & poultry rearing, promotion of backyard poultry rearing, facilitating
availability of poultry and duck chicks by establishing hatcheries, integration of
livestock rearing with other farm enterprises etc. are to be attempted for development
of the animal husbandry sector.
Fisheries contribute 2.35% towards SDP (2014-15), which is second after
agriculture in the state. At the national level West Bengal contributes about 16.5% of
fish production, 23.0 % of inland fish production (2nd after undivided Andhra
Pradesh), and 40% (highest) of fish seed production in the country. Fish production
has increased by more than six times during the last three and half decades (15.80
lakh MT in 2013-14), fish seed production increased by about 26.5% during the last
five years (15,890 million in 2013-14). The quantity of fish exported and other
products increased by about 68.22 % during the last five years (68,750 MT in 2013-
14) with significant increase in foreign exchange from Rs 720.36 crores to Rs 3058.66
crores. It is envisaged to usher in a growth of 16.78% of fish, and 25% of fish seed is
during the XIIth plan. Facilitating availability of quality fish seed by supporting
establishment of hatcheries; increasing availability of fish feed of through
encouraging development of fish feed mill; provision of accessories to fish farmers;
promoting fish rearing in beels & baors, homestead ponds and ponds developed under
other programmes; development of estuarine resources and development of marine
fishery would be attempted to increase fish production. Primary and secondary
processing of fish, encouraging ornamental fish rearing, provision of necessary
support in terms of refer van, storage etc. would be facilitated.

vii
Use of farm power to 2.5kw per hectare, promotion of custom hiring centres,
use of improved machineries for land levelling and other agricultural operations are
envisaged in the plan. Water being the major input that make or mar the efforts put in
for cultivation merits emphasis in planned development of agriculture. Bringing more
area under assured irrigation, facilitating better use of surface water through initiatives
as ‘jal dharo jal bharo’ for rainwater harvesting, ‘jaltirtha’ for enhancing storage
water by construction of check dams, facilitate use of micro-irrigation and promotion
of participatory irrigation management would be attempted to develop water resources
on a sustainable basis.
Storage has been a constraint and often causes farmers to sale in distress;
development of storage capacity would be attempted through construction of godowns
and cold storages. Forestry resources are important for the economic value it creates,
developing of forestry resources to facilitate conservation and proper use,
development of social forestry as land reclamation & watershed development
initiatives are envisaged in the plan.
Market access, facilitating forward and backward linkages, market reforms such
as amendment of Agricultural Produce Marketing Regulation Act, 1972, with
provision of Farmers’ market, Consumers’ market and direct marketing etc., has been
the initiated for setting up of farmers’ markets to enable them to market their produce
directly to the consumers. It is envisaged to provide better market access and market
linkage to farmers through initiatives such as ‘Krishak Bazars’, promoting &
supporting ‘Farmer Producers’ Organisations, ‘Sufal Bangla’, ‘Amar Fasal Amar
Gola’, developing electronic market platform etc. to ensure better price realization for
farmers, avoid distress sale, help better price discovery by farmers and help farmers’
have better share in the consumers rupee.
Cooperatives, especially the PACS, play a vital role in increasing production;
facilitate access of members to inputs, support post-harvest & storage activities and
helps in marketing. Diversification in their businesses is envisaged by enabling them
to diversify their business model and enter businesses in Food Value Chains,
Agriculture Clinics, Organic Farming, Implement Hubs, Contract Farming, etc.

viii
The overriding principle of a plan is to attempt allocation of available resources
towards attainment of the objectives taking into account the constraints and
necessities. This plan is an attempt towards developing an ecosystem to foster holistic
growth in agriculture and allied sector in West Bengal.
The sector wise allocation for State Agriculture Plan of West Bengal for the XIIth Five
year plan is presented below:
Consolidated sector wise financial outlay
during 2014-15 to 2016-17 of XIIth FYP
(Rs. in Crore)
Sl. No. Sector 2014-15 2015-16 2016-17
1 Agriculture 1169.00 1497.00 1645.00
2 Agri Market 140.00 250.00 275.00
3 Animal Resources Department 225.00 385.00 424.00
4 Cooperation 186.00 221.00 243.00
5 Fisheries 209.00 218.00 240.00
6 FPI & Horticulture 84.00 85.00 94.00
7 Forest 229.00 270.00 297.00
8 Food & Supplies 151.00 164.00 180.00
9 Sericulture 10.00 15.00 17.00
10 WRID 36.00 45.00 50.00
11 Irrigation & Waterways 39.00 38.00 42.00
12 WBCADC (P&RD) 12.00 7.00 12.00
TOTAL 2490.00 3195.00 3519.00
Considering the trend of growth in previous years during XIth Plan and the
investment and interventions proposed in the XIIth Plan period, the expected outcome
in the agriculture and allied sectors at the end of XIIth FYP over the achievements at
the end of XIth FYP is projected as under:
18% increase in case of total food production.
15% increase in case of rice production and productivity.
17% increase in wheat production.
35% increase in case of total pulse production.
30% increase in case of oilseed production.
6% increase in case of jute production.

ix
25% increase in potato production subject to improvement of cold storage and
export potential.
300 Agro-mechanical hubs will be established.
40% increase of production of horticultural crops.
25% increase in area under vegetable crops.
20% increase in area under Mulberry cultivation.
100 % reach of extension facilities to all Farming community.
Coverage of additional area of 522 ha.under coconut plantation programme.
Coverage of additional area of 55 ha.under Betelvine plantation.
Coverage of additional area of 100 ha. under Mango plantation.
Coverage of additional area of 242 ha.under Banana plantation.
Coverage of additional area of 810 ha. for cut flower cultivation.
Coverage of additional area of 1300 ha. under flower cultivation.
Coverage of additional area of 1250 ha under Seed village program.
21% increase in milk production.
20% increase in egg production.
15% increase in meat production.
16.78%, increase in fish production.
25% increase in fish seed production.
1.5 lakh MT/year additional production of fish from culture in ponds/tanks and
beels/boars.
0.82 lakh MT/year of fish production per from reservoir.

1
CHAPTER – I
INTRODUCTION

2
Endowed with natural resources and diverse agro-climatic conditions, West Bengal
offers unique opportunities for cultivation of different crops, rearing of livestock and
development of fisheries. Development of agriculture in the state has not been uniform in
spite of its enviable endowments. There is good potential for increasing agricultural
production in the state which may impact food security even at the national level.
The pressure on and demand for natural resources are increasing on account of
increasing population and developmental activities. Small and scattered land holdings; poor
utilisation of water resources; infrastructure constraints, particularly energy, coupled with
injudicious use of fertiliser in irrigated eco-systems; low productivity and inadequate
availability of quality seed and planting material are some of the major constraints for crop
production in the state.
In view of the potential of the region, Government of India under its ‘look east policy’
emphasized ushering the second green revolution from eastern region. Future agriculture,
however, will be guided by not only the compulsions of food and nutritional security but also
by the concerns of environmental protection, sustainable soil health as well as profitability of
farm enterprise. Since majority of the farmers in the region are resource-poor and have small
land holdings, increasing farm family income would be difficult unless crop based agriculture
is supplemented by some other farm enterprises viz. livestock rearing, horticulture, fishery,
etc. Integrated farming system approach would be a prudent option to accelerate the
agricultural growth of the state.
1.1 Rashtriya Krishi Vikash Yojana (RKVY)
To facilitate growth in agriculture and allied sectors; Department of Agriculture and
Cooperation, Ministry of Agriculture, Government of India launched ‘Rashtriya Krishi
Vikash Yojana’ (RKVY) for enhanced investments agriculture and allied sectors that could
achieve an annual growth rate of 3.64% during XIth plan against a growth rate of 2.46 % p.a.
in the Xth Plan Period. To bring about quantifiable changes in the production and productivity
of various components of agriculture and allied sectors by addressing in holistic manner, the
programme components have been changed during XIIth Plan in order to bring a balance
between the constituent activities not kept in the earlier plan. The programme components in
the guidelines are:
(a) RKVY (Production Growth) with 35% of annual outlay, (b) RKVY (Infrastructure and Assets) with 35%of annual outlay;
3
(c) RKVY (Special Schemes) with 20% of annual outlay; (d) RKVY (Flexi Fund) with 10% of annual outlay
States can undertake either ‘Production Growth’ or ‘Infrastructure & Assets’ projects
with this allocation depending upon state specific needs/priorities. RKVY funds would be
provided to the States as100% grant by the Central Government. As per this scheme, The
Govt. of West Bengal has to prepare State and District level plans in the agriculture and allied
sectors, based on guidelines issued by Finance Commission for availing financial assistance
from Government.
However, Government of India has changed the pattern of assistance under RKVY at
the rate of 50/50 sharing between the Central and State Governments.
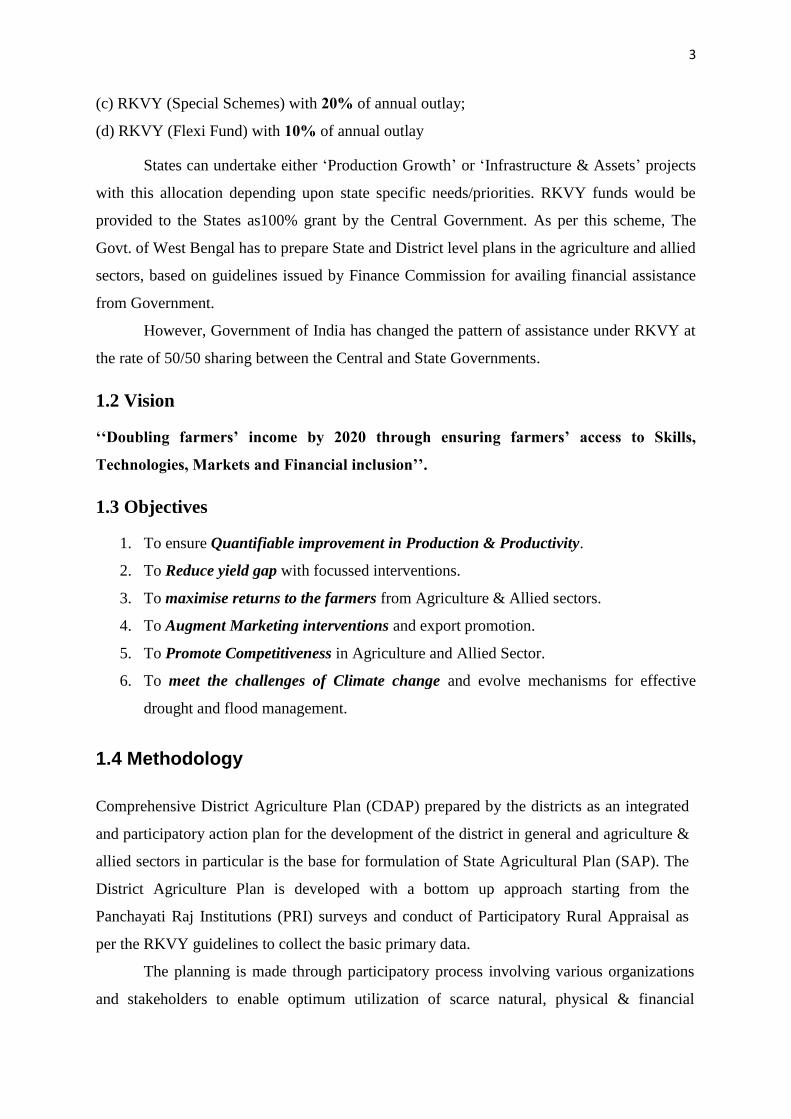
1.2 Vision
‘‘Doubling farmers’ income by 2020 through ensuring farmers’ access to Skills,
Technologies, Markets and Financial inclusion’’.
1.3 Objectives
1. To ensure Quantifiable improvement in Production & Productivity.
2. To Reduce yield gap with focussed interventions.
3. To maximise returns to the farmers from Agriculture & Allied sectors.
4. To Augment Marketing interventions and export promotion.
5. To Promote Competitiveness in Agriculture and Allied Sector.
6. To meet the challenges of Climate change and evolve mechanisms for effective
drought and flood management.
1.4 Methodology
Comprehensive District Agriculture Plan (CDAP) prepared by the districts as an integrated
and participatory action plan for the development of the district in general and agriculture &
allied sectors in particular is the base for formulation of State Agricultural Plan (SAP). The
District Agriculture Plan is developed with a bottom up approach starting from the
Panchayati Raj Institutions (PRI) surveys and conduct of Participatory Rural Appraisal as
per the RKVY guidelines to collect the basic primary data.
The planning is made through participatory process involving various organizations
and stakeholders to enable optimum utilization of scarce natural, physical & financial

4
resources and to assess and plan for the infrastructure required to support the development of
agriculture and allied sectors. The planning process takes into consideration the agro-climatic
conditions, availability of technology, trained manpower and natural resources to evolve an
action plan for achieving sustainable agricultural growth with food security and enhancement
of cropping system that will improve farmers’ income. The priorities and local needs/ crops/
feed and fodder /animal husbandry/ dairying/ fisheries are reflected in the plan. The plan
proposes to establish linkages with the required institutional support services and agencies,
like credit, technology transfer, ICT, research organizations etc. and also suggest measures to
reduce the productivity gaps of important crops, live stocks and fisheries.
The District Agriculture Planning Unit formed by the Govt. at the district level has
conducted the planning process involving members of ATMA, Technological Support
Institution (TSI), RKVY and DDM, NABARD who have provided valuable inputs in
formulating the CDAP. The entire process was participatory and on two way communication
basis to ensure the preparation of the five year plan as a realistic, holistic plan and with due
cognizance of the local need.
State Agriculture Plan (SAP) along with the Comprehensive District Agriculture Plan
(CDAP) is the corner stone of the planning and implementation of scheme. The SAP
envisages the targets and priorities of the State taking into account the growth in agriculture
and allied sector. A statistical profile of the State has been made to understand the
development potential vis-à-vis the available resources of the State. Besides inputs from
CDAP, the gaps in information were moderated by collecting information and consultation
with the stakeholders and line departments and from secondary data available from various
authentic publications and official websites for formulation of the SAP. The final plan has
been arrived at based on the discussions with the stakeholder departments and after
incorporating suggestions offered. The Plan presents the vision for agriculture and allied
sectors within the overall development perspective of the State.
1.5. Challenges
Improving productivity of agriculture, livestock and fisheries
Demand for agriculture, livestock and fishery produce is increasing steadily with the growth
of population. Considering that the possibilities of expansion of cultivated area is almost
exhausted in the state, future increase in food production to meet the continuing high demand
must come from increase in productivity. Ample scope exists for increasing yield potential of

5
a large number of food crops, vegetables, fruits, as well as livestock and fishery products.
Introduction of new variety of crops with improved package of practices and soil
amelioration need to be intensified to address location specific problems as factor
productivity growth is decelerating in major production regimes.
Reducing the ‘yield gap’ of crops by facilitating adoption of appropriate technology and
modern practices of farming is another area that has the potential to increase productivity of
crops on a sustainable basis.
Management of natural resources
Dwindling natural resources and deterioration of its quality is major concern. Increasing
production from lessening land and water resources would be the challenge in the future.
Agriculture is the biggest user of water, accounting for 80 per cent water withdrawals. There
are pressures for diverting water from agriculture to other sources. It is projected that
availability of water for agriculture use in India may be reduced by 21 percent by 2020,
resulting in drop in yields of irrigated crops, especially rice. Rain fed agriculture has huge
potential if natural resources especially soil and water are scientifically and efficiently
managed. Potential of conservation agriculture, precision agriculture and micro irrigation
needs to be perfected for agro-eco regions. Policy reforms are a necessity to avoid the
unfavourable developments in years to come.
Addressing climate risks in agriculture
Climate change has become an important area of concern in the attempts to ensure food and
nutritional security for the growing population. The impacts of climate change are global, but
countries like India are more vulnerable in view of the high population depending on
agriculture. In India, significant negative impact have been implied predicting reduction of
yield by 4.5- 9% depending on the magnitude and distribution of warming. Effort must be
made to offset the effects of climatic variability on Indian agriculture covering crops,
livestock and fisheries through development and application of improved production and risk
management technologies. A shift to climate resilient agriculture, ensuring proper use of
water and other resources would be the most important initiative in this direction.

6
Diversification, Post-harvest management and value-addition
Demand for high value commodities is increasing rapidly with the rising per capita income,
growing urbanization and unfolding globalization. Diversification towards high value and
labour intensive commodities can provide adequate income and employment to the farmers
who are dependent on small size farms. On account of perishable nature of agricultural
commodities, focus should be on entire value chain from production and post-harvest to value
addition, processing and marketing. Low cost improved technologies are required to unleash
potential, improved market efficiency and to remain competitive simultaneously.
Increasing investment in agriculture and infrastructure
The public investment in agriculture has been declining and is one of the main reasons behind
the declining productivity and low capital formation in the agriculture sector. With the burden
on productivity-driven growth in the future, this worrisome trend must be reversed. Private
investment in agriculture has also been slow and must be stimulated through appropriate
policies.
Improving Livelihood opportunities for resource poor farmers
Contribution of small holders in securing food for growing population have increased
considerably, even though they themselves are the most insecure and vulnerable group in the
society. Off-farm and non-farm employment opportunities can play an important role.
Greater emphasis needs to be placed on non-farm employment and appropriate budgetary
allocation and credit through the institutional banking system should be in place to promote
appropriate rural enterprises. Specific human resource and skill development programmes to
train them will make them better decision makers and would also enhance productivity.

7
CHAPTER – II
State Profile

8
2.1 Geographical Location
West Bengal covers 8.87 M ha. (88752 km2) and is situated between 21o38′ to 27o10′ N
latitude and 85o50′ to 89o50′ E longitude. The geography of the State is unique; its northern
part is in the Himalayan range, whereas the extreme southern part touches the Bay of Bengal
and is covered by the active delta of the Sunderbans mangrove forest. The greater part
consists of detrital and alluvial plains. It is bounded by Sikkim and Bhutan in the north,
Odisha in south, Jharkhand and Bihar in the west and Assam in the north-east. The
geographical map of the State is given in Figure 2.1. The State comprises of 20 districts
including Kolkata. There are 341 R D Blocks, 3354 Gram Panchayats and 37,945 villages in
the State.
2.2 Socio-economic Profile
The State accounts for 2.7% of the total geographical area of the country while its population
of 913.47 lakh which accounts for nearly 8 percent of the entire population of the country
thus making West Bengal the most densely populated State as per 2011 census (1029 persons
per sq.km as against the national average of 325 persons per sq.km.). About 72% of the
population live in rural areas. The scheduled caste population in the State is 23.01 per cent
(all India: 16.20 per cent) and the scheduled tribe population is 5.50 per cent (All India 8.20
per cent).
Average literacy rate in the State is
68.64 percent (female literacy: 59.60
per cent) which is higher than the
national average of 65.38 per cent
(female literacy: 53.70 per cent). Of the
total rural workers, 19.53% and 19.30%
are cultivators and agricultural labourers, respectively, while 4.72 per cent are engaged in
household industries. The total cultivated area in the state is 55 lakh ha and the number of
farm holdings is 71.23 lakh with an average farm holding size of 0.77 ha. The small and
marginal farmers constitute 95.55% of the total number of cultivators. According to the
Planning Commission, 31.85 per cent of the total population lived below poverty line in
1999-2000. The demographic features of the state are briefly described in Table 2.1.
• Farm holding 71.23 Lakhs
• Cultivable area 55 Lakh Ha
• 96% Small and Marginal farmers
• Avg. Landholding 0.77 Ha

9
Fig.2.1: Geographical Map of West Bengal

10
Table 2.1: Demographic features of West Bengal
Total population (in ‘000) 91347
Population density (No. per sq. km) (2011 census) 1029
Male population (in ‘000) 46927
Female population (in ‘000) 4420
SC Population (in ‘000) 18453
ST Population (in ‘000) 4406
Rural population (in ‘000) 62213
Urban population (in ‘000) 29134
Cultivators (in ‘000) 4556
Small/ marginal farmers (in ‘000) 4342
Marginal holdings (<= 1ha) 81.17%
Small holdings (1 to <2 ha) 14.38%
Semi-Medium holdings (2- <4ha) 4.04%
Medium holdings (4- <10ha) 0.40%
Large (10 ha and above) 0.01%
Agricultural Labourers (in ‘000) 4523
Workers engaged in household industries (in ‘000) 1436
Workers engaged in allied agro-activities (in ‘000) 335
Other Workers (in ‘000) 12173
Literacy percent 68.50%
Source: www.riceportal.html
Agriculture accounts for the largest share of the labour force in West Bengal as well
as in India. It contributed around 14.4% to the state's Gross State Domestic Product (GSDP)
in 2010–11 at the factor cost at 2004-05 prices. It is observed that during the period of 2012-
13, 2013-14 and 2014-15 the growth of per capita income of West Bengal is much higher
compared to all India figure (Fig. 2.2). Although the annual growth rate of per capita income
in West Bengal is high compared to all India figure, West Bengal is lagging behind many
states in India in terms absolute income (Appendix 1).

11
(Source: WB Economic Review 2014-15)
A= Advance, P= provisional, Q= Quick
Fig.2.2: Percent growth of per capita income at constant prices (2011-12 base)
2.3 Physiography
West Bengal is divided into three physiographic units namely, Eastern Himalayas (in the
north), Eastern plateau or Chhotanagpur plateau (in the west and south-west) and the
Alluvial and Deltaic plains or Bengal basin (in the east and south). The Eastern Himalayas
include mountainous terrain of Darjeeling and northern fringe of Jalpaiguri, comprising
foothills of Bhutan Himalayas. The inner terrain of Darjeeling Himalayas, extends to Sikkim
and Nepal. The Eastern plateau comprising peninsular mass is known as Chhotanagpur
plateau. Eastward section extends across the north-western parts of Burdwan, Medinipur,
Bankura, Birbhum and whole of Purulia. The subdued spurs of laterite formation are
frequently observed in western part of Bankura, part of Medinipur and Purulia. The extensive
stretch of Alluvial and Deltaic plains in the east and south of the state are called as Bengal
Basin, comprising eastward extension of Indo-Gangetic alluvial plain.
2.4 Geology
The geological formations in West Bengal are diverse in origin. It comprises the archean,
metamorphic to the quaternary unconsolidated sediments. About 75 per cent of the land area
is covered by alluvial and deltaic deposits of sub recent and recent time and remaining part
abounds in a wide variety of rock formations like crystalline, sedimentary and basic flows.
0
5
10
15
2012-13 (P) 2013-14 (Q) 2014-15 (A)
9.47
12.3812.84
3.2
5.5 6.1
Pe
rce
mt
gro
wth
of
pe
rca
pit
a in
com
e
Percent growth of per capita income at
constant prices (2011-12 base)
West Bengal
All India

12
The metamorphic include various types of schist and gneisses of Precambrian age, associated
with acid and basic intrusive. The sedimentary include essentially the Gondowana formations
(Barakar formation, etc.) in Eastern Plateau (outliers) that belong to Permo-carboniferous to
Triassic age whereas the Siwalik formations (sedimentary, metamorphic etc.) belong to the
Tertiaries in Eastern Himalayas. The basic flows belong to the Upper Mesozoic age and form
a conspicuous horizon setting between the two broad sedimentary groups. On the basis of
geologic set up the state of West Bengal can be broadly divided into the following divisions;
I) Extra-peninsular region of the North, II) Peninsular mass of the South West and III)
Alluvial and Deltaic plains of South and East respectively.
2.5. Soil
In the Himalayan region of the State, the soils are predominantly shallow to moderately
shallow but also deep at places, well drained, coarse-loamy to gravelly loamy in texture.
These soils occur on steep side slopes. They are classified as Typic Haplumbrepts and Typic
Udorthents. In the foothills of Himalayas and in piedmont plains the soils are deep to very
deep, imperfectly drained and coarse-loamy to fine loamy in texture and are placed in Aquic
Ustifluvents and Fluventic Eutrochrepts. Soils of the alluvial plain which includes Indo-
Gangetic alluvium (recent, active and old) are also very deep, imperfectly to poorly drained,
fine-loamy and also coarse-loamy in texture and with moderate flooding problem in some
cases. These soils are classified as Aeric Haplaquepts, Typic Fluvaquents, Typic Haplaquepts
and Typic Ustochrepts. Undulating plain area is represented by very deep, fine-loamy and
coarse-loamy soils with moderate erosion and classified as Aeric Ochraqualfs, Typic
Ustifluvents and Typic Haplustalfs.
The western part of the state i.e., predominantly Chhotanagpur plateau area have soils
shallow to very shallow, well-drained and gravelly loam and coarse-loamy in texture with
moderate erosion whereas soils in the remaining part are deep to very deep, well drained, fine
loamy in texture. They are classified as Lithic Haplustalfs and Typic Haplustalfs. Coastal
plain is represented by soils of both sandy as well as fine in texture, very deep with salinity
problems in some places. Soils are placed in Aquic Ustipsamments and Vertic Haplaquepts.
Whereas soils of delta plain are very deep, imperfectly to poorly drained, fine in texture and
has the problem of inundation and salinity and classified as Aeric Haplaquepts and Typic
Haplaquepts.

13
2.6 Climate
The varied topography of the State and its location in respect of land and water induces a
variety of climatic conditions. The south facing slopes of the Himalayas receive very heavy
rainfall in some places exceeding 5000 mm whereas in some area of the relatively drier
western districts of the State the average annual rainfall is less than 1300 mm. The western
districts of the State suffer from frequent heat wave in the summer month when the maximum
temperature goes up to 450 C or even beyond whereas the northern hilly region comes under
the grip of intense cold during winter along with occasional snowfall when the minimum
temperature drops below freezing point. The temperature in the mainland normally varies
between 24oC to 40oC during summer and 7oC to 6oC during the winter. The distribution of
precipitation (Appendix 2) and temperature (Appendix 3), humidity, cloudiness, wind
direction and speed also register marked regional and seasonal variation around the year. All
the above variations of weather and climatic conditions are well reflected in the natural
vegetation of the land which includes numerous varieties beginning with mangrove swamps
along with littoral belt to purely temperate flora over the Himalayas.
2.7 Land Use
In the densely populated West Bengal, there is heavy pressure on the meagre land resources.
About 75% of the population has per capita holding of around 0.16 ha. About 60% of the
total area of the state is under cultivation and 24% of the cultivated land comprising 1.28 M
ha is under irrigation. Forest lands account for 12% and lands not available for cultivation
account for 18% of the total geographical area of the state. Paddy is the main crop and rice-
rice-vegetable, jute-rice-vegetable and rice-wheat are very prominent cropping systems.
Dooars and Darjeeling are famous for tea and oranges. However, drought-prone areas like
Purulia, Bankura, part of Birbhum and West Medinipur grow a single crop of paddy.
Cultivable waste land of 32.9 thousand ha in the State mainly in the districts of
Burdwan, Birbhum, Bankura, Purulia and Paschim Medinipur merits attention and requires to
be brought under cultivation. South 24-Parganas, Nadia and Murshidabad has drainage
problems and therefore demanding distinctly different approaches for their reclamation.
Improvement and scientific management of 6.1 thousand ha of pasture and grazing land also
deserve attention for the development of animal resources of West Bengal. High population
pressure coupled with increasing demand for land due to rapid urbanization and
industrialization are the emerging issues to be addressed on priority. The way ahead is to

14
increase net cropped area and cropping intensity (CI) from the current level of 184% by
adopting an integrated approach involving better management of existing irrigation
infrastructure; optimum exploitation of surface and ground water resources and rain water
harvesting. District-wise Land Use Classification in West Bengal (ha.) is presented in
Appendix 4.
2.8 Forest cover
The recorded forest area of the state (Fig. 2.3) based on satellite data is 11,879 sq.km, this is
13.38 % of the geographical area. Reserved Forest accounts for 7054 sq. km (59.4%), while
Protected Forest and Unclassed State Forest account for 3772 sq. km (31.8%) and 1053 sq.
km. (8.8%) respectively. The type of natural vegetation in the state is temperate forest in the
Eastern Himalayas, tropical forest in Dooars, dry/moist deciduous forest in the plateau
outliers, and mangrove forest in the Sunderbans (Southern delta). The forest cover including
the forests created outside the recorded forest area is 21.35% of the geographical area as per
the latest report of Forest Survey of India (ISFR, 2013, GOI). The district wise area under
forest in West Bengal is presented in Appendix 5.
Fig.2.3: Forest Cover of West Bengal
Source: Annual Report, 2013-14, Directorate of Forests, Govt. of West Bengal
Major tree species found in the forest are: Sal, Nageswar, Jam, Latore, Malagiri, Lali,
Canes, Champ, Panisaj, Gokul, Angare, Sissoo, Chikrassi, Gamar Sundari, Baen, Dhundul,
Gnewa, Garan, Passur, Peasal, Kend, Mahul, Kusum, Asan, Bahera, Dhaw, Rahara Chilouni,
Utis Magnolia, Oaks, Kawla, Pipli, Katus, Lampate, Toon, Rhododendrons, Salix, Yew,
Berberis, Junipers and Birch. The mangrove forests in the Sundarban comprise mainly
sundari (Heritiera macrophylla).The name Sunderban was coined due to this plant species.
Reserved Forest
Protected forest
Unclassed Forest

15
2.9 Degraded Land
Over 120 million ha have been declared degraded or problem soils (NAAS 2010) in the
country. As per the National Rainfed Area Authority (NRAA), Ministry of Agriculture, Govt.
of India, about 2 million ha of degraded land exist in West Bengal. The major degradation
factors are soil erosion (sheet, rill and gully), stream bank erosion, land slips & landslides,
water logging, mining, coastal salinity, acidity, sand laden due to flash floods, water scarcity
etc. The status of degraded land in West Bengal is given in Table 2.2.
Table 2.2: Status of degraded land in West Bengal
Sl.
No Types of Degraded Land Area
('000 ha)
1 Saline and saline-alkali 820.45
2 Water logged 576.00
3 Sheet -rill-gullied area 666.00
4 Sea coastal 12.00
5 Stream Bank erosion and
sand laden area
67.35
6 Land slip & Land slide 35.00
7 Mining 14.50
Total 2191.30
% degraded land to total
geographical area 24.69%
% of degraded land to non-forest
area 28.51%
Source: NAAS 2010
About 14% of the area is affected by water erosion, of which Purulia is affected to the
extent of 328 thousand ha, followed by Paschim Medinipur (218 thousand ha), Bankura (199
thousand ha), Coochbehar (174 thousand ha) and Jalpaiguri (132 thousand ha). The second
major cause of land degradation is soil acidity. Acidic soils cover 418 thousand ha (0.5% of
TGA); of which 165 thousand ha is also associated with water erosion. Jalpaiguri district has
highest coverage of acid soils (118 thousand ha), followed by Darjeeling (96 thousand ha),
North Dinajpur (87 thousand ha) and Purulia (40 thousand ha). Saline soils cover 408
thousand ha, mostly in South 24-Parganas. Waterlogging is observed in Burdwan, Nadia,
North Dinajpur, Malda and Coochbehar and mining wastelands are confined to Bankura and
Purulia.
0.00100.00200.00300.00400.00500.00600.00700.00800.00900.00
Salin
e a
nd
sal
ine
-alk
ali
Wat
er lo
gged
Sh
eet
-rill
-gu
llie
d a
rea
Sea
coas
tal
Stre
am B
ank
ero
sio
n…
Lan
d s
lip &
Lan
d s
lide
Min
ing
Series1

16
At present, 24.69% of total geographical area (TGA) and 28.51% of non-forest area
of West Bengal falls under degraded land category which is a serious threat to food
production. The district-wise break-up details of the degraded lands is shown in Appendix 6.
2.10 Agro-climatic Region
Physiological setting of the State comes broadly under three Agro Climatic Regions viz.
Eastern Himalayan Region (Zone I), Lower Gangetic Plain Region (Zone II) and Eastern
Plateau & Hilly Region (Zone III).
Three broad regions are further stratified into six agro-climatic sub regions as follows:
Zone I: Eastern Himalayan Region is sub-divided into: a) Hills sub region and b) Terai sub-
region
Zone II: Lower Gangetic Region is sub-divided into: a) Old alluvium, b) New alluvium and
c) Coastal and saline
Zone III: Eastern Plateau & Hill Region—this region has no sub-division.
The characteristics of the Agro-climatic regions are briefly described below.
Zone I: Eastern Himalayan Region
a) Hills sub region: Covering Darjeeling district located between 260 27′ 10″ and 270
13′ 05″ N latitudes and 870 59′ 30″ and 880 53′ 00″ E longitudes; 3149 km2 area).
Mainly brown forest soil, acidic in nature (pH 3.5-5.5), annual rainfall varies from
2500-3500mm., high humidity, less sunshine hours, poor soil depth and quality limits
crop productivity. Pre-monsoon showers commences from March. Rice, maize, potato
and soybean are the major crops grown in the region.
b) Terai sub region: Covering Jalpaiguri (260 16′ to 270 0′ and 880 4′ to 890 53′ E; 6245
sq. kms) and Coochbehar district (250 57′ 47″ to 260 36′ 02″ N latitude and 890 54′
35″ E to 880 47′ 44″ E longitudes; 3387 sq. km.). Soils are mostly sandy to sandy
loams, porous, low in base content, poor in available nutrients (particularly)
phosphorous, potassium and sulphur) ; acidic (pH 4.2 to 6.2); rainfall varies from
2000-3200mm; high water table, low water holding capacity, high humidity, less
sunshine hours during the monsoon months and marginality of lands in some parts
limit crop productivity. Chronologically deficient in micronutrients, like Boron and
Zinc, in particular. Rice, jute, tobacco and tomato are the major crops grown in the
region.

17
Zone II: Lower Gangetic Region
a) Old alluvium: Comprising North Dinajpur (250 11′ N to 260 49′ N latitude and 870
49′ E to 900 00′ E longitude; 3142 sq.km) and South Dinajpur (250 10′ 55″ N to 250
13′ N latitude and 880 47′ E to 890 00′30″ E longitudes: 2219 sq. km) and Malda (240
40′ 20″ and 250 32′08″ N latitude, 870 45′50″ and 880 28′10″ E longitude; 3733 sq.
km) districts. Soils are lighter in higher situations and heavier in lower situations,
mildly acidic to neutral in reaction (pH 5.2 to 7.0); fairly fertile over most of the sub
region; rainfall 1500-2000mm in upper and 1300-1500m in lower parts, considerable
area in flood prone. Rice, sugarcane, jute and wheat are the major crops grown in the
region.
b) New alluvium: Covering Murshidabad, Nadia, Hooghly, Burdwan and North 24
Parganas. Soils are deep, acidic (pH 4.5 to 6.5) to slightly alkaline (pH 7.5 to 8.5) in
reaction and fertile; rainfall 1350-1450 mm; most productive area of the state. Rice,
sugarcane, jute and wheat are the major crops grown in the region.
c) Coastal and saline: Covering South 24 Parganas, Howrah and Purba Medinipur.
Soils are mostly heavy clay containing higher percentage of salts of sodium,
magnesium, potassium with organic matter at different stages of decomposition.
Mostly acidic (pH 4.5 to 6.5) to slightly alkaline (pH 7.5 to 8.5) soils. Electrical
conductivity varies from 3.0 to 18.0 mmbos/cm, rainfall 1600-1800mm; salinity and
water congestion limit good crop productivity. Rice, blackgram, mustard and chillies
are the major crops grown in the region.
Zone III: Eastern Plateau & Hill Region
The region comprises Purulia (220 42′ 35″ to 230 42′ 00″ N and 850 49′ 25″ to 860 54′
37″ E, 6259 sq. km) district. Soils are shallow modulated gravely, coarse textured, well
drained with low water holding capacity. Upland soils are highly susceptible to erosion;
acidic in reaction (pH 4.5 to 6.5). Rainfall varies from 1100 to 1400mm. which is spread over
only three months, mid-June to mid-September.

18
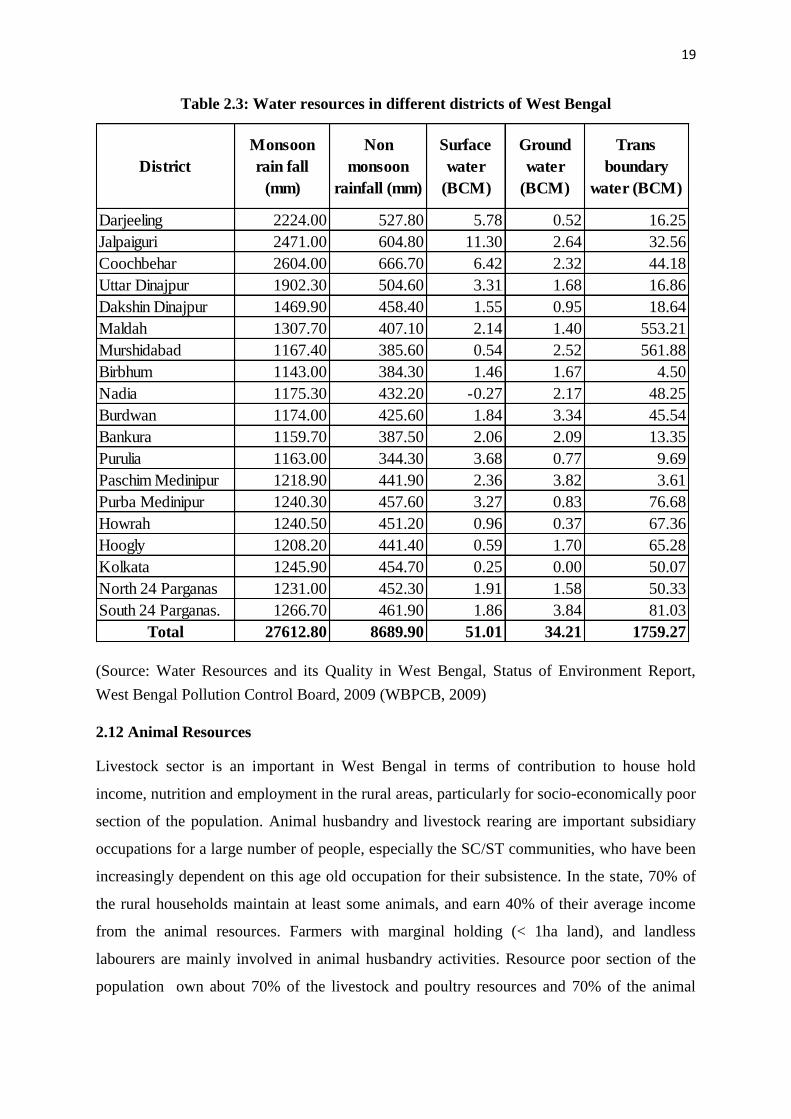
2.11 Water Resources
West Bengal is relatively rich in water resources and has well developed irrigation system
utilizing good quality ground water as well as canal network. The state with 2.7 percent of
national territory and 8% of the Indian population is endowed with 7.5 percent of water
resources. Main source of water is rainfall, the annual average being 1762 mm of which 76%
is received in monsoons months and rest being in non -monsoon periods. About 63 percent of
water resource of entire state is carried by eight basins of North-Bengal while Rarh and
eastern plains are endowed each with 22% and 15% respectively. Use of surface water is
rather low as the state has created very little storage and the potential to create major storage
is limited. The net annual water resource generated from rainfall in West Bengal amounts to
51.02 billion cubic meter (bcm) The state is also relatively richer compared to the major
Indian states in terms of ground water, with the assessed annual renewable ground water
resource being 27.4 bcm. From the total annual replenishment of ground water, the state
currently uses about 42 percent, so there is a large untapped potential. The availability of
water in the state is spatially and temporarily uneven.
The demand for water in West Bengal is projected to 10.98 million hectare meter (ham) in
2025 from 7.71 million hectare meters in 2000 leading to a deficit of 59%. The state with
42% of the geographical area being flood prone happens to be one of the prime flood prone
states in the country. Extreme rainfall, especially relating to late monsoon cloud bursts lead to
floods. Flood is also due to excess water carried over from transnational and inter-state
borders. Every summer many parts of Purulia, Bankura, Paschim Medinipur and Birbhum
also face severe water shortage with respect to the entire state. The water resources in
different districts of West Bengal is given in Table 2.3
-500
0
500
1000
1500
2000
2500
3000
Water Resources in districts
Monsoon rainfall (mm) Non monsoon rainfall (mm) Surface water (BCM)
Ground water (BCM) Trans boundary water (BCM)
19
Table 2.3: Water resources in different districts of West Bengal
(Source: Water Resources and its Quality in West Bengal, Status of Environment Report,
West Bengal Pollution Control Board, 2009 (WBPCB, 2009)
2.12 Animal Resources
Livestock sector is an important in West Bengal in terms of contribution to house hold
income, nutrition and employment in the rural areas, particularly for socio-economically poor
section of the population. Animal husbandry and livestock rearing are important subsidiary
occupations for a large number of people, especially the SC/ST communities, who have been
increasingly dependent on this age old occupation for their subsistence. In the state, 70% of
the rural households maintain at least some animals, and earn 40% of their average income
from the animal resources. Farmers with marginal holding (< 1ha land), and landless
labourers are mainly involved in animal husbandry activities. Resource poor section of the
population own about 70% of the livestock and poultry resources and 70% of the animal
Darjeeling 2224.00 527.80 5.78 0.52 16.25
Jalpaiguri 2471.00 604.80 11.30 2.64 32.56
Coochbehar 2604.00 666.70 6.42 2.32 44.18
Uttar Dinajpur 1902.30 504.60 3.31 1.68 16.86
Dakshin Dinajpur 1469.90 458.40 1.55 0.95 18.64
Maldah 1307.70 407.10 2.14 1.40 553.21
Murshidabad 1167.40 385.60 0.54 2.52 561.88
Birbhum 1143.00 384.30 1.46 1.67 4.50
Nadia 1175.30 432.20 -0.27 2.17 48.25
Burdwan 1174.00 425.60 1.84 3.34 45.54
Bankura 1159.70 387.50 2.06 2.09 13.35
Purulia 1163.00 344.30 3.68 0.77 9.69
Paschim Medinipur 1218.90 441.90 2.36 3.82 3.61
Purba Medinipur 1240.30 457.60 3.27 0.83 76.68
Howrah 1240.50 451.20 0.96 0.37 67.36
Hoogly 1208.20 441.40 0.59 1.70 65.28
Kolkata 1245.90 454.70 0.25 0.00 50.07
North 24 Parganas 1231.00 452.30 1.91 1.58 50.33
South 24 Parganas. 1266.70 461.90 1.86 3.84 81.03
Total 27612.80 8689.90 51.01 34.21 1759.27
District
Non
monsoon
rainfall (mm)
Trans
boundary
water (BCM)
Surface
water
(BCM)
Ground
water
(BCM)
Monsoon
rain fall
(mm)

20
produce in the state are contributed by 67% of the small and marginal farmers. About 71% of
the total labour in livestock faming are women.
The total livestock population in the state as per the census was 840.53 lakh in 2003,
1016.62 lakh in 2007 and 831.78 lakh in 2012 (Table 2.4). The percentage of mammalian
livestock as per 2012 census report, are 54.43% cattle, 1.97% buffalo, 3.54% sheep, 37.92%
goat and 2014% pig while the avian livestock is 88.50 % fowl and 11.72 % duck as per 2012
census report. The mammalian population has a declining trend but in the case of avian
livestock, there is regular trend of significant increase of fowl population against the gradual
decline of duck population. The cattle population is mostly non-descript local/native cattle
except about 12% cross bred /upgraded indigenous cattle like, Shaiwal, Gir, Tharparkar, Red
Sindhi etc. as per 2012 census. Among other mammalian livestock the main breeds in the
State are Bengal Goat (mostly Black Bengal), Garole Sheep, Ghoongroo Pig and Murrah
Buffalo. Among birds, RIR and White Leg Horn fowl and Khaki Campbell Ducks are
dominant breeds. In addition to these breeds, the state possesses large number of unnamed
cattle, fowl and duck population, which are classified as non- descript.
However, the state has also some important endangered indigenous cattle like ‘Siri
Cattle’ and ‘Yak’ in the hilly track of Darjeeling district, and ‘Bonpala’ breed of sheep in
Duars’ plain.
Table 2.4: Livestock population in West Bengal (in lakh)
*Provisional; Source: Animal Resources Development Department, Govt. of West Bengal & quoted
in West Bengal Economic Review, 2014-05
Cattle Buffalo Sheep Goat PigHorse and
PonyTotal Total Fowl Total Duck
Other
Poultry
Total
Poultry
2003 179.84 8.76 14.11 117.57 8.99 0.11 329.38 376.86 130.24 3.83 511.15 840.53
% (54.60) (2.66) (4.28) (35.70) (2.70) (0.03) (100) (73.70) (25.50) (0.75) (100)
18th 2007 191.88 7.64 15.77 150.69 8.15 0.06 374.19 519.43 120.47 2.53 642.43 1016.62
% (51.30) (2.04) (4.21) (40.30) (2.19) (0.02) (100) (80.90) (18.80) (0.39) (100)
19th 2012 165.14 5.97 10.76 115.06 6.48 - 303.41 467.62 61.93 - 528.37 831.78
% (54.43) (1.97) (3.54) (37.92) (2.14) (100) (88.50) (11.72) (100)
Year/
Census
Grand
Total
(lakh)
Mammalian livestock (lakh) Avian livestock (lakh)

21
2.13 Fisheries
West Bengal has a population of 913.47 lakh (as per 2011 census ) of which fisher men
population is 3.3% (29.9 lakh; 26.1 lakh in inland and 3.8 lakh in marine sector), belonging to
total 5,41,250 fisher folk families. There are total 6348 fishermen’ villages, including 1237
under 188 GP in marine sector. The state holds total 5.45 lakh ha inland fishery resources, of
which 63.3% (3.45 lakh ha) is presently utilized (Table 2.5). The inland fishery resources are
spread over 19 districts, including unique ‘Jhora fisheries’ in Darjeeling district. Out of the
total 2.88 lakh ha water area in the form of ponds/tanks, the semi-derelict and derelict water
areas are about 20% and 10%, respectively. The area of government water bodies of 2 ha and
above, is 28,226.80 ha in the state. The brackish water area of about 0.60 lakh ha is spread
over three coastal districts, of which the maximum (60.61%) area is in North 24 Parganas
followed by 30.43% in South 24 Parganas and Purba Medinipur districts, respectively.
In the marine sector, the coast line is 158 km, spread over in South 24 Parganas and
Purba Medinipur districts with inshore sea of 777 sq.km, offshore sea of 1813 sq.km, and
continental self of 17,049 sq.km. The potential of fishery resources in the Indian Exclusive
Economic Zone is 4.42 million tons.
Table 2.5: Fishery resources in West Bengal
Inland sector
Type of Fishery resources Total potential resources (lakh ha)
Under culture (in lakh ha)
% of resources area under culture
(a) Impounded water Systems
Ponds/Tanks 2.88 2.61 90.62
#Beel and Baor 0.42 0.21 50.00
Brackish water 0.60 0.59 98.33
Sewage fed 0.04 0.04 100
Total 3.94 3.45 87.56
(b) Open water Systems
Reservoir 0.28 0.13 47.00
River 1.64 - -
Canal 0.8 - -
Estuarine 1.5 - -
Total 4.22
Marine sector
Inshore area( up to 10 fathom depth) 777 sq.km
Offshore area( 10-40 fathom depth) 1813 sq.km
Continental shelf( up to 100 fathom depth) 17049 sq.km
Coast line 158 km
Source: Hand Book of Fisheries Statistics, 2012-13 & 2013-14
# beel-impounded medium/ large fresh water bodies

22
Chapter III
SWOT Analysis

23
This chapter is an attempt to analyse the strength, weakness, opportunities and threats to the
agriculture and allied sectors in the state in order to identify the key internal and external
factors that are important for developing pragmatic strategy for achieving the desired growth.
The analysis has been made after taking into consideration various social, economic and
environmental parameters.
3.1 Agriculture
Strength
Diverse agro-climatic conditions, soil type, land drainage condition, etc. provide
immense scope for cultivation of new and diversified crops throughout the year,
which may fetch better price both in domestic and international markets.
There are good ground water and surface water resources and good scope for
rainwater harvesting. Efficient use of all these water resources can lead to enormous
increase in irrigation area, cropping intensity and productivity of land.
There is good scope for introducing more remunerative integrated farming system
based on existing natural water bodies like lakes, streams or man-made rainwater
harvesting structures like ponds, etc.
Bio-diversity and existence of rich genetic pool can provide an excellent scope for
crop improvement.
Existence of fertile alluvial soils which are, in general, responsive to different inputs
and management practices.
Weakness
Small and fragmented land holdings (with about 95% of farming community) results
in poor adoption of improved agricultural technologies and poor farm mechanization.
Poor motivation and training for integrated pest management (IPM)/ use of bio-
pesticides, soil heath management and conservation agriculture, etc.
High incidence of pests and disease infestation due to high humidity.
Soil erosion, acidity, salinity, etc. are serious problems in some of the areas.
Inadequate infrastructure viz. road communication, inadequate storage and market
infrastructure, post-harvest storage/ cold storage facilities, agro-processing units.
Inadequate supply system like supply of seeds and fertilizers in time and in quality
and high input cost.

24
Poor private investment in agricultural sector; poor credit facility system for farmer;
lack of crop insurance facilities; fluctuating market price of produce, etc. - these are
the demotivating factors for adopting modern technology by the farmers.
Opportunities:
Scope of introduction of non-conventional crops owing to diverse agro-climatic
conditions.
Potential for ‘Organic agriculture’ in some of the areas can be exploited for export
oriented agriculture.
Huge scope for human resource development—people have a positive attitude
towards quality life and there is good response and participation in training and skill
demonstration.
Co-operative efforts in special fields like input supply, seed production, market
linkage, farm mechanization etc. - Farmers’ club approach is gaining popularity and
can enhance employment generation.
Good scope for promotion of Farmers’ Producers Organisations (FPO) to enable
farmers to take up commercial activities as also in taking up sorting-grading etc.
which would enable the farmers to fetch better price.
There are large opportunities in agro-based and agro-processing industries.
Harvesting of rain water throughout the state for use in agriculture, industry as well as
for domestic use can be exploited successfully.
Threats
Noticeable Climate change. The coastal areas, in particular, may be in danger in near
future due to sea level rise. Uncertain monsoon rains and temperature fluctuation are
affecting the yield.
Lack of motivation and interest among the youths for involvement in agricultural and
allied activities. Less educated older farmers inhibit the dissemination of improved
technologies.
The input cost is on increase while the market price for farm produces is in many
cases is non-remunerative. This is encouraging the farmers to migrate elsewhere for
work.
Diversion of fertile agriculture land to non-agricultural uses like urbanization, roads,
industrial use, etc.
High dependency on chemical fertilizers and low motivation to use organic manure.

25
Ground water table receding rapidly in some area due to Boro rice cultivation.
Arsenic is a major threat in some of those areas.
3.2 Horticulture
Strength
Conducive and suitable agro-climatic conditions, topography and soil types for
horticultural and plantation crops.
Sizeable cultivable land, progressive farming community, rich traditional knowledge and
hard working women folks.
Prospects in production of various types of vegetables including hybrids, flowers, spices
and plantation crops.
Support extended under National Horticulture Mission.
Existence of Agri-Export Zones in various districts, offers good scope for focused growth
of specific horticultural crops.
A growing tendency to diversify from traditional agricultural crops to horticultural crops.
New alluvium zone offers good scope for increasing production of potato and various
tropical and sub-tropical vegetables.
Excellent potential for production of high value cut flowers like dendrobium / cymbidium
orchids, liliums, gladiolus, anthurium in the Darjeeling hills; gerbera, rose in the plains
under green houses.
High potential for orchids, Kalimpong has been one of the major source and market
Orchids since British era.
Weakness
Lack of awareness on scientific farming of horticulture crops.
Declining soil health, poor recycling of organic matter, sizable area affected by salinity,
alkalinity. Water logged and rain fed cultivation practices.
Declining water table due to over exploitation of ground water.
Inadequate availability and lack of quality control on seed and planting material.
Dependence on other States to meet quality seed requirements for vegetables and more
specifically for potato.
Lack of interest, investment and rejuvenation of old orchards
Paucity of skilled manpower for training and handholding of farmers.

26
Infrastructural bottlenecks for horticultural extension, farmers’ training and capacity
building
Limited market information on Horticultural crops and products affecting price discovery
by farmers and consequently making them vulnerable to and dependent on middleman.
Inadequate knowledge of organic farming resulting in loss of opportunities for production
and export of organic produce.
Insufficient cold storage facilities for preservation of fruits, vegetables, flowers etc. and
limited refrigerated vans, grading and packaging, precooling and waxing facilities,
processing units and transportation
Opportunity
Area available for expansion of horticultural and plantation crops.
Opportunities to improve existing orchards/plantations through better management
practices.
Scope for nursery-raising of a number of horticultural crops.
Growing trend of organic fruit and vegetable production.
Establishment of post-harvest technology centres in fruits & vegetable processing in
different districts.
Wide opportunities for exports with special reference to mango, pineapple, vegetables,
potato in fresh and processed products; flowers
Development of Food Parks, Flower Auction Centres and creation of exclusive AEZs are
widening the scope for exports.
Greater demand for Organic Fruits in the market.
Threat
Receding ground water level, raising salinity and water table and degrading soil fertility
Rapid urbanization, fragmented holding, overuse of chemical fertilizers and pesticides
and environmental degradation.
Risks from natural calamities not covered by insurance
Domestic and international competition due to rising cost of production
Young generation not interested to take up agriculture and horticulture as a profession
due to vulnerabilities and uncertainities.

27
3.3 Agricultural Mechanization
Strength
Paddy and potato are the main crops for which a wide range of equipment for all the
operations is available in the country.
Most of the soils are alluvial with sandy loam to loam texture; land topography is of plain
levels which are suitable for the use of improved soil working equipment with available
power sources.
Although electricity availability in rural areas is low, a steady increase of inanimate
power sources, especially power tillers are positive indicators for higher levels of
mechanization.
Credit for Farm Mechanisation is being emphasised as a priority area in the state which
facilitates growth of mechanisation in agriculture.
Qualified human resources can be produced with the present network of Agricultural
universities and technical institutions.
Irrigation potential is high, water table is high. Good scope of shallow tube well.
The state has good infrastructure of banking system.
Strong industrial sector have the potential for manufacture, marketing and introduction of
better farm power sources and equipment.
Weakness
The existing labour oriented govt. policy owing to population pressure discourages
mechanization which is considered as the cause of labour displacement.
The economic conditions of farmers do not favour investment on high value equipment.
There is lack of credit facilities available to the farmers.
Paucity of manpower to plan and execute farm mechanization programme.
Poor extension infrastructure.
Poor mechanization in horticulture crop cultivation and hill agriculture is general.
Opportunity
Ample scope for introducing improved hand tools, implements and machineries, there is
growing demand from the farmers.
Increasingly more area is being covered by assured irrigation facility. This will enhance
the cropping intensity and resultant farm mechanization.
There is substantial gap between the demand and production of wheat, pulses and oil
seeds. Farm mechanization will be necessary to increase the production to achieve the
targets.
Custom servicing and hiring of costly machineries have good prospect for educated
youth.

28
Processing and value addition through post-harvest engineering and management would
create more jobs and income in marketing their surpluses with proper post-harvest
technology and on farm value addition.
The packages of equipment for horticultural cultivation have great opportunities.
Threat
Educated youth shuns agriculture accentuating socio economic issues.
In view of diminishing contribution of agriculture to GDP, agricultural development in
general and its mechanization in particular may be relegated to a position of low priority.
Stunted rural economy and political vulnerabilities.
Farm mechanization is not prioritised.
Operational holdings getting fragmented reducing the scope for mechanization.
Exodus of rural skilled workers and entrepreneurs to urban areas.
3.4 Animal Resources Development
Strength
Rich and diverse animal resources in the State. Good population of Black Bengal
breed of goat.
Dairy and poultry farmers under both co-operatives and private sectors
Eight wings in the Animal Resource Development Department are involved for the
overall development of the sector
Congenial environmental conditions for poultry farming (both for layers and
broilers), duckery, piggery, etc.
Paschim Banga Go Sampad Bikash Sanstha involves ‘Pranibandhus’ for promotion
of door step insemination besides, insurance of livestock.
Weakness
Lack of entrepreneurship ability among farmers and youth and taking animal
husbandry as subsidiary occupation and not as an enterprise or business.
Low level of awareness and access to modern technology.
Low productivity of livestock and low-input livestock management system mostly
taken up by small holders of livestock. .
Inadequate bank finance for backyard poultry and quail farming.
Poor maintenance of parent stocks and inadequate supply of improved variety of
livestock.
Absence of proper animal insurance settlement/ claim system.

29
Poor marketing mechanism, predominance of intermediaries in procurement of milk,
milk products, poultry products, etc.
Limited fodder and grazing land with very less fodder production.
Absence of sufficient cold chain facility.
Opportunities
Increasing demand for milk, dairy and poultry products offer great scope for animal
resource development.
Large scope for involving SHGs in poultry, goatery, piggery, duckery etc.
Scope for increasing quality animal resources and promotion of dairy, poultry, duckery,
goatery, piggery, sheep rearing etc., providing supplementary income options for small
and marginal farmers as well as landless labourers.
Scope for integration of livestock activities with other activities viz. agriculture,
aquaculture, agro-forestry/ forestry.
Small scale piggery and backyard poultry can be a successful venture in tribal areas.
Cross bred heifer has good potential.
Excellent opportunities for private sector investment/entrepreneurship in poultry and
dairy sectors, including processing and value addition.
Threats
High and recurrent incidence of deadly disease in poultry and animal rearing
Depletion of grazing land due to industrialization, urbanization, mining.
Migration/ shifting of farmers/ youths to other area/ alternatives opportunities for better
income.
Endangered indigenous breed like Siri cattle, yak etc.
Recurrence of Bird-flu and other diseases adversely affecting investment in the sector
3.5 Fisheries
Strength
Vast inland fishery resources for fish production.
All varieties of major and minor carps are cultivated besides, various types of local fish
species naturally available in the water bodies.
High demand for production of fish because of higher fish eating population.
Highest producer (40% of country’s total seed) and supplier of fish seed in the country.
Availability of good quality of spawn/seed from natural as well as commercial hatcheries.

30
Existence of active and functional Fisherman’s cooperative societies, Fish Production
Groups and a large number of Self Help Groups (SHG) all over the State contributing
well for the growth of the fishery sector.
Various state and central schemes and demonstration farms provide support for
development of fisheries.
Weakness
Large water bodies are under derelict and semi-derelict conditions.
Lack of organized improved fish culture at village level.
Shortcomings in marketing, absence of adequate ice plant and cold storage facilities at the
production point.
Inadequate bank financing and insurance in the fishery sector.
Highly season specific activity.
Inadequate demonstration and extension campaign at field level.
Opportunities
Vast and highest estuarine resource (1.5 lakh ha in the country), but least utilized.
Increasing fish production productivity through development of beels & baors.
Setting up of more number of hatcheries, for seed production in different blocks/ districts.
Immense scope of integrated fish farming with agriculture, animal husbandry, and
agroforestry etc., particularly rice - fish –horticulture- livestock based farming in water
logged rain fed lowland.
Organizing demonstration, training and awareness camps in the fish farmers’ villages for
dissemination of advanced technology.
Expansion of fishery activities through excavation of additional tanks, renovation of
derelict tanks and bills /boars.
Considerable reservoir fisheries resources
Promoting fish farming in canals
Thrust on poly culture with prawns for maximum utilization of resources.
Promotion of Magur and other air breathing fish farming, crab fattening, ornamental fish
culture.
Large scope for fisheries products processing, and value addition, including
entrepreneurship development.

31
Threats
Drying of natural water bodies due to extensive use of water for irrigation and or during
summer.
High siltation in large water bodies limits fish production.
Over exploitation of fisheries resources in sea, especially, the juvenile fishing
Climate change ( drought, flood, cyclone)and water pollution are threats to aqua culture
3.6 Sericulture
Strength
Silk Worm rearing in the state has been an age old activity.
Availability of cheap and skilled manpower.
Above national average leaf productivity.
Availability of plenty of fallow and semi-arid land for production of silk.
Weakness
Lack of region / season specific silk worm race with disease resistance properties.
Small land holding.
Poor Socio-economic conditions of rearers.
Underdeveloped post cocoon sector.
Ill developed power loom sector.
Opportunities
Presence of a strong domestic market.
Scope for product diversification and design development particularly in non-
mulberry sector.
Threat
Stiff competition with smuggled Chinese silk.
Increased cost of production of Silk.
3.7 Forest
Strength
Substantially high in respect of core forest area in the state.
Strong initiative by State forest department to increase tree coverage based on
different mixed plantation for adoption by the rural communities.

32
Availability of plenty of non-timber forest products offering rural livelihood options.
Farm forestry to prevent erosion of fertile soil from agricultural fields.
Forest species which can act as shelter belt against cyclone & flood etc.
Weakness
Very limited scope to increase terrestrial forest coverage.
Low coverage of social forestry with respect to the Total Geographical Area (TGA).
Inadequate fund flow to forest department for social forestry.
Non availability of sufficient community land.
Opportunities
Small land holding of farmers offer scope for farm forestry/agro forestry/commercial
forestry.
Abundant natural sources in forest along with better communication facilities offer
scope for eco-tourism.
Increased demand for bamboo and soft wood from paper mills.
Fodder plantations under farm forestry yields both wood and fodder.
Threats
Large scale conversions of forest lands into commercial plantation may lead to
associated problems such as straying of wild animals damaging crops.
Growing of industrial and mining activities depletes forests and grasslands
Food-fuel production imbalance may lead to inadequate supplies of food and fuel.
3.8 Water Resources Development
Strength
Good average annual rainfall of about 1800 mm in the state.
Numerous river, streams, either rain fed or perennial with normal snow melt from the
Himalayas.
Existence of large no of water bodies including tanks, wells, canals, swamps, all over
the state.
Low water table and good quality ground water in many parts.
Well-developed irrigation infrastructure and high irrigation potential already created
through tube well, deep tube well and other water bodies.
Renowned institutions and huge technical manpower.

33
Weakness
Strong seasonality in the annual rainfall volume.
Poor irrigation facility in the western part of the state.
Poor monetary condition of small and marginal farmers.
Very difficult to implement schemes where farmers contribution is necessary.
Underdeveloped micro irrigation.
Some areas are flood prone and drainage is a problem.
Shortage of funds prevents essential maintenance, renovation and electrification in
time.
Problem of Arsenic in ground water in some districts.
Dependence on flood irrigation without proper land levelling/field preparations.
Opportunity
Creation of additional irrigation potential.
Renovation and modernization of medium and minor irrigation projects.
There are no critical or over exploited blocks in the state giving scope for installation
of water drawing structures.
Soil type is predominantly sandy loam to loam with great prospect for GW recharge.
Ample scope for water harvesting by excavation / re-excavation of farm ponds and
distribution of drainage channels and nullahs.
Scope for introducing micro irrigation (drip and sprinkler) particularly for horticulture
crops.
Improving water use / irrigation efficiency.
Increased participation of beneficiaries through transfer of irrigation management to
water user associations.
Coordination of line depts. like agriculture, water resources, PHE departments for
improving use efficiency.
SRI (System of rice intensification) where water requirement is reduced has been
successful in some places.
Threat
Reduced stream flows as a result of processes associated with climate change.
Major draught periods during the summer months associated with climate change.
Declining per capita availability of water due to multi sectoral demand for water

34
viz. irrigation, industries and domestic water use etc.
Ingression of saline water in coastal area.
Drying up of natural water bodies.
Frequent cost/time over runs in implementation of projects.
3.9 Agricultural Marketing
Strength
Agricultural Marketing Directorate has taken steps to develop markets where
sellers and buyers can meet on a platform, buy and sell agricultural produce and
sort out difficulties.
Regulated Market Committees (RMCs) have been formed to ensure proper price
for the farmers by regulation enactment of APMC Act 1971.
RMCs empowered to form policies regarding buying and selling, market
amenities, infrastructure and services etc.
Agriculture marketing Board was set up to run Regulated Market Committees and
Market infrastructure services.
Scope of rural markets to become suppliers of graded, semi processed agricultural
produce to larger markets/buyer’s/processors.
Policies adopted by Government especially for small and marginal farmers to
develop post-harvest management, transport, link roads, mobile and static Suphal
Bangla, Amar Fasal Amar Gola etc.
Weakness
Poor shape of rural Haats and Bazars
Predominance of middlemen and the practices followed by them.
Poor power of execution with manpower shortage.
Lack of grading, storage and standardization in markets.
Poor market chain and information network.
Absence of regulatory mechanisms and RMCs in assuring MSP.
Fund constraints.
Many rural Haat and Bazars left to the mercy of private owners as being situated
potentially outside RMC areas and remote areas.
Even in markets within notified RMC but not under regulation of RMCs, the scope

35
of development is not sufficient due to lukewarm response from ZP/GPs etc. who
manage these markets.
Restricted movement of agricultural marketable commodities under market
regulation act.
Non availability of market information and intelligence, during need.
No mechanism to facilitate price discovery by farmers.
Opportunity
In globalized and trade liberalized atmosphere, further reforms in present APMC
act may be necessary for rapid development of rural markets and diversification of
markets.
With reforms, opportunities will open for development of markets under
cooperative sector and large private sector investment, implementation of central
sponsored capital investment subsidy schemes (CISS) for development of storage
and market yards, contact farming etc.
A win-win situation both for small and marginal farmer and the organization
giving legal contract, strictly safeguarding the interest of farmers.
Greater Fund for market development tailor-made to modern day necessities and
tie-up for product marketing.
Scope for large marketing cooperative society development.
Farmers are already engaged in cultivation of process grade potato for processing
industries.
Good scope of Farmers’ ‘Producers cooperatives” and companies giving ultimate
thrust to marketing.
Facilitating SHGs and cooperatives for organized marketing.
Development of market information network, linkages and intelligence.
Establishment of mega food park/ agro-food processing industry.
Policy interventions to encourage Private Sector participation in strengthening
market infrastructure.
Threat
Predominance of middlemen robbing the farmers of price realization.
Lack of manpower at village and block level hampering development of market
and other market development components.

36
Continuous neglect by Private owners of the rural Haats/Bazars. They earn
revenue from the seller farmers but do not invest for development of service and
infrastructure for such Haats. The markets thus become dilapidated.
The buyers and traders as well as farmer sellers have to move to the newly
constructed “Krishak Bazars”, new market infrastructure being created. Otherwise
the purpose will be defeated.
3.10 Cooperation
Strength
Large network of co-operatives and reach.
Presence in remote villages.
Different kinds of co-operative societies (consumer, marketing, credit etc.) serving
members in different needs.
Fertilizer, seed, bio-inputs, implement hubs, storages, service and sales through
PACS.
Post-harvest management through society members– use of cold storages and
godowns.
Large number of farmer members.
Govt. contribution to share capital of co-operative societies.
ST/LT credit through timely and hassle-free KCCs.
Strong SHG production, marketing and training.
Formation of Farmers Producer’s Co-operative.
Weakness
Political interference to societies.
Hindrance to growth of business/diversification of business.
High over-due from members and accumulated loss.
Lack of supervision of credit by lending societies.
Lack of training and orientation especially on ICT enabled service and controls,
towards remunerative, high tech areas of demand based lending for credit co-
operatives.
High level of imbalance.
Misappropriation, embezzlement of funds in PACS.

37
Lack of Training and awareness of leaders and members of cooperatives.
Opportunity
Since the farming communities are highly unorganized there is immense scope of
forming co-operative societies for the purpose of providing of inputs and
marketing.
Development of “Farm Implement Hub” has a bright future at PACs. Its input
business can also diversify into implement hubs for the use of members. These
hubs can resort to custom hiring and servicing.
Production in SHG works-sheds and marketing of SHG products can also become
an activity of primary co-operative societies.
Credit linkage of SHGs and KCC as a vehicle for timely and hassle-free credit,
have to be further encouraged.
Large scope of expansion of godown and cold storages by new construction and
proper maintenance.
Seed multiplication and processing by members of PACs has good potential. Role
of PACS in seed distribution.
Agro processing, bio fertilizer units, mini tube wells etc. can be developed through
primary co-operative societies.
Education and training of members of PACS/SHGs on emerging technologies for
adoption.
Using the existence of PACS for all round development of agriculture.
Scope of godown management process by PACS members and a decision support
system aided by GIS with proper training support.
PACS be computerized to build up a core banking network with Apex level State
co-operative Bank and District Central Co-operative Banks.
Threat
Continuously expanding network of RRBs/CBs in area of operation of co-
operatives.
Competition in business.
Emergence of ‘Payment’ banks in microfinance space.
Poor human resource base.

38
Chapter IV
Development in Agricultural Sector

39
2013-14: Leading producer of-
• Rice 154 LMT ,
• Vegetables 140 LMT,
• Jute 15.8 LMT and
• Potato 90 LMT (2nd Largest
producer after UP)
4.1 Introduction
The state has advantages like good rainfall, fertile alluvial belts, and generous surface and
ground water resources facilitated by creation of good irrigation infrastructure. This has
enabled the State to play a critical role in meeting the food security of the country. West
Bengal has 2.7 % percent of the nation's total land and about 8% of the country's
population. It produces more than eight per cent of the food produced in the country.
The state supplies nearly 33% of the potato
requirement and 66% of the jute requirements
of India. West Bengal is the largest producer of
rice in India with an annual output (2013-14) of
around 154 Lakh MT. It is the second-largest
producer of potatoes in India producing 90 lakh
MT (2013-14) against the requirement of 51
lakh MT. Cropping intensity in the state is
184%. It is the second-largest producer
of potatoes in India. West Bengal has been
awarded “Krishi Karman Award” for the third year in a row by Govt. of India. For
development of agricultural production in the state and for improving the per capita
income of the farmers all the programs should give priority to the marginal and small
farmers who constitute 95% of the farming community in the state and are living on
subsistence employment. The majority of the farming community has poor economic
capacity to adopt modern technologies. Moreover because of small, scattered and
fragmented land holdings, high input cost and non-remunerative market price, farming is
gradually becoming less profitable. This has led to the educated rural youths losing
interest in farming and leaving for urban areas in search of higher income. To boost
agricultural productivity and income for the farming communities a professional
transformation of agriculture in the line of commercial endeavours/business is required.
Development of infrastructure facilities like market, post-harvest storage, irrigation, agro-
processing, training, communication, education, health care, etc. are required to attract
the educated youths to remain in villages and to take up agriculture as a profession.

40
4.2 Crops and cropping pattern
The diversity in agro-climatic environment and resource endowment has resulted in inter-
regional differences in cropping pattern and in productivity and growth of major crops
within the state. The major cropping pattern in all the districts of West Bengal is rice
based. Rice covers more than 75% of the cultivated area in Kharif season since there is
prevalence of heavy showers due to south-western monsoon and major portion of
cultivated lands are low-lying. Rice, potato, jute, sugarcane and wheat are the top five
crops of the state. Other major food crops include maize, pulses, oil seeds, wheat and
vegetables.
Some popular crop rotation in West Bengal are : (1)Rice-Rice-Rice, (2) Rice- Rice,
(3)Rice-potato-Jute/Other cereals, (4)Rice-Wheat/ other cereals, (5)Rice-Wheat-Pulses/
Oilseeds, (6)Rice-Vegetables-Jute, (7)Rice-Jute-Vegetables, (8)Rice-Vegetables-
Pulses/Oilseeds, (8)Rice-Pulses/Oilseeds-Vegetables, (9)Rice-Fallow, (10)Rice-Rice-
Other cereals, (11)Rice-Rice-Pulses/Oilseeds, (12)Vegetables-Vegetables-Vegetables,
(13)Vegetables-Potato-Vegetables (Vegetables include: tomato, cabbage, cauliflower,
peas, brinjal, onion, cucurbits, ladies finger, radish, etc.). The major crops in the districts
of West Bengal are given in Appendix 7.
The production of food grains has registered an increase in 2013-14 to the tune of
171.56 lakh MT from the production of 165.22 lakh MT in2012-13. The production of
food grains estimated to be 173.37 lakh MT in 2014-15. Similarly, the production of
pulses of the state increased to 2.15 lakh MT, production of groundnut went to 1.56 MT
during the year 2013-14. The area and production of Maize was estimated to be 1.44 lakh
hectares and 6.2 lakh MT respectively during 2013-14.There is hardly any scope for
horizontal expansion of agriculture in West Bengal. In view of huge pressure on land in
West Bengal due to high population density (1029 /sq. km) there is hardly any scope of
increasing the land area for agriculture. To increase the agricultural production in West
Bengal vertical expansion is the only alternative.
Cropping intensity 184%, Irrigation potential 62% of Net Cropped area

41
The area, yield rate and production of principal crops in West Bengal is presented
in Table 4.1. Although West Bengal is the leading producer of many agricultural
commodities but the yield rate is much below international standard. Although rice is the
major crop in all the district of West Bengal the annual growth rate is remained less than
five per cent over the years.
Table 4.1: Area yield rate and production of principal crops in West Bengal
Source: Economic Review 2012-2013 & Department of Agriculture , Govt of West Bengal
A= Area in ‘000 ha, Y= Yield rate in kg/ha, P= Production in ‘000 metric tons,
P* = production in ‘000 bales/ ha (1bale= 180 kg)
0.00 20000.0040000.0060000.0080000.00100000.00120000.00140000.00160000.00180000.00
Aus (Rice)
Boro (Rice)
Wheat
Total Pulses
Total Oilseeds
Jute*
Area, Production and Productivity of crops, West Bengal
2010-11 A 2010-11 Y 2010-11 P 2011-12 A 2011-12 Y 2011-12 P
2012-13 A 2012-13 Y 2012-13 P 2013-14 A 2013-14 Y 2013-14 P
A Y P A Y P A Y P A Y P
Aus (Rice) 212.10 2138.00 453.40 213.00 2213.00 471.30 205.10 2297.00 471.20 210.00 2350.00 493.70
Aman (Rice) 3362.10 2507.00 8429.30 3999.60 2565.00 10259.40 400.00 2365.00 10259.40 4016.60 2625.00 1054.50
Boro (Rice) 1369.90 3290.00 4506.80 1221.10 3174.00 3875.10 1228.30 3310.00 4065.10 1287.00 3371.00 4338.10
Total Rice 4944.10 2708.00 13389.60 5433.70 2688.00 14605.80 5444.30 2745.00 14946.70 5513.70 2789.00 15376.90
Wheat 316.80 2760.00 874.40 315.70 2765.00 872.90 321.60 2786.00 895.90 331.50 2799.00 927.80
Total
Cereals5364.90 2728.00 14634.50 5859.50 2706.00 15855.80 5903.10 2765.00 16320.20 6003.20 2822.00 16941.10
Total Pulses 197.10 896.00 176.50 199.00 890.00 177.10 218.00 925.00 201.60 233.40 922.00 215.20
Total
Foodgrains5562.00 2663.00 14811.00 6058.50 2646.00 16032.90 6121.00 2699.00 1662.80 6236.60 2751.00 17156.30
Total
Oilseeds670.80 1048.00 703.30 678.80 1047.00 710.50 727.70 1128.00 821.00 745.40 1128.00 840.60
Potato 408.80 32831.00 13421.00 379.20 25641.00 9723.40 389.00 29869.00 11620.70 413.00 21955.00 9049.90
Jute* 568.50 14.31 8137.50 599.00 14.30 8558.60 576.70 14.30 88228.20 566.40 15.50 8771.70
Crop2010-11 2011-12 2012-13 2013-14

42
4.3 Gap analysis
The gap analysis indicates the difference between the estimated requirement of crop and
the actual production. The gap analysis presented in Table 4.2 shows that the state is
producing sufficinent quantiy of rice and cereals to meet its requirement and much excess
qualtity of potato while highly lagging behind in the production of pulses and oilseeds. It
is producing only about 16% of its requirement of pulses and about 50% of its oilseed
requirement. Thus the state needs to gear up the production of pulses and oilseeds.
Table4.2. Estimated Requirement (ER), Actual production and Gap (%) of major
crops (in lakh MT) in West Bengal for the years2013-14, 2014-15 and 2015-16
Crops 2013-14 2014-15 2015-16
ER AP Gap(%) ER AP Gap (%) ER AP Gap (%)
Rice 144.89 153.77 (+) `6.1 146.15 Dna - 147.43 Na -
Cereal 166.95 169.41 (+) 1.5 168.41 Dna - 169.88 Na -
Pulses 12.87 2.15 (-) 82.8 12.98 Dna - 13.10 Na -
Food
grains
179.82 171.56 (-) 4.6 181.39 Dna - 182.98 Na -
Oilseeds 16.55 8.4 (-) 49.3 16.69 Dna - 16.84 Na -
Potato 50.98 90.50 (+) 77.5 51.43 Dna - 51.88 Na -
(Source: Department of Agriculture, Govt. of West Bengal), Dna = data yet to be available, Na=
Not applicable
The annual growth rate of major crops is presented in Table 4.3.The growth rate
of wheat was quite high in 2007-08 and 2008-09 mostly due to introduction of new
varieties. One of the primary reasons for increase in growth rate of pulses and oilseeds is
due to increase in area of their cultivation. The fall in growth rate of jute in some years is
mostly due to decrease in area of cultivation. The increase in growth rate of potato is due
to both increase in area of cultivation and variety replacement.

43
Table 4.3 Annual growth rate (%) of yield rate of different crops in West Bengal
during different years (Base year Tri-ending 2005-07*)
Year Rice Wheat Pulses Oilseeds Jute Potato
2007-08 0.586 20.407 5.930 10.398 -4.332 36.351
2008-09 1.878 9.688 5.189 5.438 -0.284 12.670
2009-10 3.935 4.640 5.529 4.378 2.314 7.487
2010-11 3.943 4.479 5.379 4.280 2.481 6.146
2011-12 3.959 4.383 5.309 4.229 2.590 5.069
(Source: Department of Agriculture, Govt. of West Bengal), *Area, Production and yield rate figures of different crops corresponding to base year 2006-07
are actually the triennium ending average of three years, viz. 2004-05, 2005-06 and 2006-07
Note: Area, production and yield rate figures for the years 2009-10, 2010-11 and 2011-12 are
year wise targets.
-10
-5
0
5
10
15
20
25
30
35
40
Rice Wheat Pulses Oilseeds Jute Potato
Annual growth rate of crops West Bengal
2007-08 2008-09 2009-10 2010-11 2011-12

44
4.4 Varietal development and seed multiplication
Since, there is not much scope for increasing the total area of cultivation, one of the
major avenues for increasing the growth rate of different crops will be the replacement of
existing varieties of crops with high yielding, disease resistant and location specific
varieties. The existing varieties of some important crops and some of their recent
developments in West Bengal are given Table 4.4.
Table 4.4: Varieties of some important crops in West Bengal
SL. No. Crop Varieties
1
Rice (Aus) HYV, Heera, Aditya, Prasanna, Kalyani-2, Khanika
HYV, Rasi, Tulsi, IET-2233, Annanda, IET-579
Rice (Kharif)
Upland (15-30 cm.)Rupsail, Raghusail, Bhasamanik, Patnai-23, SR-226B, Nagar Tilakkachari
Shallow water (30-50cm.) HYV, IR-64, Ratna, Khitish, Vikash, IET-4786, Lalat
Semi-deep water (50-100cm.) HYV, Jaya, Ajaya, Kunti, Shsyasree, Vikramacharya, Prakash, Pratap, IR-20
Deep water (above 100 cm.) HYV, IR-42, Shalibahan, Pankaj, Sharna, Bipasha, Sabitri, Gayitri, Suresh, Biraj, Jogen, Tulashi, Rajashree, Sabita, Nalini, Amulya, Matangini, Purnendu, Dinesh, Urnendu, Jitendra, PNR-381, Manassarovar, Swarnadhan, Sashi, Madhukar, Neeraja, Jalapriya, CSR 10, CSR 13, CSR 27
Boro HYV, Tulsi, Aditya, IR-64, Khitish, Vikas, IR-36, Shasyasree, LET-4786, IET-2233, Annada, Satabdi, Rasi
Rice (Hybrid) CNRH 3, DRRH 2, JKRH 401, CNRH 101 & 102
Rice varieties identified as higher iron content
Jayasilet, Champkhussi, Sitabhog],
Local Rice varieties identified as arsenic tolerant
Gotrabhog, Nayanmani, CN1646-2, CN 1646-5
2 Wheat HYV, K-9107, HP-1731, HD-2643, HP-1633, Sonalika, HUW-468, UP-262, PBW-543, PBW-443, PBW-343, PBW-533, HD-273, HD-

45
2733, HD-2285, NW-1014
3 Potato K. Jyoti, K. Chandramukhi, K. Badsha, K. Ashoka
Processing variety : Atlantic, Chipsona- I, Chipsona – III
4 Sugarcane Co J-64, Co -7218, Co-87263, CoS-687, Bo-91, Co 62033, CoS-76
5 Jute JRO-632, JRO-524, JRO-7835, JRO-878
JRC-7447, JRC-212
6
Oilseeds
Mustard and Toria Benoy, Subinoy
Till Tilottama, Rama, Sabitri
Linseed Grima, Neela, Mukta
Groundnut AK 12-24, JL-24, ICGS-44, Somnath, ICGS-II, Girnar-I, Rabi Summer
Sunflower Morden
7
Pulses
Pea Dhusar, GF-68, Garden pea, Bonavillia, Arkel, GF-68
Arhar TAT-10
Pigeon Pea Sweta, Chuni
Gram Mahamaya-1, Mahamaya-2, Anuradha, Bidisha
Kalai Kalindi, Goutam, Sarada, Sulata
Mung Sonali, Panna, Pusa Baisakhi, K-850, Bireswar, Sukumar
Lentil Asha, Subrata, Ranjan, Subhendu, Maitri
Khesari Nirmal, BIOL, Sarada, Ratan, WBK 14-7, WBK 11-3
Soyabean JS-2, Pusa-16, Soyamax
Chickpea Mahamaya-1/2
Blackgram Kalindi, Pusa, Baisakhi,
Cowpea Co-1
8 Maize
Hybrid, Composite Kishan, Composite Azad Uttam, Composite Megha
Diara, Arun, Tarun, Probha, Agoti-76, Vijay, Ganga, Safed-2, Kishan Composite Vikram, Deccan-101
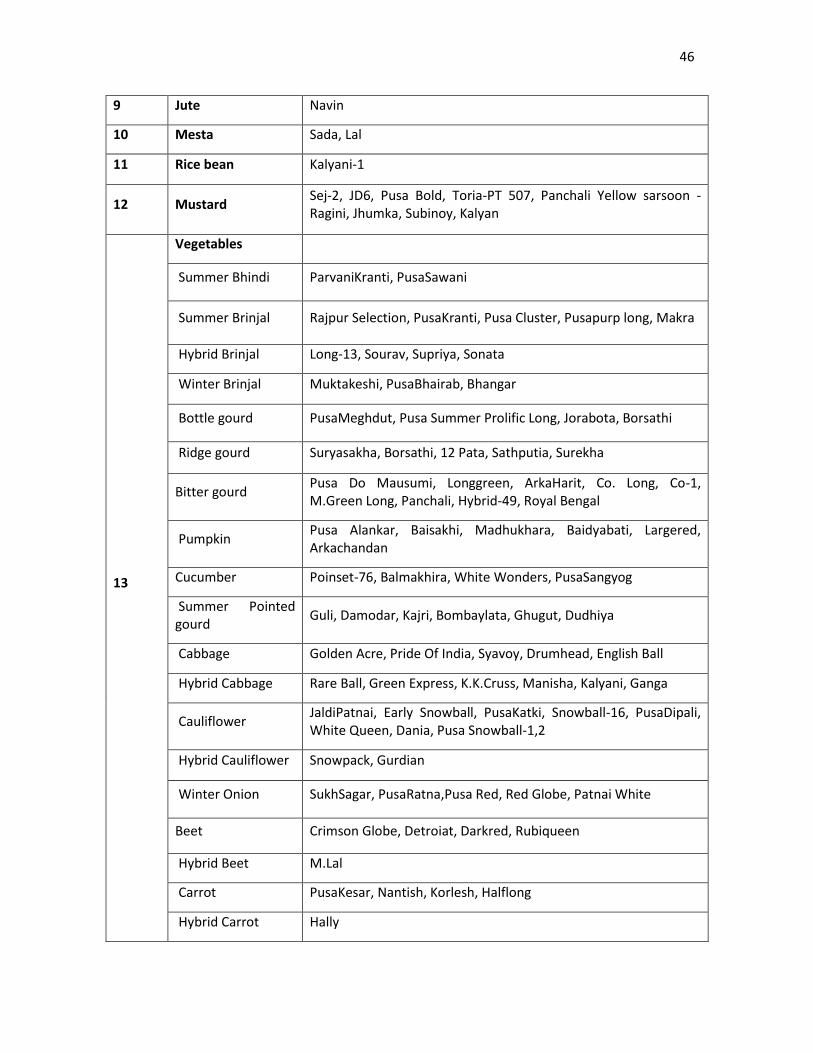
46
9 Jute Navin
10 Mesta Sada, Lal
11 Rice bean Kalyani-1
12 Mustard Sej-2, JD6, Pusa Bold, Toria-PT 507, Panchali Yellow sarsoon - Ragini, Jhumka, Subinoy, Kalyan
13
Vegetables
Summer Bhindi ParvaniKranti, PusaSawani
Summer Brinjal Rajpur Selection, PusaKranti, Pusa Cluster, Pusapurp long, Makra
Hybrid Brinjal Long-13, Sourav, Supriya, Sonata
Winter Brinjal Muktakeshi, PusaBhairab, Bhangar
Bottle gourd PusaMeghdut, Pusa Summer Prolific Long, Jorabota, Borsathi
Ridge gourd Suryasakha, Borsathi, 12 Pata, Sathputia, Surekha
Bitter gourd Pusa Do Mausumi, Longgreen, ArkaHarit, Co. Long, Co-1, M.Green Long, Panchali, Hybrid-49, Royal Bengal
Pumpkin Pusa Alankar, Baisakhi, Madhukhara, Baidyabati, Largered, Arkachandan
Cucumber Poinset-76, Balmakhira, White Wonders, PusaSangyog
Summer Pointed gourd
Guli, Damodar, Kajri, Bombaylata, Ghugut, Dudhiya
Cabbage Golden Acre, Pride Of India, Syavoy, Drumhead, English Ball
Hybrid Cabbage Rare Ball, Green Express, K.K.Cruss, Manisha, Kalyani, Ganga
Cauliflower JaldiPatnai, Early Snowball, PusaKatki, Snowball-16, PusaDipali, White Queen, Dania, Pusa Snowball-1,2
Hybrid Cauliflower Snowpack, Gurdian
Winter Onion SukhSagar, PusaRatna,Pusa Red, Red Globe, Patnai White
Beet Crimson Globe, Detroiat, Darkred, Rubiqueen
Hybrid Beet M.Lal
Carrot PusaKesar, Nantish, Korlesh, Halflong
Hybrid Carrot Hally

47
Tomato
Pusa Rubi, Pusa Gaurav, PunjabChuhara, S.L.-120, Roma, Early Duarf, Best Of All
Hybrid Tomato Rajani, Baisakhi, Abinash-2, Sadabahar, Gaurav, Nath-88, Rocky, Rashika, Hira, Moti, Shital, Meghna, Navin
Radish Red Bombay, KontaiLal, PusaHimani, Japanese White
Chilli
Pusa Jala, Suryamukhi, Bulet, Patnai, Guntur, Dhani
Hybrid ChilliTejashwini, Surya, Sujata, NathDiyva, Jwalan, Atm, Kranti, Kiran
Capsicum CaliforniaOandara, Yellow Oandara, Sweet Bannana, Hambars
Hybrid Capsicum Bharat, P-2, Beauty Bel, Nathhira, Greengold, Atlas
Green Pea Bonnveli, Telephone, Alderman, Pioneer
Watermelon Sugar Baby, Adhary, Ashahi Yamato
Potato KufriJyoti, KufriChandramukhi, KufriAlankar, KufriChamatkar, Kufri Shakti, KufriShinduri
Sweet Potato PusaLal, Kalmegh, PusaSafed, Goldrush
Ladies Finger Pusa Savani, Parbani Kranti, Sathshira, Longreen, Jhati
Hybrid Ladies Finger
Vijay, Improved Vijay, Makiho No.-10,12, Amar, Ajay-2
Chinese Cabbage Chinese Cabbage, Pakchoi, Odeti
Red Cabbage Primoro, Red Queen
Kohlrabi White Viena, Purple Viena, PusaKanchan, Largegreen, Rapid Star
Broccoli White Viena, Purple Viena, PusaKanchan, Largegreen, Rapid Star
Lettuce Great Lakes, Bolt, French Breakfast, Darkgreen
Teasle Gourd (Kakrol)
Tall, Round
Smooth Gourd (Dhudhul)
PusaChikni, PusaSupriya
Broad Beens (Seem)
Altapati, Noldog, Ghritakanchan, Gobornada, PusaEarly
French been French White, Contender, Pusa Parbati, Pusa Mausumi
(Source: Directorate of Agriculture, Govt. of West Bengal)
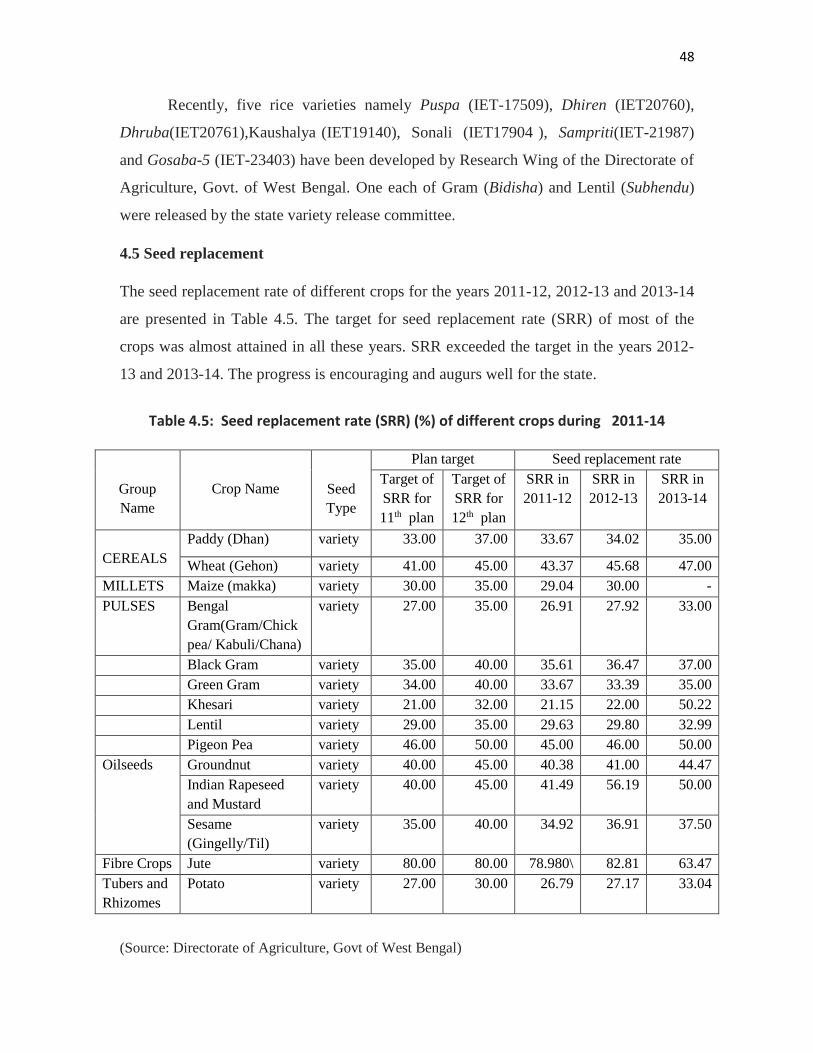
48
Recently, five rice varieties namely Puspa (IET-17509), Dhiren (IET20760),
Dhruba(IET20761),Kaushalya (IET19140), Sonali (IET17904 ), Sampriti(IET-21987)
and Gosaba-5 (IET-23403) have been developed by Research Wing of the Directorate of
Agriculture, Govt. of West Bengal. One each of Gram (Bidisha) and Lentil (Subhendu)
were released by the state variety release committee.
4.5 Seed replacement
The seed replacement rate of different crops for the years 2011-12, 2012-13 and 2013-14
are presented in Table 4.5. The target for seed replacement rate (SRR) of most of the
crops was almost attained in all these years. SRR exceeded the target in the years 2012-
13 and 2013-14. The progress is encouraging and augurs well for the state.
Table 4.5: Seed replacement rate (SRR) (%) of different crops during 2011-14
Group
Name
Crop Name
Seed
Type
Plan target Seed replacement rate
Target of
SRR for
11th plan
Target of
SRR for
12th plan
SRR in
2011-12
SRR in
2012-13
SRR in
2013-14
CEREALS
Paddy (Dhan) variety 33.00 37.00 33.67 34.02 35.00
Wheat (Gehon) variety 41.00 45.00 43.37 45.68 47.00
MILLETS Maize (makka) variety 30.00 35.00 29.04 30.00 -
PULSES Bengal
Gram(Gram/Chick
pea/ Kabuli/Chana)
variety 27.00 35.00 26.91 27.92 33.00
Black Gram variety 35.00 40.00 35.61 36.47 37.00
Green Gram variety 34.00 40.00 33.67 33.39 35.00
Khesari variety 21.00 32.00 21.15 22.00 50.22
Lentil variety 29.00 35.00 29.63 29.80 32.99
Pigeon Pea variety 46.00 50.00 45.00 46.00 50.00
Oilseeds Groundnut variety 40.00 45.00 40.38 41.00 44.47
Indian Rapeseed
and Mustard
variety 40.00 45.00 41.49 56.19 50.00
Sesame
(Gingelly/Til)
variety 35.00 40.00 34.92 36.91 37.50
Fibre Crops Jute variety 80.00 80.00 78.980\ 82.81 63.47
Tubers and
Rhizomes
Potato variety 27.00 30.00 26.79 27.17 33.04
(Source: Directorate of Agriculture, Govt of West Bengal)

49
4.6. Soil Fertility
Although the state has limited infrastructure facility for Soil testing laboratories, the
fertility status of most of the district of the state has been evaluated (Table 4.6). The soils
of most of the districts of the state are, in general, low to medium in available nitrogen,
and medium in available phosphorus and potassium. In specific cases, the red and
lateritic soils in the Western and south-western parts of the state (parts of the districts of
Purulia, Purba Medinipur, Paschim Medinipur, Birbhum, etc.) are deficient in
phosphorus, some areas in Hooghly and Burdwan districts are high in available
phosphorus while, appreciable areas of North Bengal districts (parts of the districts of
Jalpaiguri, Alipuduar, Coochbehar, etc.) are low in available potassium. So far fertility
index in concerned, isolated areas in all the districts are low in soil fertility index.
Table 4.6: Soil fertility status of districts of West Bengal
District Available N
(kg/ha)
Available P
(kg/ha)
Available K
(kg/ha)
South 24 Parganas Low Medium Medium
Nadia Low Medium Medium
Burdwan Low Medium Medium
Hooghly Medium Medium Medium
Howrah Medium Medium Medium
Midnapur (East & West) Medium Medium Medium
Bankura Medium Medium Medium
Purulia Medium Medium Medium
Birbhum Medium Medium Medium
Murshidabad Low Medium Medium
Malda Low Medium Medium
West Dinajpur Low Medium Medium
Darjeeling Low Medium Medium
Jalpaiguri Medium Medium Medium
Coochbehar Medium Medium Medium
(Source: Directorate of Agriculture, Govt. of West Bengal)

50
4.7 Fertilizer use
There has been a considerable increase in fertilizer consumption in West Bengal over the
years (Fig 4.1).
Fig. 4.1: Fertilizer Consumption in West Bengal
The total NPK fertilizer consumption in West Bengal has increased from 11.3
thousand tons in 1960-61 to 1571.8 tons in 2010-11 but declined in subsequently in 2012-
13 and 2013-14 but showed an increase in 2014-15 (1471.5 tons). An analysis of the
N:P:K indicates that the gap between the quantity of nitrogen (N) used against the
quantity of phosphate (P) and potash (K) used is narrowing down and approaching
towards the ideal ratio of 2:1:1. (Table 4.7). This is an encouraging trend and indicates
that the farmers are getting more and more conscious for use of balanced nutrient ratio.
11.373.8
282.8
753.0
1085.1
1571.8 1602.41560.4
1303.0
1471.5
0
200
400
600
800
1000
1200
1400
1600
1800
NP
K C
on
sum
pti
on
in '0
00
to
ns
Year

51
Table 4.7: Trend in yearly fertilizer consumption (in ‘000 tons) in West Bengal
Year Nitrogen (N) Phosphate (P) Potash (K) N:P:K
1960-61 7.71 3.50 0.12 2:0.90:0.03
1970-71 47.5 12.50 13.80 2:0.52:0.58
1980-81 167.30 70.80 44.70 2:0.84:0.53
1990-91 412.89 206.78 134.33 2:1.00:0.63
2000-01 561.88 296.96 226.25 2:1.05:0.80
2010-11 712.37 495.58 363.87 2:1.40:1.02
2011-12 782.65 480.56 319.03 2:1.23:0.82
2012-13 824.00 453.68 282.73 2:1.10:0.68
2013-14 696.37 335.37 271.25 2:0.96:0.62
2014-15 752.54 399.06 319.88 2:1.06:0.85
(Source: Directorate of Agriculture, Govt. of West Bengal)
However, inadequate use of organic manure in sufficient quantity has resulted in
gradual deterioration of soil quality. Moreover, the quantity of fertilizers used does not
keep pace with nutrient removal by crops. Thus the fertility status of soil is declining
rapidly under intensive agriculture. In some areas the deficiencies of sulphur, zinc and
boron are becoming prominent.
In a comprehensive study carried out by ICAR through their Coordinated
Research Project on Micronutrients, it was found that about 48 per cent of the soils
studied were deficient in zinc, 33 per cent in boron, 13 per cent in molybdenum, 12 per
cent in iron, 5 per cent in manganese and 3 per cent in copper. Micronutrient deficiency is
one of the limiting factors lowering fertilizer response and crop productivity. As a result
of over-emphasis on chemical fertilizers the fertilizer use efficiencies are gradually
decreasing: hardly 35 per cent for N, 15–20 per cent for P and only 3–5 per cent for
micronutrients like zinc are available to crops resulting in high cost of production. At this
rate, the National Academy of Agricultural Sciences has estimated that for meeting the
food needs of the country by 2025, India may have to increase NPK supply to over 45
million tons from the current level of 26.5 million tons and of organic manure from 4 to 6
million tons. The 12th five year plan envisages NPK demand at 34–36 million tons by
2016–17, but the more important priority and emphasis should be given on fertilizer use
efficiency and soil health.
Restoration of soil health requires initiatives for continuous monitoring of soil

52
health, measures to arrest decline of soil health, creating adequate facilities for soil
testing, fertilizers testing, ensuring judicious and efficient use of fertilizers and pesticides.
Judicious use of fertilizer requires adequate soil testing facilities. The Govt. of West
Bengal has proposed establishment of new Soil testing Laboratories and strengthening of
existing Soil testing laboratories in the 12th FYP through the use of fund from Rashtriya
Krishi Vikas Yojana (RKVY) and has also taken initiatives to assist the State
Agricultural Universities and KVKs in this regard. Steps are also being initiated to create
widespread awareness for soil-test–based fertilizer use and Integrated Nutrient
Management (INM).
4.7.1 Organic Manure and Bio-pesticides
Measures for soil health improvement need to be comprehensively centered on addition
of soil organic matter in substantial quantities over time. The effort for production and
use of available biological sources of nutrients like bio-fertilizers, organic manure, bio-
compost is necessary for sustained improvement of soil health including the improvement
of soil organic carbon status. However, the production of organic manure has remained
very low (Table 4.8) and merits focused attention. Efforts to motivate farmers to use
organic manure should be accelerated. Use of organic inputs alone or in conjunction with
chemical fertilizers can enhance agricultural production to a great extent, reduce cost of
production and improve soil health and quality of soil environment. Similarly, use of bio-
pesticides is important for sustained increase in agricultural productivity and maintenance
of soil health and environmental quality. The use of synthetic pesticides needs to be
confined to targeted control in the right quantity and at the right time, presence of
pesticides residue in food commodities is becoming a serious food safety issue. The
Government of West Bengal has given due emphasis in the 12th plan outlay for adoption
of Integrated Pest Management (IPM) approach, which emphasizes safe and judicious
use of pesticides as well as all round measures to reduce pesticides. The quality of
pesticides is regularly analyzed in State Pesticide quality control laboratories and
initiatives have been taken to strengthening these laboratories during 12th plan period.

53
Table 4.8: Production of different organic manures
Commodity 2011-12 2012-13 2013-14 2014-15
Bio- fertilizer (MT) 1110.00 Dna 1650.00 1732.00
Organic manure- Cow dung(lakh MT) 39.20 Dna Dna 41.00
Organic manure- Concentrates (lakh MT) 3.20 Dna Dna 3.65
Total organic manures (lakh MT) 42.40 Dna 43.50 44.65
Vermi-compost (lakh MT) 23.80 Dna 23.95 24.66
Rural compost (lakh MT) 79.80 Dna 79.80 82.20
City compost (lakh MT) 7.90 Dna 7.90 8.10
Green manuring (area in lakh ha) 685000.00 Dna 658100.00 698880.00
Certified area of organic farming (ha) 255.00 350.00 Dna 354.00
Area under conversion to organic farming (ha) 5000.00 6000.00 Dna 6050.00
(Source: Directorate of Agriculture, Govt. of West Bengal), Dna= Data not available
4.8 Agricultural Mechanization
Agricultural implements and machines enable farmers to employ the power judiciously
for production purposes. Introduction and adoption of agricultural machinery in recent
past has mainly been confined to the northern states of India. However, with the increase
in irrigation facilities and modernization of cropping practices, the demand for
agricultural machinery has shown an increasing trend in the state. In West Bengal, the
prevalence of small and marginal farmers prevents them from exploiting the maximum
benefits of the modern agricultural implements. Further, West Bengal is the leading
producer of paddy in the country. With paddy primarily being a wetland crop, not many
machines had been used earlier. The farm power availability in West Bengal (1.48 kw/ha)
is less than average farm power available in Indian farms. The implements used by the
cultivators for performing various agricultural operations are desi plough, bose plough,
leveler, long handled spade, row marker, khurpi etc. Low income of farmers, less land
holding, lack of proper infrastructure and inadequate facilities of repair and maintenance
for different types of machineries / implements resulted in poor status of farm
mechanization in the state.

54
4.8.1 Trend of mechanization
Farm power availability is in incremental stage which has attained at 1.48 KW per ha.
during 2013-14 from a level of 1.25 KW per ha. in 2001-02. With the progress of farm
mechanization schemes of the State, enhanced use of farm power and machineries are
being encouraged mostly for farm equipment ranging up to 15 HP or less. By and large,
the farmers have adopted the mechanized ploughing especially power tillers. There has
been increase in purchase and use of power tillers in West Bengal in the last few years for
paddy cultivation. Use of ‘paddy transplanters’ has been on an increasing trend in the
state due to shortage of labour. Vertical conveyer reaper is another such machine which
has been taken up on a wide scale by the farming community. Other equipments like,
paddy weeder, sprayers and paddy thresher are also being used and also owned more
frequently by the farmers. Recently tractor drawn automatic potato planter, tractor dawn
potato digger-cum-elevator etc. have been introduced in the state. Awareness generation
and availability of machinery can increase the demand for machinery in crop cultivation
in the state.
The state govt. through its agencies and agricultural universities promotes
agricultural machineries through the demonstration of newly developed farm equipments.
The aim of the govt. is to enhance farm power availability to 2.5 kw/hour from 1.48
kw/hour. This would necessitate small implements of low horse power. Food grain
production with relation to farm power availability is presented in Table 4.8. The
improved tools and equipment for different operations that may be considered for
introduction are as below:
Tillage machinery: MB plough, Disk plough, cultivator.
Seed bed preparation: Puddlers, drum type pre-germinated paddy seeder, manually
operated self-propelled paddy transplanter, automatic/bullock drawn potato planter,
rotovator, animal dawn multi-crop planter, multi-crop seed drill, power tiller with
rotovator.
Plant protection equipment: Conoweeder, hand hoe, wetland weeder, wheel hoe,
knapsack sprayer, foot sprayers etc.
Harvesting/Threshing: Vertical reaper, Reaper-cum-binder, combine harvester, axial
flow paddy thresher, potato digger multi crop thresher etc.
Misc: Quality hand tools for horticultural crops viz. pit makers, pruning tools, sprayer
for tall trees etc.
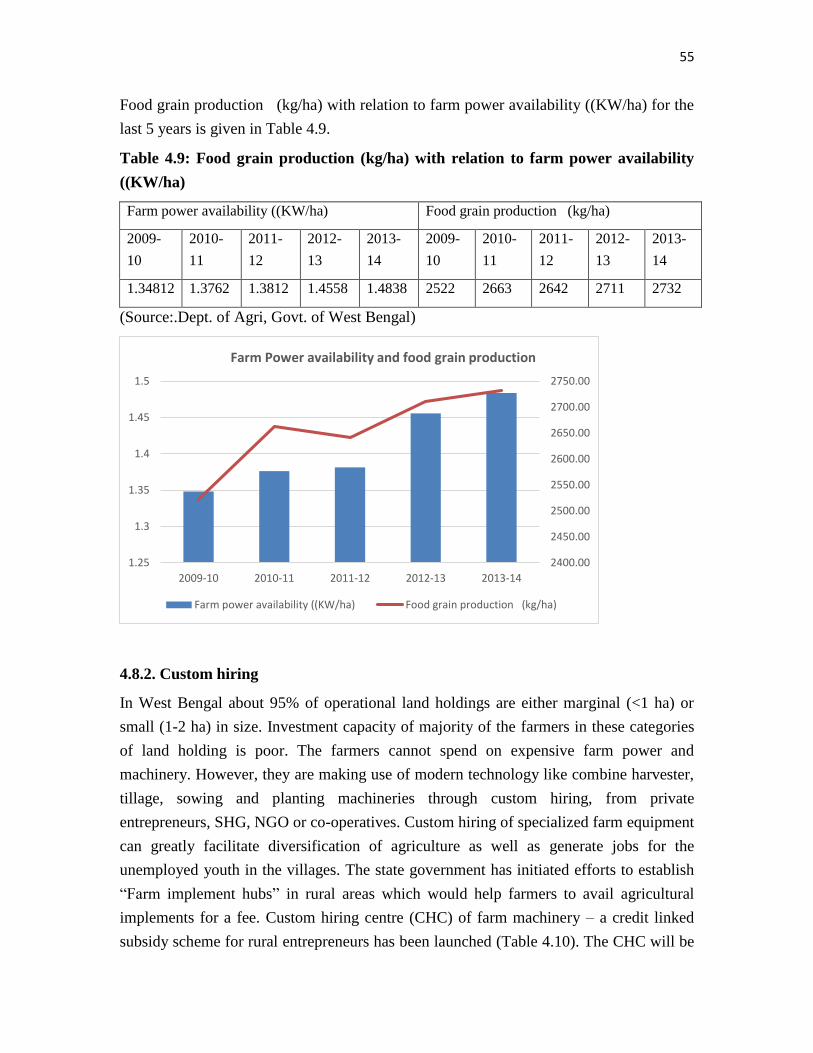
55
Food grain production (kg/ha) with relation to farm power availability ((KW/ha) for the
last 5 years is given in Table 4.9.
Table 4.9: Food grain production (kg/ha) with relation to farm power availability
((KW/ha)
Farm power availability ((KW/ha) Food grain production (kg/ha)
2009-
10
2010-
11
2011-
12
2012-
13
2013-
14
2009-
10
2010-
11
2011-
12
2012-
13
2013-
14
1.34812 1.3762 1.3812 1.4558 1.4838 2522 2663 2642 2711 2732
(Source:.Dept. of Agri, Govt. of West Bengal)
4.8.2. Custom hiring
In West Bengal about 95% of operational land holdings are either marginal (<1 ha) or
small (1-2 ha) in size. Investment capacity of majority of the farmers in these categories
of land holding is poor. The farmers cannot spend on expensive farm power and
machinery. However, they are making use of modern technology like combine harvester,
tillage, sowing and planting machineries through custom hiring, from private
entrepreneurs, SHG, NGO or co-operatives. Custom hiring of specialized farm equipment
can greatly facilitate diversification of agriculture as well as generate jobs for the
unemployed youth in the villages. The state government has initiated efforts to establish
“Farm implement hubs” in rural areas which would help farmers to avail agricultural
implements for a fee. Custom hiring centre (CHC) of farm machinery – a credit linked
subsidy scheme for rural entrepreneurs has been launched (Table 4.10). The CHC will be
2400.00
2450.00
2500.00
2550.00
2600.00
2650.00
2700.00
2750.00
1.25
1.3
1.35
1.4
1.45
1.5
2009-10 2010-11 2011-12 2012-13 2013-14
Farm Power availability and food grain production
Farm power availability ((KW/ha) Food grain production (kg/ha)

56
set up in every district by eligible and selected entrepreneurs. The project cost for CHC
will be in the range of ten lakh to sixty lakh with subsidy of 40% to be provided by the
State Govt. subject to maximum limit of 24 lakh.
Table 4.10: Equipment procured/ subsidized by Govt. of W.B. through different
schemes during 2012-13, 2013-14 and 2014-15 including those privately owned
Sl.
No.
Name of the machinery/ Equipment 2012-
13
2013-14 2014-15 **Total Nos
in the state
(approx.)
1 Combined harvester (Mini) - - - 20
2 Combined harvester (large) - - - 5
3 Tractor upto 40 HP 492 140 213 32,800
4 Power tiller upto 8HP and above 5271 2707 2559 1,58,000
5 Pump set upto 5HP (BIS/ ISI) 34537 25259 33334 5,80,000
6 Self-propelled power reaper 465 101 145 1050
7 Tractor drawn zero till seed-cump
fertilizer drill
10 9 22 350
8 Self-propelled/ paddy Thresher - - - 11
9 Multi crop Thresher/ paddy thresher - 85 1312 8500
10 Rotavator - - 29 10,000
11 Power sprayer - 2141 749 50,000
12 *Custom Hiring Centre (CHC) - - 84
(Source: Directorate of Agriculture, Govt. of West Bengal)
Specific implements recommended for different crops are presented in Appendix 8.
4.9. Irrigation
The total irrigation potential created in West Bengal up to 2009-10 is 5.42 million ha of
which 3.82 million ha is ground water and surface water minor irrigation and 1.59 million
ha under major and medium irrigation. The irrigation potential of the state is estimated to
be 62% of the net cropped area. The state has 37.5 percent of its net irrigated area under
canal irrigation. At present, 208 million ha is under minor irrigation in the state. The
minor irrigation sector is dominant over major and medium irrigation with an untapped
potential to harness another 1.5 million ha under it.
Although overall irrigated areas for the state is around 45%, it is not well
distributed evenly all over the state. Ten districts have irrigated area more than 50% area

57
and three have even more than 70%. In ten districts canal is a major source of irrigation
while in six districts especially in central region of the state it is shallow tube wells used
for exploiting good quality ground water. However four districts have only 30% area
under irrigation. Further in canal irrigated area, the data do not reflect real life scenario as
the water don’t reach to tail areas. This is true for Bankura where water from Kangsabati
canal rarely cover whole command area.
The state agriculture continues to be dependent on monsoon for cultivation in
many districts. In about 5 districts 70% of the net areas sown are single cropped areas.
47% of the gross rice area in the state is still rainfed with substantially low production
levels. Though West Bengal has plenty of water, its quality remains poor in many areas.
Salinity is a problem in 60 blocks in North 24 Parganas, South 24 Parganas, Midnapore
(east) and Howrah districts. Arsenic is a major contaminant in 78 blocks of Maldah,
Mursidabad, Nadia, North 24 Parganas, South 24 Parganas, Howrah, Hooghly and
Burdwan while three blocks in Birbhum district have high concentration of fluoride.
4.9.1 Major and Medium Irrigation Projects
Under major irrigation schemes in the state, Mayurakshi irrigate 161 thousand ha,
51thousand ha and 18 thousand ha in Birbhum, Murshidabad and Burdwan districts. The
Kangshabati projects irrigate 18, 147 and 143 thousand hectares in Hooghly, Bankura and
Medinipur (East and West) districts, respectively. Damodar Valley projects’ canals
irrigate about 284, 76, 5, 34 thousand ha area in Burdwan, Hooghly, Howrah and
Bankura districts respectively. The Teesta Barrage project irrigates about 104 thousand
hectare in three districts of North Bengal viz. Jalpaiguri, Darjeeling and Uttar Dinajpur.
Area irrigated by govt. canals under medium irrigation schemes is about 68 thousand ha
spreading over the districts like, Medinipur (East and West), Bankura, Jalpaiguri, Purulia
and Birbhum. The water efficiency in dam canal networks of India was estimated to be
30-40 percent only.
4.9.2 Minor Irrigation
Major and medium irrigation can only effectively meet merely 2.44 percent of the
demand of water in the agricultural sector. Minor irrigation has played a pivotal role in
boosting agricultural production in the State. West Bengal is well endowed with ground
water which played an important role in West Bengal’s agriculture. In the late 1980’s and
early 1990’s, agricultural growth rates were 6% per annum, which was attributed to
expansion in the area under Boro rice cultivation and an increase in yield of all paddy
crops due to assured irrigation from tube wells. Net annual ground water availability is
estimated to be 27.64 bcm of which 42% has been developed and thus there is a large

58
untapped potential. There are many districts where ground water can be drawn safely
which has facilitated use of water by small and marginal farmers thereby helping them
economicaly. The district wise cultivated area and net irrigated area through different
sources are given in Table 4.11.
Table 4.11: Status of Minor irrigation in West Bengal (2013-14)
District HDTW MDTW LDTW STW RLI ODW
Major Medium Mini Total
(1) (2) (3) (4) (5) (6) (7) (8) (9) (10)
Burdwan 601 36 746 104 300 0 15 315 0
Birbhum 31 109 415 0 123 0 131 254 950
Bankura 37 110 266 160 211 88 185 484 1479
Purba Medinipur 127 46 313 0 112 58 12 182 9
Paschim Medinipur 295 181 1091 0 470 75 34 579 364
Howrah 87 111 6 0 161 3 17 181 0
Hooghly 488 53 1001 0 363 13 42 418 0
24 Pgs. (N) 353 32 616 300 190 0 46 236 0
24 Pgs. (S) 4 54 2 99 84 1 6 91 0
Nadia 677 27 616 767 354 0 23 377 0
Murshidabad 533 48 587 989 420 6 56 482 0
Uttar Dinajpur 181 8 54 6099 121 6 165 292 0
Malda 278 49 377 2126 369 36 154 559 0
Jalpaiguri 42 9 0 3786 51 0 251 302 268
Alipurduar 18 2 0 1723 40 0 154 194 0
Darjeeling 0 2 0 1043 27 0 161 188 0
Cooch Behar 72 27 0 4940 114 5 293 412 0
Purulia 0 0 0 0 130 7 107 244 4328
West Bengal 3958 917 6493 25569 3899 298 1984 6181 7398
(Source : West Bengal Economic Review, 2014-15)
Notes: HDTW – High Capacity Deep Tubewell STW – Shallow Tubewell
MDTW – Medium Capacity Deep Tubewell RLI – River Lift Irrigation
LDTW – Low Capacity Deep Tubewell ODW – Open Dug well

59
The ultimate minor irrigation potential in the state had been estimated at 44.34 lakh
hectare, out of which 31.34 lakh hectare is from ground water resources and 13.00 lakh
hectare is from surface water resources. Up to 31.03.2014, creation of irrigation potential
in the minor irrigation sector has been estimated to be about 39.78 lakh hectare, out of
which 28.38 lakh hectares is from ground water resources and 11.40 lakh hectare is from
surface water resources which are to be vetted after publications of 5th MI census report
(Table 4.12). The district wise extent of ground water availability and utilization along
with block categorization are presented in Appendix 9 and Appendix 10 respectively.
Table 4.12: Minor irrigation potential created up to 2013-14
Season wise minor irrigation potential created (ha) 2006-
07 as per 4th MI Census
Season wise minor irrigation potential created (ha)
(Provisional)
Minor Irrigation Kharif Rabi Perenial Other
(Boro)
Total Kharif Rabi Perenial Others
(Boro)
Total
Dug Well 16,889 14,955 872 3,520 36,236 18,949 16,779 987 3,949 49,656
Shallow TW 9,50,282 6,30,716 27,441 5,60,490 21,61,929 10,66,195 7.07.749 30.788 6,28,857 24,33,489
Deep TW 1,54,999 92,279 8,196 69,103 3,24,577 1,73,905 1,03,535 9,196 77,532 3,64,168
Surface Flow 2,40,279 1,03,780 10,389 57,658 4,12,106 2,50,636 1,08,253 10,837 60,143 4,29,869
SurfaceLift (RLI) 3,09,704 1,92,886 69,656 1,08,484 6,80,730 3,23,053 2,01,200 72,658 1,13,160 7,10,071
Total MI 16,72,153 10,34,616 1,16,554 7,99,255 36,22,578 18,32,737 11,37,416 1,24,457 8,83,641 39,78,252
4.9.3 XIIth Plan achievement The financial and physical target and achievement for
water resource development in XIIth Plan is presented in Appendix 11.
4.10 Horticulture
West Bengal, with six diverse agricultural conditions, is conducive for growing a wide
range of agricultural crops such as fruits, vegetables, spices, plantation crops, and
flowers, medicinal and aromatic plants. Horticulture plays important role contributing
growth in agriculture and has many advantage in enhancing the per unit area, generating
employment, aesthetic aspect and raw materials for processing industries. Many schemes
are being implemented through State Horticulture Department by National Horticulture
Mission (NHM), National Horticulture Board (NHB), MIDH and RKVY for production,
productivity and market opportunity. The programmes are in operation under State
Horticulture Department for overall development of horticulture.

60
4.10.1 Fruits
The state is a leading producer of
fruits. The Production of fruits
increased from30.55 tonnes in 2011-
12 to 31.72 lakh tonnes in 2012-13. In
West Bengal, the total area under
fruits is 2.2 lakh with a production
31.73 lakh MT in 2013-14(Table
4.13). Among the fruits, mango
occupies the largest area of about 0.93
lakh hectares (42%) and contributes 7.35 lakh MT. The state ranks first in production of
pineapple and 2nd in litchi with a production of 3.10 and 0.90 lakh MT respectively. The
major fruits grown in the state include mango, banana, guava, litchi, sapota, citrus and
pineapple. Among fruits mango occupied maximum areas (42 %).
Table 4.13: Area, Production and Productivity of Fruit Crops in West Bengal
Source: Food Processing & Horticulture Dept. Govt. of West Bengal.
Area in
000 ha
Production
in 000 MT
Productivity
in Mt/Ha
Area in
000 ha
Production
in 000 MT
Productivity
in MT/Ha
Area in
000ha
Production
in 000 MT
Productivity
in MT/Ha
1 Mango 90.937 661.528 7.275 92.5 735 7.946 93.5 430.71 4.607
2 Banana 43.734 1053.989 24.1 44.7 1077.8 24.112 45.5 1097.5 24.121
3 Pineapple 10.126 309.856 30.6 10.5 310 29.524 10.7 316 29.533
4 Papaya 11.227 327.828 29.2 11.3 331 29.292 11.4 335 29.386
5 Guava 14.068 179.776 12.779 11.3 331 29.292 14.35 186 12.962
6 Jackfruit 11.41 191.975 16.825 14.2 184 12.958 11.47 194.5 16.957
7 Litchi 8.933 85.267 9.545 11.45 193.5 16.9 9.3 93.9 10.097
8Mandarin
Orange3.84 38.048 9.908 3.855 38.294 9.934 3.88 38.6 9.948
9 Other Citrus 7.649 69.198 9.047 7.855 71.106 9.052 8 72.4 9.05
10 Sapota 4.101 43.611 10.634 4.15 44.8 10.795 4.2 45.4 10.81
11Temperate
Fruits2.32 30.18 13.009 2.325 30.35 13.054 2.33 30.42 113.056
12 Misc. Fruits 8.299 64.18 7.733 8.575 66.65 7.773 8.87 69.28 7.811
216.644 3055.436 14.103 220.6 3172.5 14.382 223.5 2909.71 7.811Total
Sl.
No.
Name of the
Fruits
2011-2012 2012-13 2013-14
Other Fruit Crops
West Bengal is Leading producer of :
• Pineapple 3.9 LMT and
• Litchi 0.9 LMT
• Mango 4.3 LMT (Max acreage)
• 1st in Loose flower production (0.665
LMT)
• 4th in area under flowers (24850 ha)

61
4.10.2 Vegetables
The state is the leading producer of vegetables in the country producing traditional and
non – traditional vegetables. The area and production under vegetables is 9.68 lakh
hectares and 140.00 lakh MT respectively (2013-14). The area of vegetables increased by
0.73% and production by 1.80% during 2013-14 (Table 4.14). The important vegetables
grown are Tomato, Cabbage, Cauliflower, Peas, Brinjal, Onion, Ladysfinger, Sweet
Potato, Beans, Cucurbits and other vegetables.
TABLE 4.14: Area, Production & Productivity of Vegetables in West Bengal
Source: Food Processing & Horticulture Dept. Govt. of West Bengal.
4.10.3 Spices
The important spices grown in India are Red Pepper, Ginger, Turmeric, Fenugreek,
Coriander, Large Cardamom and other spices. During 2013-14 production increased
marginally (Table 4.15). Red Pepper grows in 63.55thousand hectares, producing 57.6
thousand tonnes. Red Pepper production exhibited decrease over the preceding year.
Area in
000ha
Production
in 000 MT
Productivity
in Mt/Ha
Area in
000ha
Production
in 000 MT
Productivity
in Mt/Ha
Area in
000ha
Production
in 000 MT
Productivity
in Mt/Ha
1 Tomato 55.23 1104.50 20.00 56.00 1125.60 20.10 56.50 1141.50 20.20
2 Cabbage 76.78 2149.93 28.00 77.80 2179.20 28.01 78.20 2197.40 28.10
3 Cauliflower 71.44 182.66 2.56 73.00 1863.00 25.52 73.60 1879.00 25.53
4 Peas 21.65 131.00 6.05 21.80 132.11 6.06 21.90 133.50 6.10
5 Brinjal 100.02 2945.73 29.45 161.00 2965.60 18.42 161.50 2977.00 18.43
6 Onion 21.68 304.56 14.05 22.00 309.10 14.05 23.50 342.85 14.59
7 Ladysfinger 74.38 863.50 11.61 74.60 869.10 11.65 75.00 877.00 11.69
Sweet
PotatoNA NA Not available 22.90 236.10 10.31 22.80 236.00 10.35
Other 263.46 174.70 0.66
8 Beans NA NA Not available 23.05 126.80 5.50 23.20 127.80 5.51
9 Cucurbits NA NA Not available 170.00 2177.70 12.81 170.60 2187.00 12.82
10 Raddish 40.49 494.79 12.22 40.60 496.20 12.22 40.70 498.50 12.25
11 Watermelon NA NA Not available 16.60 233.50 14.07 16.55 233.40 14.10
12 Ol NA NA Not available 13.40 216.66 16.17 13.70 222.66 16.25
13 Kachu NA NA Not available 19.86 344.56 17.35 20.00 348.00 17.40
14 Others NA NA Not available 168.72 600.26 3.56 170.30 613.33 3.60
961.35 13875.51 14.43 968.05 14014.95 14.47Total West Bengal:
Sl.
No.
Name of the
Vegetables
2011-12 2012-13 2013-14
Main Vegetables
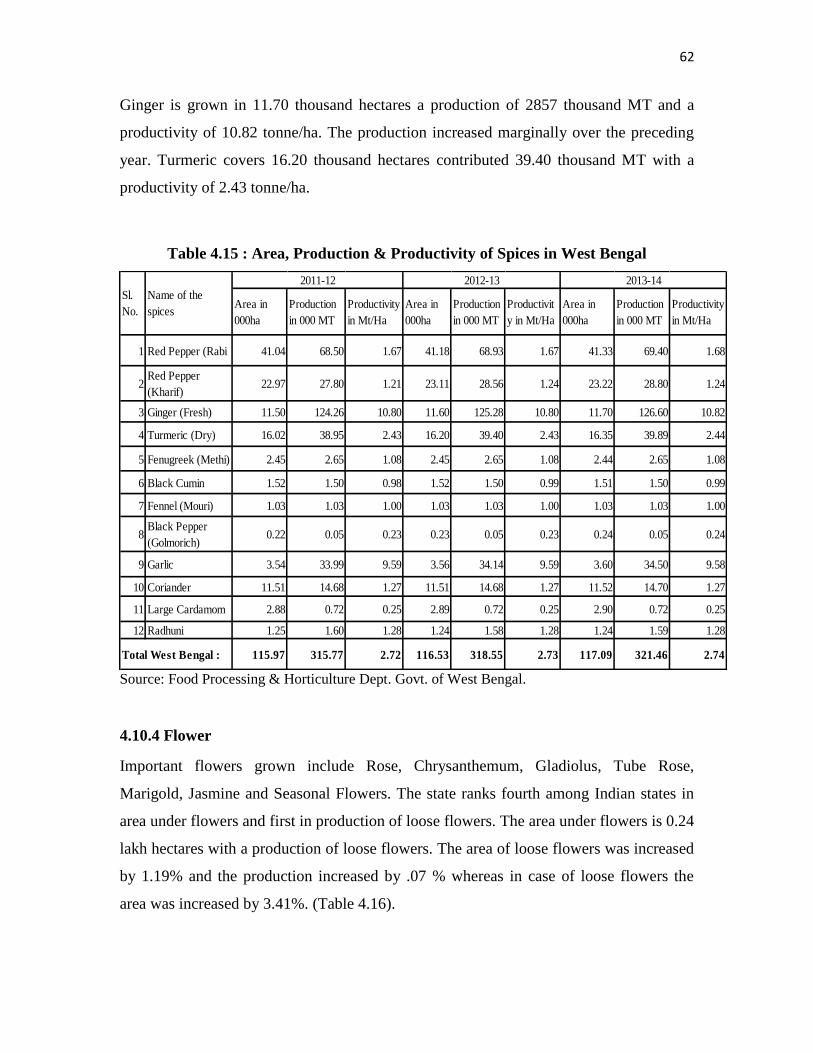
62
Ginger is grown in 11.70 thousand hectares a production of 2857 thousand MT and a
productivity of 10.82 tonne/ha. The production increased marginally over the preceding
year. Turmeric covers 16.20 thousand hectares contributed 39.40 thousand MT with a
productivity of 2.43 tonne/ha.
Table 4.15 : Area, Production & Productivity of Spices in West Bengal
Source: Food Processing & Horticulture Dept. Govt. of West Bengal.
4.10.4 Flower
Important flowers grown include Rose, Chrysanthemum, Gladiolus, Tube Rose,
Marigold, Jasmine and Seasonal Flowers. The state ranks fourth among Indian states in
area under flowers and first in production of loose flowers. The area under flowers is 0.24
lakh hectares with a production of loose flowers. The area of loose flowers was increased
by 1.19% and the production increased by .07 % whereas in case of loose flowers the
area was increased by 3.41%. (Table 4.16).
Area in
000ha
Production
in 000 MT
Productivity
in Mt/Ha
Area in
000ha
Production
in 000 MT
Productivit
y in Mt/Ha
Area in
000ha
Production
in 000 MT
Productivity
in Mt/Ha
1 Red Pepper (Rabi 41.04 68.50 1.67 41.18 68.93 1.67 41.33 69.40 1.68
2Red Pepper
(Kharif)22.97 27.80 1.21 23.11 28.56 1.24 23.22 28.80 1.24
3 Ginger (Fresh) 11.50 124.26 10.80 11.60 125.28 10.80 11.70 126.60 10.82
4 Turmeric (Dry) 16.02 38.95 2.43 16.20 39.40 2.43 16.35 39.89 2.44
5 Fenugreek (Methi) 2.45 2.65 1.08 2.45 2.65 1.08 2.44 2.65 1.08
6 Black Cumin 1.52 1.50 0.98 1.52 1.50 0.99 1.51 1.50 0.99
7 Fennel (Mouri) 1.03 1.03 1.00 1.03 1.03 1.00 1.03 1.03 1.00
8Black Pepper
(Golmorich)0.22 0.05 0.23 0.23 0.05 0.23 0.24 0.05 0.24
9 Garlic 3.54 33.99 9.59 3.56 34.14 9.59 3.60 34.50 9.58
10 Coriander 11.51 14.68 1.27 11.51 14.68 1.27 11.52 14.70 1.27
11 Large Cardamom 2.88 0.72 0.25 2.89 0.72 0.25 2.90 0.72 0.25
12 Radhuni 1.25 1.60 1.28 1.24 1.58 1.28 1.24 1.59 1.28
115.97 315.77 2.72 116.53 318.55 2.73 117.09 321.46 2.74
Sl.
No.
Name of the
spices
2011-12 2012-13 2013-14
Total West Bengal :

63
Table 4.16: Area, Production & Productivity of Flowers in West Bengal
Source: Food Processing & Horticulture Deptt. Govt. of West Bengal.
4.10.5 Plantation Crops
Plantation crops excluding tea, includes coconut, arecanut, betel vine and cashew nut.
The area of plantation crops is 0.72 lakh hectares. Coconut occupies maximum area of 29
lakh hectares with a production of 3709.00 lakh nuts in 2013-14. The area, production &
productivity of plantation crops in West Bengal is given in Table 4.17.
Table 4.17: Area, Production & Productivity of Plantation Crops in West Bengal
Source: Food Processing & Horticulture Dept. Govt. of West Bengal.
Sl.
No.Name of Flower
Area in
000ha
Cut
Flower(Produc
tion in Crore
Sticks)
Productivity
in Lakh
Sticks/Ha
Area in
000ha
Cut
Flower(Pro
duction in
Crore
Sticks)
Productivity
in Lakh
Sticks/Ha
Area in
000ha
Cut
Flower(Prod
uction in
Crore Sticks)
Productivity
in Lakh
Sticks/Ha
1 Rose 1.68 77.64 4.6 1.72 79.36 4.6 1.73 81.7 4.72
2 Chrysanthemum 0.52 14.04 2.7 0.5 13.35 2.67 0.51 13.92 2.72
3 Gladiolus 2.61 39.16 1.5 2.65 39.7 1.49 2.71 40.64 1.49
4 Tuberose 4.98 118.16 2.37 5.16 121.87 2.35 5.29 125.07 2.36
Total 9.801 249.01 2.54 10.04 254.29 2.53 10.25 261.35 2.55
Name of FlowerArea in
000ha
Loose
Flower(Produc
tion in 000
MT)
Productivity
in Mt/Ha
Area in
000ha
Loose
Flower(Pro
duction in
000 MT)
Productivity
in Mt/Ha
Area in
000ha
Loose
Flower(Prod
uction in
000 MT)
Productivity
in Mt/Ha
5 Marigold 6.17 52.07 8.43 6.33 53.42 8.43 6.49 54.86 8.44
6 Jasmine 0.46 0.64 1.38 0.45 0.63 1.37 0.45 0.63 1.38
7 Seasonal flowers 4.68 7.84 1.67 4.74 7.82 1.64 4.75 7.71 1.62
8 Misc. Flowers 2.77 3.35 1.2 2.82 3.36 1.18 2.89 3.29 1.13
Total 14.1 63.9 4.53 14.36 65.23 4.54 14.6 66.5 4.55
Total West Bengal 23.9 24.41 24.85
2011-12 2012-13 2013-14
Area in
000ha
Production in
000 MT
Productivity
in Mt/Ha
Area in
000ha
Production
in 000 MT
Productivity
in Mt/Ha
Area in
000ha
Production
in 000 MT
Productivity
in Mt/Ha
1 Coconut 29.133675.00
(Lakh nuts)
12615(no.
Nuts/Ha)29.2
3693.81(L
akh nuts)
12650(no.
Nuts/ha)29.30
3709.00(L
akh nuts)
12659(no.
Nuts/ha)
2 Areacanut 11.45 21.80 1.90 11.46 21.89 1.91 11.47 22.20 1.935
3 Betelvine 19.21149.00(Lakh
motes)
775.31
Motes/ha19.32
150.00(La
kh motes
776.39
Motes/ha19.40
150.94(La
kh motes)
778.041
Motes/ha
4 Cashew nut 12.20 10.80 0.885 12.25 10.84 0.885 12.30 11.00 0.894
71.99 72.23 72.47
Sl.
No
Name of
the
plantation
crops
2011-12 2012-13 2013-14
Total West

64
Betel vine which is cultivated in 0.19 lakh hectares provides livelihood to a large
number of small and marginal farmers.14370 MT (2012-13). The area and production
details under the broad categories of plantation and horticulture sector in West Bengal are
furnished in Table 4.18.
Table 4.18: Area and Production of different horticulture produce during 2013-14
West Bengal Area ( ‘000 ha) Production ( ‘000 MT)
Fruit 223.50 2909.71
Vegetables ( Excl. Potato) 968.05 14014.95
Potato 413.00 9049.90
Spices 117.09 321.46
Plantation crops 72.47 -
Flower- Loose 14.60 66.50
Cut 261.35 (crore sticks)
Total 1705.20 29664.15 Source: State Horticulture & F P I Dept., Govt. of W.B.
The crop wise area and production details furnished in Tables 4.13 to 4.17
indicate that the area under all the major horticulture crops in the state has increased over
the period (2013 to 2014) at varying levels mainly on account of bringing cultivable
waste lands under perennial horticulture crops and also adoption of crop diversification to
more remunerative vegetables and flower crops.
4.10.6 Projected Requirement of fruits and Vegetables
The per capita consumption of fruits and vegetables in the country including in the State
of West Bengal, is less than 200 grams/day against the recommended norm of 350 grams
inadequate production, transport and distribution bottlenecks associated with perishable
produce are major contributing reasons for low level of consumption. This apart,
predominantly cereal based food consumption habit in the country is also considered a
major reason. This is amply explained from the fact that in West Bengal with a
population of 9.37 (census 2011), the total production of vegetables including potato in
2012-13 was 230.95 lakh tonne. Considering 20 per cent wastage, another 20 per cent for
outside state trading and seeds and 10 per cent for processing and exports around 50 per
cent of production i.e.115.47 lakh tonnes were available for consumption. This works
out 335 g per head per day. Similarly consumption of fruits comes to 85 g per head per
day. But consumption of vegetables in West Bengal is only 125 g (50th National Sample

65
Survey Bulletin No. 402). One consequence of this trend is the high pressure on food
grains. It is difficult to cope up with the rising demand of the food grains but the pressure
can be offloaded by supplementing with vegetables. This approach is also crucial for
ensuring nutritional security and addressing the endemic problem of mal-nutrition. Since
the pressure on land is high and scope for area expansion is limited as in the case of food
crops, the emphasis should be more on vertical integration through productivity
enhancement measures. Keeping in view the expected population growth, the
requirements of fruits and vegetables in the state are projected in the Table 4.19
Table 4.19: Projected Requirement of Fruits and Vegetables
(R – Requirement; P (Act.) – Production (Actual); P (Tar.) – Production (Target)
The above data suggests a widening gap between consumption needs and likely
production highlighting the opportunities available for increased production, which inter
alia calls for an integrated approach including convergence of various development
programs under implementation in the State. A table on district wise major horticultural
crops grown and scope for expansion is presented in Appendix 12.
4.11 Agro Processing
West Bengal experiences hot and humid weather, which are highly hazardous from Post-
Harvest Technology (PHT) angle. In humid weather, drying of farm produce to safe
moisture levels (cereals to about 12%, pulses 10% and oil seed 8%) becomes difficult
without crop dryers. Clean, graded and dry produce obtained by use of dryers, cleaners
and graders, always fetch high price. Excessive post-harvest loss is a serious concern for
the country. Food grain losses are estimated at 10-12%, fruits and vegetables 20-40%.
Market price being affected by demand and supply, the price of farm produce are low
during harvest season, when arrival is high. With proper on-farm storages and off season
sale farmers can have greater net returns from their produce and by product.
Required Availability
gm/ day gm/ day
R P(Tar.) R P (Tar.) R P (Tar) R P(Tar)
Fruits 60.00 51.00 5620.00 2909.00 5693.00 3091.68 5767.00 3285.84 5842.00 3492.19
Vegetables 250.00 125.00 234185.00 14014.95 237227.50 14781.57 240310.00 15590.12 243432.50 16442.89
Population (Projection)
(in lakhs)
936.74 948.91 961.24 973.73
Particulars
Per capita Requirement and Production in thousand tones
2013-14 2014-15 2015-16 2016-17

66
West Bengal is a major producer of food grains, especially rice. The state is
also the major producer of many other commodities. Some of these are as follows:
Largest producer of Rice, Pineapple, Vegetables in the country.
Second largest producer of Potato and Litchi.
Ranked first in meat production (including poultry) in the country.
West Bengal is also one of the leading states in pisciculture and supplies nearly 80%
of the fish seed demand of the country.
Ranks third in India in flower production.
Significant producer of mango, mandarin orange, and sapota.
Grows 145 different varieties of medicinal plants and herbs.
Grows substantial quantities of spices, coconut, cashew nut, arecanut, betelvine, etc.
Being a surplus production state for both perishable and non-perishable
agricultural commodities, adequate storage infrastructure is of paramount importance.
Already 459 cold storage units with a combined capacity of 76 lakh MT, of which 54.45
lakh MT storage capacity is exclusively for storage of potato (400 potato cold storage
units and 59 multipurpose cold storages) are operating in the state. The wide gap in the
available storage infrastructure vis-à-vis the requirement offer an opportunity for both
public and private sector investment in creating post- harvest infrastructure for
agriculture produce.
The state govt. has identified six crop specific agri-export zones viz. Malda
(mango), Siliguri (Pine apple), Hooghly (potato), North 24 Parganas (vegetable), Malda
(Litchi) and Darjeeling (tea) to give target oriented boost to the production of such crops
in which the state has natural advantages. Twelve food parks are currently being set up in
the state. Pack houses with multipurpose cold storages facilities also have come up. Post-
harvest management system and cold chain infrastructure is being developed under the
National Horticulture Mission.
4.12 Soil Conservation
Soil and water conservation programmes have been undertaken to bring more area under
cultivation by development of cultivable waste lands into usable land by intercepting and
inducing larger and extensive insitu absorption of rain water into the soil profile as well
as trap eroded materials through appropriate soil and water conservation measures. Large
scale programmes are being undertaken to maximize the water storage capacity of

67
existing surface water bodies/canals through re-excavation of partially silted up
tanks/farm ponds surface water bodies/water harvesting structures etc. for life saving
irrigation to crops during post rainy season and also for development of fisheries.
In the context of soil and water conservation, most vulnerable areas are the
lateritic tracts of western districts (Purulia, Bankura, Birbhum and Paschim Medinipur),
the hilly areas of Darjeeling district, coarse sandy areas of Tarai region in Jalpaiguri,
Coochbehar, Darjeeling districts and coastal saline zone comprising of 24-Parganas
(North) and 24-Parganas (South) districts. Out of the total 88.752 lakh ha (TGA) in West
Bengal, nearly 25% is affected by different problems associated with land degradation.
Development of this area is possible through soil and water conservation measures by
adopting watershed approach.
4.12.1 Watershed Development
Department of land resources, Govt. of India is implementing Integrated Watershed
Management Programme (IWMP) since 2009-10. The objectives of IWMP are
harnessing, conserving and developing degraded natural resources such as soil, water and
vegetative cover, prevention of soil runoff, rain water harvesting and recharging of
ground water table; increasing the productivity of crops; introduction of multi cropping
and diverse agro-based activities; promoting sustainable livelihoods and increasing the
livelihood income. Soil and water conservation projects are mostly demand driven and
location specific and are undertaken with the active involvement and cooperation of
beneficiaries. The status of IWMP in West Bengal is given in Appendix 13 and 14.
NABARD is implementing watershed development through a fund called
“Watershed Development Fund (WDF)”. One of the unique features of WDF in West
Bengal is that many of the Project Implementing Agencies (PIAs) are Panchayat Samities
and the role of NGOs is to facilitate the programme by mobilizing the people. A total of
28129 ha under 38 watershed projects, covered so far. The State Government has
initiated measures towards focused emphasis on Watershed Development to bring the
degraded lands into farming. The extent of wasteland available for treatment under
watershed development programme is presented in Table 2.2.

68
4.12.2 Rain water harvesting
One of the reasons or the poor utilization of rain water is high concentration of rainfall
(76%) during south west monsoon period June-September. Uneven distribution also
creates a situation of long dry periods when cropping is difficult if water is not retained or
made available in some other way. Harvesting rain water and making it available in the
dry season could have implication for agriculture and livelihood. Water harvesting ponds
are dug on farm lands to store rain water which can help meet both agricultural and
household needs. Historically, tanks are very much significant for rural life in general and
agricultural practices in particular in the West Bengal. Tanks had been considered a big
boon for the people, which harvested runoff and captured flood water for use in summer.
These ponds are used not only for agriculture but also livestock, domestic purpose and
fish culture. In the first half of the twentieth century, in a large part of West Bengal, tanks
were the primary source of irrigation. Tank irrigated area in West Bengal was about 27
percent during 1961-63. But it registered a decline thereafter and remained stationary at
around 14-15 percent in the past three decades.
Under ”Jol Dharo - Jol Bhoro” programme, special thrust is being given to
surface water utilization through implementation of large scale harvesting of rain water,
in all kinds of water bodies viz. ponds, reservoirs, canals and underground aquifers. From
May, 2011; 116630 water conservation and water harvesting structures have been created
out of which 83,889 have been completed in convergence with the programme under
MGNREGA. Mass awareness campaign of the programme has been continuing in the
State.
4.13. Impact of Climate Change
The challenge of climate change facing agriculture needs to be taken seriously. This may
result in great threat to food security (due to decreasing crop, fish and meat yields) and
the loss of habitat due to rising sea level, particularly in the coastal region. A distinct
trend towards both drier and warmer weather during the last 60 years is shown in
Appendix 15. Table 4.20 shows the rainfall pattern in different regions of West Bengal
and their departure from the normal. Long term weather data analysis indicates that the
trend in departure is on increase.

69
Table 4.20 Rainfall Analysis (mm.) for the year 2011 – 2013
Source: Data collected from the Indian Meteorological department, Figures in parenthesis () indicates %
departure from normal.
Rainfall in context of agriculture in West Bengal has traditionally been important
in terms of the monsoon (that is, June– September) since Kharif rice (Aman) is the most
important crop in almost all the districts. Change in cropping pattern would be necessary
as a measure of adaptation to climate change. The present dominance of Aman rice
cultivation may be reduced or its usual season of transplanting may need a shift according
to the changing rainfall pattern. It is noteworthy that each of the last three Plan periods
had recorded lower mean rainfall and higher rainfall variability compared to the
immediately previous period. The last three years of 11th plan (2008, 2009 and 2011) had
annual rainfall below 95 per cent of long period average, as compared to only five years
in the previous 15 years.
Temperature conditions have deteriorated even more. Periods prior to 1997 can be
considered normal, but warming has increased at an accelerating pace since then. The
Eleventh Plan period contained the two warmest years (2010 and 2009) ever recorded
since 1900. Even the coolest year (2008) during these five years was the thirteenth
warmest in the last 110 years. The rise in temperature will have profound negative impact
on yield of crops, particularly those of thermos sensitive ones. It is predicted that
production of most of the food crops will decrease due to increase in temperature. There
2011 2012 2013 2011 2012 2013 2011 2012 2013 2011 2012 2013
425 552 405 610 641 531 454 279 421 74 211 229
(-6) (22) (-11) (-4) (1) (-16) (-1) (-39) (-8) (-67) (-5) (4)
374 139 229 229 303 239 427 225 377 127 173 100
(46) (-46) (-10) (-28) (-5) (-25) (37) (-28) (21) (-6) (28) (-27)
391 277 288 356 416 336 436 243 392 109 186 143
(21) (-14) (-11) (-16) (-2) (-21) (21) (-33) (9) (-34) (13) (-13)
Gangetic West
Bengal256 318 311 135
West Bengal 322 425 360 164
Actual (% departure)Normal
Actual (% departure)
Sub-
Himalayan
West Bengal
454 635 458 221
Region
June July August September
NormalActual (% departure)
NormalActual (% departure)
Normal

70
may be early or late flowering or irregular flowering of many crops/ varieties and
consequently, poor yield. There may be considerable impact on population of microbes of
microbes, pathogens and insects which may result in more infestation of crops by
diseases and pests and deterioration of soil quality. Increase in temperature will increase
fertilizer requirement for the same target yield. To combat the change of climate a new
technology of rice cultivation namely, “System of assured rice production (SARP)” have
been developed by the Research wing of the Directorate of Agriculture, Govt. of West
Bengal. Adopting this method farmers can easily escape the early drought and late flood
situation by transplanting as old as 60 days old seedlings with a minimum seed rate of 10
kg /ha without hampering the normal yield.
According to IPCC (International Panel on Climate Change) a rise in global
temperature beyond 2.0°C is likely to have severe impact on agriculture, livelihood and
environmental systems as a whole. The different adaptation strategies may be adopted for
meeting and mitigation of climate change are:
(i) Developing suitable crop varieties adapt the climate change variabilities,
(ii) Adjusting crop sowing time. This is particularly true for Aman rice due to shift of
monsoon rains,
(iii) Integrated management of pests and diseases,
(iv) On farm harvesting of rain water.
(v) Improving soil organic matter status with increased use of vermin-compost,
organic manures, green manuring, integrated nutrient management, etc.,
(vi) Integrated farming system,
(vii) Practicing Agro-forestry and social forestry etc.
(viii) Using wastewater. This is very important because of the fact that more than 80%
of the total use of water is consumed by agriculture.
Alternative techniques must be developed to produce more food with less water.
Rainwater harvesting, use of waste water, multiple use of water, precision irrigation are
some of the options.

71
4.13.1 Climate Change Adaptation Activities in West Bengal
West Bengal having a long sea coast in the south, Himalayan Mountains in the north and
drought prone areas in the West is one of the most vulnerable state in India to face the
climate change impacts. About 68% of its population resides in the rural areas drawing
their livelihood from the state’s natural resource base, by pursuing agriculture,
horticulture, animal husbandry, fisheries and by harvesting forest products. As the natural
systems are all linked to climate, any change in climate is likely to disturb the efficiency
of production of these systems, thereby impacting the associated economy. The impact of
climate change is palpable in West Bengal and can be very well observed in the hilly
areas of Darjeeling, Coastal region of Sundarbans, major drought prone districts like
Bankura, Purulia and West Midnapur.
Strategy of Govt. of West Bengal to mitigate impact of climate Change
The Govt. of West Bengal has come out with the strategy to address the climate change
in the state which focuses on 10 sectors like Water, Agriculture and allied activities,
Health, Forestry, Energy Efficiency, Non-Conventional Energy sources, Sundarbans,
Darjeeling Himalayas, Habitat and Institute for Climate change studies.
Water resource
Floods: About 42% of the state area is flood prone and is manifested across the state by
various modes. Floods can be due to excess water carried over from transnational and
inter state borders. For example, floods are caused in north Bengal, by flood waters
received through rivers Teesta, Torsa, Jaldhaka, Raidak from Sikkim and Bhutan. In
Uttar and Dakshin Dinajpur by flood waters in rivers passing through these two districts
and originating in Bangladesh. In Malda by flood waters received through Mahananda
from Nepal, and through Ganga which carries flood water from about 11 States in India.
Extreme rainfall, relating to late monsoon cloud bursts also lead to floods. The
infrastructures such as roads and railways with inadequate culverts intercept cause
expansion of floods. Poor drainage is also a cause due which the flood spreads.

72
Also floods are caused by storm surges resulting from cyclones and sea level rise. The
recent damages caused by the Cyclone Aila, has established, that the southern Coastal
region of West Bengal, covering the southern part of South 24 Parganas district, is
extremely vulnerable to storm surges and cyclones. The soil in this region has become
saline due to this event even upto a distance of 40 km from Kolkata and drinking water
became contaminated with sea water. Additionally, the sea level rising in some areas of
the coast at a much higher rate than the others is also a cause of inundation.
Droughts: Every summer many parts of Purulia, Bankura, Paschim Medinipur, and
Birbhum (covering the south-western part of the state) suffer water shortage with respect
to the entire state. The tradition of storage of water in ponds has slowly being forgotten.
The governments efforts to supply water for drinking and irrigation is dependent on the
reservoirs of Damodar valley Project, namely, Massanjore and Kansaboti. The storage
capacity of these reservoirs have reduced over the years, mainly due to siltation rendering
the region bereft of adequate water during summers. Also introduction of water intensive
crops in the region has lead to higher crop failures making the region and its people
vulnerable.
Landslides: Incessant rains and at times cyclones lead to land slides in North Bengal.
Case in point is the impact of the latest super cyclone Aila in 2009. Water supply in these
regions was affected severely during this event.
Water Pollution: The increasing exploitation of ground water exceeding replenishable
limits has been causing irreparable damage and leading to arsenic and fluoride
contamination in the eastern and western parts of West Bengal respectively. The arsenic
in ground water is spread over 81 blocks belonging to eight districts and about 225
villages in 43 blocks of 7 districts have been found to contain fluoride in ground water.
Depletion of ground water is causing desiccation of rivers during non-monsoon months,
as the capacity for effluent seepage towards the river is reduced. Over dependence on
ground water has lead to the decay of tradition of practicing lift irrigation. Further,
inundation of land by sea water is causing salinity of water for drinking as well as
agriculture.

73
Agriculture crops
Judicious use water and enhancing water use efficiency
Region specific key concerns due to changing climate in West Bengal for Agriculture
Crops is given below.
Zones Concerns
Hill Zone
Decline in size and quality of citrus such as mandarin orange due to rising
minimum temperature during flowering of citrus trees.
Increase in runoff from enhanced intensity of rainfall leading to erosion and
landslides.
Reduced productivity of Darjeeling tea due to increase in extended drought
periods.
Increase in winter temperature effecting potato and wheat.
Degradation of seed quality.
Terai
Zone
Long winter periods conducive to wheat production in this region, but
increase in winter temperatures reducing wheat yields.
Degradation of quality seeds.
Nutrient loss by enhanced leaching.
Long span of winter is an advantageous which can be exploited.
Old
Alluvial
Zone
Drying of natural water bodies due to extensive use of water for
irrigation as the surface run off reduces
Excessive underground water extraction as demand exceeds availability
which is over and above the receipt of rainfall, and available surface
runoff
Rice productivity at stake due to water stress in future
Wheat productivity has decreased due to shorter winters
Temperatures in excess of 45-46 degree C in summers is impacting
productivity of oilseeds and pulses
Also excess temperatures affecting livestock productivity
Increase in pests and disease due to increase in foggy days affecting
pulses

74
Degradation of quality seeds
New
Alluvial
Zone
Reduced availability of water has reduced the production on boro rice
Jute also requires intermittent irrigation, reduced amount of water
availability may affect jute production
As jute crop requires humid climate with temperature fluctuating between 24
and 38 degree C, any increase in temperature may effect jute productivity.
Further, as new grey alluvial soil of good depth receiving silt from annual
floods is most suitable for jute growth, any increase in rainfall intensity in
this region, is likely to remove the alluvial silt deposition, affecting jute
productivity.
Degradation of quality seeds.
Decreasing potato yield with increasing winter temperature.
Red and
Laterite
Zone
Rainfall inherently scanty in this zone as compared to other agro climatic
zones in West Bengal and is reducing further.
Also temperature, both maximum and minimum, are rising.
Agriculture mainly rain fed, only 27% of the land area is irrigated.
Soil is poor in nutrient content and likely to become drier.
Degradation of quality seeds.
Saline
Coastal
zone
Intrusion of saline water into the agricultural land resulting in loss of yields
and greater risk to the farmer. After Aila, enhanced salinity in soil was tested
up to 40 km from Kolkata.
Natural salinity of the soil is increasing due to recurrent intrusion of sea
water, resulting in loss of agricultural land and making people migrate.
Longer span of summer increased insect and pest attacks on crops.
The delayed winter has hampered the cultivation of winter crops.
The intrusion of saline water causes severe stress on availability of drinking
water.
Increasing humidity leads to incremental phenomenon of vector borne
diseases.
Degradation of quality seeds.

75
Fisheries
Seed availability: It has been observed that with increase in temperature there is a
decrease in fish pawning and hence decrease in fish seed availability
Growth of Fish: Temperature changes will have an impact on the suitability of species
for a given location. In temperate areas increasing temperatures could bring the
advantages of faster growth rates and longer growing seasons. Similarly for the Indian
Major Carps the growth rate increases upto 33ºC but from 34ºC and above feeding is
reduced and growth diminishes. This simple growth model provides a reliable projection
of growth (SGR %) with unit rise of temperature within the range of 29º to 34ºC.
Assuming these growth rates are constant, it would take average 77 days for a fish to
double its weight at 30ºC to 33ºC and 35ºC, but at 34 ºC it would take only 35-36 days.
Enhanced breeding period of fish : Elevated temperature range (0.37ºC–0.67ºC) and
alteration in the pattern of monsoon proved a major factor for shifting the breeding period
of Indian major carps from June to March in fish hatcheries of West Bengal.
Investigations conducted indicate an extended breeding period of Indian major carps by
40-60 days, with breeding season extending from 110-120 days (Pre1980-85) to 160-165
days (2000-2009) at present in fifty fish seed hatcheries in four districts of West Bengal,
India viz. North 24 Parganas, Bankura, Burdwan & Hooghly. This has provided
opportunities to the farmers to avail of the extended breeding period in producing
valuable fish seed and supplement their income.
Geographical shift of fishes: A perceptible shift was observed in geographic distribution
of the warm water fish species, Glossogobius giuris, Puntius ticto, Xenentodon cancila
and Mystus vittatus towards the colder stretch of the river Ganga up to Haridwar with an
enhancement of annual mean minimum water temperature of 1.5ºC in the Haridwar
stretch during the period 1970-86 to 1987-2009. This stretch has become a congenial
habitat for these warm water fishes of the middle stretch of the river. As a result fishers
would have an enhanced yield and diversity in their fish catch from the stretch.

76
Drought condition prevailing in West Bengal during 2009 had impacted fisheries. District
of North 24 Parganas rainfall was deficient by 29%, Bankura by 27%, Burdwan by 23%
and Hooghly by 34% in the fish breeding months of March to September.
92% of the fish seed hatcheries have been affected by the deficit rainfall and increasing
trend of temperature in the state. That results indicate about 61% and 73% loss of fish
seed in North 24 Parganas and Bankura, respectively during 2009 compared to the
previous four years.
The cyclone Aila affected loss to fishing equipments and aquaculture enterprises.
Freshwater fishes in ponds were rendered ineffective due to salinity rise.
The vulnerability index for the fisheries sector of West Bengal indicates that fisheries
activity is more susceptible to climate change (Table 3). Studies on inland fisheries
(Central Inland Fisheries Research Institute report, ICAR- NPCC Annual Report 2009-
10) indicated that drought in West Bengal during 2009 affected 92% of the fish seed
hatcheries due to deficit rainfall and high temperature in the state. Freshwater ponds
became unusable due to salinity rise because of cyclone.
The vulnerability index for the fisheries sector of West Bengal indicates that fisheries
activity is more susceptible to climate change. Studies on inland fisheries indicated that
drought in West Bengal during 2009 affected 92% of the fish seed hatcheries due to
deficit rainfall and high temperature in the state. Freshwater ponds became unusable due
to salinity rise because of cyclone.
For the fisheries and aquaculture sector, climate change notwithstanding, there are
several issues to be addressed. Strategies to promote sustainability and improve the
supplies should be in place before the threat of climate change assumes greater
proportion. In the fisheries sector proper adaptive measures needs to be taken to combat
climate change.
Horticulture Crops
A rise in a temperature of above 1ºC may shift a major area of potential suitable
zones for various horticultural crops. Studies shown that many suitable areas of

77
spices will become marginally suitable or new areas, which are presently
unsuitable, become highly suitable for cultivation of spices. This holds good to a
variety of horticultural crops, such as citrus fruits, medicinal plants grown in hilly
zone of West Bengal.
Production timing is likely to change. Because of rise in temperature, crops will
develop more rapidly and mature earlier. For example, citrus, grape, melons and
mango will mature earlier by about 15 days.
While temperature rises, photoperiods may not show much variation. Onions, a
photosensitive cop, will mature faster leading to small bulb size. Strawberries will
have more runners at the expense of fruits.
As the winter regime and chilling duration reduce in temperate regions, they will
affect the temperate crops.
The faster maturity and higher temperature induced ripening will make the
produce, especially fruits to have less storage period in trees/ plants. They will
overripe.
Pollination will be affected adversely because of higher temperature. Floral
abortions will occur.
Soil temperature will increase much earlier in spring hence the planting time also
will advance. This can be catastrophic if late frosts occur.
The requirement of annual irrigation will increase, not only because of higher
evaporation, but also because the trees develop more fasters during the 12 month
period. Heat units required will be achieved in much lesser time.
Higher temperature will reduce tuber initiation process in potato, reduced quality
in tomatoes and poor pollination in many crops. In case of crucifers, it may lead
to bolting; anthocyanin production may be affected in apples and capsicum.
Specific chilling requirements of pome and stone fruits will be affected hence
dormancy breaking will be earlier. Tip burn and blossom end rot will be common
in tomatoes.
Soil conditions may pose problems with an increase in acidity, alkalinity and
salinity are expected. Coastal regions can expect much faster percolation of sea
water in inland water tables causing more salinity.
78
Animal Resources
Livestock Productivity: The Temperature Humidity Index (THI) relates animal stress
with temperature and humidity. Livestocks are comfortable at THI between 65 and 72,
under mild stress when THI is between72 to 78 and under severe stress when it is above
80. The livestock in West Bengal is already experiencing medium to high stress levels.
Increase in temperature levels in the future may make the entire West Bengal region with
THI > 80.
Impact on production systems: There is normally a decrease in milk production for
animals under heat stress. This decrease can be either transitory or longer term depending
on the length and severity of heat stress. These decreases in milk production can range
from 10 to >25%. It has been estimated that with a temperature rise of 1.0 or 1.2°C with
minor change in precipitation during March – August, milk productivity is likely to be
marginally affected and during other months productivity will remain relatively
unaffected. The negative impact of temperature rise on total milk production for India has
been estimated about 1.6 million tonnes in 2020 and more than 15 million tonnes in 2050.
4.13.2. NABARD’s Initiatives to Reduce the Impact of Climate Change
NABARD has been accredited by the Adaptation Fund Board of UNFCCC as the
National Implementing Entity (NIE). The NIEs will bear full responsibility for the overall
management of the projects and programmes financed by the Adaptation Fund and will
bear all financial, monitoring, and reporting responsibilities. The first project on
“Enhancing Adaptive Capacity and Increasing Resilience of Small and Marginal
Farmers in Purulia and Bankura Districts of West Bengal (Executing Entity: DRCSC)”
involving grant assistance of `13.886 Crore was sanctioned by Adaptation Fund Board in
2014-15. The project aims at developing climate adaptive and resilient livelihood systems
through diversification, technology adoption and natural resource management for small
and marginal farmers in Lateritic Zone of West Bengal.
Climate Proofing of Watershed Projects
Climate proofing of Watershed Project is one of the major interventions for improving
the resilience capacity of the farming community to cope up with Climate change

79
impacts. NABARD in collaboration with GIZ has developed a tool - Climate Proofing for
Development -to analyze whether intended benefits of investments and government
schemes or agricultural production levels which are threatened by the impacts of climate
change.
NRM Initiatives of NABARD
NABARD is implementing projects in Natural Resources Management sector such as
watershed development, sustainable livelihood for tribal communities, Umbrella
Programme for Natural Resources Management (UPNRM), promotion of Resource
Conservation Tillage Technology (RCTT), SRI, Organic farming etc. These programmes
/ projects involve not only regeneration of degraded envirnment but also the management
of needs of the human community in such a way that their demands match the resources
viz. land, water and vegetation available within that particular project area.
Tribal Development Fund
In West Bengal NABARD has supported 18985 tribal families to set up 18500 acres of
orchard in 8 districts under Integrated Tribal Development Programme called Wadi.
Under the projects, support is being provided for establishment of Horticulture crop
based orchard with fodder and fuel plants on the fringes, soil conservation measures,
water resources development apart from nonfarm sector activities like tailoring, sal leaf
plate making, farm sector activities like Vermicomposting SRI and animal husbandry
activities.
Watershed Development Fund
One of the major strategy of NABARD to promote Natural resource management and
climate adaptability is Watershed Approach. This approach involves soft interventions
like promoting people’s participation, people’s organisations like SHG and JLG, capacity
building, technology transfer, interventions like check dams, rainwater harvesting,
contour tranches, plantations etc., as part of soil water conservation. NABARD has
promoted 38 watersheds in the State of West Bengal on Ridge to Valley model covering
28129 ha. area in districts. The positive outcomes have been increased availability of
water, lesser soil erosion, increase in intensified cropping and diversification of
livelihoods. NABARD has also prepared Banking Plan for few of these Watersheds,

80
which could be taken up by Banks for financing.
Umbrella Programme for Natural Resource Management (UPNRM)
The programme was initiated by NABARD in partnership with KFW and GiZ of
Germany to further the cause of community based natural resource management. Under
the programme promotion of integrated farming of Large Cardamom, Dairy and
Vermicomposting units in Darjeeling district; Production of Handicraft products from
Mat grass in West Mednipur district; Assistance to livelihood activities in post watershed
areas in Bankura District and Production of bio-enriched vermi-compost units in
Coochbehar District were supported. It is established that a positive approach to
conservation of climate is to provide alternative livelihood options to rural people which
will reduce their exploitations of natural resources.
4.14 Crop Insurance
The “Modified National Agricultural Insurance scheme (MNAIS)” a component of
National crop insurance programme (NCIP) has been implemented in the state by
Agriculture Insurance Company of India (AICIL). The NAIS is available to all the
farmers, loanee and non-loanee, irrespective of size of their holding. The scheme covers
all food crops (cereals, millets and pulses) and oil seeds and Annual commercial/
horticultural crops. As per norm, 10% subsidy on premium is available to small &
marginal farmers for noncommercial crops (jute and potato are commercial crops),
farmers are to pay 90% of the premium, which is 2.5% of the total crop value, and the
Union and the state government are to equally share (5% each) the remaining 10% of the
premium. . The claims are automatically calculated based on shortfall in the current
season yield obtained from crop cutting experiments conducted by State Governments
under General Crops Estimation Survey (GCES) as compared to threshold yield and
settled through the rural banking network.
The Govt. of West Bengal declared that from Rabi 2011-12 farmers in West Bengal
would not require paying anything for crop insurance. West Bengal is the first and only
state in India that is contributing the entire farmers’ share in the premium for crop
insurance. Wheat, mustard, Boro paddy or dry variety paddy, linseed, sesame, rapeseed,

81
gram, masur (lentil) and tur are some crops being covered under the insurance
scheme. The insurance covers risks such as drought, flood, insect attack and plant
diseases, apart from manmade damages. All farmers, including tenant farmers,
sharecroppers and marginal farmers are covered under it. Earlier, in case of insurance for
noncommercial crops (jute and potato are commercial crops), farmers used to pay 90% of
the premium, which is 2.5% of the total crop value, and the Union and the state
government used to equally share (5% each) the remaining 10% of the premium. The
state is now bearing 95% of the premium for insuring noncommercial crops and the
Central government provides just 5% of it. From Rabi 1999-2000 to Rabi 2013-14 a total
of 12364000 farmers (total of Rabi and Kharif) in West Bengal have been covered
underNIAS.
(Source:—iGovernment Bureau; http://www.igovernment.in/news/34824/free-crop-
insurance-for-bengal-farmers-in-offing#sthash.3sZ6UYKU.dpuf

82
CHAPTER V
DEVELOPMENT IN ALLIED
SECTOR

83
5.1 Animal Resource Development
5.1.1 Overview of development
The West Bengal state has made significant developments in the animal husbandry.
Livestock sector contributing 2.18% of Net State Domestic
Products (SDP), and 12.74% of the Agriculture and allied
sector SDP (2013-14).
In the state, milk production increased by more
than four and half times during the last three and half
decades (10.64 lakh MT 1976-77 – 48.60 lakh MT in
2012-13), and further went up to 49.06 and 49.61 lakh MT
during 2013-14 and 2014-15 respectively. During the
same period, meat production enhanced by five times (1.29 lakh M.T to 6.48 lakh M.T.),
and was 6.50 and 6.57 lakh MT during 2013-14 and 2014-15 respectively. Similarly, egg
production increased by about seven times (676 million to 4707 million), and further
enhanced to 4746 and 4813 million in 2013-14 and 2014-15 respectively. However, the
per capita availability in the state during 2013-14 is 145g milk/day, 19 g meat/day, and
50eggs/year for the estimated population of 943.85 lakh as on 1st Oct.2013. The state
ranks 2nd in production of sheep and goat meat in the country. The wool production in the
state was 725 MT during 2013-14. Though there was moderate growth in production of
milk, meat and egg, the production level largely falls short of requirements (Table 5.1).
Table 5.1. Production and demand of major livestock products
Year Milk (lakh MT) Egg ( million ) Meat ( lakh MT)
Requirement Production Requirement Production Requirement Production
2011-12 60.60 46.60 9198 4337 10.07 6.11
2012-13 60.28 47.16 9327 4707 10.21 6.48
2013-14 62.13 49.06 9457 4746 10.35 6.50
Source: Animal Resources Development Department, Govt. of West Bengal & quoted in West Bengal
Economic Review 2014-15
With regard to breed upgradation of cattle, an animal breeding policy is in
operation in the state since 2002 with the creation of PBGSBS and introduction of
2013-14
(Production & Requirement)
• Milk 49.06 LMT (62.13
LMT)
• Meat 6.50 LMT (10.35
LMT)
• Egg 4746 M (9457 M)

84
‘Pranibandhus’ scheme is a success in this regard. The crossbred population is 12% of the
total cattle, and is 19% of the breedable females. The number of artificial insemination
(AI) greatly increased by more than three and half times during the last 12 years, and was
38.27 lakh in 2013-14.
In respect of feed and fodder, West Bengal is fodder deficient state mainly
because of paucity of land for growing fodder. In addition to this, availability of pasture
and grazing land is very limited in the state. Production of main ingredient of feed,
particularly maize, is much less and another important ingredient, soya bean is not grown
in the state. These are limitations for the growth of feed manufacturing units. The
availability of fodder in the state is 252.50lakh MT, which is about 40% of the
requirement.
The development of facilities in animal husbandry sector in the state is
substantial. The state possesses 110 State level Health Centre, 6612 Block Health
Centres and 3248 Gram Panchayat level Animal development Aid Centres, 5647 AI
centres, 3 Deep Frozen Semen Production Centres , and 3210 Paravets/ Pranibandhus at
village level. The available farms for animals and poultry birds in the state, are 5 for
cattle, 2 for sheep, 5 for goat, 14 for fodder, and 27 for poultry. The state has 5 dairies,
and 5 feed plants. There are two modern abattoirs, and 11 registered slaughter houses in
the state
5.1.2 Achievement during XIth Plan
i) Increasing milk production: In respect of target /expected outcome of 19% higher milk
production in XIth plan, 14.30% increase in production (46.60 lakh MT) was achieved in
XIth plan over that in 2007-08. Though, a short fall of 23.10% remained against the
demand.
ii) Increasing meat production: The meat production in the XIth plan enhanced by
18.87% (6.22 lakh MT) over Xth plan, but a gap of 39.22% in meat production remained
between the Xth and XIth Plan.
iii) Increasing egg production: The production in XIth increased by 1298 million
(42.17%) over Xth plan; though a 52.85% gap remained between production and demand.

85
iv) Breed improvement through AI: The total AI done doubled in the first year of XIth
plan (19.32 lakh in 2007-08 to 38.21 in 2012-13), the average AI done by Pranibandhus
was 875 nos. during the same period. Number of AI centres increased from 5529 in 2007-
08 to 5798 in 2012-13.
v) Calf born: The total calf born increased by 6.54 lakh (97.47% growth) at the first year
of XIIth plan compared to Ist year of the XIth plan.
vi) Veterinary services: The achievements during 2007-08 to 2012-13 were, increase in
treatment of animal and birds from 98.65 lakh to 13106 lakh, vaccination from 86.84 lakh
to 175.85 lakh, cases treated in health camp from 16.18lakh to 26.50 lakh, vaccination in
health camp from 21.63 lakh to 22.30lakh and production of vaccines and antigen from
19.66 lakh to 160.10 lakh.
vii) Fodder production: Fodder production also increased from 248 lakh tons to 252.50
lakh tons during 2013-14. Demonstration of Azolla (supplementary fodder) cultivation
was taken up in XIth plan under fodder development programme.
viii) Insurance coverage: The insurance coverage of animals enhanced by 15459 cases in
XIth plan, and 100% insurance claim was settled.
5.1.3 Gap Analysis
Dairy
Inadequate AI coverage of breedable animals: - Share of crossbreds in the total
cattle population is 12%, and that of crossbred breedable females is around 19%.
The breeding coverage is only 33% of the total cattle and buffalo population.
Indigenous cattle resources: Though cattle population is large, mostly there are
indigenous cattle with poor milk producing capacity (average 1.9 kg/day/animal).
In the last 3 years (2011-12 to 2013-14), average gap between demand and
production of milk in the state is 21.61% (Table 5.1) and 20.5% in 2014-15.
Shortage of feed and fodder: West Bengal is a fodder deficit State. Fodder
availability is only 252.50 lakh MT per annum against the requirement of around
650.19 lakh MT/year, thus accounting for 61.17 % deficit of fodder. Fodder is
grown in only 1.18% of the cultivable in the state compared to 4.6% of national

86
average. Moreover, pasture and grazing land is very less (0.77% of total land).
There is limitation in growth of feed plant in the state due to less / nonproduction
of major feed ingredients like maize/ soya bean.
Dominance of local vendors in milk marketing: Maximum amount of produced
milk is marketed by local vendors, while less than 2% milk is processed and
marketed by organized sector like cooperatives. There is need for milk route
development involving cooperative development along with required milk
procurement and testing equipments. Strengthening milk procurement with
adequate Bulk Milk Cooling Units.
Poultry sector
Shortage of egg - There is large gap (50.73% on an average in 2011-12 to 2013-
14) between requirement and demand of egg in the state, leading to import from
other states (Table 5.8). However, the gap during 2014-15 is 49.44%. Organized
poultry produce forms only 16% of the production. Productivity of majority of
the poultry birds (indigenous fowl and duck) is low (around 100 eggs /yr).
High Feed cost: Feed cost is very high (70%) in production. The growth of
intensive layer poultry production in the state faces problem like high investment
and less/non-availability of the main feed ingredients like maize, soya bean,
ground nut cake etc.
Insufficient production/ supply of day of chick, and fluctuation of chick cost.
Less developed duckery sector, and also quail farming.
Meat production
Shortage in meat production: The average gap between demand and production of
meat in the state during 2011-12 to 2013-14 is 37.68%. Considering the
production of 6.57 Lakh MT during 2014-15, the gap is 37.0%.
Poor productivity in animals: Average meat productivity in animal resources is
comparatively low (7 kg in goat, 7.7 kg in sheep, and 20.9 kg in pig).
Apart from these, better health management facilities, and capacity building of
farmers are needed in all the sectors of animal husbandry.

87
5.1.4 Achievement in the XIIth Plan (2012-14)
The achievement of Animal Resource Department is presented in Table 5.2.
Table 5.2 Achievements Animal Resources Development during 2012-14 of XII Plan
Item Unit 2012-13 2013-14 2014-15 (up
to Dec 2014)
Animal and poultry bird treatment
cases
Lakh 131.06 157.99 123.52
Vaccine and antigen production -do- 160.10 241.85 173.00
Vaccination done -do- 175.85 222.34 146.09
Health camp organised ‘000 no. 6.08 22.04 13.51
Chicks/ ducklings distributed Lakh - 60.65 25.51
(up to Feb.2015)
Employment generation -do- 24.58 25.27 -
AI done Lakh 38.21 38.27 29.73
Crossbred calves born -do- 13.25 13.19 8.76
Pranibandhu engaged (cumulative ) -do- 3178 3210 3206
Frozen semen straw produced No
(lakh)
- 35.88 26.51
Cross bred calves born through
embryo transfer technology
No - 30 12
Animal insured NO 17,390 60,758 49,875 Source: Animal Resources Development Department, Govt. of West Bengal as quoted in West
Bengal Economic Review, 2014-15
Total 241.85 lakh doses of animal and poultry bird vaccine was produced during 2013-14
against the target of 260.92 lakh doses accounting for 92.69% success. Financial
achievement in this regard was utilization of Rs 57.975 lakh against received amount of
Rs. 160.265 lakh.
Table 5.3: Financial and Physical Achievements of Paschim Banga Go Sampad
Bikash Sanstha (PBGSBS) during 2013-14
Sl
No
Scheme Fund
received
(Rs in
lakh)
Fund
utilized
(Rs in
lakh)
Target Major achievement
i) AI – 38.27lakh
ii) Crossbred
/up-graded calves
born- 13.19 lakh
iii) Frozen Semen
Straw production –
35.88lakh
iv) Calves born
through Embryo
Transfer -30 nos
1 National Project for
cattle and buffalo
development(100%
Central Share)
1171.36
900.00 i) AI -42.55lakh
ii) Crossbred /up-graded
calves born-14.44 lakh
iii) Frozen Semen Straw
production – 32.00lakh
iv) Calves born through
Embryo Transfer -30 nos

88
2. National dairy Plan
((100% Central
Share)
107.00 107.00 Strengthening of
infrastructure of Frozen
semen station, Haringhata
Work in progress
3 Livestock Insurance
(50% Central
Share)
400.00 312.22 Milch cattle and buffalo
insurance – 65,000
Milch cattle and
buffalo insurance –
60, 758
4 Bishesh Go-Sampad
Bikash Avijan
(RKVY)
1500.40 1500.40 i) Crossbred / upgraded
heifers taken under
scientific management-
2.50lakh
ii) Insurance of Heifer -
1.00 lakh
iii) Cattle feed distributed
to farmers – 13,000MT
iv) Organization of Heath
Camps -780 nos
v) Organization of
fertility camps-400nos
Crossbred /
upgraded heifers
taken under
scientific
management-
2.50lakh
ii) Insurance of
Heifer -1.03 lakh
iii) Cattle feed
distributed to
farmers –
10716.25MT
iv) Organization of
Heath Camps -779
nos
v) Organization of
fertility camps-
385nos
5 Software
development for
identification,
breeding
management and
performance for
augmentation of
milk production
36.81 36.81 SMS as well as Web
based Software
development in Breeding
management
Software
development
completed and
application rolled
out throughout of
the state
Source: Animal Resources Development Department, Govt. of West Bengal Annual
Administrative Report 2013-14
Major livestock products: The state produced 48.60, 49.06 and 33.50 lakh MT of milk
during 2012-13, 2013-14 and 2014-15 (up to Nov.14) respectively. The production of
meat during the same period was 6.48, 6.50 and 4.22 lakh MT respectively. The egg
production during the same period was 4707, 4746, and 3109 million eggs respectively.
The wool production was 722.43 MT in 2012-13 and 725.00 MT in 2013-14.
Dairy development: The WB Co-operative Milk Producers’ Federation LTD with 16
District Milk Union procured 237.10 - 285.40 TKPU (Thousand kg per day) during 2013-
Dec. 2014. The Metro Dairy Ltd sold 2.20 to 2.36 lakh litres milk and 10764 to 11999
litres ice-cream per day in the same period. In the case of Mother Dairy, the average daily

89
sale of liquid milk was 2.61 to 3.06 lakh litres of milk and 3577 to 3741 kg of milk
products per day during the same period. Milk production in Central Dairy and
Haringhata Dairy was 28.74 and 1.56 TLPD (Thousand Litres per Day), respectively,
while Haringhata Dairy produced 13.07 MT of ghee and 0.40MT of chocolate per year.
Table 5.4: Daily average and annual milk procurement from DCS /WDCS of the
Milk Unions during 2013-14
Milk Union /Unit Daily average milk
procurement (TKgPD)
Annual milk procurement
( Lakh Kg)
HIMUL( Darjeeling) 10.50 38.325
BHAGIRATHI( Murshidabad) 40.10 146.365
KISHAN( Nadia) 39.52 144.248
MIDNAPORE( Medinipur) 30.10 109.865
BARDHAMAN( Burdwan) 3.15 11.498
DAMODAR( Hooghly) 16.98 61.977
ICHHAMATI (North 24-Parganas) 14.51 52.961
HOWRAH( Howrah) 3.97 14.490
Source: Animal Resources Development Department, Govt. of West Bengal Annual
Administrative Report 2013-14
Animal feed: The total feed production was 33,408 MT in 2012-13 and 21,073 MT
during 2014-15(up to Dec.2014) (Table 5.5).
Table 5.5: Manufacture and marketing of feed during 2013-14
Plant Target ( MT) Achieved (MT) Achievement (%)
Kalyani 20,000 17,232 86.16
Salboni 15,000 10,494 69.96
Siliguri 2,500 1.446 57.84
Durgapur 3,000 2,417 80.56
Gazole 2,500 1,819 72.69
Meat products: The sale value of different meat (pork and pork product, chicken and
chicken product, and other meat and agricultural product) were Rs 199.56 lakh in the
year 2013-14 and Rs. 305.46 lakh in 2014-15(up to Jan.2015)

90
5.2 Fisheries
5.2.1 Overview of development
Fishery is a very important sector in West Bengal, as its contribution towards Net State
Domestic product (SDP) is 2.39% (2013-14), which is second after agriculture. In the
national scenario, the state contributes about 16.5% of fish production, 23.0 % of inland
fish production, and 40% of the fish seed production in the country.
Fish production has increased by more than
six times during the last three and half decades (2.34
lakh MT in 1977 to 14.90 lakh MT in 2012-13).
During 2014-15 production was 16.17 lakh MT, of
which 14.38 lakh MT was in inland sector and the rest
1.79 MT in marine sector (Table 5.6). The growth in
annual production during the last five years was
unstable with variation from -4.11 to +6.04% and there was deficit in production in
comparison to the demand. The state fish production accounts for 16.5 % of the total fish
production in the country, while its contribution in inland sector is about 23.0% of the
total inland fish production in the country.
Table 5.6 Production, growth rate and demand of fish in West Bengal
Year Inland Marine Total
production
(lakh ton)
Annual growth
rate (%)
Demand
(lakh ton)
Deficit
/surplus
2009-10 13.26 1.79 15.05 + 1.41 15.62 - 0.57
2010-11 12.46 1.97 14.43 - 4.11 15.85 - 1.42
2011-12 12.90 1.82 14.72 + 2.00 16.06 -1.34
2012-13 13.38 1.52 14.90 + 1.22 16.29 -1.39
2013-14 13.92 1.88 15.80 +6.04 16.51 -0.71
2014-15 14.38 1.79 16.17 +2.34 16.72 -0.55 Source: Hand Book of Fisheries Statistics, 2014-15
District-wise fish production: There is a trend of increase in fish production in inland
sector during the last five years except in the districts of Jalpaiguri, Murshidabhad, Nadia,
Howrah, Purulia, Bankura, and Paschim Medinipur (Fig.1). The decline in production in
2014-15
Fish production and
(Demand) 16.17 LT
(16.72 LT)
Fish seed production
16,717 Million

91
the last three districts viz. Purulia, Bankura, and Paschim Medinipur, which are in the
Red lateritic agro-climatic zone is correlated with less rainfall (departure from normal
rainfall, -11 to -34%) during South –West monsoon in the year 2011, 2012 and 2013,
coupled with low moisture holding capacity in soil. The fish production compared to
culture area, was in general less in Darjeeling (Siliguri), Jalpaiguri, Coochbehar, Malda,
South 24 Parganas and Bankura.
Source: Handbook of fisheries Statistics, 2013-14
Fig.5.1: District wise water area (ha) of all sources except river, khal/canal and
reservoir and inland fish production in MT in West Bengal
Fish productivity: The average fish productivity under FFDA Scheme has considerably
increased during the last five years (3,735 kg/ha in 2009-10 to 4,650 kg /ha in 2013-14)
due to adoption of improved culture technology and capacity building of the fish farmers.
Similarly, the productivity in brackish water sector covered by BFDA, has also enhanced
to the extent of 1305 kg /ha in 2011-12 to 1440 kg /ha in 2013-14 in the case of prawn,
and 1055kg/ha to 1280 kg/ha in the case of mullets during the same period. The shrimp
production increased from 86,895 MT in the year 2007-08 to 1,12,815 MT in 2013-14.

92
Fish seed production: The fish seed production has increased by about 24.26% during
the last five years, and is presently 16,717 million (2014-15) (Table 5.7), which is
highest, and accounts for about 40% of the total seed production in the country. With
respect to district-wise fish seed production trend in last four years ( Fig 2), only two
districts i.e. North 24-Parganas and Bankura produced on an average 53.21% of total
seed production in the state, followed by Nadia and Hooghly ( 19.23%); while in rest of
the districts seed production was much less, especially in North Bengal districts except
Dakshin Dinajpur. The fish seed production was lowest in Cooch Behar, followed by
Purulia, Birbhum, South 24-Pargans, Malda, respectively.
Table 5.7: Fish seed production (million) in West Bengal
Year Target Production
2009-10 14500 12566
2010-11 13000 13453
2011-12 13500 13846
2012-13 14500 15002
2013-14 15500 15890
2014-15 16000 16717
Source: Hand Book of Fisheries Statistics, 2014-15
Source : Handbook of Fisheries statistics, 2013-14
Fig. 5.2: Trend of district wise fish seed production in west Bengal
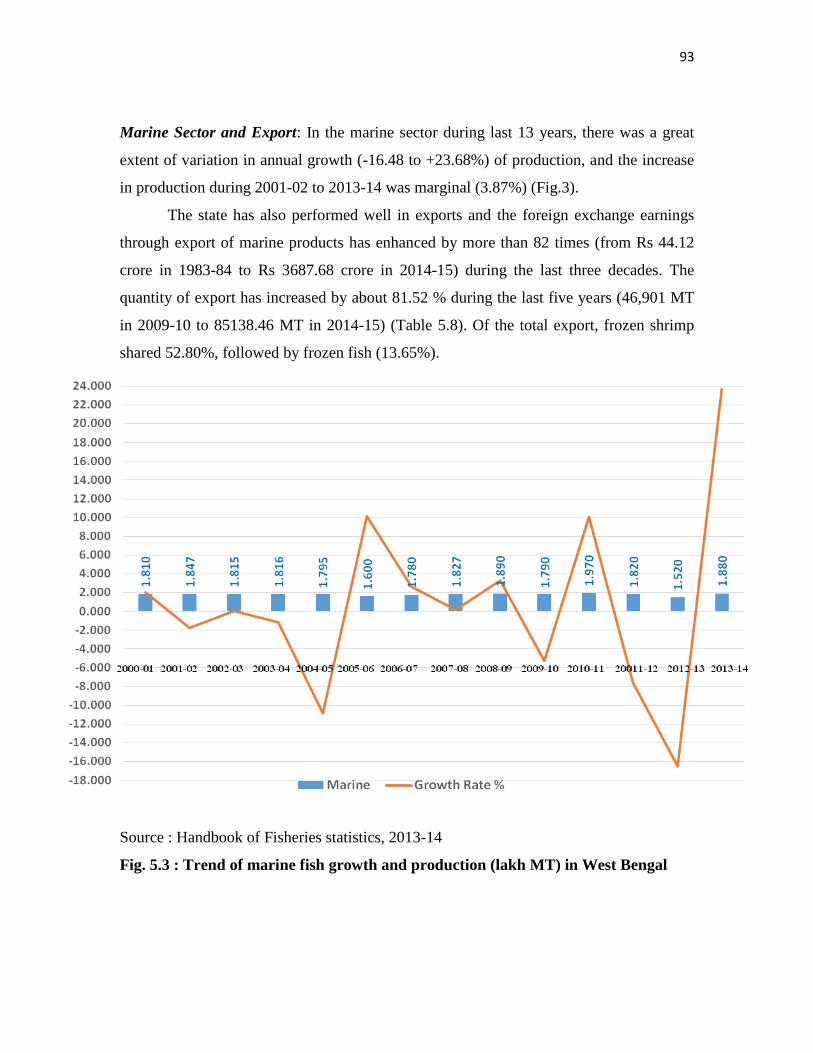
93
Marine Sector and Export: In the marine sector during last 13 years, there was a great
extent of variation in annual growth (-16.48 to +23.68%) of production, and the increase
in production during 2001-02 to 2013-14 was marginal (3.87%) (Fig.3).
The state has also performed well in exports and the foreign exchange earnings
through export of marine products has enhanced by more than 82 times (from Rs 44.12
crore in 1983-84 to Rs 3687.68 crore in 2014-15) during the last three decades. The
quantity of export has increased by about 81.52 % during the last five years (46,901 MT
in 2009-10 to 85138.46 MT in 2014-15) (Table 5.8). Of the total export, frozen shrimp
shared 52.80%, followed by frozen fish (13.65%).
Source : Handbook of Fisheries statistics, 2013-14
Fig. 5.3 : Trend of marine fish growth and production (lakh MT) in West Bengal

94
Table 5.8: Export of fish, prawn and other fishery produce
Year Quantity
( Ton)
Value
( Rs Crore)
2008-2009 33625.23 720.360
2009-2010 46901.00 892.480
2010-2011 59774.00 1322.01
2011-2012 61915.00 1737.84
2012-2013 66941.00 1825.12
2013-2014 68750.00 3058.66
2014-2015 85138.46 3687.68 Source: Handbook of fisheries statistics, 2014-15
Infrastructure Development: With respect to facilities/infrastructure development in the
state, in the inland sector, the state has 604 Indian Major Carp (IMC) hatcheries,
including 8 Govt. hatcheries, 11 prawn hatcheries, and 4 ornamental hatcheries mainly in
the private sector. In the marine sector, the state possesses 1 deep sea port, 7 fishing
harbours, and 78 fish landing centres. The state also own 1 fish processing centre and 35
ice plants. With regard to support in efficient and safe fishing in sea, licenses have been
provided to total 38,137 mechanised boats and 12,142 non-mechanised boats, and E–
registration has been extended to total 14,557 mechanised boats and 12,633 non-
mechanised boats.
With regard to the development of Co-operative societies, the state has total 1170
Fishermen Co-operative Societies in the inland sector, including 191 Ornamental Primary
Fishermen Co-operative Societies. In marine sector, there are total 180 Fishermen Co-
operative Societies comprising 116 in South 24 Pargans and 64 in Purba Medinipur. To
facilitate marketing there are 636 whole sale markets involving 4054 wholesalers and
3208 retail market with 37,058 retailers. The total employment generation in fisheries
sector (planned scheme) counts 20.92 million man-days.
Welfare of fishermen: Housing facility to fishermen has increased by more than 90%
(from 17985 in 2009-10 to 34238 in 2013-14) during the last five years. Coverage of old
age pension to fishermen has increased by five times during the last fourteen years. In
order to provide financial assistance to the family members of deceased or permanently
disabled fishermen, the Fishermen's Group Personal Insurance Accident Insurance

95
Scheme was initiated 30 years ago. It gives financial assistance of Rs1,00,000/- in case of
death, and Rs 50,000/- in case of partial disablement due to accident. The premium of Rs.
28.00 only per annum per head is borne on 50:50 share basis by Central and State Govt.
Total 1,60,000 fishermen were benefitted in this scheme during 2012-13.
The insurance for fish crop is yet to be developed and the issue is included in the budget
provision of the department.
5.2.2 Achievement during XIth Plan
i) Development of derelict ponds /increasing coverage culture area in inland sector:
The area under fish culture in ponds /tanks increased from 2.2 lakh ha to 2.60 lakh ha
(18.18% higher) during XIth plan. While in the case of reservoir fisheries, the increase in
the same period was from 0.03lakh ha to 0.13 lakh ha. The coverage under FFDA (Plan
Scheme), in XIth plan was 6329.11 ha higher (5.231%) over the Xth plan (2006-07), while
in the case of brackish water, the culture area under BFDA (Plan Scheme) increased by
23.98% (1361.50 ha) in the same period.
ii.) Higher fish production: In respect to target of 16% increase in fish production during
XIth plan, 8.31% higher production (from 13.59lakh MT in Xth plan to 14.72 lakh MT in
XIth plan) was achieved during XIth plan period. The fish seed production also enhanced
from 12852 million in 2006-07 to 13846 million (7.73% higher) in 2011-12.
iii) Increasing productivity in ponds/tanks: With regard to target of increasing
productivity from 3500kg /ha to 7500kg/ha during XIth plan, an increase up to 4450 kg/ha
(27.14% higher) has been achieved during XIth plan. However, in the case of non-FFDA,
the increase was from 2650kg/ha to 2826.88 kg/ha.
iv)Diversification of fish farming: Total 4015 ornamental fisheries units were developed
during XIth plan compared to 660 units developed during Xth plan.
v) Setting up of hatcheries: Total 604 IMC hatcheries, (including 8 Govt. hatcheries), 11
prawn hatcheries, and 4 ornamental hatcheries were developed mainly in the private
sector up in the first year of XIIth plan.
vi) Credit facilities: The coverage under Short Term Credit Programme (STCP) in XIth
plan was 9657.09 ha area (9558 cases) with bank disbursements amounting to Rs
13227.66 lakh.

96
vii) Employment generation: The employment generation (Planed Schemes) increased
from 179.89 lakh man-days in 2007-08 to 195.43 lakh man-days in 2011-12.
viii) Fishermen welfare: The coverage under old age pension for the fishermen increased
from 10500 at the end of Xth plan to 20548 numbers at the end of XIth plan. Similarly,
housing scheme was also extended to more fishermen (20458 nos) in 2011-12.
ix) Coastal security: The number of licensed boats in XIth plan increased from 10449
mechanised and 1979 non-mechanised boats to19182 mechanised and 6402 non-
mechanised boats, respectively. The E- registration of boats reached a figure of 2477
mechanised and 3418 non- mechanized in XIth plan period.
x) Export: The export quantity increased three times (61915 ton) in the last year of XIth
plan over the last year of Xth plan leading to increase in foreign exchange earnings by Rs
1120.84 crores
5.2.3 Gap analysis
Gap between demand and production - The demand of fish at the end of XIIth
Plan (2016-17) in the state will be 17.19 lakh MT. During the last five years, the
production level remained with a deficit of 0.57- 1.39 lakh MT. Thus, fish
production needs to be increased by 16.78% over production at the end of XIth
Plan (14.72 lakh MT), at annual growth rate of 3.36%. However, considering the
production in 2014-15 the gap is 6.30%. Fish production compared to culture area
was comparatively lower in the districts of Darjeeling (Siliguri), Jalpaiguri,
Coochbehar, Malda, South 24 Parganas,Purulia and Bankura.
Instability in production growth- The fish production during the last eight five
years plan period in the state lacks stability; as the annual growth rate greatly
fluctuated in the range of 26.11 - 41.90%.
Poor production in large water bodies: At present very poor fish production, i.e.
0.55 lakh MT in beels /boars and 0.016 lakh MT in reservoir fisheries is obtained
due to underutilization of resources and poor productivity.
Under-utilization of estuarine resources: The large estuarine resource is
underutilized.

97
Stagnant production in marine sector. There is a great extent of variation in
annual growth of production during last 13 years.
Lack of diversification in fish culture - Under inland culture fishery, major carps
share maximum i.e. 67%, followed by exotic carps 12.93%, catfishes (Wallago
attu, Rita rita etc) 2.90%, minor carps 3.58%.
Gaps in productivity in ponds/tanks: The fish productivity in ponds/tanks under
FFDA Scheme at the end of XI plan was 4450 kg/ha/yr and 2827 kg/ha/yr in the
case of traditional (non-FFDA) ponds. In brackish water ponds the same was
1305kg/ha/yr of shrimp and 1055kg/ha of mullets. There is scope of further
increase in productivity in both the sector
Need of quality fish seeds: About 72.40% of total fish seed is produced in four
districts North 24-Parganas, Bankura, Hooghly and Nadia with maximum
quantity (53.20%) in the first two districts. Inbreeding in brood stock, lack of
proper brood management, quality control in hatcheries are causes of poor quality
seeds.
High cost in culture: The cost of inputs in fish culture is very high, and
increasing, especially the feed cost i.e. about 50% or more.
Lack fish feed mill – There is an urgent need to develop fish feed mill, lack of feed
mill government sector impedes facilitation of fish farming.
Need for conservation of open water fishery resources including Hilsa
Inadequate supportive infrastructures for production and welfare of fishers .
Poor insurance Coverage under – The fisheries sector lack proper insurance
coverage.
Poor entrepreneurship development- PPP mode should be promoted in
ornamental fish culture, seed production, processing/ value addition, feed mill,
aqua-tourism etc.
Gap in awareness development /capacity building needs to be addressed.
5.2.4 Achievements in XIIth Plan (2012-14)
Development of inland fisheries and aquaculture: An amount of Rs 253.33 lakh
subsidy was disbursed for 933.71 ha inland fisheries, 83 unit Jhora fisheries and
other 4 schemes.

98
Development of social fisheries: In order to supplement stock and restore the
breeding ground of native carps in natural water bodies, 9 lakh fingerlings were
released in 500 water bodies with financial involvement of Rs 58 lakhs.
Demonstration Centres: With a view to disseminate intensive fish culture
technology for increasing the productivity, 14 demonstrations Centres in different
districts were completed with the achievement of 6000-8000 kg/ha productivity.
Economic upliftment of tribal people: Renovation of water bodies and adoption of
composite fish culture were taken up with 326 beneficiaries with utilization of Rs
87.12 lakh.
Replenishment and propagation of the indigenous fish species through stocking of
beels under PFCS: An amount of Rs 12.72 lakh was sanctioned to implement the
scheme in 212 units.
Marine fisheries: Infrastructure development (community hall, tube wells, roads,
fish market) for fishers was taken up with Rs.90lakh. For safety of fishermen in
sea, 1000 Distress Alert Transmitters (DAT) was provided. About 3000 Biometric
Identity Cards were distributed to marine fishers.
Hilsa Conservation and Research Centre (HCRC) was established at Sultanpur,
South 24 Pargans District to address the issue of conservation of this important
species in parity with the national initiative ( GOI, ICAR institutes)
BENFISH: Three projects namely Digha Mohana Ice plant in Purba Medinipur
with Rs 39 lakh cost, International Ornamental Fish market , in Kolkata with Rs
30 lakh cost and Ornamental Fish market in Sabang, Paschim Medinipur with Rs
25 cost were completed and inaugurated during Feb.2013- Jan .2014.
SFDC: 1010.41 bati (spawn) was produced. The total production was 324.90 MT
from brackish water fisheries, 663 MT from sewage fisheries, and 14.2 MT from
freshwater fisheries project, besides 8.3 MT from hatchery project.
WBFC: Infrastructure development projects were being implemented under RIDF
schemes like, 1) Renovation of Bansdaha Beel in Burdwan , 2) Improvement of
Navigability of Durba canal in Purba Medinipur, and 3) Construction of 200MT
Cold Storage in Purba Medinipur. In first two cases 50% and in last case 40% of
work was completed.

99
Fish seed market: Construction of two modern fish seed markets, one at
Rajendranagar (Naihati) and other in Ramsagar (Bankura) was taken up under
RIDF project to facilitate quality fish seed trade in domestic and national
markets.
A sum of Rs 120 lakh was allotted for stocking of fish fingerlings in the Gov.
water bodies as well as ponds and tanks developed in Jal Dhoro Jal Bhoro
Programme under MGNREGS
Construction of 178 Block level Laboratory –cum- training Centre was completed
so far under RKVY.
Fishing nets and fishery requisites were distributed to 1200 fishers. Housing
facilities for fishermen was initiated with a target of 11,768 houses under EWS
Housing ‘Gitanjali’ during 2012-13 & 2013-14 and another 5000 house
construction during 2014-15. Initiative was taken for construction of 226 houses
under Model Fishermen’s Villages of National Welfare Schemes of Fishermen.
For the first time a consortium was formed with all ICAR Fisheries Institutes for
addressing R&D needs in fisheries sector and on this platform, a ‘Disease
Surveillance’ Project (the first of its kind) has started functioning in 10 districts of
the state.
5.3 Sericulture
5.3.1 Introduction
Sericulture is an agro-based cottage industry contributing significantly to
employment in the rural areas in some of the states where it is predominant. It is highly
labour intensive and employs 60% of the labour from the women member of the family.
It is an occupation that can be easily adopted by the semi – literate and traditional farm
families and suites land holding of many sizes. It provides the much needed cash income,
at short intervals and generates gainful on farm and off farm employment both Upstream
and down Stream. Cultivator/ farmers produces cocoons as raw materials for the reeling
industry and the end product of the reeling industry are the raw material for silk weaving
industry.

100
Four varieties of silkworms are reared in the country viz. Mulberry, Muga, Tassar
and Eri. Mulberry sericulture is taken up in the states of Karnataka, Andhra Pradesh,
Tamil Nadu, Jammu and Kashmir, Assam and West Bengal while non-Mulberry
sericulture is practiced in Jharkhand, Chattisgarh, Odisha and North Eastern States.
About 85% of the country’s production is contributed by Karnataka with introduction of
bivoltine and multivoltine hybrids, enabled by rearing four to five crops in a year. Other
states namely Andhra Pradesh, Assam, Tamil Nadu, Uttar Pradesh, Himachal Pradesh
and Punjab Contributes roughly 1.8% of the total production of mulberry silk in India.
5.3.2 Overview of Development
Four types of Silk viz. mulberry, tasar, muga and eri are produced in West Bengal. The
district wise status of the the four types of silk in the state during 2014-15 are given in
Appendix Nos. 16 - 19.
Mulberry: Mulberry is grown in Murshidabad, Nadia, Malda, Birbhum,
CoochBehar, U. Dinajpur, D. Dinajpur, Jalpaiguri, 24 Parganas, Medinipur, Purulia,
Bankura and Bardhaman. Mulberry area as on 01.04.2015 is 37,883.52 acres. Out of total
acre, 85% area is situated in the district of Malda, Murshidabad and Birbhum. During this
period, a total of 574.34849 lakh DFLs were produced and reared which produced
23153.262 kahan cocoons and finally, 2450.36 MT raw silk.
Tasar: Tasar plantation is confined in the district of Murshidabad, Medinipur,
Purulia, Bankura, Burdwan and Birbhum. Area of plantation of Tasar as on 01.04.2015
was 16,997.96 acre. Maximum area is situated in the district of Bankura and Purulia.
During the period, a total of 8.6808 lakh DFLs were produced and reared which further
produced 39233.16 kahan cocoon and 21.5250 MT raw silk.
Muga: Muga is confined in the district of Jalpaiguri, CoochBehar, Uttar Dinajpur
and Darjeeling (hill & plain) and Kalimpong. It is cultivated in an area of 1,541.0 (as on
01.04.2015). A total of .41951 lakh DFLs were produced and reared during the period
which resulted in production of 15.02 lakh cocoons and 271.13 kg raw silk.
Eri: Eri is confined to the district of Jalpaiguri, Dakshin Dinajpur and 24
Parganas. The area as on 01.04.2015 was 118.0 acre. A total of 1.03532 DFLs were
produced and reared, which further produced 7.5161 MT cocoons and 6.02 MT raw silk.

101
There are 62 Basic farms, 16 production centres and 59 Technical Service Centres
throughout the state to cater the needs of sericulture farmers. The target for production of
the four types of silk during the XIIth Five Year Plan is presented in Appendix 20
5.4 Forest
West Bengal is one of the few states in the country where per capita tree and forest cover
is the lowest (.021 ha). Total recorded forest land in the state is 11,879 sq. km. of which
7054 sq. km. is reserved forest, 3772 sq.km.is protected forest and 1053 sq.km. is
unclassed state forest thus contributing 13.38% of the geographical area of the state. The
vegetation cover of the state is around 21.35% of the geographical area. The vegetation
cover includes village orchards/groves, tea garden and horticultural plantations. The
forests of West Bengal are classified into ten categories as given in Table 5.9.
Table 5.9: Areas under forest in different districts of West Bengal
Forest type Location Area km2 Major tree species
Northern tropical wet
evergreen
North Bengal Plains and
foothills
167 Sal, Nageswar, Jam, Latore,
Malagiri, Lali, Canes
Northern sub-tropi cal
semi-evergreen
North Bengal 25 Champ, Panisaj, Gokul,
Angare
North India moist
deciduous
North Bengal Dooars and
Terai
1757 Sal, Champ, Panisaj, Sissoo,
Chikrassi, Gamar
Littoral and swamp –
mangrove
Sundarban 4263 Sundari, Baen, Dhundul,
Gnewa, Garan, Passur
Littoral and swamp –
tropical seasonal
Malda, North and South
Dinajpur districts
20 Hijal
Northern tropical dry
deciduous
Bankura, Purulia,
Midnapore, Burdwan and
Birbhum districts
4527 Sal, Peasal, Kend, Mahul,
Kusum, Asan, Bahera,
Dhaw, Rahara
Northern sub-tropical
broadleaved wet hill
North Bengal hills 300m-
1650m altitude
800 Chilouni, Panisaj, Gokul,
Utis
Northern Montane
wet temperate
North bengal hills 1650m–
3000 m altitude.
150 Magnolia, Champ, Oaks,
Kawla, Pipli,
East Himalayan moist
temperate
North Bengal hills 1500m-
1800m altitude
150 Chilouni, Katus, Panisaj,
Lampate, Utis, Angare,
Toon, Malagiri
Sub alpine North Bengal hills 3000m-
37000 m altitude
20 Rhododendrons, Salix, Yew,
Berberis, Junipers, Birch
Source:Champion & Seth, 1968 ; Atlas: Forest Types of India, 2011, FSI, GOI

102
In terms of forest canopy density classes, the state has 2971 sq. km.(3.35%) of very dense
forest, 4146 sq. km.(4.67%) of moderately dense forest and 9688 sq.km.(10.92%) of
open forest. The district wise forest cover is given in Annexure 21.
The State has 4692 sq. km. of forest under protected area network which is
39.50% of the State’s total forest area and 5.28% of the total geographical area. There are
six national parks, fifteen sanctuaries, two tiger reserves, and one biosphere reserve. The
protected area network includes 1488.72 sq.km. in sanctuaries, 1981.48 sq.km. in parks
and the balance are being represented by buffer areas of two tiger reserves viz. Sundarban
tiger reserve & Buxa tiger reserve. There are two elephant reserves viz. Mayurijharna
Elephant Reserve (414 sq.km.) and Eastern Doors Elephant Reserve (977.51 sq.km.). In
recent years, there is substantial increase in forest area in the state mainly due to coppice
growth (dense growth of small trees), afforestation in new area, growth of commercial
plantations and shade trees in tea gardens as well as effective joint forest management
involving participation of local people (Annual Report, 2013-14, Dir. of Forests, Govt. of
West Bengal).
5.4.1 Biosphere Reserve
Part of the world’s largest mangrove forest, Sundarban is located in southern West
Bengal. The total area of Indian Sundarban region is about 9630 sq. km, of which the
reserve forest occupies nearly 4260 sq.km. The Govt of India has declared the entire
9630 sq. km. of Sunderban as the Sunderban Biosphere Reserve in 1989. Sundarban is
the only mangrove forest in the world having largest floral and faunal diversity including
several endangered, threatened and endemic species. It acts as a fish nursery and supports
coastal fisheries along Bay of Bengal and Indian Ocean. The mangrove forest provides
protection to inland habitations against the fury of cyclones.
5.4.2 Non timber forest produce
The state produces a number of non-timber forest products from forests apart from sawn
timber. Non timber forest products play a vital role among the people living near the
forests and provide asource of income and subsistence living The Dept of forest
undertakes cultivation, processing and marketing of different non timber forest products
e.g. citronella, turmeric, medicinal herbs, bamboos etc. through joint forest management,
some of these are given in Table 5.10.

103
Table 5.10 : Some important non timber forest products
Non Timber Forest Product
2000 -01
2001-02
2002-03
2003-04
2004-05
2005-06
2006-07
2007-08
2008-09
2009-10
Honey (Quintals) 494 323 363 383.3 311.2 305.52 382.07 251.28 245.65 257.50
Wax (Quintals) 7.24 21.23 34.55 17.58 13.17 15.59 14.02 13.96 8.89 0.40
Sal Seeds (MT) 1848.37 -- -- -- 1070.7 117.67 120.58 1408.13 75.53 418.10
Kendu Leaves(MT) 362 379 367 642 347.22 1104.76 1163.96 849.06 803.16 907.24
Lac (Tonne ) - - - - 22.38 -- -- -- -- --
Citronella grass (Qt) 2137 6738 9530 6890 2316 8613 7101.21 3227.14 2094 3548
5.4.3 Joint Forest Management
The poor and tribal people living around forests are integral part of forest eco-system and
sustainability of their livelihood is important for ensuring long term conservation of
forests. The joint forest management (JFM) is viewed as an effective tool for making the
poor local people a stake holder of the forests and other natural assets in their vicinity and
ensuring their continuous support in protecting the same. West Bengal is the pioneer state
in India in initiating the JFM movement at Arabari in Midnapur by roping in participation
of communities in fringes of forests to rejuvenate degraded a vast area of sal forests
through employment generation activities and sharing of non-timber forest produce from
such forests. Subsequent Government’s decision in 1989 to share profit of forest produce
with fringe people followed by various resolutions of Government gave institutional
support to the existing participatory system of forest management. In 1996, Eco
Development Committees (EDC) were also formed for protection of wildlife protected
areas. As on 31 March 2014, there are 4,294 JFM Committees in the State comprising
4,93,713 members protecting forest areas over 5,92,243.368 ha. There are also 105 EDCs
in the State comprising 22,881 members protecting 69,836.51 ha. of protected area.. In all
JFMCs and EDCs, the spouses are joint members. The committee members are employed
in timber harvesting operations and plantation activities in various parts of the state. The
West Bengal Forest Development Corporation Ltd. (WBFDCL) is responsible for
marketing of timber harvested from the Govt forests and a substantial of part of the
revenue earned by the corporation is shared with the forest protection committee
members. The Govt also helps the members in marketing of non-timber forest products

104
collected by them, in particular the honey collected from Sunderban. Self-Help Groups
(SHGs) formed in forest fringe villages among the members of JFMC and EDC
particularly by womenfolk have also played an important role in various vocational and
income generating activities to curtail their dependence on forest for livelihood protecting
simultaneously the ecological balance and environment. The number of SHGs in forest
fringe villages as on 31 March, 2014 is 2295 in which 18648 women are members and
1046 SHGs are exclusively run by women (Annual Report, 2013-14, Dir. of Forests,
Govt. of West Bengal).
5.4.4 Agroforestry
Agroforestry is a proven land use system for vertically enhancing productivity and risk
coverage against unstable weather conditions. Mono cropping neither provides gainful
employment opportunities nor generates sufficient income to meet the family expenses.
Effective utilization of available space, both horizontally and vertically, is the concept of
modern cropping system known as agroforestry. This system research aims at increasing
production and farmers’ income in a sustainable manner making use of available
technology and physical and socioeconomic resources of the farmers. Selection of
intercrops, fruit trees and tree (silvi) species depends on agro-climatic situation and
farmers’ choice. Such modern cropping systems generate higher biomass, yield more
produce, provide high and steady income and create gainful on farm employment, in
addition to meeting the requirements of food, vegetables and fuel for the family.
Further, it has a strong element of soil management. Scientifically designed and
well managed agroforestry systems have the potential to control run-off and erosion,
maintain soil organic matter and physical properties, and promote nutrient cycling.
Supply of fuel, timber, firewood from non- forest zone will reduce the pressure from
forest, especially, fruit-based agroforestry models can make a major contribution to
sustainable land use and production. Unused fallow land or unproductive land in the
district of Bankura, Birbhum, Hooghly, Pashim Medinipur is being utilized under
agroforestry.

105
5.4.4.1 Agroforestry Models
The agroforestry is executed by bringing farmer’s field/ fallow land / community land/
vested land with integration of crop, tree, livestock, fishery and other enterprises. Some
land use models may be as follows:
Agri-horticulture (crops + fruit trees)
Agri-silvi-horticulture (crops + trees + fruit trees)
Agri-silviculture (Crops +trees)
Boundary plantation (trees on boundary + crops)
High density plantation at non-arable land
Horti-olericulture (fruit trees + vegetables)
Aqua-forestry(trees/fruit trees+fishes), after construction of water harvesting
structure
Homestead (multiple combination of trees, fruit trees, vegetable etc)
Integrated Farm forestry (Poultry /duckery + pisciculture + Fruits/vegetables/ tree
species.)
The fruit and tree species recommended under agroforestry in the State is shown in the
Table 5.11
Table 5.11: Fruits and tree species recommended for agroforestry in West Bengal
Fruits tree mango, Jam, pomegranate, banana, guava and ber
Tree species For timber and fuel: Gamhar (Gmelina arborea), Akashmoni (Acacia
auriculiformi.), Eucalyptus, Sal, Teak, Mehagani, Babla, Siris, Sisoo,
Kadam, Bamboo, Chikrasi etc.
For Medicinal: Arjun (Terminalia arjuna), Jam (Syzygium cuminii)
Bahera (T.bellirica), Haritaki, Tetul (Tamarindus indica), Amlaki, etc.
For TBOs: Neem, Karanj, Mahua etc.
For Fodder: Subabool, Glyricidia, Jack fruit etc.
Social Forestry : Radhachura, Krishnachura, Simul etc.
Intercrops Preferred by the farmers of the region

106
CHAPTER VI
AGRICULTURE SUPPORT SECTOR

107
6.1 Agricultural Marketing
6.1.1 Introduction
Endowed with 6 agro-climatic zones, the state is a leading producer of paddy, Jute, tea and
oilseeds. It also happens to be major producer of fruits such as mango, guava, pineapple,
papaya and bananas besides many other fruits grown in varied agro-climates. New vegetables
like Broccoli have gained grounds in recent years. It is also a leading producer of fish (2nd
among the states in the country) and in fish seed top most producer in the country. Though
the potential of marketing a wide variety of agricultural produce is high, there are major
constraints in realizing the potential. The majority of the farmers are small, marginal, share
cropper/oral lessees who form 97.7% of farming community and account for about 95% of all
farming households in the state. They lack adequate financial support from credit institutions
like cooperatives and banks for making investment in their profession for adoption of better
practices as well as for marketing of their produce.
6.1.2 Nature of Markets in the State
In West Bengal, the ‘mixed’ type of Haats existed right from Zamindary days where
wholesale / primary and retail markets functioned together from same place. About 80-90%
of the rural markets have been privately owned from ages. Along with perishable and
nonperishable agricultural commodities, other items like iron & wooden components such as
axe, chuff cutters, spade, dao and other household items were sold from these age old Haats/
Bazars. Price was, however, commodity specific dependent on development of glut in the
market and presence or absence of nearby market and also depended on decision of the
farmer to store his produce either in storage space or immediate sale in market.
6.1.3 Problems in agro marketing
Agricultural Marketing in the state is constrained with lack of storage, inadequate means of
transport, lack of grading and standardization, unavailability of market information,
malpractice in buying & selling and in absence of sufficient institutional marketing, forcing
farmers to sell individually. Agriculturists (Producers) sometimes earn not more than 20-30%
of the price ultimately paid by end user consumer by virtue of presence of intermediaries. The
inadequacy of basic infrastructure for collection, sorting, packaging, movement and storage
of a variety of goods is an impediment to marketing. To upgrade the current marketing
system two major aspects have to be dealt with (1) Building the physical infrastructure for

108
which substantial capital outlay is required and (2) setting up of efficient service platform,
making the infrastructure developed viable and profitable. For support of physical
infrastructure, cooperative bank and other banks can play a role along with large/medium
sized companies looking for investment opportunities in these market infrastructure projects.
6.1.4 Areas of Concerns
1. Lack of godown and cold storage in market yard compared to requirement.
2. Farmers get very low proportion of the consumer’s price.
3. Farmers to get price of crop produce as fixed by Agricultural Cost & Price
Commission. The services and infrastructure of the markets deserve much
improvement.
4. Farmers not equipped with market information, price movements and the like, thus
becoming prone to exploitation by middlemen.
6.1.5 Agricultural Cooperative Marketing Societies
Agricultural cooperative marking is an important aspect of marketing of agricultural produce
besides the individualized private marketing system. The growth of marketing through
cooperatives of farmers is a sure and positive sign. The key elements with an effective market
delivery mechanism to motivate the majority of small/marginal farms to form/join their own
cooperative of which they will pay share capitals and become members/owners.
The milk co-operatives ‘Amul’ of Gujarat would enable and inspire the cooperatives
of small and marginal farmers and may serve as a model to:
Overcome the fragmentation of land issue and enabling the members to adopt
most remunerative cropping systems to increase income.
Have bargaining power due to their togetherness, negotiate best terms of credit
and convert the risk to a collective risk than individual risk.
Access cooperative loans and Government assistance more easily. Cooperative
society and cooperative banks can assist small and marginal farmer members SHG
members to acquire livestock assists, improve local breeds (example: Black
Bengal goats) and improve income level. Convergence with MGNREGA for
sheds and other infrastructure may be a possibility.
Have a stake in marketing process.
To have collaboration with corporate bodies in private sector for establishing
Weight and Measure Scales, Storing in Cold Chain and consequent grading,

109
Standardisation and Packaging at Haat/Bazar level, the primary stage of
distribution. Building up a ‘brand name’ for cooperative shall be desirable.
Accessing latest fruits of research will be possible when these cooperatives build
up bridges with prestigious government research and development bodies at
Central and State levels.
Farmers’ cooperatives to make key interventions to address the gaps in post-
harvest and marketing of agricultural commodities. Identification of marketing
channels, deploying market infrastructure including grading, standardization,
transportation and communication facilities etc. would be crucial tasks.
.6.1.6 Development in the Agricultural Marketing
The West Bengal State Agricultural Marketing Board (AMB) was set up in the year 1982
with the following objectives:
To close knit the multi layered marketing network development linking of rural
periodical hubs/bazaars with principal market yards sub market yards and Regulated
Market Committees (RMCs) and finally with centralized terminal markets.
To achieve sustained and equitable growth and expansion of agriculture and allied
sectors activities.
RMCs to build storage facilities, platforms, market shade, stalls and other
infrastructure like link roads linking Bazars and municipality etc.
To improve infrastructure and management of 2918 odd rural periodical markets/haats
etc.
6.1.7 Development of rural market infrastructure
There are 20 principal market yards and about 455 sub market yards which are managed the
rough 21Zonal Regulated Market Committees (ZRMCs). Besides there are 2918 rural Haats
and Bazars managed by private operators (Associations, Societies etc.). There are also about
350 daily markets in the municipality / semi urban areas managed by local authorities
(Panchayat Municipalities, ZP, GP etc.). Present day schemes of agriculture marketing can
be categorized into 5 major groups viz.
Development of Marketing Infrastructure Scheme
From 12th plan initial years i.e. from 2012-13 marketing infrastructure was given a boost as
decision to develop new infrastructure like “Krishak Bazars” in all the blocks of the State
with a view to facilitating the marketing management of agricultural produces so that farmers
of the locality can get remunerative price for their produce and consumers can get produces at
comparatively lower price. 128 Krishak Bazars have been completed out of 184 in various

110
blocks. This apart, constructions of 34 cold storages were also taken up which are at different
level of completion phase wise. This was to bridge the gap in the storage structures for
perishable commodities, mainly potato. So far around 60 - 65% cold storage space of total
potato production has been created in the state.
Sufal Bangla
The objective of this project was to ensure maximum
share of the producer in consumer's price by procuring
agri. commodities directly from the farmers and
subsequently sell to the consumers at a fair price. The
project was started on 29.09.2014 with the aim to
develop a sustainable business model that suits socio
economic context in West Bengal for benefit of both
farmer and consumer. Under this project 3200 MT of fresh fruit and vegetables, valuation of
Rs. 6.00 crores have been sold till 31.12.2015 through 15 retail outlets in Kolkata, Howrah
and adjacent areas.
Subsidy administered schemes
The new schemes for 12th year plan to provide subsidy to need based “Flexi type” projects for
storage structures for food grains and subsidy for means of transport like bullock carts and
van rickshaws were increased many fold including subsidy for “Amar Fasal Amar Gola” (My
produce my storage structure) , “Amar Fasal Amar Gari ( My produce my transport van with
6 perforated poly-crates), Amar Fasal Amar Chatal ( My produce my threshing yard with
Rice boiling unit), Pulse grain processing units to SHGs and needy and poor farmers (SF &
MF). These are the schemes to reduce post-harvest loss.
Capacity Building, Training Schemes
A new institute “Netaji Subhas Training Institute of Agricultural Marketing” (NSTIAM) was
set up at Sheorafuly in Hooghly District for long term training of farm families on
organization building, capacity building, value added marketing link ups, capacity building
on Farmers’ Producers Organization (FPO) etc. This institute also imparts training and
capacity building to SHGs, Farmer's clubs and small and marginal farmers with one time
assistance to SHG clusters as livelihood support. As of now 44 FPOs have been registered
and converted to FRCs (companies) set up in the state by Agricultural Marketing Department

111
under a scheme phased out for 3 years. The Small Farmers Agri. Business Consortium
(SFAC) is executing the scheme on behalf of the Agri. Marketing Department.
Marketing intervention
A Task Force was constituted with stakeholders during steep price rise crisis and for taking
immediate action. As a result, potato was sold in Kolkata and in other cities with Govt.
transport vehicles to control prices. Transport subsidy was given in 2014-15 to the extent of
Rs. 50 per quintal for transport of Potato through railway rakes for sending the commodity to
states other than West Bengal. For export to overseas market, transport subsidy was allowed
at the rate of Rs. 100 per quintal of potato for export of the commodity to other country from
Kolkata Port only. Infrastructure support at logistics hubs are required to facilitate export.
Enforcement of marketing Regulation
This includes Cold Storage and Warehouse regulation. Postharvest Credit for farmers by
means of Pledging / Warehouse receipts has started also. Negotiability of Warehouse receipts
is important. NABCONS, the consultancy arm of NABARD, has been entrusted with
accreditation work as an agency, while WDRA remains regulating authority whose
registration is mandatory. The GOI 2007 Act in this regard is enforced in 2010 in this state of
West Bengal. At times the critical financial need of farmer is met with this arrangement. GOI
interest subvention scheme have been made applicable in pledge loan also. On full & timely
repayment farmers enjoy interest subvention from GOI on loans taken on the basis of
Warehouse receipt. While 65 applications are received by the department, so far 9
warehouses got the accreditation certificate from NABCONS.
6.1.8 Amendment of Marketing Act
Agricultural Produce Marketing (Regulation) Act 1972 has been amended in December 2014
with provisions of Farmers’ Market, Consumer Market & Direct marketing etc. with a view
to accelerating agricultural marketing reforms in the state. The act allows setting up of
Farmers markets for marketing their produce directly to the consumers. In keeping with the
amended act, sub divisional level regulated market committees (RMCs) have been abolished
and Zilla Regulated markets committees (ZRMCs) have been formed for better management
of Krishak Bazars’ and Farmers' Producer Organizations (FPOs) are encouraged for
conducting primary transactions of agricultural products at the Krishak Bazars to have
competitive prices and maximum share of consumer’s rupee.

112
6.1.9 Food Processing and Data Collection Centers
There are about 22 Food Processing units spread out over 19 districts and Kolkata. These are
mainly value addition centers for perishable fruits & vegetables. Training programmes are
conducted for unemployed youth in 3 batches, each batch of 3 month duration. The centers
help the entrepreneurs in marketing of value added produce. In addition, there are also
community canning centers equipped with laboratory & workshops. 100 data collection
centers have been set up to generate database on price movements of agricultural
commodities in agricultural markets to provide transparent price information to farmers, as
also on available infrastructure and storage facilities, regulation, warehousing database etc. It
is necessary to empower farmers with customized, personalized marketing information using
Information and Communication Technology (ICT) Introduction of a ‘producer-buyer’
linkage platform to facilitate market linkage is to be attempted.
6.1.10 Gap Analysis
Considering a huge gap of storage and marketing infrastructure of about 52 lakh metric
tonnes (LMT) in the state, (Total food grain production of the state during 2013-14 being
170.51 LMTs and total storage capacity in the state being 33.09 LMT which included FCI's
10.91 LMT, CWC's 6.57 LMT and SWC's 2.16 LMT ( Source: www.rbi.org.in as well as
www.dfpd.nic.in). Under CISS Rural Godown (Gramin Bhandaran Yojona) scheme in West
Bengal, a capacity of 13.45 LMT has been sanctioned as on 31 March 2014). If 50 % of food
grain production in the state to be used for consumption, still the state requires to store 52.165
LMT of food grains more than the existing storage capacity. Similarly there is a large gap in
cold storage capacity of 488 m MT (Source: DSM, NABARD, HO; Mumbai). Around 60 -
65% cold storage space of total potato production has been created so far in the state. Being a
surplus production state for both perishable and non-perishable commodities, inadequate
storage infrastructure has to be there.
6.1.11 Performance during XIth & XIIth FY Plan.
Three broad performance indicators of the Agri. Marketing Directorate under XIth Plan
Period and first 3 years of XIIth plan viz. (a) Investment in marketing infrastructure (b)
Improved realization of Paddy price and (c) Amount of Plan expenditure (out of state budget)
showed an increasing trend during XIth plan (Table 6.1).

113
Table 6.1 Investment in Marketing Infrastructure and Plan Expenditure
Source: Department of Agri- Marketing, GOWB.
However, the growth was faster during initial 3 years (2012-2015) of XIIth Five Year Plan to
cumulative achievement of 11th Plan period as the investment in marketing infrastructure
grew by 130%; average realization of paddy prices increased by 139% and plan expenditure
grew by 141% during corresponding first 3 years of 11th plan period. The trend indicates with
the present rate the performance indicators during XIIth plan would outpace the XIth plan
performance. Net Grant Statement in Table 6.2 shows that the total core component
expenditure for 2014-15 has exceeded the targeted total grant allotted. Total grant under
RKVY had major share (75%) of total grant of Rs.13,429.30 lakhs comprising core, loan and
RKVY components.
Table 6.2 Financial outlay in Agri Marketing during 2014-15 to 2016-17
(Rs. in Crore)
2014-15 (RE) 2015-16 (BE) 2016-17 Tentative
140.00 250.00 275.00 Source: Finaance Dept., Budget publication , Figures of 2016-17 is tentative (10% over 2015-16 BE
6.2 Cooperation
6.2.1 Introduction
The economy of the state is based on agriculture which contributes 24% share of the state
SGDP and use 57% of total work force. Co-operatives have a vital role in increasing the
agricultural production. In West Bengal there are 6517 primary agricultural co-operative
2007-08 2008-09 2009-10 2010-11 2011-12 Total 2012-13 2013-14 2014-15 Total
Investment in
marketing
infrastructure
(Rs. crores)
7.27 15.46 19.33 35.19 61.13 138.38 51.31 45.99 81.68 178.98
Improved
realization of
Paddy Price
by farmers
(Rs./ qtl)
690.84 720.80 740.11 1000.11 990.11828.39
(Average)970.12 1265.15 1210.15
1148.47
(Average)
Amount of
Plan expen
diture out of
State
budget(Rs. in
crores)
28.11 35.95 24.62 39.50 66.63 389.62 72.55 100.18 118.12 290.85
11th
Plan Period 12th
Plan PeriodIndicator

114
credit societies. These societies are providing credit facilities for cultivation of crops and also
engaged in supply of fertilizer, pesticides, seeds and other inputs to the farmers. Besides there
are also marketing societies which procure agricultural produce from the farmers for
marketing purpose. Co-operative cold storages assist farmers in preservation of agricultural,
dairy and other perishable products. Some of the co-operative societies possess godowns for
the use of farmers. Hence the co-operative societies have the opportunity to develop
agriculture in organized way through their member farmers. Further such societies are also
functioning as associated sectors of Fishery, dairy, livestock etc.
6.2.2 Major Concerns
Lack of adequate infrastructure of godown in PACs to provide fertilizers, pesticides,
agro-inputs for members at an affordable rate.
Lack of awareness among for farmers about co-operative in the area its opportunities
for their benefit.
With the change of economy from supply driven to market driven, capacity building
of the employees as well as its members assume great significance.
Most of the cooperatives are engaged with short term (ST) credit only whereas
diversified activities are required to be supported for business growth. The co-
operatives have to develop their business plans and implement with right earnest
The co-operatives have to raise to the occasion and be acquainted with concepts of
Agricultural-Export Zones, food and value chain finance, organic farming, ornamental
fishery, contract farming, Agricultural clinics etc. to name a few.
The fund constraint in PACS is a stumbling bottleneck. It is due to the impaired credit
flow. Several factors like high level of accumulated loss, overdue etc. cause this and
requires early resolve
6.2.3 Vaidyanathan Committee Recommendations
Vaidyanathan committee set up by GOI to revitalize the cooperatives has recommended
certain steps in 2005. Facets of Vaidyanathan committee recommendations were financial,
legal (reform linked), HR / Training aspects, computerization of PACS etc.
So far special audit initiated in 5305 PACS of which audit completed and
considered by SLIC and vetted by DLIC are 5289. On a second drive additional number of
188 PACS were taken up for special audit. For 88 PACS out of 188, special audit was
completed and considered by 11th SLIC. Out of 188 PACS, for another 76 PACS special
audit was completed and placed in 12th SLIC. Hence till date special audit has been
completed in 5365 PACS. Out of 4187 PACS to be given recapitalization support, GOI has

115
released for 3161 PACS sanctioned by SLIC. As many as 1026 PACS are left for
recapitalization support as on date.
Hence, with the implementation of Vaidyanathan Committee recommendation and
Cooperative projections supported by RKVY, we assume that farmers concerned with
production of agriculture storage and marketing shall benefit. It is interesting to observe an
additional focus on capacity building of SHGs, development of infrastructure for training and
marketing arrangement being planned in 12 five year plan from districts. RKVY initiatives
together with implementation of these recommendations may give a boost to the coop sector.
In coming days the coops have to be utilized fully to develop agriculture and allied sectors
through the following measures:
To create awareness among farmers and SHG members regarding scientific
methodology of cultivation by soil testing, appropriate use of chemical and bio-
fertilizes (sustainable agriculture), vermin compost, new cropping pattern, sowing of
quality seeds, scientific preservation of harvested seeds etc. Regular farmer’s
motivational camps can be organized throughout the districts.
Quality seeds of oilseed and pulses may be made available through cooperatives to
farmers for seed multiplication. Procurement of such harvested seed may make the
district self-reliant in the sphere of food crops and fodder.
Improved technology in agriculture may reach the farmers in remote villages through
co-operatives due to its wide reach. Modern agricultural machinery may be
maintained by the PACS in the form of Machinery Hubs Members will have to utilize
such implements in following good agricultural practices (GAP).
Strengthening the godown capacity of the coops through repair, renovation, extension
and new construction, the base level infrastructure for supply of agricultural inputs,
implements and procurement of harvested crops may be ensured. Distress sale by
farmers may also be reduced by pledging or marketing through cooperatives. Cold
storage at the cooperatives can help in Post-harvest management of perishable
commodities.
6.2.4 Schemes of Co-operative department
Repairing, renovation and expansion of old rural godowns.
Construction of godowns of capacity 100 MT with office. Such larger godowns are
being constructed from 2013-14 and smaller 50 MT capacity godowns ceased to be
constructed from the same year.
Setting up of seed village societies to supply low cost, certified seeds produced by
members of these societies. A PACS, GONTRA, was the first to implement a

116
profitable co-op seed village. Now seed processing units with higher outlay are being
supported with RKVY and RIDF though there is no convergence noticed. Seed
processing units are also equipped with seed godown, office, etc.
About 46 co-operative cold storage societies were set up with multiple type
ownership, those owned by PACS, PAMS and pure type (by name of co-operative
society). Previously cold storages of 4000-6000 MT capacities were constructed.
Those have become old and non-viable today. Larger cold storages, present day, with
capacity of 6000 MT entail cost of Rs.8 to 10 crores which become prohibitive. Hence
repair and renovation of existing cold storages is allowed by Cooperation Directorate,
rather than large scale expansion
Vermi compost schemes are encouraged.
SHG training for small scale rural household industries (example Sal leaf plates etc.)
are conducted with society members. Even at this level, very small schemes are
discouraged due to viability issue. Thrust is less number of relatively large schemes
with viability assurance (flagship schemes).
Flexi Schemes: Consumer cooperatives (selling agricultural produces) under PACS,
PAMS are encouraged. West Bengal Governments’ new ambitious scheme of “Sufal
Bangla” would be supported by these consumer cooperatives which would process
agricultural commodity directly from members & sell it to consumers.
6.2.5 Performance during XIth & XIIth FY Plan
The yearwise target and achievement of RKVY projects of Department of Cooperation
during XI and initial 3 years of XII FYP is presented in Table 6.3
Table 6.3: Plan Outlay of Cooperation Sector during 2014-15 to 2016-17
(Rs. in Crore)
2014-15 (RE) 2015-16 (BE) 2016-17 (Tentative)
186.00 221.00 243.00
Source: Finaance Dept., Budget publication, Figures of 2016-17 is tentative (10% over 2015-16 BE
6.3 Institutional Credit
6.3.1 Banking Profile
Banking services to the people of West Bengal are provided through Commercial Banks
(CBs), Regional Rural Banks (RRBs) and Cooperative Banks. Kolkata is the Head Quarters

117
of three commercial Banks, viz; United Bank of India, Allahabad Bank and UCO Bank.
United Bank of India is the convenor of State Level Bankers’ Committee (SLBC) in the state.
Besides, under short–term structure, there are District Central Cooperative Banks and
branches of West Bengal Cooperative Bank functioning in the districts of the state. Under the
long-term structure there are branches of Primary Cooperative Agriculture and Rural
Development Banks (PCARDBs) and West Bengal State Cooperative Agriculture and Rural
Development Bank (SCARDB). West Bengal State Finance Corporation (WBSFC) is another
financing agency operating in the state. United Bank of India is the lead Bank in 10 districts,
UCO Bank and Central Bank of India are lead Banks in 4 districts each and Allahabad Bank
is the lead Bank in 1 district. Moreover, there are good network of branches of 3 Regional
Rural Banks (RRBs) in all the districts. Branch network of the banks is given in Table 6.4.
6.3.2 Branch Network
Total number of Bank Branches went up from 6913 as on December, 2013 to 7137 as on
March, 2014 and further to 7315 as on December, 2014. The branch network in West Bengal
is given in Table 6.4. Available figure indicates that the state had 5207 commercial Bank
Branches, 938 RRB branches, 445 Cooperative Bank branches and 547 private Bank
Branches as on 31st March, 2014. Population served per bank branch in the state (13302 -
comprising CBs and RRBs) is on higher side. Barring Kolkata and Darjeeling, the remaining
18 districts are under-banked. Hence it should focus in opening of more Brick and Mortar
branches in these districts with priority on 716 unbanked GP Headquartered villages.
(Source: SLBC, West Bengal)
Table 6.4: Branch Network in West Bengal
Agency Number of Branches as on 31 March, 2014
Rural Semi-urban Urban Metropolitan Total
CBs 2070
(39.73)
831
(15.94)
1073
(20.67)
1233
(23.66)
5207
(100)
RRBs 773
(82.41)
131
(13.96)
32
(3.41)
2
(0.22)
938
(100)
Cooperatives 296
(66.52)
58
(13.03)
73
(16.40)
18
(4.05)
445
(100)
Private Banks 52
(9.50)
124
(22.67)
172
(31.45)
199
(36.38)
547
(100)
Total 3191
(44.71)
1144
(16.04)
1350
(18.91)
1452
(20.34)
7137
(100)
Note: Figures in brackets represent percentage to row total.
(Source: NABARD-State Focus Paper, West Bengal, 2015-16)

118
6.3.3 Deposits
Total deposits of all Banks in West Bengal went up from Rs.406439.60 crores as on 31st
March, 2013 to Rs.463079.26 crores as on 31st March, 2014 and further to Rs.513960 crores
as on 31st December, 2014.YOY growth as on March, 2014 was 13.93 (Table 6.5). It may be
noted that YOY growth has been declining over last 3 years. Commercial Banks which alone
accounted for 81.86% of total deposits in the Banking sector showed a decline in YOY
growth over March, 2013. Share of RRB, WBSCB in total deposits of Banking sector
remained almost same over last 3 years. However, YOY growth of RRBs and WBSCB as on
March, 2014 was more than that of CBs. Private Banks which had a share of 11.60% of total
deposit as on 31.03.2014 also achieved YOY growth of 16.78%. (Source: SLBC, West
Bengal)
Table 6.5 Agency-wise Deposits in West Bengal
(Rs. In crore)
Agency March
2012
YOY
Growth
(%)
March
2013
YOY
Growth
(%)
March
2014
YOY
Growth
(%)
CBs 284643.58
(81.20)
15.01 333932.40
(82.16)
17.31 379089.29
(81.86)
13.52
RRBs 10866.79
(3.10)
10.84 12207.62
(3.00)
12.33 13873.34
(2.99)
13.64
WBSCB 12383.24
(3.53)
5.17 14144.03
(3.48)
22.52 16209.39
(3.50)
14.60
WBSCARDB 105.40
(0.03)
16.14 121.82
(0.03)
15.57 145.53
(0.03)
19.46
Private Banks 42519.18
(12.14)
36.46 46033.73
(11.33)
8.26 53761.80
(11.60)
16.78
Total 350518.20
(100)
16.71 406439.60
(100)
15.95 463079.26
(100)
13.93
Note: Figures in brackets represent percentage to row total.
(Source: NABARD-State Focus Paper, West Bengal, 2015-16)
6.3.4 Loans and Advances
Total advances of all banks increased from Rs.262662 crores as on March, 2013 to
Rs.311877 crores, thus registering a growth of 18.73% over previous year (Table 6.6). Total
advances in the banking system have further gone up to Rs.340420 crores as on December,
2014. YOY growth in advances in the Banking system as also that of CBs have been
increasing over last three years, which is encouraging. While the growth in advances of
Private Sector Banks as on March, 2014 was a staggering 27.58%, other Banks failed to
match it. (Source: SLBC, West Bengal)

119
Table 6.6: Agency-wise Loans and Advances in West Bengal
(Rs. In crore)
Agency March
2012
YOY
Growth
(%)
March
2013
YOY
Growth
(%)
March
2014
YOY
Growth
(%)
CBs 185982
(83.12)
16.27 216759
(82.53)
16.55 255657
(81.97)
17.94
RRBs 5328
(2.38)
20.73 5990
(2.28)
12.42 6919
(2.21)
15.50
WBSCB 7080
(3.16)
-2.21 9089
(3.46)
28.37 10258
(3.29)
12.86
WBSCARDB 947
(0.42)
0.21 1031
(0.39)
8.87 1033
(0.33)
0.16
Private Banks 24428
(10.92)
7.46 29793
(11.34)
21.96 38010
(12.18)
27.58
Total 223765
(100)
14.58 262662
(100)
17.38 311877
(100)
18.73
Note: Figures in brackets represent percentage to row total. (Source: NABARD-State Focus
Paper, West Bengal, 2015-16)
6.3.5 Agency-wise CD ratio
CD ratio in the Banking System as a whole in West Bengal hovered around 65% till 2013
(Table 6.7). However as on March, 2014 it was 67% which is the same for CBs, as well. CD
ratio of RRBs was only 50%. CD ratio of CBs as on December, 2014 reduced to 66%.
(Source: SLBC, West Bengal)
Table 6.7 Agency-wise CD ratio in West Bengal
Agency CD Ratio at the end of (CD ratio in %)
2008 2009 2010 2011 2012 2013 2014
CBs 64 64 64 64 64 65 67
RRBs 44 43 42 45 49 49 50
SCB 74 61 56 61 57 64 63
Private Banks 75 64 70 71 57 65 70
Total 65 63 64 65 64 65 67 (Source: State Focus Paper, West Bengal, 2015-16)
6.3.6 Ground Level Credit (GLC) flow
GLC flow to priority sector fell short of target by Rs.9893 crore as on March, 2014.
However, YOY growth of GLC to priority sector was a stupendous 53.53% (Table 6.8).
Though, there was a huge shortfall of achievement vis-a-vis target in Agriculture sector as on
March, 2014, YOY growth in flow of credit in this sector was as high as 29.66%. Credit flow
to MSE sector during the same period more than doubled and surpassed target substantially.
Credit flow to other priority sector categories also grew over 20% over preceding year and
surpassed target by about 143%. Data shows that almost all agencies have a clear preference

120
towards lending to MSEs at the cost of Agriculture. Till December, 2014, disbursement to
agriculture sector has been Rs. 16439 crore which is nowhere in the vicinity of the target, in
spite of the fact that Banks have surpassed the target of KCC beneficiary (no.) during the
three quarter period ending December, 2014.
Table 6.8 Sector-wise GLC flow in West Bengal (2010-11 to 2013-14)
(Rs. Crore)
Sector 2010-11 2011-12 2012-13 2013-14 2014-15
A A A T A % A T
Agriculture 11554.81 14386.54
(YOY-
24.51%)
15935.08
(YOY-
10.77%)
38389.00 20661.91
(YOY-
29.66%)
53.82 39800.00
MSE 7235.62 8387.12
(YOY-
15.92%)
10463.65
(YOY-
24.75%)
16200.00 21841.55
(YOY-
108.74%)
134.82 16323.00
Other
Priority
Sector
6436.07 5829.07
(YOY-
-9.43%)
6036.85
(YOY-
3.55%)
5104.00 7296.01
(YOY-
20.87%)
142.95 5371.00
Total GLC
flow to
Priority
Sector
25226.50 28602.73
(YOY-
13.38%)
32435.58
(YOY-
13.40%)
59693.00 49799.47
YOY-
53.53%)
83.43 61494.00
T - Target, A – Achievement, Source: State Focus Paper, West Bengal, 2015-16
Table 6.9:Agency-wise GLC flow in West Bengal – 2013-14
(Rs. In Crore)
Agency 2013-14 2014-15
Trget Achievement % Ach Target
CBs 37742.00 37182.65 (74.67%) 98.52 45551.89
SCB/CCBs 9816.00 5243.01 (10.53%) 53.41 5456.52
PCARDB 1430.00 - - 836.82
RRB 8884.00 6246.81 (12.54%) 70.32 8797.37
Other Agencies 1821.00 1127.00 (2.26%) 61.89 851.80
Total GLC flow to priority sector 59693.00 49799.47 100.00%) 83.43 61494.40
Note: Figures in brackets represent percentage to row total.
Source: NABARD-State Focus Paper, West Bengal, 2015-16
In respect of achievement of target as on March, 2014, Commercial Banks marginally missed
the target of Credit flow to Priority sectors. However, performance of other lending agencies
was far from satisfactory (Table 6.9).

121
6.3.7 Kisan Credit Card and Farmers’ Welfare
There has been several remarkable achievements towards the welfare of the farmers. About
2167071 Kisan Credit Card (KCC) have been issued and 1.44 lakh Biometric identity cards
have been distributed to marine fisher persons. The status of Kisan Card distribution in 2012-
13 and 2013-14 is given in Table 6.6. Under Nijo Griha Nijo Bhumi Prakalpa (NGNBP)
landless families has been allotted 5 decimal of land per family. The target is to cover all
landless families in West Bengal by 2015-16. The number of NGNBP Pattas issued/
distributed to beneficiaries up to December, 2014 was 28380.
Table 6.10: Progress on Kisan Credit Card and Credit Flow
Year Item Target Achievement
2012-13
KCC (Nos.) 10,00,000 1000215
Credit Flow (Rs. In crore) 23500.00 17,000.00 (72.3%)
2013-14
KCC (Nos.) 12,00,000 1,80,000(1st Qrt)
Credit Flow (Rs. In crore) 37100.00 7120 (20%) (1stqtr)
Source: Lead Bank – UBI, Source: Govt. of West Bengal, Department of Agriculture: National Conference on
Agriculture for Rabi Campaign – 2013, On 24th& 25th September, 2013 at PUSA Complex, New Delhi
6.3.8 Credit Flow to Agriculture Sector
It has been observed that credit flow to agriculture sector has been increasing over years.
However, in spite of having a growth of about 30% in credit outlay over March, 2013, the
Banking sector could only achieve only about 54% of Target set for the FY 2013-14. Target
of credit flow to Agriculture during FY 2014-15 was set at Rs.39800 crore, whereas
disbursement during FY 2013-14 was only Rs. 20662 crores, thereby envisaging a growth of
about 93%. It has also been observed that MSE sector received preference over Agriculture
so far as credit outlay by the Banking system is concerned.
6.3.9 Financing to Self Help Groups
Commercial Banks, Cooperative Banks and RRBs lent helping hands to SHGs in a big way
which positively impacted the village economy through economic and psychological
empowerment. The number of SHGs having Savings Linked and Credit Linked as on
31.03.2014 are 13,45,814 and 11,77,330 respectively.
Developments that took place in this sector are given Tables 6.11.

122
Table 6.11: SHG Bank Linkage Programme during last five years ending March, 2014.
(Rs. In Lakh)
Year Savings
Outstanding
Bank Loans
disbursed during
the year
Avg.
Loan
per
SHG
Bank Loan
Outstanding
Avg.
Loan
outsta
nding
No. Amount No. Amount Amt No. Amount
2009-10 647879 9322.93 23341 3431.34 0.43 507707 32705.77 0.26
2010-11 666314 0314.14 31912 57589.80 0.43 501284 49924.65 0.30
2011-12 685448 37694.40 99379 5136.55 0.55 382942 157003.37 0.41
2012-13 586821 72694.80 95284 51415.24 0.54 494166 242447.01 0.49
2013-14 591464 81406.51 196746 68514.00 0.35 472554 217850.00 0.46
Source: NABARD-State Focus Paper, West Bengal, 2015-16
The substantial decline in total no. of SHGs savings linked during 2012-13 is mainly
due to weeding out of inactive and dormant SHGs from CBS system of Banks. During the
first three quarters of Financial Year 2014-15, 64317 fresh SHGs have been credit linked
with a sum of Rs.526.65 crore. Average credit disbursal per SHG has gone down from
Rs.55482/= in 2011-12 to Rs.34823/= during 2013-14, which is not at par with other states
like Andhra Pradesh. The State Governments wants credit linkage target for FY 2015-16 to
be Rs.2000 crores.
Recovery against demand under SHG credit came down to 65% at the end of
December 2014 from 79% as on December 2013. In Andhra Pradesh, due to State
Government support, the recovery is always above 98%. Further, proper codification is not
being followed by Bank Branches for SHG Accounts which is necessary for implementation
of Interest Subvention Scheme. The Government of West Bengal has decided to modify its
interest subvention scheme viz. West Bengal Swanirbhar Sahayk Prakalp in such a way that
all SHGs will get loans at ultimate interest rate of 3%.
For the Financial year 2015-16, a potential of 230021 SHGs with a financial
projection of Rs. 3122.63 crores has been estimated. For JLGs a potential of 87151 with a
financial projections of Rs. 1472.74 crores has been assessed.
123
6.3.10 Financial Inclusion
6.3.10.1 Roll out of Financial Inclusion Plan
Based on the national agenda on Financial Inclusion, the United Bank 0f India, being the
SLBC Convener Bank in the states of West Bengal, allocated 7486 villages in West Bengal
state to different Banks, in the 1st phase of implementation of financial inclusion for villages
having population of more than 2000.
Since then, the Banks have made serious inroads in unbanked villages by opening
branches and other outlets. Simultaneously, the Banks together embarked upon opening of
accounts of all those households which hitherto did not have access to banking channels both
in banked or unbanked areas. Following statistical data will speak for itself about progress
made in this direction.
6.3.10.2 Initiatives of NABARD / RBI / GOI relating to Financial Inclusion
NABARD is continuing to extend financial support to Cooperative banks and RRBs
for issue of RuPay KCC as also for RuPay Debit Cards under Financial Inclusion
Technology Fund (FITF). Financial support is also being extended for demonstration
of banking technology using mobile vans, under Financial Inclusion Fund (FIF).
NABARD also continued its efforts in spreading the message of financial literacy in
numerous ways. It included grant support to banks and NGOs for conduct of financial
literacy programmes / campaigns, nukkad plays, puppet shows etc. and also in an
innovative way of painting tractor trolleys, wall paintings in villages and displaying
hoardings at prominent places in rural areas.
SCB and DCCBs in West Bengal have been advised to prepare Financial Inclusion
Plans based on their self- set targets for the years 2013-14, 2014-15 & 2015-16.
RBI has prepared financial literacy guide, financial diary and financial literacy Posters
and placed the same on its website for use by the banks. NABARD has accordingly
sanctioned financial support of Rs.10.00 crore to SLBC, West Bengal for printing and
distribution of the financial literacy material among banks in the state.
The DFS, GOI has clarified that in the under banked districts, all villages with
population of 5000+ should have a bank branch irrespective of the fact whether
another bank branch is located within a radius of 5 km. Banks can set up Ultra Small
Branches wherever opening of B & M branch are not considered viable. There are
889 unbanked Gram Panchayats in the state. The banks have been allocated areas to

124
open Brick & Mortar branches phase wise in these GPs. As on 31 May 2014, banks
have opened brick & mortar branches in 80 GPs.
Prime Minister’s Jana Dhana Yojana (PMJDY) has been launched in the State on 28
August 2014. The State Level Implementation Committee on PMJDY reviewed the
progress in implementation till 15 November 2014. In all the 20 districts of West
Bengal, SSA mapping has been completed and all the 8661 rural SSAs and 2908
urban wards have been covered either by Brick and Mortar branch or through BCA by
banks in the state. Banks have as on 15 November 2014, opened 40,55,069 and
15,16,154 accounts in the allocated SSAs and Wards respectively and issued
24,17,566 Rupay cards. The coverage of households under PMJDY was recorded at
87.97% as on 15 November 2014. While advising the banks on giving emphasis on
customer education and strengthening of financial literacy measures, the state level
implementation committee also discussed the connectivity issues in 1482 identified
locations as also the technical challenges relating to introduction of all PIN based
security guidelines in the FI gateway layer. The issues are being sorted out with all
concerned including Telecom enforcement, DFS, GOI and NPCI.
(Source: NABARD-State Focus Paper, West Bengal, 2015-16)
6.3.10.3 Status of Financial Inclusion in the State
With regard to coverage of unbanked 28140 villages with population less than 2000,
till March 2014, 11604 villages have been covered with banking outlets as against
8405 that was targeted to be covered within March 2014.
Out of 889 unbanked Gram Panchayat (GPs) covering 18 districts of West Bengal,
banks have opened brick and mortar branches in 80 unbanked GPs.
Against the target of 9803 banking outlets to be opened in villages with population
more than 2000, 8957 banking outlets have been opened. Similarly, as against the
target of 12440 banking outlets to be opened in the villages with a population of less
than 2000, 10704 banking outlets have since been opened, thereby taking the total
banking outlets in all villages to 19661 against the target of 22358 outlets.
Available data shows that till 31.01.2015, Banks have opened 89.70 lakh accounts,
under PMJDY, out of which 58.50 lakh accounts were from rural area & rest 31.20
lakh accounts were from urban area.

125
Out of 89.70 lakh accounts opened under PMJDY, Rupay Card has been issued in
72.67 lakh accounts, covering 81%. Pass Book has been issued to 70% account
holders till January 2015.
DBTL has been successfully launched in the state. With effect from 01.04.2015, all
DBT benefits could be routed through banking channel only.
As on 31.12.2014, 27 number of FLCs are operational in the state. FLCs carried out
390 number of outdoor activities during nine months ending December, 2014, where
58679 persons availed the benefit. 14918 no. of persons were already having Bank
accounts and 7360 no. of persons opened account after attending FLC.
West Bengal has 19 RUDSETIs for infusing technical skill, behavioural inputs and
managerial abilities among rural unemployed youth.
(Source: SLBC, West Bengal)
6.4 Agriculture Extension
The agricultural extension arrangements in the State can be broadly classified under four
different heads on the basis of service provider viz.
6.4.1 State Extension service
The Director of Agriculture is responsible for implementation of Government policies related
to agriculture extension in the State. Additional Directors of Agriculture (ADAs) and Joint
Directors of Agriculture (JDAs) are heading the agricultural extension work at State level and
Range (the State has been divided into seven ranges) level respectively. The Deputy Director
of Agriculture, Administration is the nodal authority at district level extension works. Each
subdivision has an Asst. Director Agriculture (Admin) assisted by Asst. Director Agriculture
(SM) to channelize the agricultural extension services in the subdivision. The block level
extension works are carried out by Asst. Director Agriculture. At the Panchayat level, the
Krishi Proyukti Sahayaks (KPSs) are attached to help the ADA to maintain close contact with
the farming community at their respective operational areas.
Eighteen (ten static and eight mobile) Soil Testing Laboratories, three Fertilizer
Quality Control Laboratories, one Pesticide Quality Control Laboratory, one Seed Testing
Laboratory and one Bio Pesticide Quality Control Laboratory are operating in the State to
provide agricultural extension services to the farmers. The other extension services provided
by the department include:-

126
Dissemination of information on modern agricultural practices through publications and
handouts as well as through mass media;
Organizing exhibitions, field demonstrations, seminars, group meetings etc.
Training and capacity building of farmers through nine Agricultural Training Centres
(ATC) functioning in the State;
Production and supply of quality agricultural inputs especially seeds, fertilizers and
pesticides;
Pest and disease surveillance and on-site advisory work.
Matir Katha – Agri Portal of Agriculture Department Gov. of West Bengal
Matir Kaha is an agriculture based portal involving 5 Departments viz. Agriculture,
Agricultural marketing, Animal Husbandry, Fisheries and Horticulture. Through this
portal, useful information in different
Agricultural Sectors are available to serve the
citizens in West Bengal at grass root level. A
wide range of information is covered in this
portal such as name and kind of seeds,
availability, price and quality control of seeds,
suggestions for Season / Area / Crop / variety
wise cropping (based on crop calendar),
different information related to Soil and
Fertiliser, Cultivation Technique of different
crops, crop diseases and their remedies, Agro-Climatic Zones and Schemes for cultivation
of different crops. Regular updation of the content and further addition of Sector wise
information is done. Continuous Training of Nodal Officers in each sector and
sensitization of Stakeholders are arranged for propagation of effective service delivery
mechanism through CSC.
6.4.2 Education / Research Institutions
Three State Universities viz. BCKV, UBKV and WBUAFS, three National Level ICAR
Institutes viz. NIRJAFT, CRIJAF and CIFRI and several Research Stations of ICAR
Institutes such as CRIJAF, CIBA, CIFE, CIFA, CSSRI, NBSS&LUP, IVRI, NDRI,
CPCRI and CTRI are operating in the field of agricultural research and extension services
in the State These institutions are working in close association with State Agricultural
Department in the State for dissemination of knowledge and transfer of technology.
Krishi Vigyan Kendras (KVK) or Farm Science Centres are specialized institutions
providing vocational training to farmers based on learning through work experience.
There are 18 KVKs in the State functioning under different Agricultural Universities,

127
NGOs and ICAR. The KVKs are strategically located covering different agro climatic
regions catering to location specific training, demonstration and extension needs.
Nineteen centers of Agricultural Technology Management Agency (ATMA) are
facilitating a participatory mode of extension delivery, which are farmer driven and
farmer accountable. State Agricultural Management Extension and Training (SAMETI) is
operating from ATC Narendrapur.
Kisan Call Center is in operation in the State (in line with the all India system) to
facilitate the farmers in providing advice and latest information in agriculture.
6.4.3 NABARD
NABARD has been instrumental in facilitating the adoption of new/upgraded technology by
farmers/entrepreneurs to promote increased productivity and production. NABARD has
devised a scheme known as Capacity building for Adoption of Technology (CAT) through
exposure visits and training the farmers preferably marginal, small and tribal to enable them
to adopt proven technologies in agricultural developments made by research institutes,
corporate houses, NGOs, progressive farmers/entrepreneurs. The entire cost towards such
visits / programmes is supported by NABARD.
6.4.3.1 Farmers’ Club
Farmers’ Club programme of NABARD is an initiative towards capacity building of farmers.
NABARD has facilitated exposure visits, training programmes, demonstrations, market
access programmes for these clubs. In West Bengal FCs are engaged in supplementing
extension services of State Government Line Departments in the field of Agriculture, Animal
Husbandry, etc. FCs are actively involved in developing awareness/imparting training to
farmers regarding use of bio-fertilizers, production of vermin-compost, crop diversification
and adopting more scientific cropping practices.
6.4.4 Non Government Sector
In West Bengal, effort have been made to supplement the public extension system through
private extension machinery like NGOs, Farmers’ Clubs, SHGs, Farmers Interest Groups,
Women Groups, Farmer Association and Farmer Cooperatives. They are actively involved in
extension services including technology transfer through capacity building, skill development
and support services.

128
Private extension machineries created in the state are presented below:
No. of Farmers Interest Group Formed: 560 nos.
No. of Commodity Organization formed: 60 nos.
No. of NGO attached with the extension system: 130 nos.
No. of Farmers’ Producer Organizations (under different initiatives): 150 nos.
No. of Agri- entrepreneurs and Agribusiness established: 35 nos.
No. of Agro Service Centres formed: 25 nos.
No. of Farmers Clubs established (as on 31March 2015): 7125 nos.
Agri-portal, a website created by Department of Agriculture, Govt. of West Bengal is playing
a major role in providing extension services to the farmers
6.4.5 Major Concerns
Involvement of multiple agencies with overlapping objectives
Need for technology transfer is felt more in agriculturally and socio-economically
backward districts.
A well-coordinated approach is apparently lacking with different players adopting
independent, target oriented approach.
Limited attempts to understand the farmers’/location specific needs
Emphasis on technology transfer without fully understanding social/psychological
barriers of target groups (farmers)
Importance is not attached to participatory approach with involvement of
farmers/entrepreneurs
6.4.6 Possible Interventions
1. A co-ordinated approach among all Research & Extension organizations at
regional/district level in assessing the extension needs.
2. Using the village / field level groups like Farmers' Clubs / NGOs / other agencies for
facilitating effective transfer of various technologies already developed at the above
institutes
3. Utilization of various promotional funds created by NABARD like FSPF, CAT etc.,
by the research and extension organizations/ bodies like KVKs
4. Collaboration with ATMA at State / District Level

129
6.5 Agricultural Research & Education
6.5.1 Agricultural Universities
Three State Agricultural Universities, viz. Bidhan Chandra Krishi Viswavidyalaya, Uttar
Banga Krishi Viswavidyalaya and West Bengal University of Animal & Fishery Sciences are
the pioneer Institutes of the education and extension system in agriculture and allied sector in
West Bengal. Besides, there are faculties at Visva-Bharati Sriniketan in the name of “Palli
Siksha Bhavana”, Institute of Agricultural Science under Calcutta University, Indian Institute
of Technology, Kharagpur, Ramkrishna Mission Vivekananda University and several
colleges for undergraduate and postgraduate education and research in various agriculture
related disciplines.
Bidhan Chandra Krishi Viswavidyalaya (BCKV)
BCKV was established in 1974 at Mohanpur in Nadia district to provide facilities for the
study of Agriculture, Horticulture and Agricultural Engineering. It has become the pioneer
institute of agricultural education, research and extension and undertake the educational and
extension programmes in agriculture among the ruralstakeholders, keeping in view the
requirements of the state. The University has an extended campus at Burdwan, The College
of Agriculture, for studies in agriculture at undergraduate level and 12 farms distributed in
1340.6 acre of land to conduct need based research and extension activities for transfer of
technologies to the stakeholders and farmers.
Uttar Banga Krishi Viswavidyalaya (UBKV)
UBKV was established in 2001 at Pundibari in Coochbehar district to cater the needs of the
farming community and stakeholders especially in the six northern districts of West Bengal
which is endowed with diverse natural resources and agro regions. The region is
predominantly agrarian in nature characterized by low productivity and subsistence farming
with limited number of crops leading to poor economic condition of the people. The
University plays an important role in taking care of region specific problems and
dissemination of improved technologies to increase agricultural and horticultural production,
productivity and rural livelihood. The University has three faculties viz. Agriculture,
Horticulture and Agricultural Engineering which offer undergraduate and post graduate
degrees besides research in agriculture and horticulture. A College of Agriculture under the
control of the University has been set up at Tapan in Dakshin Dinajpur district for studies in
agriculture at undergraduate level and extension activities for transfer of technologies to the
farmers and stakeholders.

130
West Bengal University of Animal & Fishery Sciences (WBUA&FS)
WBUA&FS was established in Kolkata in 1995 to impart education, training and conduct
research in veterinary and animal sciences, dairy sciences and fishery sciences and also to
cater the needs of the farming community of the State. Besides education and extension, the
three faculties of the University viz. Veterinary & Animal Sciences, Dairy Technology and
Fishery Sciences conduct research for improved management of animal and fishery
resources, disease problems, nutrients, water resources and environment. The research,
extension and farm activities of the University are organized through the Directorate of
Research, Extension & Farms of the University.
6.5.2 ICAR Institutes
Central Research Institute for Jute and Allied Fibres (CRIJAF), Barrackpore
CRIJAF undertakes basic, strategic and applied research for the development of natural fibre
crops viz., Jute, Sisal, Ramie, Sunnhemp, Mesta and Flax. The institute with its four regional
research stations along with All India Network Project on Jute and Allied Fibres and a Krishi
Vigyan Kendra has immensely contributed towards enhancement of productivity as well as
development of technologies on improvement of jute and allied fibre crops to cope them in
changing climatic situation and also to suit for diversified uses through application of
biotechnological / genetic engineering tools. Jute has a great socio-economic role for the
eastern part of the country as it provides livelihood to more than 4 million farm families. The
institute play an important role in production and quality improvement of jute and allied
fibres through dissemination of technologies to farmers and other stake holders.
National Institute of Research on Jute and Allied Fibre Technology (NIRJAFT),
Kolkata
A premier institute under Indian Council of Agricultural Research, NIRJAFT is dedicated to
the research of jute and allied fibres leading to the diversified use and industrial growth.
The institute is mandated to carry out basic and technological research on jute and allied
fibres to promote production of good quality fibres and find diversified uses of plant fibres,
their agricultural by-products and industrial wastes in large scale and decentralised
sectors. The Institute conducts regular training programmes to prospective entrepreneurs in
small and medium sectors and other stakeholders on production of jute based diversified
products. The Zonal Technology Management (ZTM) & Business Planning and Development

131
(BPD) at the Institute is an Indian Council of Agricultural Research initiative under National
Agricultural Innovation Project, component-I scheme. The aim of this activity is to identify
the potential marketable technologies ready for commercialization under public-private
partnership framework and make consistent provision of consultancy and training for creating
prospective entrepreneurs and value added manpower.
Central inland Fisheries Research Institute (CIFRI), Barrackpore
CIFRI is the oldest premier research institute in the field of inland fisheries research and
training in India. The Institute undertakes basic, strategic and applied research in inland
open-water fisheries viz. rivers, reservoirs, lakes, estuaries and associated waters to develop
ecosystem-based technology and strategies for productivity enhancement in mandated waters
and monitor environmental changes and their impacts on fisheries. The vision of Institute is
“Sustainable fisheries from inland open waters for environmental integrity, livelihood and
nutritional security”. The Institute has four Regional Centres at Allahabad, Guwahati,
Vadodara and Bangalore through which it creates awareness on conservation of biodiversity,
integrity of ecological services and to derive social benefits from inland open waters. CIFRI
organizes short-term training programmes on different areas of inland fisheries development
and on natural resource management basis to University faculties, Government Officials,
KVK personnel, Fishery Cooperatives, NGOs, Self Help Groups and Inland fishers/women
6.5.3 ICAR Regional Research Stations
There are 12 ICAR Regional Research Stations located in different districts of the State and
linked to ICAR Institutes, each working on specific area relevant to regional problems in
agricultural and allied sector. The list of ICAR Regional Research Stations is given in
Table 6.12
Table6.12 : ICAR Regional Research Stations in West Bengal
Sl
No
ICAR Regional Research Station
& Host Institute
Activity
1. Central seed Research Station for
Jute and Allied Fibres, Bud Bud,
Burdwan
Central Research Institute for Jute
and Allied Fibres, Barrackpore
production of nucleus seed of jute and allied
fibres
multiplication of breeder seeds of notified
varieties of jute & allied fibres
2 NBSS&LUP Regional Centre,
Kolkata
National Bureau of Soil Survey &
Land Use Planning , Nagpur
soil survey and mapping together with soil
correlation and classification, assessment of
soil degradation pedological research,
remote sensing and GIS application for land

132
management practices in eastern region
3 CSSRI Regional Res. Station,
Canning Town
Central Soil Salinity Res. Institute,
Karnal
develop strategies for sustainable
management of degraded coastal land and
water for enhancing livelihood securities of
farming communities
4 CIFE Kolkata Centre
Central Institute of Fisheries
Education, Mumbai
basic and strategic research in frontier areas
of fisheries
training and educational programs in
Fisheries Management/ Aquaculture/ Fish
processing
consultancy and advisory services
5 IVRI Regional Station, Kolkata
Indian Veterinary Research
Institute, Izzatnagar
regional problem-oriented basic and applied
research on improvement of animal resource
of Eastern and North-Eastern Region
imparts post-graduate education and
specialized training courses for the field
veterinary officers
7 CTRI Research station, Dinhata,
Central Tobacco Res. Institute,
Rajahmundri
Cigar wrapper, Jati and Motihari tobaccos,
management of pests and diseases,
reducing cost of cultivation for benefit of
farmers
finding suitable inter crops for tobacco
8 CPCRI Research Centre,
Mohitnagar, Jalpaiguri
Central Plantation Crops Research
Institute, Kasaragaod
location-specific and need based research on
crop improvement, production, protection
and extension on plantation crops and spices
to cater to the needs of the farming
community of Sub Himalayan Terai region
9 CIFA Regional Research Centre,
Rahara
Central Institute of Freshwater
Aquaculture, Bhubaneswar
research for developing wastewater
aquaculture practices for economically
viable fish production systems for
livelihood, water use efficiency and farm
income
10 CIFA Regional Research Centre,
Kalyani
Central Institute of Freshwater
Aquaculture, Bhubaneswar
research for developing sustainable and
diversified freshwater aquaculture practices
for enhanced productivity, quality, water use
efficiency and farm income and provides
training and consultancy services
11 NRCO Darjeeling Centre
National Res. Centre for Orchids,
Sikkim
protected cultivation of orchids and
conservation of germplasm
collection, maintenance and characterization
of orchid species
12 CIBA Kakdwip Research centre,
Kakdwip, 24-parganas(S)
Central Institute of Brackishwater
Aquaculture , Chennai
development of culture technologies for
crustaceans and fin fish

133
6.6 Food & Supplies
6.6.1 Gap Analysis
The total storage space required for storage, warehouse and godowns is not adequate in the
state as can be observed from the following estimates of the Department of food supply.
Table 6.13: Present capacity and requirement of storage space in food supply services Minimum
storage
capacity
required
(Lakh MT)
Existing
storage
Capacity
with State
(Lakh MT)
Existing
storage
Capacity
with FCI
(Lakh MT)
Total
existing
Capacity
(2 + 3 )
(Lakh MT)
Additional
storage
capacity
required
(Lakh MT)
Capacity
constructed/ under
Construction
(Lakh MT)
Further
Capacity to
be developed
(Lakh MT)
(1) (2) (3) (4) (5) (6) (7)
21.14 6.53 5.61 12.14 9.99 1.45 8.55
Source: Food & supplies Dept., GOWB
The Department of Food & Supplies envisages development of 8.55Lakh MT storage space
to cater to the requirement. The Department of Food and Supply started accessing RKVY
Funds from the year 2013-14. RKVY support was utilized in creating new storage capacity &
ancillary works. During 2013-14 an amount of Rs.3.22 crore was utilized by the Department
for recovering a capacity of 19000 MT by providing 16 shades to existing godowns and
making them storage worthy. The Department has also undertaken an exercise for building
godowns of a total capacity of 2.14 lakh MT at several locations by private entrepreneurs
under GOI scheme.
6.6.2 Action Plan .
There is huge potential for storage space such as departmental warehouses and godowns
that needs to be developed. Resource mobilization from different sources such as RKVY
and RIDF to bridge the gap besides higher allocation in the core plan.
Development of storage space by private entrepreneurs, development in PPP mode would
be facilitating in fulfillment of the need.

134
CHAPTER VII
STATE PLAN
Strategies & Interventions

135
The XIIth Five Year Plan, which is being implemented in West Bengal along with rest
of the country during 2012-13 to 2016-17, offers a significant opportunity for overall
development of the State of which Agriculture and Allied sectors play a very important role.
The state has envisaged a 4% growth rate in Agriculture and Allied sectors. However, in
order to achieve the goal some strategic issues are to be addressed in a concerted manner. The
strategy devised and interventions chosen for reaching the targeted growth and to facilitate
attaining the mission of doubling farmers’ income by 2020 are enunciated below:
7.1 Agriculture
Soil health card (SHC) and personalized nutrient advisory to ‘all farmers of West
Bengal’.
Seed Mission’ to ensure state seed requirement by production, certification and seed
replacement with improved varieties. Seed mission initiated by the Department of
Agriculture would be augmented further to ensure timely availability of quality seed
at competitive price.
Facilitate productive use of Rice fallow and Current fallow. This is aimed to facilitate
economic use land enabling the farmers to take up more crops. This would also
support in the efforts to enhance farm income, necessary support and handholding to
farmers would be ensured.
To facilitate effective and economic use of land, land use planning would be
facilitated. This would be attempted through- Soil resource analysis, Classification of
land according to capability, ascertaining suitability of soil for different crops based
on which effective selection of crops to be cultivated can be facilitated, developing
crop matrix based on suitability, mapping irrigation requirement of crops and
developing a matrix for effective water use as also to balance water availability with
water demand and use.
Enhance cropping intensity and maintain cultivable area by dissuading diversion of
land for non-agricultural use.
Adoption of location specific strategies for enhancement of productivity of agriculture
and allied sectors. Upgradation f technology for reducing cost of cultivation with
integration of the ITKs.

136
Promotion of Organic farming and increased application of organic manures
(Vermicomposting, Organic manure application, green manuring, azola cultivation,
etc.) will enhance of soil quality, fertilizer use efficiency and crop productivity.
Conservation agriculture like zero tillage, mulching, etc. to be promoted for better soil
health and carbon sequestration.
Erosion control of land through appropriate land and water management practices and
reclamation of problem soils like acid soils will increase productivity.
Water saving technology like SRI in Paddy cultivation may be promoted
Integrated farming system with agricultural& horticultural crops with pisciculture,
animal husbandry and poultry to be adopted along with practices like INM and IPM
for higher productivity, income and conservation of environment.
Bringing more areas under Irrigation by creating and increasing irrigation potentiality.
Promoting crop diversification and integrated farming
Replenishment of nutrients loss through mining.
Identification, conservation and up-gradation of genetic resources of crop, animal,
birds and fisheries
Plot level & Geo referenced e-pest surveillance would be facilitated to ensure better
management of pests and diseases. This would also effect timely action against any
possible spread of disease/pest containing the threshold of damage.
Planned promotion of Organic practices and certification under the Participatory
Guarantee System (PGS).
Demand driven Crop diversification and integrated farming to facilitate better price
realisation. Integrated farming practices provide fall back options for farmers in the
event of failure of any of the farm enterprises thereby reducing possibility of farmer
facing distress.
Ensure timely availability of quality/ certified inputs. Constraints of input availability
impedes agricultural growth and profitability.
Suitable backward and forward integration.
Empowering all farmers with customized, personalized and localized information for
Agriculture, Animal resource, Fisheries for production, processing and marketing
with ICT interventions (G2F services).

137
Promoting & replicating Innovative & Best practices of Progressive Farmers of the
State in Agriculture and Allied areas.
Developing Centre of excellence for Modern Technology demonstration at Matitirtha
Krishi Katha (Permanent site for Mati Utsab).
Identification of climate change impacts on water resource, pests and pollination and
adopting suitable strategies to mitigate adverse effects on Crops, Birds and Fish.
Judicious use of water and enhancing water use efficiency.
Agronomic interventions to combat weather aberrations.
Facilitate Farmers’ Producer Organisations (FPOs), Farmer Producer Companies
(FPCs), Farmers’ Clubs, SHGs under take aggregation, sorting, grading and other
work to effectively link farmers with market, promote linkage with the buyers so as to
ensure better price realisation for farmers.
Enhance storage space by creation of additional storage capacity by the Department of
Food & Supplies.
7.2 Horticulture
7.2.1 Vegetables
Increase productivity of vegetable crops as a whole (on an average 20 t/ha) through
adoption of modern production technologies.
Establishment of organized markets and proper logistic support in the existing important
markets.
Establishment of at least 2 Multi chamber vegetable storage at intensive vegetable
growing clusters of major vegetable growing districts.
Establishment of processing industry (at least 10 % of total production may be utilized
during glut season) for different value added products like frozen product of sweet
pepper, French bean, pea, assorted vegetables; pickles; dehydrated vegetables etc. which
have good domestic and export demand.
Promotion of incentive-led schemes for cultivation of high value and off-season (Summer
and Kharif) vegetables like, coloured sweet pepper, cherry tomato, tropical cauliflower,
coriander leaf, tropical radish, palak, etc. under low cost poly house.
Promotion of net house cultivation of vegetables particularly brinjal in major brinjal
producing districts.

138
Establishment of poly tunnel for seedling raising during rainy season in at least 50 nos.
per block.
Storage of rabi onion to mitigate the crisis during July- September and to keep the price
of onion reasonable in the market. Natural ventilated storage structure is to made with
brick, bamboo and straw
Cultivation of Kharif onion using uplands of Blocks of major growing districts to supply
onion during November- December.
Improved technology for onion seed production particularly in Balagarh block is to be
disseminated. Seed bin with airtight technology is to be provided to each of the onion
seed grower for longer storage of seed.
Good scope for crop diversification with different vegetable crops like kharif or early-rabi
onion, high value exotic vegetables like, broccoli, leek, celery, lettuce, cherry tomato,
sweet corn, etc..
Assured supply of organic inputs like neem based products, vermin compost, pheromone
trap, bio-fertilizers, etc. particularly in the major vegetable producing blocks, Formation
of entrepreneur-led farmer cluster for export-oriented production of different tropical,
high value and exotic vegetables to Bangladesh, United Arab Emirates and other
neighbouring countries.
Introduction of farm machineries particularly small machineries in vegetable cultivation
has wide opportunities in the districts.
Popularization of the concept of INM & IPM through different training programmes for
reducing cost of cultivation of vegetables.
Awareness creation among farmers for “Good Agricultural Practice” and among the
intermediaries/ exporters/processors for the quality aspects and requirements with respect
to sanitary and phyto-sanitary measures (SPS), CODEX, HACCP through organized
training programmes preferably in B.C.K.V, Kalyani
Development of Agri-Business consortium at the block level with the participation of
local panchayats, cooperatives and rural educated youth in Public-Private partnership
model to link the products with collective retail facilities in block which will facilitate
efficient marketing of different vegetables.
Establishment of plant health clinic in Public-Private partnership model at the block level
and e-pest surveillance programme in collaboration with B C K V.
139
Improved productivity by way of quality germplasm, planting material and water use
efficiency
Encourage aggregation of farmers into farmer groups like FIG/FPOs to bring economy of
scale and scope.
Support skill development and create employment generation opportunities for rural
youth in horticulture and post-harvest management especially in cold chain sector.
7.2.2 Fruits
Introduction of improved variety of paculture and papaya having average fruit weight is
500g-1kg as per need of the farmers as small fruits have more demand in the market.
Establishment of papaya nurseries for production of disease-free and healthy seedlings
Promotion of tissue culture of G-9 variety of banana having higher yield potential and
market demand. At least 40% banana area may be converted with G-9 variety.
Improved production technology including bunch cover for growing tissue culture banana
especially G-9 variety
Establishment of model orchard in the clusters.
Promotion of cultivation of Dofala varieties of mango as they can supply fruits during off
season like September-October
Establishment of mango processing industries for making pickles, jam, jelly, etc., at least
2 nos. in the clusters. ( 10% of the produce may be utilized)
Promotion of processing industry in the Medium and micro scale, invoving the
department of MSME as per need. Small scale pulping units for Mango, canning units for
Pineapple, Processing units for cashew nut, betel nut has good potential.
7.2.3 Flowers
Establishment of more number of organized markets for flowers
Establishment of more poly house (Naturally ventilated tubular structure) for flower
cultivation in the clusters for growing gerbera, rose, etc.
Emphasis is to be given to introduce new flowers such as Asiatic lili, Orchids,
Anthurium, Carnation etc.
Adoption of improved production technology for commercial flowers like, Orchids,
Anthurium, Marigold, gladiolus, gerbera etc.

140
Practice of growing inter crop with vegetable to increase income.
Establishment of seedling nursery and crop specialized nursery like chrysanthemum, rose,
palm nursery.
Establishment of one tissue culture laboratory for producing ornamental plants like
Gerbera, carnation etc. in intensive flower growing areas
Adoption of proper package of practice for post-harvest handling and packaging of
flowers.
Introduction of Micro Irrigation system in flower cultivation.
Establishment of poly house (Naturally ventilated tubular structure) in the clusters for
growing gerbera, rose, etc.
7.2.4 Spices Adoption of proper package of practice of spices for quality production of spices.
Establishment of spice industry in the local area for promotion of spice cultivation.
Tying up with local level exporter through spice board for promotion of spice business.
Introduction of Black Pepper cultivation in North Bengal districts to increase the income
of farmer.
Availability of improved variety of seed spices.
7.2.5 Plantations
Conversion of conventional and traditional baroj of betelvine into net house for better
production and productivity.
Introduction of Drip & Fogger system in conventional baroj.
Adoption of proper phyto sanitary measure for betelvine cultivation.
Adoption of proper agro practices for maintenance of traditional coconut and areca nut
plantation. Establishment of Coconut based industry for creation of employment.
Production of good seedlings of coconut and arecanut in Govt. farm and reputed nurseries
There is a vast area of date palm whose potentiality is under exploited. Special
programme will be taken for survival of molasses industries from the date palm sap.
Utilization of existing Arecanut and Coconut plantation through growing of black pepper
under multi-storied cropping.
Cultivation of Oil Palm especially in Govt. land and establishment of oil extraction unit.

141
7.3 Animal Resource Development
Intensification of breed up gradation programme (one AI Unit / 1000 breedable
female – Target: 15000 units in next 5 years.
Strengthening of calf rearing at village level.
Commercial dairies in private sector at Block level.
Creation of Fodder Bank, including fodder seed and Azolla inoculum banks in 5 state
fodder farms and promotion of fodder cultivation.
Milk route development by dairy cooperatives through formation of Milk Unions in
each district.
Commercial layer and broiler farms (with mechanization) in private sector in block
level.
Creation of two Poultry Hubs with modern hatcheries in North and South Bengal
Strengthening of successful ongoing schemes like Backyard poultry, duckery and
quail farming especially among marginal farmers, landless , SC & ST families
Creation of Buck Mother Farm in Government and private sector. Introduction of AI
in goat.
Integration of livestock with agriculture for feed and fodder
Engaging SHG in livelihood linked dairy, goatery, poultry and piggery
Hygienic meat marketing centres at block level through private sector.
One Animal Health Centre for every three Panchayats
Mobile Veterinary Dispensaries at block level with a target of 50% coverage of total
blocks. Linkage with M Kissan / Kishan Call Centre (KCC), etc.
Awareness / training on Bio-security measures in poultry sector.
Poultry vehicle washing station in each block as a preventive measure against spread
of disease etc.
7.4 Fisheries
More culture area coverage by developing-
i) Renovation of beels/ boars ( 100 ha)
ii) Renovation of semi -derelict /derelict tanks/ ponds ( 50 ha)
iii) Estuarine resource.

142
Target of higher production by 2050kg /ha /yr in FFDA ponds, and 700kg in non-
FFDA ponds.
Special emphasis to be given for increasing fish production in less fish-producing
districts compared to available area, like Darjeeling(Siliguri), Jalpaiguri, Coochbehar,
Malda, South 24 Parganas, Purulia and Bankura.
Special drive for increase in production in districts with low production (Purulia,
Birbhum, South 24 Parganas, Malda, Cooch behar, Jalpaiguri).
Seasonal aquaculture (fingerlings rearing, magur culture) in rainfed ponds of Jangal
Mahal, Birbhum.
Culture in ponds under Jal Dharo Jal Bhoro Scheme.
Reservoir Fisheries - Proper stocking and management in 30 % area especially of
small reservoir.
Establishment/promotion of three Freshwater ‘Fish Brood Banks’ in Kalyani,
Barasagardighi and Junput Farms
Programme for seed production in comparatively less seed producing districts especially
Purulia, Birbhum, South 24 Parganas, Malda, Coochbehar.
Establishment/ promotion of three hatcheries for cold water fishes in North Bengal.
Accreditation of private hatcheries, and training on brood stock management.
Upgradation/ establishment/ promotion of 50 magur hatchery at block level.
Promotion of integrated farming system, like fish–livestock-horticulture, and rice-fish-
horticulture-livestock for optimum utilization of farm resources as well as climate
resilient options. Fingerlings rearing in vast waterlogged rice fields can be viable option
of effective use of non-conventional fishery resources.
Emphasis on Seabass and mud crab culture in brackish water sector.
The production in estuarine sector should be increased by proper conservation of
fauna and efficient capture mechanisms. However, mangrove based culture system
may be developed with a programme in pilot scale.
Identification, conservation and upgradation of indigenous fish genetic resources
including ornamental fishes.
Establishment/ promotion of Fish Feed Plant in five Zones
Marine Sector-
A. Strengthening of modernizing capture devices and safety programmes.

143
B. Installation of Fish Aggregating Device (FAD) in sea in pilot scale
Introduction ‘Mastyabandhu’ scheme with fish health management advisory service
Sufficient and timely availability of credit facilities should be ensured for fishermen
cooperatives, SHGs, farmers clubs and groups. Leasing of water bodies should be fast
and for more tenure (7 years period).
7.5 Agriculture Mechanisation
Custom operation of power equipment and machinery cooperatives should be encouraged
to extend the use of efficient equipment and power units to small and marginal farmers.
Any appropriate business model can be adopted.
Facilitating growth in Farm Power to 2.5kw/Ha.
Package of multi crop implements/equipment for different sub zones in the state may be
identified and popularized.
Power operated weeders for narrow and wider row crops will have to be introduced and
popularized. Ergonomically designed long handed manual tools may be introduced for
reducing drudgery of manual field operations.
Presently harvesting is done by sickles. Combines and harvesters for almost all crops are
available and will have to be introduced and popularized for timely harvesting.
The level of mechanization of horticulture crops is less. In order to compete in quality and
productivity, it is necessary to introduce different tools and equipment for different types
of horticulture crops.
The government in cooperation with R&D institutions and manufacturers should work
out a mechanism to plans for development and introduction of farm machineries for
mechanization of specialized crops, horticulture and agroforestry.
Adequate facilities should be created and expanded for training of trainers,
drivers/operators, mechanics, and manufacturers to support the agricultural
mechanizations, performances. Training in operation and management of farm machinery
and power units for farmers should be available at district level.
Local manufacture of good quality agricultural tools and machinery should be encouraged
through logistic and technical support and credit facilities.
.Different types of manually operated and power operated garden tools will have to be
introduced and popularized for promotion of raising seedlings for growing of fruits,

144
vegetables and flowers and for work in the garden. Equipments like vegetable planters,
furrowers, cultivators, pit hole digger, power weeders should be given greater thrust.
Farm machinery clinic-cum-primary processing centers at block level with all service
facilities and trained local manpower to man the centers may be established and their
progress to be constantly monitored.
7.6 Water Resource Development
Promote better use of surface water sources by facilitating trapping water (Jal dharo Jal
Bharo), storage of water in new/ renovated ponds and check dams etc.
Increase the reservoir storage potential of major irrigation projects by way of removal of
siltation in the reservoirs and lining of the sides of the canal systems etc.
Preparation of district wise and block wise water resource and hydrological maps
Creation of surface water based irrigation schemes (lift irrigation) identifying feasible
areas and required water flow.
For southern part having hard rock areas, tank cum well system can be used to create a
reliable irrigation for a two crop rotation.
Encouraging rain water harvesting ponds in farmers’ fields and community ponds for
small and medium farmers.
Modernization of irrigation system using drip, sprinkler systems.
Periodical monitoring of ground water level fluctuation in different blocks by establishing
suitable network of hydrograph stations.
Delineation of aquifers containing salinity, arsenic, fluoride, iron and other heavy metals
beyond permissible limits.
Implementation of pilot schemes for artificial recharge of ground water
Establish high resolution weather monitoring, river inflow monitoring, hydrograph
monitoring and early warning system for floods.
For northern hilly districts, technologies harnessing low discharge small springs with the
use of LDPE film lined tanks and run off recharging tanks can be used to provide reliable
irrigation.
Capacity building of farmers, field functionaries through training and demonstrations
with the active participation of agricultural university, KVK’s and industries.

145
A strong coordination mechanism to be put in place at the state and district level for
proper dovetailing of schemes including land development, agricultural, horticultural and
water management.
Participatory irrigation management (PIM) by forming Water users’ associations (WUA)
to facilitate ownership of projects by users , create better interface with users and enable
them to own the project for future maintenance to facilitate sustainability and proper use
of the asset created.
Augmentation of drainage facilities to facilitate cultivation, improve soil health and avoid
pitfalls of continuous submergence.
Promoting consumptive water use and rainwater harvesting for surface, sub-surface and
underground water resources
Jalatirtha – In order to facilitate use of surface water a special initiative of construction
of around 800 check dams has been initiated by the Government of West Bengal. The
emphasis of this initiative is to facilitate use of surface water for irrigation and other uses
by facilitating impounding and storage of water. Involving the beneficiaries by way of
promoting users associations and preparing them to take over the structure for future use
and maintenance is the key feature of the scheme. Capacity building of the user groups is
an important facet of the initiative along with construction of the check dams. It is aimed
to foster a participative effort towards water use.
7.7 Soil Conservation
Reclamation of sand laden areas to protect arable lands from flash floods.
Plantation of horticulture crops / mixed plantation on uncultivable waste lands and
converting them into productive lands.
Farm forestry / agro-forestry practices on dry lands.
In-situ moisture conservation by way of field / contour binding, graded bunding etc.
Rain water harvesting through excavations / re-excavations of water storage structures
/ dug out ponds / farm ponds / tanks
Development of cultivable waste lands into arable lands through land levelling.
Construction of Dhal bunds and contour bunding for recharging of ground water.
Drainage line treatment, de-siltation and construction of check dams.
Stream bank erosion control measures through strengthening.

146
Training on soil and water management practices.
7.8 Agro Processing
Setting up of agro processing units/cold chains close to the source/centers of raw
material of production by creating common infrastructure facilities.
Special incentives like grant/subsidy to small and marginal farmers, women
entrepreneurs for creating infrastructure/setting up of units for value addition.
Setting up of new and upgradation of rice mills and husking mills to enable reduce
wastage, production of more nutritious rice and other rice based by-products.
Encourage public private partnership to establish cold chain, pre and post-harvest
network infrastructures.
Establishment of packaging development centre for promotion of low cost packaging
and common service for processing.
Multipurpose cold storage units suitable for storing fruits, vegetables, flowers, fish,
meat, milk and milk products.
Establishment of seed processing and packaging centre.
Setting up units engaged in production of fermented vegetables, dehydrated fruits and
vegetables, pickles, pulp from fruit and vegetables, crude oil extraction from aromatic
and medicinal plants.
Establishment food safety, standard testing facilities
Marginal and small farmers engaged in horticulture should be organized into producer
cooperatives and assisted to enter into legal arrangements with processing industries
with proper protection of their interests.
Establishment of primary processing centers in villages run by women self help
groups for processing local agricultural produce.
7.9 Forest
Enhancing quality of moderately dense forest, open forest and degraded forest
Enhanced fire prevention and fire management
Preventing man-animal conflict
Protecting livelihood dependent on forest produce
Spring recharge and enhancing good water recharge in forest areas
Mitigating impacts of landslides, storm surges and fast river run off

147
Establishment of fruit tree / tree outside the forest for meeting the target of green
forest cover.
Improvement of soil health by suitable intercrops and pisciculture species.
Transfer of technology to the farmers’ field with integrations of land and market.
Distribution of planting materials (fruit sapling / saplings of different tree species) out
of nurseries made of polyhouse.
Afforestation with various economically viable species of plants.
Cultivation of Jatropha on waste land as a raw crop as strong fence along field and
forest boundaries.
Establishment of bamboo plantation as the effective tool for vegetative cover in forest
and non-forest area.
Livelihood development through implementation of different backyard forestry
models like cultivation of orchid, medicinal plants etc.
Development of nursery for social forestry.
7.10 Sericulture
Improvement in production, productivity and product quality with special emphasis
on Tasar sector.
Evolution of climate / season specific disease resistant hardy and robust silk breeds.
Establishment of Silk park in Malda.
Thrust on quality silk seed production in both public and private sector.
Intensive support to sericulture for construction of ideal rearing home and
procurement of plantation and rearing inputs/appliances and disinfectants.
More coverage on crop insurance sector.
Emphasis on HRD for knowledge and skill development among stakeholders.
7.11 Agri. Marketing
Developing more storage structures (Godown, warehouse, cold storages) to minimize
loss of post harvested perishable and non-perishable agricultural commodities.
The Govt. should intervene in developing more regulated markets in the vastly
unorganized agri-marketing sector. It is required to ensure proper regulations as
stipulated in Agricultural Produce Marketing Act, 1971.

148
Develop market infrastructure and services in the principal market yards & sub
market yards. This is also necessary in the remote Haat / Bazars in the areas outside
the notified areas of RMCs.
Explore market linkages and channels, develop grading, sorting, standardization &
transport facilities enabling these markets to supply semi processed agricultural raw
material for processing industry / agro industry as well as consumers.
Create database & help agricultural producers with sound market information of
arrivals/rates (MIS) to avoid region wise price variation, proper & timely information
feedbacks for their sales decision making.
Cold storages, refrigerated vans, and cold storage chains to fit the concept of farm to
fork. Encourage FPO (Farmers Produce Organization) which has been just initiated.
Direct access of Potato farmers to cold storages are desirable.
Encourage contract farming by further amending APMC Act. With such reforms,
implementation of CISS of GOI for Development of market infrastructure under Co-
operative sector and Private Sector with grading and standardization will be possible.
The ‘Sufal Bangla’ project started by Agri. Market Department merits support for
farmers’ price realization. The consumers’ demand can be accessed through internet
& direct supply of vegetables at the doorsteps of consumers. Development of
‘Producer-Buyer Linkage platform’ to facilitate transactions is one of the major
activities planned.
Establishment of “Krishak Bazars” in all the blocks of the state.
Strengthening of the “Amar Dhan Amar Chatal” (my rice and my yard) scheme
initiated under BGREI sub scheme of RKVY
State has taken an initiative for participating in NAM National Agri. (virtual) Market)
by amendment of WBAPM(R) Act. It would integrate physical markets of West
Bengal in National e platform.
Scaling up Sufal Bangla networking in the districts and Kolkata empowering farmers
in a business model through registered FPOs.
Empowering farmers through value addition devices / processing units at farm level
integrating them into Agri business.
Quality control networking at Krishak Bazars (grading and standardization).
Setting up of cold storages in North Bengal Districts.
Developing effective mechanism to facilitate price discovery by farmers.

149
7.12 Cooperation
Diversification of business by PACS to fertilizers & agro inputs implement hub, seed
storage, bio-input storage & marketing, agro service centres, management of godowns
& cold storages etc. for viability. These have to run on a sound Business model.
Monitoring & Supervision of PACs by higher cooperative tiers to be strengthened.
All cooperative members to be given KCC through which timely credit will be made
available.
Training and Capacity building of small and marginal farmers & SHGs, Training
infrastructure and training by inviting experts are required. Arrangement has to be
made so that products get markets.
Vaidyanathan Committee recommendations on revitalizing the PACS must be
implemented by recapitalization, PACS to be computerized to build up a Core
Banking network with Apex Level Cooperative Bank (SCB) and District Central Co-
operative Banks (DCCB) like rest of banking industry.
In the godown management system, a decision support system aided by GIS for the
purpose of sharing of information will be desirable. Proper training of farmers
keeping produce in godowns shall be necessary.
Need for setting up of large numbers of Co-operative Societies of Fish, Milk and
other sectors in agriculture as also in Non-farm Sectors (Handloom, Handicrafts etc.)
Farmers’ Irrigation Cooperatives and Co-operative marketing societies need attention.
The human resource development of the functionaries of base level cooperatives has
to be looked into.
7.13. Agricultural Extension and Education
Augment Extension machinery to ensure easy flow of information which will lead to
easy flow of credit to farmers.
Facilitate ICT based inputs/ Market intelligence and weather advisory to the farmers.
Matir katha has been an intiative in this line and would be extended to include all the
farmers of the state.
Quantifiable extension training and technology up to grass root farmers.
Last mile extension capacity building by multi agency engagement.

150
Promotion of Agro e-Commerce. Facilitate development of e-commerce on agro
products in the district levels, foster tie-up with new generation e-commerce
companies for ensuring market for farmers. Need based facilitation of contact farming
based on demand from the companies.
Augment capacity of the Extension machinery to provide timely and quality extension
support to farmers, provision of holistic extension support.
Skill development with agro-allied near farm livelihood support under Utkarsa
Bangla initiatives and NSDC. About 10000 farmers (@4 per panchayat) would be
trained in each district in collaboration with the Department of Technical Education,
training would be on repair and maintenance of agricultural implements and support
services. This would result in development of human resource in the Agriculture
sector and make available services for the sector in village/ Panchayat level.
Skillset development across production, processing and marketing value chain at farm
family level.
Bringing competiveness both input and output end of the Agriculture value chain to
provide higher return to farmer and lower price for the end consumer
Alternative modes of extension on support through Agri Clinics and Agri Business
Centre Scheme (ACABC) may be given thrust.
There is need to promote low cost improved technologies building on traditional
technologies which would improve the quality and simultaneously be cost-effective.
DCCBs/ RRBs in the State which sanction assistance for Financial Literacy Centres
by NABARD need to expedite the activities for opening of more FLCs in remaining
blocks in their area of operation and secure future business apart from wholehearted
participation in the programme of national importance.
Government / SAU should consolidate all research findings going on in different
agricultural universities, colleges and institutions by floating a Web Portal.
To introduce mobile extension van (at least one in each district), equipped with all
audio-visual aids for promotion of latest agro-technology in remote villages.
7.14 Credit
All farmers, including recorded bargadars and Patta holders to be covered under
Kisan Credit Card with adequate limits. The state govt. may utilize the central scheme
to finance JLGs of ‘Bhoomi Heen Kisan’ to cover the landless farmers.
151
Credit per SHG in West Bengal was quite low at Rs.34,823/- per SHG vis-a-vis all
India average of Rs.175678/- as at the end of FY 2013-14.. Banks should ensure
credit linkage of at least Rs. 1 lakh per SHG as per decision of SLBC. Inadequate
finance by Banks to SHGs has resulted in rising NPA, group disintegration. Banks
need to move from micro credit to livelihood financing.
Land Revenue Records Department of the State Government may institute a system of
issuing Loan Eligibility Certificates to landless farmers, Share Croppers and tenant
farmers, on the lines of Andhra Pradesh Government.
Farmers’ Clubs may be involved by the Bankers for enhancing credit flow and
departments for technology dissemination and extension activities.
Farmers’ Clubs, PACS, SHGs, and JLGs may be encouraged to set up Custom Hiring
Centres by availing Bank Loan.
Banks may explore financing in the mode of Joint Liability Groups and Producers’
organisations.
Bankers may proactively finance the agriculture and veterinary graduates trained
under Agri-clinics and Agri-business centres scheme for setting up of veterinary
dispensaries and provision of services including supply of frozen semen, liquid
nitrogen and extension consultancy under ACABC or DEDS Scheme.
Financing for BMCUs, Deep fridge, milking machines, milkotester and milk vans by
Banks and dairy equipments for small scale processing of indigenous milk products.
Introduction of on-line land verification is the need of the hour so that Banks can have
the facility of on-line viewing of digitalised land records from their branches. This
will help Banks to take prompt credit decision.
Banks should give importance on big ticket project finance under Agriculture and
Allied sector that would enhance credit flow to this sector.
Facilitating fast transfer of indemnity to farmers in case of crop loss due to natural
disasters.
7.15 Strategies and Actions to address Climate Change Concerns
Climate change and its impact on agriculture is huge and merits specific initiatives for the
reducing the vulnerability of farmers. The Government of West Bengal prepared the West
Bengal State Action Plan on Climate Change (WBSAPCC) and outlined strategies for

152
mitigation of and adaptation to climate change impacts. The action plan has been referred to
in arriving at this plan.
Farmers are the most vulnerable to the impacts of climate change. Strategies proposed are
enunciated below:
Field Crops
Crop diversification by introducing alternate production systems in the 6 agro-
climatic zones that effectively exploits the climate, soil and water resource availability
in the context of climate change. This can be done through exploitation of the
biodiversity and encouraging diversification to new crops that are a part of the
biodiversity of the zone, and also by enhancing activities under ‘Integrated scheme of
Oilseed, Pulses, Oil Palm and Maize (ISOPOM)’. In the upland in Red and Lateritic
Zone of WB, where there is no impounding of rainwater, maize, black gram, pigeon
pea, millets can be grown as sole/ intercrop. In the pre- monsoon season, areas
receiving >100mm rainfall can be cropped with greengram and blackgram. In upland,
i.e. hill and terai zones, cultivation of Goundnut, maize, sorghum, soybean, blackgram
and greengram needs to be taken up instead of rice. Training of farmers on alternate
crops would be taken up to facilitate adoption of appropriate technology.
Introduction of new cultivars of rice, and other important staple crops that are heat
resistant, can endure water stress, tolerant to salinity of the soil, and are fortified with
nutrients for growing in soils deficit in corresponding nutrients. Introduction of short
duration wheat can be one adaptation strategy to overcome the rising winter
temperatures.
Encouraging indigenous cultivars that are more hardy with respect to vagaries of
climate and more nutritious such as small millets, and other cereals, pulses and oil
seeds
Upscale Resource Conservation Technologies (RCTs) for farming such as “no tillage"
as it saves water, labour and energy, helps early sowing, improves soil organic C,
reduces soil compaction, increases fertilizer use efficiency, and reduces soil erosion.
Water harvesting through ground water recharge using runoff from hills in red and
Laterite zone.
Introduction of drip irrigation in Red and Laterite zone.

153
Water conservation for rice production can be significantly enhanced by introducing
aerobic rice, direct seeded rice, and SRI technologies such as keeping the fields moist,
not flooded, planting of singe plant adequately spaced to permit more growth of roots
and canopy and to keep all leaves photosynthetically active; and rice seedlings are
transplanted when young, to avoid trauma to roots and to minimize transplant shock.
Introduce farm mechanisation for planting technologies such as bed planting for rice
and wheat and drum seeding for direct seeding.
Additionally, brown manuring can also be done for resource conservation as it is a
‘no-tillage’ version of green manuring, using a non-selective herbicide to desiccate
the crop (and weeds) at flowering instead of using cultivation. The plant residues are
left standing. This may also be a preferred option on lighter soils prone to erosion.
The standing residues can be grazed after appropriate withholding periods have been
observed. Further sequential cropping can be practiced.
Introduce sequential cropping of different crops that can also augment nutrient into
the soil for the next crop.
Nitrogen management through LCC in puddled and direct seeded rice: Leaf Colour
Chart (LCC) to determine the nitrogen status in growing rice in direct seeded/
transplanted /Zero Tillage (ZT) rice. The timings of nitrogen top dressing could easily
be determined based on soil N supply and crop demand. This simple tool helps
farmers to reduce the excess use of nitrogen fertilizers and leads to fertilizer savings
of up to 46 kg N /ha.
Popularise the concept of Integrated Farming System (IFS) that integrates, rice crops,
livestock and fisheries. For example, the livestock can provide the manure, which can
be used for producing energy. The effluent of the biogas system can be the manure
for the fields. The water on the fields can support fisheries. Rice stock can be cattle
feed. Broken rice grain for poultry feed. IFSs with different types of elements of
integration can be developed as per the suitability of a region.
Undertake effective soil nutrient management, to counter the deficiency of soil
nutrients across the state - application of right nutrient, right time and right place for
minimum costs. For example, in terai region due to leaching there is deficiency in
lime, Zinc and Boron. Further, it seen that by green manuring such as enrichment of
the soil organically by growing a variety of crops on the land and then ploughing the
green matter back into the soil it is possible to enrich the soil in 200 days .

154
Develop biological ways for combating weeds, insect, pests and diseases and nutrient
management. For example, green manuring incorporates green plant residue into the
soil with a cultivation implement. Most commonly conducted with an offset disc
plough, cultivation aims to kill weeds and control seed-set while building soil organic
matter and nitrogen status. Green manuring has a very long history of managing
weeds and building soil fertility in systems where herbicides are either not an option
or not available, such as organic farming systems.
Strengthen research and development for water resource conservation technologies
developing new climate proofed cultivars nutrient management organic pest
management Identification of crops for crop diversification.
Identification of traditional hardy, nutrient rich crops appropriate for each zone.
Effective outreach for advisory to farmers on various aspects of agriculture including
setting up systems to access real time weather and 7 days forecast and long term
forecast; strengthening outreach through agricultural BPOs for accessing information
on forecasting on climate (7 days forecast, advent of monsoon, and projections on rain
fall and temperature for the entire cropping season- on choice of cultivar, time of
cropping, likely crop diversification, type, method, time and quantity of farm inputs;
promote use of internet and mobile telephony.
Develop seed storage facilities in red and laterite areas where the moisture is the
least. The aim is to establish a seed bank in this region which will make available
seeds for contingent situations and also develop infrastructure for seed storage. The
salient features would be the establishment of seed bank for maintenance of
foundation and certified seeds of different crops to ensure timely availability of seeds
to the farmers, to take care of the special requirement of seed at the time of natural
calamity and to create infrastructure facilities for production and distribution of
quality seeds. The seed bank will be established according to the guidelines of the
national scheme on development of seed banks and supported by the West Bengal
State Seed Corporation. Further, seed banks at village/community levels also need to
be encouraged.
Access to funds for farmers to enable them to develop market ready products such as
dal threshers and oil mills.
Expand the coverage of crop insurance to small and marginal farmers in the state. In
order that the benefits of Crop Insurance can reach the actually affected farmers,

155
insurance of two most important crops in the State – Aman and Boro rice have been
notified at the Gram Panchayat level since 2002-03. The other crops insured at block
level in West Bengal are Jute, Aus rice, Maize, Wheat, Mustard; and those insured at
the district level are Musur, Gram, Maskalai, Arhar, Mung, Linseed and Til.
Facilitating faster transfer of indemnity to farmers in case of natural disasters.
Enhance access to markets by building infrastructure for transferring produce and
storing grains in block levels in West Bengal.
Encourage public-private partnership for easier penetration of all strategies for
fortifying productivity and food security and for enhancing earnings of the marginal
farmers.
Fisheries
The main aim of the Government of West Bengal is to ensure productivity of fish even in the
context of climate change. Hence the following strategies have been suggested.
Real time Monitoring of Fish shoals: Monitoring of Fish Shoals is necessary to assess the
quantum of fish arriving per shoal at different level of river and sea-water and at different
time period. For this 1 (one) Deep Sea Monitoring –cum Research vessel equipped with state
of the art in technology may be hired from other Govt. Organizations. Further throughout the
stretch of River Ganges from Sagar to Farakka at least 40 Nos. of Monitoring Cell (21 for
Riverine, 6 for estuarine & 7 for Fishing Harbours and 6 for Fish landing centers along the
coastline of West Bengal) equipped with modern facilities should be constructed. Every unit
may be operated by a 5 (five) member team.
Real time Weather Monitoring & Forecasting: It is one of the vital parameters for gaining
maximum /optimal production of fish and fish seed as the climatic parameters (Temperature,
Humidity, Rainfall, Water flow, Sea-surface temperatures and water level) are directly
associated in maintaining fishery resources properly. For this a meteorological unit at all
districts headquarters (Meen Bhavan Complex) and places of importance from the point of
view of inland and marine catch may be installed in 22 points across the State as per
guideline of India Meteorological Department (IMD) and /or CSIR. This will cost around Rs.
506 lakhs. However, in 12th plan, real time data from Regional Meteorological Centre,
Alipore, Govt. of India on yearly contract basis for the data of stations/districts and places of
importance from the point of view of Fish and Fisheries @ Rs. 1.0 lakh per year per can be
accessed. Total cost will be Rs.110 lakh.

156
Mapping vulnerable fisher folk settlements: Identifying vulnerable fisher folk residing in
and around inland and marine villages is a matter of deep concern. Through the system of
Remote Sensing and Geographical Information Systems they may be located them and
project new outlook for their all-round socio-economic development. Location and mapping
of the helpless fisher folk throughout the state may be done at gram panchayat level.
Qualified personnel on contractual basis may be deployed to collect such data from G.P.
Level in conformity with the data of Census Department. Govt. of India and GIS data
attained from zonal officers of Dy. Directors and to synchronize such data in computer.
Forecasting and use of simulation Modeling : The following factors will involve in
generating a model for forecasting on fisheries viz. i) weather forecasting, ii) Testing of soil
and water iii) Training on Fishery and fishing practices at grass-root level.
Ensure synergy between the climatic and oceanographic data and fisheries data. Projections
on climate change impact on fish populations are the first step for future analytical and
empirical models, and for planning better management adaptations. Special thrust needs to be
given for data generation. There may be gaps in attaining real time data on Fish & Fisheries.
Disparities observed between the published report and actual physical observation is a matter
of deep atrocity and such disparity occurs in course of data transition from lab to land and
vice-versa. Data management in its proper sense should be taken into account to overcome
the problem. The strategies for bridging the gaps include i)Adequate training to Fishery
Officers’ (from grass root level to District Level), ii) Engagement of qualified survey
personnel (at least Science graduate ) iii) Acquaintance of fishery personnel with modern
equipment and computer systems iv) Random field visit and routine supervision by higher
officers.
Mangrove Plantation: There is a positive correlation between mangroves extent and total
fisheries yield in the adjacent waters due to abundant supply and regeneration of nutrients due
to the activity of microorganisms and filter feeders. The estuarine water is not only enriched
with nutrients but it is perfectly buffered against abrupt changes in pH. Different types of
bacteria in abundance in the soil, water, litter etc. play the important role in nutrient cycle of
this ecosystem. Mangroves resist soil erosion and protect the mainland from devastating
storm. There should be a specific programme for mangrove plantation along the canals,
ponds and other water bodies in the Hoogli Matlah estuarine region for the conservation of
bio-diversity.

157
Promotion of canal fisheries:
Promotion of Brackish Water Canal Fishery and Creation of mangrove dyke plantations
along the tide fed canals to prevent erosion as well as enrichment of nutrients of canal water
through leaf fall. Further, Mangroves help to protect coast lines from erosion, storm damage,
and wave action. Protection and conservation of the natural environment and periodical
excavation of the canals are being made by the local populace for their own interest. West
Bengal has an extensive canal network of about 80,000 ha spread over different river systems
with vast unrealized fishery potential out of which 23,430.47 ha is in the coastal districts
covering 24 parganas (N), 24 Parganas (S) & Purba Medinipur
Development of Sewage fed fisheries: West Bengal has 0.41 lakh hectare of beels owned by
the Fisheries Co-operative Societies. Besides, 279 wastewater fed farms covering an area of
approximately 5000 ha supply more than 21,000 MT of fish per year to the city customers.
Protection of water and wetlands resources can be achieved by introducing fish in these areas
to improve water balance, produce more oxygen and absorbing more carbon dioxide. The
floodplain wetlands (beels) are considered as biologically sensitive habitats as they play a
vital role in the recruitment of fish populations in the riverine ecosystems and provide nursery
grounds for commercially important fishes as well as the endangered native fishes. Most of
the large water bodies viz. Beel Baor Bundh etc. have become silted due to long years of
neglect. It has been observed that the ecotonal zones of the wetlands have become extremely
shallow (witnessed only 0.5-1.0 mt depth in average). This has resulted in overflowing of
water from these water bodies causing flood with consequential loss of fish crop.
Protection and Development of Water Bodies: Protection and development of water bodies
is of utmost importance to combat climate change. Fisheries activities need to be popularised
in both seasonal and perennial water bodies. Initiatives need to be taken to preserve the small
water bodies by promoting endangered species. Protection and conservation of the natural
environment and periodical excavation of the water bodies will be made by the local
populace for their own interest.
Providing Life Saving Equipments: Losing a life of a fisherman in work is a serious concern.
There should be specific plans to provide lifesaving equipment to the fishers. The equipments
should be easy to wear and remove, maintenance free, hazard less and cost effective.
Promotion of Solar Light: Tapping non-conventional energy resources by way of erection of
solar light is very important in respect of adaptive measures for climate change.

158
Block level laboratory cum training centre for Fishery Extension Officers: The Fisheries
Department, Government of West Bengal took an initiative to expand its extension service
upto grass root level by establishing Block level laboratory cum training center for Fishery
Extension Officers. These establishments are the main hub of the training, demonstration of
new technology, water and soil analysis as well as disaster management. In case of sudden
occurrence of any type of climatic hazards these centres equipped with e-services can offer
all type of assistance immediately.
Research to ensure fish productivity and hence food security:
Endangered fish species
Fish virology and effect of pesticides on fishery
Survey of Migration route, bio morphological study and stock assessment of
Hilsa & other species
Increased Productivity & Brood Stock Management in Departmental Farms
Species specific feed formulation for native threatened/endangered fish
species through gut content analysis of the target species
Value added fish products
Impact of climate change on marine and coastal fish production of West
Bengal & options for adaptive measures
Mass culture of different indigenous algal species on preparation of algal
powder for ready to use fish feed & human supplementary feed
Horticulture
Protection from heat in all zones below hill and terai zones: In the short run, provide
overhead shade to fruit trees and construct greenhouses for vegetables, wherever the
temperatures are exceeding the tolerance level of plants.
Impetus to Research: In the long run, introducing new varieties to ensure livelihood security
of the poor relying on agriculture, focus should be on optimizing productivity with maximum
profits. Research and Development will play a vital role in identification of new cultivars
resilient to higher temperatures, water stress and high concentration of CO2. Develop fruit
and vegetable varieties that can adapt to excess salinity, can tolerate heat stress and water
stress. Develop vegetable varieties that are fortified with nutrients that are absent in the soils
they are grown. Develop short rotation varieties of vegetables to adjust to the increasing
winter temperatures

159
Popularization of indigenous varieties: Mapping of existing traditional varieties practised
by farmers in different regions are to be conducted and characterized having high resilience
to the changing climate need to be identified and promoted.
Crop diversification: Continue and intensify crop diversification programmes to include
more crops which have wider adaptability. Improvement of existing practices of growing
crops which are sensitive to climate resilient crops.
Crop diversification: Continue and intensify crop diversification programmes to include
more crops which have wider adaptability. Improvement of existing practices of growing
crops which are sensitive to climate resilient crops.
Production of off-season vegetables: Off-season vegetables have very high scope for
improvement of rural economy at higher altitudes where the temperatures are likely to remain
conducive.
Integrated Pest Management (IPM): Steps to be taken to replace chemical control of
diseases and pests by bio-pesticides, bio-control agents and other organic methods. These
programmes need to be intensified to expedite the process of organic conversion.
Water management system: Undertake water management programmes to use efficiently
water and provide critical moisture for crop health. Ongoing programmes such as drip
irrigation, construction of rain water harvesting structures, community ponds are to be
strengthened to increase productivity with limited water and simultaneously conserving
rapidly diminishing water resources. Through efficient system of water management, it is
targeted to utilise fallow land after paddy crop for cultivation of vegetables, potato and other
horticultural crops during Rabi season.
Reducing weather related risks: Establish weather stations at high spatial resolution for
weather data collection at village level, analysis by nearby Agriculture University and
forecasting the same. Sensitise the farming community on weather related risks. This system
should also focus on helping farmers to make critical farming decisions for efficient crop
management practices.
Enhance infrastructure for storage and transport to markets of perishable horticulture
products.
Monitoring impacts of climate change: Information system within the department needs to
be strengthened with focus on collection of baseline data and a system to measure changes
periodically with climate change impacts

160
Animal Resources
Encourage breeding of small ruminants for livelihood security: The State is naturally
gifted with a good stock of Black Bengal Goat, Garole Sheep and Ghungru Pig. The
presence of high fecundity factor makes the breeds like Bengal Goat, Garole Sheep
and Ghungru Pig for evolution in any adverse environment. Genetic up-gradation
programme of Garole Sheep, Bengal Goat and Ghungru Pig involving SHGs in the
State of West Bengal has to be given utmost importance.
Therefore as a strategy for adaptation for small and marginal farmers who can afford
the small ruminants , encouragement may be given for Goat Farming (Bengal Goat),
Sheep Farming (Garole Sheep), Pig Farming (Ghungru Pig/ Improved breed), Broiler
Farming, develop Meat processing plants, and undertake Male exchange programme
of Black Bengal goat to arrest inbreeding depression.
Strengthen disease investigation system: Research studies to be conducted to study
the causes of diseases related to climate and the nature of emerging diseases due to
emergence of new pests and diseases and develop control measures by involving
livestock research institutions.
Preventive health measures: To control and contain the existing epidemic diseases, the
government and its concerned departments need to prepare long term strategies where by 100
percent population of the livestock get regularly vaccinated. Beside this, animal health camps
need to be set up in various occasions to make people aware of adopting different control
measures.
Improved cattle sheds for alleviating heat stress in livestock : The cattle sheds may be
augmented with Water sprinklers or directly bathing the animals to enable them to have
evaporative cooling, allow them to wallow in the ponds and other water bodies, increase the
air circulation in sheds so that cool air is retained, undertake evaporative cooling;
Feed and fodder development: To combat fodder shortage, fodder development needs to
have an additional impetus from the government by promoting mixed crop system, growing
fodder on waste land, agro forestry etc. These may be further enhanced. It may also think of
supporting farmer centered fodder banks. Undertake mineral mapping in different regions to
assess mineral status and accordingly supply specific mineral mixture to farmers for growing
fodder.
Dairy Development: For enhancing milk productivity even with increase in temperatures,
extensive Artificial Insemination of the indigenous stock of the State has to be undertaken.

161
Risk Management: Coverage of agriculture insurance may be extended to animal husbandry
as well, especially for small and marginal farmers. Feasibility of the same needs to be studied
before it can be launched. Other forms of risk management for farmers can be explored.
Capacity building of farmers for effective adaptation to climate change: Adaptation
practices vis a vis right shelter for animals to protect them for heat stress, right grazing
practices that would enable the animals to be protected from heat, the practices for
identifying disease and mitigating them, creating feed mixes with proper nutrients for
enhancing mild productivity, etc.
Augmentation of drainage facilities
Old and New Alluvial Plains: For abatement of floods in this region, a rethink and hence
revamping of the existing infrastructure and making new infrastructure that help water pass
through and drain out may be needed. Also in near term excavation of derelict channels,
blocked drainage and construction of new drainage might be taken up especially in cities.
Saline Coastal region: Reconstruction of the Sundarbans embankment in vulnerable areas
through public and private partnership to entrust the management of the embankment to
public as well. Undertake stabilisation of embankment slope, and create drainage through the
embankment to drain out high tide water.
Flood management: Is being carried out by the Irrigation Department through building of
embankments to prevent saline ingress in the Sundarban areas through tidal waters and also at
other parts of West Bengal to prevent flood waters from damaging agriculture areas such as
in North Bengal along Teesta, Raichak, Ganga, Jaldhak, Ajay rivers and renovation and
remodelling of embankments along the Mayurakshi-Bhagirathi system and along Kangsabati
river system. It excavates new drainage channels and enhances the drainage capacities
existing channels of various river systems and also drainage of Kolkta. The Department also
regularly undertakes anti river erosion and anti-sea erosion works.
Participatory irrigation management (PIM)
Participatory irrigation management involves fostering participation of water users in the
project to enable them to own the project and take up maintenance of the project for
sustainable flow of benefits. The Government of West Bengal has initiated the process by
promoting Water Users’ Associations under different schemes being implemented for
developing irrigation facilities in the state.

162
CHAPTER VIII
STATE PLAN
Financial Outlay and Outcome

163
8.1 Financial Outlay and Expenditure during XIth Plan The financial achievement for agricultural and allied sectors compared to total state plan
outlay during the XIth Five Year Plan is presented in Table 8.1.
Table 8.1: Financial Achievement of Agricultural and Allied Sectors compared to
Total Annual Plan size in XIth FYP,
(Rs. in Crore)
Annual
Plan Year
Total State
Plan
Expenditure
Outlay/Expendi
ture for Agri. &
allied Sectors
(excluding
RKVY)
RKVY
fund
released
Fund released
in other
schemes*
Expenditure of
agri. & allied
sectors as % of
total plan outlay
2007-08
(A.E.)
9073.09 357.81 54.93 n.a 3.97
2008-09
(A.E.)
10396.90 503.20 147.38 n.a 4.84
2009-10
(A.E.)
12121.59 597.36 147.38 n.a 4.93
2010-11
(A.E.)
11784.94 674.95 335.98 62.74 5.73
2011-12
(A.E.)
21029.67 867.62 486.65 67.33 4.13
* Other schemes: NFSM, NHM, NMMI, ATMA
Source: Dept. of Agriculture, Govt. of W.B
8.2 Financial outlay during XIIth FYP
The financial outlay of agricultural and allied sectors during XIIth FYP is presented in
Table 8.2.
Table 8.2: Financial outlay during XIIth FYP
(Rs. in Crore)
Year
Expenditure
in
agriculture
& allied
sector
of
which
RKVY
Expenditure
in
agriculture
& allied
sector Excl.
RKVY
Total Plan
Expenditure
% of total plan
expenditure
incurred in
agriculture &
allied sector
2012-13 1029.00 497.00 532.00 18994.00 2.80
2013-14 1153.00 273.00 879.00 24207.00 3.63
2014-15 2490.00 757.00 1768.00 44074.00 4.01
2015-16 3195.00 886.00 2431.00 49507.00 4.91
2016-17 3519.00 975.00 - - -

164
8.3 Broad Sector wise Projection
The consolidated sector wise financial outlay during 2014-15 to 2016-17 of XIIth FYP is
presented in Table 8.3.
Table 8.3: Consolidated sector wise financial outlay
during 2014-15 to 2016-17 of XIIth FYP
(Rs. in Crore)
Sl. No. Sector 2014-15 2015-16 2016-17
1 Agriculture 1169.00 1497.00 1645.00
2 Agri Market 140.00 250.00 275.00
3 Animal Resources Department 225.00 385.00 424.00
4 Cooperation 186.00 221.00 243.00
5 Fisheries 209.00 218.00 240.00
6 FPI & Horticulture 84.00 85.00 94.00
7 Forest 229.00 270.00 297.00
8 Food & Supplies 151.00 164.00 180.00
9 Sericulture 10.00 15.00 17.00
10 WRID 36.00 45.00 50.00
11 Irrigation & Waterways 39.00 38.00 42.00
12 WBCADC (P&RD) 12.00 7.00 12.00
TOTAL 2490.00 3195.00 3519.00
8.4 Convergence
The department of Agriculture, Govt. of West Bengal has issued guidelines for
convergence of different schemes viz. RKVY, NFSM, NNMI, ATMA, etc. as there are
substantial commonality among the schemes. Most of the schemes have the common
objective of improving livelihood base of rural farmers by way of treatment of
agricultural land through land development, irrigation facilities, afforestation, soil and
water conservation and other interventions. Convergence of financial resources will help
to more integrated approaches which can stop wastage of financial resources and utilize
man hours in a more positive way. The proposed convergence of RKVY with other
schemes has been presented in Table 8.2.

165
8.5 Flagship Programmes and Outlays
Considering large number of small and marginal farmers below poverty line and
also the extensiveness of agriculture and rural development, there is a need to promote
specific single purpose projects on cluster basis. These kinds of projects would bring
holistic development through better planning, coordination and monitoring involving
economic infrastructural and social sectors and also facilitate backward and forward
linkages.
A number of area/sector specific flagship projects based on economic viability
and sustainability have been identified from CDAPs and presented here. These projects
not only provide benefit to the stake holders but also have a considerable impact on state
domestic product. Some of the flagship programmes are given in art.8.5.1 to 8.5.4.
District wise programmes with financial outlays are given in the Annexure.
8.5.1 Agriculture
1. Title: Production of Quality seeds
Components:
i) Production of foundation seed, assistance to procure breeder seed,
incentivizing hybrid paddy and maize seed production
ii) Seed treatment campaign throughout the State
Budget:
(Rs. In Lakh)
2013-14 2014 – 15(Approved) 2015 - 16 Total Financial Outlay Fund
50.00 123.20 109.40 282.60 RKVY
Location: Throughout the State of West Bengal
Output/outcome
450 MT foundation seed will be produced through giving assistance to farmers.
80 MT of breeder seeds will be procured from outside state through giving
assistance to small traders.
32 MT hybrid paddy seeds and 700 MT hybrid maize seeds will be produced,
more farmers and seed producing organizations will be interested to produce

166
hybrid paddy and maize seeds contributing towards self-sufficiency in seed
production in the State.
Pest and disease free quality seed production.
A total of 5000 ha will be covered under this campaign
2. Title: Initiatives for crop development in West Bengal
Components:
A. Aromatic rice- a precious indigenous wealth: its area expansion, conservation,
research and improvement
B. Development of rice hybrids
C. Breeder seed production of pulses and oilseeds
D. Sustainable development of sugarcane based cropping system in West Bengal
E. Production Enhancement through Alternate Crops during the Early Rabi & Rabi
Summer 2014-15
F. Front line demonstration of Zero Tillage Technology in direct seeded rice and wheat in
West Bengal
Budget
(Rs. in Lakh)
2013-14 2014 – 15
(Approved)
2015 - 16 Total Financial
Outlay
Fund
517.08 799.38 496.80 1813.26 RKVY
Output/outcome
Expansion of indigenous aromatic rice areas vis-à-vis seed production.
5080 and 9500 ha will be covered in 2014-15 and 2015-16 kharif and rabi seasons
respectively with location specific cultivars throughout the State Database
development and documentation of aromatic rice genotypes.
New hybrid variety for shallow low land and irrigated upland situations of West
Bengal.
5 tons of breeder seed of different paddy varieties will be produced as per DAC
and CSSO indent.

167
150-200 quintals of breeder and nucleus seeds of different pulses and oilseeds will
be produced to enhance agricultural productivity and crop diversification.
Increase in farmer’s income.
Replace conventional thin varieties by HYV.
Productivity is expected to increase up to 90 tons/ha.
3000 farmers will be directly benefitted besides indirect impact on many
neighbouring farmers.
11170 ha will be brought under alternative crops viz. pulses, hybrid maize.
Substantial increase in nutrient and water use efficiency.
Reduce cost of cultivation by saving about Rs.4495.00 per ha and increase
productivity by 5.96% of rice and 13.13% of wheat
3. Title: Support to Plant Protection & integrated Pest Management
Components:
A. Seed treatment campaign for 100% coverage
B. Disease and pestilence warning system in the South Bengal Districts of West Bengal
C. Disease and pestilence warning system in the North Bengal Districts of West Bengal
Budget:
(Rs. in Lakh)
2013-14 2014 – 15
(Approved)
2015 – 16 Total Fund
16.70 695.52 712.22 1424.44 RKVY
Output/outcome;
Region wise disease and pest calendar for better planning and farm operation in
the northern and southern districts.
Delivery of pest management advices directly from experts to crop growers.
Reduce indiscriminate use of pesticides and crop loss, thereby improving the
profitability of farm operation.
Delivery of pest management advices directly from experts to crop growers.
Reduce indiscriminate use of pesticides and crop loss, thereby improving the
profitability of farm operation.

168
4. Title: Special programme for agriculture development of Darjeeling district
under GTA for 2014-15
Budget
Programme Amount (Rs. in
Lakh), (Approved)
Fund
1.Popularization of hybrid maize seed 50.00 RKVY
The project is
supported as per
norms of NFSM/
MIDH
2.Cardamom development scheme 167.50
3.Promotion of broomstick 18.00
4.Popularisation of biopesticides 12.00
TOTAL 247.50
Output/outcome
1. 630 ha to be covered and 2520 farmers to be benefitted through cultivation of
hybrid maize
2. 200 ha to be covered and 1000 farmers to be benefitted through cultivation of
Cardamom Development Scheme
3. 800 ha to be covered and 800 farmers to be benefitted out of promotion of
Broomstick Scheme
4. 2400 farmers to be benefitted in eight blocks of Darjeeling Hills under GTA
5. Title: Implementation of land shaping and rain water harvesting technology
including land embankment cultivation for augmentation of agricultural production
in South 24-Parganas district of West Bengal
Budget
(Rs. in Lakh)
Approved in 2014 - 15 2015 -16 Total Financial Outlay Fund
306.50 336.50 643.00 RKVY
Output/outcome
The beneficiaries of the project, as stated, would be Aila affected small and marginal
farmers of Sundarbans, in south 24-Parganas.

169
6 : State specific Agri-research projects for providing support to growth and
development of agriculture and allied sectors in the State
Budget:
Component Projects Amount (Rs. in Lakh) Fund
1. Validation, dissemination and survey
for adoption of resource conserving
technologies (RCTs) towards enhancing
farmers income and sustainable rice
production in West Bengal
2013-14 2014-15
(Approved)
2015-16
RKVY
224.98
73.15
238.03
2. Development of rice varieties with
resistance
3. Biotechnological Research
Programme in rice
4. Maintenance of rice biodiversity
through collection, conservation
evaluation and documentation of rice
biodiversity of west Bengal
5. Management of rice insect pests
Output/outcome
The outcome of the projects will facilitate the overall growth and development of
agriculture and allied sector in the State.
7. Title: Yield calculation using satellite based remote sensing and crop cutting
experiment methodologies for paddy
Budget
(Rs. in Lakh)
2014 – 15
(approved)
2015 -16 Total Financial Outlay Fund
300.00 300.00 600.00 RKVY
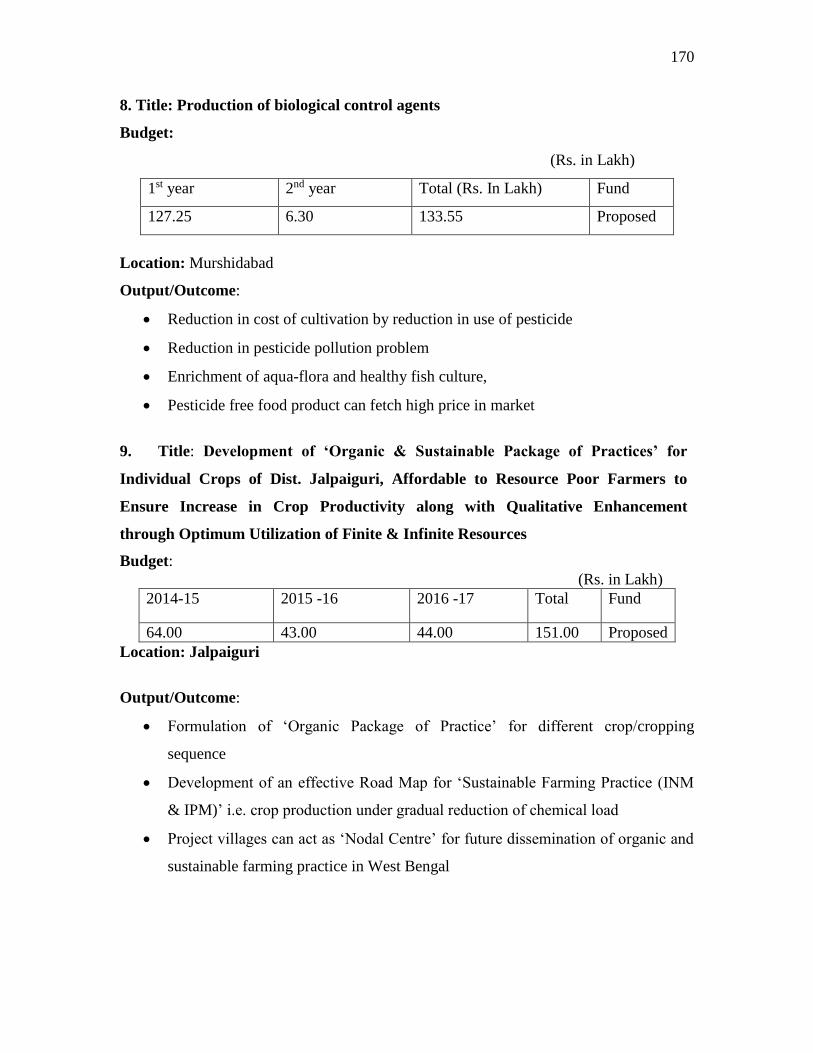
170
8. Title: Production of biological control agents
Budget:
(Rs. in Lakh)
1st year 2nd year Total (Rs. In Lakh) Fund
127.25 6.30 133.55 Proposed
Location: Murshidabad
Output/Outcome:
Reduction in cost of cultivation by reduction in use of pesticide
Reduction in pesticide pollution problem
Enrichment of aqua-flora and healthy fish culture,
Pesticide free food product can fetch high price in market
9. Title: Development of ‘Organic & Sustainable Package of Practices’ for
Individual Crops of Dist. Jalpaiguri, Affordable to Resource Poor Farmers to
Ensure Increase in Crop Productivity along with Qualitative Enhancement
through Optimum Utilization of Finite & Infinite Resources
Budget:
(Rs. in Lakh)
2014-15 2015 -16 2016 -17 Total Fund
64.00 43.00 44.00 151.00 Proposed
Location: Jalpaiguri
Output/Outcome:
Formulation of ‘Organic Package of Practice’ for different crop/cropping
sequence
Development of an effective Road Map for ‘Sustainable Farming Practice (INM
& IPM)’ i.e. crop production under gradual reduction of chemical load
Project villages can act as ‘Nodal Centre’ for future dissemination of organic and
sustainable farming practice in West Bengal

171
8.5.2 Horticulture
(Rs. in Lakh) Sl.
No.
Project Duration Total Project
Outlay
1. Hi-tech Horticulture in West Bengal 1 year 547.00
2. Integrated development of fruits and
flowers in West Bengal
1 Year 470.00
3. Capacity building and human resource
development in West Bengal
1 Yr 48.00
4. Integrated development of vegetable
cultivation in West Bengal
1 yr 963.00
5. National vegetable initiatives for
Urban Clusters (NVIUC)
1yr 1200.00
8.5.3 Animal Resource Development
(Rs. In Lakh)
Sl.
No.
Project
Duration
Total
Project
Outlay
Approved
for 2014-15
Fund
1. Livelihood improvement of poor and
tribal people through livestock based
enterprises under selected villages of
Jhargram Block
5 Years 950.00 320.60
RKVY
2. Modified Bishes Go sampad Bikash
Avijan
1 Yr 2312.44 2312.44
3. Strengthening of bio-security practices
in the Govt. poultry farms
1 yr 400.00 400.00
4. Optimization of productive efficiency
through organization of animal health
camp (Parasite control, PPR control,
fertility management and Ranikhet
disease control at farmer’s doorstep)
1 yr 700.00 700.00
5. Augmentation of meat production by
intensive sheep/goat rearing through
adoption of good husbandry practices
1 yr 750.00 750.00 NMPS
Special
scheme

172
8.5.4 Fisheries
(Rs. in Lakh)
Sl.
No.
Schemes Duration Total
Project
Outlay
Approved
for 2014-15
Output/outcome Fund
1. Scheme for
intensive fish
culture
2 yr
2014-15
2015-16
2944.00 2007.80 Implementation of
the scheme resulted
considerable increase
in fish productivity
upto potential level
RKVY
2. Scheme for
production of
fingerlings of
Carps
1 yr 345.00 345.00 Fish fingerlings
production and
income of fish
farmers increased by
implementation of
the scheme
3. Scheme for
Brooders
management and
production of
quality Spawn
Indian Major carp
1 yr 36.60 36.60 The scheme resulted
in better brood
management leading
to quality spawn
production of IMC
4. Hilsa
Conservation
Programme and
Hilsa Resource
Centre
2 yr
2013-14
2014-15
175.25 174.912 The programme
helped in better
management and
conservation of hilsa
resources
5. Scheme for
Modified
Extensive culture
of Black Tiger
Shrimp in
Brackish Water
1 yr 170.00 170.00 Increase in
production of black
tiger shrimp with
better quality of the
shrimp
6. Aquaculture
Development
through integrated
approach in the
Henry’s Island
Fishery Project
3 yr
2012-13
2013-14
2014-15
186.00
93.00
-
NMPS
7. Aquaculture
Development
through integrated
approach in the
beel
3 yr
2012-13
2013-14
2014-15
641.79
320.90
NMPS

173
8 Aquaculture
Development
through integrated
approach in the
Krishnabundh
Fishery Project
3 yr
2012-13
2013-14
2014-15
64.00
32.00
NMPS
9 Scheme for
production of big
sized fish in large
water bodies
2 yr.
2014-15
2015-16
470.00
14.10
NMPS
10.
Scheme for
production of big
sized fish in large
water bodies
2 yr.
2014-15
2015-16
287.00
37.31
NMPS
Output/outcome
Integrated approach resulted in better production, income and employment in the
target area of sundarbans.
Supported reclamation of the beel.
Fish Production level has increased in the beel leading to more employment
generation
There was an increase in production through integrated approach leading to more
income and employment generation
Output/Outcome:
The fish production level increased in medium and large water bodies thereby fulfilling
the objective of protein supplement.
8.6 Expected Outcome
Considering the trend of growth in previous years during XIth Plan and the investment
and interventions proposed in the XIIth Plan period, the expected outcome in the
agriculture and allied sectors at the end of XIIth FYP over the achievements at the end of
XIth FYP is projected as under:
18% increase in case of total food production.
15% increase in case of rice production and productivity.

174
17% increase in wheat production.
35% increase in case of total pulse production
30% increase in case of oilseed production
6% increase in case of jute production.
25% increase in potato production subject to improvement of cold storage and
export potential
300 Agro-mechanical hubs will be established
20% increase of production of horticultural crops
25% increase in area under vegetable crops
20% increase in area under Mulberry cultivation
100 % reach of extension facilities to all Farming community
Coverage of additional area of 522 ha. under coconut plantation programme.
Coverage of additional area of 55 ha. under Betel vine plantation.
Coverage of additional area of 100 ha. under Mango plantation.
Coverage of additional area of 242 ha. under Banana plantation.
Coverage of additional area of 810 ha. for cut flower cultivation.
Coverage of additional area of 1300 ha. under flower cultivation.
Coverage of additional area of 1250 ha under Seed village program
21% increase in milk production
20% increase in egg production
15% increase in meat production.
16.78% increase in fish production
25% increase in fish seed production
1.5 lakh MT/year additional production of fish from culture in ponds/tanks and
beels/boars,
0.82 lakh MT/year of fish production per from reservoir.

175
Annexure
Projects/Interventions proposed in XIIth Plan and Budgetary allocationin the Districts of
West Bengal (as in CDAP)
1. District: Alipurduar (Rs. in Lakh)
Interventions 2014-15 2015-16 2016-17 TOTAL
Agriculture
Development of ‘organic & sustainable package of
practices’ for individual crops of dist. Alipurduar,
affordable to resource poor farmers to ensure increase in
crop productivity along with qualitative enhancement
through optimum utilization of resources
64.00 43.00 44.00 151.00
Women empowerment through small scale goatery 28.00 18.00 18.50 64.50
Establishment of village based seed enterprises in SC
and ST dominated areas for improvement of their
livelihood
68.55 29.77 20.69 119.01
Assessment of bamboo resources in the district of
Alipurduar and transfer of technology for uplifting
socio-economic condition
14.32 9.07 9.32 32.71
Agricultural Knowledge management and technology
transfer under ATMA
109.26 110.64 110.64 330.54
Ensuring food security under NFSM (Rice) 229.15 246.19 277.19 752.53
Ensuring food security under NFSM (Pulse) 15.43 35.07 36.19 86.69
Sustainable agricultural intervention under NMSA 0.00 949.00 908.00 1857.00
Value addition and resource conservation 0.00 2307.00 2298.00 4605.00
Soil health management 0.00 144.00 62.00 206.00
On farm water management 0.00 58.18 58.18 116.36
Activities under SMAM 62.85 133.20 93.20 289.25
Activities under RKVY 41.29 45.70 33.19 120.18
Activities under NMOOP MM-I 12.72 18.05 22.24 53.01
MM-II (Oil palm) 2.18 3.88 3.23 9.29
Horticulture
New Plantation of Guava 1.92 0.00 0.00 1.92
New Plantation of Lime 5.50 2.75 2.75 11.00
New plantation of banana (Sucker) 7.80 7.80 7.80 23.40
New plantation of banana (TC) 5.42 8.13 8.13 21.69
New area of rhizomatic spices 2.50 2.50 2.50 7.50
New area of Bulbous flower 2.25 0.00 0.00 2.25

176
New area of loose flower 9.60 0.00 0.00 9.60
Vermicompost 2.50 1.50 1.50 5.50
Greenhouse (Bamboo Structure) 4.13 1.77 1.77 7.67
Training, exposure visit, seminar 1.14 0.76 0.76 2.66
New Area under unconventional vegetables 2.00 2.00 2.00 6.00
Low cost onion storage structure 3.50 3.50 3.50 10.50
Power machineries up to 20 BHP 12.00 12.00 12.00 36.00
Multi-storied cropping with black pepper cuttings 2.50 8.75 8.75 20.00
Increase in area of minor fruits under domestic
cultivation.
1.90 - - 1.90
Establishment of new nursery 7.50 - - 7.50
New plantation with bay leaf and beetle leaf 1.55 - - 1.55
Increase of area under Onion 1.95 1.95 1.95 5.85
Expansion of area under Sarpagandha - 1.56 - 1.56
Cultivation of Watermelon in river-belt - 2.00 2.00 4.00
New area under mandarin Orange - 6.00 6.00 12.00
Mandarin Orange Storage Structure - 1.50 0.00 1.50
Arecanut based multitier cropping system (Arecanut-
Black-Pepper-Turmeric) under NMSA
- 25.00 25.00 50.00
Kitchen Garden under NMSA - 10.00 10.00 20.00
Sericulture
Land Management & soil reclamation. 4.00 - - 4.00
Equipment support to the govt. Farms 5.40 - - 5.40
Construction of fencing around the Govt Farms. 135.00 - - 135.00
Installation of coolers at govt. farms 20.00 - - 20.00
Maintenance of silkworm host plant at farmer’s garden.
(Mulberry &Eri)
30.00 - - 30.00
Scheme for introducing modern tools and technologies 21.00 21.00
Soil Conservation
Reclamation/ rejuvenation of sand laden areas & In situ
conservation moisture
36.00 54.00 54.00 144.00
Strengthening & training or re excavation of drainage
line with vegetative support
4.00 8.00 8.00 20.00
Rain water harvesting 12.00 18.00 18.00 48.00
Re excavation of existing tanks/ ponds 5.00 7.50 7.50 20.00
Bamboo piling for stream bank erosion control 5.60 7.20 7.20 20.00
Water extracting Unit (Dug well,shallow, etc.) 5.00 5.00 5.00 15.00
Strengthening & training of Kutchha drainage line 2.00 4.00 4.00 10.00
Animal Resource Development

177
Distribution of Goatery units under RKVY including
NMPS
8.00 8.00 9.68 26.48
Distribution of Piggery units under RKVY including
NMPS
8.00 8.00 9.68 26.48
Augmentation of Good husbandry practices among goat
farmers under RKVY including NMPS
7.04 7.74 8.51 23.29
Chicks distribution programme under State Plan 15.84 17.42 19.17 52.43
Bishes Go-Sampad Abhijan Prokalpa 45.40 49.94 136.61
Parasitic Control, Fertility Management & Ranikhet
Disease control
12.32 13.55 14.90 40.77
PPR Control 3.53 3.88 4.27 11.67
FMD Control 4.17 4.59 5.04 13.80
Vaccination of other economically important diseases 2.71 2.98 3.28 8.98
Agricultural Marketing
Amar fasal, amar gari, Amar fasal, amar gola 100.00 120.00 150.00 370.00
Construction of community storage structure 14.40 16.80 19.20 50.40
Construction of traditional storage structure 21.50 22.50 23.00 67.00
Jute grading training camp 11.20 13.20 15.20 39.60
Jute retting training camp 3.50 5.00 7.50 16.00
Cold storage technical training 1.75 2.50 3.50 7.75
Training of scientific packaging 1.00 1.50 1.75 4.25
Food processing training and demonstration programme 5.00 5.50 6.25 16.75
Development of marketing infrastructure 237.05 273.30 205.00 715.35
Agri-Mechanical schemes 288.57 321.25 343.55 953.38
Fisheries Department : Fisheries development
programme
5.20 28.20 5.20 38.60
Forest Department
Demonstration & selection of orchid and training of
farmers for orchid cultivation
10.00 0.00 0.00 10.00
Growing of orchid under backyard system 0.00 16.00 0.00 16.00
Demonstration& growing of orchid under backyard
system
0.00 0.00 26.00 26.00
Area expansion under medicinal tree like rudraksha,
ritha, chalmogra
10.00 10.00 10.00 30.00
Social forestry (Nursery formation and distribution
among farmer)
4.80 9.60 4.80 19.20
Water Resources Investigation & Development Department
Shallow Tube well (Diesel operated) 280.00 140.00 140.00 560.00
Pump Dug well (Diesel operated ) 48.00 80.00 80.00 208.00

178
2. District: Coochbehar (Rs. in Lakh)
Interventions 2014-15 2015-16 2016-17 TOTAL
Agriculture
Popularization of improved varieties of different crops
through D/C
853.80 853.80 742.00 2449.60
Introduction of remunerative crops 44.00 44.00 44.00 132.00
Farm Mechanization 535.50 1337.50 535.50 2408.50
Soil Health management 298.40 298.40 298.40 895.20
E-governance 1802.70 0.00 0.00 1802.70
Agricultural Training Centre 15.18 108.66 15.71 139.55
UBKV Schemes
Development of ‘organic & sustainable package of
practices’ for individual crops of CoochBehar district,
affordable to resource poor farmers to ensure increase in
crop productivity along with qualitative enhancement
through optimum utilization of resources
64.00 43.00 44.00 151.00
Women empowerment through small scale goatery 28.00 18.00 18.50 64.50
Establishment of village based seed enterprises in SC and
ST dominated areas for improvement of their livelihood
68.55 29.77 20.69 119.01
Scaling up and dissemination of appropriate technologies
for off-season (winter season) watermelon cultivation in
the Toorsa and Mansai riverbed of terai zone of West
Bengal
24.05 20.95 17.40 62.40
Survey, Exploration, Assessment of Potential and
Technology Transfer of Biofuel crops through Awareness
Programmes for Livelihood Development
35.39 17.89 14.38 67.66
Establishment of district level mass production unit for
microbial bioinoculants aiming towards promotion of
organic cultivation in northern district of West Bengal
79.50 46.30 43.20 169.00
Development of need based agroforestry models for
improving private, community and institutional land in
CoochBehar district of West Bengal
12.41 14.41 14.41 41.23
Up scaling Family farming through enhancement and
integration of land-water-animal and tree based
livelihood approaches
16.34 14.88 10.80 42.02
Development of irrigation facilities in Horticulture
orchard
4.80 14.80 14.80 34.40
Development of Model nursery in instructional farm,
UBKV, Pundibari
15.00 27.70 19.70 62.40

179
Fishery Development Programme by UBKV, Cooch
Behar, for conducting training, demonstration etc.
5.20 28.20 5.20 38.60
KVK, UBKV, Cooch Behar
Farm infrastructure development 100.60 102.20 24.70 227.50
Training and other infrastructure development 5.50 4.00 8.00 17.50
Climate resilient / mitigating agriculture technologies 20.65 21.75 15.75 58.15
Soil health management 4.30 5.45 4.25 14.00
Better land use planning 4.00 8.00 8.00 20.00
Eco-friendly disease and pest management 0.25 2.00 1.75 4.00
Vocational commercial agriculture technologies 9.40 13.80 11.40 34.60
Agril. Information publicity and dissemination 2.50 1.75 1.75 6.00
Horticulture
Small Mushroom Production Unit 6.25 6.25 6.25 18.75
Up-Gradation of Small Scale Nursery Shade Net
Structure for quality Betel-vine Production
5.00 5.00 5.00 15.00
Plant Protection Equipment(Foot Sprayer) for Orchard 3.00 3.00 3.00 9.00
Cultivation of Shade Loving Spices as Intercrop in Areca
Plantation Homestead Cultivation of Coconut for Small
& Marginal Farmers
4.50 4.50 4.50 13.50
Mixed farming of Fruit Bearing Plants 4.80 4.80 4.80 14.40
Production of Quality Elephant Foot Yam with Organic
Manures
12.50 12.50 12.50 37.50
Integrated Development of Rabi Onion 22.50 22.50 22.50 67.50
Cultivation of Early & High Value Vegetables 2.50 2.50 2.50 7.50
Sericulture
Proposed intervention wise plans 66.00 228.20 183.60 477.80
Soil Conservation
Proposed intervention wise plans 253.00 299.00 335.00 887.00
Animal Resource Development
Proposed intervention wise plans of ARD 135.91 135.91 121.91 393.73
ARD Project Under Eco-Tourism Project at Garh
Kanteswar Under Sitalkuchi Block
167.14 0.00 0.00 167.14
Agricultural Marketing
Jute Grading Training Programme 1.20 1.20 1.20 3.60
Training on better packaging &Post harvest technology 1.50 1.50 1.50 4.50
Awarness camp on Scientific storing of Potato in Cold
Storage
2.50 2.50 2.50 7.50
Workshop on Cold Storage Proprietors, Technicians and
Operators Training
0.50 0.50 0.50 1.50

180
Training on Processing and Preservation of Fruits and
Vegetables.
4.50 4.50 4.50 13.50
Demonstration programme/camp on Processing and
Preservation of fruits and vegetables
1.50 2.25 2.50 6.25
Amar Fasal Amar Gari (distribution of Van-rickshaw
with crate for carrying farm produce)
30.00 40.00 50.00 120.00
Amar Fasal Amar Gola (traditional & improved storage
structure for storing food grains)
1.70 25.50 25.50 52.70
Agri-Mechanical
Proposed intervention wise plans 379.89 282.85 282.85 945.59
Fisheries
Production Growth 32.17 166.80 216.30 415.27
Infrastructure& Assets 52.60 98.70 124.00 275.30
NMPS 0.00 151.40 151.40 302.80
Training 6.90 20.48 27.18 54.55
Extension 2.40 4.20 4.44 11.04
Agri-Irrigation
Proposed intervention wise plans 388.15 544.25 544.25 1476.65
Cooperation
Proposed intervention wise plan for strengthening S K U
S and farmers’ skill development
159.00 173.50 272.00 604.50
WBCADC
Seed Village Programme 1.44 1.76 2.12 5.32
Establishment of Goat/Sheep farm (10+1) 13.20 18.48 25.44 57.12
Establishment of Polly house 100 m2 24.60 34.44 47.20 106.24
Establishment of Poultry unit (100 birds) 9.90 15.84 49.49
Establishment of Pig breeding unit 19.80 31.68 38.00 89.48
Soil sample testing amendment of soil health 0.72 1.05 1.44 3.21
Establishment of Mash room Production 7.20 10.08 13.60 30.88
Skill development training for SHG Members/Farmers
under Agriculture
4.32 6.16 8.48 18.96
Production of quality of seed (Paddy) @ Rs. 26000/-Per
ton
13.00 14.85 16.80 44.65
Renovation of seed godown including Thrashing floor
and Thresher seed processing machine
15.00 0.00 0.00 15.00

181
3. District: Bankura (Rs. in Lakh)
Interventions 2014-15 2015-16 2016-17 TOTAL
Agriculture
Technological interventions on seed production and
processing of agricultural crops
1113.50 517.50 517.50 2148.50
Intervention on potato 24.00 24.00 23.00 71.00
Initiatives of crop development in West Bengal
Seed treatment campaign for attaining 100%
coverage of seed treatment of all major crops in the
district
- 41.19 41.19 82.38
Aromatic rice- area expansion through
demonstration and seed multiplication
- 120.00 120.00 240.00
Sustainable Development of Sugarcane Based
Cropping System
- 9.24 9.24 18.48
Production Enhancement through Alternate Crops
during the Early Rabi & Rabi Summer
- 8.50 8.50 17.00
Soil Conservation : action Plan and activities - 826.00 1082.70 1908.70
Soil and water management - 394.00 562.30 956.30
Horticulture
Area Expansion of Vegetables (RKVY Stream-PG):
Increasing the area under hybrids varieties through
subsidy to the hybrid vegetable growers.
- 80.00 90.00 170.00
Area Expansion of fruit crops ((RKVY Stream-PG)
New crop introduction: Promotion of Strawberry
cultivation(without integration)
- 7.50 10.00 17.50
Dry land farming: Cultivation of minor fruit plants
like Pomegranate, Sapota, Anola, Ber etc
- 32.00 40.00 72.00
Protected Cultivation : Naturally ventilated :
Tubular structure - 28.05 37.40 65.45
Bamboo structure - 13.50 18.00 31.50
Shade net house : bamboo structure - 10.80 14.40 25.20
Net house - 10.80 14.40 25.20
Plastic tunnels - 2.40 3.00 5.40
Vermicompost pit - 50.00 75.00 125.00
Vermicompost pit (HDPE) - 3.20 6.40 9.60
Horticulture Mechanization - 59.05 88.45 147.50

182
Minor & Micro irrigation - 236.25 252.50 488.75
Distribution of Seed minikit distribution for model
kitchen garden
- 75.00 75.00 150.00
Skill development training of farmers - 10.00 20.00 30.00
Integrated Post Harvest Management - 29.50 42.25 71.75
Proposed annual action Plan for RKVY Projects - 177.20 489.80 667.00
Forest: Agroforestry Models
Agri-silvi-horticulture - 30.00 36.00 66.00
Aqua-forestry - 50.00 60.00 110.00
Production of quality planting materials - 30.00 50.00 80.00
Animal Resource Development
Proposed action plans and schemes - 1054.10 1663.00 2717.10
Fisheries Sector
Conversion of semi-derelict and derelict waterbodies
for effective pisciculture
- 462.50 555.00 1017.50
Intensification of carp polyculture - 150.00 180.00 330.00
Semi-intensification of giant freshwater prawn
culture
- 80.00 80.00 160.00
Polyculture of carps with giant freshwater prawn - 70.00 70.00 140.00
Polyculture of carps with small indigenous fishes in
small homestead ponds
- 100.00 100.00 200.00
Culture of air-breathing fishes in semi- derelict
water bodies
- 30.00 40.00 70.00
Integrated fish culture - 120.00 120.00 240.00
Commercial scale production of giant freshwater
prawn seed
- 0.00 20.00 20.00
Promotion of Self Help Group –based fish farming
in common waterbodies for women empowerment
- 20.00 20.00 40.00
Breeding and production of indigenous and exotic
ornamental fishes
- 16.00 16.00 32.00
Up-gradation of pond water & soil testing and fish
disease diagnosis laboratories
- 80.00 100.00 180.00
Establishment of small-scale fish feed
manufacturing units
- 20.00 30.00 50.00
Training of fish farmers for skill development (at the
Meen Bhaban, Hooghly).
- 22.00 22.00 44.00
Strengthening of Fishery Cooperative Societies. - 90.00 90.00 180.00
Development of Model Fisheries Cooperative
Society
- 10.00 10.00 20.00

183
Development of Ornamental Fish Breeding and
Culture Farms
- 10.00 10.00 20.00
Development of Fish Hatchery for breeding of non-
conventional freshwater fishes
- 7.00 7.00 14.00
Strengthening marketing channels through
development of equipped fish sellers/vendors.
- 247.20 247.20 494.40
Establishment of Ice Plant for fish preservation - 0.00 80.00 80.00
Fish market modernization - 80.00 160.00 240.00
ICT-based fish marketing network development - 0.00 90.00 90.00
Sericulture
Sericulture intervention schemes - 30.32 85.25 115.57
Agricultural marketing
Development of Rural Market - 176.00 200.00 376.00
Processing & Preservation of Fruits & Vegetables - 9.60 10.80 20.40
Farmers Training - 3.95 4.95 8.90
Promoting Storage facilities 61.30 73.75 135.05
Transportation for Marketing - 110.00 120.00 230.00
Development of farm to market link road - 1.20 1.30 2.50
Cooperation Department
Setting up of a Training Centre at Bishnupur Branch
premises
- 210.60 - 210.60

184
4. District: Birbhum
(Rs. in Lakh)
Interventions 2014-15 2015-16 2016-17 TOTAL
Agriculture
Technological interventions on seed
production and processing of agricultural
crops
399.00 203.00 203.00 805.00
Intervention on potato 7.85 7.85 7.85 23.55
Initiatives of crop development in West
Bengal
Seed treatment campaign for attaining 100%
coverage of seed treatment of all major crops
in the district
- 15.90 15.90 31.80
Aromatic rice- area expansion through
demonstration and seed multiplication
- 8.25 8.25 16.50
Sustainable Development of Sugarcane
Based Cropping System
18.52 27.93 27.94
Production Enhancement through Alternate
Crops during the Early Rabi & Rabi Summer
- 56.45 56.45 112.90
Agri-irrigation schemes 0.00 652.15 754.43 1406.58
Soil Health Management
STL establishment, rejuvenation and soil
testing activities
102.90 178.90 101.90 383.70
Promotion of Integrated Nutrient
Management (INM)
183.19 147.19 146.19 476.57
Establishment of mini fertilizer/manure
quality control laboratory
50.00 - - 50.00
Soil & Water Conservation schemes 916.85 1026.27 1086.98 3030.10
Mechanization in agriculture - 27.50 27.50 55.00
Horticulture
Area Expansion of Vegetables 5.00 5.00 5.00 15.00
Protected Cultivation: Naturally ventilated-
Tubular structure 4.68 4.68 4.68 14.04
Bamboo structure 2.25 2.25 2.25 6.75
Shade net house : bamboo structure 1.80 1.80 1.80 5.40
Plastic tunnels 0.30 0.30 0.30 0.90

185
Vermicompost pit 5.00 5.00 7.50 17.50
Vermicompost pit (HDPE) 0.40 0.80 1.20 2.40
Horticulture Mechanization 6.00 6.80 10.60 23.40
Skill development training of farmers 1.00 2.00 3.00 6.00
Integrated Post Harvest Management 4.38 4.38 4.38 13.14
Proposed annual action Plan for RKVY
Projects
0.60 3.00 0.63 4.23
Agroforestry
Agri-silvi-horticulture 24.00 30.00 40.00 94.00
Aqua-forestry 50.00 60.00 80.00 190.00
Production of quality planting materials 30.00 50.00 50.00 130.00
Animal Resource Development
Asset/infrastructure generation/development 1075.45 1554.05 1447.05 4076.55
Human Resource Development 103.29 101.29 103.29 307.87
Fisheries
Conversion of semi-derelict waterbodies for
effective pisciculture
200.00 240.00 240.00 680.00
Conversion of derelict waterbodies for
effective pisciculture
262.50 315.00 315.00 892.50
Intensification of carp polyculture 150.00 180.00 180.00 510.00
Semi-intensification of giant freshwater
prawn culture
80.00 80.00 120.00 280.00
Polyculture of carps with giant freshwater
prawn
70.00 70.00 105.00 245.00
Polyculture of carps with small indigenous
fishes in small homestead ponds
100.00 100.00 120.00 320.00
Culture of air-breathing fishes in semi-
derelict water bodies
30.00 40.00 40.00 110.00
Integrated fish culture 120.00 120.00 120.00 360.00
Commercial scale production of giant
freshwater prawn seed
0.00 20.00 20.00 40.00
Promotion of Self Help Group –based fish
farming in common waterbodies for women
empowerment
20.00 20.00 20.00 60.00
Breeding and production of indigenous and
exotic ornamental fishes
16.00 16.00 16.00 48.00

186
Up-gradation of pond water & soil testing
and fish disease diagnosis laboratories
&Training
40.00 80.00 80.00 200.00
Establishment of small-scale fish feed
manufacturing units
20.00 30.00 40.00 90.00
Fish Farmers’ Residential Training Centre –
cum - Laboratory
186.00 0.00 0.00 186.00
Fish farmers training & capacity building 18.00 18.00 18.00 54.00
Skill development for ornamental fish
breeding, rearing & marketing
5.50 5.50 5.50 16.50
Development & Strengthening of Fishery
Cooperative Societies
130.00 130.00 95.00 355.00
Development of Ornamental Fish Breeding
and Culture Farms.
10.00 10.00 10.00 30.00
Development of Fish Hatchery for breeding
of non-conventional freshwater fishes
7.00 7.00 7.00 21.00
Strengthening marketing channels through
development of equipped fish sellers/vendors
216.00 216.00 216.00 648.00
Establishment of Ice Plant for fish
preservation
- 80.00 80.00 160.00
Fish market modernization 80.00 160.00 160.00 400.00
Agricultural Marketing
Providing support to SHGs as livelihood
support through Direct Marketing of Agril.
Produce @ Rs. 25000/- per SHG
2.50 3.00 3.75 9.25
Infrastructure and Asset 64.20 70.25 76.90 211.35
Production Growth 7.15 9.47 12.52 29.14
Cooperation
Infrastructure & assets 414.00 395.00 390.00 1199.00
Flexi-fund schemes 34.00 34.00 36.00 104.00
Production Growth schemes 20.00 20.00 25.00 65.00
WBCADC
WBCADC Schemes 37.20 16.85 17.55 71.60
Proposal of action plans of RKVY 142.00 374.00 181.00 697.00

187
5. District: Hooghly (Rs. in Lakh)
Interventions 2014-15 2015-16 2016-17 TOTAL
Agriculture
Technological interventions on seed
production and processing of agricultural
crops 220.00 108.00 108.00 436.00
Intervention on potato 24.00 24.00 23.00 71.00
Intervention on jute 13.06 13.06 13.06 39.18
Initiatives of crop development in West Bengal
Seed treatment campaign for attaining 100%
coverage of seed treatment of all major crops
in the district - 36.90 36.90 73.80
Aromatic rice- area expansion through
demonstration and seed multiplication - 8.25 8.25 16.50
Sustainable Development of Sugarcane Based
Cropping System - 2.81 2.81 5.62
Production Enhancement through Alternate
Crops during the Early Rabi & Rabi Summer - 8.50 8.50 17.00
Establishment of soil testing laboratories its strengthening and other soil test related
activities
Setting/Establishment of the new STLs;
rejuvenation of the old and strengthening one
STL with advanced facility of micronutrient
analysis- with 7 Nos sub schemes 25.30 175.30 72.80 273.40
Soil testing including capacity building
through training- with 7nos sub schemes 27.00 33.00 31.00 91.00
Demonstration and Distribution 127.56 129.36 128.36 385.28
Capacity building through training 27.68 27.68 27.68 83.04
Farm Mechanization Intervention : Custom
hiring centre/ implementa tion hub, assistance
to farmers for purchase, maintenance and
repair of farm implements, supply of farm
implements to sed farms, etc 220.86 212.60 207.60 641.06
Interventions on integrated plant protection through bio- village, IPM & plant health clinic
Awareness training cum field demonstration
through IPM - 9.61 9.61 19.22
Establishment of Bio-Village programme –
Demonstration - 12.60 12.60 25.20
Distribution of bio pesticides to demonstrate
the efficacy of the bio-pesticides - 14.44 14.44 28.88

188
Establishment of plant Diagnostic Clinic 16.30 4.62 4.62 25.54
Horticulture
Area Expansion of Vegetables (RKVY
Stream-PG): Increasing the area under hybrids
varieties through subsidy to the hybrid
vegetable growers. 10.00 12.00 12.00 34.00
Protected Cultivation like construction of green houses, shade net house and plastic
tunnels, anti bird/hail nets, etc.
Naturally ventilated Tubular Structure 9.35 9.35 9.35 28.05
Bamboo Structure (Low cost poly house with
UV-stabilized polythene top and insect-proof
side wall) 9.00 13.50 18.00 40.50
Shade Net House – Bamboo structure 7.20 7.20 7.20 21.60
Net House 20.00 20.00 20.00 60.00
Plastic tunnel 1.20 1.50 1.50 4.20
Organic Cultivation
Construction of permanent vermicompost pit 15.00 15.00 20.00 50.00
Vermicompost Pit (HDPE) 1.60 1.60 2.40 5.60
Horticulture Mechanization
Power Tiller (8 BHP and above) 36.00 36.00 36.00 108.00
Power/Hydraulic operated machines - 8.00 8.00 16.00
Human Resource Development-Training of
farmers 5.00 5.00 5.00 15.00
Integrated Post Harvest Management : Low
Cost Onion Structure (25 mt) 35.00 35.00 26.25 96.25
Technology dissemination through Tissue
culture banana plantation At Chin. Hort.
Res. & Dev farm –1.5 acre 2.20 - - 2.20
Technology dissemination on Onion seed
production in 0.5 acre land area and seed
storage at KVK, Hooghly 0.60 - - 0.60
On farm awareness programme on technology
and demonstration of cultivation of onion in
Hooghly dist.– 30 nos. farmer per training at
Chin. Horti. Res. & Dev. Farm, Hooghly - 3.00 - 3.00
Vegetable Seedling Production under
PolyHouse at KVK,Hooghly – 200 Sq. m. - 0.20 - 0.20
Maintenance of progeny orchard at KVK,
Hooghly 0.50 0.50
Demonstration on off season vegetable
cultivation under shade net/ poly house of 200
Sq. mt. area in three season at Chinsurah
Horticulture Res. & Dev. Farm 0.63 0.63

189
Area Expansion of Vegetable (For Max. area
of 2 ha. Per beneficiary) - Hybrid 20.00 - - 20.00
Promotion of INM/IPM 0.60 - - 0.60
Low Cost Onion Storage Structure (25MT) 4.38
Vermi compost Units Permanent Structure of
(30’×8’×2.5’) 15.00 - - 15.00
Training of Farmers within State (one day’s) 4.50 - - 4.50
Agroforestry
Agri-silvi-horticulture 24.00 30.00 40.00 94.00
Aqua-forestry 50.00 60.00 80.00 190.00
Production of quality planting materials 30.00 50.00 50.00 130.00
Irrigation & water resource programmes 502.63 1736.88 1781.31 4020.84
Fisheries
Conversion of semi-derelict water bodies for
fish culture 200.00 240.00 240.00 680.00
Conversion of derelict water bodies for fish
culture 262.50 315.00 315.00 892.50
Intensification of carp polyculture 150.00 180.00 180.00 510.00
Semi-intensification of giant freshwater prawn
culture 80.00 80.00 120.00 280.00
Polyculture of carps with giant freshwater
prawn 70.00 70.00 105.00 245.00
Polyculture of carps with small indigenous
fishes in small homestead ponds 100.00 100.00 120.00 320.00
Culture of air-breathing fishes in semi-derelict
water bodies 30.00 40.00 40.00 110.00
Integrated fish culture 120.00 120.00 120.00 360.00
Commercial scale production of giant
freshwater prawn seed 0.00 20.00 20.00 40.00
Promotion of Self Help Group –based fish
farming in common waterbodies for women
empowerment 20.00 20.00 20.00 60.00
Breeding and production of indigenous and
exotic ornamental fishes 16.00 16.00 16.00 48.00
Up-gradation of pond water & soil testing and
fish disease diagnosis laboratories 40.00 60.00 80.00 180.00
Establishment of small-scale fish feed
manufacturing units 20.00 30.00 40.00 90.00
Fish Farmers’ Residential Training Centre –
cum - Laboratory for on-farm training of fish
farmers for skill development (at the Meen
Bhaban, Hooghly) 18.00 18.00 18.00 54.00

190
Skill development for ornamental fish
breeding, rearing, transportation & marketing
through training and exposure visits in
different National Institutes / universities for
farmers and govt. officials 5.50 5.50 5.50 16.50
Strengthening of Fishery Cooperative
Societies 90.00 90.00 90.00 270.00
Development of Model Fisheries Cooperative
Society 30.00 30.00 15.00 75.00
Kalyan Matsyajibi Samabay Samity Ltd., Srirampore Dekole Chandimata Matsyajibi
Samabay Samity Ltd, Balagarh
Development of Ornamental Fish Breeding
and Culture Farms. 10.00 10.00 10.00 30.00
Development of Fish Hatchery for breeding of
non-conventional freshwater fishes 7.00 7.00 7.00 21.00
Strengthening marketing channels through development of equipped fish sellers / vendors
Providing bi-cycle with insulated box 24.00 24.00 24.00 72.00
Providing Matsyajan 43.20 43.20 43.20 129.60
Providing Insulated Box 180.00 180.00 180.00 540.00
Establishment of Ice Plant for fish
preservation - 80.00 80.00 160.00
Fish market modernization 80.00 160.00 160.00 400.00
ICT-based fish marketing network
development - 90.00 90.00 180.00
Animal Resource Development
Modernization of Animal Development Aid
Centre (ADAC) 25.00 37.50 37.50 100.00
Vaccine transportation System for
maintaining cold chain from District Head
Quarter to different Blocks of the district 15.00 - - 15.00
Establishment of Goat Breeding Farm for
supplying breeding stock to stakeholders 10.00 15.00 - 25.00
Establishment of Pig Rearing Farm in cluster
Form involving pig keepers 12.60 25.20 25.20 63.00
Central Mother Fodder Seed Production Unit - 10.00 - 10.00
Fodder Demonstration Plot 9.00 13.50 13.50 36.00
Go Abash Prakalpo(Low cost Scientific
cowshed) for poor dairy farmers 22.50 45.00 45.00 112.50
Distribution of Hand Driven Chaff Cutter
forprogressive dairy Farmers 72.00 144.00 144.00 360.00
Distribution of MachineDriven Chaff Cutter
progressive dairy farmers 117.00 234.00 234.00 585.00

191
Supply of Feeding –Trough to BPL Dairy
Farmers 18.00 27.00 27.00 72.00
Self –Employment through Goatery
Demonstration of heifer management under
family bas9.25ed programme 58.50 117.00 117.00 292.50
Outlets for Marketing of Animal Products
through SHG. 20.00 20.00 20.00 60.00
Human resource Development 68.50 80.00 82.00 230.50
Agri marketing
Flexi Fund : Providing support to SHGs as
livelihood support through Direct Marketing
of Agril. Produce @ Rs. 25000/- per SHG 2.50 3.00 3.75 9.25
Infrastructure and Asset : amar fasal amar
gola, amar fasal amar gari 64.20 70.25 76.90 211.35
Training of farmers and cold storage operators 8.65 11.57 15.52 35.74
Cooperation Dept.
Infrastructure And assets 578.00 524.00 466.00 1568.00
Flexi Fund : Repair renovation of rural
godown, Development of PACs and
cooperatives 18.00 18.00 18.00 54.00
Training for SHGs 20.00 20.00 25.00 65.00
Food & Supplies
Godown construction for storing foodgrains 700.00 1400.00 1400.00 3500.00
Renovation of existing godown - 15.00 110.00 125.00
Training cum Meeting 5.00 5.00 10.00
WBCADC: Boinchi Project Schemes 24.10 88.70 93.55 206.35

192
6. District: Malda
(Rs. in lakh)
Interventions 2014-15 2015-16 2016-17 TOTAL
Agriculture
Enhancement of Soil Fertility through soil
amelioration 265.50 337.50 409.50 1012.50
Promotion of INM and IPM 67.50 90.00 112.50 270.00
Promotion of Conservation Agriculture 75.00 75.00 75.00 225.00
Integrated Pest Management Practices through
Bio Village programme 150.00 150.00 150.00 450.00
Seed Treatment Campaign 4.50 4.50 4.50 13.50
Popularization of bio pesticides and
botanical pesticides 6.00 6.00 6.00 18.00
Diversification of crops through
Promotion of Hybrid Maize 15.00 15.00 15.00 45.00
Cropping system Intensification 30.00 30.00 30.00 90.00
Promotion of sugarcane based cropping system 18.50 18.50 18.50 55.50
Location specific initiative by promoting
local black gram cultivars 60.00 60.00 60.00 180.00
Farm Mechanization through establishment of
Implement Hub 900.00 900.00 900.00 2700.00
Capacity Building 105.00 105.00 105.00 315.00
Infrastructure Development of Government
Agricultural farm 576.00 309.00 5.00 890.00
Horticulture
Production Growth through Demonstration
Centre and capacity building 0.00 183.25 103.03 286.28
Infrastructure and Assets 205.03 289.69 103.03 597.75
Animal Resource Development
Production and Growth programmes 90.49 182.92 186.92 460.33
Capacity Building 26.40 52.80 52.80 132.00
Infrastructure and Assets 3.00 0.00 0.00 3.00
Fisheries
Culture of indigenous fish in backyard ponds 14.40 15.00 18.00 47.40
Seed Mahotsov - 7.50 7.50 15.00
Liberation of fish fingerlings in the ponds
excavated under MGNREGS - 4.00 5.00 9.00
Scheme for Intensive Fish culture 73.60 92.00 110.40 276.00
Scheme for production of fingerlings of Carps 6.90 8.63 11.50 27.03

193
Scheme for Brooders management and
production of quality Spawn of Indian Major
Carp 0.73 1.83 2.56 5.12
Scheme for production of big sized fish in
large water bodies 47.00 70.50 94.00 211.50
Scheme for production of big sized fish in
medium water bodies 14.35 22.69 `28.7 65.74
Infrastructure & Assets 78.60 51.28 60.75 190.63
State core plan : extension, Capacity building,
others 61.80 68.23 78.34 208.37
Sericulture : Production growth
programmes 213.33 213.33 204.60 631.26
Agriculture Marketing : Production Growth
programs 1183.10 1219.34 803.10 3207.54
Minor Irrigation : Production Growth
programmes 602.09 1784.05 628.78 3014.92
Cooperation : Plan for godown, cold
storage, markets, PACs, Co-operative
consumer societies, etc. of Co-op Dept 253.50 670.40 760.70 1684.60
DRDC : Production Growth programmes 215.00 430.00 430.00 1075.00
RRSS, OAZ, UBKV
Ehancement of Cropping System
productivity through Cropping System
Intensification 19.95 15.45 15.45 50.85
Seed production of Cereals and Pulses through
Participatory Approach 13.52 19.81 19.81 53.14
Infrastructure and Assets 96.00 67.00 10.00 173.00
KVK, Malda
Effective utilization of residual moisture for
wheat cultivation by zero tillage machine 3.00 6.00 9.00 18.00
Seed production of blackgram 1.80 3.00 7.20 12.00
Demonstration on Hybrid Maize 5.00 10.00 15.00 30.00
Lentil cultivation through Resource
Conservation 1.80 3.00 5.40 10.20
Effective utilization of the relative upland by
cultivating remunerative crops 7.50 15.00 22.50 45.00
Maintenance as well as peservation of germ
plasm of obsolete variety of sona mung 3.00 4.50 6.00 13.50
Infrastructure 114.00 10.50 8.00 132.50
Farm Implements 1.50 1.50 6.50 9.50
Capacity Building Programmes 4.95 7.28 12.23 24.45

194
7. District: South 24-Parganas Rs. in lakh
Interventions 2014-15 2015-16 2016-17 TOTAL
Agriculture
Programmes on Production and Growth,
Infrastructure and asset Building 1040.47 1177.22 1258.24 3475.93
Horticulture
Hi-tech Horticulture in West Bengal 129.29 345.84 475.06 950.19
Organic Farming 20.00 22.50 25.00 67.50
Post Harvest Infrastructure Development 39.50 57.00 94.50 191.00
Sustainable Vegetable Initiative Programme in
Bhangar II Block 69.87 69.98 70.05 209.90
Capacity building 85.11 97.31 108.37 290.73
Integrated Development of Fruits and vegetable
cultivation (Vegetables) 87.87 99.98 110.05 297.90
Plant Protection Measures - 100.00 150.00 250.00
Innovative Projects 82.95 49.16 49.16 181.27
Mission Management - 116.40 126.40 242.80
Integrated Development of Fruits and vegetable
cultivation (Fruits) - 227.50 292.50 520.00
Market Infrastructure - 125.00 250.00 375.00
Infrastructure - 1376.25 835.00 2211.25
Seed Spices - 15.00 30.00 45.00
Mushroom Cultivation - 25.00 50.00 75.00
Pollination support through Bee Keeping - 44.00 66.00 110.00
Seminar, workshop, exhibition, etc. - 32.00 32.00 64.00
Agri Marketing
Godown, cold storage, livelihood support, 29.50 1105.00 1200.00 2334.50
Road, krishak bazaar, etc.
Soil Conservation
BGERI W H S Programmes 298.00 382.00 408.00 1084.00
NMSA Programmes 134.92 134.92 134.92 404.76
Programmes for Canning & Diamond Harbour 398.00 382.00 408.00 1188.00
Forestry : Programmes 59.00 - - 59.00
Animal Resources development
Optimization of productive efficiency through
parasitic control programme (Flexi). 59.53 59.53 59.53 178.59
Improvement of Livelihood through Goat Farming
(Selected Blocks) 36.39 36.39 36.39 109.17
Improvement of Livelihood through Goat Farming(
NMPS) 18.20 18.20 18.20 54.60

195
Distribution of Inputs for Improvement of
Livelihood through Goat Farming (RKVY) 60.00 60.00 60.00 180.00
Distribution of Inputs for Improvement of
livelihood through Pig Farming. 8.00 8.00 8.00 24.00
Extension of Animal Health Care Service in remote
Areas through Mobile Vet. Clinic 21.87 21.87 21.87 65.61
Augmentation of Meat Production by Intensive
Sheep/ Goat Rearing through adoption of Good
Husbandry Practice (NMPS) 38.69 38.69 38.69 116.08
Strengthening Goat Farm under R. K. Mission
Ashram at Nimpith (Infrastructure). 15.52 15.52 15.52 46.56
Distribution of Chicks/Ducklings involving SHG 69.60 69.60 69.60 208.80
Fisheries
Culture of indigenous fish in backyard ponds - 45.00 45.00 90.00
Seed Mahotsov - 12.50 15.00 27.50
Scheme for Intensive Fish culture 368.00 368.00 368.00 1104.00
Scheme for production of fingerlings of carps 40.25 40.25 40.25 120.75
Scheme for Modified Extensive culture of Black
Tiger Shrimp in Brackish Water 68.00 68.00 68.00 204.00
Scheme for Brooders management and production
of 0.73 1.46 1.46 3.65
quality Spawn of Indian Major Carp
Scheme for production of big sized fish in large
water bodies 28.20 28.20 28.20 84.60
Scheme for production of big sized fish in medium
water bodies 34.44 34.44 34.44 103.32
Infrastructure & assets 194.50 194.50 194.50 583.50
Training & Extension 28.93 28.93 28.93 86.79
Cooperation Dept.: Godown, skill development,
vermicompost , etc. 202.50 290.00 270.00 762.50
Regional research station (CSZ), BCKV, KAKDWIP
Promotion of sunflower through standardization of
crop management and quality oil production 122.73 13.70 13.70 150.13
Low cost mushroom spawn production and
cultivation technology for livelihood security of
rural youth 46.91 10.61 10.19 67.71
Seed production and establishment of a processing
unit in RRS (CSZ),BCKV, Kakdwip for seed
distribution in South 24-Parganas 59.62 23.00 18.40 101.02
Development of infrastructure for improving quality
of life of rural people of sundarban delta 291.31 194.20 35.74 521.25
Establishment of vermi-compost production units
for livelihood security of rural youth 11.06 4.28 4.39 19.73

196
8. District: Dakshin Dinajpur
(Rs. in lakh)
Interventions 2014-15 2015-16 2016-17 TOTAL
Agriculture
Infrastructure development for Govt. Agri.Farm 224.25 504.08 248.70 977.03
Soil health management – green manuring,
vermicompost, biofertilizer, INM concept, training and
distribution of soil testing kit 91.50 214.45 280.45 586.40
Plant protection:
a) Seed treatment campaign to gain 100% coverage of
seed treatment of major crop
b) Popularization of bio-pesticides and botanical
pesticides
c) Bio-village programme 4.80 26.40 26.40 57.60
Farm Mechanizatioin : establishment of Implement
hub and training of operators 162.00 405.00 324.00 891.00
Diversification of agriculture through demonstration :
a) Promoting hybrid maize
b) Promotion of sugarcane based cropping system
c) Area expansion of aromatic rice 5.00 16.00 `16.00 37.00
KVK, UBKV, Dakshin Dinajpur
Agriculture Farm Infrastructure dev. 99.10 68.20 40.20 207.50
Animal husbandry & Fishery Infrastructure
Development 22.00 2.50 2.50 27.00
Promotion of RCT as Conservation Agriculture
Practices in farmers field 5.75 5.75 5.75 17.25
Soil Health Management & Organic Farming Practices
in Farmers Field 4.55 4.30 3.80 13.65
Plant Protection & Secondary Agri. Practices 3.50 4.50 4.50 12.50
Agril. Information Publicity & Dissemination 7.50 6.75 6.75 21.00
RRS (OAZ) UBKV Dakshin Dinajpur
Infrastructure Development for Farm 141.00 226.00 221.00 588.00
Farm Mechanization 14.00 31.25 13.75 59.00
Farm Horticulture sector 19.00 50.00 47.00 116.00
Livelihood intervention for sustainable development at
rural level 47.00 47.00 47.00 141.00
Human Resource Development 9.50 9.50 9.50 28.50
Animal Resource Development
Distribution of Inputs for Improvement of Livelihood
through Goat Farming 54.00 59.40 65.34 178.74

197
Augmentation of Meat Production by Intensive
Sheep/Goat Rearing through adoption of good
husbandry practices 86.00 94.60 104.06 284.66
Distribution of Inputs for Improvement of livelihood
through Goat Farming 86.00 94.60 104.06 284.66
Optimization of Productive Efficiency through
Organization of Animal Health Camp 17.68 19.45 21.40 58.53
Infrastructure Development
a) Strengthening of Biosecurity practices in the Govt.
poultry farm
b) Mobile Veterinary Clinic 126.44 124.21 136.66 387.31
Modified Bishes Go- Sampad Bikash Avijan 44.28 48.71 53.58 146.57
Horticulture
Integrated development of fruits and vegetable
cultivation in D.Dinajpur 458.00 503.80 554.18 1515.98
Capacity building and Human Resource Development
in D.Dinajpur 96.71 106.38 116.05 319.15
Bee Keeping and Pollination support in D. Dinajpur 44.44 48.88 53.33 146.65
High Tech Horticulture in D. Dinajpur 50`5.27 555.80 606.32 1162.12
Organic Farming in D. Dinajpur 60.60 66.66 72.72 199.98
Horticulture Technology Dissemination Centre 205.03 225.53 - 430.56
Agril. Marketing : Infrastructure dev. 56.72 687.68 104.64 849.04
Fisheries
Intensive fish culture 22.08 22.08 22.08 66.24
Production of carp fingerlings 4.60 4.60 4.60 13.80
Brooders management 0.73 0.73 0.73 2.19
Infrastructure &Assets 47.20 47.20 47.20 141.60
Irrigation : Plans and Programes 69.34 138.69 138.69 346.72
Agri-Mechanical : Plans & Programmes 298.56 312.37 312.37 923.30
Sericulture : Plans and Programmes 61.30 38.00 40.00 139.30
Forestry : Plans and Programmes 154.63 126.33 114.13 395.09
District Industrial Centre Programmes 935.00 1344.00 380.00 2659.00

198
9. District: Nadia (Rs. in lakh)
Interventions 2014-15 2015-16 2016-17 TOTAL
Agriculture
Production of quality seed in Nadia district 27.60 27.60 27.60 82.80
Initiatives for crop development in Nadia district 116.39 116.39 116.39 349.17
Soil Health management Introduction of mobile soil
testing van cum laboratory - 75.00 - 75.00
Technologies Demonstration for improvement in
efficiency of fertilizer application through promotion of
slow releasing nitrogen fertilizer, biofertilizer ,etc. 16.00 16.00 16.00 48.00
Promotion of Integrated Nutrient Management ( INM)
through soil health management 55.94 55.94 55.94 167.82
Farm Mechanization 502.00 502.00 502.00 1506.00
Agril. Extension and mass campaign 46.32 46.32 46.32 138.96
Seed Production in govt. Agril. farm 23.30 23.30 23.30 69.90
Horticulture
Human Resource Development ……Awarmess
Programme of Farmers 2.50 2.50 2.50 7.50
Open Field Cultivaiton-Area Expansion of Hybrid
Vegetables 5.00 6.00 6.00 17.00
Open Field Cultivation- Area Expansion of Loose
Flowers 3.20 4.00 4.00 11.20
Open Field Cultivation - Area Expansion of Kharif
Onion 15.00 15.00 15.00 45.00
Protected Cultivation ( Green House – Naturally
Ventilated ) … Tubular Structure 5.30 5.30 5.30 15.90
Protected Cultivation ( Green House – Naturally
Ventilated ) … Bamboo Structure 2.25 2.25 4.50 9.00
Protected Cultivation ( Shade Net House ) … Bamboo
Structure 1.80 2.52 2.52 6.84
Organic Farming -Vermi Compost Pit (Permanent) 1.50 1.50 1.50 4.50
Horticulture Mechanization-Power Tiller ( 8 BHP &
above) 6.00 6.00 6.00 18.00
Horticulture Mechanization …….. Power Operated /
Fuel operated Knapsack sprayer 0.80 0.80 1.20 2.80
Post - Harvest Management-Low cost Onion Structure 8.75 8.75 8.75 26.25
Public Sector Scheme - Tissue Culture Banana
Demonstration - 2.20 - 2.20
Public Sector Scheme-Vegetable seedling production
under Poly House - 0.20 - 0.20

199
Public Sector Scheme….. Kharif Onion Seed Production
demonstration - 0.60 - 0.60
Public Sector Scheme- Marketing Structure ( Chakdaha) - 142.23 - 142.23
Public Sector Scheme- Marketing Structure (Ranaghat) 125.59 - 125.59
Public Sector Scheme….. Construction of Technology
Dissemination Centre( Ranaghat) - 41.75 - 41.75
Public Sector Scheme….. Construction of Technology
Dissemination Centre( Tehatta) - 41.75 - 41.75
Public Sector Scheme….. Infrastructural Development
of SHR&DS, Krishnagar - 7.26 6.33 13.59
Construction of market complex and infrastructure
…Birnagar, Nadia - - 138.23 138.23
RKVY Special schemes : National vegetable Initiative
for Urban Clusters 45.48 - - 45.48
Animal Resource development
Optimization of Productive efficiency Through 34.89 34.89 34.89 104.67
Organizationof animal ealth camp (parasite Control, ppr
control,Fertilitymanagement And ranikhet disease
Control at farmers’Door step.
Augmentation of meat Production by intensive 30.00 30.00 30.00 90.00
Sheep/goat rearing Through adoption of Good
husbandry Practice.
Strengthening of bio-security practices in the 150.00 0.00 0.00 150.00
Govt. poultry farms
Infrastructural Development of District Veterinary Polly
Clinic 75.00 0.00 0.00 75.00
Proposals under bishes go sampad bikash avijan 137.55 314.08 130.31 581.94
Fisheries
Culture of indigenous fish in backyard ponds 60.00 60.00 90.00 210.00
Seed Mahotsov 6.00 12.00 18.00 36.00
Scheme for Intensive Fish culture 120.00 180.00 180.00 480.00
Scheme for production of fingerlings of Carps 120.00 180.00 180.00 480.00
Scheme for Brooders management and production of
quality Spawn of Indian Major Carp 90.00 90.00 150.00 330.00
Fish farming with floating protein feed in newly created
water bodies under the scheme “Jal Dharo Jal Bhoro” 150.00 150.00 150.00 450.00
Composite Fish Farming in perennial Beels under FCS 120.00 180.00 240.00 540.00
Setting up Demonstration Centre (DC) 90.00 60.00 42.00 192.00
Scheme for production of big sized fish in large water
bodies (NMPS) 80.00 80.00 80.00 240.00

200
Scheme for production of big sized fish in medium
water bodies (NMPS) 60.00 60.00 90.00 210.00
Distribution of hygienic insulated box to fish
vendors/collectors. 180.00 180.00 180.00 540.00
Distribution of By-Cycle with insulated box to fish
vendors 24.00 24.00 24.00 72.00
Distribution of Matsyajan (insulated fish vending unit) 43.20 43.20 43.20 129.60
Construction and commissioning of Block Laboratory -
cum - Training centre 15.00 15.00 30.00 60.00
Re-excavation of beels for fish farming 500.00 1000.00 1000.00 2500.00
Construction of weir-net bundhs in open Beel 30.00 30.00 60.00 120.00
Sericulture
Improvement of Mulberry Garden in Govt. Farms
through application of Organic Manure, Bio-fertilizar
etc. 1.80 1.80 1.80 5.40
Farm Mechanization & adoption of scientific Package of
Practices. 6,00 - -
Development of Seed Production facilities at Govt.
Farms 25.00 - - 25.00
Establishment of Scientific Testing & Training Centre
at Govt. Unit. 30.00 - - 30.00
Supply of organic inputs & eco-friendly pesticides for
production of quality Mulberry Leaves for Bi-voltine
Rearing of farmers 6.00 6.00 6.00 18.00
Disinfection of Rearing House & appliances of Farmers 15.00 15.00 15.00 45.00
Supply of Paddle Van to Farmers for carrying of
Mulberry leaves & other items 15.00 15.00 15.00 45.00
Cooperation
Construction of rural goown(100MT&50MT) 375.00 375.00 375.00 1125.00
Repair/ Renovation/ Extension/ Completion of Rural
Godown 80.00 80.00 80.00 240.00
Training Centre for farmers & SHGs 105.00 105.00 105.00 315.00
Irrigation through sub mersible Pumps 10.00 10.00 10.00 30.00
Co-operative Rice Mills 1000.00 1000.00 1000.00 3000.00
Establishment of Vermicompost unit, Development of
co-operatives, PAC, Consumer Coop, Mahila Coop,
Marketing Coop, etc 106.00 110.00 110.00 326.00
Establishment of Multipurpose Mini Co-op. Cold
Storage 200.00 200.00 200.00 600.00
Establishment of food Processing unit. 50.00 50.00 50.00 150.00
Self Service counter for Wholesale Consumers Co-ops 100.00 100.00 - 200.00

201
Training and awareness programme 26.50 26.50 26.50 79.50
Coop cold storage Multipurpose - 10000.00 - 10000.00
WBCADC
WBCADC Ranaghat II–Agril. programmes 54.50 52.50 54.00 161.00
WBCADC Haringhata–Agril. programmes 52.00 52.00 52.00 156.00
WBCADC Haringhata–Fishery programmes 4.36 2.61 2.61 9.58
Agri-Marketing
Amar Fasal Amar Gola - 13.60 13.60 27.20
Amar Fasal Amar Gari. - 15.00 15.00 30.00
Jute grading training - 4.00 4.40 8.40
KVK Gayeshpur Nadia – Agril. Programmes &
Infrasture - 184.00 103.00 287.00
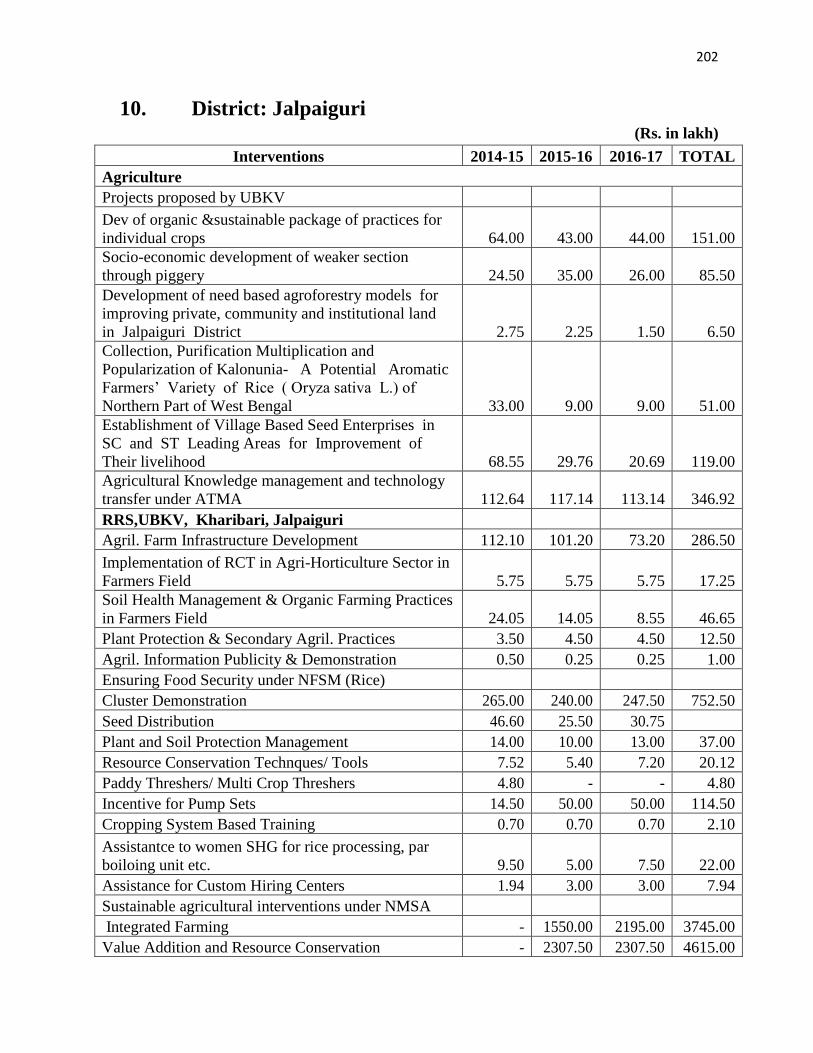
202
10. District: Jalpaiguri (Rs. in lakh)
Interventions 2014-15 2015-16 2016-17 TOTAL
Agriculture
Projects proposed by UBKV
Dev of organic &sustainable package of practices for
individual crops 64.00 43.00 44.00 151.00
Socio-economic development of weaker section
through piggery 24.50 35.00 26.00 85.50
Development of need based agroforestry models for
improving private, community and institutional land
in Jalpaiguri District 2.75 2.25 1.50 6.50
Collection, Purification Multiplication and
Popularization of Kalonunia- A Potential Aromatic
Farmers’ Variety of Rice ( Oryza sativa L.) of
Northern Part of West Bengal 33.00 9.00 9.00 51.00
Establishment of Village Based Seed Enterprises in
SC and ST Leading Areas for Improvement of
Their livelihood 68.55 29.76 20.69 119.00
Agricultural Knowledge management and technology
transfer under ATMA 112.64 117.14 113.14 346.92
RRS,UBKV, Kharibari, Jalpaiguri
Agril. Farm Infrastructure Development 112.10 101.20 73.20 286.50
Implementation of RCT in Agri-Horticulture Sector in
Farmers Field 5.75 5.75 5.75 17.25
Soil Health Management & Organic Farming Practices
in Farmers Field 24.05 14.05 8.55 46.65
Plant Protection & Secondary Agril. Practices 3.50 4.50 4.50 12.50
Agril. Information Publicity & Demonstration 0.50 0.25 0.25 1.00
Ensuring Food Security under NFSM (Rice)
Cluster Demonstration 265.00 240.00 247.50 752.50
Seed Distribution 46.60 25.50 30.75
Plant and Soil Protection Management 14.00 10.00 13.00 37.00
Resource Conservation Technques/ Tools 7.52 5.40 7.20 20.12
Paddy Threshers/ Multi Crop Threshers 4.80 - - 4.80
Incentive for Pump Sets 14.50 50.00 50.00 114.50
Cropping System Based Training 0.70 0.70 0.70 2.10
Assistantce to women SHG for rice processing, par
boiloing unit etc. 9.50 5.00 7.50 22.00
Assistance for Custom Hiring Centers 1.94 3.00 3.00 7.94
Sustainable agricultural interventions under NMSA
Integrated Farming - 1550.00 2195.00 3745.00
Value Addition and Resource Conservation - 2307.50 2307.50 4615.00

203
Soil Health Management - 98.00 36.00 134.00
On Farm Water Management - 26.09 26.09 52.18
Activities under SMAM 62.85 133.20 93.20 289.25
Activities under RKVY 44.68 55.57 46.93 147.68
Activities under NOOP 20.52 33.15 37.34 91.01
Climate Change and sustainable agriculture: Modelling
& Networking (CCSAMN) - 7.50 8.00 15.50
Horticulture
Programmes, Infrastructure &training 188.90 115.03 115.03 418.96
Animal Resource Development
Distribution of Goatery units under RKVY including
NMPS - - - 40.00
Distribution of Piggery units under RKVY including
NMPS - - - 8.00
Augmentation of Good husbandry practices among
goat farmers under RKVY including NMPS - - - 21.11
Chicks distribution programme under State Plan - - - 34.32
Bishes Go-Sampad Abhijan Prokalpa - - - 89.42
Parasitic Control, fertility management, - - - 26.69
PPR control & Ranikhet Disease control - - -
PPR Control - - - 7.80
FMD Control - - - 9.22
Vaccination of other economically important diseases - - - 6.00
Sericulure
Land Management & soil reclamation. 8.75
Equipment support to govt. Farms for quality
production of Mulberry and silk worm silk 16.20
Construction of chain link Fencing around the Govt.
Farms 195.00
Maintenance of silkworm host plant at Farmer’s
garden. (0.5 acre / Farmer) 30.00
Scheme for introducing of modern tools and
technologies. 21.00
Agri-mechanical
Cost of renovation of major RLI schemes 862.58 0.00 0.00 862.58
Agri-marketing
Amar fasal amar gari 100.00 120.00 150.00 370.00
Amar fasal amar gola 35.90 39.30 42.20 117.40
Jute grading training camp 11.20 13.20 15.20 39.60
Jute ratting training camp 3.50 5.00 7.50 16.00
Cold storage technician training programme 1.75 2.50 3.50 7.75
Training of scientific & batter packaging of agri. 1.00 1.50 1.75 4.25
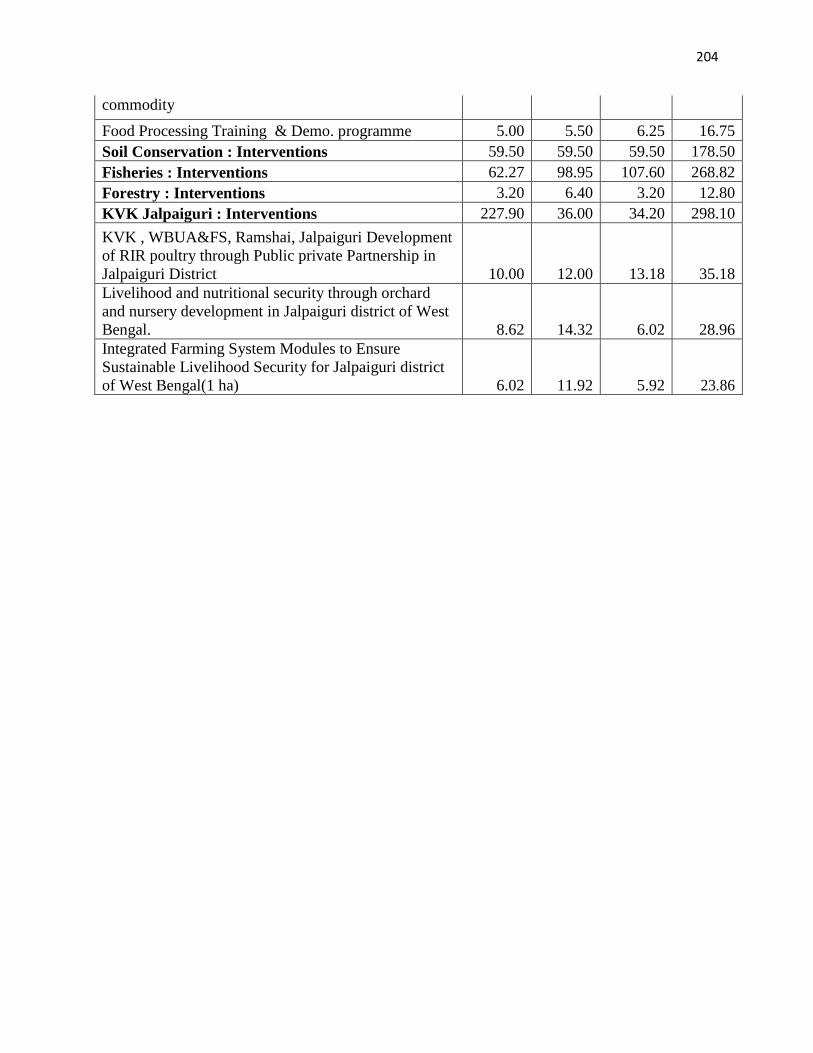
204
commodity
Food Processing Training & Demo. programme 5.00 5.50 6.25 16.75
Soil Conservation : Interventions 59.50 59.50 59.50 178.50
Fisheries : Interventions 62.27 98.95 107.60 268.82
Forestry : Interventions 3.20 6.40 3.20 12.80
KVK Jalpaiguri : Interventions 227.90 36.00 34.20 298.10
KVK , WBUA&FS, Ramshai, Jalpaiguri Development
of RIR poultry through Public private Partnership in
Jalpaiguri District 10.00 12.00 13.18 35.18
Livelihood and nutritional security through orchard
and nursery development in Jalpaiguri district of West
Bengal. 8.62 14.32 6.02 28.96
Integrated Farming System Modules to Ensure
Sustainable Livelihood Security for Jalpaiguri district
of West Bengal(1 ha) 6.02 11.92 5.92 23.86

205
11. District: Burdwan (Rs. in Lakh)
Interventions 2014-15 2015-16 2016-17 TOTAL
Agriculture
Reclamation and Development of acid soil 303.00 609.00 609.00 1521.00
Creation of Agriculture & Allied Training Facilities
for Farmers at block level 131.00 183.40 209.60 524.00
Farmers training in agril. And allied 361.02 486.66 1068.36 1916.04
production of organic input and formation of
organic groups 13.78 19.29 22.04 55.10
IPM Demonstrations 59.80 74.52 100.92 235.24
INM Demonstrations 53.82 56.44 80.38 190.64
Varietal Demonstration 444.00 543.00 585.00 1572.00
Farmers Field Schools 92.80 103.20 429.60 625.60
Schemes in production growth sector 107.50 3345.80 3402.80 6856.10
Infrastructure & Assets 50.50 1883.00 1261.50 3195.00
Innovative programmes 314.60 440.44 503.36 1258.40
New installation of irrigation facilities 1751.25 2451.75 2802.00 7005.00
Soil conservation plan : In situ moisture
conservation, dev. of wastelands, etc. 6.80 7.10 7.10 21.00
Water resource development 132.90 132.90 136.40 402.20
Infrastructure creation & maintenance 3.25 3.25 2.16 8.66
Training 1.00 1.00 1.00 3.00
KVK, BUD BUD
Establishment of bio-fertilizer lab for bulk
production of bio- fertilizer 3.30 41.90 4.60 49.80
Maintenance/modification of demonstration unit of
fruit 3.00 3.25 1.00 7.25
Developing of hatchery for hi- breathing Fish
(Deshi Magur) 6.20 0.30 0.30 6.80
Formulation and production of mineral mixture for
goat 1.20 5.30 3.00 9.50
Establishment of Plant–AnimalFish Health Clinic 15.10 5.70 - 20.80
Mushroom spawns production – cum - maintenance
lab 9.95 1.10 0.30 11.35
Establishment of Information technology Lab at
KVK and and Information Kiosk center in six
village - 29.37 13.27 62.64
Establishment of Home sc. lab. for preparation of
weaning food/ value added food product 8.70 0.70 0.20 9.60
Infrastructure for capacity building through training - 15.10 - 15.10
Assessment of paddy productivity through SRI
(kharif) under irrigated and medium upland
situation 7.00 4.60 0.60 12.20

206
Horticulture
NHM (Post harvest management) 12.50 15.00 20.00 47.50
Horticultural mechanization, 10 No. Tractor 30.00 36.00 45.00 111.00
15 No. Power Tiller 22.50 30.00 37.50 90.00
Protective cultivation unit 300.00 200.00 200.00 700.00
Demonstration of micro-irrigation system 100.00 100.00 100.00 300.00
Development of high value orchard 50.00 50.00 100.00 200.00
Construction of water harvesting structure in
western part of Burdwan 50.00 25.00 25.00 100.00
Animal Resource Development
Optimization of productive efficiency through
organization of Animal Health camp 243.44 - - 243.44
Bishes Go Sampad Bikash Avijan (Modified) 1257.77 - - 1257.77
Distribution of Inputs for improvement of
livelihood through Pig Farming. 24.00 - - 24.00
Distribution of for improvement of livelihood
through goat Farming 58.20 - - 58.20
Augmentation of meat production by intensive
sheep/goat production through adoption of good
husbandry practices 101.70 - - 101.70
Distribution of Chick/Duckling among Women
SHG. 162.36 - - 162.36
Centrally Sponsored rural backyard Poultry
Development 362.20 - - 362.20
Extension of Animal Health Care Services in
Remote areas of W. B through Mobile Veterinary
Clinic 21.87 - -- 21.87
Strengthening of bio-security practices in Govt.
Poultry Farms 15.00 - - 15.00
Assistance to State for Control of Animal Diseases
(ASCAD) 295.14 - - 295.14
Organization of Animal Health camp (24camp/
block) 37.20 40.92 44.64 122.76
Organization of Fertility Camp(4 camp/block) 12.40 13.64 14.88 40.92
Distribution of pig (3 sows/ beneficiary & 2 boar/)
among SHG members (16 SHG) 21.00 19.00 21.00 61.00
Distribution of goat (4 does/beneficiary & 2
bucks/group) among SHG 184.00 203.50 222.00 609.50
Assistance to goat rearers for renovation of shelter,
medicinal support and training.(500 beneficiaries
/block 82.50 87.50 100.00 270.00

207
Distribution of Chick/Duckling among Women
SHG (60 SHG/block) 122.76 135.78 144.80 403.34
Purchase of FAX and Photocopier(1 set/block) 8.00 8.00 - 16.00
Installation of public addressing system in all three
farms for training 1.00 1.00 1.00 3.00
Renovation of Rasulpur Fodder farm and
demonstrative goat farm 20.00 - - 20.00
Demonstrative Dairy Farm for farmers - 20.00 - 20.00
Setting up laboratory of the Veterinary polyclinic at
Fagupur, Burdwan 5.00 - 5.00 10.00
20 bed residential set up for farmers in all three
SPF/DCF 25.00 25.00 25.00 75.00
Feed plan 75.00 - - 75.00
Office of the DD, ARD including J.D. office
Burdwan division zone-III 300.00 100.00 - 400.00
Vety. Poly clinics and A.B.H. C 32.00 32.00 20.00 84.00
A.I. container 7.50 3.25 3.25 14.00
Fodder Kiosk/livestock Kiosk 64.00 12.00 - 76.00
Bulk cooler for milk collection 1.00 1.00 - 2.00
FISHERIES
Culture of indigenous small fish in backyard
ponds 30.00 33.00 45.00 108.00
Seed Mahotsav 10.00 15.00 20.00 45.00
Liberation of fish fingerlings in the ponds excavated
under MGNREGS 4.00 5.00 6.00 15.00
Scheme for intensive fish culture 331.20 368.00 404.80 1104.00
Scheme for production of fingerling of carps 34.50 37.95 41.40 113.85
Culture of magur in small ponds 2.93 3.29 3.66 9.88
Scheme for brooders management and production
of quality spawn of IMC 20.00 22.00 24.00 66.00
Culture of Monosex Tilapia 30.00 33.00 36.00 99.00
Rearing of indigenous small fish seed from wild
collection 10.00 11.00 12.00 33.00
Distribution of hygienic insulated box to fish
vendors 59.40 66.00 72.60 198.00
Distribution of bi-cycle with insulated box to fish
vendors 28.80 32.00 35.20 96.00
Distribution of matsyajan 35.00 37.50 40.00 112.50
Construction and commissioning of block lab. cum
trg. center. 43.20 72.00 36.00 151.20
Soil and water testing kits 70.00 80.00 80.00 230.00
Infrastructure for oxygen packing of fish seed 9.30 9.30 9.30 27.90

208
Fish seed carrying vehicle. 30.00 15.00 20.00 65.00
SERICULTURE
Egg Supply 30.00 30.00 30.00 90.00
Transportation 10.00 10.00 10.00 30.00
Supply of kit to the farmers 20.00 20.00 20.00 60.00
Cocoon purchase from the farmers 80.00 80.00 80.00 240.00
Purchase of Cocoon collection van 120.00 120.00 120.00 360.00
Cocoon storing unit in the collection 500.00 500.00 500.00 1500.00
AGRI-MARKETING
Processing & Preservation of Fruits & Vegetables-
001 2.00 2.00 2.00 6.00
Farmer's Training in Post-Harvest Technology-003 2.00 2.00 2.00 6.00
Construction and Improvement of Storage
Structure-800 50.00 50.00 50.00 150.00
Development of farm to Market Link Roads 50.00 50.00 50.00 150.00
Development of Rural and Primary Markets 50.00 50.00 50.00 150.00
Development of Regulated Markets 100.00 100.00 100.00 300.00
Export Promotion of flower 8.00 8.00 8.00 24.00
Training and Marketing Officials & Others 5.00 5.00 5.00 15.00
Introduction of Pledge Finance 4.00 4.00 4.00 12.00
Agril. Marketing Information& Exhibition 15.00 15.00 15.00 45.00
Annual Macro Management Mode Work Plan 1.00 1.00 1.00 3.00
Scheme for Strengthening & Supervision of Cold
Storages 6.00 6.00 6.00 18.00
COOPERATION
Programmes under RKVY Scheme for Co-operative
Societies from Burdwan –I Range 423.50 353.50 247.00 1024.00
Schemes/Programmes of cooperation dept.
Raina - 1 15.50 20.50 7.50 43.50
Burdwan - II 87.50 109.50 43.00 240.00
Burdwan - I 31.50 40.00 25.00 96.50
Galsi - II 9.00 1.50 1.50 12.00
Ausgram - II 28.00 23.50 6.50 58.00
Bhatar 76.50 54.00 41.50 172.00
Ausgram - I 9.00 16.50 16.50 42.00
Khandkosh 17.50 17.50 7.50 42.50
Memori - II 86.00 18.00 12.00 116.00
Memori - I 74.00 86.50 56.50 217.00
Water Resource Investigation and Development Department
Fund reqd. for proposed activities 533.00 1019.00 1179.00 2731.00
CADC, Kalna
Schemes of coop dept. Mem. II 81.00 83.52 91.80 256.32

209
12. District: Murshidabad (Rs. in Lakh)
Interventions 2014-15 2015-16 2016-17 TOTAL
Agriculture
Production of foundation and Certified Seeds in
Govt. Farm 3.00 3.30 3.50 9.80
Hybrid Maize Seed Production by WBSSC,
CADC,KVK & Private Seed Producer with subsidy
@ Rs. 50/- per Kg 2.50 3.00 3.50 9.00
Production of foundation and Certified Seeds of
cereals, oilseeds, pulses for varieties released within
10 years by WBSSC, CADC, KVK & Private Seed
Producer with Subsidy @ Rs. 10/-per Kg 20.00 22.00 24.00 66.00
Jute Seed Production by top cutting/ normal Method
by farmers with subsidy @ Rs. 50/-per Kg. 0.50 0.60 0.70 1.80
Seed Village Programme (100% Subsidy) 40
farmers/Unit 30.00 45.00 45.00 120.00
Capacity Building Training of 50 farmers on Seed
Preservation 5.20 5.20 5.20 15.60
Subsidy sale of Seeds to farmers HYV Certified @
20/- per kg 5.20 6.00 7.00 18.20
Conservation of Local Variety Seeds in
SARF/Model Farm/BSF 0.40 0.40 0.50 1.30
Supply of Booklet /Printing on Seed Production
Technique 20.00 20.00 20.00 60.00
SOIL HEALTH MANAGEMENT
Application of Soil ameliorant 45.00 45.00 45.00 135.00
Green Manuring D/C (0.4 ha) 12.50 25.00 37.50 75.00
Application of Bio-fertiliser (1 bigha) 13.00 13.00 13.00 39.00
Preparation of Vermicompost by SKUS,NGO,
Farmers Club 10.00 15.00 20.00 45.00
Preparation of Kutcha compost by individual farmer 13.00 26.00 26.00 65.00
Preparation of Vermicompost by individual farmer 15.00 15.00 15.00 45.00
INM D/C (1 bigha) 26.00 26.00 26.00 78.00
Capacity building training on INM atDistrict level 1.25 1.25 1.25 3.75
Capacity building training on INM at Subdivision
Level 4.00 4.00 4.00 12.00
Capacity building training on INM at block level 13.00 13.00 13.00 39.00
Supply of Booklet / Printing on INM techniques 5.00 7.50 10.00 22.50
CROP DEMONSTRATION
DC on SRI in Boro 5.00 7.50 10.00 22.50
DC on Zero Tillage on Wheat 1.50 2.50 3.50 7.50

210
DC on Improved practices on Pulse Production 10.00 15.00 20.00 45.00
DC on Improved practices on Oilseeds Production 15.00 20.00 25.00 60.00
0.5 ha DC on Improved practices on Sugarcane
Production 10.00 20.00 20.00 50.00
DC on Improved practices on jute production 3.00 4.00 5.00 12.00
DC on Improved practices on Maize Production 2.60 5.00 5.00 12.60
DC on Improved practices on 2.50 2.50 2.50 7.50
Hybrid Production
Capacity building training
at District / Subdivision/Block level 10.00 10.00 10.00 30.00
Documentation & Printing of Leaflet / Supply of
Booklets 5.00 5.00 5.00 15.00
FARM MECHANISATION
Subsidy Sale of Implement (50% subsidy)
i) Power Tiller @ 0.60 Lakh 60.00 75.00 90.00 225.00
ii) Power reaper @ 0.40 lakh 16.00 24.00 32.00 72.00
iii) Tractor 35-40 HP @ 1.5 lakh 45.00 60.00 75.00 180.00
iv) Zero Tillage Machine @ 0.40 lakh 1.20 3.20 4.80 9.20
Distribution of Small Implements in Subsidy
i) Pumpset (electric/diesel) @ 0.1 50.00 75.00 100.00 225.00
ii) Sprayer @ 0.01 10.00 15.00 20.00 45.00
iii)Foor Sprayer @ 0.2 10.00 15.00 20.00 45.00
iv) Cono Weeder for SRI @ 0.1 20.00 25.00 30.00 75.00
v)Marker for SRI @ 0.005 2.50 3.50 4.50 10.50
vi) Paddle Thrasher fitted (6ft
Drum) with motor (2HP) @ 0.15 30.00 37.50 45.00 112.50
Distribution of implements to implement hub as
Custom hiring Centres 125.00 125.00 125.00 375.00
PLANT PROTECTION
Farmers' Field School for 6 weeks 6.50 6.50 6.50 19.50
Organic farming DC (0.4 ha) @ 0.03 7.80 7.80 7.80 23.40
Seed Treatment Campaign with50 farmers 26.00 52.00 52.00 130.00
Bio-Village @ 1.00 26.00 26.00 26.00 78.00
Training on IPM for farmers at District /
Subdivision level 9.00 9.00 9.00 27.00
Distribution of Seed Treating Chemicals @0.001
per ha 5.00 10.00 15.00 30.00
Printing of Literature on IPM / Organic Farming /
Seed Treatment 5.00 5.00 5.00 15.00
Infrastructural Development In farm
i) Construction of Modern scientific godown 30.00 30.00 30.00 90.00
ii) Construction of Covered Treshing Floor 20.00 20.00 20.00 60.00
iii) Construction of Implements Shed 10.00 10.00 10.00 30.00

211
iv) Construction of Boundary Wall 100.00 100.00 100.00 300.00
v) Installation of already supplied Seed Processing
unit 60.00 0.00 0.00 60.00
vi) Construction of Farmers' Training Hall
&Maintenance 780.00 5.00 5.00 790.00
Modernisation of Block/subdivision/ 62.00 62.00 62.00 186.00
District Agril office
Capacity building & extension service 218.80 119.50 127.00 465.30
Contingent Plan for Seed Kit Distribution
/assistance for jute retting etc. during natural
calamity 25.00 30.00 35.00 90.00
Up gradation of Soil Testing Laboratory, Fertilizer
Testing Laboratory & Micro-nutrient Trials 20.00 20.00 20.00 60.00
Up gradation of Pulses & Oilseeds Research Station
& Research activities 20.00 25.00 30.00 75.00
Horticulture
Demonstration centre of Exotic Vegetable crops 5.00 6.25 7.50 18.75
Demonstration centre of Gravitational Drip
irrigation system in veg. crops 3.50 7.00 10.50 21.00
Area expansion of minor fruit crops 12.50 18.75 25.00 56.25
Seed production of onion crops 3.75 7.50 15.00 26.25
Seed production of elephant foot 42.00 42.00 42.00 126.00
Mushroom Spawn productionLaboratory 12.30 - - 12.30
Infrastructure Development of rural 96.50 99.50 105.50 301.50
huts for Horticulture crops
Development of fruit and vegetable 180.00 216.00 262.00 658.00
processing units
Onion storage of 1500 MT capacity 197.57 217.33 239.00 653.90
Horticulture Mechanization(Distribution of Mango
harvestor 13.50 27.00 27.00 67.50
Development of Multipurpose cold storage of 30
MT capacity for preservation of fruits and
vegetables 50.00 55.00 60.50 165.50
Technology dissemination centre at sub divisional
level of Murshidabad District 45.00 45.00 45.00
Agri-Marketing
Construction of cold storages 100.00 100.00 100.00 300.00
Construction of Conditional Godowns (Av.
Capacity : 500 MT) 100.00 150.00 150.00 400.00
Construction of rural godowns (Av. Capacity : 500
MT) 300.00 450.00 525.00 1275.00
Jute Grading Training Camp 52.00 80.00 100.00 232.00
Small Market Yard for Rural Farmers 35.00 52.50 70.00 157.50
Traditional Storage Structures 22.50 23.00 23.50 69.00
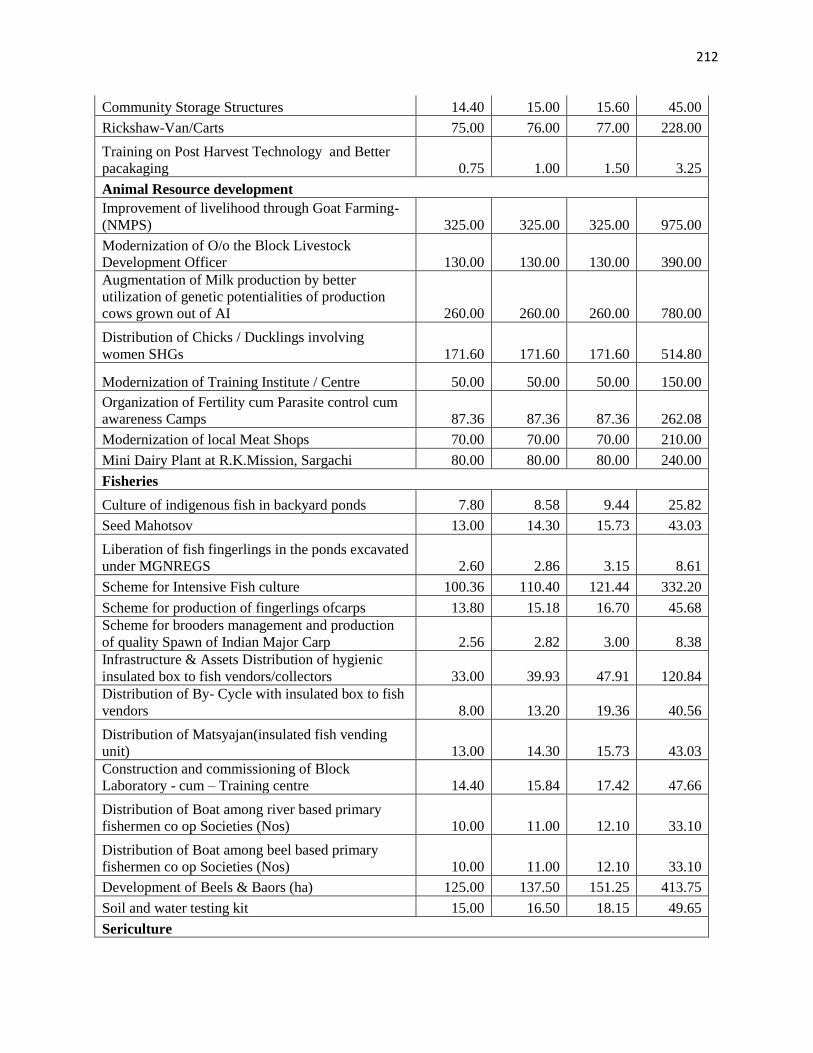
212
Community Storage Structures 14.40 15.00 15.60 45.00
Rickshaw-Van/Carts 75.00 76.00 77.00 228.00
Training on Post Harvest Technology and Better
pacakaging 0.75 1.00 1.50 3.25
Animal Resource development
Improvement of livelihood through Goat Farming-
(NMPS) 325.00 325.00 325.00 975.00
Modernization of O/o the Block Livestock
Development Officer 130.00 130.00 130.00 390.00
Augmentation of Milk production by better
utilization of genetic potentialities of production
cows grown out of AI 260.00 260.00 260.00 780.00
Distribution of Chicks / Ducklings involving
women SHGs 171.60 171.60 171.60 514.80
Modernization of Training Institute / Centre 50.00 50.00 50.00 150.00
Organization of Fertility cum Parasite control cum
awareness Camps 87.36 87.36 87.36 262.08
Modernization of local Meat Shops 70.00 70.00 70.00 210.00
Mini Dairy Plant at R.K.Mission, Sargachi 80.00 80.00 80.00 240.00
Fisheries
Culture of indigenous fish in backyard ponds 7.80 8.58 9.44 25.82
Seed Mahotsov 13.00 14.30 15.73 43.03
Liberation of fish fingerlings in the ponds excavated
under MGNREGS 2.60 2.86 3.15 8.61
Scheme for Intensive Fish culture 100.36 110.40 121.44 332.20
Scheme for production of fingerlings ofcarps 13.80 15.18 16.70 45.68
Scheme for brooders management and production
of quality Spawn of Indian Major Carp 2.56 2.82 3.00 8.38
Infrastructure & Assets Distribution of hygienic
insulated box to fish vendors/collectors 33.00 39.93 47.91 120.84
Distribution of By- Cycle with insulated box to fish
vendors 8.00 13.20 19.36 40.56
Distribution of Matsyajan(insulated fish vending
unit) 13.00 14.30 15.73 43.03
Construction and commissioning of Block
Laboratory - cum – Training centre 14.40 15.84 17.42 47.66
Distribution of Boat among river based primary
fishermen co op Societies (Nos) 10.00 11.00 12.10 33.10
Distribution of Boat among beel based primary
fishermen co op Societies (Nos) 10.00 11.00 12.10 33.10
Development of Beels & Baors (ha) 125.00 137.50 151.25 413.75
Soil and water testing kit 15.00 16.50 18.15 49.65
Sericulture

213
Restructuring of Govt. Granages 30.00 30.00 30.00 90.00
Development of Rearing facilities at Govt. farmers 60.00 30.00 30.00 120.00
Assistance to farmers for installation of Irrigation
system 35.00 30.00 25.00 90.00
Construction of internal pathway at Govt. farms 7.50 2.50 2.50 12.50
Construction of scientific Godown at govt. Farms 30.00 10.00 10.00 50.00
Deployment of Reource person(Resham Bandhu)
for transfer of technology 6.50 12.50 12.50 31.50
Conversion of existing plantation through
replacement with widely spaced HYV saplings 15.00 10.00 7.50 32.50
Chain Lock Fencing along with Planting of Hedge
Plants around the Perimeters Of Govt. Farms 1.26 12.60 25.20 39.06
Cooperation Dept
Construction of storage Godown 96.00 88.00 128.00 312.00
GodownRenovation/repairing of existing 42.00 36.00 45.00 123.00
Working shed for SHG 20.00 24.00 28.00 72.00
Vermi Compost unit - 4.00 2.00 6.00
Development of Jute Baling unit - 4.00 2.00 6.00
Development of LAMPS 3.00 - - 3.00
Development of PAMS 12.00 8.00 8.00 28.00
Seed Multi-plication Unit 15.00 15.00 15.00 45.00
Development of Rural Haat - 40.00 40.00 80.00
Dev. of Agril. Produce Business Centre 32.00 32.00 48.00 112.00
Training Centre for SHG 24.00 18.00 12.00 54.00
Development of PACS 21.00 18.00 24.00 63.00
Unit Development of Agro. Processing - 5.00 5.00 10.00
Development of Pry. Cons Co-op. 8.00 4.00 8.00 20.00
Self Service counter - 4.00 8.00 12.00
Soil Testing Laboratory 30.00 30.00 60.00
Fruit Processing Unit 18.00 18.00 36.00
Training 16.00 24.00 16.00 56.00
Bhagirathi cooperative milk producers’ union
limited - - - 585.12
WBCADC
Modernisaton of already established two numbers
of "Ghungru Pig" farm at Bhabki Mahisedanga &
Gura 14.05 14.05 - 28.10
Distribution of Piglets to the Tribal SHG 5.63 6.25 6.88 18.75
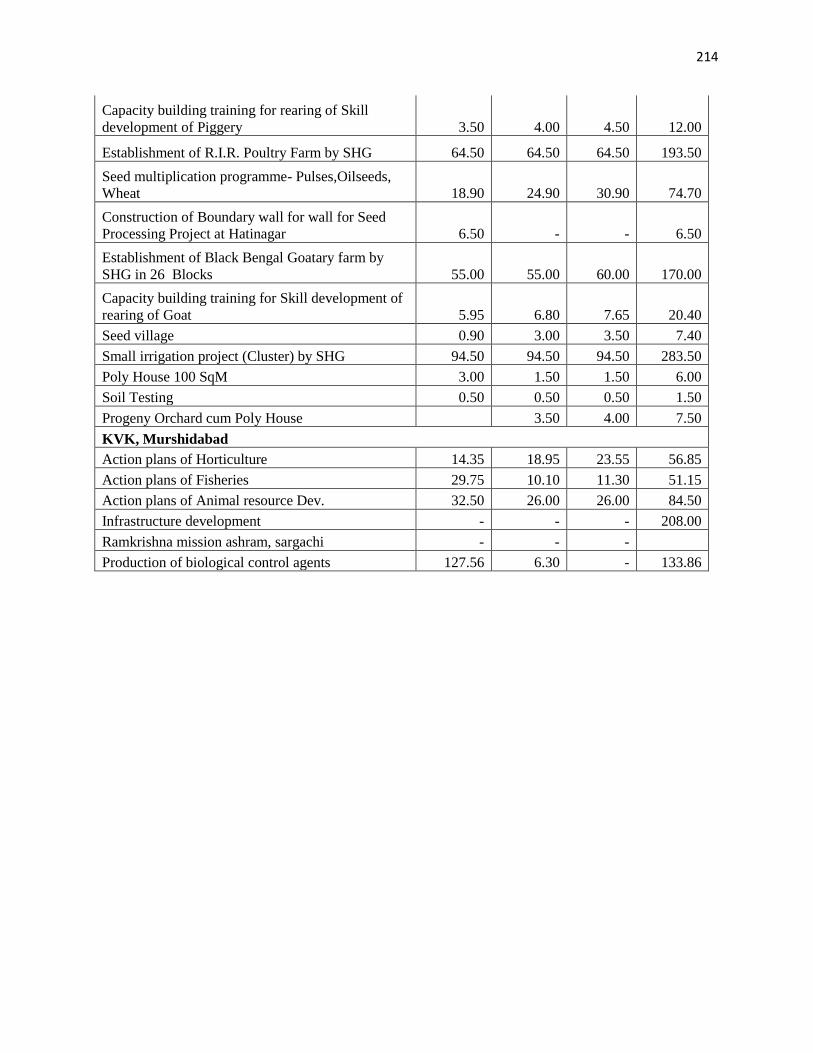
214
Capacity building training for rearing of Skill
development of Piggery 3.50 4.00 4.50 12.00
Establishment of R.I.R. Poultry Farm by SHG 64.50 64.50 64.50 193.50
Seed multiplication programme- Pulses,Oilseeds,
Wheat 18.90 24.90 30.90 74.70
Construction of Boundary wall for wall for Seed
Processing Project at Hatinagar 6.50 - - 6.50
Establishment of Black Bengal Goatary farm by
SHG in 26 Blocks 55.00 55.00 60.00 170.00
Capacity building training for Skill development of
rearing of Goat 5.95 6.80 7.65 20.40
Seed village 0.90 3.00 3.50 7.40
Small irrigation project (Cluster) by SHG 94.50 94.50 94.50 283.50
Poly House 100 SqM 3.00 1.50 1.50 6.00
Soil Testing 0.50 0.50 0.50 1.50
Progeny Orchard cum Poly House 3.50 4.00 7.50
KVK, Murshidabad
Action plans of Horticulture 14.35 18.95 23.55 56.85
Action plans of Fisheries 29.75 10.10 11.30 51.15
Action plans of Animal resource Dev. 32.50 26.00 26.00 84.50
Infrastructure development - - - 208.00
Ramkrishna mission ashram, sargachi - - -
Production of biological control agents 127.56 6.30 - 133.86

215
13. District: Darjeeling (Rs. in Lakh)
Interventions 2014-15 2015-16 2016-17 TOTAL
Agriculture
Soil health management 60.96 60.96 60.48 182.40
Interventions in production of food crops
a. Potato 42.28 42.28 40.04 124.60
b. Cereals (Rice , Wheat, Maize) 57.66 57.66 57.66 172.98
c. Pulses 17.96 17.96 17.96 53.88
d. Oilseeds 8.96 8.96 8.96 26.88
e. Millets 3046.00 30.45 30.45 3106.90
Proposal for Ginger development 8.68 8.68 8.68 26.04
Cardamom development in Govt. farms 14.49 14.49 14.49 43.47
Infrastructure development of Agril. Farms 1208.27 - - 1208.27
Proposal for agriculture mechanization 42.80 42.80 42.80 128.40
Soil conservation measures in Darjeeling Hills 419.84 744.80 771.21 1935.85
Shiliguri subdivision
Yield Gap Analysis and strategies to build the gap 130.75 158.70 185.40 474.85
Soil Health Issues 55.53 95.68 146.33 297.54
Infrastructural Gaps and requirements 43.60 4.00 4.50 52.10
Input planning 14.80 26.30 38.50 79.60
Farm Mechanization 68.25 106.02 144.25 318.52
Credit linkage 3.90 5.70 7.50 17.10
Crop insurance 40.00 60.00 100.00 200.00
Research/Extension/Adoption gap and ways to minimise 4.60 4.85 5.10 14.55
Packaging, marketing of post harvest products 2.00 3.00 5.00 10.00
Possibility of generating additional income from other
allied sector-Organic cultivation and marketing 4.00 6.00 8.00 18.00
Fund management – Contractual manpower 3.60 3.60 3.60 10.80
Animal Resource Development
Distribution of inputs for improvement of livelihood
through pig farming in hill region of Darjeeling. 26.77 26.77 26.77 53.54
Optimization of productive efficiency through
organization of animal health camp (parasite control, ppr
control, fertility management and ranikhet disease control
at farmers’ door step. 20.80 20.80 20.80 62.40
Augmentation of meat production by intensive sheep /
goat rearing through adoption of good husbandry practices 224.00 - - 224.00
Genetic upgradation of goat involving self help groups in
the hilly region of Darjeeling 41.06 - - 41.06

216
Rural backyard poultry development scheme for socio-
economic growth of rural people in the hill region of
Darjeeling 82.00 82.00 82.00 246.00
Women empowerment through dairy farming in
Darjeeling district 27.12 27.12 27.12 81.36
Project proposal for introduction of jamnapari goat in the
hill region of Darjeeling. 4.90 - - 4.90
Establishment of residential training institute (2) for
organising training programme under ARD department,
GTA, Darjeeling. 508.37 - - 508.37
Augmentation of human resources through training of
farmers in livestock oriented activities. 29.52 - - 29.52
Project proposal for exposer visit of livestock extension
facilitator under national livestock mission 3.60 - - 3.60
Project proposal for exposer visit of farmers under
national livestock mission for skill development,
technology transfer and extension 64.80 - - 64.80
Conservation of germplasm of threatened indigenous breed of livestock’ (siri breed) including livelihood
support schemes.
a) Conservation of siri cattle as indigenous breed 97.47 7.03 7.03 111.53
b) Livelihood support 1151.43 - - 1151.43
ARD Schemes in Shiliguri Subdivision 1980.00 1980.00 1980.00 5940.00
Sericulture
Government Farm Oriented Schemes 378.55 - - 378.55
Beneficiary oriented schemes 156.55 - - 156.55
KVK, UBKV, Kalimpong
Fencing of land areas under Darjeeling krishi vigyan
kendra to escape from encroachment 5.40 7.56 8.64 21.60
Establishment of machinery hub for farm mechanisation
for the farmers of Darjeeling hills 2.93 4.11 4.69 11.73
Infrastructure development for white button and oyster
mushroom cultivation 8.50 11.90 13.60 34.00
Infrastructure development for rain water harvesting 4.75 6.65 7.60 19.00
Infrastructure development for hampshire pig breeding
programme at hill areas of Darjeeling district 10.25 14.34 16.39 40.98
Development of a self learning ict tool on animal health
management 7.88 11.03 12.60 31.50
Infrastructure development for black bengal goat breeding
programme at hill areas of Darjeeling district 3.03 4.24 4.84 12.11
Establishment of plant germplasm unit 6.75 9.45 10.80 27.00
Infrastructure development for plant health clinic 4.49 6.29 7.18 17.96

217
Infrastructure development for bio fertilizer production
unit 4.50 6.30 7.20 18.00
Establishment of demonstration unit on semi high tech
plastic house cultivation 9.20 12.88 14.72 36.81
Quality planting material production of Darjeeling
mandarin, ginger and large cardamom 9.36 13.10 14.97 37.43
Strengthening of soil testing laboratory in Darjeeling hills 6.38 8.93 10.20 25.50
Farm women empowerment 5.00 7.00 8.00 20.00
RRS, UBKV, Kalimpong
Infrastructure development of Regional Research Station,
Kalimpong and Regional Research Sub- Station, Pedong. 143.04 200.25 228.86 572.15
Management of citrus decline in Darjeeling Mandarin – A
step to revive the mandarin industry. 30.00 4.76 4.76 39.52
Establishment of model nursery for fast multiplication of
elite clones and new varieties of pear, peach, plum,
strawberry and kiwi. 27.00 11.18 11.18 49.36
Modernization of plant diseases and insect-pests
diagnostic service centre 27.00 1.00 1.00 29.00
Strengthening seed distribution system through seed
village programme & establishment of seed processing
unit 44.79 1.95 1.95 48.69
Production of Bio-Agent based bio-formulations: eco-
friendly pest management and livelihood expansion in
Darjeeling Himalayas 13.00 3.00 3.00 19.00
Project proposal for vermicompost production unit 9.61 6.81 7.01 23.43
Establishment of Bee nurseries and Training centre 14.68 3.19 2.99 20.86
Strengthening Farm Media Centre (FMC) for
dissemination of farm worthy technologies using ICT
tools. 10.00 5.00 0.10 15.10
Production of planting materials of gerbera (Gerbera
jamesonii bolus ex. Hooker f..), under cover and post-
harvest management practices in the Darjeeling hills of
West Bengal 16.93 11.33 11.63 39.89
Strengthening of tissue culture laboratory for production
of tissue cultured plantlets of cardamom and ginger for
the farmers of Darjeeling hills 27.00 1.50 1.50 30.00
Production of elite, disease free nucllear Seedling in
Mandarin through In -Vitro culture 34.86 10.00 10.00 54.86
Improved rice production technology for resource
conservation and climate resilience 5.00 5.00 7.00 17.00
Ongoing projects at RRS(HZ), Kalimpong and RRSs,
Pedong 50.94 50.94 50.94 152.82

218
Horticulture
Integrated Development of Vegetable 30.30 30.30 30.30 90.90
Fruits-Peach , Plum, Pear & Kiwi 30.30 30.30 30.30 90.90
Orchid /Anthurium (Kurseong) Tubular Structure 124.43 124.43 124.43 373.29
Orchid /Anthurium (Mirik) Tubular Structure 711.04 711.04 711.04 2133.12
Hi-tech Green House Orchid/Anthurium (Kalimpong) 84.84 84.84 84.84
Cultivation of Mushroom 303.00 303.00 303.00 909.00
Agri-Marketing
Milk collection centre 50.00 70.00 80.00 200.00
Processing & Preservation of Fruits &Vegetablescentres 50.00 70.00 80.00 200.00
Construction & Improvement of Storage Structure 100.00 140.00 160.00 400.00
Development of Markets 37.50 52.50 60.00 150.00
Dev. of Rural & Pry. Markets 100.00 140.00 160.00 400.00
Dev. of Regulated Markets 100.00 140.00 160.00 400.00
Export promotion 20.00 28.00 32.00 80.00
Training of Marketing Officials & Others 10.00 14.00 16.00 40.00
Agril. Marketing Information & Exhibition 12.50 17.50 20.00 50.00
Scheme for Strengthening &construction and Supervision
of cold storage 56.25 78.75 90.00 225.00
Kalimpong Unit 1.00 1.40 1.60 4.00
Fisheries
Distribution of fish seeds for jhora Fishery Scheme in 8
blocks of Darjeeling 30.00 30.00 33.00 93.00
Distribution of fishery requisites for jhora fishery
beneficiaries i.e. nylon dragnets and aluminium hundi 15.00 15.75 16.50 47.25
Distribution of floating fish feed @100kg/unit 8.00 8.40 8.80 25.20
Distribution of hygienic insulated box to fish vendors 4.95 5.10 5.25 15.30
Imparting block level training on inland fish farming for 5
days in 8 blocks 2.88 2.88 3.20 8.96
Imparting district level training on inland fish farming for
5 days in 8 blocks 1.44 1.60 1.60 4.64
Awareness programme for modern scientific approach &
environment. 1.60 1.60 2.00 5.20
Construction and commissioning of block level laboratory
& training centre. 10.00 15.00 18.00 43.00
Agri-Irrigation
Pre fabricated water harvesting farm ponds with LDPE
geomembrane lining under Darjeeling division within
GTA hill areas, Darjeeling 56.25 78.75 90.00 225.00
Cultivation of Cinchona 223.44 312.82 357.51 893.77
Cultivation of Ipecac 70.70 98.98 113.12 282.80

219
Cultivation of Rubber 108.35 151.69 173.36 433.41
Cultivation of Chirata 4.67 6.54 7.48 18.69
Commercial Cultivation of Other Medicinal Plants 70.00 140.00 80.00 290.00
Cultivation of Mushroom 32.22 45.11 51.56 128.89
Infrastructure development (Construction of new Office
building) 48.70 68.18 77.92 194.81
Construction of Aromatic Plants extraction unit. 6.00 8.40 9.60 24.00
WBCADC
Schemes for Kalimpong - 56.50 59.90 116.40
Schemes for Shiliguri-Naxalbari 97.50 84.80 95.70 278.00
Cooperation
Construction of rural storage godown cum office 30.00 35.00 40.00 105.00

220
14. District: Howrah (Rs. in Lakh)
Interventions 2014-15 2015-16 2016-17 TOTAL
Agriculture
Farm Mechanization 204.00 196.00 165.00 565.00
Soil Health Management 54.00 65.50 78.00 197.50
Farmers’ training cum awareness 10.80 10.80 10.80 32.40
Crop diversification 17.00 14.00 17.00 48.00
Strengthening of Seed Farm & Production of Quality
Seed 445.00 106.00 37.00 588.00
Human Resource Development; Training of farmers
& Agril. officials 18.50 22.30 20.00 60.80
Plant Protection and ITK application 14.50 16.50 19.50 50.50
IT Development / Application in Agriculture 10.00 7.00 7.00 24.00
Training Centre at each Block attached with
Assistant D.A. blocks 160.00 160.00 160.00 480.00
Seed Festival 2.00 - - 2.00
Crop Museum at SARF ULUBERIA - 20.00 - 20.00
Contigency planning to combat natural calamities in
agril. sector ( Distribution of seedkits of various
crops including fertilizers, biofertilizers and
pesticides) 25.00 25.00 25.00 75.00
Contingent Expenditure (Miscellaneous
Expenses) Expenditure for Hiring of Vehicle , Rent
of Go down, Contractual payment of watch man and
other miscellaneous contingencies. 30.00 30.00 30.00 90.00
Soil health management : establishment of soil
testing laboratory, its strengthening and other soil
test related activities 24.30 100.80 23.80 148.90
Horticulture
Area Expansion of Vegetables 20.00 24.00 30.00 74.00
Protected Cultivation 23.40 21.02 29.38 73.80
Organic Cultivation 15.70 18.20 19.00 52.90
Horticulture Mechanization 0.00 4.80 6.00 10.80
Human Resource Development 3.00 3.60 4.50 11.10
Vegetable Seedling Production under PolyHouse at
KVK, Howrah – 200 Sq. m. - 0.20 - 0.20
Maintenance of progeny orchard at KVK, Howrah - - 0.50 0.50
Demonstration on off season vegetable cultivation
under shade net/ poly house of 200 Sq. mt. area in
three season at KVK,Howrah - - 0.63 0.63
Model nurseries (Hitech small) Public sector (1 ha.)
at KVK,Howrah. 2.25 3.15 3.60 9.00
Development of Bio-control laboratory 54.00 54.00

221
Leaf/tissue analysis laboratory 15.00 15.00
Pack house 4.80 4.80
RKVY Special Schemes
Area Expansion of Vegetable (For Max. area of 2
ha. Per beneficiary) - Hybrid 20.00 - - 20.00
Promotion of INM/IPM 1.20 - - 1.20
Organic Farming
Vermi compost Units Permanent Structure of
(30’×8’×2.5’) 12.50 - - 12.50
Training of Farmers within State (one day’s) 3.00 - - 3.00
Social Forestry
Garchumuk Deer Park-Civil Work 61.70 - - 61.70
Creation of distribution seeding nursery in three
places - 6.00 6.00 12.00
Raising high yielding Coconut seeding in three
places - 11.16 11.16 22.32
Protection and improvement of Wilding and
rescuing, tranquilizing - 5.34 5.34 10.68
Water Resourses Investigation & Development Department
District Plan and proposed schemes under RKVY 1195.00 1810.00 650.00 3655.00
Agri mechanical department
District Plan and proposed schemes under RKVY 111.54 156.16 178.46 446.16
Animal Resource Development
Optimization of productive efficiency through
organization of Animal Health Camp 28.74 28.74 28.74 86.22
Heifer Rearing Programme: 10 unit per Block 70.00 77.00 84.70 231.70
Fodder Demonstration Plot: 10 Plot / Block 2.80 2.80 2.80 8.40
Goat Rearing: 10 unit per Block 18.20 18.20 18.20 54.60
Distribution of Breeding Buck( Black Bengal): 20
unit per Block 14.00 14.00 14.00 42.00
Chicks ( RIR) Distribution: 300 unit / Block 27.72 27.72 27.72 83.16
Organisation of Animal Health Camp/ Awareness
Camp : 5.88 5.88 5.88 17.64
Fisheries Department
Scheme for Intensive Fish culture 110.40 184.00 220.80 515.20
Scheme for production of fingerlings of Carps 9.20 11.50 11.50 32.20
Infrastructure & Assets
Distribution of hygienic insulated box to fish
vendors/collectors 33.00 33.00 33.00 99.00
Distribution of By-Cycle with insulated box to fish
vendors 11.20 12.00 12.80 36.00
Distribution of Matsyajan (insulated fish vending
unit) 25.00 25.00 25.00 75.00

222
Construction and commissioning of Block
Laboratory - cum - Training centre 14.40 36.00 43.20 93.60
Cooperation Department
Proposed schemes of Coop. Dept. 1537.50 1668.11 1926.86 5132.47
Agri-Marketing Department
Workshop-cum-Training Programme in preservation
/processing of Fruits & vegetables and Marketing 4.15 8.30 12.45 24.90
Processing machine-equipments and printing of
leaflets 2.00 3.00 5.00 10.00
Scheme : amar fasal amar gola, amar fasal amar gari 129.10 143.40 166.15 438.65
WBCADC
Establishment of Progeny Goat with supply of Blakc
variety Goat and suplimentary feed with shed. 8.50 4.50 5.40 18.40
Establishment of Projeny Orchard with 100sqm.
Poly House with Sprinkler & Deep Irrigation. 10.10 6.00 4.80 20.90
Rain Water Harvesting by Ex. Land & Micro
Irrigation 2.30 4.00 5.00 11.30
Demonstration on Seed Health Management. 0.30 0.40 0.50 1.20
Skilled Development Training 1.70 1.50 1.80 5.00
120MT capacity godown with threasing floor. 12.15 - - 12.15
Soil sample testing for amendmend of soil health 0.15 0.20 0.30 0.65
Establishment of Poultry Farm 1.00 - - 1.00
Establishment of A.H Programme 1.20 - - 1.20
Formation of Seed Village 1.2 0 1.80 1.50 3.30
Establishment of Poultry Unit 11.00 6.00 6.00 23.00
Establishment of Mashroom Production Unit 2.50 - - 2.50
Paddy Seed Certification Programme 14.00 18.00 20.00 52.00
KVK, Howrah, Jagatballavpur
Improvement of the Farm Machinaries 13.50 - - 13.50
Improvement of existing training infrastructure 0.94 0.92 - 1.86
Study tour for farmers 0.20 0.20 0.20 0.60
Construction of Farm road 25.00 - - 25.00
Publication related to IPM 1.00 - - 1.00
Establishment of Duck unit - 4.16 0.61 4.77
Renovation of poultry + goatery units - 1.25 1.25
Improvement of existing Soil & Water Analysis
laboratory - 0.46 40.00 40.46
Vermicompost Unit - 5.00 5.00

223
15. District: North 24 Parganas (Rs. in Lakh)
Interventions 2014-15 2015-16 2016-17 TOTAL
Agriculture
Farm mechanization 112.20 112.90 125.10 350.20
Enhancement of soil fertility 16.80 18.55 20.30 55.65
Plant protection 17.90 20.70 23.50 62.10
Training 8.20 8.95 9.70 26.85
Seed village with certification program 14.30 14.90 14.90 44.10
New Intervention 7.55 8.70 11.00 27.25
RKVY Schemes : Farm Mechanization 10.00 17.00 10.00 37.00
Setting up STL at KVK, Asoknagar 50.00 5.00 3.00 58.00
Infrastr. for capacity building 35.00 65.00 70.00 170.00
Seed processing unit 20.00 - - 20.00
Horticulture
Area Expansion of Ber (high Density Planting) 20.00 - - 20.00
Productivity Improvement by providing Assistance for
Plant Protechtion Equipments – Foot Sprayer 4.00 - - 4.00
Vegetable Seed Production Centre Cum Processing
Unit for Small & Marginal farmers of Disaster prone
area of North 24 Parganas 2.50 - - 2.50
Demonstration of High value Veg. and Medicinal
Plants 1.25 1.25 1.25 3.75
Area Expansion of (non- conventional) Vegetables
(Broccoli/Red Cabbage/ Capsicum) 6.75 6.75 6.75 20.25
Area Expansion of Minor Fruits 4.00 - - 4.00
Hybrid Vegetable Cultivation - - 20.00 20.00
RKVY Schemes - 0.30 0.90 1.20
Animal Resource Development
Cattle &Buffalo Development 267.30 514.20 514.20 1295.70
Sheep & goat Development 65.00 130.00 130.00 325.00
Pig Development 18.00 45.00 45.00 108.00
Poultry Development 137.70 259.12 259.12 655.94
Capacity Building 21.00 25.20 25.20 71.40
Infrastructure development 60.00 146.00 116.00 322.00
Comprehensive Area Development - 300.00 300.00 600.00
Fisheries Department
Culture of indigenous fish in backyard ponds 8.40 21.60 30.00
Seed Mahotsov 7.50 7.50
Liberation of fish fingerlings in the ponds excavated
under MGNREGS 4.00 4.00
Scheme for Intensive Fish culture 368.00 368.00

224
Scheme for production of fingerlings of Carps 40.25 40.25
Scheme for Modified Extensive culture of Black Tiger
Shrimp in Brackish Water 17.00 17.00
Scheme for Brooders management and production of
quality Spawn of Indian Major Carp 5.49 5.49
Infrastructure & Assets
Distribution of hygienic insulated box to fish
vendors/collectors 13.44 21.29 82.50 117.23
Distribution of By-Cycle with insulated box to fish
vendors 16.88 30.40 47.28
Distribution of Matsyajan (insulated fish vending unit) 7.50 60.00 67.50
Construction and commissioning of Block Laboratory -
cum - Training centre 6.84 28.80 35.64
NMPS Schemes
Aquaculture Development through integrated approach
in 12 Nos of beels 47.54 120.00 - 167.54
Scheme for production of big sized fish in large water
bodies - - 103.40 103.40
Scheme for production of big sized fish in medium
water bodies - - 34.44 34.44
Training 8.64 14.42 20.68 43.74
Extension 1.10 4.40 4.40 9.90
RKVY Schemes 45.00 18.00 10.00 73.00
Agri-Irrigation
RKVY Schemes 250.00 295.00 250.00 795.00
Irrigation of existing farm at KVK with renovation of
drainage system - 25.00 10.00 35.00
Cooperation
Seed multiplication unit 80.00 80.00 80.00 240.00
Seed village for production of food grain ( Paddy,
mustard oil) and vegetable seed 90.00 90.00 90.00 270.00
Agril – Clinic two for each block 16.00 16.00 16.00 48.00
Cattle feed production unit 4.00 4.00 4.00 12.00
Rain water harvesting for 3 blocks ( sandeshkhali-I ,
sandeshkhali-II and hingalganj) 9.00 9.00 9.00 27.00
Safe drinking water project 5 for each Block 88.00 88.00 88.00 264.00
Vermi compost unit 10 for each Block 88.00 88.00 88.00 264.00
Farmers training Centre 16.00 16.00 16.00 48.00
Training programme for use of Bio- pest , Bio-
fertilizer, siol health etc. 100 Programme for each year 10.00 10.00 10.00 30.00
Soil testing kit 0.40 0.40 0.40 1.20
Construction of godown (100 mt) 60.00 60.00 60.00 180.00
Construction of cold storage (100 mt), multipurpose 60.00 60.00 60.00 180.00
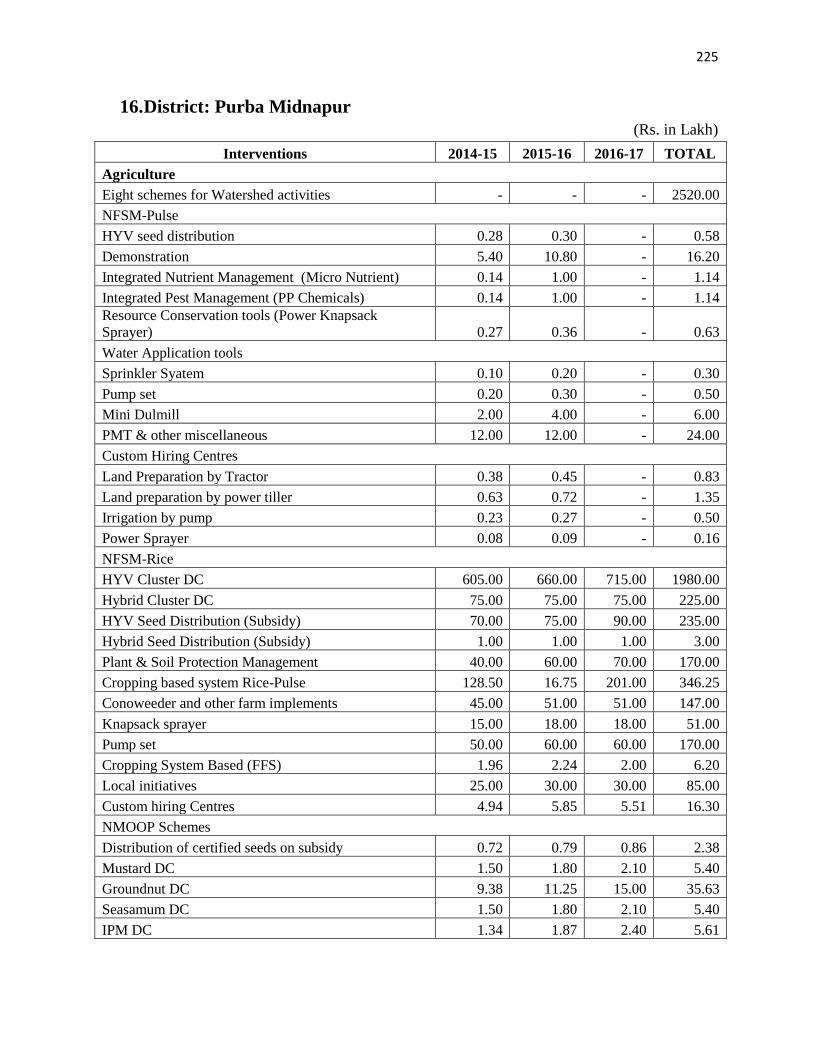
225
16. District: Purba Midnapur
(Rs. in Lakh)
Interventions 2014-15 2015-16 2016-17 TOTAL
Agriculture
Eight schemes for Watershed activities - - - 2520.00
NFSM-Pulse
HYV seed distribution 0.28 0.30 - 0.58
Demonstration 5.40 10.80 - 16.20
Integrated Nutrient Management (Micro Nutrient) 0.14 1.00 - 1.14
Integrated Pest Management (PP Chemicals) 0.14 1.00 - 1.14
Resource Conservation tools (Power Knapsack
Sprayer) 0.27 0.36 - 0.63
Water Application tools
Sprinkler Syatem 0.10 0.20 - 0.30
Pump set 0.20 0.30 - 0.50
Mini Dulmill 2.00 4.00 - 6.00
PMT & other miscellaneous 12.00 12.00 - 24.00
Custom Hiring Centres
Land Preparation by Tractor 0.38 0.45 - 0.83
Land preparation by power tiller 0.63 0.72 - 1.35
Irrigation by pump 0.23 0.27 - 0.50
Power Sprayer 0.08 0.09 - 0.16
NFSM-Rice
HYV Cluster DC 605.00 660.00 715.00 1980.00
Hybrid Cluster DC 75.00 75.00 75.00 225.00
HYV Seed Distribution (Subsidy) 70.00 75.00 90.00 235.00
Hybrid Seed Distribution (Subsidy) 1.00 1.00 1.00 3.00
Plant & Soil Protection Management 40.00 60.00 70.00 170.00
Cropping based system Rice-Pulse 128.50 16.75 201.00 346.25
Conoweeder and other farm implements 45.00 51.00 51.00 147.00
Knapsack sprayer 15.00 18.00 18.00 51.00
Pump set 50.00 60.00 60.00 170.00
Cropping System Based (FFS) 1.96 2.24 2.00 6.20
Local initiatives 25.00 30.00 30.00 85.00
Custom hiring Centres 4.94 5.85 5.51 16.30
NMOOP Schemes
Distribution of certified seeds on subsidy 0.72 0.79 0.86 2.38
Mustard DC 1.50 1.80 2.10 5.40
Groundnut DC 9.38 11.25 15.00 35.63
Seasamum DC 1.50 1.80 2.10 5.40
IPM DC 1.34 1.87 2.40 5.61

226
Farmers training DC 4.80 5.28 6.00 16.08
Training of officers / extension personnel 1.80 1.80 2.52 6.12
Distribution of SSP 22.50 26.25 30.00 78.75
Distribution of Rhizobium 0.99 1.35 1.65 3.99
Distribution of PP Chemicals 5.00 7.50 10.00 22.50
Sunflower DC - 4.00 6.00 10.00
Polythene Mulch in G.Nut - 1.15 1.73 2.88
Initiatives for crop development
Production of Certified HYV Seed through seed village
programme & DC 57.50 98.50 98.50 254.50
Production enhancement through alternate crops during early Rabi and Rabi summer
Distri bution of Seed kits 214.39 238.75 249.85 702.99
Farm Mechanization 775.00 900.00 900.00 2575.00
Agri-extension 61.00 68.50 60.50 190.00
Soil Health Management 81.30 97.30 97.30 275.90
Plant Protection 41.46 14.35 14.35 70.16
Assets & Infrastructure 312.90 612.90 611.90 1537.70
State plan activities 4.46 17.19 22.29 43.94
Animal Resource Development
Dairy Scheme (3 high yielding' mileh tow per unit) 2.25 2.25 2.25 6.75
Goatery scheme (20:2) 125.00 125.00 125.00 375.00
Sheep Farmmg(lO-.l) 6.25 6.25 6.25 18.75
Piggery[3:l) 190.54 190.54 190.54 571.62
Broiler
Chick distribution involving SHG 87.50 87.50 87.50 262.50
Household duckery scheme 25.00 25.00 25.00 75.00
Training tor farmers upgradation (15 days (3) Rs.80
/trainee/day) 6.00 6.00 6.00 18.00
Awareness campaign organised at 223 GPs (2
camp/GP) 17.84 17.84 17.84 53.52
Heifer rearing scheme 30.00 30.00 30.00 90.00
Fertility camp @ 4nas. /block 20.00 20.00 20.00 60.00
Awareness camp in dist. & block level 4.50 4.50 4.50 13.50
Building for BLDO & BAHC unit 296.00 296.00 296.00 888.00
Building fund for ABAHC 120.00 120.00 120.00 360.00
Green Fodder Development 2.00 2.00 2.00 6.00
Milk Booth (Raw & Processed Milk) [1 in each sub-
divn] 2.00 2.00 2.00 6.00
Livestock Market Dev. - 10.00 - 10.00
Broiler Meat Shop (3 in each sub-divn.) 57.84 57.84 57.84 173.52
Feed processing plant - 250.00 - 250.00
Azzola Cultivation 2.00 2.00 2.00 6.00

227
Layer Bird Distribution 20 Nos. 35.63 35.63 35.63 106.88
Training programme 15.63 15.63 15.63 46.88
Enrichment of Straw and cellulose waste 2.75 2.75 2.75 8.25
Women Development (Sheep Goat ) 17.84 17.84 17.84 53.52
Assistance to hand driven chaff cutter 22.50 22.50 22.50 67.50
Assistance to power driven chaff cutter 12.50 12.50 12.50 37.50
ABAHC office building construction 150.00 150.00 150.00 450.00
BLDO cum BAHC construction 148.00 148.00 148.00 444.00
SAHC construction 60.00 60.00 60.00 180.00
Horticulture
Production of planting material 7.50 15.00 7.50 30.00
Banana 15.37 30.72 30.72 76.81
Flowers 50.40 99.20 116.80 266.40
Spices 5.88 8.40 9.00 23.28
Plantation crops 10.20 - - 10.20
Shade Net house 5.40 7.20 8.10 20.70
Plastic Tunnels 0.15 2.10 2.25 4.50
Horticulture Mechanization 30.00 60.00 84.00 174.00
Organic Farming 12.00 21.00 24.00 57.00
Banana Sucker 5.85 10.50 12.25 28.60
Fruit crops other than cost intensive crops using normal
spacing 3.08 9.00 9.00 21.08
Human Resource Development 0.50 2.00 3.75 6.25
Mushroom - 8.00 16.00 24.00
Agri-Marketing
Armar fasal amar gola [ traditional] 400.00 440.00 480.00 1320.00
Amar fasal amar gola [ community] 26.00 30.00 36.00 92.00
Amar fasal amar sari (van-rickshaw & e nos. 99.00 120.00 132.00 351.00
Amar fasal amar gari poly crate] 24.75 30.00 33.00 87.75
Jute grading training camp 1.60 2.00 3.00 6.60
Colo storage seminar 0.50 1.25 1.50 3.25
Post-harvest training camp 1.00 1.25 1.50 3.75
Training cum workshop programme on betel leaf and
cashew nut 1.00 1.25 1.50 3.75
Better packaging, technique fruit and vegetables 1.20 1.80 2.40 5.40
Agri-Irrigation
Modernisation of Minor Irrigation Tank. 145.10 271.95 271.95 689.00
Renovation of PVC pipe line in place of RCC pipe
line at different D.T.W 165.00 165.00 170.00 500.00
Re-drilling of HDTW (Heavy deep tube well) 28.00 28.00 30.00 86.00
Agri-Mechanical : Proposed Schemes 133.30 71.45 49.60 254.35
WBCADC, Tamluk Project

228
Seed Village 0.90 0.90 0.90 2.70
Establishment of Sheep/Goat Breeding Farm (10+1) by
SHG 2.70 2.70 2.70 8.10
Establishment of Poly House (100 sq.m.) 6.80 6.80 6.80 20.40
Establishment of Poultry Unit by SHG 11.00 11.00 11.00 33.00
Soil Sample Testing for Amendment of Soil Health 0.50 0.50 0.50 1.50
Strengthening of Soil & Water Testing Lab 6.00 6.00 6.00 18.00
Establishment of Mushroom Production Unit 5.00 5.00 5.00 15.00
Skill Development Training for SHG
Members/Farmers under Agril. & Allied Sector 3.00 3.00 3.00 9.00
Integrated Farming System Demonstration-cum-
Training Centered by Farmers/Farmers’ Club/SHG
Cluster 24.00 24.00 24.00 72.00
Fisheries Department
Providing Water Test Kit 14.00 14.00 14.00 42.00
Providing Mobile to the Block FEO/ Fisbery Field
Assistants 7.50 7.50 7.50 22.50
Providing One Motor Cycle to the Block Vishe
Fishery Section 18.90 18.90 18.90 56.70
Prowding One 5PH pumpset to proegressise kish
Famers in rural area 25.00 25.00 25.00 75.00
Providing One set of PH pumpset plnkhan not and
Scheme dise to Fish Fanners 12.50 12.50 12.50 37.50
Providing pr Block on Aquaruluser for Fish Farmers 3.75 3.75 3.75 11.25
Cooperation Department
Rural storage godown cum office (50MT/100MT) 39.00 39.00 39.00 117.00
Repair of godown 8.00 8.00 8.00 24.00
Workshop cum Sales counter for SHG 12.00 12.00 12.00 36.00
Agro processing unit 10.00 10.00 10.00 30.00
Mini Deep Tube-Well 2.50 2.50 2.50 7.50
a) Skill-Dev. Training of SHG 3.60 4.20 4.80 12.60
b) Awarness training of SHGs 5.00 5.00 5.00 15.00
Dev. Of Consumer Coop. Society or Consumer
business of Coop. Society 3.50 3.50 7.00 14.00
Dev. Of PAMS 5.00 5.00 5.00 15.00
Dev. Of PACS and Mahila Coop. 4.00 4.00 4.00 12.00
Rural haat 10.00 10.00 10.00 30.00
Interest subsidy to loanee members of CARD Bank 450.00 485.00 525.00 1460.00
Assistance for Universal membership 10.00 10.00 10.00 30.00
Development of Women Cooperative 10.00 10.00 10.00 30.00
Strengthening of weak PACS 16.59 15.00 13.50 45.09
ST(SAO) loan through KCC 23007.22 24872.35 26978.37 74857.94
MT (Agril) loan 3014.14 3287.52 31260.75 37562.41

229
17. District: Paschim Midnapur
(Rs. in Lakh)
Interventions 2014-15 2015-16 2016-17 TOTAL
Agriculture
Crop demonstration 255.50 2609.60 2754.00 5619.10
Agriculture Extension 579.50 548.00 548.00 1675.50
Training & capacity building 15.00 22.50 22.50 60.00
Agril. Information Kiosk 150.00 150.00 200.00 500.00
Farmer’s study tour 47.50 56.50 76.25 180.25
Seed supply 215.00 255.00 332.50 802.50
D.C. with local varietiess 14.20 14.20 14.20 42.60
Bio and Botanical Pesticides 33.00 42.10 53.00 128.10
Biovillage 90.00 120.00 150.00 360.00
Popularization of Pheromone Trap 17.80 22.25 24.30 64.35
Soil health management 245.00 884.50 1014.00 2143.50
Farm Mechanization 876.00 1137.06 1350.12 3363.18
Infrastructure Development 393.00 604.15 207.00 1204.15
Spear Head Technology Intervention 30.00 34.00 74.00 138.00
Horticulture
Horticulture Development 65.00 50.00 50.00 165.00
Post-Harvest Infrastructure 0.00 45.00 50.00 95.00
Animal Resource Development
Construction of office and godown of central medical store 50.00 - - 50.00
Establishment of veterinary poly clinic 200.00 - - 200.00
Onstruction of animal development Aid centre at GP level 900.00 1000.00 1000.00 2900.00
Moderisation of state Animal Health Care Centre. 9.00 9.00 9.00 27.00
Organisation of fertility cam. 29.00 29.00 29.00 87.00
Establishment of goat/sheep farming through SHG. 400.00 400.00 400.00 1200.00
Distribution of chicks/duckling involving women SHG. 120.00 120.00 120.00 360.00
Establishment of Poultry (Broiler farm/croiler individual for ST/SC General poor farmer.) 177.00 174.00 174.00 525.00
Establishment of Pig farm 116.00 116.00 116.00 348.00
Socio – economic development programme through vaccination of animal and bird 5.00 10.00 15.00 30.00
Establishment of goat building cum demonstration farm at Jangal Mahal 250.00 - - 250.00
Establishment of Pig building station at Salboni 642.00 - - 642.00
Composite Training centre for tribal farmer and milk society personal 50.00 - - 50.00
Composite State Animal Husbandry Farm Salboni 150.00 0.00 0.00 150.00
Fisheries Department

230
Grant in aid 30.00 35.00 40.00 105.00
5 days training on modern farming technology 4.00 8.00 12.00 24.00
Distribution of Fisheries minikit (No.) 80.00 90.00 100.00 270.00
Composite Fish Culture 25.00 50.00 75.00 150.00
Fishery Training 5.00 10.00 15.00 30.00
Observation of the farmers’ day 2.90 2.90 4.35 10.15
Model Village 80.00 96.00 120.00 296.00
Infra. Dev. Of fishery Village 25.00 50.00 100.00 175.00
Maintenance of roads for fishermen village 40.00 50.00 60.00 150.00
Assistance of F.C.S. 12.00 15.00 16.00 43.00
Production of quality fish seed 20.00 50.00 50.00 120.00
Construction of Community hall 24.00 32.00 40.00 96.00
Prawn Seed rearing bank 8.00 8.00 4.00 20.00
Soil & water testing equipments & lab in each block 20.00 24.00 14.00 58.00
Mobile Marketing van 8.00 24.00 32.00 64.00
Fish feed plant - 15.00 - 15.00
Integrated fish farming for jhargram sub-div. With duck/hen/pig 10.00 20.00 20.00 50.00
De-Siltation of tank/bundh (80 ha) 40.00 60.00 60.00 160.00
Development of Hygienic fish market 12.00 15.00 20.00 47.00
Fisheries training centre 25.00 25.00 50.00 100.00
Carp hatchery (each block) 56.00 56.00 35.00 147.00
Agri-irrigation Schemes 332.08 621.02 909.31 1862.41
Agri-Mechanical Schemes 94.30 40.00 40.00 174.30
State Minor Irrigation Corporation 7.00 9.00 9.67 25.67
Kansabati canal irrigation 20.00 30.00 35.00 85.00
Sericulture
Schemes for Mulberry sector - 76.00 15.00 91.00
Schemes for Tasar sector 35.00 89.00 124.00
Social Forestry
Wasteland Development (in ha) 900.00 900.00 1200.00 3000.00
Jatropha /Biodiesel 200.00 200.00 240.00 640.00
Bamboo Cultivation 129.00 129.00 129.00 387.00
Forest Nursery 45.00 52.50 60.00 157.50
Cooperation Department
Rain water Harvesting(Ha) 10.75 21.50 31.25 63.50
Goatery (No) 18.00 36.00 54.00 108.00
Agril Godown (No) 38.90 71.80 143.60 254.30
Working shed for SHGs (No) 74.20 148.80 222.60 445.60
Soil Testing Laboratory (No) 22.05 22.05 22.05 66.15
Power Tiller (No) 23.70 47.40 71.10 142.20

231
Seed Village (No) 100.00 150.00 200.00 450.00
Rural Market (No) 64.00 128.00 192.00 384.00
Vermi Compost (No) 33.00 49.50 66.00 148.50
Construction of Training Centre (No) 11.98 - - 11.98
Agril. Hub (No) 80.00 80.00 80.00 240.00
Tractor (No) 73.70 110.55 147.40 331.65
Mini Deep Tube Well (No) 16.25 32.50 48.75 97.50
Rural Hat (No) 50.00 50.00 50.00 150.00
Schemes for cooperative Management Centre, Jhargram 40.69 20.69 16.00 77.38
Agri-Marketing
Construction of Traditional storage structure 20.00 25.00 30.00 75.00
Construction of Community storage structure 12.00 18.00 24.00 54.00
Construction of Onion storage structure 2.50 3.75 5.00 11.25
Jute Grading Camp 3.00 4.50 6.00 13.50
Van-Rickshaw & Poly Crate Combo 50.00 70.00 100.00 220.00
Development of RMC 90.00 90.00 90.00 270.00
Cold Storage Seminar 2.00 3.00 4.00 9.00
Post harvest training camp 2.00 3.00 4.00 9.00
Better packaging techniques-Fruits and Vegetables 2.50 3.75 5.00 11.25
Workshop programme on potato 2.50 3.75 5.00 11.25
Multipurpose cold storage set up 40.00 40.00 80.00 160.00
Market linked road 72.00 36.00 36.00 144.00
Food processing centre setup 12.00 12.00 12.00 36.00
Development of Rural Hatt 20.00 20.00 30.00 70.00
Interlink approach road with principal market yard of RMC 12.00 12.00 …. 24.00
Construction of 1000MT Godown 25.00 25.00 25.00 75.00
Tube well for the market within the district 3.00 6.00 9.00 18.00
Community Hall at the principal market yard at Ghatal RMC 12.00 12.00 12.00 36.00
Construction of Boundary Wall 30.00 30.00 30.00 90.00
Construction of Krishak Bazar ….. 5400.00 6000.00 11400.00
Special Component for Ganga Basin - 390.00 390.00 780.00
Soil Conservation schemes - 820.50 820.50 1641.00
WBCADC
Schemes of WBCADC 199.32 106.30 29.33 334.95
Drought Prone Area Programme – Jhargram 39.10 47.07 6.40 92.57
KVK, KAPGARI
Technology assessment and demonstration to enhance capacity development 76.00 80.00 120.00 276.00

232
18. District: Purulia
(Rs. in Lakh)
Interventions 2014-15 2015-16 2016-17 TOTAL
Agriculture
Seed Production 221.75 221.75 221.75 665.25
Technology dissemination 1.75 1.75 1.75 5.25
Agricultural information & publicity 6.25 6.25 6.25 18.75
Varietal replacement 81.50 81.50 81.50 244.50
Addressing problematic soil 211.00 61.00 61.00 333.00
Popularizing bio-pesticides & judicial use of PP chemicals 43.40 43.40 43.40 130.20
Capacity building 73.50 73.50 73.50 220.50
Farm Mechanization 155.50 155.50 155.50 466.50
Agri Implements Hub 75.00 75.00 75.00 225.00
Agri-irrigation schemes 695.16 753.47 817.62
Infrastr. development of govt seed farm and STL 124.80 9.80 9.80
Improvement of facilities on Post Harvest Technologies 3.00 13.00 3.00 19.00
Agri Extension Mobility facility 66.24 66.24 66.24 198.72
Manpower hiring 46.80 46.80 46.80 140.40
IT facilities 6.50 6.50 6.50 19.50
Agri Extension Communication 3.88 1.38 1.38 6.64
Animal Resource Development
Carpet AI programme in difficult reach areas of ajodhya hills pu rulia 58.11 54.10 54.10
Identification & conservation of higher growth rate germplasm resource of Black Bengal goat in its natural habitat at Ayodhya hill of Bagh mundi, Purilia 13.24 13.24 14.24 39.72
Infarstr. Dev. at Block & District Level of ARD 269.16 - - 269.16
District Industries sector
Strengthening of Lac growers in Purulia District 51.44 52.56 53.80
Fisheries sector
Scheme for Intensive Fish culture 36.80 36.80 36.80
Scheme for production of fingerlings of Carps 11.50 11.50 11.50
Distribution of hygienic insulated box to fish 9.90 9.90 9.90 29.70
vendors/ collectors
Distribution of By-Cycle with insulated box to fish vendors 16.00 16.00 16.00 48.00

233
Distribution of Matsyajan (insulated fish vending unit) 10.00 10.00 10.00 30.00
Scheme for production of big sized fish in large water bodies 9.40 9.40 9.40 28.20
Scheme for production of big sized fish in medium water bodies 28.70 28.70 28.70 86.10
Forestry sector
Afforestation works 5.70 16.50 5.10 27.30
Soil & moisture conservation works 58.48 54.24 34.54 147.26
Cooperation Sector
Construction of rural godown and repairing /renovation/ completion of incomplete godown for primary Cooperative Societies 142.00 142.00 142.00 426.00
Provision of Infrastructural facilities to the Primary Cooperative Societies 32.50 22.50 22.50 77.50
Special Programme on Strengthening of SHGs 21.00 21.00 21.00 63.00
Capacity building of SHG members 44.85 44.85 44.85 134.55
Agriculture Marketing
Infrastr. modernization of existing Market Yards and hats and development new sub-market yards 475.44 83.84 73.37 632.65
Capacity building - Food processing centres at Balarampur and Raghunathpur blocks and one food testing laboratory at Purulia 389.60 14.85 14.85 419.30
Horticulture
Production & Growth Schemes 172.71 127.77 108.83 409.31
Sericulture
Schemes for mulberry plantation and training centres 135.34 0.00 0.00 135.34
Land & Water Resource Development
Development of land/soil resources 750.00 750.00 750.00 2250.00
Gully control measures 20.00 20.00 20.00 60.00
Construction of diversion field/irrigation channel 28.00 28.00 28.00 84.00
Construction of check dam 120.00 120.00 120.00 360.00
Ravine & sand reclamation scheme 6.00 6.00 6.00 18.00
Innumerable dug-out farm pond 180.00 180.00 180.00 540.00
Re-excavation of existing silted ponds 120.00 120.00 120.00 360.00
Construction of Percolation Tank 9.00 9.00 9.00 27.00
Excavation of open Dug well 13.00 13.00 13.00 39.00
KVK, Kalyan, Purulia
Establishment of Demonstration Unit for Cultivation of Coloured Capsicum under Hi-tech Polyhouse condition 19.38 1.23 1.23 21.84

234
Strengthening of existing Seed Processing Infrastructure 46.87 2.00 2.00 50.87
Establishment of demonstration unit for natural resource management and sustainable farming through Vermi-compost 57.22 1.94 1.94 61.10
Strengthening of Existing Soil Testing Laboratory with Micro nutrient testing facility 45.00 5.00 5.00 55.00
Establishment of Plant Health Clinic 48.76 2.81 2.81 54.38
Integrated Mushroom Unit for Spawn Production and Training 42.33 2.53 2.53 47.39
Establishment of pure breed of Black Bengal goat farm Genetic Resource Conservation and capacity building infrastructure at KVK, Purulia 68.78 5.38 5.38 79.54

235
19. District: Uttar Dinajpur
(Rs. in Lakh)
Interventions 2014-15 2015-16 2016-17 TOTAL
Agriculture
Infrastr. development of Agricultural Govt. Farm 274.75 316.50 317.00 908.25
Soil health management 79.70 130.00 138.00 347.70
Plant protection 18.00 29.00 32.00 79.00
Farm Mechanization 164.00 218.00 268.00 650.00
Aromatic rice 37.50 75.50 75.50 188.50
Agri-mechanical 0.73 N A N A 0.73
Agri-irrigation Plan 4948.51 1614.01 - 6562.52
Horticulture
Integrated development of fruits and vegetable cultivation 70.71 171.91 53.26 295.88
Capacity building and Human Resource Development 10.65 0.65 0.15 11.45
Bee Keeping and Pollination support 44.00 - - 44.00
High Tech Horticulture 230.40 - 237.60 468.00
Organic farming 40.00 30.00 15.00 85.00
Flowers - 17.50 - 17.50
Mushroom Cultivation - 10.00 - 10.00
Mission Management - 7.00 - 7.00
Sericulture
Construction of internal Pathway at Hemtabad & Raiganj Farm 12.50 - - 12.50
Development of of rearing facilities at Hemtabad Farm - 30.00 - 30.00
Development of of rearing facilities at Fulhara Farm - - 30.00 30.00
Cooperation
Construction of godown 62.50 62.50 62.50 187.50
Repair of godown 12.00 12.00 12.00 36.00
Development of Agro. Processing unit 5.00 5.00 5.00 15.00
Development of Agri. Implement Hub 15.00 15.00 15.00 45.00
Development of food processing unit 5.00 5.00 5.00 15.00
Development of seed processing unit 10.00 10.00 10.00 30.00
Development of SEMS ltd 10.00 10.00 10.00 30.00
Dev. of Primary Consumers’ Co-Op. Society 7.00 7.00 7.00 21.00
Development of Rural Hat 50.00 50.00 50.00 150.00
Development of irrigation unit 5.00 5.00 5.00 15.00
Development of Self Help Groups 10.00 10.00 10.00 30.00
Social Forestry
Advance work for plantation (nursery) 1600nos seedling/Hect 46.00 53.00 61.00 160.00
Soil & Moisture Conservation 30.55 33.25 36.35 100.15
Agri-Marketing

236
Amar Dhan amar chatal 15.00 20.00 30.00 65.00
Manually operated grain drier fuelled by bio-mass 12.00 16.00 24.00 52.00
Amar Fasal Amar Gola 14.50 35.50 44.00 94.00
Amar Fasal Amar Gari 20.70 40.00 50.00 110.70
Jute grading training camp 0.30 0.45 0.75 1.50
Technician program of cold storage - 10.50 1.75 12.25
Low cost Paddy/grain storage structure 7.50 10.00 15.00 32.50
Fisheries
RKVY i) Production Growth 6.78 8.58 10.01 25.37
ii) Infrastructure 36.87 27.65 24.45 88.97
NMPS 23.77 - - 23.77
State Core Plan : a) Training 4.20 5.10 6.35 15.65
b) Extension 0.90 1.35 1.80 4.05
C ) Social Fishery 20.65 21.10 23.35 65.10
a) Distribution of fisheries requisites 4.00 2.50 2.00 8.50
b) TSP 20.13 24.00 24.00 68.13
WBCADC
Formation of Seed Village 2.40 3.00 3.30 8.70
Establishment of goat breeding unit 27.90 31.00 34.10 93.00
Soil samples testing 0.50 0.55 0.60 1.65
Soil & water Testing lab 3.00 0.00 0.00 3.00
Skill development training of SHGs/ Farmers 3.00 5.25 6.00 14.25
Seed Multiplication 27.50 27.00 29.00 83.50
Estab.of poultry 8.25 9.00 10.50 27.75
Pig breeding unit 5.50 0.00 0.00 5.50
Vermicompost unit 0.00 0.00 0.00 0.00
Animal Resource development
Distribution of Inputs for Improvement of Livelihood through Goat Farming 40.00 50.00 60.00 150.00
Augmentation of Meat Production by Intensive Sheep/Goat Rearing through adoption of good husbandry practices 30.00 37.50 45.00 112.50
Distribution of Inputs for Improvement of Livelihood through Pig Farming 32.00 40.00 48.00 120.00
Optimization of Productive Efficiency through Organization of Animal Health Camp (Parasitic Control, PPR Control, Fertility Management & Ranikhet Diseases Control at Farmers' Doorstep) 32.00 40.00 50.00 122.00
Infrastructure Development 23.00 23.00 33.00 79.00
Maintenance and Recurring Cost to run Mobile Veterinary Clinic 11.50 12.50 13.50 37.50
Modified Bishes Go- Sampad Bikash Avijan 68.98 73.60 74.80 217.38

237
APPENDIX - A

238
Appendix 1
Per Capita Income of Various Indian States
State 2010-11 2011-12 2012-13 Growth%
Andhra Pradesh 60703 68970 78177 13.30
Arunachal Pradesh 61002 72091 77647 7.70
Assam 33348 37250 42036 12.80
Bihar 19205 22890 28317 23.70
Chhattisgarh 40166 46743 52689 12.70
Goa 164962 167838 NA NA
Gujarat 78802 89668 NA NA
Haryana 94798 108345 122660 13.20
Himachal Pradesh 67475 74694 82611 10.60
Jammu & Kashmir 40752 45380 50641 11.60
Jharkhand 34721 38258 43384 13.40
Karnataka 62251 68423 77015 12.60
Kerala 69465 80924 NA NA
Madhya Pradesh 32223 37994 43864 15.40
Maharashtra 83395 95339 107670 12.90
Manipur 29281 32865 36290 10.40
Meghalaya 48690 53542 60156 12.40
Mizoram 48591 54689 NA NA
Nagaland 53635 56461 59535 5.40
Odisha 38878 41896 49489 18.10
Punjab 69580 78663 88783 12.90
Rajasthan 44709 53735 NA NA
Sikkim 108972 124791 142625 14.30
Tamil Nadu 78473 88697 98550 11.10
Tripura 45087 50175 55004 9.60
Uttar Pradesh 26692 29785 33269 11.70
Uttarakhand 73815 81595 92607 13.50
West Bengal 47389 54125 62831 16.10
Andaman & Nicobar 80588 85984 89748 4.40
Chandigarh 130763 142869 NA NA
Delhi 148608 173686 201083 15.80
Puducherry 101072 102859 122652 19.20
Source: pbplanning.gov.in/pdf/Statewise%20GSDP%20PCI%20and%20G.R.pdf

239
Appendix 2
Average Monthly and Annual Rainfall and Rainy days in the Districts of West Bengal
Source: Data collected from the Indian Meteorological department
Sl No Districts Jan Feb Mar Apr May Jun Jul Aug Sep Oct Nov Dec Annual
RF 18.70 24.50 36.60 109.70 237.90 585.00 805.00 588.90 493.50 148.30 22.50 14.00 3084.60
RD 1.50 2.30 3.20 6.80 13.30 19.10 24.20 20.90 17.00 5.40 1.20 1.00 115.90
RF 14.50 23.10 33.60 124.60 361.10 692.10 928.00 616.00 528.80 155.70 19.20 11.60 3508.30
RD 1.00 1.60 2.20 7.00 14.00 18.30 21.90 17.50 15.30 5.80 1.10 0.70 106.40
RF 9.80 15.00 28.30 123.80 321.00 580.30 792.90 535.80 488.70 127.10 11.00 7.90 3041.60
RD 0.70 1.20 1.90 6.30 13.20 16.70 19.60 14.50 14.20 4.80 0.70 0.60 94.40
RF 10.90 10.80 16.60 59.80 183.80 346.50 515.60 408.40 364.30 106.00 10.90 8.30 2041.90
RD 0.90 0.90 1.20 3.30 7.70 11.70 16.40 13.30 12.60 3.90 0.70 0.60 73.10
RF 10.40 7.10 13.80 59.40 192.60 288.90 400.10 312.80 347.60 103.90 9.90 8.60 1755.10
RD 0.70 0.90 0.90 3.00 8.00 10.70 17.40 11.90 11.60 4.10 0.60 0.70 70.50
RF 10.90 10.80 11.00 39.10 117.50 229.40 353.10 302.40 296.60 91.80 12.30 10.30 1485.20
RD 0.80 1.00 1.00 2.30 5.90 10.00 15.00 12.90 11.10 4.00 0.70 0.70 65.40
RF 8.80 20.00 22.20 46.20 110.90 236.50 309.30 258.20 236.90 102.10 17.10 9.90 1378.10
RD 0.80 1.60 1.80 2.90 6.20 11.10 15.00 13.60 11.20 4.50 1.00 0.60 70.30
RF 8.50 28.80 31.70 59.90 138.50 245.90 308.50 269.80 228.70 88.40 18.60 16.60 1443.90
RD 0.80 1.80 2.10 3.40 7.20 11.50 15.30 14.10 11.00 4.50 1.00 0.70 73.40
RF 9.70 23.20 23.30 40.70 88.70 234.20 324.50 295.70 258.20 105.40 17.50 9.40 1430.50
RD 0.90 1.80 1.90 2.90 5.60 10.80 15.60 15.20 11.80 4.70 1.00 0.70 72.90
RF 10.90 25.80 28.60 41.40 90.00 241.40 299.80 296.30 235.40 82.30 18.90 15.10 1385.90
RD 1.00 1.90 2.10 3.10 5.40 11.30 15.40 15.10 11.40 4.40 1.00 0.90 73.00
RF 12.10 20.00 22.20 30.60 59.00 252.90 298.50 290.90 233.80 70.00 19.30 12.60 1321.90
RD 1.30 1.60 2.00 2.70 4.40 11.20 15.40 15.40 11.40 3.60 1.10 0.90 71.00
RF 9.00 24.40 28.30 47.80 108.90 229.30 289.20 279.40 221.30 82.60 15.70 12.40 1348.30
RD 0.80 1.70 2.00 3.00 5.90 11.00 14.70 14.30 10.70 4.20 0.90 0.60 69.80
RF 11.30 31.50 33.60 61.60 117.60 248.30 313.90 300.00 236.00 94.20 19.10 9.10 1476.20
RD 1.00 2.00 2.30 3.70 6.50 11.40 15.80 15.50 11.60 5.00 1.00 0.70 76.50
RF 11.30 27.80 39.80 47.60 127.60 280.30 315.60 367.10 303.30 132.50 40.70 7.90 1701.50
RD 0.90 1.80 2.00 3.00 6.00 11.10 14.20 15.80 12.40 5.70 1.60 0.40 74.90
RF 13.50 24.70 34.80 60.10 110.30 258.50 319.60 334.50 263.50 92.60 18.50 7.90 1538.50
RD 1.00 1.70 2.20 3.80 6.20 11.30 15.20 15.70 11.70 4.70 1.00 0.60 75.10
RF 12.30 28.50 34.00 54.70 109.50 249.80 315.60 338.20 263.30 93.20 24.50 11.30 1534.40
RD 1.00 1.90 2.40 3.40 5.80 11.80 15.30 15.90 12.00 4.80 1.10 0.70 76.10
RF 15.30 19.50 29.50 49.20 102.30 269.70 329.20 321.30 295.00 142.80 17.10 7.20 1598.10
RD 0.80 1.40 2.20 3.00 6.00 12.40 6.60 17.10 13.60 7.20 1.10 0.40 81.80
RF 8.60 36.40 40.90 65.30 144.30 287.80 333.70 303.60 265.80 95.30 28.10 13.90 1623.70
RD 0.70 2.00 1.90 3.70 7.30 12.10 16.50 16.20 12.50 4.80 1.00 0.60 79.30
RF 10.80 24.40 31.20 52.80 122.70 309.70 386.90 409.30 340.20 135.00 42.40 10.90 1876.30
RD 1.10 1.60 2.00 3.00 6.10 12.50 16.60 17.00 13.70 5.90 1.80 0.50 81.8019
13
14
15
16
17
18
7
8
9
10
11
12
Howrah
Kolkata
Uttar 24-
Parganas
Dakshin 24-
Parganas
1
2
3
4
5
6
Bankura
Purulia
Burdwan
Hooghly
Purba
Medinipur
Paschim
Medinipur
RF --- Rainfall in millimeter RD ---- Rainy days.
Darjeeling
Jalpaiguri
Coocebehar
Uttar-Dinajpur
Dakshin
Dinajpur
Malda
Murshidabad
Nadia
Birbhum

240
Appendix 3
Average Daily Maximum and Minimum Temperature in 0C
Sl No District/Place Jan Feb Mar Apr May Jun Jul Aug Sep Oct Nov Dec Annual
Max 11.00 11.40 14.60 17.30 18.10 19.80 20.00 20.90 19.80 19.00 16.20 13.10 16.80
Min 3.00 3.90 6.80 9.30 11.20 12.10 14.80 14.20 13.40 10.80 8.20 51.10 9.40
Max 22.60 24.70 29.00 31.40 31.00 31.20 31.10 31.40 30.70 30.50 28.60 24.90 28.90
Min 8.20 10.70 14.90 18.70 21.00 23.70 24.30 24.40 23.50 19.50 14.90 10.30 17.80
Max 23.10 25.30 29.30 31.00 30.70 31.30 30.40 30.10 30.80 30.30 28.40 25.20 28.80
Min 9.30 11.40 16.10 18.30 22.10 23.90 25.00 25.00 23.90 20.60 15.30 11.00 18.50
Max 21.90 25.40 30.30 33.60 33.20 32.50 31.70 32.10 31.40 30.70 28.60 24.40 29.70
Min 8.80 11.10 15.50 19.30 22.30 24.60 25.00 24.80 23.60 21.10 15.40 10.10 18.50
Max 25.20 27.80 32.80 35.90 34.90 33.20 32.60 32.60 32.80 31.80 29.50 26.70 31.30
Min 10.00 12.10 16.80 21.10 22.90 24.30 24.90 25.10 24.80 22.30 16.70 11.50 19.40
Max 23.00 26.70 32.30 35.00 34.70 33.70 32.20 32.20 31.70 30.80 28.50 24.80 30.50
Min 10.10 12.10 16.50 21.70 24.30 25.70 25.90 26.00 25.00 22.00 16.90 11.90 19.80
Max 24.60 27.60 33.00 36.90 35.90 34.10 32.60 32.40 32.50 31.70 29.10 25.60 31.30
Min 10.90 13.30 17.90 22.50 23.80 25.10 25.30 25.40 25.00 22.50 17.70 12.80 20.20
Max 23.70 27.10 32.50 35.50 35.60 33.50 32.00 31.80 32.00 31.30 28.80 25.30 30.80
Min 10.60 13.80 18.70 22.50 25.10 25.70 25.90 26.00 25.30 22.70 17.40 11.80 20.50
Max 24.40 27.90 33.30 37.00 36.90 34.40 32.20 31.80 31.60 31.00 29.10 25.50 31.30
Min 11.20 14.20 19.00 23.10 25.20 25.90 26.00 26.00 25.30 22.30 17.40 12.80 20.70
Max 24.90 27.80 33.20 36.60 38.20 35.30 31.40 31.70 31.70 31.10 29.20 25.60 31.50
Min 11.30 14.20 19.10 23.60 25.90 25.90 25.70 25.80 25.20 21.90 17.30 12.00 20.70
Max 24.80 28.50 32.90 37.30 38.20 33.70 31.50 30.30 31.00 30.70 28.40 25.20 31.10
Min 11.10 13.90 18.70 22.50 25.00 25.00 24.80 24.40 23.80 20.80 16.20 11.60 19.80
Max 25.00 27.60 33.00 36.00 36.00 34.30 32.30 31.60 31.70 31.00 29.00 26.00 31.10
Min 11.80 14.80 19.00 23.00 24.50 25.60 25.80 25.80 25.30 22.00 17.50 12.90 20.70
Max 24.70 28.00 32.80 35.50 35.70 34.20 32.50 32.10 32.10 31.40 29.10 25.90 31.20
Min 12.10 15.50 20.40 23.60 25.10 26.00 26.00 26.10 25.50 23.00 17.70 13.00 21.20
Max 25.60 28.60 32.70 34.60 35.00 32.60 31.60 31.30 31.60 31.40 29.40 26.40 30.90
Min 13.30 17.20 21.70 24.40 26.30 26.40 26.30 26.30 25.90 24.60 18.80 13.80 22.10
Max 25.10 27.00 30.00 32.00 32.00 32.00 31.10 31.00 31.20 30.80 28.90 26.10 29.80
Min 13.00 17.50 22.00 25.00 26.60 27.00 26.60 26.50 26.10 23.70 18.60 13.20 22.20
Max 25.70 29.50 34.40 37.40 37.00 34.50 32.20 31.80 32.00 31.50 29.50 26.50 31.80
Min 12.00 16.00 20.60 23.80 25.60 25.70 25.40 25.30 24.80 22.20 17.40 13.00 21.00
Max 25.10 28.20 32.40 34.70 34.80 33.40 32.00 31.70 31.90 31.60 29.40 26.00 30.90
Min 11.40 15.50 20.20 23.30 25.20 25.40 25.50 25.40 25.10 22.70 17.10 13.30 20.80
Max 24.70 28.20 32.20 35.00 34.80 32.80 31.60 31.30 31.40 31.00 29.00 25.90 30.60
Min 11.30 15.30 20.30 23.00 25.00 25.40 25.20 25.30 25.00 22.60 17.40 12.40 20.70
Max 26.60 29.70 34.00 36.30 36.00 34.10 32.20 32.00 32.20 31.90 29.80 27.00 31.80
Min 13.90 16.90 21.70 25.10 26.40 26.50 26.10 26.10 25.80 24.00 18.90 14.30 22.10
Max 24.80 27.00 29.90 31.20 32.10 31.80 30.40 30.30 30.60 30.20 28.20 25.40 29.30
Min 16.20 19.30 24.00 26.60 27.50 27.40 26.70 26.70 26.60 25.30 21.00 16.90 23.70
19
20
13
14
15
16
17
18
7
8
9
10
11
12
1
2
3
4
5
6
Digha
Medinipur
Uluberia
Basirhat
Alipur
Sagar 1st
Suri
Susunia
Hatwara
Burdwan
Dhaniakhali
Nandigram
Source: Data collected from the Indian Meteorological department
Max --- Average daily maximum, Min --- Average daily minimum.
Sonada
(Darjeeling)
Mohitnagar
Coochbehar
Raiganj
Balurghat
Malda
Berhampur
Nakashipara

241
Appendix 4
District-wise Land Use Classification in West Bengal (2010-11)
(Area in ha)
*Excluding Kolkata Metropolitan District ; Source: Dir.of Agri.,Evaluation wing, Govt. W B
Sl.
No. District
Reporting
Area
Forest
Area
Area Under
Non-
Agricultural
Use
Barren and
Unculturable
Land
Permanent
Pastures &
Other
Grazing Land
Land
under
Misc. Tree
Groves
not
included in
Net Area
Sown
Culturable
Waste Land
Fallow
Land
Other
than
Current
Fallow
Current
Fallow
Net Area
Sown
1 2 3 4 5 6 7 8 9 10 11 12
1 Burdwan 698762 21165 211565 858 261 1986 4876 1237 4352 452462
2 Birbhum 451118 15853 101191 281 171 824 2815 2696 7331 319956
3 Bankura 687998 148930 148482 1424 775 1435 2130 1970 118763 264089
4
Purba
Medinipur 396594 899 102236 689 180 2149 296 237 1856 288052
5
Paschim
Medinipur 928581 171935 156588 2480 581 10016 3993 2972 93817 486199
6 Howrah 138676 - 53115 - - 1461 54 153 4480 79413
7 Hooghly 313379 530 96526 89 8 1588 1518 119 594 212407
8
North 24-
Parganas 386524 - 124782 - - 4817 - - 33908 223017
9
South 24-
Parganas 948710 426300 143323 70 23 2557 1344 7 16685 358401
10 Nadia 390655 1216 90220 54 64 3729 631 113 4181 290447
11 Murshidabad 532499 771 130761 1984 7 1078 1367 240 333 395958
12 Uttar Dinajpur 312466 580 33426 267 129 1513 125 157 1501 274768
13
Dakshin
Dinajpur 221909 932 34171 10 - 1157 30 408 1586 183615
14 Malda 370862 1679 90112 - - 3244 96 294 57453 217984
15 Jalpaiguri 622700 179000 90669 2989 - 4992 102 104 10717 334127
16 Darjeeling 325469 124575 40527 2465 830 2350 1487 3216 16437 133582
17 Cooch Behar 331565 4256 69431 263 8 5800 286 55 855 250611
18 Purulia 625646 75048 105719 3203 1807 2517 7601 4222 199395 226134
West Bengal* 8684113 1173669 1822844 17126 4844 53213 28751 18200 574244 4991222

242
Appendix 5
District wise Area under Forests (Legal Status) in West Bengal
Source : Annual report, 2013-14, Dir. of Forest, Govt. of West Bengal
Sl.
No.
District Reserved
Forests
Protected
Forests
Unclassed State
Forests & others
Total Area
(sq. km)
1 Darjeeling 1115 - 89 1204
2 Jalpaiguri 1483 217 90 1790
3 Cooch Behar - 42 15 57
4 Bankura 80 1311 91 1482
5 Purba Medinipur 8 1166 535 1709
6 Paschim Medinipur
7 Burdwan 3 192 82 277
8 Purulia 112 729 35 876
9 Birbhum 8 54 97 159
10 Hooghly 3 - - 3
11 Nadia 5 3 5 13
12 Murshidabad 1 7 - 8
13 Malda 8 5 7 20
14 Uttar Dinajpur 8 4 6 18
15 Dakshin Dinajpur
16 24-Parganas (N) 43 - - 43
17 24-Parganas (S) 4177 42 1 4220
18 Howrah - - - -
19 Kolkata - - - -
Total 7,054
(59.38%)
3,772
(31.75%)
1,053
(8.87%)
11879
(100%)
All India 425,494
(55.12%)
214,986
(27.85%)
131,341
(17.01%)
771,821
(100%)

243
Appendix 6
District-wise Degraded Lands
Districts Problems Approx. Area (ha.)
(Non-forest area)
Darjeeling
In Darjeeling Hills: Landslips & landslide, Gully,
Torrential velocity of streams, Mining, Acidity, outer slope
of cultivated terraces, surface flows over the slopes of
runoff.
In Siliguri Sub-Division: Splash, Sheet & rill erosion, gully
formation, sand landen, stream bank erosion, acidity,
mining.
67,100
Jalpaiguri Splash, sheet & rill erosion, stream bank erosion, sand
laden, gully formation, soil acidity, water logging, flash
flood.
84,000
Cooch Behar 62,000
North Dinajpur 13,800
South Dinajpur Stream bank erosion and sand laden 9,500
Malda Sand laden, stream bank erosion and river cutting, water
logging
28,000
Murshidabad Sand laden, stream bank erosion, river cutting, and
moisture stress.
85,000
Birbhum Sheet & rill erosion, undulating tract, moisture stress,
mining and sand laden
1,04,000
Burdwan Sheet erosion, undulating tract, gully, moisture stress,
mining and sand laden
1,33,000
Nadia Water logging, stream bank erosion 54,200
North 24-
Parganas
Scarcity of sweet water, ingress of saline water, water
logging, sea coastal erosion and soil salinity.
1,82,610
South 24-
Parganas
Scarcity of sweet water, ingress of saline water, water
logging, sea coastal erosion and soil salinity
5,00,830
Howrah Soil salinity, water logging 92,650
Hooghly Sand laden, water logging 50,200
East Medinipur Soil salinity, scarcity of sweet water, sea coastal erosion 3,42,310
West Medinipur Sheet, rill, gully erosion, undulating/rolling type
topography, moisture stress etc.
1,46,700
Bankura Sheet, rill, gully erosion, undulating/rolling type
topography, moisture stress etc.
89,200
Purulia Sheet, rill, gully erosion, undulating rolling type
topography, moisture stress etc.
1,46,200
Total 21,91,300
Source: Degraded and Wastelands of India – Status and spatial distribution, ICAR-NAAS, 2010

244
Appendix 7
Major Crops in the districts of West Bengal
District Major crops sequence of area covered
Burdwan Rice potato>jute> oilseeds1*> wheat>other cereals2*>pulses3*
Birbhum Rice> potato> wheat> oilseeds>pulses>jute>other cereals
Bankura Rice> potato> oilseeds> wheat> other cereals> jute> pulses
Purba Medinipur Rice> potato> oilseeds> jute> pulses> wheat> other cereals
Paschim Medinipur Rice> potato> oilseeds> jute> wheat> pulses> other cereals
Howrah Rice> potato>jute> oilseeds> pulses> wheat> other cereals
Hooghly Potato> rice> jute> oilseeds> wheat> other cereals> pulses
North 24 Parganas Jute>rice> potato> oilseeds>wheat> pulses> other cereals
South 24 Parganas Rice> potato> jute> pulses> oilseeds> wheat> other cereals
Nadia Jute>rice> potato> wheat> oilseeds> pulses> other cereals
Murshidabad Jute>rice> potato> wheat> oilseeds> pulses> other cereals
Uttar Dinajpur Rice> jute> potato> wheat> other cereals >oilseeds> pulses
Dakshin Dinajpur Rice> jute> potato> wheat > oilseeds> other cereals> pulses
Malda Rice> jute> potato> wheat > oilseeds> other cereals> pulses
Jalpaiguri Potato—rice> jute> wheat> other cereals >oilseeds> pulses
Darjeeling Potato> rice> other cereals> jute>wheat> pulses> oilseeds
Coochbehar Jute> potato> rice> other cereals> wheat – oilseeds > pulses
Alipurduar Jute> potato> rice> other cereals> wheat – oilseeds > pulses
Purulia Rice> potato> other cereals> wheat> pulses> oilseeds
West Bengal Rice> potato> jute> wheat> oilseeds> other cereals>
pulses
(Source: Statistical Handbook West Bengal, 2012, C-DAP of districts 2014)
1* Crops are arranged in sequence of area covered, begins with highest area covered one; 2*Oilseeds include: sesame,
rapeseed & mustard, linseed, groundnut, sunflower, safflower, castor, niger; 3* Other cereals include: maize, barley,
ragi, jower, bajra, millets; 4*Pulses include: gram, tur, mung, lentil, (musur), pea (matar), khesari, kulthi, soyabean;

245
Appendix 8
Implements recommended for different crops in West Bengal
Paddy
Puddling: Animal-operated helical blade puddlers must be introduced on large scale. These will
be useful to enhance the quality and output of work.
Transplanting: Paddy requires huge amount of manual labour for transplanting which also
involves drudgery. Drum type pre-germinated paddy seeders and manually-operated 6-row
transplanters will go a long way in reducing the cost of transplanting, timeliness and the human
drudgery.
Weeding: Cono weeders or rotary hoe weeder should be introduced to improve the efficiency of
weeding.
Harvesting: Good quality, self-sharpening sickles for manual harvesting and power tiller
operated vertical-conveyor reapers.
Threshing: Manual/motorized wireloop threshers, multi-crop engine/motor operated threshers
will reduce the time and loss of grains in threshing operations.
, Potato
.Planting: Depending on the farm size, animal-drawn and tractor drawn potato planters will
reduce the cost of planting.
Harvesting: Animal-operated / tractor-operated diggers.
Graders: Manually-operated graders will enhance the value of produce by on-farm grading.
Wheat
Seed-bed preparation: Animal- drawn 3-tyne cultivator/harrow, power tiller with rotovator.
Sowing: Animal-drawn 3-row seed drill; use of tractor-operated zero-till drill will be beneficial
as the time between the harvest of kharif paddy and sowing of wheat is limited.
Harvesting: Good quality, self-sharpening sickles for manual harvesting; power tiller operated
vertical-conveyor reapers. This package of equipment is common to paddy and wheat.
Threshing: Engine/motorized multi-crop threshers, high capacity tractor-operated threshers in
selected areas on custom hiring basis.

246
Pulses/Oilseeds/Maize
Sowing: Animal drawn mustard drill, manual dibblers, animal drawn multi-crop planter for crops
like groundnut, pigeonpea, maize etc.
Harvesting: Groundnut digger.
Threshing: Groundnut pod stripper, groundnuts decorticator, tubular maize sheller.
Jute
Land preparation: Mould board plough, Cultivator, Disc harrow, Rotovator
Sowing: Seed Drill
Interculture: Wheel hoe, Scrapper
Plant protection: Sprayers, Dusters
Miscellaneous
Quality hand tools for horticultural crops. Air-assisted sprayers, micro-irrigation for laterite and
red soil zone in western part of the state.

247
Appendix 9
District wise net ground water availability, utilization and status of groundwater
development in West Bengal (in ham)
Source: SWID
For
Irrigation
For
Domestic &
industrial
Water
1 2 3A 3B 3C 4 5 6 7
Darjeeling 46957 1700 807 2507 5.34 1719 43539
Jalpaiguri 237259 6635 3700 10335 4.36 5957 224667
Coochbehar 208500 31081 3702 34783 16.68 5006 172412
Uttar Dinajpur 153686 68657 3608 72265 47.02 5808 79221
Dakshin Dinajpur 87120 39045 2186 41231 47.33 3519 44556
Malda 127128 67237 5142 72379 56.93 8278 51613
Murshidabad 227038 191893 8944 200837 88.46 183003 16842
Nadia 195511 166677 6266 172943 88.46 9320 19513
24-Parganas (North) 141876 94066 6939 101005 71.19 10859 36951
Howrah 33330 5096 1774 6870 20.61 2421 25813
Hooghly 152640 53047 6047 59094 38.71 8419 91175
Burdwan 303295 123679 8221 131900 43.49 12187 5622 167429
Bankura 189926 52097 4742 56839 29.93 6376 131453
Purulia 70147 6000 3666 9666 13.78 4940 59207
Birbhum 152612 34887 4472 39359 25.79 6073 111651
Purba Medinipur 74341 26034 2847 28881 38.85 3965 44342
Paschim Medinipur 344447 116340 7507 123847 35.96 10453 217654
Additional
Ground
Water
Draft for
mining
activity
Net ground
water
availability
for future
irrigation
development
beyond
March, 2004
Existing Ground Water
Draft for All Uses
District Net Annual
Ground
Water
Availability
Total Stage of
Ground
Water
Develop
ment (%)
Allocation
for domestic
and
industrial
water supply
requirement
for next 25
years from
April,2004

248
Appendix 10
District Wise Categorization of Blocks by Exploitation and Quality
District Total
No. of
Blocks
Blocks
with
GW
Data
Blocks Classified as Arsenic
Effected
Blocks
Fluoride
Effected
Blocks
Safe
Semi Critical
Critical
Darjeeling 12 2 0 0 0
Jalpaiguri 13 8 0 0 0
Coochbehar 12 12 0 0 1
Uttar
Dinajpur
9 9 1 0 0 7
Dakshin
Dinajpur
8 8 7 0 7 4
Maldah 15 15 7 4 0 22 0
Murshidabad 26 26 22 1 0 9
Birbhum 19 19 9 0 5 0
Bardhaman 31 29 5 0 17 0
Nadia 17 17 17 0 17 0
24
Parganas(N)
22 17 17 0 1 0
Hoogly 18 18 1 0 0 12
Bankura 22 22 12 0 0 15
Purulia 20 20 15 0 0 0
Purba
Medinipur
25 10 0 0 0
Paschim
Medinipur
29 28 0 0 0
Howrah 14 5 0 0 0
West Bengal 341 265 227 37 1 69 48
Source : SWID

249
Appendix 11
Financial and physical targets for water resource development
Financial Target and achievement
Rs. in Crore
Major heads Annual Plan
2012-13
Annual Plan
2013-14
Annual Plan
2014-15
Annual
Plan
2015-16
Approve
d outlay
Actual
expendit
ure
Approv
ed
outlay
Actual
expendit
ure
Approve
d outlay
Actual
expendit
ure
Approved
outlay
Minor Irrigation,
AIBP,& other,
WBADMIP,
ACA, RKVY,
OCASPS,CAD
&WM, GTA,
etc.
369.91
114.67
422.44
131.02
466.52
381.67
528.00
Physical Target and achievement
Major Heads Annual Plan
2012-13
Annual Plan
2013-14
Annual Plan
2014-15
Annual
Plan
2015-16
Target Achieve
ment
Target Achieve
ment
Target Achieve
ment
Target
Minor Irrigation,
AIBP,& other,
WBADMIP,
ACA, RKVY,
OCASPS, GTA,
.(irrigation
potential in ha)
63000 21018 50000 23171 45000 72287 62000
CAD&WM
(CCA in ha)
15300 6350 10000 2513 10000 6337 5500
Source : SWID

250
Appendix 12
Major horticulture crops growing districts
Crops Districts Scope
FRUITS
Banana Jalpaiguri, CoochBehar, Nadia, 24 Pgs
(S), 24 Pgs (N), Hooghly, Bardhaman,
Midnapore (West & East), Murshidabad,
Dakshin Dinajpur, Malda, Birbhum,
Bankura
Area available for further
expansion.
Guava Nadia, 24 Parganas (N & S), Birbhum,
Midnapore (W & E), Purulia, Bankura,
Bardhaman, Cooch Behar
Area available for further
expansion.
Litchi Malda, Murshidabad, 24 Parganas (N &
S), Uttar Dinajpur, Cooch Behar
Area available for further
expansion.
Mango Malda, Murshidabad, 24 Parganas (N &
S), Midnapore (W & E), Purulia,
Bankura, Birbhum, Hooghly, Howrah,
Nadia, Uttar Dinajpur, Dakshin Dinajpur
Area available for further
expansion.
Papaya 24 Parganas (N & S), Jalpaiguri,
Murshidabad, Nadia, Hooghly, Bankura,
Purulia, Midnapore (W & E), Bardhaman
Area available for further
expansion.
Pineapple Darjeeling, Jalpaiguri, Cooch Behar,
Uttar Dinajpur, 24 Parganas (N & S),
Midnapore (W & E)
Area available for further
expansion.
VEGETABLES
Brinjal Nadia, Murshidabad, North & South 24
Parganas, Malda, Jalpaiguri, Cooch
Behar
Area available for further
expansion.
Cabbage Paschim Medinipur, 24 Parganas, North
24 Parganas, Nadia, Murshidabad
Area available for further
expansion.
Cauliflower Paschim Midnapore, Bankura, Nadia,
Murshidabad, North & South 24 Parganas
Area available for further
expansion.
Okra (Ladies
Finger)
Nadia, Murshidabad, North & South 24
Parganas, Bardhaman
Area available for further
expansion.
Onion Hooghly, Murshidabad, Nadia, North 24
Parganas
Area available for further
expansion.
Peas Nadia, Hooghly, 24 Parganas (N & S) Area available for further
expansion.
Tomato Murshidabad, Nadia, North 24 Parganas, Area available for further

251
South 24 Parganas, Jalpaiguri, Cooch
Behar
expansion.
Potato Hooghly, Bardhaman, Howrah, Paschim
Midnapore, Bankura
Area available for further
expansion.
FLOWERS
Loose Howrah, Hooghly, 24 Parganas (N & S),
Jalpaiguri, Purba Medinipur,
Murshidabad, Malda, Bankura, Paschim
Medinipur, Cooch Behar, Uttar Dinajpur,
Dakshin Dinajpur, Bardhaman
Area available for further
expansion.
Cut Jalpaiguri, Nadia, Murshidabad, Purba
Medinipur, 24 Parganas (N & S),
Birbhum, Hooghly, Howrah, Malda,
Bankura, Paschim Medinipur, Cooch
Behar, Uttar Dinajpur, Dakshin Dinajpur,
Bardhaman
Area available for further
expansion.
Bulbous Darjeeling Area available for further
expansion.
PLANTATION
Areca Nut Jalpaiguri, Cooch Behar, 24 Parganas (N
& S), Howrah, Nadia, Darjeeling, Malda,
Alipurduar
Area available for further
expansion.
Coconut Bankura, Birbhum, Bardhaman, Cooch
Behar, Darjeeling, Hooghly, Howrah,
Malda, Jalpaiguri, South 24 Parganas,
Alipurduar
Area available for further
expansion.
Cashewnut Midnapore (East & West), Purulia Area available for further
expansion.
Betelvine 24 Parganas (S), Malda, Nadia, Cooch
Behar, Murshidabad, Jalpaiguri,
Alipurduar
Area available for further
expansion.
SPICES
Garlic Cooch Behar, Jalpaiguri, Alipurduar Area available for further
expansion.
Ginger Cooch Behar, Jalpaiguri, North 24
Parganas, Alipurduar
Area available for further
expansion.
Turmeric Cooch Behar, Jalpaiguri, North 24
Parganas, Alipurduar
Area available for further
expansion.
Red Chilli South 24 Parganas, North 24 Parganas Area available for further
expansion.

252
Appendix 13
IWMP Projects in the State of West Bengal
Batch Batch III Batch IV Batch V Batch VI
Total Sanction Year 2011-12 2012-13 2013-14 2014-15
(Pending)
Alipurduar 4 1 5
Bankura 15 6 2 2 25
Birbhum 4 3 9 2 18
Burdwan 1 1 2
Cooch Behar 5 5 5 15
Dakshin Dinajpur 6 6
Darjeeling 7 6 1 14
Jalpaiguri 4 1 5 10
Malda 7 7
Murshidabad 7 7
North 24 Parganas 1 3 1 5
Paschim Medinipur 16 5 10 31
Purba Medinipur 8 8
Purulia 13 7 10 30
South 24-Parganas 7 5 4 16
Uttar Dinajpur 8

253
Appendix 14
The Achievements of IWMP in West Bengal
Sl.
No.
Physical Activities Achievements
1 Formation of Self Help Groups (SHG) 10,567 Nos.
2 Total number of SHG members 68,414 Nos.
3 Formation of User Groups (UG) 1418 Nos.
4 Total number of UG members 16543 Nos.
5 Training Programme organized including capacity building. 3449 Nos.
6 Number of persons trained including capacity building. 1,08,901 Nos.
7 Number of Entry Point Activities (EPA) completed. 5464 Nos.
8 Number of water extracting units created under Entry Point Activities
(EPA)
1073 Nos.
9 Culturable wastelands developed & converted into agricultural lands
additionally.
88 Ha.
10 Afforestation on wastelands 84.36 Ha.
11 In-situ moisture conservation through field bunding, trenching,
graded bunding etc.
311 Ha.
12 Earthen Checks, Gully Plugging, Loose Boulder structures, others. 609.5 Ha.
13 Newly excavated water bodies like Farm ponds, WHS, Rainwater
Harvesting structures, land shaping etc.
341 Nos.
14 Re-excavation of existing water bodies like like Farm ponds, WHS,
Rainwater Harvesting structures, land shaping etc.
723 Nos.
15 Additional rainwater storage capacity created through excavation of
new water bodies.
259796.67 cum
16 Additional rainwater storage capacity created through re- excavation
of existing water bodies.
654851.43 cum
17 Additional irrigation potential created through excavation and re-
excavation of different water bodies under IWMP.
980.84 Ha.
18 Numbers of Livelihood Activities for asset less persons. 256 Nos.
19 Number of beneficiaries under Livelihood Activities. 2449 Nos.
20 Number of activities under Production System & Micro-enterprises. 1244 Nos.
21 Number of beneficiaries under Production System & Micro-
enterprises.
6120 Nos.
22 Number of activities taken up under Fisheries. 145 Nos.
23 Number of beneficiaries under Fisheries. 251 Nos.
24 Number of activities taken up under Poultry. 68 Nos.
25 Number of beneficiaries under Poultry. 68 Nos.
26 Number of activities taken up under Sericulture. 4 Nos.
27 Number of beneficiaries under Sericulture. 280 Nos.
28 Total number of beneficiaries under IWMP till 31/03/2015 203026 Nos.

254
Appendix 15
Changes in some agriculturally important weather components in India
over the last 60 years
Weather component 1951-52
to
1967-68
1968-69
to
1980-81
1981-82
to
1990-91
1991-92
to
1996-97
1997-98
to
2001-02
2002-03
to
2006-07
2007-08
to
2011-12
Mean Annual Rain fall
(cm)
122.5
(12.5)
118.7
(10.2)
120.1
(11.5)
121.0
(7.2)
118.8
(8.3)
113.7
(9.4)
117.7
(10.0)
Mean Monsoon Rainfall
(cm))
91.9
(10.1)
88.8
(9.6)
88.8
(11.0)
90.0
(6.5)
87.8
(5.5)
83.9
(7.9)
86.6
(9.7)
Source: Climate bulletin and other publications of Meteorology Department and XIIth Five Year
Plan document, Govt. of India
Appendix 16
District wise Mulberry Sericulture Status (2014-2015)
Sl.
No. Name Of District
Cumulative
Area of
Plantation
(in Acre) as
on
01/04/2015
Production
of Com.
DFLs (in
Lakh)
Rearing of
Com. DFLs
(in Lakh)
Production
of Com.
Cocoons
(MT)
Production
of Raw Silk
(MT)
Production
of Raw Silk
Waste (MT)
Addl.
Employment
(in No.)
1 Kalimpong 299.25 2.19 0 0 0 0 240
2 Darjeeling (hill) 166.12 0 0 0 0 0 144
3 Darjeeling Plain 204.26 6.215 0 0 0 0 174
4 CoochBehar 607.23 1.341 0.168 6.276 0 0 601
5 Jalpaiguri 866.88 1.64 0 0 0 0 503
6 U. Dinajpur 982.14 0.4475 0.39 12.93 0 0 525
7 D. Dinajpur 435.66 0.22 0.27 8.88 0 0 395
8 Malda 20982.39 389.4435 397.65 16,088.12 1724.967 584.59 1570
9 Murshidabad 5838.20 101.05 102.96 4,356.54 463.57 157.21 2414
10 Nadia 1740.64 2.595 4.19 159.61 0 0 1311
11 24 Parganas 197.00 0 0.095 2.87 0 0 193
12 Midnapore 481.74 2.0548 0.44 12.43 0 0 214
13 Purulia 164.00 0.084 0 0 0 0 56
14 Bankura 276.50 0.529 0 0 0 0 208
15 Burdwan 40.50 0 0.0275 0.762 0 0 60
16 Birbhum 4601.01 66.538 68.168 2,504.85 261.82 90.7 2371
Total 37833.52 574.34849 574.343 23153.262 2450.36 832.5 10978

255
Appendix 17
-District wise Tasar Sericulture Status (2014-2015)
Appendix 18
District wise Muga Sericulture Status (2014-2015)
Appendix 19
District wise Eri Sericulture Status (2014-2015)
Sl.
No.
Name Of
District
Cumulative Area of
Plantation (in Acre)
as on 01/04/2015
Production
of DFLs
(in Lakh)
Rearing
of DFLs
(in Lakh)
Production
of Cocoons
( MT)
Production
of Spun
Silk (MT)
Addl.
Employment
(Nos.)
1 Jalpaiguri 1,582.00 0.934 0.927 6.7710 5.9116 200
2 Dakshin
Dinajpur
98.63 0.082 0.0876 0.6086 0 20
3 24
Parganas
168.50 0.019 0.021 0.1365 0.1090 16
TOTAL 1,849.13 1.03532 1.03532 7.5161 6.02 236
SL.
NO
NAME OF
DISTRICT
Cumulative
Area of
Plantation
(in Acre) as
on
01/04/2015
Production
of DFLs (in
Lakh)
Rearing of
DFLs (in
Lakh)
Production
of Cocoons
(in Kahan)
Production
of Raw Silk
(in MT)
Production
of Silk
Waste (in
MT)
Addl.
Employment
(in Nos.)
1 Murshidabad 0.00
2 Midnapore 2261.31 1.74 1.976 8679.01 0 0 140
3 Purulia 5672.20 1.06065 1.3634 5832.51 8.5 4.25 152.94
4 Bankura 6715.00 4.93 5.03736 23416.702 25.2 12.6 350
5 Burdwan 934.80 0 0.051 226 0 0 38
6 Birbhum 1404.65 0.95 0.253 1078.94 9.35 4.675 53
16997.96 8.6808 8.6808 39,233.16 43.05 21.525 734TOTAL
Sl. No.
Name Of
District
Cumulative
Area of
Plantation
(in Acre) as
on
01/04/2015
Production
of DFLs (in
Lakh)
Rearing of
DFLs (in
Lakh)
Producti
on of
Cocoons
(MT)
Producti
on of
Raw Silk
(in kg)
Producti
on of
Raw Silk
Waste
(in kg)
Addl.
Employment
(in Nos.)
1 Kalimpong 168 0.07068 0.02416 0.8519 0 0 20
2
Darjeeling
(Hill) 96 0.00218 0.00441 0 0 0 18
3
Darjeeling
(Plain) 0 0 0 0 0 0 0
4
Cooch
Behar 995 0.29588 0.325 12.365 239.13 120 79
5 Jalpaiguri 283 0.05077 0.06594 1.9067 32 15 12
6
Uttar
Dinajpur 0 0 0 0 0 0 0
1,541.00 0.41951 0.41951 15.12 271.13 135 129TOTAL

256
Appendix 20
Silk Production and Target during XIIth Five Year Plan
MULBERRY
YEA
R
Planta
tion
area
(ha)
DFLs (Lakh Nos) REELING COCOON (MT) RAW SILK (MT) #
B
V
C
B
IC
B
CB(
Tota
l)
Total B
V
CB ICB CB(Tot
al)
Total B
V
C
B
IC
B
CB(
Tota
l)
TO
TA
L
2012
-
2013
730 1.
00
515 40 10 200
0
2013
-
2014
730 1.
25
525 50 12 210
0
2014
-
2015
770 1.
50
540 60 14 220
0
2015
-
2016
600 4.
45
18
0.
55
380
.00
560.
55
565.0
0
20
0.
25
577
7.6
171
00
22877.6
0
23077
.85
25 59
0
183
5
2425 245
0
2016
-
2017
650 5.
25
16
0.
00
434
.75
594.
75
600.0
0
26
2.
5
560
0.0
0
208
68
26468.0
0
26730
.50
33 57
2
224
5
2817 285
0
# Besides indigenous production, it includes production of BV/CB Silk out of cocoon to be procured from outer States
TASAR
YEAR PLANTATION
AREA (ha) DFLs
(Lakh Nos)
REELING
COCOON
(Lakh Nos)
RAW SILK
(MT)
2012-13 200 8.5 0.330 40
2013-14 200 9.0 0.346 42
2014-15 200 9.5 569.9968 45
2015-16 200 9.5 569.9968 45
2016-17 200 10.0 599.9966 47
ERI
YEAR PLANTATION
AREA
(ha)
DFLs
(Lakh Nos)
CUT COCOON
(MT)
SPUN SILK
(MT)
2012-13 80 2.00 18 14
2013-14 80 2.00 20 16
2014-15 80 1.63 14.62 12
2015-16 80 1.65 14.8 12.15
2016-17 100 1.75 15.6 12.8
MUGA
YEAR PLANTATION
AREA
(ha)
DFLs
(Lakh Nos)
REELING
COCOON
(Lakh Nos)
RAW SILK
(MT)
2012-13 40 1.00 40 0.8
2013-14 40 1.25 50 1.0
2014-15 40 0.82 23 0.5
2015-16 40 0.90 25 0.54
2016-17 45 1.00 30 0.64

257
Appendix 21
District-wise Forest-cover of West Bengal
District Geographical
area
Very Dense
forest
Moderately
dense forest
Open
forest Total
Percent of
GA
Bankura 6882 222 365 657 1244 18.08
Bardhaman 7024 61 89 169 319 4.54
Birbhum 4545 1 30 145 176 3.87
Kolkata 185 0 0 0 0 0.00
Coochbehar 3387 0 27 321 348 10.27
Dakshin
Dinajpur
2219 0 5 82 87 3.92
Darjeeling 3149 724 650 1004 2378 75.52
Howrah 1467 0 50 254 304 20.72
Hooghly 3149 0 14 146 160 5.08
Jalpaiguri 6227 720 440 1703 2863 45.98
Malda 3733 0 214 290 504 13.50
Medinipur 14081 218 802 1964 2984 21.19
Murshidabad 5324 0 54 294 348 6.54
Nadia 3927 1 159 319 479 12.20
North 24
Parganas
4094 13 185 527 725 17.71
Purulia 6259 31 308 530 869 13.88
South 24
Parganas
9960 980 752 1042 2774 27.85
Uttar Dinajpur 3140 0 2 241 243 7.75
TOTAL 88752 2971 4146 9688 16,805 18.93
Source : Annual Report, 2013-14, Dir. of Forest, Govt. of West Bengal

258
APPENDIX – B
District Profile

259
West Bengal District Profile
There are 19 districts in West Bengal (other than Kolkata metropolitan district) viz. Alipurduar,
Cooch Behar, Darjeeling, Jalpaiguri, Malda, Murshidabad, Nadia, North 24 Parganas, South 24
Parganas ,Uttar Dinajpur, Dhaskin Dinajpur, Hooghly, Howrah, Paschim Medinipur, Purba
Medinipur, Purulia, Bankura, Birbhum and Burdwan. The characteristic features of the districts
are briefly described below.
ALIPURDUAR
Alipurduar is the 20th district of West Bengal created on 25th June, 2014. It shares border with
the western part of Jalpaiguri District & eastern part of Assam State and is close to International
borders with Bhutan in the North & South. It lies between 26029N & 89034E to 26.480 N
89.570E. It has geographical areas measuring 3383km2 (1306 sq mile) and population of the
district is almost 17.00 lakh. It consists of two municipalities viz. Alipurduar and Falakata and
six community development blocks: Madarihat–Birpara, Alipurduar–I, Alipurduar–II, Falakata,
Kalchini and Kumargram. The six blocks contain 66 gram panchayats and nine census towns.
The district has its headquarters at Alipurduar. It comprises chiefly of a rural population. More
than 80 per cent of its total population belongs to SC/ST community. The topography of the land
is cut across by rivers, rivulets and hills, and covered with tea gardens and forests. The salient
features of the district are given in the Table.
Salient Features of Alipurduar District
Total Geographical area (sq. km) 3383
No. of Blocks 6
No. of villages (inhabited) 282232
No. of Panchayats 66
Forest land (ha) 73439.6
Degraded land (ha) 40,000 – 45,000
Net sown area (ha) 95760
Crop intensity (GC/NSA) % 194
Total population (in ‘000) 1426
Population density (Nos. per sq. km) 19

260
Male population (in ‘000) 732.4
Female population (in ‘000) 693.6
SC Population (in ‘000) 444.9
ST Population (in ‘000) 381.6
Literate population (in ‘000) 908.6
Marginal holdings (<= 1ha) 158389 (95.11%)
Small holdings (1-2 ha) 6743 (4.05%)
Medium + large holdings (>2ha) 1395 (0.84%)
Total holdings 166527
Average Normal Rainfall (mm) 3165
Average Normal Temperature (0C) 10.80C - 30.90C
. Alipurduar is a multi-lingual district of West Bengal where Bengali, Hindi, English,
Sadri, Oraon, Munda, Kharia, Boro, Santal languages are spoken and different communities of
Tribes are found here. It is virtually a cauldron of different ethnic tribes like the Rajbanshi,
Rabha, Metch, Santhals, Madasia, Bodo and Toto & Oraons. The tribe TOTO is found only in
this district and it is significant that this human species is getting abolished gradually.
The Alipurduar district has rich bio-diversity in both flora and fauna and has immense
and natural beauty which may aid in future development of this district. The dominant
agricultural products of the district are jute and tobacco. Common plantation crops of the district
are arecanut, coconut and black pepper. The district is familiar with vegetable and fruit
production throughout the year. A major part of the district is covered with tea gardens and
forests.
Alipurduar District enjoys a humid tropical climate with an average air temp. 24.1oC and
average annual rainfall of 3160 mm to 3500 mm. Major portion of rainfall is drained through
surface of land and run into large number of rivers or rivulets, more or less 80 to 92 in number
that runs across the districts. The major rivers in the districts are: Torsa, Jaldhaka, Raidak,
Sankosh, Kaljani, Gadadhar, etc. Soil of this district is sandy loamy and loose textural class
which is prone to soil erosion and less water holding capacity. Soil is deficient in organic matter
and devoid of loamy clay. Soil is most permeable to water and nutrient leaches down quickly.

261
The characteristics of soil coupled with heavy rainfall increases the vulnerability of the
agricultural land and other land into erosion. There are problems of sand deposition along with
debris & stone due to occasional change of river courses and occurrence of flood in each year.
BANKURA
Bankura is located in the western part of the state, which is popularly known as ‘Rarh’ Region
from time immemorial. It is situated between 22038 and 23038’ north Latitude and between
86036’ and 87047’ east Longitude. It is drained by Damodar, Dwarakeswar and Kangsabati
river along with their tributaries of which Gandheswari, Silai and Kumari deserve separate
mention. This district has a moderate deposit of Coal and a number of good deposits of China
Clay. The Headquarters of Bankura district is at Bankura, The salient feature of the district.
The salient features of the district are given in Table.
Table. Salient features of Bankura district
Total Geographical area (sq. km) 6882
No. of Sub-divisions 3 nos.
No. of Blocks* 22
No. of villages (inhabited) 5187
No. of Panchayats 190
Area reported (ha) 68100
Forest land (ha) 148350
Area not available for cultivation (ha) 109621
Permanent pasture and grazing land (ha) 633
Land under miscellaneous tree and fruit crops (ha) 5366
Cultivable waste land (ha) 2337
Current fallow (ha) 20973
Other fallow (ha) 1386
Net sown area (ha) 396131
Gross cropped area (ha) 560555
Area cultivated more than once (ha) 164424
Crop intensity (GC/NSA) % 141.5
Total area available for irrigation (NIA + Fallow (ha) 419055
Net irrigated area (Area irrigated at least once) (ha) 354130
Total population (in ‘000) 3599
Population density (Nos. per sq. km) 520
Male population (in ‘000) 1842
Female population (in ‘000) 1757
Rural population (in ‘000) 3364

262
Urban population (in ‘000) 235
SC population (in ‘000) 997
ST population (in ‘000) 331
Population density (Nos. per sq. km) 520
Marginal holdings (<= 1ha) 278411 (68%)
Small holdings (1-2 ha) 85292(21%)
Medium + large holdings (>2ha) 44325
Total holdings 408031
Average Normal Rainfall (mm) 1423
Average Normal Temperature 0C 270 – 450C
*Blocks: Bankura Sadar (North) Sub-division (8Nos.)- Bankura-I, Bankura-II, Chhanta, Saltora,
Meihia, G. Ghati, Baruora, Onda; Khatra Sub-division (8 Nos.): Indpur, Khatra, Hirbandh,
Ranibandh, Taldangra, Simlapal, Raipur, Sarenga; Bishnupur Sub-division: Bisnupur,
Sonamukhi, Patrasayer, Indus, Youpur, Kotulput
Soils: Soil of Bankura district can be broadly grouped into three principal types viz. (1) Red Soil
(2) Alluvial Soil and (3) Laterite Soil. According to the land situation, lands are classified as
High (168462.00 ha), Medium (177325.80 ha) and Low (77409.65 ha) lands. The soils are
mostly loamy in texture and the land is characterized by undulating topography
BIRBHUM
Birbhum is situated in the “Rarh Region” on the western side of West Bengal. The district lies
between 23˚32'30”and 24˚35'0” North Latitude and 88˚01'40”and 87˚05'25” East Latitude. The
land is drained by the rivers and rivulets, most of which are originated from the Chhotonagpur
hills. Major rivers are Ajoy, Mayurakshi, Hinglow, Bansloi, Kopai, Bakreswar, Siddheswar.
Brahamani, Dwarka etc. The salient features of the district is given Table II/5
Table. Salient features of Birbhum district
Total Geographical area (sq. km) 4511
No. of Sub-divisions 3 Nos.
No. of Blocks* 19 Nos,
No. of villages (inhabited) 2232
No. of Panchayats 167
Area reported (ha) 45118
Forest land (ha) 15833
Area not available for cultivation (ha) 91711

263
Permanent pasture and grazing land (ha) 382
Land under miscellaneous tree and fruit crops (ha) 1571
Cultivable waste land (ha) 3528
Current fallow (ha) 143578
Other fallow (ha) 3360
Net sown area (ha) 320611
Gross cropped area (ha) 421420
Area cultivated more than once (ha) 90907
Crop intensity (GC/NSA) % 131.4
Total area available for irrigation (NIA + Fallow (ha) 374707
Irrigation potential created (ha) 329258
Net irrigated area (Area irrigated at least once) (ha) 231129
Total population (in ‘000) 3502
Population density (Nos. per sq. km) 770
Male population (in ‘000) 1791
Female population (in ‘000) 1711
Rural population (in ‘000) 3054
Urban population (in ‘000) 448
SC Population (in ‘000) 1033
ST Population (in ‘000) 236
Literate population (in ‘000) 2175
No. of BPL (in ‘000) 1482
Marginal holdings (<= 1ha) 200265 (69%)
Small holdings (1-2 ha) 63374 (22%)
Medium + large holdings (>2ha) 26173 (9%)
Total holdings 289776
Average holding (ha) 0.98
Average Normal Rainfall (mm) 1431
Average Normal Temperature 0C Max. 430C, Min. 7˚C
* Blocks: Rampurhat Sub-Div.- Nalhati-I, Nalhati-II, Murarai-I, Murarai-II, Mayureswar-I,
Mayureswar-II, Rampurhat-I, Rampurhat-II: Sadar Sub-Div.- Md. Bazar, Sainthia, Dubrajpur,
Rajnagar, Suri-I, Suri-II, Khoyrasole,; Bolpur Sub-Div -Bolpur-Sriniketan, Labhpur, Nanoor,
Illambazar
Soil and Agro-climate
Soil is normally well drained, susceptible to soil erosion due to rapid external drainage or runoff,
soil reaction ranges from acidic in ridge and near neutral in valleys, base saturation, and organic

264
carbon content, phosphate and potash are significantly low at ridge but increases down the slope
especially at valley.The land is is characterized by undulating topography. The land situation is
gradually slopped down from the west to the flat plains. The district lies under three (3) Agro-
climatic Zones of the State namely (1) Gangetic Alluvial Zone, (2) Vindhyan Alluvial Zone, (3)
Undulating Red and Laterite Zone. The predominant textural group of soil is coarse loamy, fine
loamy and fine covering area of 20.0% and 46.7.0% and 23.67% of total cultivated area
respectively. The fertility status of the soil is medium to high. There is problem of flood is
concerned in block areas of Bolpur and Rampurhat sub-divisions during kharif months where
moisture stress problem is also a great concern for Suri (Sadar) subdivision.
The major problems of agriculture are small land holdings, poor marketing facilities,
natural calamities like drought, flood, hailstorm and heavy population pressure on land etc. The
ground water resource of most of the blocks of this district has been overexploited and ground
water level is declining day by day. Depletion of ground water table is really a serious problem
to supply water for drinking and for agriculture.
The ground water resource of most of the blocks of this district has been overexploited
and ground water level is declining day by day. Depletion of ground water table is really a
serious problem to supply water for drinking and for agriculture. As a result major emphasis has
been given on rain water harvesting for which several schemes have been introduced.
Distribution of Land Holdings indicates that the numbers of holding under medium and large
category have decreased significantly over time. The average land holding size is also decreasing
day to day.
BURDWAN DISTRICT: The district of Burdwan extends from 22°56' to 23°53' North latitude and from 86°48' to
88°25' East longitudes. The river Barakar forms the State boundary to the west; the Ajay
separates Birbhum and Dumka to the north with exception of a portion of Katwa
subdivision; the Damodar forms a southern boundary with Purulia and Bankura, while
Bhagirathi forms the main eastern boundary with a few exceptions. Burdwan is a well-
balanced district in West Bengal as it has minerals, forests, industry and agricultural lands.
The district is both agrarian as well as industrial on account of its unique positioning. The

265
salient features of the district is presented in Table II/6.
Table. Salient features of Burdwan district
Total Geographical area (sq. km) 7024
No. of Sub-divisions 6
No. of Blocks* 31
No. of villages (inhabited) 2529
No. of Panchayats 277
Area reported (ha) 699
Forest land (ha) 22
Area not available for cultivation (ha) 196
Permanent pasture and grazing land (ha) 0
Land under miscellaneous tree and fruit crops (ha) 1
Cultivable waste land (ha) 8
Current fallow (ha) 8
Other fallow (ha) 5
Net sown area (ha) 465
Gross cropped area (ha) 835
Area cultivated more than once (ha) NA
Crop intensity (GC/NSA) % 180
Total area available for irrigation (NIA + Fallow (ha) 277980
Irrigation potential created (ha) NA
Net irrigated area (Area irrigated at least once) (ha) NA
Total population (in ‘000) 7723
Male population (in ‘000) 3975
Female population (in ‘000) 3748
Rural population (in ‘000) 4644
Urban population (in ‘000) 3079
SC Population (in ‘000) 1860
ST Population (in ‘000) 441
Literate population (in ‘000) 5958
No. of BPL (in ‘000) 3598

266
Population density (Nos. per sq. km) 1100
Marginal holdings (<= 1ha) 325565 (72%)
Small holdings (1-2 ha) 88410 (20%)
Medium + large holdings (>2ha) 38892 (8%)
Total holdings 452867
Average Normal Rainfall (mm) 1442
Average Normal Temperature 0C Min. 9.5 0C and
Max. 39.50C
Soil, topography and Agro Climate
Burdwan district is a part of Ganga-Brahamaputra alluvial plain in the north and east. Different
types of soil are encountered in the district. In the west there is coarse gritty soil blended with
rock fragments. This soil is of reddish colour, medium to coarse in texture, acidic in reaction,
low in nitrogen, calcium, phosphate and other plant nutrients. Water holding capacity of this soil
increases with depth as well as with the increase of clay portions. Towards the east alluvial soil
attains an enormous thickness in the low level plains to the east. These soils are sandy, well
drained and slightly acidic in nature. The land classification according to the location is as: high
land-8622 ha, medium land -241475 ha and low land 22038 ha. The climate is warm temperate
and humid Main crops of the district are autumn rice, winter rice, summer paddy, jute, potato,
mustard and sesame, sugarcane and vegetables out of the said paddy covers about 87 percent in
Kharif and winter paddy 66 percent and potato 13 percent in Rabi season. The average
operational holding of the district is around 1.00 ha (2005-06 estimate)
There are many tanks, wells, canals, swamps and bils are found all over the district.
Within the Damodar Valley region, there are around 17000 tanks. The Durgapur barrage and
Mithon dam have formed two large reservoirs at the south-western and western periphery of the
district. The animal resources of Burdwan is very rich and with a large variety. It rears cattle,
buffalos, sheep, goats, pigs, fowls and ducks. Animal husbandry has good prospects specially in
the western lateritic part of the district.

267
COOCHBEHAR DISTRICT
Coochbehar lies between 25057'47"N and 88047'44" E to 26036'20" N & 89054'35"E. Coochbehar
is situated at north-eastern part of West Bengal; bounded by the district of Jalpaiguri and
Alipurduar in the north and north-west, state of Assam in the east and the International Border of
Indo-Bangladesh boundary in the south and south-west. Beside this bounded area there are
enclaves (called Chhits) which are outlying and detached tracts of land situated inside
Bangladesh. There are 110 such Chhits.
The salient features of Coochbehar are given in Table.
Table. Salient features of Coochbehar district
Total Geographical area (sq. km) 3387
No. of Sub-divisions 5
No. of Blocks 12
No. of villages (inhabited) 1188
No. of Panchayats 128
Area reported (ha) 338700
Forest land (ha) 6000
Area not available for cultivation (ha) 53892
Permanent pasture and grazing land (ha) 81
Land under miscellaneous tree and fruit crops (ha) 9573
Cultivable waste land (ha) 1344
Current fallow (ha) 14816
Other fallow (ha) 36
Net sown area (ha) 1146
Gross cropped area (ha) 246491
Area cultivated more than once (ha) 221591
Crop intensity (GC/NSA) % 215
Total area available for irrigation (NIA + Fallow (ha) 246491
Irrigation potential created (ha) 106000
Total population (in ‘000) 2823

268
Male population (in ‘000) 1454
Female population (in ‘000) 1369
Rural population (in ‘000) 2540
Urban population (in ‘000) 283
SC Population (in ‘000) 1242
ST Population (in ‘000) 15
Literate population (in ‘000) 1880
No. of BPL (in ‘000) 338
Population density (Nos. per sq. km) 833
Marginal holdings (<= 1ha) 315894
(70%)
Small holdings (1-2 ha) 89464 (20%)
Medium + large holdings (>2ha) 43542 (10%)
Total holdings 448900
Average Normal Rainfall (mm) 5348.8mm
Average Normal Temperature 0C 3.90C-39.90C
The Coochbehar district has rich bio-diversity in both flora and fauna and has immense
and natural beauty which may aid in future development of this district. The dominant
agricultural products of the district are jute and tobacco. Common plantation crops of the district
are arecanut, coconut and black pepper. The district is familiar with vegetable and fruit
production throughout the year. A major part of the district is covered with tea gardens and
forests.
Soil and Agro-climate
The topography of the land is cut across by rivers, rivulets and hills. Soil of this district is sandy
loamy and loose textural class which is prone to soil erosion and less water holding capacity.
Soil is deficient in organic matter and poor in clay content. Soil is highly permeable to water and
nutrient leaches down quickly. The characteristics of soil coupled with heavy rainfall increases
the vulnerability of the agricultural land and other land into erosion. There are problems of sand
deposition along with debris & stone due to occasional change of river courses and occurrence of
flood in each year. The common forms of erosion are flash, sheet, rill, gully and ravine and
stream bank erosion. The climate is a humid tropical.

269
DAKSHIN DINAJPUR DISTRICT
The Dakshin Dinajpur district lies between 26035’15” and 25010’55” North Latitude and
89o0’30” and 87o48’37” East longitude. The district is encircled on three sides by Indo-
Bangladesh international border (approx.. 252 km) with ‘Hilli’ as international border check
post. Among the total 08 blocks of the district, 06 blocks are bordering the international
borderline of Indo-Bangladesh border. Balurghat is the district head quarter. The district is criss-
crossed by nos. of north and south flowing rivers like Atreyee, Punarbhava, Tangon, Yamuna
etc. Most of the rivers and rivulets these rivers flow from North to South and originate from
Bangladesh. Dakshin Dinajpur is predominantly an agricultural district with large area of land
being under cultivation. The salient features of the district is given in Table
Table. Salient features of Dakshin Dinajpur district
Total Geographical area (sq. km) 2219
No. of Sub-divisions* 2
No. of Blocks* 8
No. of villages (inhabited) 1637
No. of Panchayats 65
Area reported (ha) 221909
Forest land (ha) 932
Area not available for cultivation (ha) 34171
Permanent pasture and grazing land (ha) 43
Land under miscellaneous tree and fruit crops (ha) 1160
Cultivable waste land (ha) 30
Current fallow (ha) 1590
Other fallow (ha) 410
Net sown area (ha) 17562
Gross cropped area (ha) 33973
Area cultivated more than once (ha) 160353
Crop intensity (GC/NSA) % 191
Total area available for irrigation (NIA + Fallow (ha) 19562

270
Irrigation potential created (ha) 82541
Total population (in ‘000) 1670
Population density (Nos. per sq. km) 750
Male population (in ‘000) 855
Female population (in ‘000) 815
Rural population (in ‘000) 1434
Urban population (in ‘000) 236
SC Population (in ‘000) 433
ST Population (in ‘000) 242
Literate population (in ‘000) 1233
No. of BPL (in ‘000) 469
Population density (Nos. per sq. km) (2011 census) 753
Marginal holdings (<= 1ha) 157078
Small holdings (1-2 ha) 40049
Medium + large holdings (>2ha) 16880
Total holdings 214007
Average Normal Rainfall (mm) 1755
Average Normal Temperature 0C 20.40-31.40C
*Balurghat sub-division- Blocks: Balughat, Tapan, Kumarganj and Hilli. Gangarampur sub-
division- Blocks: Gangarampur, Harirampur, Kushmandi and Banshihari
Soil and Agro-Climatic Characteristics :
Geologically, Dakshin Dinajpur district is of mostly plain land consists of entirely of
alluvial and situated in the old alluvial agro-climatic zone of West Bengal. Few parts of the
district are also in red and lateritic zone. The soils are light medium and heavy texture, upland
being lighter and medium and low lands being heavier. The soils consists of ash coloured, clay
silt, locally called khiar. The characteristics features of these zone is inundation caused by
sudden heavy rainfall due to lake of proper drainage facilities. The soils are low in Nitrogen,
Phosphorus and Potassium content (N, P, K). The district Dakshin Dinajpur has moderate type
of climate. The maximum temperature varies from 20o-37oC and minimum temperature 09o-04o
C with average humidity 80-92% .

271
DARJEELING DISTRICT
Darjeeling district located between 260 27’ 10’’ and 27013’05’’ North Latitude and between
87059’30’’ and 88053’ 0’’ East longitude. Although Darjeeling is known as a popular tourist
destination only but agriculture is one of the major ways of livelihood of the rural people. The
salient features of the district is presented in Table.
Table. Salient features of Darjeeling district
Total Geographical area (sq. km) 3149
No. of Sub-divisions* 4
No. of Blocks* 12
No. of villages (inhabited) 640
No. of Panchayats 134
Area reported (ha) 325469
Forest land (ha) 124576
Area not available for cultivation (ha) 40527
Permanent pasture and grazing land (ha) 830
Land under miscellaneous tree and fruit crops (ha) 2350
Cultivable waste land (ha) 1487
Current fallow (ha) 16437
Other fallow (ha) 3216
Net sown area (ha) 133582
Gross cropped area (ha) 195832
Area cultivated more than once (ha) 62250
Crop intensity (GC/NSA) % 147
Total area available for irrigation (NIA + Fallow
(ha)
11474
Irrigation potential created (ha) 6609
Net irrigated area (Area irrigated at least once) (ha) 3391
Total population (in ‘000) 1842
Male population (in ‘000) 935
Female population (in ‘000) 907

272
Rural population (in ‘000) 1124
Urban population (in ‘000) 718
SC Population (in ‘000) 259
ST Population (in ‘000) 204
Literate population (in ‘000) 1328
No. of BPL (in ‘000) 607
Population density (Nos. per sq. km) 590
Marginal holdings (<= 1ha) 74719
Small holdings (1-2 ha) 13876
Medium + large holdings (>2ha) 3406
Total holdings 92001
Average Normal Rainfall (mm) 3092
Average Normal Temperature 0C 8.70 – 14.70C
*The subdivisions are Sadar, Kalimpong, Kurseong, and Siliguri
Soil and agro-climate: Mainly brown forest soil acidic in nature (pH 3.5-5.5), annual rainfall
varies from 2500-3500 mm, high humiddty, late sunshine hours, poor soil depth which limits
crop productivity. Pre-monsoon showers commences from March.
HOOGHLY DISTRICT
The district of Hooghly extends between 20°30′32″ and 23°1′20″ North latitude to between
87°30′20 and 88°30′15″ East longitude . In spite of the fact that, Hooghly is one of the most
important industrial districts of West Bengal, its basic rural characteristics still remains where
not less then 70% of its total population depends on Agriculture. The major crops are: rice,
potato, jute, vegetables, oilseeds, wheat and pulses. The salient features of the district is
presented in Table.
Table. Salient features of Hooghly district
Total Geographical area (sq. km) 3149
No. of Sub-divisions 4

273
No. of Blocks* 18
No. of villages (inhabited) 1886
No. of Panchayats 207
Area reported (ha) 314900
Forest land (ha) 649
Area not available for cultivation (ha) 96615
Permanent pasture and grazing land (ha) 8
Land under miscellaneous tree and fruit crops (ha) 1588
Cultivable waste land (ha) 1518
Current fallow (ha) 594
Other fallow (ha) 119
Net sown area (ha) 223390
Gross cropped area (ha) 513797
Area cultivated more than once (ha) 193425
Crop intensity (GC/NSA) % 230
Total area available for irrigation (NIA + Fallow (ha) 169761
Irrigation potential created (ha) 44336
Net irrigated area (Area irrigated at least once) (ha) 168924
Total population (in ‘000) 5519
Male population (in ‘000) 2815
Female population (in ‘000) 2704
Rural population (in ‘000) 3391
Urban population (in ‘000) 2128
Literate population (in ‘000) 4526
Population density (Nos. per sq. km) 1753
Marginal holdings (<= 1ha) 293535 (86 %)
Small holdings (1-2 ha) 40363 (12 %)
Medium + large holdings (>2ha) 8633 (2 %)
Total holdings 342531
Average Average Normal Rainfall (mm) 1476
Average Average Normal Temperature 0C !50C - 350C

274
Soil and Agro-climate
The soils in the district are of Gangetic alluvial soil and Vindhya alluvial. But the predominant
group is Gangetic alluvial. The soil are fertile and cropping intensity is about 241%. Eighty
percent of the soils are sandy loam to loam and clay to clay loam soils are existing only in 20%
of the area. Two types of agro-climate is prevailing iconstitute this district viz. (1) Gangetic
Alluvial,(2) Vindhya Alluvial. Flood is the problem in some of the area, particularly in Balagarh
and Arambagh subdivisions.
HOWRAH DISRICT
Howrah smallest district in West Bengal is situated between 22012'30" and 22°46'55"
north latitude and 88°22'10" and 87°50'45" east longitude. Although one part of the district
is fully engaged with industrial activities the other part is still retaining its basic rural
characteristics with over 60% of its total population depending on Agriculture and its
position as one of the important producers of cereals in the State. The district is surrounded by
the Rivers Hooghly and Mundeswari-Rupnarayan in the east, west and south and several rivers
like Damodar and canals are also flowing through the district. The salient feature of the district is
depicted in Table.
Table. Salient features of Howrah district
Total Geographical area (sq. km) 1467
No. of Sub-divisions 2
No. of Blocks* 14
No. of villages (inhabited) 734
No. of Panchayats 157
Area reported (ha) 138676
Forest land (ha) nil
Area not available for cultivation (ha) 49672
Permanent pasture and grazing land (ha) 19
Land under miscellaneous tree and fruit crops (ha) 1081

275
Cultivable waste land (ha) 60
Current fallow (ha) 5308
Other fallow (ha) 234
Net sown area (ha) 82186
Gross cropped area (ha) 164019
Crop intensity (GC/NSA) % 199.57
Total area available for irrigation (NIA + Fallow (ha) 47150
Irrigation potential created (ha) 66510
Net irrigated area (Area irrigated at least once) (ha) 50520
Total population (in ‘000) 4850
Male population (in ‘000) 2500
Female population (in ‘000) 2350
Rural population (in ‘000) 1776
Urban population (in ‘000) 3074
SC Population (in ‘000) 659
ST Population (in ‘000) 19
Literate population (in ‘000) 3290
No. of BPL (in ‘000) 508
Population density (Nos. per sq. km) 730
Marginal holdings (<= 1ha) 218281 (92.6 %)
Small holdings (1-2 ha) 14550 (6.17 %)
Medium + large holdings (>2ha) 2893 (1.23 %)
Total holdings 235724
Average Normal Rainfall (mm) 1515
Average Normal Temperature 0C 21.60 – 31.80C
Soil and Agro-climate
Geologically, the Howrah district is located in the stable shelf on the south-western
flank of the Bengal Basin. The district consists of a flat alluvial plain. The surface
deposits consist of the Damodar riverine soil in the extreme north-west, saline soils in the

276
southern half, Ganga lowland soils in the eastern portions and Damodar flatland soils in
the rest of the district. The soil is highly fertile a n d h a s well developed irrigation
infrastructure thus, the district is an agriculturally advanced district. The District of Howrah is
spread over three major agro-climatic regions namely Gangetic Alluvial region and Bindhya
Alluvial region, Coastal Saline region.
The vast sweet water bodies along the road side, ponds, canals, etc remain untapped. Paddy cum
fish culture is a traditional practice in rainy season & is also a source of livelihood of resource
poor farmers. The benefits of intensive agriculture, however is confined to a few crops
especially rice and potato and to an extent vegetables.
JALPAIGURI DISTRICT
Jalpaiguri is situated between 26°16'N to 27°00′N latitude and 88° 25' E to 89°53' E longitude.
Jalpaiguri is a beautiful district on the foothills of the Himalayas. It is always known for 3Ts -
Tea, Tourism & Timber. Continuous degradation of natural resources, severe erosion, low
productivity, etc. are some of the major problems in the area. The district is rich in bio-diversity
of both flora and fauna and has immense natural beauty The topography of the land is covered
with tea gardens and forests. The salient features of the district in given in Table.
Table .Salient features of Jalpaiguri district
Total Geographical area (sq. km) 622773
No. of Sub-divisions * 2
No. of Blocks 7
No. of villages (inhabited) 742
No. of Panchayats 13
Area reported (ha) 622700
Forest land (ha) 179000
Area not available for cultivation (ha) 90669
Permanent pasture and grazing land (ha) 985
Land under miscellaneous tree and fruit crops (ha) 4992
Cultivable waste land (ha) 102

277
Current fallow (ha) 10717
Other fallow (ha) 104
Net sown area (ha) 334127
Gross cropped area (ha) 427600
Area cultivated more than once (ha) 252284
Crop intensity (GC/NSA) % 128
Net irrigated area (Area irrigated at least once) (ha) 105638
Total population (in ‘000) 3872
Male population (in ‘000) 1983
Female population (in ‘000) 1889
Rural population (in ‘000) 2812
Urban population (in ‘000) 1060
SC Population (in ‘000) 1549
ST Population (in ‘000) 735
Literate population (in ‘000) 2498
No. of BPL (in ‘000) 422
Population density (Nos. per sq. km) 2026
Marginal holdings (<= 1ha) 237307 (80 %)
Small holdings (1-2 ha) 47175 (16 %)
Medium + large holdings (>2ha) 1154 (4 %)
Total holdings 295636
Average Normal Rainfall (mm) 3150
Average Normal Temperature 0C 10.8 0C - 30.9 0C
*Sadar subdivision and Mal subdivision
Soil and Agro-climate Characters
The topography of the land is cut across by rivers, rivulets and hills. The Soil is sandy loamy and
light textured which is prone to soil erosion and has less water holding capacity. Soil contains
less organic matter and is poor in clay content. Soil is most permeable to water and nutrient
leaches down quickly. The characteristics of soil coupled with heavy rainfall increases the
vulnerability of the agricultural land and other land into erosion. There are problems of sand
deposition along with debrish & stone due to occasional change of river courses and occurrence

278
of flood each year. The common forms of erosion are flash, sheet, rill, gully and ravine and
stream bank erosion. The main rivers of the district are Torsa,Jaldhaka, Raidak, Sankosh etc. The
district falls under the Teesta- alluvial Agro-climatic zone. .
MALDA DISTRICT
Malda lies between Latitude 24°40'20"N and 25°3'28"N and Longitudes between 87°45'5"0E to
88°28'10"E. The district of Malda is situated on the Western part of the alluvium filled gap
between the Rajmahal hills on the west and Garo hills on the east. The entire area is covered by
alluvium, which, however, is of two different ages displaying different physical and
physiographic characteristics. The rivers Ganga, Mahananda, Fulahar and Kalindri flow through
the district. As such, some areas of the district are subject to frequent inundations. The salient
feature of the district is presented in Table.
Table. Salient features of Malda district
Total Geographical area (sq. km) 3733
No. of Sub-divisions 2
No. of Blocks* 15
No. of villages (inhabited) 1798
No. of Panchayats 146
Area reported (ha) 373300
Forest land (ha) 1679
Area not available for cultivation (ha) 84654
Land under miscellaneous tree and fruit crops (ha) 4874
Cultivable waste land (ha) 90
Current fallow (ha) 65632
Other fallow (ha) 326
Net sown area (ha) 188623
Gross cropped area (ha) 371147
Area cultivated more than once (ha) 182524
Crop intensity (GC/NSA) % 196
Total area available for irrigation (NIA + Fallow (ha) 276275

279
Net irrigated area (Area irrigated at least once) (ha) 125759
Total population (in ‘000) 3290
Male population (in ‘000) 1360
Female population (in ‘000) 1930
Rural population (in ‘000) 3049
Urban population (in ‘000) 241
SC Population (in ‘000) 554
ST Population (in ‘000) 227
Literate population (in ‘000) 1332
No. of BPL (in ‘000) 1842
Population density (Nos. per sq. km) 1100
Marginal holdings (<= 1ha) 327455
Small holdings (1-2 ha) 49658 (83%)
Medium + large holdings (>2ha) 15508 (13%)
Total holdings 392621 (4%)
Average Normal Rainfall (mm) 1485
Average Normal Temperature 0C 110 – 360C
Soil and Agro-climatic
The district is divided into three physiographic regions, namely Tal, Barind and Diara. East of
Mahananda river, the soil is older alluvium forming Barind tract. The tract is the red soil of old
alluvium formation. The soil of this tract is mostly acidic; pH ranges from 4.2 to 5.5. In the west
of Mahanada river, the soil is light loam. On the eastern side the proportion of clay is greater.
The soil of this area is the most fertile and neutral in reaction. Agro-climatically the district falls
under the Gangetic alluvial zone.
The region is fortunate to have excellent soil conditions and irrigation facilities. The land
is ideal for mulberry and mango cultivation. Agriculture is the main occupation of the populace,
the main crops being are paddy, wheat, jute and rabi-crops. Malda is famous for its silk and
mangoes, both of which are produced in the western region of the district, due to the favourable
soil conditions for the growth of Mango and Mulberry trees.

280
MURSHIDABAD DISTRICT
Murshidabad lies between 23º43'N and 24º52'N latitude and 87º49'E and 88º44'E longitude. It
is one of the most agriculturally developed districts in West Bengal, where all types of crops
are grown. Various types of vegetables and fruit crops are grown here of which the quality
Mango and Litchi are famous. The climatic condition and soil of this district are congenial for
cultivation of almost every field crops and for this; the district can be designated as “Crop
Museum”. Salient features of the district is presented in Table.
Soil and Agro-climate
The river Bhagirathi passes through the district from north to south and divides the district into 2
parts. The western part having stiff clay soil, reddish in colour and undulated topography is
called “Rarh” and simultaneously the eastern part of the Bhagirathi containing alluvial and fertile
soil is known as “Bagri”.
The district Murshidabad has three agro climatic zones namely old alluvial under AES-I with
14.30% of area, lateritic light under AES-II with 37.79% of area and new alluvial zone under
AES-III covering 47.914% of area of the district. New alluvium zone and Old alluvium zone
represented by AES-III and AES-I are more fertile than AES-II
Table. Salient features of Murshidabad district
Total Geographical area (sq. km) 5316
No. of Sub-divisions 5
No. of Blocks* 26
No. of villages (inhabited) 1923
No. of Panchayats 255
Area reported (ha) 531611
Forest land (ha) 1670
Area not available for cultivation (ha) 142208
Permanent pasture and grazing land (ha) 1014
Land under miscellaneous tree and fruit crops (ha) 16443
Cultivable waste land (ha) 776
Current fallow (ha) 4974
Other fallow (ha) 500

281
Net sown area (ha) 365000
Gross cropped area (ha) 892451
Area cultivated more than once (ha) 721748
Crop intensity (GC/NSA) % 245
Total area available for irrigation (NIA + Fallow (ha) 531611
Irrigation potential created (ha) 365000
Net irrigated area (Area irrigated at least once) (ha) 204704
Total population (in ‘000) 7104
Male population (in ‘000) 3627
Female population (in ‘000) 3476
Rural population (in ‘000) 5703
Urban population (in ‘000) 1401
SC Population (in ‘000) 898
Literate population (%) 63.88
Population density (Nos. per sq. km) 1334
Marginal holdings (<= 1ha) 231659 (69.7%)
Small holdings (1-2 ha) 99117 (29.9%)
Medium + large holdings (>2ha) 1242 (0.4%)
Total holdings 332020
Average Normal Rainfall (mm) 1300
Average Normal Temperature 0C 170 – 350C
NADIA DSTRICT
Nadia lies between 24° 11' and 22° 53' North latitude and between 88° 48' and 88° 09' East
Latitude. District Nadia is agriculturally very progressive. Rice is the main crop. Other crops are:
wheat, maize, Pulses, oilseeds, jute, potato and sugarcane. District Nadia is also popular for its
vegetable production. Brinjal, okra, potato, ginger, onion, cabbage and cauliflower etc are
cultivated. The salient feature of the district is presented in Table.

282
Table. Salient features of Nadia district
Total Geographical area (sq. km) 3927
No. of Sub-divisions 4
No. of Blocks* 17
No. of villages (inhabited) 2637
No. of Panchayats 187
Area reported (ha) 390656
Forest land (ha) 1216
Area not available for cultivation (ha) 86522
Permanent pasture and grazing land (ha) 70
Land under miscellaneous tree and fruit crops (ha) 4404
Cultivable waste land (ha) 700
Current fallow (ha) 6900
Other fallow (ha) 680
Net sown area (ha) 272135
Gross cropped area (ha) 761978
Crop intensity (GC/NSA) % 280
Total area available for irrigation (NIA + Fallow (ha) 279000
Irrigation potential created (ha) 298255
Net irrigated area (Area irrigated at least once) (ha) 217000
Total population (in ‘000) 5167
Male population (in ‘000) 2654
Female population (in ‘000) 2513
Rural population (in ‘000) 3728
Urban population (in ‘000) 1439
SC Population (in ‘000) 1366
ST Population (in ‘000) 114
Literate population (in ‘000) 3661
No. of BPL (in ‘000) 1334
Population density (Nos. per sq. km) 1334

283
Marginal holdings (<= 1ha) 310374 (78%)
Small holdings (1-2 ha) 76386 (19%)
Medium + large holdings (>2ha) 13836 (3%)
Total holdings 400596
Normal Rainfall (mm) 1427
Normal Temperature 0C 19 0C - 29 0C
Soil and and Agro Climate
The district comes under Lower Gangetic Plain Region Zone III. The district is criss-crossed by
the Bhagirathi and its tributaries. Soil of this district is deep, well drained, texturally fine, loamy,
and neutral in reaction with high base saturation and medium to medium low NPK status.
The area is humid and with high precipitation. Summer is hot and humid and winter is moderate
which triggers to better crop production and yield. Flood is almost of regular occurrence in the
district
NORTH 24 PARGANAS DISTRICT
North 24 parganas district lies between 230 15' North to 220 11' North Latitude and between
890 5' East to 880 20' East Longitude. The river Hooghly flows along the district. There are many
other rivers, which include the Icchamati, Jamuna, and Bidyadhari, etc.. The district is bordered
with Bangladesh by north and east. Paddy is the major crop of this district. Other major crops are
vegetable, oilseeds wheat, pulses etc. Salient features of the district is given in Table.
Table. Salient features of North 24 Parganas district
Total Geographical area (sq. km) 4094
No. of Sub-divisions 5
No. of Blocks* 22
No. of villages (inhabited) 1599
No. of Panchayats 214
Area reported (ha) 386524
Forest land (ha) 110

284
Area not available for cultivation (ha) 124782
Land under miscellaneous tree and fruit crops (ha) 4475
Cultivable waste land (ha) 465
Current fallow (ha) 587
Net sown area (ha) 225000
Gross cropped area (ha) 482399
Area cultivated more than once (ha) 162905
Crop intensity (GC/NSA) % 214.39
Total area available for irrigation (NIA + Fallow (ha) 154311
Net irrigated area (Area irrigated at least once) (ha) 154311
Total population (in ‘000) 10822
Male population (in ‘000) 5172
Female population (in ‘000) 4910
Rural population (in ‘000) 4276
Urban population (in ‘000) 5806
SC Population (in ‘000) 1840
ST Population (in ‘000) 198
Literate population (in ‘000) 6207
No. of BPL (in ‘000) 3841
Population density (Nos. per sq. km) 2500
Marginal holdings (<= 1ha) 447799 (80.7 %)
Small holdings (1-2 ha) 80843 (14.6 %)
Medium + large holdings (>2ha) 26314 (4.7 %))
Total holdings 554916
Average Normal Rainfall (mm) 1579
Average Normal Temperature 0C 100 – 410C
Soil and Agro Climate
Most of the soils derived from alluvial deposits are recent alluvium with little or no profile
development. The predominant group of soil is sandy loam to loamy soils covering area of
28.7% and 23.8% cultivated of total area respectively. Clay soil persists in 24% area and clay
loam in 19.7% area where as sandy soils prevail only in 3.6% of the total cultivated areas.

285
Salinity during pre-kharif season is a major concern in the southern part of the district which is
still under active delta and growing gradually. A part of this active delta contains forests. Known
as Sunderbans, this part of the active delta region is under reserve forests. Quite a large part of
Sunderbans has been brought under cultivation.
Two distinct agro ecological situations viz. Gangetic alluvial zone and coastal alluvial zone are
prevailing in the district.
PASCHIM MEDINIPUR DISTRICT
Medinipur (undivided) was the biggest among the districts of West Bengal, with its
geographical location in 21 º 36´ to 22 º 57´ North latitude to 86 º 33´ to 88 º 11´ East longitude.
The district was bifurcated on January 1, 2002 into two districts viz. Purba Medinipur and
Paschim Medinipur. Paschim Medinipur District is surrounded by Bankura, Hooghly and Purba
Medinipur districts and the states of Odisha and Jharkhnd. The district is mainly a land of
Agriculture and more than 80% of the total population is residing in the villages. Rivers like
Kangsabati, Silabati, Dulang, Subarnarekha, Keleghai and their tributaries are flowing through
the district and enriched cropping system of this district. Kangsabati Canal System is the main
irrigation scheme. The major crops grown in this district are Paddy (Aus, Aman & Boro), Wheat,
Potato, Oilseeds, Vegetables, Pulses, Sugarcane, Jute, Betel vine, Matstick etc. and minor crops
like Maize etc. are also grown. Salient features of the district is given in Table.
Table. Salient features of Paschim Medinipur district
Total Geographical area (sq. km) 9295
No. of Sub-divisions 4
No. of Blocks* 29
No. of villages (inhabited) 7498
No. of Panchayats 290
Area reported (ha) 1166392
Forest land (ha) 144613
Area not available for cultivation (ha) 126328
Cultivable waste land (ha) 47982

286
Current fallow (ha) 6020
Net sown area (ha) 595210
Gross cropped area (ha) 980880
Area cultivated more than once (ha) 312495
Crop intensity (GC/NSA) % 164.8
Total area available for irrigation (NIA + Fallow (ha) 430936
Net irrigated area (Area irrigated at least once) (ha) 268677
Total population (in ‘000) 5943
Male population (in ‘000) 3032
Female population (in ‘000) 2911
Rural population (in ‘000) 4986
Urban population (in ‘000) 507
SC Population (in ‘000) 1069
ST Population (in ‘000) 867
Literate population (in ‘000) 4184
Population density (Nos. per sq. km) 640
Marginal holdings (<= 1ha) 180133 (26 %)
Small holdings (1-2 ha) 487398(71 %)
Medium + large holdings (>2ha) 18326 (3 %)
Total holdings 685857
Average Normal Rainfall (mm) 1542
Average Normal Temperature 0C 80 – 400C
Soil and Agro-climate
Generally three types of soil are found in Paschim Medinipur district namely Red &
lateritic, Vindhya Alluvial and Recent alluvial. The characteristic of Red & Lateritic soil is poor
water retention capacity, rich in iron and alluminium and deficient in Ca, Mg, B, Mo, and
organic matter. The pH varies from 4.8 to 6.6. On net cropped area basis total 262782 ha land
comes under this type of soil. Vindhya alluvial soil having good water retention capacity with
moderate organic matter content and pH varies from 5.5 to 7.2.. The character of Recent alluvial
is moderate water retention capacity with pH range 5.8 – 6.6. Extremely rugged topography is

287
seen in western part of the district and rolling topography is experienced consisting of lateritic
covered area. These rolling plains gradually merge into flat alluvial and deltaic plains to the east
and south-east of the district. The soil is poor to medium fertile.
The climate is characterized by hot summer, cold winter. The experience of drought and
flood are common in this district and sometimes one is followed by another in a year. Flood
prone areas are Ghatal and part of Kharagpur Sub-Division and drought prone areas are
Jhargram, Kharagpur and Medinipur Sadar Sub-Division.. The district falls under two agro-
climatic zones viz. Vindhyan Alluvial Zone and Undulating Red and Laterite Zone
PURBA MEDINIPUR DISTRICT
Medinipur (undivided) was the biggest among the districts of West Bengal, with its geographical
location in 21 º 36´ to 22 º 57´ North latitude to 86 º 33´ to 88 º 11´ East longitude. The district
was bifurcated on January 1, 2002 into two districts viz. Purba Medinipur and Paschim
Medinipur. Purba Medinipur district is surrounded by the Bay of Bengal and Balashore district
of Odisha state in its South, Paschim Medinipur in its West, Howrah' district in the North and
South 24 Parganas in the East. Purba Medinipur district is mainly a land of agriculture and more
than 80% of the total population is residing in the villages and the rural economy is based on
Agriculture. The major crops grown in this district are Paddy (Aus, Aman & Boro), Wheat,
Potato, Oilseeds, Vegetables, Pulses, Jute, Betel vine, Mat stick, etc. The salient features of the
district is presented in Table.
Table. Salient features of Purba Medinipur district
Total Geographical area (sq. km) 4295
No. of Sub-divisions 4
No. of Blocks* 25
No. of villages (inhabited) 2964
No. of Panchayats 223
Area reported (ha) 396594
Forest land (ha) 900
Area not available for cultivation (ha) 92490

288
Permanent pasture and grazing land (ha) 50
Land under miscellaneous tree and fruit crops (ha) 3600
Cultivable waste land (ha) 250
Current fallow (ha) 3930
Other fallow (ha) 370
Net sown area (ha) 304800
Gross cropped area (ha) 518076
Area cultivated more than once (ha) 213276
Crop intensity (GC/NSA) % 170
Total area available for irrigation (NIA + Fallow (ha) 309100
Irrigation potential created (ha) 220000
Net irrigated area (Area irrigated at least once) (ha) 206060
Total population (in ‘000) 5094
Male population (in ‘000) 2631
Female population (in ‘000) 2463
Rural population (in ‘000) 4500
Urban population (in ‘000) 594
SC Population (in ‘000) 639
ST Population (in ‘000) 27
Literate population (in ‘000) 4465
No. of BPL (in ‘000) 2
Population density (Nos. per sq. km) 1100
Marginal holdings (<= 1ha) 618720
(95%)
Small holdings (1-2 ha) 26591 (4%)
Medium + large holdings (>2ha) 4455 (1%)
Total holdings 649766
Average Normal Rainfall (mm) 1748
Average Normal Temperature 0C 250-340C
Soil and Agro-climate: The district has 3 major types of soil viz. clay loam, loamy clay and
coastal saline. The soils are moderately fertile, poor in N but rich in K and moderate to low in P.
The climate of this district is characterized by Hot-Summer with High humidity, abundant

289
rainfall and moderate winter. The district Purba Medinipur falls under two agro climatic zones
namely, i) Vindhiya 4 alluvial zone and ii) Coastal saline zone.
PURULIA DISTRICT
Purulia lies between 22.60 degree and 23.50 degree north latitude and 85.75 degree and 86.65
degree east longitude. This district is surrounded by the districts of Bankura, Midnapore and
Burdwan of West Bengal and Hazaribag, Singbhum, Dhanbad, Ranchi, Jamshedpur and Bokaro
of Jharkhand. Purulia is one of the poorly developed districts of the country. draining into
common nallas of Kangsabati and Dwarakeswar River. The salient features of the district is
presented in Table.
Table. Salient features of Purulia district
Total Geographical area (sq. km) 6259
No. of Sub-divisions 3
No. of Blocks* 20
No. of villages (inhabited) 2468
No. of Panchayats 170
Area reported (ha) 625646
Forest land (ha) 75048
Area not available for cultivation (ha) 108922
Permanent pasture and grazing land (ha) 1807
Land under miscellaneous tree and fruit crops (ha) 2517
Cultivable waste land (ha) 7601
Current fallow (ha) 199395
Other fallow (ha) 4222
Net sown area (ha) 290000
Gross cropped area (ha) 318702
Area cultivated more than once (ha) 15310
Crop intensity (GC/NSA) % 105
Total area available for irrigation (NIA + Fallow (ha) 199110
Irrigation potential created (ha) 169274

290
Net irrigated area (Area irrigated at least once) (ha) 78900
Total population (in ‘000) 2930
Male population (in ‘000) 1497
Female population (in ‘000) 1433
Rural population (in ‘000) 2557
Urban population (in ‘000) 373
SC Population (in ‘000) 463
ST Population (in ‘000) 463
Literate population (in ‘000) 1625
No. of BPL (in ‘000) 606
Population density (Nos. per sq. km) 470
Marginal holdings (<= 1ha) 234716 (76%)
Small holdings (1-2 ha) 60322 (19%)
Medium + large holdings (>2ha) 18313 (5%)
Total holdings 313361
Average Normal Rainfall (mm) 1300
Average Normal Temperature 0C 2.80 – 520C
Soil and Agro-climate
Purulia is located at a transition zone between the alluvial plains of west Bengal and the plateau
of Jharkhand.
The soils are of shallow depth, lateritic red,gravelly, coarse textured, well drained having low
water holding capacity. Colluvial soils are found at the bottom of valleys. These lands are
either severely eroded or very susceptible to erosion. Soils are very poor in organic matter and
other plant nutrients.Soils are mostly acidic in nature and pH varies from 5 to 6.5. Due to long
exposure of high degree of erosion the top soils are lost, leaving the fertility status and physical
condition of the soils is very poor.
The climate is of extreme nature and the district is severely drought prone.The district falls under
the Undulating red and lateritic climatic zone

291
SOUTH 24 PARGANAS:
South 24 Paganas district lies between 23015'2'' and 22011'6'' North latitude and 8905' and 88020'
East longitude. The district is surrounded be the Bay of Bengal on the south, Bangladesh on the
east, North 24 Parganas on the North and Purba Medinipur and the river Hooghly on the West.
Paddy is the major crop of this district. Other major crops are vegetable, oilseeds wheat, pulses
etc. Salient feature of the district is given in Table.
Table. Salient features of South 24 Parganas district
Total Geographical area (sq. km) 9960
No. of Sub-divisions 5
No. of Blocks* 29
No. of villages (inhabited) 2086
No. of Panchayats 312
Area reported (ha) 948710
Forest land (ha) 426300
Area not available for cultivation (ha) 143323
Permanent pasture and grazing land (ha) 23
Land under miscellaneous tree and fruit crops (ha) 2557
Cultivable waste land (ha) 1344
Current fallow (ha) 16685
Other fallow (ha) 7
Net sown area (ha) 358410
Gross cropped area (ha) 587196
Area cultivated more than once (ha) 218205
Crop intensity (GC/NSA) % 159
Irrigation potential created (ha) 126074
Net irrigated area (Area irrigated at least once) (ha) 110460
Total population (in ‘000) 8153
Male population (in ‘000) 4183
Female population (in ‘000) 3970
Rural population (in ‘000) 6065

292
Urban population (in ‘000) 2088
SC Population (in ‘000) 2281
ST Population (in ‘000) 85
Literate population (in ‘000) 6406
No. of BPL (in ‘000) 2836
Population density (Nos. per sq. km) 820
Marginal holdings (<= 1ha) 538339 (86%)
Small holdings (1-2 ha) 75421 (12%)
Medium + large holdings (>2ha) 10355(2%)
Total holdings 624115
Average Normal Rainfall (mm) 1579
Average Normal Temperature 0C 13.60 -36.30C
Soil and Agro Climate:
Most of the soils derived from alluvial deposits are recent alluvium with little or no profile
development. The soils are generally heavy texture. Salinity during pre-kharif season is a major
concern in the southern part of the district which is still under active delta and growing
gradually. A part of this active delta contains forests. Known as Sunderbans, this part of the
active delta region is under reserve forests. Quite a large part of Sunderbans has been brought
under cultivation. The soils are rich in K but moderate to poor in N and P, and rich in almost all
micro-nutrients except Zn.
Two distinct agro ecological situations viz. Gangetic alluvial zone and coastal alluvial zone are
prevailing in the district.
UTTAR DINAJPUR DISTRICT
Uttar Dinajpur district lies between latitude 25°11' N to 26°49' N and longitude 87°49' E to
90°00' E. The regional topography is generally flat with a gentle southerly slope towards which
the main rivers like Kulik, Nagar, and Mahananda etc. Uttar Dinajpur district was created after
the bifurcation of erstwhile West Dinajpur District on 1st April 1992. The District shares the
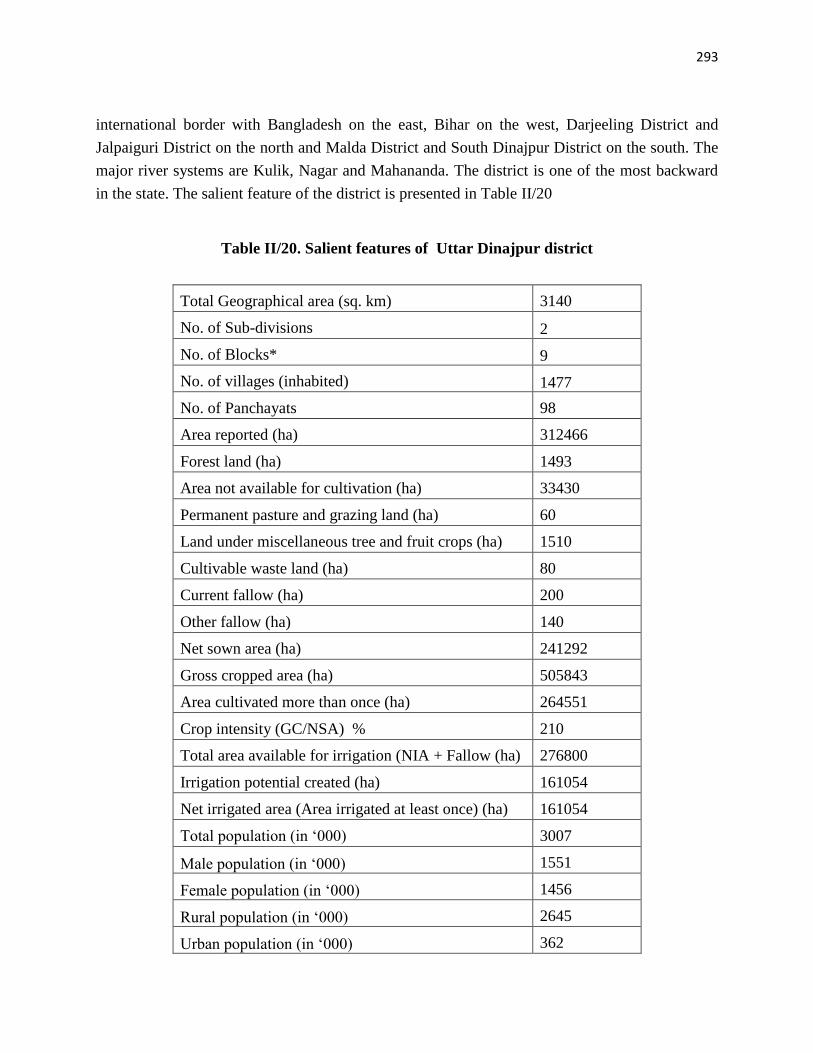
293
international border with Bangladesh on the east, Bihar on the west, Darjeeling District and
Jalpaiguri District on the north and Malda District and South Dinajpur District on the south. The
major river systems are Kulik, Nagar and Mahananda. The district is one of the most backward
in the state. The salient feature of the district is presented in Table II/20
Table II/20. Salient features of Uttar Dinajpur district
Total Geographical area (sq. km) 3140
No. of Sub-divisions 2
No. of Blocks* 9
No. of villages (inhabited) 1477
No. of Panchayats 98
Area reported (ha) 312466
Forest land (ha) 1493
Area not available for cultivation (ha) 33430
Permanent pasture and grazing land (ha) 60
Land under miscellaneous tree and fruit crops (ha) 1510
Cultivable waste land (ha) 80
Current fallow (ha) 200
Other fallow (ha) 140
Net sown area (ha) 241292
Gross cropped area (ha) 505843
Area cultivated more than once (ha) 264551
Crop intensity (GC/NSA) % 210
Total area available for irrigation (NIA + Fallow (ha) 276800
Irrigation potential created (ha) 161054
Net irrigated area (Area irrigated at least once) (ha) 161054
Total population (in ‘000) 3007
Male population (in ‘000) 1551
Female population (in ‘000) 1456
Rural population (in ‘000) 2645
Urban population (in ‘000) 362

294
SC Population (in ‘000) 808
ST Population (in ‘000) 163
Literate population (in ‘000) 1489
No. of BPL (in ‘000) 582
Population density (Nos. per sq. km) 960
Marginal holdings (<= 1ha) 219312 (77%)
Small holdings (1-2 ha) 50047 (18%)
Medium + large holdings (>2ha) 14817 (5%)
Total holdings 284176
Average Normal Rainfall (mm) 1566
Average Normal Temperature 0C 90 – 250C
Soil and Agro-climate
The land is flat, sloping gently towards the south. The soil of the district may be
classified as old alluvium, alluvium in the transition phase and new alluvium. Generally the soil
of the district is fertile, 46.32 % and 22 % of the total net cropped area are of sandy loam and
loam. Internal drainage of the soil is good. The entire soil group is moderately rich in
Phosphate& potash content. The district falls under the Terai-Teesta Alluvial Agro-climatic zone.


![Home | Welcome to West Bengal Judicial Academy Bengal Excise... · West Bengal Act of 2012 THE BENGAL EXCISE (AMENDMENT) ACT, 2012. [Passed by the West Bengal Legislature.] [Assent](https://img.pdfslide.us/doc/110x75/607fa9c0e387de78580b7626/home-welcome-to-west-bengal-judicial-bengal-excise-west-bengal-act-of-2012.jpg)