Embed Size (px)
Citation preview
Report No: ACS19044
WEST BANK & GAZA
ENERGY EFFICIENCY ACTION PLAN
2020-2030
Final Report
June 2016
Pub
lic D
iscl
osur
e A
utho
rized
Pub
lic D
iscl
osur
e A
utho
rized
Pub
lic D
iscl
osur
e A
utho
rized
Pub
lic D
iscl
osur
e A
utho
rized

Energy Efficiency Action Plan for 2020-2030 – Final Report
2
Standard Disclaimer:
This volume is a product of the staff of the International Bank for Reconstruction and Development/
The World Bank. The findings, interpretations, and conclusions expressed in this paper do not
necessarily reflect the views of the Executive Directors of The World Bank or the governments they
represent. The World Bank does not guarantee the accuracy of the data included in this work. The
boundaries, colors, denominations, and other information shown on any map in this work do not imply
any judgment on the part of The World Bank concerning the legal status of any territory or the
endorsement or acceptance of such boundaries.
Copyright Statement
The material in this publication is copyrighted. Copying and/or transmitting portions or all of this work
without permission may be a violation of applicable law. The International Bank for Reconstruction
and Development/ The World Bank encourages dissemination of its work and will normally grant
permission to reproduce portions of the work promptly.
For permission to photocopy or reprint any part of this work, please send a request with complete
information to the Copyright Clearance Center, Inc., 222 Rosewood Drive, Danvers, MA 01923, USA,
telephone 978-750-8400, fax 978-750-4470, http://www.copyright.com/.
All other queries on rights and licenses, including subsidiary rights, should be addressed to the Office
of the Publisher, The World Bank, 1818 H Street NW, Washington, DC 20433, USA, fax 202-522-
2422, e-mail [email protected].
Energy Efficiency Action Plan for 2020-2030 – Final Report
3
TABLE OF CONTENTS
Abbreviations and acronyms....................................................................................................... 5
1. Executive summary ...................................................................................................... 6
1.1. Methodology ..................................................................................................... 6
1.2. Review of the Palestinian energy sector ........................................................... 6
1.3. Demand forecast by usage and Energy Efficiency target ................................. 7
1.4. NEEAP 2020-2030 ........................................................................................... 7
2. Introduction and methodology ...................................................................................... 9
2.1. Introduction ....................................................................................................... 9
2.2. Methodology ..................................................................................................... 9
3. Energy and EE market review and diagnostic ............................................................ 12
3.1. Key general indicators .................................................................................... 12
3.2. Primary energy supply and consumption ........................................................ 16
3.3. Electricity sector ............................................................................................. 20
3.3.1. Description of the value chain ............................................................ 20
3.3.2. Electricity usages ................................................................................ 22
3.3.3. Transmission and distribution losses .................................................. 23
3.3.4. Electricity tariffs.................................................................................. 24
3.3.5. Demand forecasting for electricity ...................................................... 27
3.4. Existing EE programs and preliminary results ............................................... 28
3.4.1. Targets defined by the National Energy Efficiency Action plan for 2012-2020
............................................................................................................. 28
3.4.2. Review of the Phase I action plan results (2012 – 2014) .................... 30
3.5. Legal framework and key EE players ............................................................. 31
3.5.1. Overview of existing energy regulation .............................................. 31
3.5.2. Presentation of main existing key players ........................................... 31
4. Forecasted demand of electricity for 2020-2030 timeframe ....................................... 33
4.1. Methodology and main assumptions .............................................................. 33
4.2. Segmentation of the consumption of electricity by economic activity ........... 35
4.3. Segmentation of the usages of electricity ....................................................... 36
4.3.1. Industrial, commercial and service sectors ......................................... 39
4.3.2. Residential sector ................................................................................ 40
4.4. Forecasted demand by usage and potential savings ........................................ 43
5. 2030 Energy Efficiency targets .................................................................................. 47
Energy Efficiency Action Plan for 2020-2030 – Final Report
4
5.1. Reduction of consumption of electricity ......................................................... 47
5.2. Reduction of the CO2 emissions ..................................................................... 47
6. Review of key contributing technologies during 2020-2030 ..................................... 49
6.1. Lighting ........................................................................................................... 49
6.2. Electric motors ................................................................................................ 50
6.3. Room heating and air conditioning ................................................................. 50
6.4. Fridges (residential sector) .............................................................................. 51
6.5. Water heating .................................................................................................. 51
6.6. Smart homes.................................................................................................... 51
6.7. Building renovation and nearly Zero Energy Buildings ................................. 51
6.8. Smart metering ................................................................................................ 51
6.9. Smart grids ...................................................................................................... 52
6.10. Miscellaneous ................................................................................................. 52
7. Energy Efficiency Action plan for 2020-2030 ........................................................... 53
7.1. Global strategy and main assumptions ........................................................... 53
7.2. NEEAP 2020-2030 Phase I (Residential sector) ............................................ 55
7.3. NEEAP 2020-2030 Phase I (other sectors) ..................................................... 60
7.4. NEEAP 2020-2030 Phase II ........................................................................... 61
7.5. NEEAP 2020-2030 Phase III .......................................................................... 62
7.6. Impacts of this EE action plan on the creation of jobs ................................... 62
7.7. Recommendations for an implementation plan .............................................. 63
8. Conclusion .................................................................................................................. 65
9. References ................................................................................................................... 67
Energy Efficiency Action Plan for 2020-2030 – Final Report
5
ABBREVIATIONS AND ACRONYMS
CFL Compact Fluorescent Light
CBA Cost Benefit Analysis
DISCo Distribution Company
EE Energy Efficiency
ESCO Energy Service COmpany
GDP Gross Domestic Product
GEDCO Gas Electricity Distribution Company
GHG Greenhouse Gas
GPP Gaza Power Plant
GWh Gigawatt hour
HEPCO Hebron Electric Power Company
HH Household
HV High Voltage
HVAC Heating, Ventilation and Air Conditioning
IEC Israel Electricity Company Ltd
JDECO Jerusalem District Electricity Company
LED Light Emitting Diodes
LPG Liquefied Petroleum Gas
MENA Middle East and North Africa
MEPS Minimum Energy Performance Standard
MV Medium Voltage
MWh Megawatt hour
NEEAP National Energy Efficiency Action Plan
NEDCO Northern Electric Distribution Company
NIS New Israeli Shekel (1 USD ~ 3.69 NIS)
NGO Non-Governmental Organization
nZEB nearly Zero Energy Building
PCBS Palestinian Central Bureau of Statistics
PEA Palestinian Energy Authority
PEC Palestinian Energy and Environment Research Center
PERC Palestinian Energy Regulatory Council
PF Power Factor
PENRA Palestinian Energy and Natural Resources Authority
PMA Palestinian Monetary Authority
PPA Power Purchase Agreement
PV Photovoltaic
RES Renewable Energy Sources
SELCO Southern Electric Company
SME Small and Medium Enterprise
TJ terajoule (1012 joules)
Energy Efficiency Action Plan for 2020-2030 – Final Report
6
1. EXECUTIVE SUMMARY
The World Bank in partnership with PENRA, and in collaboration with the Agence Française
de Développement (AFD) prepared this Energy Efficiency Action Plan for 2020-2030 (also referred
to as NEEAP II) as a prolongation of the current plan for 2012-2020. Based on the lessons learned and
PENRA’s vision of the sector, the NEEAP II introduces more ambitious energy efficiency targets. To
be achieved, the implementation of NEEAP II should start before 2020 in order to provide results early
next decade.
The NEEAP II plan focuses on electricity since this form of energy has the largest share in the
Palestinian final energy mix. The plan is also concentrated on a reduction of the consumption and not
on the development of the renewable energy such as wind, biomass or solar PV. The potential for
developing these renewable energies has already been addressed in another study led by PENRA.
1.1. Methodology
The methodology used to build this Energy Efficiency (EE) Action Plan is based on an iterative
cycle where EE actions are analysed in terms of benefits (reduction of the consumption) and costs
(investment needed to implement technology replacements and consumer behaviour changes). These
benefits and costs are then compared to an EE target for expected savings. Cumulated costs are
compared with a given budget so that a selection of the more effective actions may be decided within
this financial envelop. Another principle has been adopted: focus on the largest uses of electricity.
National statistics are traditionally based on consumption by sector. In Palestine, the residential
sector is the main consumer of electricity with more than 60% of the total consumption. In order to
identify pertinent actions, we need to know the consumption by usage. For instance, in the industry
sector, main usages are motors or heating/chilling. In the residential sector, the usages of electricity
have been identified through surveys. An average consumption profile has been modelled to reflect
the various usages of electricity by sector.
Since this EE Action Plan is for the 2020-2030 timeframe, demand forecasts will help to size
the potential reduction of the consumption. Usually, the EE target is a reduction of the present level of
consumption at a given date1. Because of the particular situation of Palestine where energy
consumption is already strongly limited by imports, it has been proposed instead to reduce the
consumption growth rate during 2020-2030, compared to a “business as usual” scenario where no EE
action would be implemented. The last component of the methodology is a review of the technologies
that should reduce future consumption. For instance, lighting based on LED should divide by ten the
consumption of incandescent bulbs.
1.2. Review of the Palestinian energy sector
Palestine has the third fastest growing population (+2.9% per annum) in MENA during the last
decade. Palestine has the lowest GDP but the highest economic growth rate. The fast-growing
economy should positively influence future investments in EE actions for the industrial and
commercial (I&C) sectors. Among MENA countries, Palestine ranks first in primary energy intensity2,
which indicates a relatively low consumption of energy and as a consequence, a possible difficulty for
reducing this consumption through EE actions in the residential sector. This is particularly true for
Gaza where suppressed demand reaches a very high level.
1 In Europe, the target for 2020 is a reduction of 20% of the consumption below the 1990 level. 2 Ratio between total energy consumption and GDP. It is a measure of the total amount of energy required to generate a
unit of GDP.
Energy Efficiency Action Plan for 2020-2030 – Final Report
7
However, there should be room from improvement on Palestinian households. With 34%,
electricity has the largest part of the Palestinian energy mix. Furthermore, the residential sector
accounts for 60% of the consumption. This shows that concentrating EE actions on the residential
sector should have a large impact on final consumption.
Palestine is the MENA country with the highest use of Solar Water Heaters (SWH). 56% of
households have a SWH system on their roof. However, one third of these systems is out of order.
Moreover, distribution losses (technical and non-technical) reach a very high level (20-30%). A
significant reduction of these losses would be of paramount importance for the nation. The price of
electricity, based on IEC retail tariff, is very high in Palestine. As a consequence, the share of electricity
in Palestinian household expenditures (9%) is the highest within MENA countries. Any EE action
reducing consumption should have a short return on investment. However, for selecting the most
appropriate actions, one needs to know what the future consumption will be during 2020-2030 and, if
possible, by usage of electricity.
1.3. Demand forecast by usage and Energy Efficiency target
A specific methodology for demand forecast has been developed to take into account specific
evolutions for the residential sector (growth rate estimation: 2.2-2.4%/y) and the economic sectors
(4.5%/y). Segmentation by usage is required to target the EE actions where substantial benefits are
expected. The search for low hanging fruits leads to build a consumption profile. Electricity meters
give a consumption which is the sum of all usages. Through the household surveys done by the
Palestinian Central Bureau of Statistics (PCBS) it has been possible to identify the number of
appliances per households and then to approximate the daily consumption by usage. Energy audits
give similar information for the economic sectors. It seems that, for the residential sector, the main
usages of electricity are air-conditioned, electric room heaters, water heating, fridge and lighting. A
review of new technologies for these usages helps to identify specific actions such as the replacement
of appliances or the switch to gas (LPG or NG) for heating.
The NEEAP target for 2012-2020 is a reduction of the total consumption of electricity by 384
GWh during the 9-year period. The new proposed target in the NEEAP II for 2020-2030 is 5,000 GWh
(or 500 GWh per year). However, the actions which are proposed in this new plan might lead to save
up to 11,000 GWh if they were all implemented. This will provide flexibility to the Palestinian
Authority to select some of the proposed measures according to budget or other constraints.
How the prove the 2030 target is reached? Since the proposed target is related to the demand
forecasts, there is a risk to over or under estimate the consumption without NEEAP (business as usual).
To avoid this situation, indicators have been proposed for each individual EE action. The
implementation of the proposed plan should save 3.5 million tons of CO2 each year.
1.4. NEEAP II 2020-2030
The proposed NEEAP II plan is built on three layers or phases:
- The first layer or Phase I (2020-2030) is a follow up of the previous plan. It focuses mainly on
the use of efficient appliances and industrial equipment. The information of the consumers and
energy audits for the I&C sectors should help to replace inefficient energy-using products. The
general deployment of smart meters is required to inform both households and distribution
companies. The reduction of the grid losses (technical and non-technical) will be then easier to
implement. The switch to gas for heating water is also an important action to decide as long as
generation capacity is not enough to satisfy the demand.
Energy Efficiency Action Plan for 2020-2030 – Final Report
8
- The second layer or Phase II (2024-2030) focuses on energy market structuring. The objective
is to introduce demand side management. If the previous phase aims at reducing energy
consumption (kWh), this second phase has in view a reduction of the peak load (kW). This is
an important factor to take into account especially if a large proportion of (intermittent)
renewable energy is integrated with solar and wind.
- The third layer or Phase III (2027-2030) is dedicated to the use of new technologies such as
smart homes, smart buildings and smart grids. The direct communication established between
generation and consumption should optimize the use of infrastructures. A Time of Use Tariff
(ToU) will then be required.
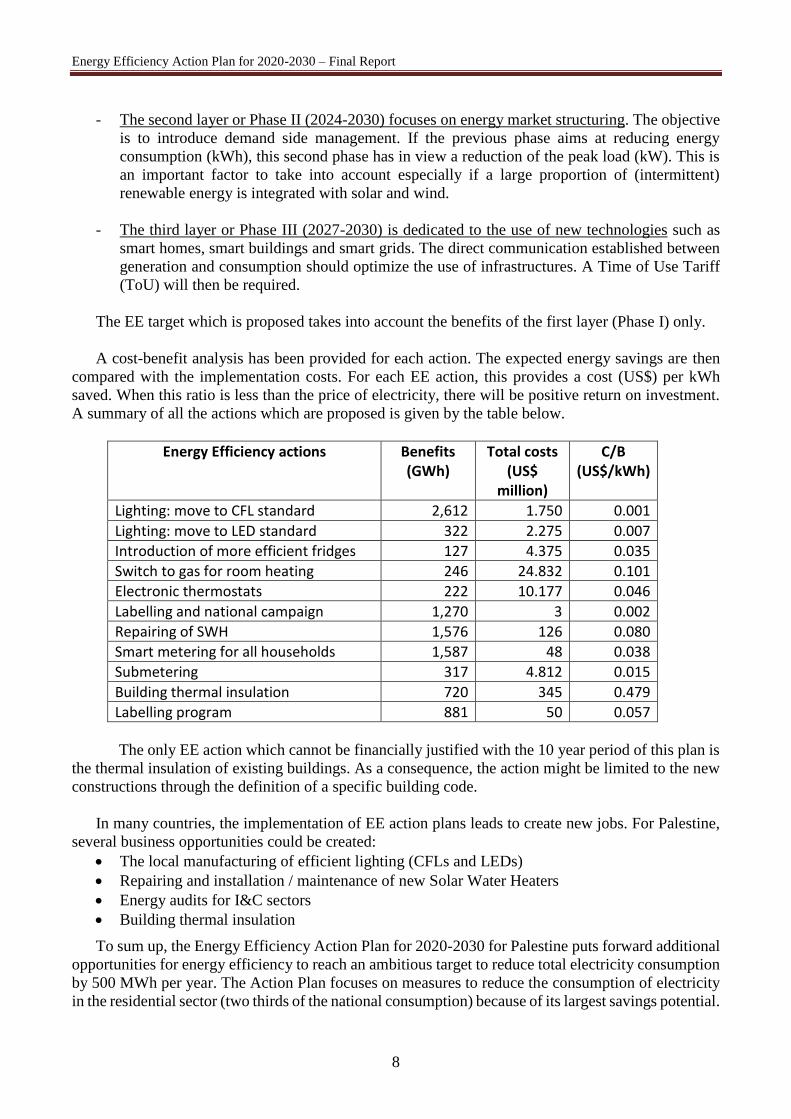
The EE target which is proposed takes into account the benefits of the first layer (Phase I) only.
A cost-benefit analysis has been provided for each action. The expected energy savings are then
compared with the implementation costs. For each EE action, this provides a cost (US$) per kWh
saved. When this ratio is less than the price of electricity, there will be positive return on investment.
A summary of all the actions which are proposed is given by the table below.
Energy Efficiency actions Benefits (GWh)
Total costs (US$
million)
C/B (US$/kWh)
Lighting: move to CFL standard 2,612 1.750 0.001
Lighting: move to LED standard 322 2.275 0.007
Introduction of more efficient fridges 127 4.375 0.035
Switch to gas for room heating 246 24.832 0.101
Electronic thermostats 222 10.177 0.046
Labelling and national campaign 1,270 3 0.002
Repairing of SWH 1,576 126 0.080
Smart metering for all households 1,587 48 0.038
Submetering 317 4.812 0.015
Building thermal insulation 720 345 0.479
Labelling program 881 50 0.057
The only EE action which cannot be financially justified with the 10 year period of this plan is
the thermal insulation of existing buildings. As a consequence, the action might be limited to the new
constructions through the definition of a specific building code.
In many countries, the implementation of EE action plans leads to create new jobs. For Palestine,
several business opportunities could be created:
The local manufacturing of efficient lighting (CFLs and LEDs)
Repairing and installation / maintenance of new Solar Water Heaters
Energy audits for I&C sectors
Building thermal insulation
To sum up, the Energy Efficiency Action Plan for 2020-2030 for Palestine puts forward additional
opportunities for energy efficiency to reach an ambitious target to reduce total electricity consumption
by 500 MWh per year. The Action Plan focuses on measures to reduce the consumption of electricity
in the residential sector (two thirds of the national consumption) because of its largest savings potential.
Energy Efficiency Action Plan for 2020-2030 – Final Report
9
Indeed, electricity is the main source of energy in the Palestinian energy mix, and for this source, the
residential sector is the main consumer. Other energy sources have their own leading consumption
sector. Diesel and gasoline are mainly consumed by the transport sector, LPG by the residential sector.
These sources might need also a specific EE action plan.
2. INTRODUCTION AND METHODOLOGY
2.1. Introduction
The Palestinian Energy and Natural Resources Authority (PENRA) currently oversees the
implementation of the National Energy Efficiency Action Plan (NEEAP) for the period 2012 to 2020,
which is divided in three phases. Phase I has been successfully achieved and Phase II is being
implemented satisfactorily.
The World Bank in partnership with PENRA, and in collaboration with the Agence Française de
Développement (AFD) prepared this Energy Efficiency Action Plan for 2020-2030 (also referred to as
NEEAP II) as a prolongation of the current plan. Based on the lessons learned and PENRA’s vision of
the sector, the NEEAP II introduces more ambitious energy efficiency targets. To be achieved, the
implementation of NEEAP II should start before 2020 in order to provide results early next decade.
Similar to the current plan, the NEEAP II mainly focuses on electricity since this form of energy has
the largest share in the Palestinian final energy mix. However, diesel3 is the second most used form of
energy and should be considered in a future study. Benchmarking with other MENA countries has
been introduced whenever possible in order to identify areas where Palestine is already well-advanced
and others where potential progress could be achieved.
2.2. Methodology
The methodology used in this draft NEEAP II encompasses the following five steps:
1. Demand forecasting: It is of paramount importance to know how final consumption of
energy will evolve to sustain the economic development of the country. When a country, and
this is the case for Palestine, is highly dependent on imports to satisfy the internal demand
for energy, it is vital to monitor the costs for purchasing primary energy. Energy efficiency
actions are mandatory when a cost reduction is targeted without neither impacting the
economic development nor reducing the quality of life of the population.
2. Segmentation of energy demand: The main objective is to identify the volume of
consumption per segment and potential savings. Several questions would need to be
answered: Who are the consumers? What are their equipment and appliances? What are their
behaviours? What is the energy efficiency potential for Palestine? The priority will be given
to the “low-hanging fruits”, i.e. a small action over a large volume. The use of alternative
sources of energy (wind, photovoltaic, biomass …) is not considered since these sources
contribute to produce electricity and not to reduce the demand. However, solar thermal
energy (e.g. for solar water heating) has to be considered since it reduces the consumption of
electricity when used for electric heaters.
3 From an economical perspective, electricity is mainly used by the residential sector (more than 60%) whereas diesel is
used almost exclusively by the transport sector.
Energy Efficiency Action Plan for 2020-2030 – Final Report
10
3. Review of electrical equipment technologies: The objective is to encourage the purchase
and the use of highly efficient products. This is quite obvious for existing products. In the
future, more efficient technologies or processes may become mature and affordable. In the
case of lighting, for example, traditional bulbs -Edison’s invention one century ago- have
been progressively replaced with CFLs (Compact Fluorescent Lamps) because their
consumption is only 20% of the bulbs, which in turn are being replaced with LED (Light
Emitting Diodes) consuming two or three time less and then, the introduction of infra-red
detectors to switch off when nobody is present in the room. The price of these new appliances
is generally higher than standard off-the-shelf products but, it is decreasing due to economies
of scale. The key point is to determine when this price is justified by the savings and when it
becomes affordable for a large number of customers.
4. Establish an energy saving target: Generally this target is expressed as a percentage of the
total consumption for a given milestone or as a reduction of the forecasted growth rate of the
demand. NEEAP 2010-2020 set the target for this period as a reduction of 383 GWh of the
demand (~1% per year, compared to 2010 electricity consumption level).
5. Identify required Energy Efficiency actions: The objective is to identify the most cost-
effective actions to reduce the forecasted consumption and reach the target. Because of the
segmentation of the usages and the selection of appropriate technologies, it will be possible
to recommend new products, the replacement of pieces of equipment, etc. To ensure the cost-
effectiveness of each proposed action, a cost-benefit analysis is performed. Also, indicators
are defined for each action so that an objective measure of the results can be done during and
after implementation.
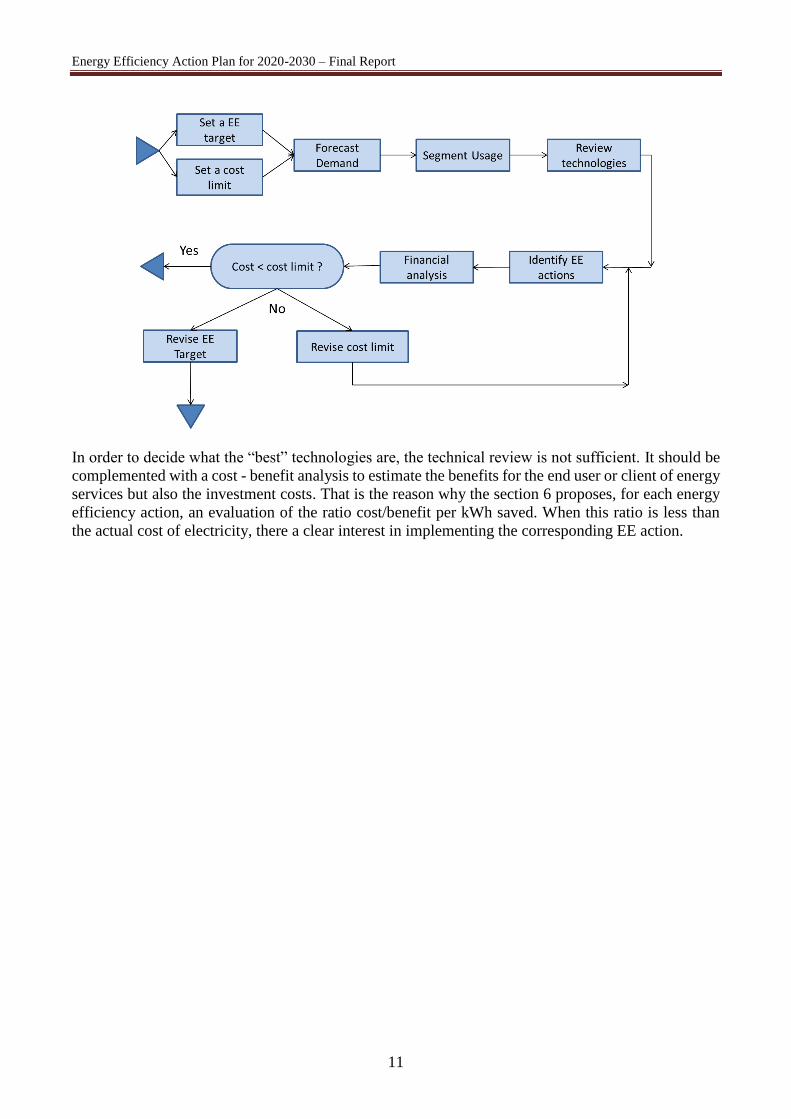
The flow-chart below illustrates the methodology for drafting the NEEAP II. Since an investment
needs to occur before obtaining any savings, it is helpful to compare the implementation costs with a
given cost limit. When a new EE action is added to the proposed NEEAP II, the corresponding
additional cost is compared with the cost limit. An iterative mechanism is then used to adjust the Action
Plan so that the target can be reached within the cost limit. If this is not possible, either the target or
the cost limit shall be revised.
Energy Efficiency Action Plan for 2020-2030 – Final Report
11
In order to decide what the “best” technologies are, the technical review is not sufficient. It should be
complemented with a cost - benefit analysis to estimate the benefits for the end user or client of energy
services but also the investment costs. That is the reason why the section 6 proposes, for each energy
efficiency action, an evaluation of the ratio cost/benefit per kWh saved. When this ratio is less than
the actual cost of electricity, there a clear interest in implementing the corresponding EE action.
Energy Efficiency Action Plan for 2020-2030 – Final Report
12
3. ENERGY AND EE MARKET REVIEW AND DIAGNOSTIC
3.1. Key general indicators
Palestine is composed of two territories, the West Bank and the Gaza Strip, which have different
characteristics: population growth rate, energy consumption, population density, economic activities,
etc. In this report, the weighted average between West Bank and Gaza is taken into account.
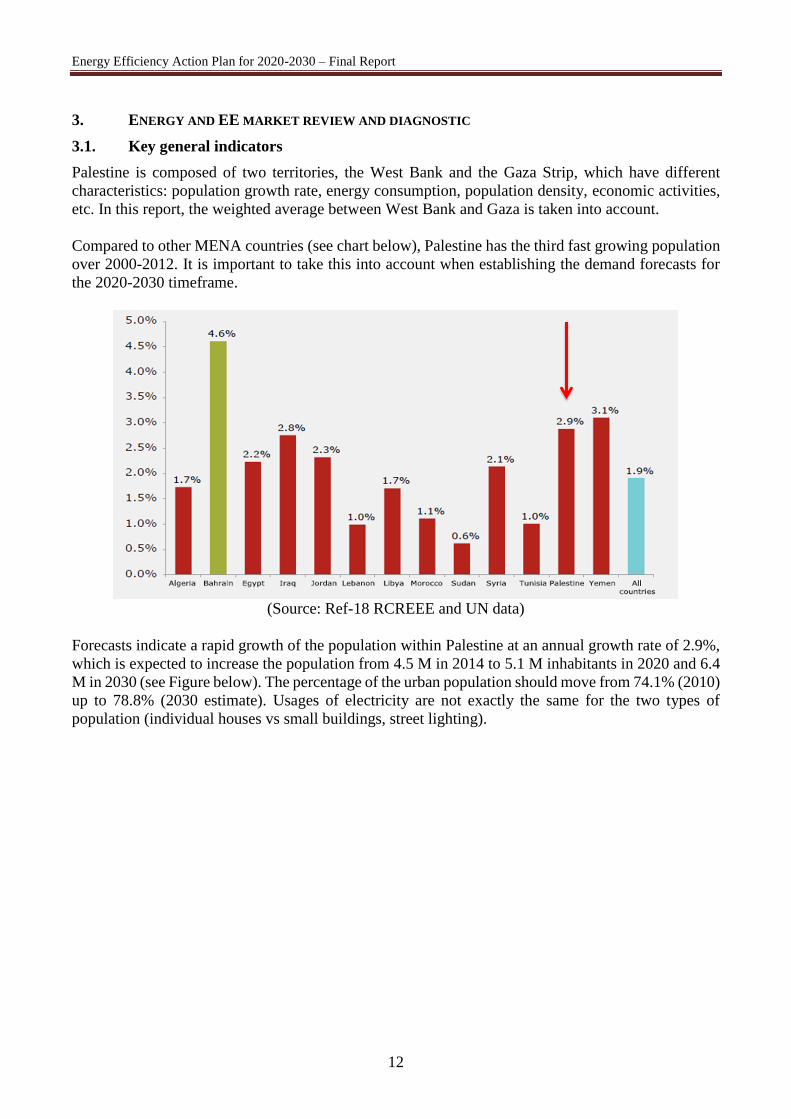
Compared to other MENA countries (see chart below), Palestine has the third fast growing population
over 2000-2012. It is important to take this into account when establishing the demand forecasts for
the 2020-2030 timeframe.
(Source: Ref-18 RCREEE and UN data)
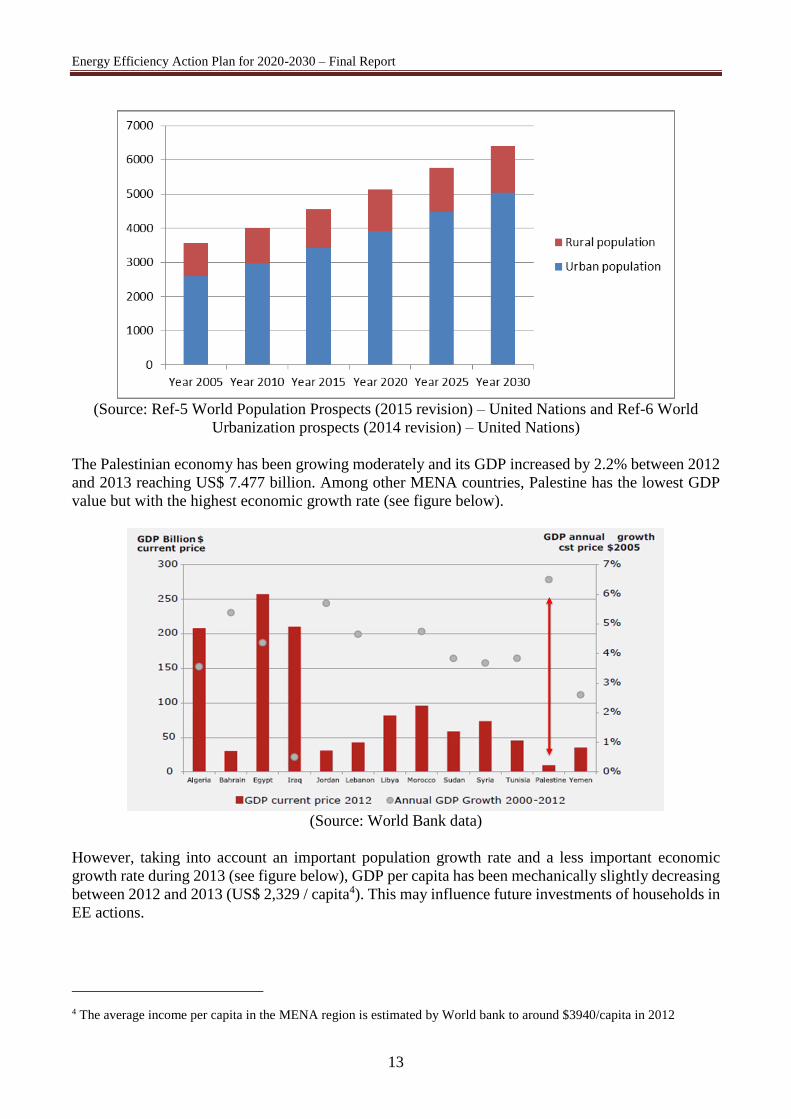
Forecasts indicate a rapid growth of the population within Palestine at an annual growth rate of 2.9%,
which is expected to increase the population from 4.5 M in 2014 to 5.1 M inhabitants in 2020 and 6.4
M in 2030 (see Figure below). The percentage of the urban population should move from 74.1% (2010)
up to 78.8% (2030 estimate). Usages of electricity are not exactly the same for the two types of
population (individual houses vs small buildings, street lighting).
Energy Efficiency Action Plan for 2020-2030 – Final Report
13
(Source: Ref-5 World Population Prospects (2015 revision) – United Nations and Ref-6 World
Urbanization prospects (2014 revision) – United Nations)
The Palestinian economy has been growing moderately and its GDP increased by 2.2% between 2012
and 2013 reaching US$ 7.477 billion. Among other MENA countries, Palestine has the lowest GDP
value but with the highest economic growth rate (see figure below).
(Source: World Bank data)
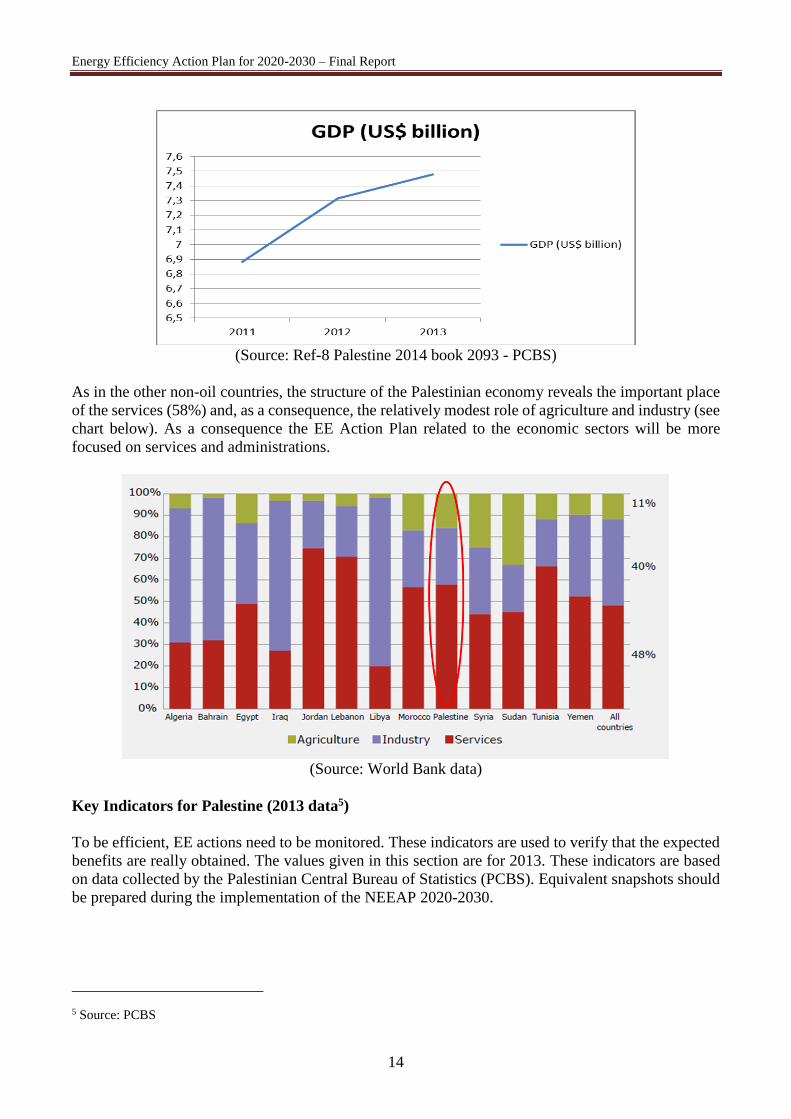
However, taking into account an important population growth rate and a less important economic
growth rate during 2013 (see figure below), GDP per capita has been mechanically slightly decreasing
between 2012 and 2013 (US$ 2,329 / capita4). This may influence future investments of households in
EE actions.
4 The average income per capita in the MENA region is estimated by World bank to around $3940/capita in 2012
Energy Efficiency Action Plan for 2020-2030 – Final Report
14
(Source: Ref-8 Palestine 2014 book 2093 - PCBS)
As in the other non-oil countries, the structure of the Palestinian economy reveals the important place
of the services (58%) and, as a consequence, the relatively modest role of agriculture and industry (see
chart below). As a consequence the EE Action Plan related to the economic sectors will be more
focused on services and administrations.
(Source: World Bank data)
Key Indicators for Palestine (2013 data5)
To be efficient, EE actions need to be monitored. These indicators are used to verify that the expected
benefits are really obtained. The values given in this section are for 2013. These indicators are based
on data collected by the Palestinian Central Bureau of Statistics (PCBS). Equivalent snapshots should
be prepared during the implementation of the NEEAP 2020-2030.
5 Source: PCBS
Energy Efficiency Action Plan for 2020-2030 – Final Report
15
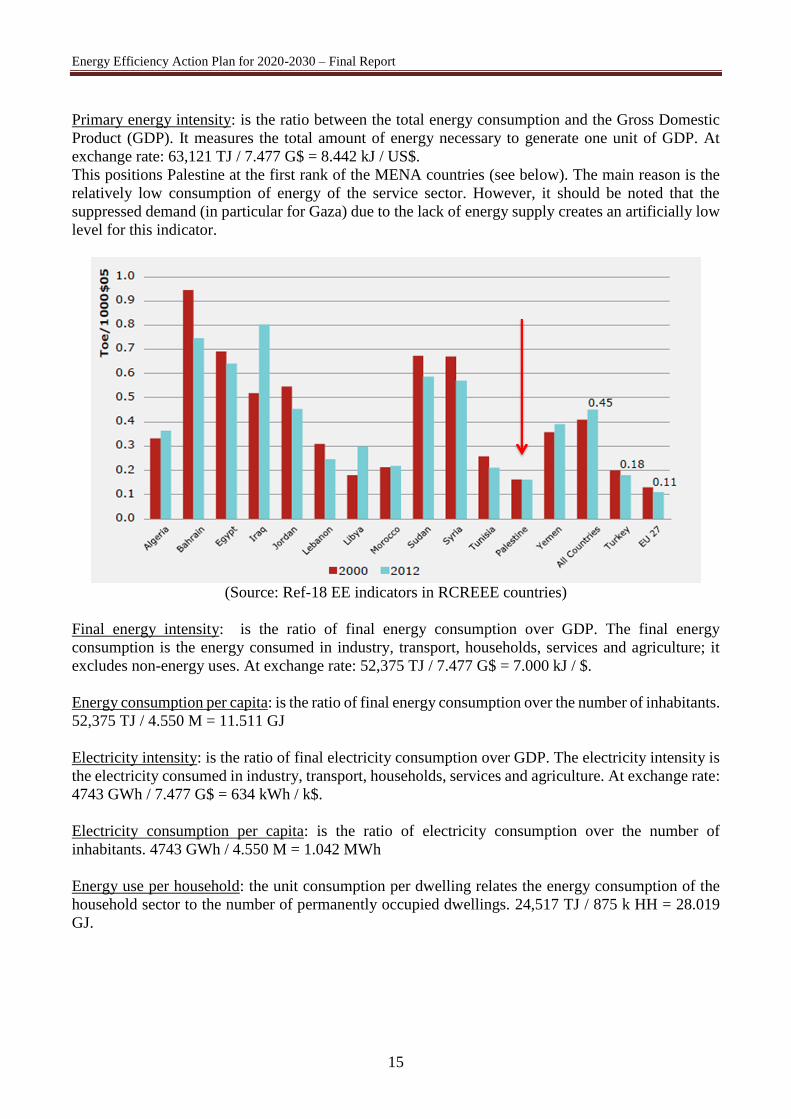
Primary energy intensity: is the ratio between the total energy consumption and the Gross Domestic
Product (GDP). It measures the total amount of energy necessary to generate one unit of GDP. At
exchange rate: 63,121 TJ / 7.477 G$ = 8.442 kJ / US$.
This positions Palestine at the first rank of the MENA countries (see below). The main reason is the
relatively low consumption of energy of the service sector. However, it should be noted that the
suppressed demand (in particular for Gaza) due to the lack of energy supply creates an artificially low
level for this indicator.
(Source: Ref-18 EE indicators in RCREEE countries)
Final energy intensity: is the ratio of final energy consumption over GDP. The final energy
consumption is the energy consumed in industry, transport, households, services and agriculture; it
excludes non-energy uses. At exchange rate: 52,375 TJ / 7.477 G$ = 7.000 kJ / $.
Energy consumption per capita: is the ratio of final energy consumption over the number of inhabitants.
52,375 TJ / 4.550 M = 11.511 GJ
Electricity intensity: is the ratio of final electricity consumption over GDP. The electricity intensity is
the electricity consumed in industry, transport, households, services and agriculture. At exchange rate:
4743 GWh / 7.477 G$ = 634 kWh / k$.
Electricity consumption per capita: is the ratio of electricity consumption over the number of
inhabitants. 4743 GWh / 4.550 M = 1.042 MWh
Energy use per household: the unit consumption per dwelling relates the energy consumption of the
household sector to the number of permanently occupied dwellings. 24,517 TJ / 875 k HH = 28.019
GJ.
Energy Efficiency Action Plan for 2020-2030 – Final Report
16
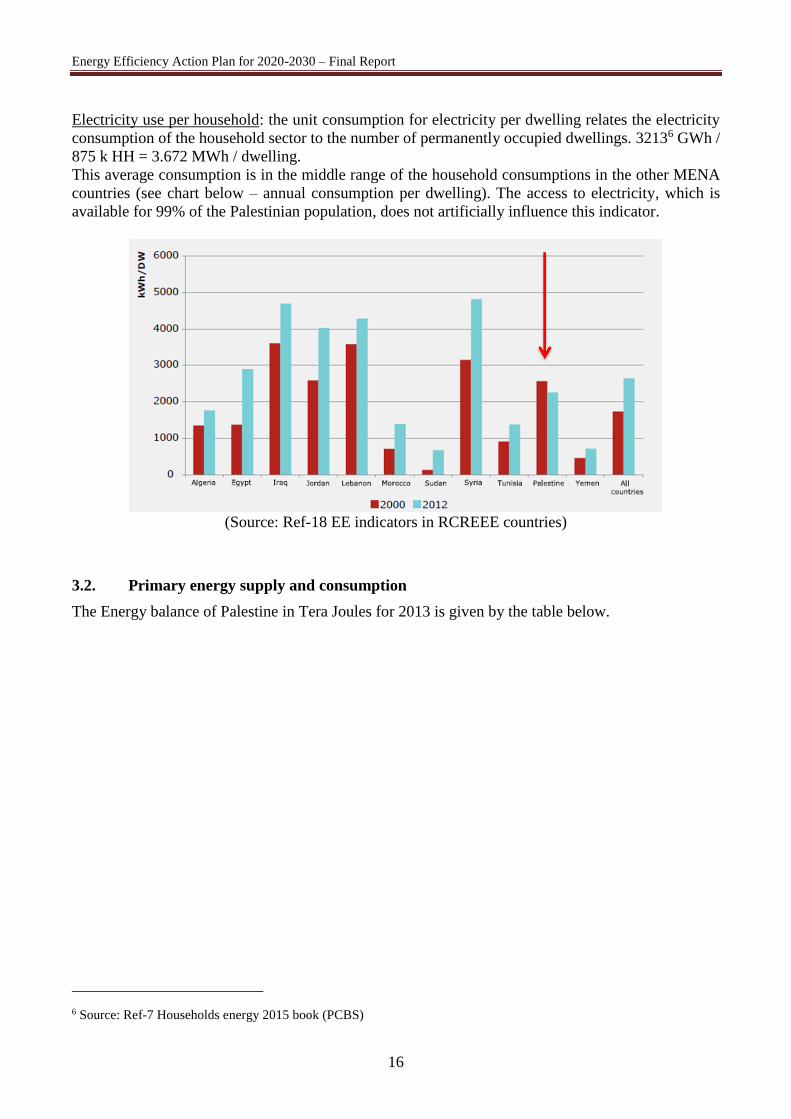
Electricity use per household: the unit consumption for electricity per dwelling relates the electricity
consumption of the household sector to the number of permanently occupied dwellings. 32136 GWh /
875 k HH = 3.672 MWh / dwelling.
This average consumption is in the middle range of the household consumptions in the other MENA
countries (see chart below – annual consumption per dwelling). The access to electricity, which is
available for 99% of the Palestinian population, does not artificially influence this indicator.
(Source: Ref-18 EE indicators in RCREEE countries)
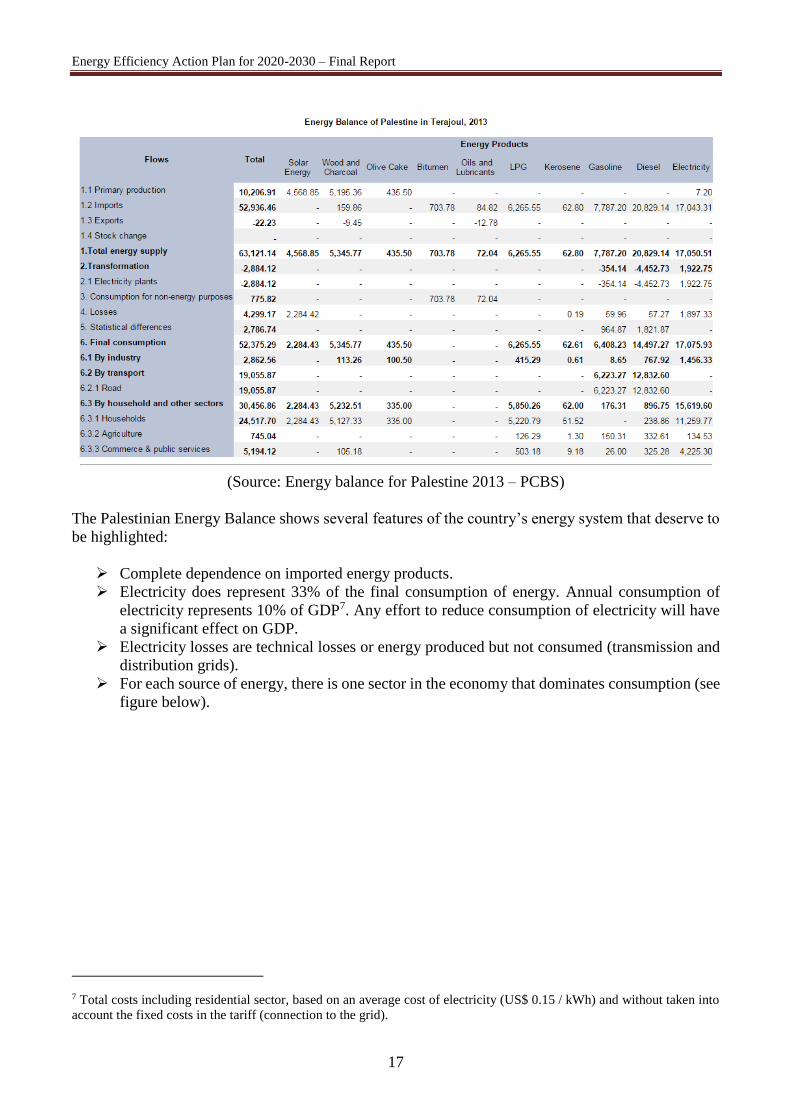
3.2. Primary energy supply and consumption
The Energy balance of Palestine in Tera Joules for 2013 is given by the table below.
6 Source: Ref-7 Households energy 2015 book (PCBS)
Energy Efficiency Action Plan for 2020-2030 – Final Report
17
(Source: Energy balance for Palestine 2013 – PCBS)
The Palestinian Energy Balance shows several features of the country’s energy system that deserve to
be highlighted:
Complete dependence on imported energy products.
Electricity does represent 33% of the final consumption of energy. Annual consumption of
electricity represents 10% of GDP7. Any effort to reduce consumption of electricity will have
a significant effect on GDP.
Electricity losses are technical losses or energy produced but not consumed (transmission and
distribution grids).
For each source of energy, there is one sector in the economy that dominates consumption (see
figure below).
7 Total costs including residential sector, based on an average cost of electricity (US$ 0.15 / kWh) and without taken into
account the fixed costs in the tariff (connection to the grid).
Energy Efficiency Action Plan for 2020-2030 – Final Report
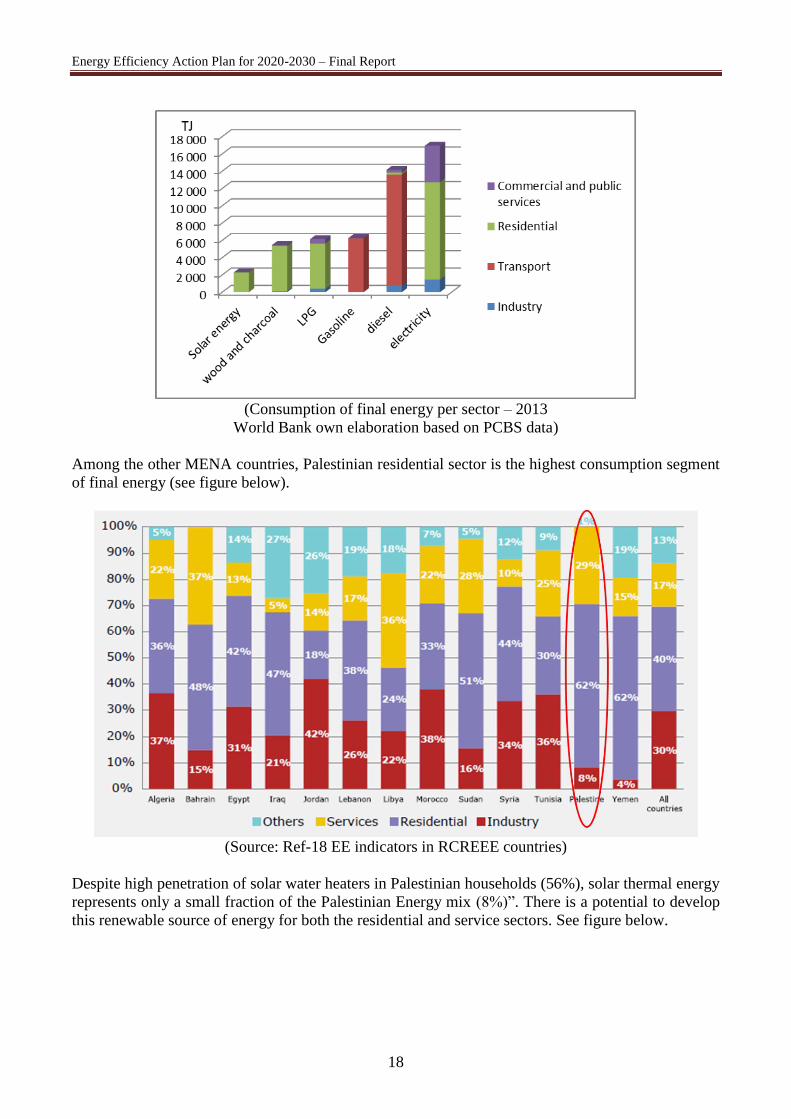
18
(Consumption of final energy per sector – 2013
World Bank own elaboration based on PCBS data)
Among the other MENA countries, Palestinian residential sector is the highest consumption segment
of final energy (see figure below).
(Source: Ref-18 EE indicators in RCREEE countries)
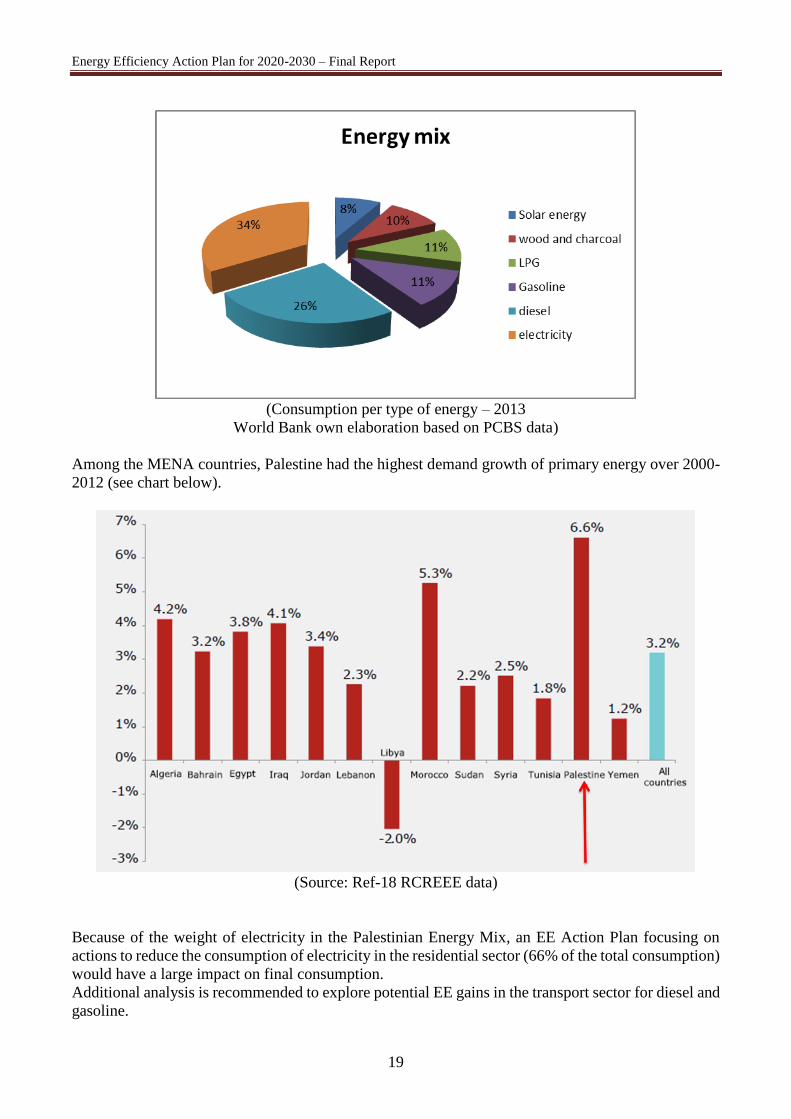
Despite high penetration of solar water heaters in Palestinian households (56%), solar thermal energy
represents only a small fraction of the Palestinian Energy mix (8%)”. There is a potential to develop
this renewable source of energy for both the residential and service sectors. See figure below.
Energy Efficiency Action Plan for 2020-2030 – Final Report
19
(Consumption per type of energy – 2013
World Bank own elaboration based on PCBS data)
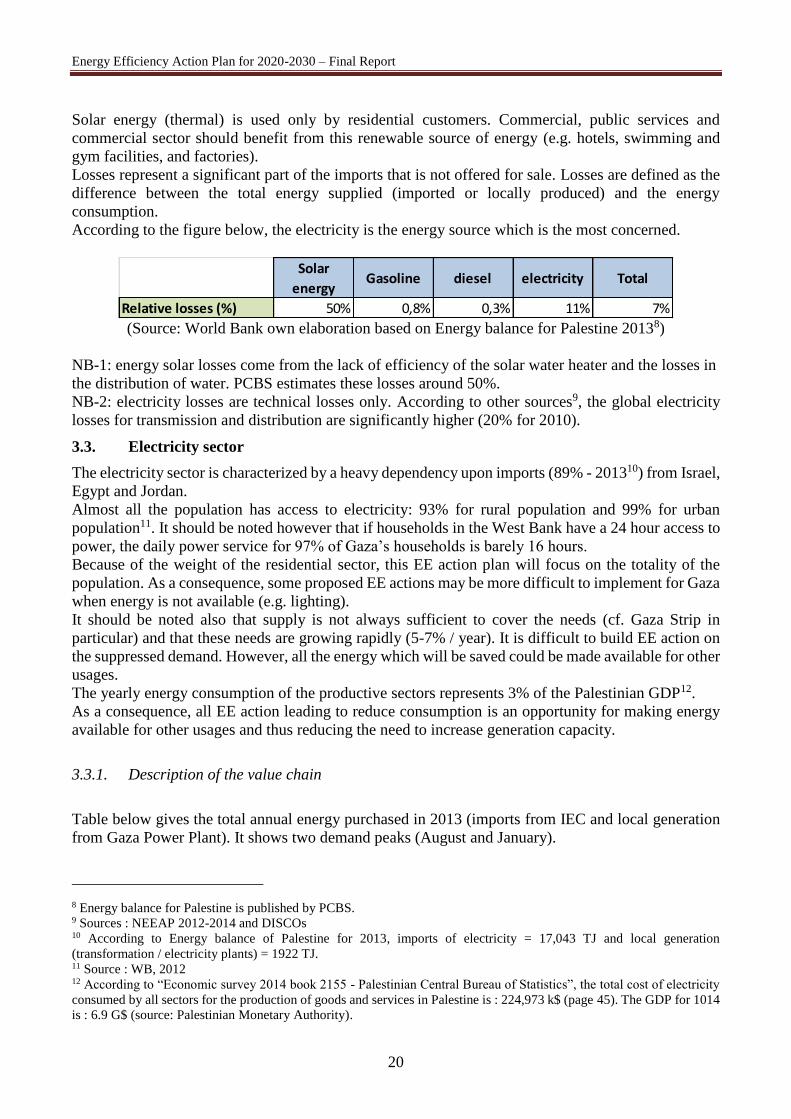
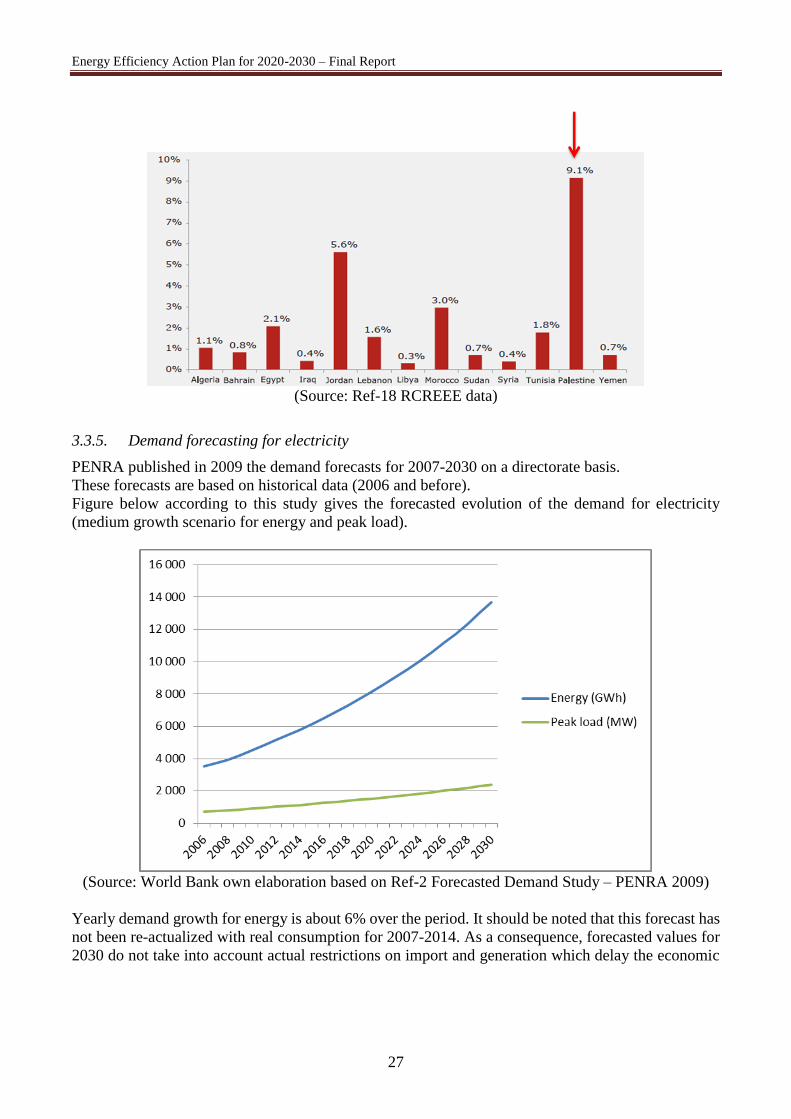
Among the MENA countries, Palestine had the highest demand growth of primary energy over 2000-
2012 (see chart below).
(Source: Ref-18 RCREEE data)
Because of the weight of electricity in the Palestinian Energy Mix, an EE Action Plan focusing on
actions to reduce the consumption of electricity in the residential sector (66% of the total consumption)
would have a large impact on final consumption.
Additional analysis is recommended to explore potential EE gains in the transport sector for diesel and
gasoline.
Energy Efficiency Action Plan for 2020-2030 – Final Report
20
Solar energy (thermal) is used only by residential customers. Commercial, public services and
commercial sector should benefit from this renewable source of energy (e.g. hotels, swimming and
gym facilities, and factories).
Losses represent a significant part of the imports that is not offered for sale. Losses are defined as the
difference between the total energy supplied (imported or locally produced) and the energy
consumption.
According to the figure below, the electricity is the energy source which is the most concerned.
(Source: World Bank own elaboration based on Energy balance for Palestine 20138)
NB-1: energy solar losses come from the lack of efficiency of the solar water heater and the losses in
the distribution of water. PCBS estimates these losses around 50%.
NB-2: electricity losses are technical losses only. According to other sources9, the global electricity
losses for transmission and distribution are significantly higher (20% for 2010).
3.3. Electricity sector
The electricity sector is characterized by a heavy dependency upon imports (89% - 201310) from Israel,
Egypt and Jordan.
Almost all the population has access to electricity: 93% for rural population and 99% for urban
population11. It should be noted however that if households in the West Bank have a 24 hour access to
power, the daily power service for 97% of Gaza’s households is barely 16 hours.
Because of the weight of the residential sector, this EE action plan will focus on the totality of the
population. As a consequence, some proposed EE actions may be more difficult to implement for Gaza
when energy is not available (e.g. lighting).
It should be noted also that supply is not always sufficient to cover the needs (cf. Gaza Strip in
particular) and that these needs are growing rapidly (5-7% / year). It is difficult to build EE action on
the suppressed demand. However, all the energy which will be saved could be made available for other
usages.
The yearly energy consumption of the productive sectors represents 3% of the Palestinian GDP12.
As a consequence, all EE action leading to reduce consumption is an opportunity for making energy
available for other usages and thus reducing the need to increase generation capacity.
3.3.1. Description of the value chain
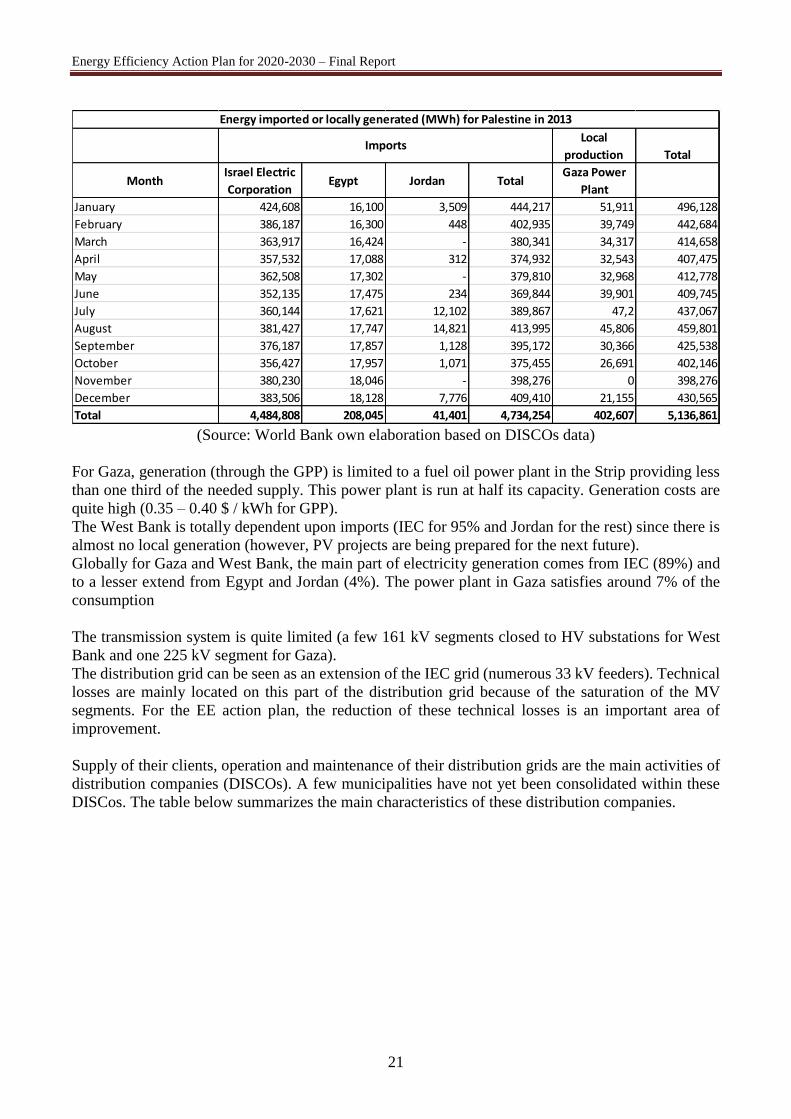
Table below gives the total annual energy purchased in 2013 (imports from IEC and local generation
from Gaza Power Plant). It shows two demand peaks (August and January).
8 Energy balance for Palestine is published by PCBS. 9 Sources : NEEAP 2012-2014 and DISCOs 10 According to Energy balance of Palestine for 2013, imports of electricity = 17,043 TJ and local generation
(transformation / electricity plants) = 1922 TJ. 11 Source : WB, 2012 12 According to “Economic survey 2014 book 2155 - Palestinian Central Bureau of Statistics”, the total cost of electricity
consumed by all sectors for the production of goods and services in Palestine is : 224,973 k$ (page 45). The GDP for 1014
is : 6.9 G$ (source: Palestinian Monetary Authority).
Solar
energyGasoline diesel electricity Total
Relative losses (%) 50% 0,8% 0,3% 11% 7%
Energy Efficiency Action Plan for 2020-2030 – Final Report
21
(Source: World Bank own elaboration based on DISCOs data)
For Gaza, generation (through the GPP) is limited to a fuel oil power plant in the Strip providing less
than one third of the needed supply. This power plant is run at half its capacity. Generation costs are
quite high (0.35 – 0.40 $ / kWh for GPP).
The West Bank is totally dependent upon imports (IEC for 95% and Jordan for the rest) since there is
almost no local generation (however, PV projects are being prepared for the next future).
Globally for Gaza and West Bank, the main part of electricity generation comes from IEC (89%) and
to a lesser extend from Egypt and Jordan (4%). The power plant in Gaza satisfies around 7% of the
consumption
The transmission system is quite limited (a few 161 kV segments closed to HV substations for West
Bank and one 225 kV segment for Gaza).
The distribution grid can be seen as an extension of the IEC grid (numerous 33 kV feeders). Technical
losses are mainly located on this part of the distribution grid because of the saturation of the MV
segments. For the EE action plan, the reduction of these technical losses is an important area of
improvement.
Supply of their clients, operation and maintenance of their distribution grids are the main activities of
distribution companies (DISCOs). A few municipalities have not yet been consolidated within these
DISCos. The table below summarizes the main characteristics of these distribution companies.
Local
production Total
MonthIsrael Electric
CorporationEgypt Jordan Total
Gaza Power
Plant
January 424,608 16,100 3,509 444,217 51,911 496,128
February 386,187 16,300 448 402,935 39,749 442,684
March 363,917 16,424 - 380,341 34,317 414,658
April 357,532 17,088 312 374,932 32,543 407,475
May 362,508 17,302 - 379,810 32,968 412,778
June 352,135 17,475 234 369,844 39,901 409,745
July 360,144 17,621 12,102 389,867 47,2 437,067
August 381,427 17,747 14,821 413,995 45,806 459,801
September 376,187 17,857 1,128 395,172 30,366 425,538
October 356,427 17,957 1,071 375,455 26,691 402,146
November 380,230 18,046 - 398,276 0 398,276
December 383,506 18,128 7,776 409,410 21,155 430,565
Total 4,484,808 208,045 41,401 4,734,254 402,607 5,136,861
Energy imported or locally generated (MWh) for Palestine in 2013
Imports
Energy Efficiency Action Plan for 2020-2030 – Final Report
22
(Source: PERC 2011 annual report, WB Assessment and action plan to improve payment for
electricity services in the Palestinian Territories)
3.3.2. Electricity usages
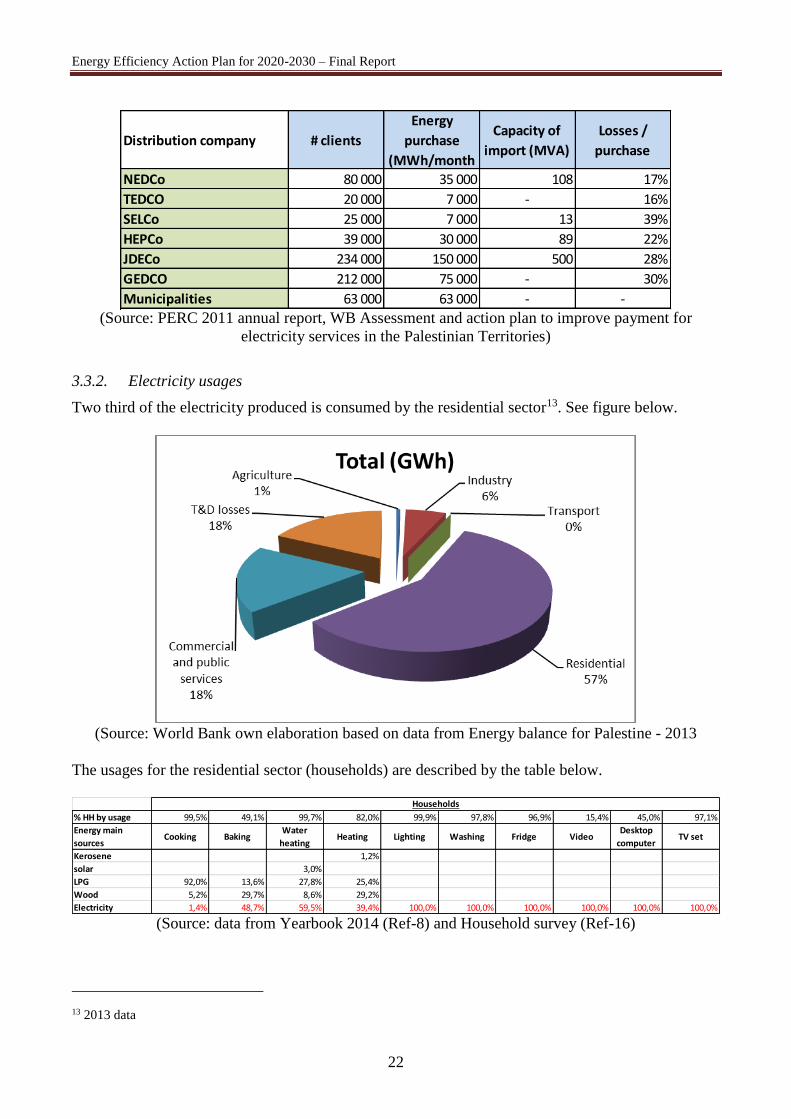
Two third of the electricity produced is consumed by the residential sector13. See figure below.
(Source: World Bank own elaboration based on data from Energy balance for Palestine - 2013
The usages for the residential sector (households) are described by the table below.
(Source: data from Yearbook 2014 (Ref-8) and Household survey (Ref-16)
13 2013 data
Distribution company # clients
Energy
purchase
(MWh/month
Capacity of
import (MVA)
Losses /
purchase
NEDCo 80 000 35 000 108 17%
TEDCO 20 000 7 000 - 16%
SELCo 25 000 7 000 13 39%
HEPCo 39 000 30 000 89 22%
JDECo 234 000 150 000 500 28%
GEDCO 212 000 75 000 - 30%
Municipalities 63 000 63 000 - -
% HH by usage 99,5% 49,1% 99,7% 82,0% 99,9% 97,8% 96,9% 15,4% 45,0% 97,1%
Energy main
sourcesCooking Baking
Water
heatingHeating Lighting Washing Fridge Video
Desktop
computerTV set
Kerosene 1,2%
solar 3,0%
LPG 92,0% 13,6% 27,8% 25,4%
Wood 5,2% 29,7% 8,6% 29,2%
Electricity 1,4% 48,7% 59,5% 39,4% 100,0% 100,0% 100,0% 100,0% 100,0% 100,0%
Households
Energy Efficiency Action Plan for 2020-2030 – Final Report
23
The use of energy for cooking, water heating, lighting, washing and fridge is almost common for all
households (97-99% of the households).
NB: Several sources of energy may be used for a given usage (heating for instance); only the main
source has been taken into account in the above table.
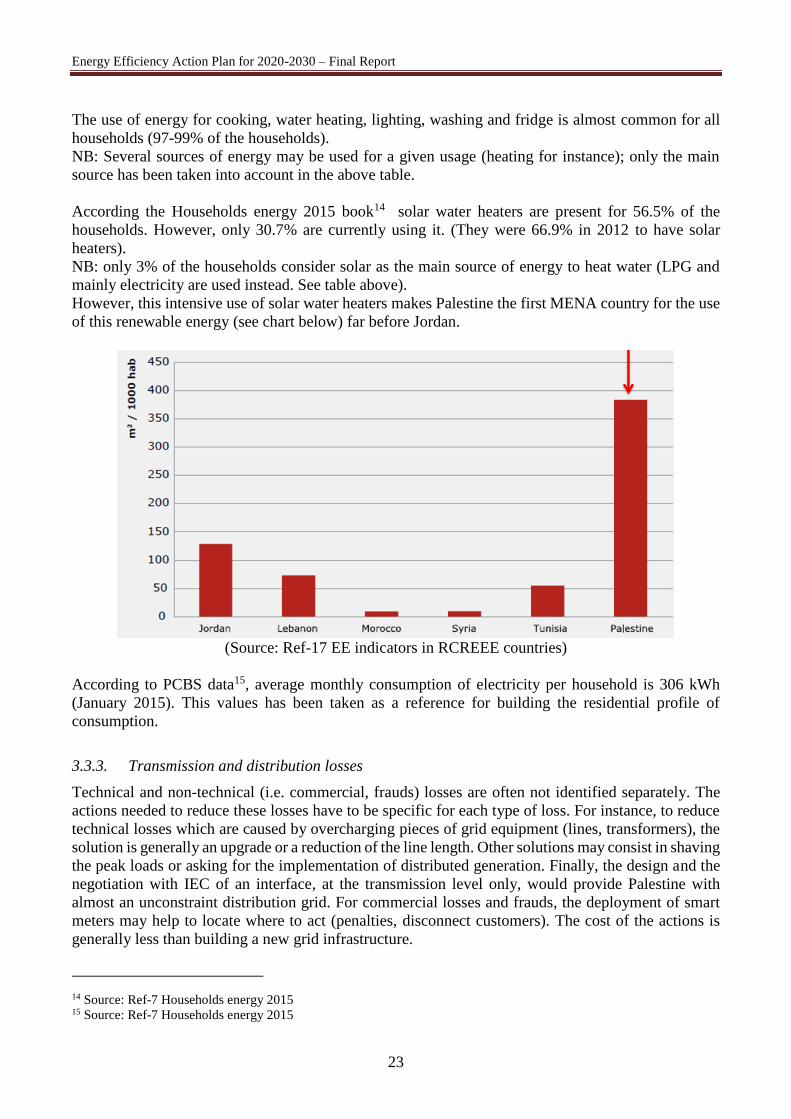
According the Households energy 2015 book14 solar water heaters are present for 56.5% of the
households. However, only 30.7% are currently using it. (They were 66.9% in 2012 to have solar
heaters).
NB: only 3% of the households consider solar as the main source of energy to heat water (LPG and
mainly electricity are used instead. See table above).
However, this intensive use of solar water heaters makes Palestine the first MENA country for the use
of this renewable energy (see chart below) far before Jordan.
(Source: Ref-17 EE indicators in RCREEE countries)
According to PCBS data15, average monthly consumption of electricity per household is 306 kWh
(January 2015). This values has been taken as a reference for building the residential profile of
consumption.
3.3.3. Transmission and distribution losses
Technical and non-technical (i.e. commercial, frauds) losses are often not identified separately. The
actions needed to reduce these losses have to be specific for each type of loss. For instance, to reduce
technical losses which are caused by overcharging pieces of grid equipment (lines, transformers), the
solution is generally an upgrade or a reduction of the line length. Other solutions may consist in shaving
the peak loads or asking for the implementation of distributed generation. Finally, the design and the
negotiation with IEC of an interface, at the transmission level only, would provide Palestine with
almost an unconstraint distribution grid. For commercial losses and frauds, the deployment of smart
meters may help to locate where to act (penalties, disconnect customers). The cost of the actions is
generally less than building a new grid infrastructure.
14 Source: Ref-7 Households energy 2015 15 Source: Ref-7 Households energy 2015
Energy Efficiency Action Plan for 2020-2030 – Final Report
24
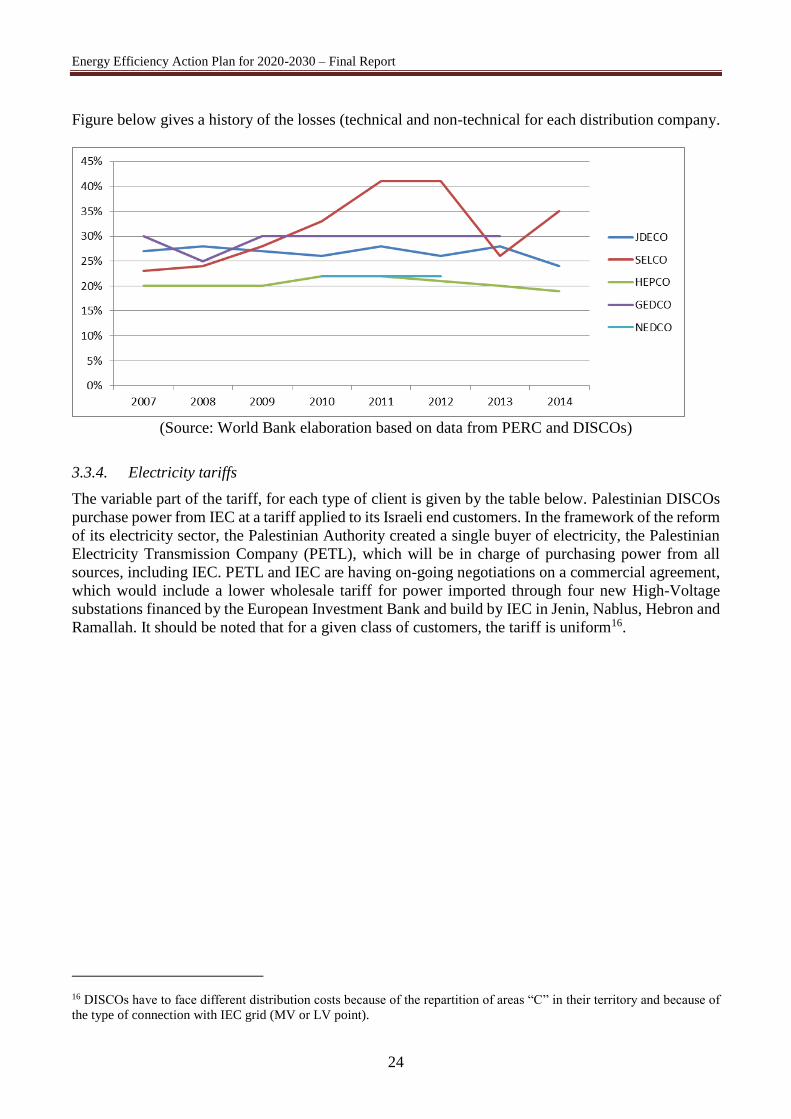
Figure below gives a history of the losses (technical and non-technical for each distribution company.
(Source: World Bank elaboration based on data from PERC and DISCOs)
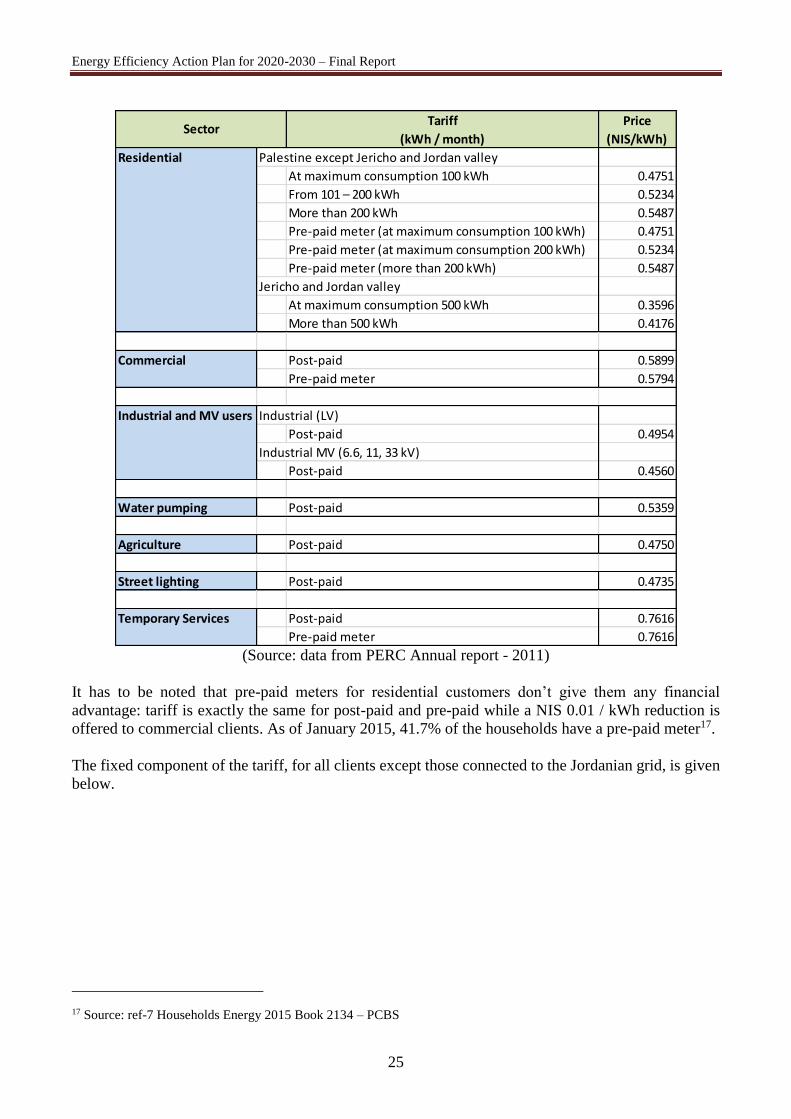
3.3.4. Electricity tariffs
The variable part of the tariff, for each type of client is given by the table below. Palestinian DISCOs
purchase power from IEC at a tariff applied to its Israeli end customers. In the framework of the reform
of its electricity sector, the Palestinian Authority created a single buyer of electricity, the Palestinian
Electricity Transmission Company (PETL), which will be in charge of purchasing power from all
sources, including IEC. PETL and IEC are having on-going negotiations on a commercial agreement,
which would include a lower wholesale tariff for power imported through four new High-Voltage
substations financed by the European Investment Bank and build by IEC in Jenin, Nablus, Hebron and
Ramallah. It should be noted that for a given class of customers, the tariff is uniform16.
16 DISCOs have to face different distribution costs because of the repartition of areas “C” in their territory and because of
the type of connection with IEC grid (MV or LV point).
Energy Efficiency Action Plan for 2020-2030 – Final Report
25
(Source: data from PERC Annual report - 2011)
It has to be noted that pre-paid meters for residential customers don’t give them any financial
advantage: tariff is exactly the same for post-paid and pre-paid while a NIS 0.01 / kWh reduction is
offered to commercial clients. As of January 2015, 41.7% of the households have a pre-paid meter17.
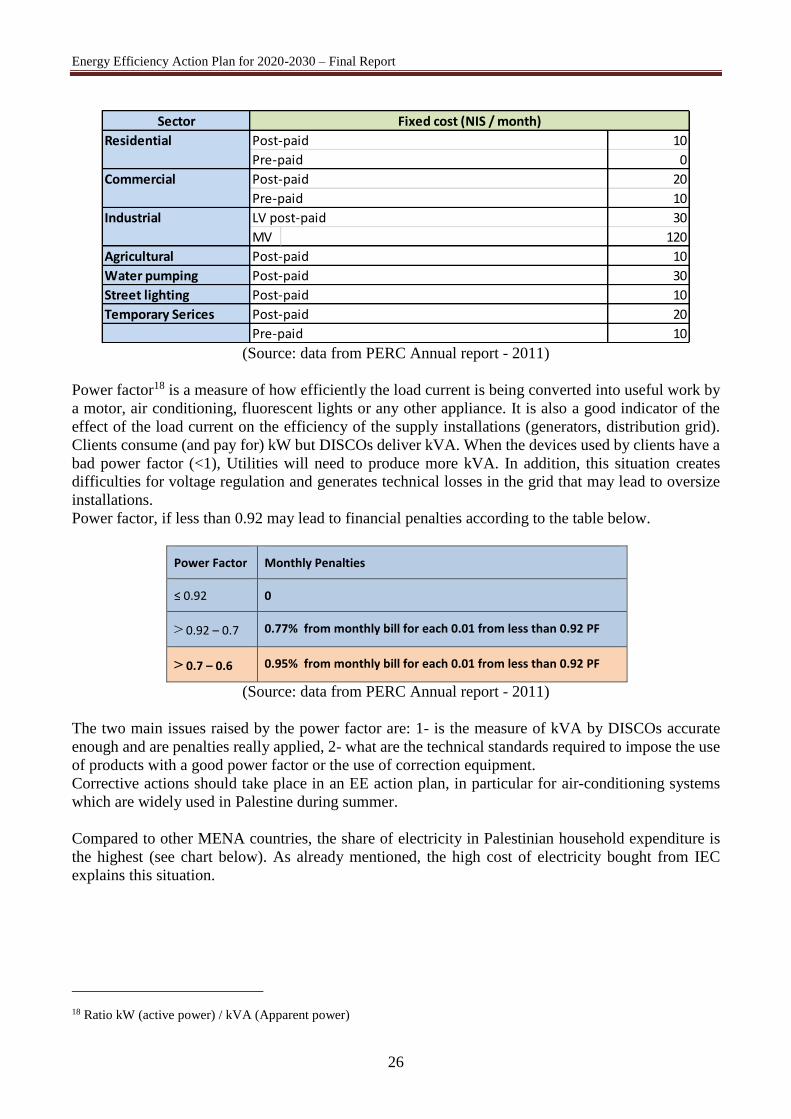
The fixed component of the tariff, for all clients except those connected to the Jordanian grid, is given
below.
17 Source: ref-7 Households Energy 2015 Book 2134 – PCBS
Tariff
(kWh / month)
Price
(NIS/kWh)
Residential Palestine except Jericho and Jordan valley
At maximum consumption 100 kWh 0.4751
From 101 – 200 kWh 0.5234
More than 200 kWh 0.5487
Pre-paid meter (at maximum consumption 100 kWh) 0.4751
Pre-paid meter (at maximum consumption 200 kWh) 0.5234
Pre-paid meter (more than 200 kWh) 0.5487
Jericho and Jordan valley
At maximum consumption 500 kWh 0.3596
More than 500 kWh 0.4176
Commercial Post-paid 0.5899
Pre-paid meter 0.5794
Industrial and MV users Industrial (LV)
Post-paid 0.4954
Industrial MV (6.6, 11, 33 kV)
Post-paid 0.4560
Water pumping Post-paid 0.5359
Agriculture Post-paid 0.4750
Street lighting Post-paid 0.4735
Temporary Services Post-paid 0.7616
Pre-paid meter 0.7616
Sector
Energy Efficiency Action Plan for 2020-2030 – Final Report
26
(Source: data from PERC Annual report - 2011)
Power factor18 is a measure of how efficiently the load current is being converted into useful work by
a motor, air conditioning, fluorescent lights or any other appliance. It is also a good indicator of the
effect of the load current on the efficiency of the supply installations (generators, distribution grid).
Clients consume (and pay for) kW but DISCOs deliver kVA. When the devices used by clients have a
bad power factor (<1), Utilities will need to produce more kVA. In addition, this situation creates
difficulties for voltage regulation and generates technical losses in the grid that may lead to oversize
installations.
Power factor, if less than 0.92 may lead to financial penalties according to the table below.
Power Factor Monthly Penalties
≤ 0.92 0
< 0.92 – 0.7 0.77% from monthly bill for each 0.01 from less than 0.92 PF
< 0.7 – 0.6 0.95% from monthly bill for each 0.01 from less than 0.92 PF
(Source: data from PERC Annual report - 2011)
The two main issues raised by the power factor are: 1- is the measure of kVA by DISCOs accurate
enough and are penalties really applied, 2- what are the technical standards required to impose the use
of products with a good power factor or the use of correction equipment.
Corrective actions should take place in an EE action plan, in particular for air-conditioning systems
which are widely used in Palestine during summer.
Compared to other MENA countries, the share of electricity in Palestinian household expenditure is
the highest (see chart below). As already mentioned, the high cost of electricity bought from IEC
explains this situation.
18 Ratio kW (active power) / kVA (Apparent power)
Sector
Residential Post-paid 10
Pre-paid 0
Commercial Post-paid 20
Pre-paid 10
Industrial LV post-paid 30
MV 120
Agricultural Post-paid 10
Water pumping Post-paid 30
Street lighting Post-paid 10
Temporary Serices Post-paid 20
Pre-paid 10
Fixed cost (NIS / month)
Energy Efficiency Action Plan for 2020-2030 – Final Report
27
(Source: Ref-18 RCREEE data)
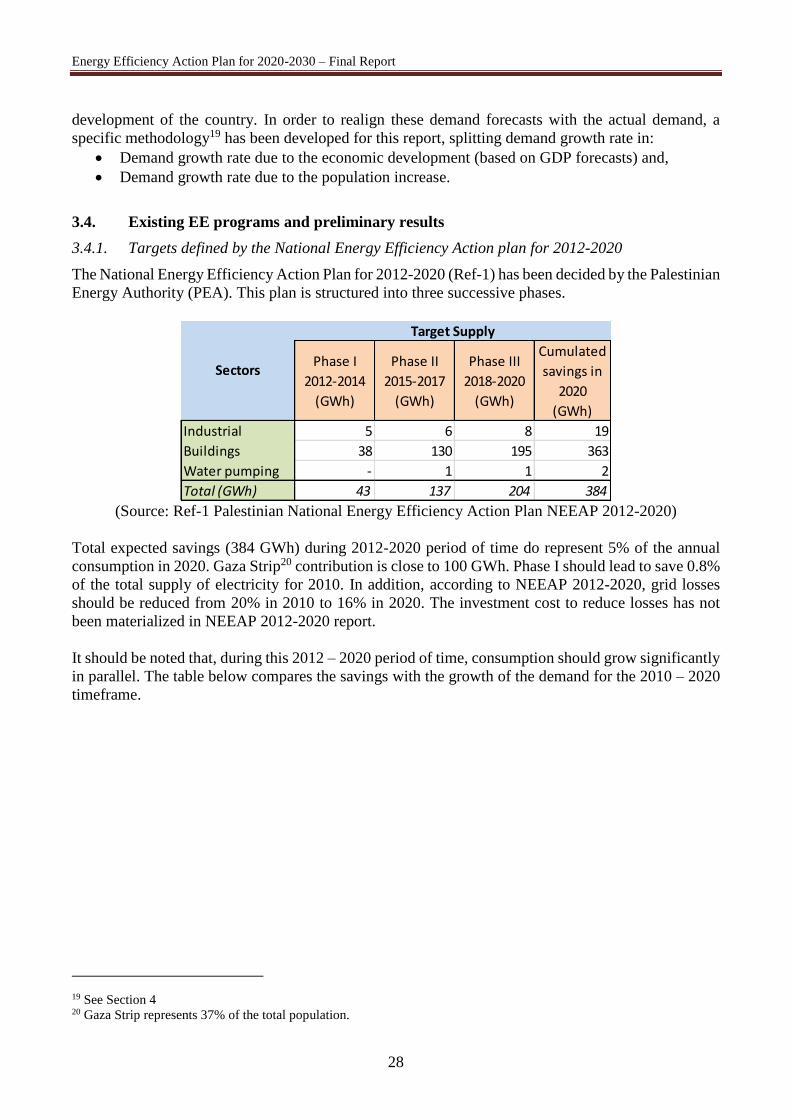
3.3.5. Demand forecasting for electricity
PENRA published in 2009 the demand forecasts for 2007-2030 on a directorate basis.
These forecasts are based on historical data (2006 and before).
Figure below according to this study gives the forecasted evolution of the demand for electricity
(medium growth scenario for energy and peak load).
(Source: World Bank own elaboration based on Ref-2 Forecasted Demand Study – PENRA 2009)
Yearly demand growth for energy is about 6% over the period. It should be noted that this forecast has
not been re-actualized with real consumption for 2007-2014. As a consequence, forecasted values for
2030 do not take into account actual restrictions on import and generation which delay the economic
Energy Efficiency Action Plan for 2020-2030 – Final Report
28
development of the country. In order to realign these demand forecasts with the actual demand, a
specific methodology19 has been developed for this report, splitting demand growth rate in:
Demand growth rate due to the economic development (based on GDP forecasts) and,
Demand growth rate due to the population increase.
3.4. Existing EE programs and preliminary results
3.4.1. Targets defined by the National Energy Efficiency Action plan for 2012-2020
The National Energy Efficiency Action Plan for 2012-2020 (Ref-1) has been decided by the Palestinian
Energy Authority (PEA). This plan is structured into three successive phases.
(Source: Ref-1 Palestinian National Energy Efficiency Action Plan NEEAP 2012-2020)
Total expected savings (384 GWh) during 2012-2020 period of time do represent 5% of the annual
consumption in 2020. Gaza Strip20 contribution is close to 100 GWh. Phase I should lead to save 0.8%
of the total supply of electricity for 2010. In addition, according to NEEAP 2012-2020, grid losses
should be reduced from 20% in 2010 to 16% in 2020. The investment cost to reduce losses has not
been materialized in NEEAP 2012-2020 report.
It should be noted that, during this 2012 – 2020 period of time, consumption should grow significantly
in parallel. The table below compares the savings with the growth of the demand for the 2010 – 2020
timeframe.
19 See Section 4 20 Gaza Strip represents 37% of the total population.
Phase I
2012-2014
(GWh)
Phase II
2015-2017
(GWh)
Phase III
2018-2020
(GWh)
Cumulated
savings in
2020
(GWh)
Industrial 5 6 8 19
Buildings 38 130 195 363
Water pumping - 1 1 2
Total (GWh) 43 137 204 384
Target Supply
Sectors
Energy Efficiency Action Plan for 2020-2030 – Final Report
29
(Source: World Bank own elaboration based on PCBS data from NEEAP 2012-2020)
The Energy Efficiency Action Plan for 2020-2030 proposes more ambitious targets by focusing on the
most intensive activities21. The Action Plan22 provides a menu of activities from which Palestinian
Authorities will be able to select the most efficient actions for Palestine taking into account the
investment costs and the benefits of each MWh saved.
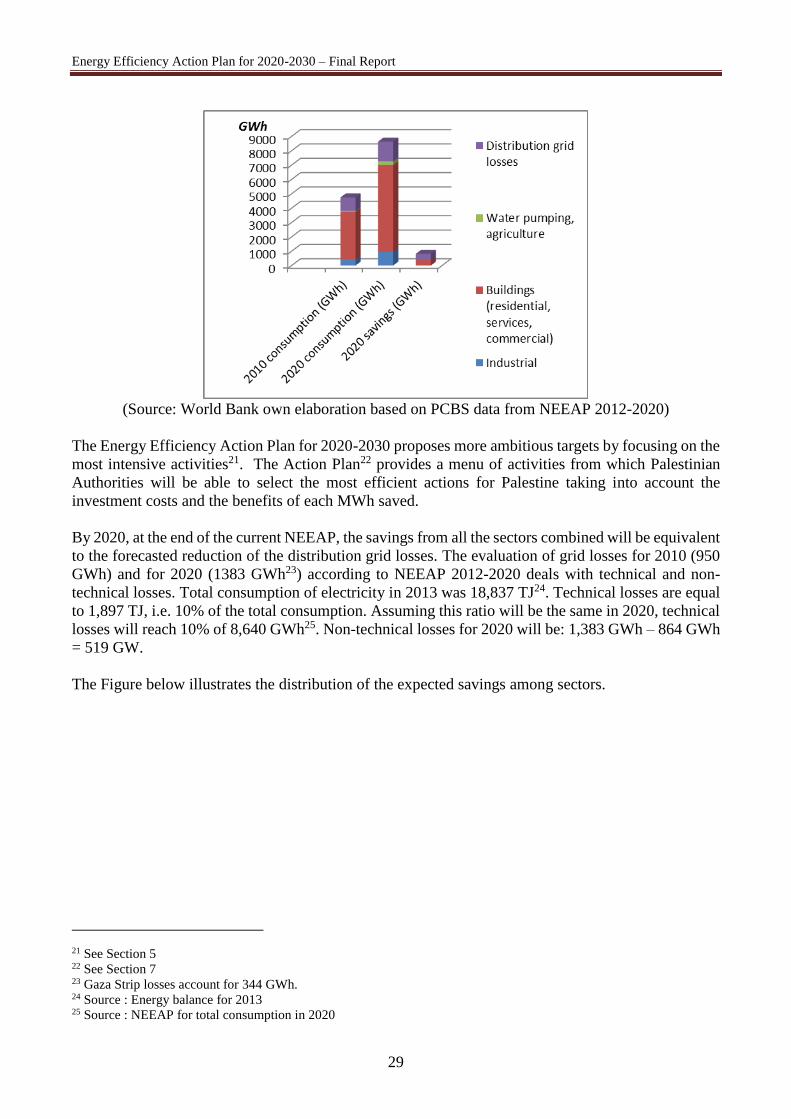
By 2020, at the end of the current NEEAP, the savings from all the sectors combined will be equivalent
to the forecasted reduction of the distribution grid losses. The evaluation of grid losses for 2010 (950
GWh) and for 2020 (1383 GWh23) according to NEEAP 2012-2020 deals with technical and non-
technical losses. Total consumption of electricity in 2013 was 18,837 TJ24. Technical losses are equal
to 1,897 TJ, i.e. 10% of the total consumption. Assuming this ratio will be the same in 2020, technical
losses will reach 10% of 8,640 GWh25. Non-technical losses for 2020 will be: 1,383 GWh – 864 GWh
= 519 GW.
The Figure below illustrates the distribution of the expected savings among sectors.
21 See Section 5 22 See Section 7 23 Gaza Strip losses account for 344 GWh. 24 Source : Energy balance for 2013 25 Source : NEEAP for total consumption in 2020
Energy Efficiency Action Plan for 2020-2030 – Final Report
30
(Source: World Bank own elaboration based on PCBS data from NEEAP 2012-2020)
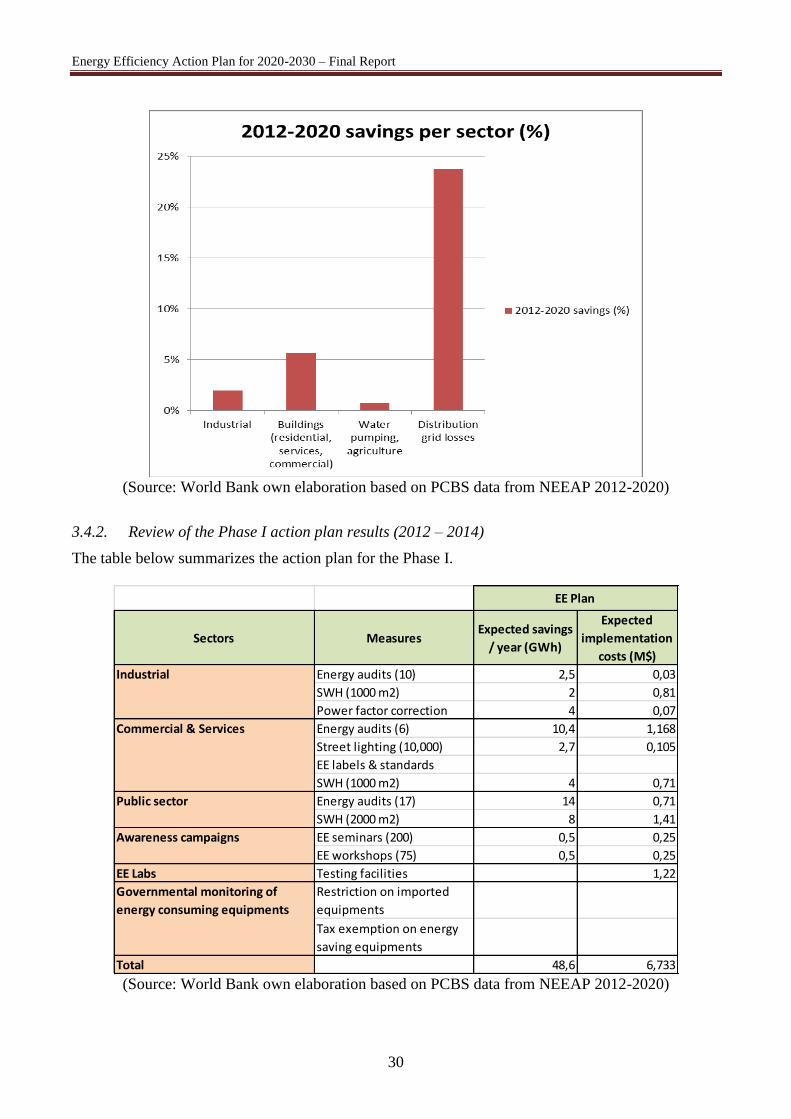
3.4.2. Review of the Phase I action plan results (2012 – 2014)
The table below summarizes the action plan for the Phase I.
(Source: World Bank own elaboration based on PCBS data from NEEAP 2012-2020)
Sectors MeasuresExpected savings
/ year (GWh)
Expected
implementation
costs (M$)
Industrial Energy audits (10) 2,5 0,03
SWH (1000 m2) 2 0,81
Power factor correction 4 0,07
Commercial & Services Energy audits (6) 10,4 1,168
Street lighting (10,000) 2,7 0,105
EE labels & standards
SWH (1000 m2) 4 0,71
Public sector Energy audits (17) 14 0,71
SWH (2000 m2) 8 1,41
Awareness campaigns EE seminars (200) 0,5 0,25
EE workshops (75) 0,5 0,25
EE Labs Testing facilities 1,22
Governmental monitoring of
energy consuming equipments
Restriction on imported
equipments
Tax exemption on energy
saving equipments
Total 48,6 6,733
EE Plan
Energy Efficiency Action Plan for 2020-2030 – Final Report
31
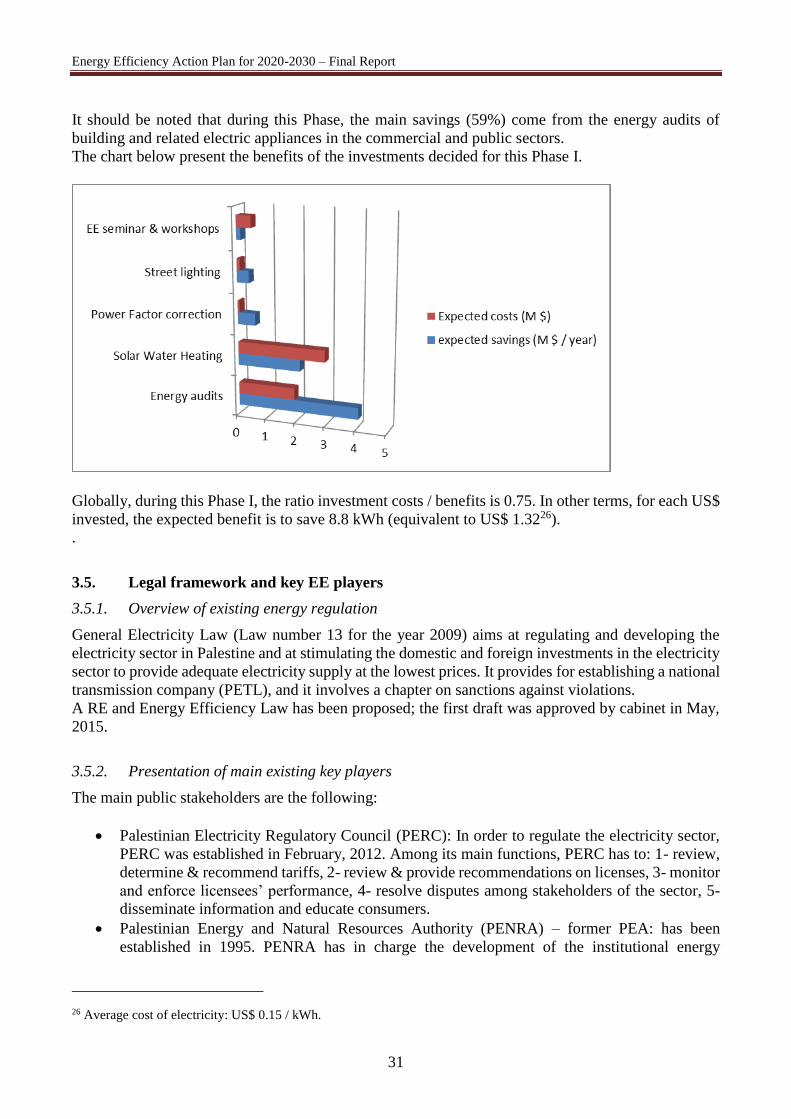
It should be noted that during this Phase, the main savings (59%) come from the energy audits of
building and related electric appliances in the commercial and public sectors.
The chart below present the benefits of the investments decided for this Phase I.
Globally, during this Phase I, the ratio investment costs / benefits is 0.75. In other terms, for each US$
invested, the expected benefit is to save 8.8 kWh (equivalent to US$ 1.3226).
.
3.5. Legal framework and key EE players
3.5.1. Overview of existing energy regulation
General Electricity Law (Law number 13 for the year 2009) aims at regulating and developing the
electricity sector in Palestine and at stimulating the domestic and foreign investments in the electricity
sector to provide adequate electricity supply at the lowest prices. It provides for establishing a national
transmission company (PETL), and it involves a chapter on sanctions against violations.
A RE and Energy Efficiency Law has been proposed; the first draft was approved by cabinet in May,
2015.
3.5.2. Presentation of main existing key players
The main public stakeholders are the following:
Palestinian Electricity Regulatory Council (PERC): In order to regulate the electricity sector,
PERC was established in February, 2012. Among its main functions, PERC has to: 1- review,
determine & recommend tariffs, 2- review & provide recommendations on licenses, 3- monitor
and enforce licensees’ performance, 4- resolve disputes among stakeholders of the sector, 5-
disseminate information and educate consumers.
Palestinian Energy and Natural Resources Authority (PENRA) – former PEA: has been
established in 1995. PENRA has in charge the development of the institutional energy
26 Average cost of electricity: US$ 0.15 / kWh.
Energy Efficiency Action Plan for 2020-2030 – Final Report
32
framework. This includes overall sector coordination, policy formation, system development,
generation, transmission, distribution, tariffs and regulation.
Palestinian Electricity Transmission Company Limited (PETL) -Government owned company:
is involved from the source to distribution companies and final consumers, as well as
importing/exporting electricity. PETL owns, operates and develops the transmission grid.
Within the single buyer model, PETL is the purchaser of power generated from projects with
capacity higher than 1MW. Payment of purchased power will is granted by government.
Distribution Companies (DISCos): Population in Palestine receive electricity from 6
distribution companies (NEDCo, TEDCo, JDECo, HEPCo, SELCo in the West Bank and
GEDCo in Gaza), in addition to the municipalities / local councils not affiliated with any
distribution company. Three of these companies have the legal form of joint stock private
companies, while the other three (Southern Electricity Company, Hebron Electric Power
Company and Tubas District Electricity Company) still work informally without proper
registration at competent departments. Meanwhile, 316 councils (49% of total local councils)
have already joined the DISCOs.
Palestinian Energy and Environment Research Center (PEC): PEC is the national R&D
institution, established in 1993. It is responsible for studies and promotion of energy
conservation, and renewable energy in Palestine. PEC develops and implements national
programs for energy conservation, rational use of energy, and implement national programs for
utilisation of renewable energy.
Palestinian Electricity Regulatory Council (PERC): PERC insure that customers of regulated
utilities receive safe, adequate and reliable service at just and reasonable rates, matching
interests between customers and companies working in the electricity sector on the basis of
justice. Also PERC fosters competition where appropriate. The council executes electricity
sector regulations with accuracy and efficiency that is based on transparency, justice and
openness.
Energy Efficiency Unit (EEU): established by PEA, the main missions of the EEU are: 1-
identify, analyse and propose possible technical and cost effective policies and measures for
EE improvements regarding the generation as well as the consumption aspects, 2- encourage
and promote activities targeting EE actions and reducing negative environmental influence
caused by energy conversions within both generation and consumption processes.
Energy Efficiency Action Plan for 2020-2030 – Final Report
33
4. FORECASTED DEMAND OF ELECTRICITY FOR 2020-2030 TIMEFRAME
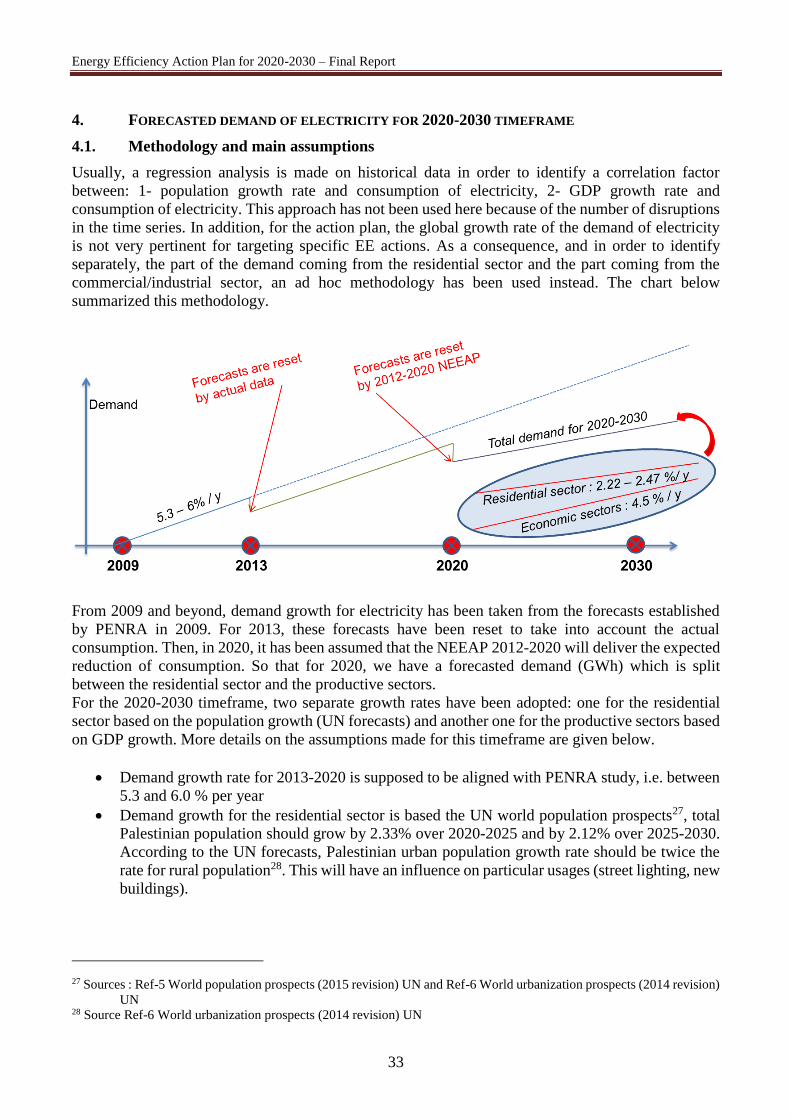
4.1. Methodology and main assumptions
Usually, a regression analysis is made on historical data in order to identify a correlation factor
between: 1- population growth rate and consumption of electricity, 2- GDP growth rate and
consumption of electricity. This approach has not been used here because of the number of disruptions
in the time series. In addition, for the action plan, the global growth rate of the demand of electricity
is not very pertinent for targeting specific EE actions. As a consequence, and in order to identify
separately, the part of the demand coming from the residential sector and the part coming from the
commercial/industrial sector, an ad hoc methodology has been used instead. The chart below
summarized this methodology.
From 2009 and beyond, demand growth for electricity has been taken from the forecasts established
by PENRA in 2009. For 2013, these forecasts have been reset to take into account the actual
consumption. Then, in 2020, it has been assumed that the NEEAP 2012-2020 will deliver the expected
reduction of consumption. So that for 2020, we have a forecasted demand (GWh) which is split
between the residential sector and the productive sectors.
For the 2020-2030 timeframe, two separate growth rates have been adopted: one for the residential
sector based on the population growth (UN forecasts) and another one for the productive sectors based
on GDP growth. More details on the assumptions made for this timeframe are given below.
Demand growth rate for 2013-2020 is supposed to be aligned with PENRA study, i.e. between
5.3 and 6.0 % per year
Demand growth for the residential sector is based the UN world population prospects27, total
Palestinian population should grow by 2.33% over 2020-2025 and by 2.12% over 2025-2030.
According to the UN forecasts, Palestinian urban population growth rate should be twice the
rate for rural population28. This will have an influence on particular usages (street lighting, new
buildings).
27 Sources : Ref-5 World population prospects (2015 revision) UN and Ref-6 World urbanization prospects (2014 revision)
UN 28 Source Ref-6 World urbanization prospects (2014 revision) UN
Energy Efficiency Action Plan for 2020-2030 – Final Report
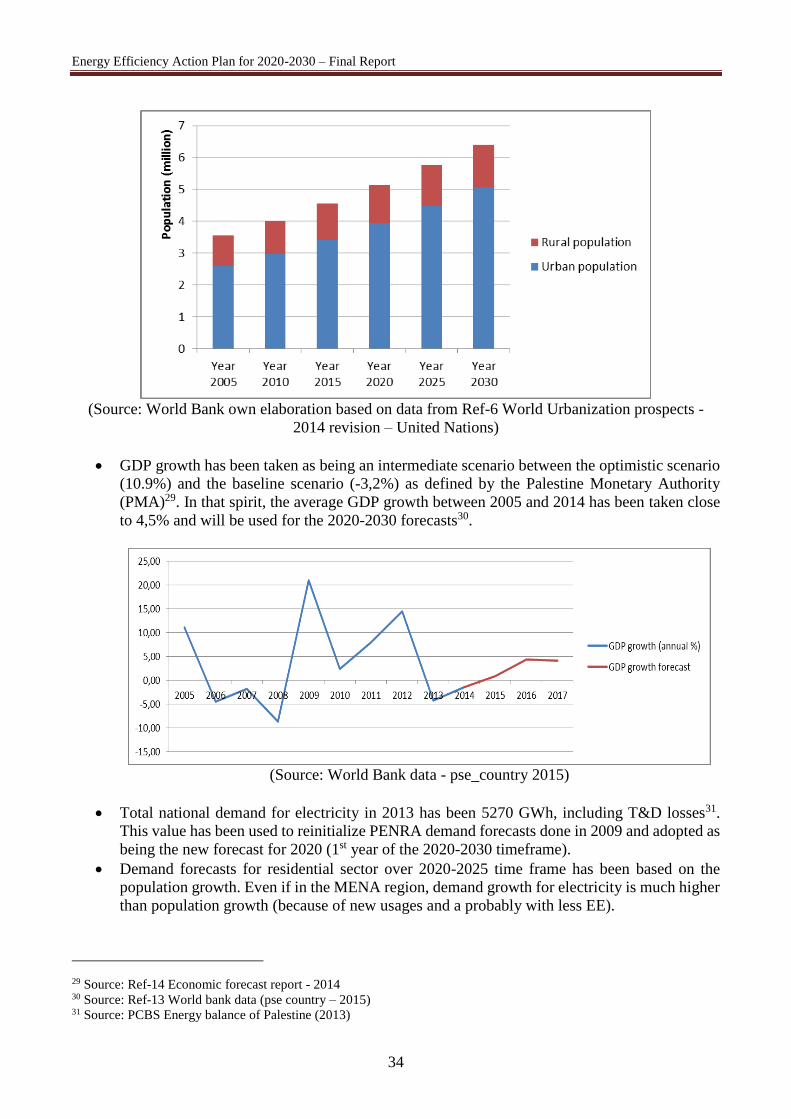
34
(Source: World Bank own elaboration based on data from Ref-6 World Urbanization prospects -
2014 revision – United Nations)
GDP growth has been taken as being an intermediate scenario between the optimistic scenario
(10.9%) and the baseline scenario (-3,2%) as defined by the Palestine Monetary Authority
(PMA)29. In that spirit, the average GDP growth between 2005 and 2014 has been taken close
to 4,5% and will be used for the 2020-2030 forecasts30.
(Source: World Bank data - pse_country 2015)
Total national demand for electricity in 2013 has been 5270 GWh, including T&D losses31.
This value has been used to reinitialize PENRA demand forecasts done in 2009 and adopted as
being the new forecast for 2020 (1st year of the 2020-2030 timeframe).
Demand forecasts for residential sector over 2020-2025 time frame has been based on the
population growth. Even if in the MENA region, demand growth for electricity is much higher
than population growth (because of new usages and a probably with less EE).
29 Source: Ref-14 Economic forecast report - 2014 30 Source: Ref-13 World bank data (pse country – 2015) 31 Source: PCBS Energy balance of Palestine (2013)
Energy Efficiency Action Plan for 2020-2030 – Final Report
35
Losses (technical +commercial) have been estimated between 20 and 30% by Discos. Since
EE actions should be effective for the 2020-2030 timeframe, for paid and also for non-paid
energy, a 10% ratio has been taken for the estimation of remaining technical losses which are
proportional to the total consumption. This is a very conservative value compared to other
MENA countries.
Total NEEAP 2012-2020 savings are supposed to be effectively obtained in their totality during
the period. It is assumed that these savings will be equally spread over this 9-year period. As a
consequence, demand forecasts for 2020 will take into account a reduction of:
o Industry: 19/9 = 2.1 GWh
o Buildings (commercial & residential): 363/9 = 40.3 GWh (1/3 for commercial and
public, 2/3 for residential)
o Water pumping: 2/9 = 0.2 GWh
o Distribution losses (TL + CL) are supposed to be reduced from 20% (2010) to 16%
(2020): 431 GWh
Mutatis mutandis, segmentation of usages (see next section) is assumed to be almost the same
until 2020. In other words, sectors of activity should keep the relative weight they have today.
It is also supposed that these segments will not evolve during 2020-2030 period except for
taking into account the effects of the proposed EE action plan.
o NB: A more focused analysis would require analysing consumption trends by sector
(e.g. ineffectiveness of policies within the sector, structural changes within the sector,
specific economic growth, low fuel price, etc.)
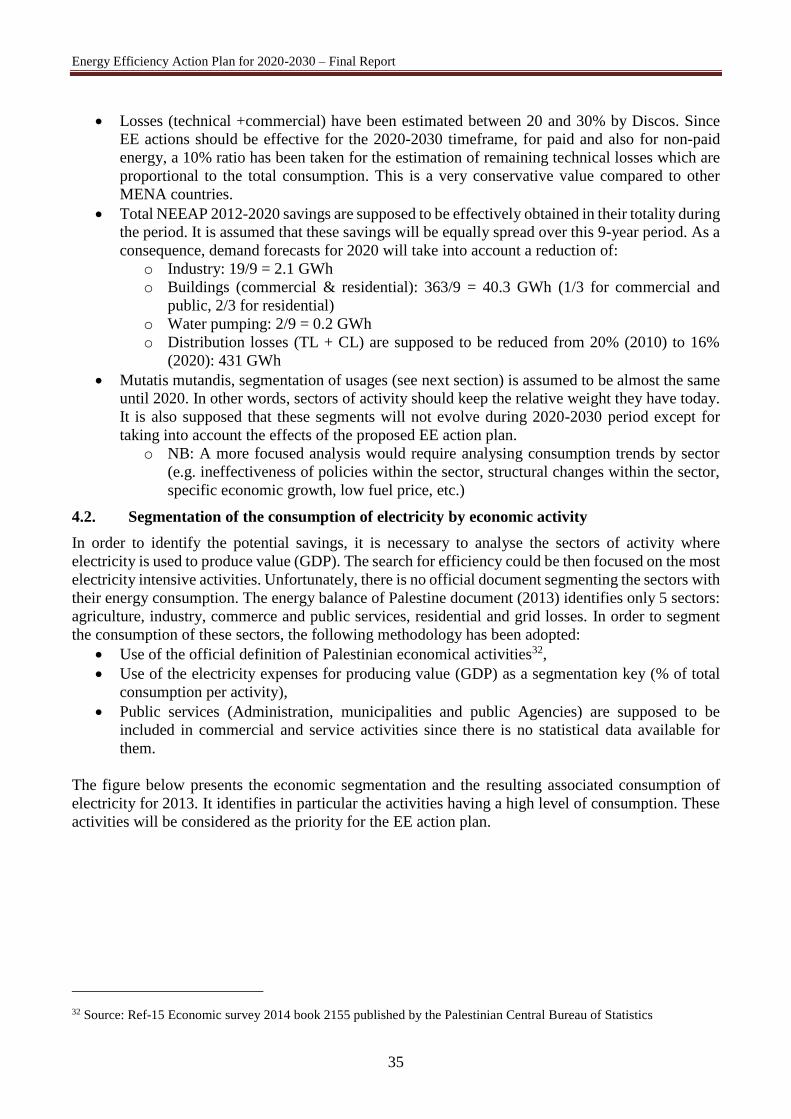
4.2. Segmentation of the consumption of electricity by economic activity
In order to identify the potential savings, it is necessary to analyse the sectors of activity where
electricity is used to produce value (GDP). The search for efficiency could be then focused on the most
electricity intensive activities. Unfortunately, there is no official document segmenting the sectors with
their energy consumption. The energy balance of Palestine document (2013) identifies only 5 sectors:
agriculture, industry, commerce and public services, residential and grid losses. In order to segment
the consumption of these sectors, the following methodology has been adopted:
Use of the official definition of Palestinian economical activities32,
Use of the electricity expenses for producing value (GDP) as a segmentation key (% of total
consumption per activity),
Public services (Administration, municipalities and public Agencies) are supposed to be
included in commercial and service activities since there is no statistical data available for
them.
The figure below presents the economic segmentation and the resulting associated consumption of
electricity for 2013. It identifies in particular the activities having a high level of consumption. These
activities will be considered as the priority for the EE action plan.
32 Source: Ref-15 Economic survey 2014 book 2155 published by the Palestinian Central Bureau of Statistics
Energy Efficiency Action Plan for 2020-2030 – Final Report
36
(Source: World Bank own elaboration based on Ref-15 Economic survey 2014 book 2155)
NB: the 10th sector - residential sector - is segmented through the usages of electricity and the
behaviour of an “average household”. See next section.
4.3. Segmentation of the usages of electricity
It is not sufficient to identify electricity intensive activities, because reducing consumption may lead
to reduce the level of economic activity. In order to avoid that, an additional segmentation of the
activities has been used: the segmentation by usage. For instance, when electricity is used for heating
in an industrial process, an energy efficiency measure could be to improve the thermic isolation of the
process so that less electricity will be consumed to produce exactly the same result.
Energy Efficiency Action Plan for 2020-2030 – Final Report
37
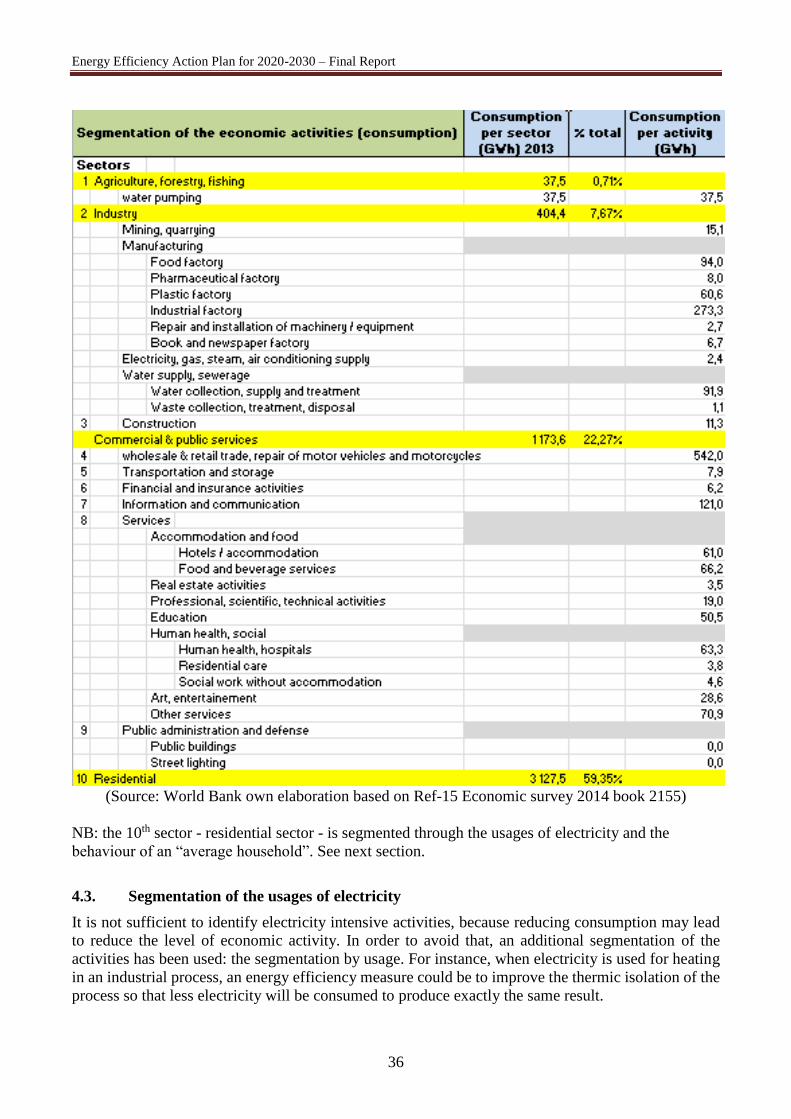
With this segmentation by usage it will be possible to identify specific EE actions. The more the
segments are detailed, the more the actions can be focused on. Metered consumption is generally not
available for this level of detail. A model has been design to take into account existing data gathered
from PCBS surveys and from energy audits33. Since the residential sector is about two third of the total
consumption, a specific household consumption profile has been modelled.
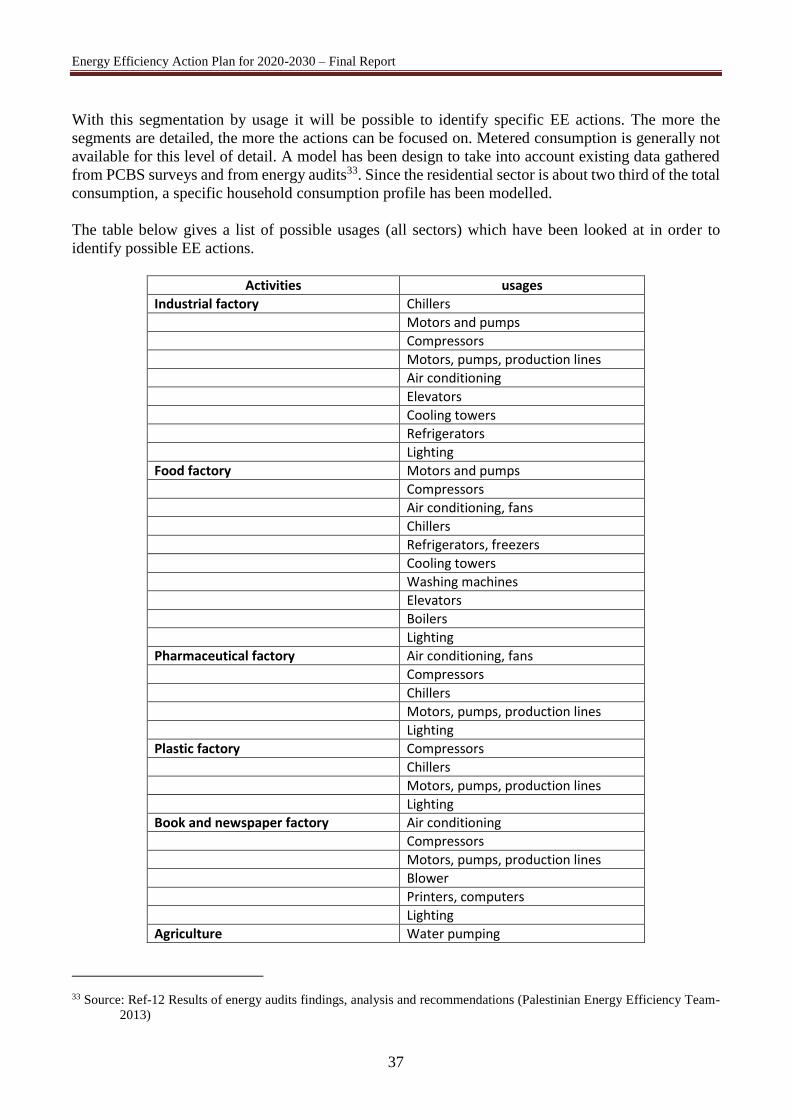
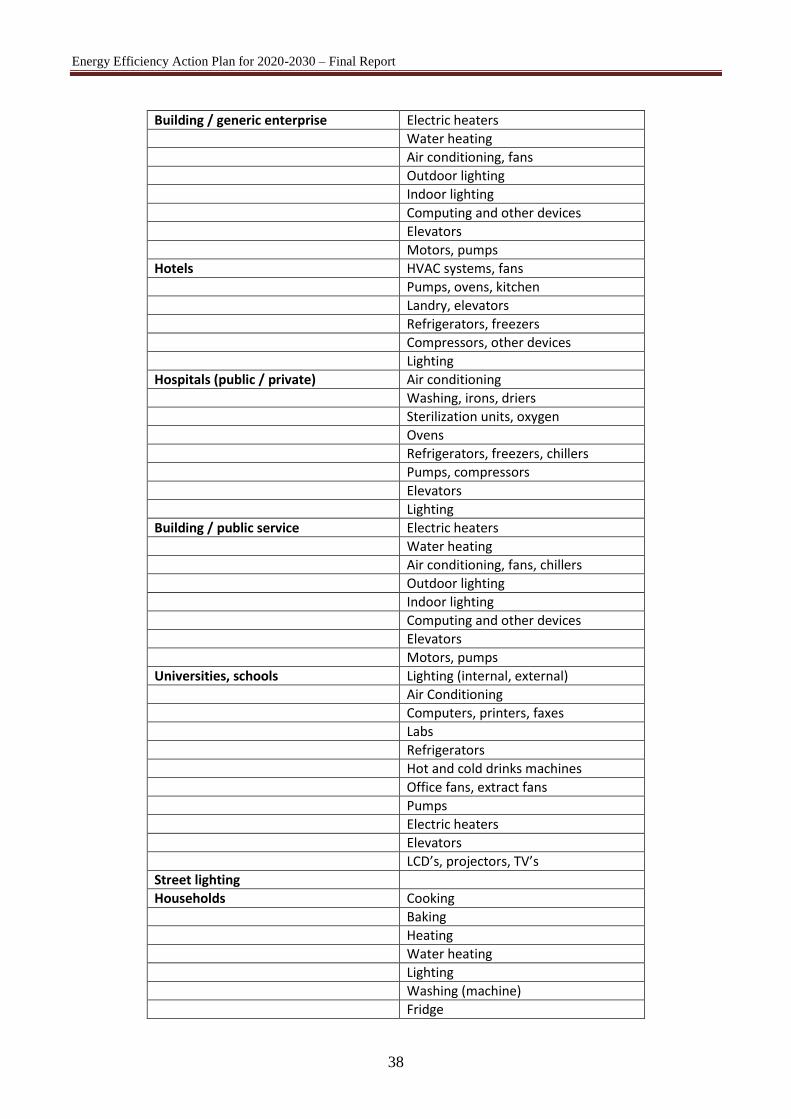
The table below gives a list of possible usages (all sectors) which have been looked at in order to
identify possible EE actions.
Activities usages
Industrial factory Chillers
Motors and pumps
Compressors
Motors, pumps, production lines
Air conditioning
Elevators
Cooling towers
Refrigerators
Lighting
Food factory Motors and pumps
Compressors
Air conditioning, fans
Chillers
Refrigerators, freezers
Cooling towers
Washing machines
Elevators
Boilers
Lighting
Pharmaceutical factory Air conditioning, fans
Compressors
Chillers
Motors, pumps, production lines
Lighting
Plastic factory Compressors
Chillers
Motors, pumps, production lines
Lighting
Book and newspaper factory Air conditioning
Compressors
Motors, pumps, production lines
Blower
Printers, computers
Lighting
Agriculture Water pumping
33 Source: Ref-12 Results of energy audits findings, analysis and recommendations (Palestinian Energy Efficiency Team-
2013)
Energy Efficiency Action Plan for 2020-2030 – Final Report
38
Building / generic enterprise Electric heaters
Water heating
Air conditioning, fans
Outdoor lighting
Indoor lighting
Computing and other devices
Elevators
Motors, pumps
Hotels HVAC systems, fans
Pumps, ovens, kitchen
Landry, elevators
Refrigerators, freezers
Compressors, other devices
Lighting
Hospitals (public / private) Air conditioning
Washing, irons, driers
Sterilization units, oxygen
Ovens
Refrigerators, freezers, chillers
Pumps, compressors
Elevators
Lighting
Building / public service Electric heaters
Water heating
Air conditioning, fans, chillers
Outdoor lighting
Indoor lighting
Computing and other devices
Elevators
Motors, pumps
Universities, schools Lighting (internal, external)
Air Conditioning
Computers, printers, faxes
Labs
Refrigerators
Hot and cold drinks machines
Office fans, extract fans
Pumps
Electric heaters
Elevators
LCD’s, projectors, TV’s
Street lighting
Households Cooking
Baking
Heating
Water heating
Lighting
Washing (machine)
Fridge
Energy Efficiency Action Plan for 2020-2030 – Final Report
39
TV set, video, computing
Cooling
(Segmentation of usages)
Metered consumption is generally not available for this level of detail. A model has been design to
take into account existing data gathered from different studies and from energy audits. For the
industrial and commercial services, PCBS publishes cost estimations of the energy needed by each
sector to contribute to the GDP. These cost estimation have been translated into energy consumed by
usage. For the residential sector, which is about two third of the total consumption, a specific household
consumption profile has been modelled, based on available data and PCBS surveys dealing with
875,000 households34. To illustrate that, it has been possible to estimate the average consumption for
lighting, heating and washing.
This split of the total forecasted demand into specific usages has been then used for evaluating EE
action benefits. In the example cited above, an EE action could be to replace bulb with CFLs or CFLs
with LEDs. If this action was entered in the model, it would reduce the national consumption for the
associated usage.
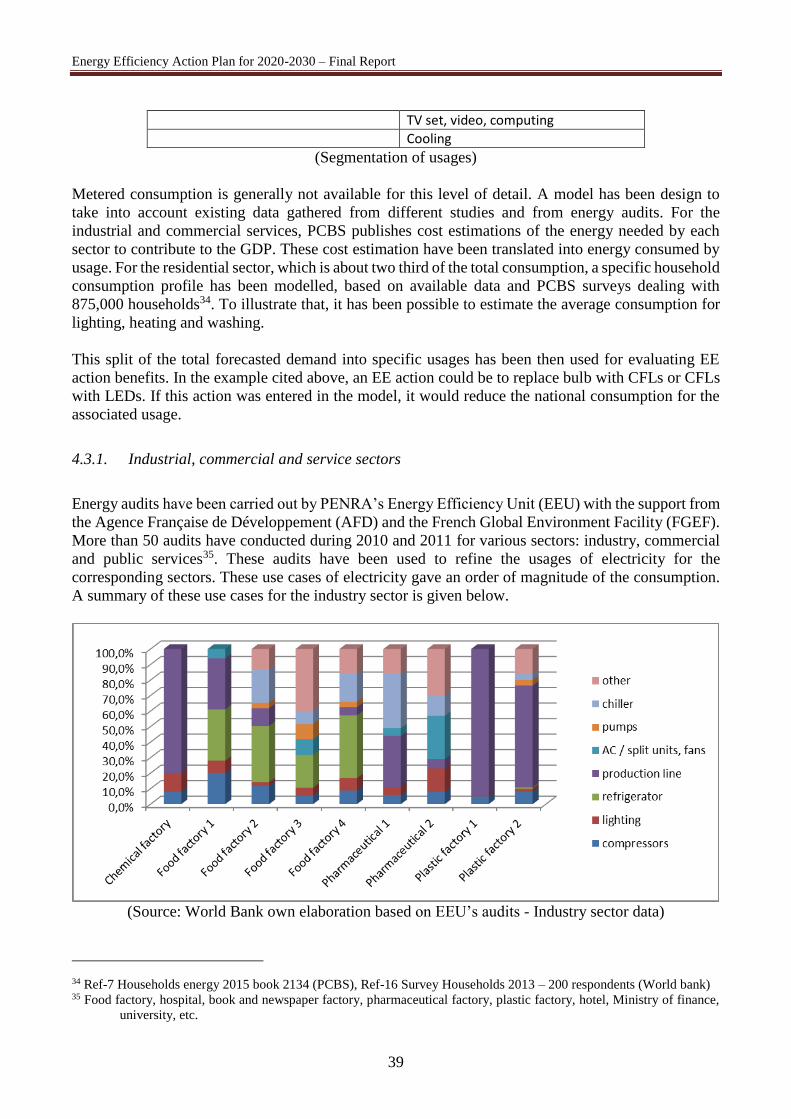
4.3.1. Industrial, commercial and service sectors
Energy audits have been carried out by PENRA’s Energy Efficiency Unit (EEU) with the support from
the Agence Française de Développement (AFD) and the French Global Environment Facility (FGEF).
More than 50 audits have conducted during 2010 and 2011 for various sectors: industry, commercial
and public services35. These audits have been used to refine the usages of electricity for the
corresponding sectors. These use cases of electricity gave an order of magnitude of the consumption.
A summary of these use cases for the industry sector is given below.
(Source: World Bank own elaboration based on EEU’s audits - Industry sector data)
34 Ref-7 Households energy 2015 book 2134 (PCBS), Ref-16 Survey Households 2013 – 200 respondents (World bank) 35 Food factory, hospital, book and newspaper factory, pharmaceutical factory, plastic factory, hotel, Ministry of finance,
university, etc.
Energy Efficiency Action Plan for 2020-2030 – Final Report
40
Consumption associated to the production line usage (in violet) seems to be the most important
usage. As a consequence, priority should be given to specific EE actions dealing with this usage:
motors, pumps, compressors. For the food factories, however, the use of refrigerators generates the
main consumption of electricity.
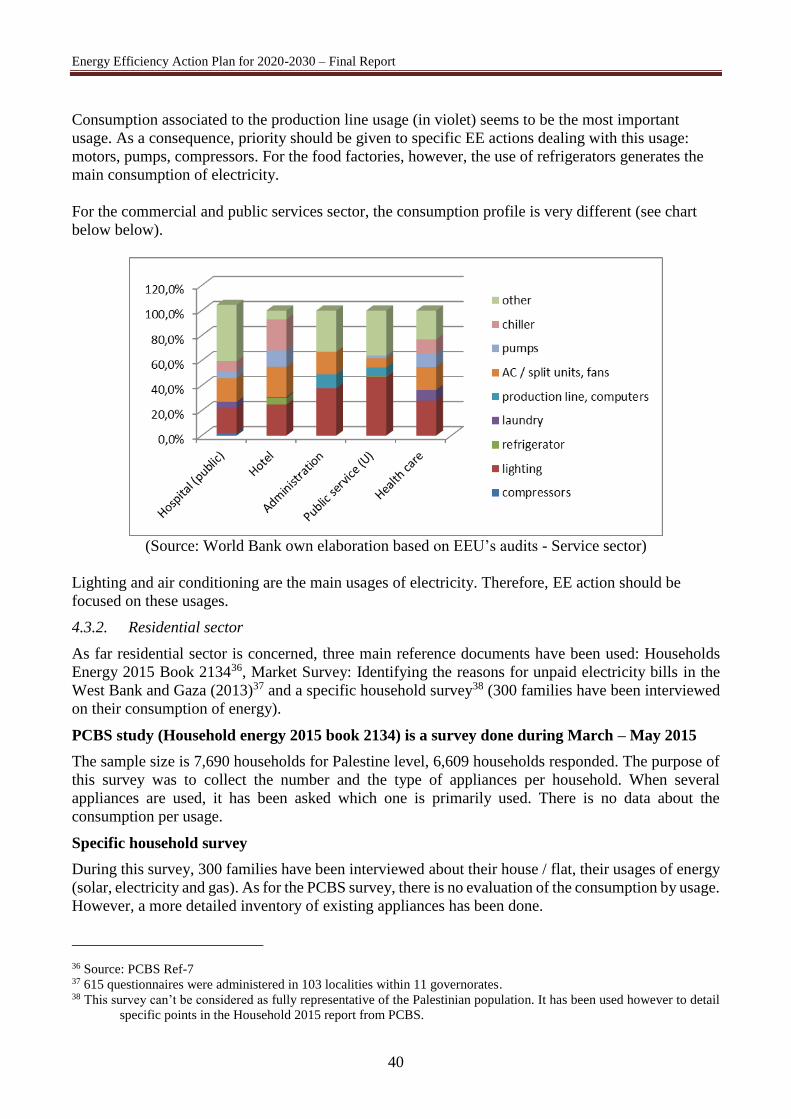
For the commercial and public services sector, the consumption profile is very different (see chart
below below).
(Source: World Bank own elaboration based on EEU’s audits - Service sector)
Lighting and air conditioning are the main usages of electricity. Therefore, EE action should be
focused on these usages.
4.3.2. Residential sector
As far residential sector is concerned, three main reference documents have been used: Households
Energy 2015 Book 213436, Market Survey: Identifying the reasons for unpaid electricity bills in the
West Bank and Gaza (2013)37 and a specific household survey38 (300 families have been interviewed
on their consumption of energy).
PCBS study (Household energy 2015 book 2134) is a survey done during March – May 2015
The sample size is 7,690 households for Palestine level, 6,609 households responded. The purpose of
this survey was to collect the number and the type of appliances per household. When several
appliances are used, it has been asked which one is primarily used. There is no data about the
consumption per usage.
Specific household survey
During this survey, 300 families have been interviewed about their house / flat, their usages of energy
(solar, electricity and gas). As for the PCBS survey, there is no evaluation of the consumption by usage.
However, a more detailed inventory of existing appliances has been done.
36 Source: PCBS Ref-7 37 615 questionnaires were administered in 103 localities within 11 governorates. 38 This survey can’t be considered as fully representative of the Palestinian population. It has been used however to detail
specific points in the Household 2015 report from PCBS.
Energy Efficiency Action Plan for 2020-2030 – Final Report
41
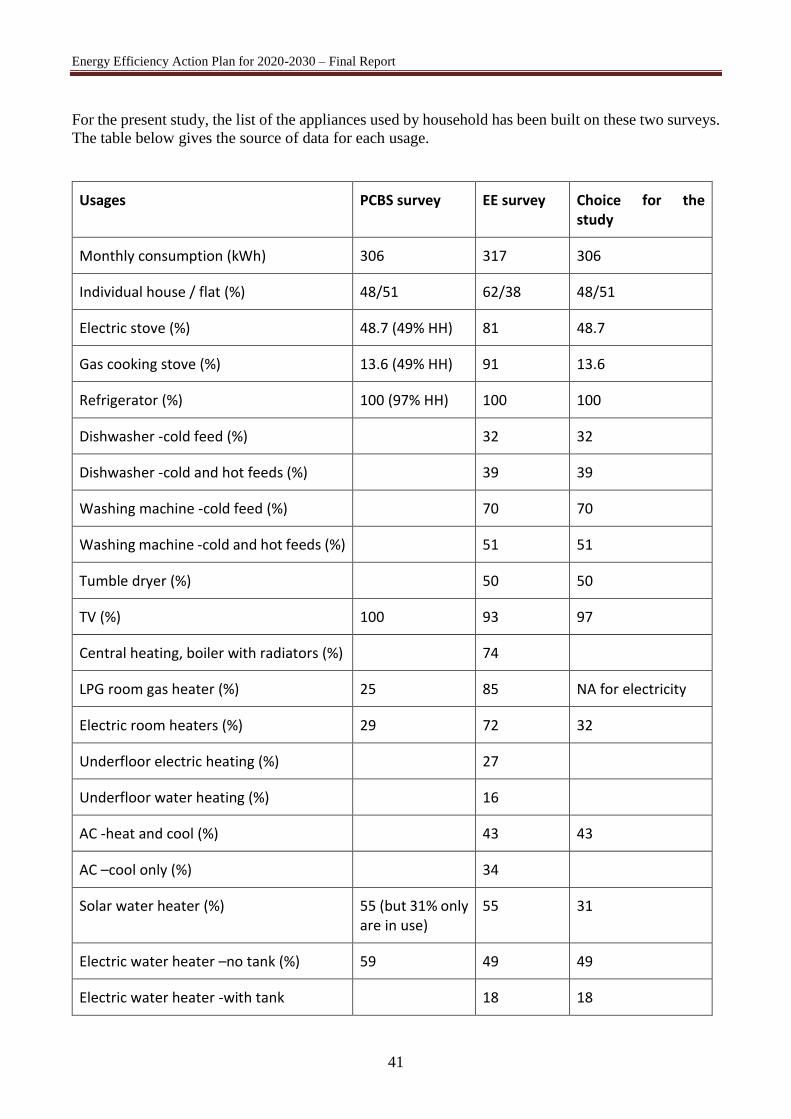
For the present study, the list of the appliances used by household has been built on these two surveys.
The table below gives the source of data for each usage.
Usages PCBS survey EE survey Choice for the study
Monthly consumption (kWh) 306 317 306
Individual house / flat (%) 48/51 62/38 48/51
Electric stove (%) 48.7 (49% HH) 81 48.7
Gas cooking stove (%) 13.6 (49% HH) 91 13.6
Refrigerator (%) 100 (97% HH) 100 100
Dishwasher -cold feed (%) 32 32
Dishwasher -cold and hot feeds (%) 39 39
Washing machine -cold feed (%) 70 70
Washing machine -cold and hot feeds (%) 51 51
Tumble dryer (%) 50 50
TV (%) 100 93 97
Central heating, boiler with radiators (%) 74
LPG room gas heater (%) 25 85 NA for electricity
Electric room heaters (%) 29 72 32
Underfloor electric heating (%) 27
Underfloor water heating (%) 16
AC -heat and cool (%) 43 43
AC –cool only (%) 34
Solar water heater (%) 55 (but 31% only are in use)
55 31
Electric water heater –no tank (%) 59 49 49
Electric water heater -with tank 18 18
Energy Efficiency Action Plan for 2020-2030 – Final Report
42
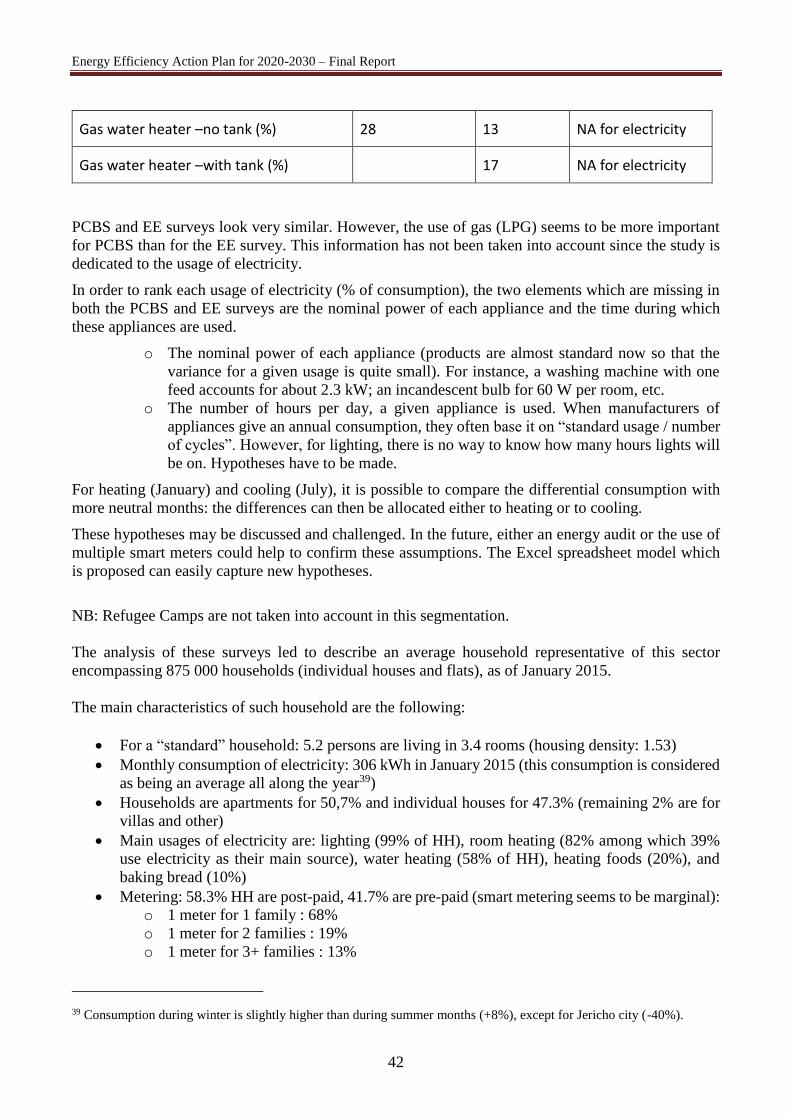
Gas water heater –no tank (%) 28 13 NA for electricity
Gas water heater –with tank (%) 17 NA for electricity
PCBS and EE surveys look very similar. However, the use of gas (LPG) seems to be more important
for PCBS than for the EE survey. This information has not been taken into account since the study is
dedicated to the usage of electricity.
In order to rank each usage of electricity (% of consumption), the two elements which are missing in
both the PCBS and EE surveys are the nominal power of each appliance and the time during which
these appliances are used.
o The nominal power of each appliance (products are almost standard now so that the
variance for a given usage is quite small). For instance, a washing machine with one
feed accounts for about 2.3 kW; an incandescent bulb for 60 W per room, etc.
o The number of hours per day, a given appliance is used. When manufacturers of
appliances give an annual consumption, they often base it on “standard usage / number
of cycles”. However, for lighting, there is no way to know how many hours lights will
be on. Hypotheses have to be made.
For heating (January) and cooling (July), it is possible to compare the differential consumption with
more neutral months: the differences can then be allocated either to heating or to cooling.
These hypotheses may be discussed and challenged. In the future, either an energy audit or the use of
multiple smart meters could help to confirm these assumptions. The Excel spreadsheet model which
is proposed can easily capture new hypotheses.
NB: Refugee Camps are not taken into account in this segmentation.
The analysis of these surveys led to describe an average household representative of this sector
encompassing 875 000 households (individual houses and flats), as of January 2015.
The main characteristics of such household are the following:
For a “standard” household: 5.2 persons are living in 3.4 rooms (housing density: 1.53)
Monthly consumption of electricity: 306 kWh in January 2015 (this consumption is considered
as being an average all along the year39)
Households are apartments for 50,7% and individual houses for 47.3% (remaining 2% are for
villas and other)
Main usages of electricity are: lighting (99% of HH), room heating (82% among which 39%
use electricity as their main source), water heating (58% of HH), heating foods (20%), and
baking bread (10%)
Metering: 58.3% HH are post-paid, 41.7% are pre-paid (smart metering seems to be marginal):
o 1 meter for 1 family : 68%
o 1 meter for 2 families : 19%
o 1 meter for 3+ families : 13%
39 Consumption during winter is slightly higher than during summer months (+8%), except for Jericho city (-40%).
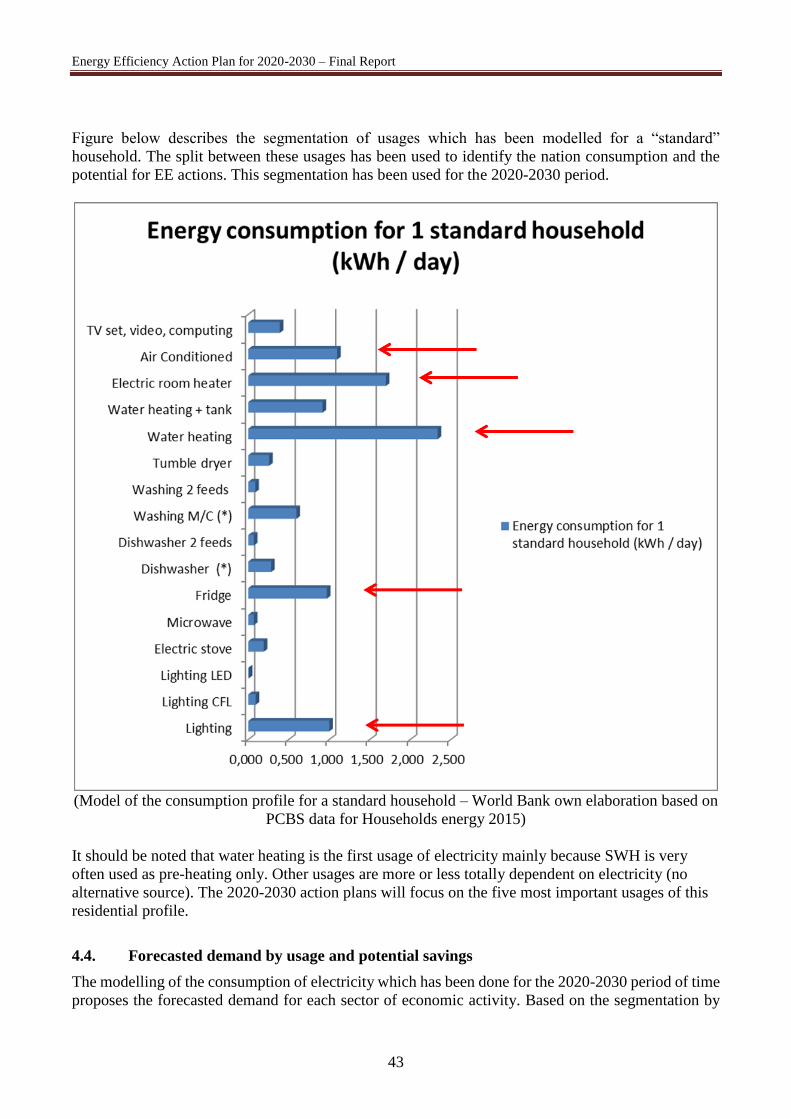
Energy Efficiency Action Plan for 2020-2030 – Final Report
43
Figure below describes the segmentation of usages which has been modelled for a “standard”
household. The split between these usages has been used to identify the nation consumption and the
potential for EE actions. This segmentation has been used for the 2020-2030 period.
(Model of the consumption profile for a standard household – World Bank own elaboration based on
PCBS data for Households energy 2015)
It should be noted that water heating is the first usage of electricity mainly because SWH is very
often used as pre-heating only. Other usages are more or less totally dependent on electricity (no
alternative source). The 2020-2030 action plans will focus on the five most important usages of this
residential profile.
4.4. Forecasted demand by usage and potential savings
The modelling of the consumption of electricity which has been done for the 2020-2030 period of time
proposes the forecasted demand for each sector of economic activity. Based on the segmentation by
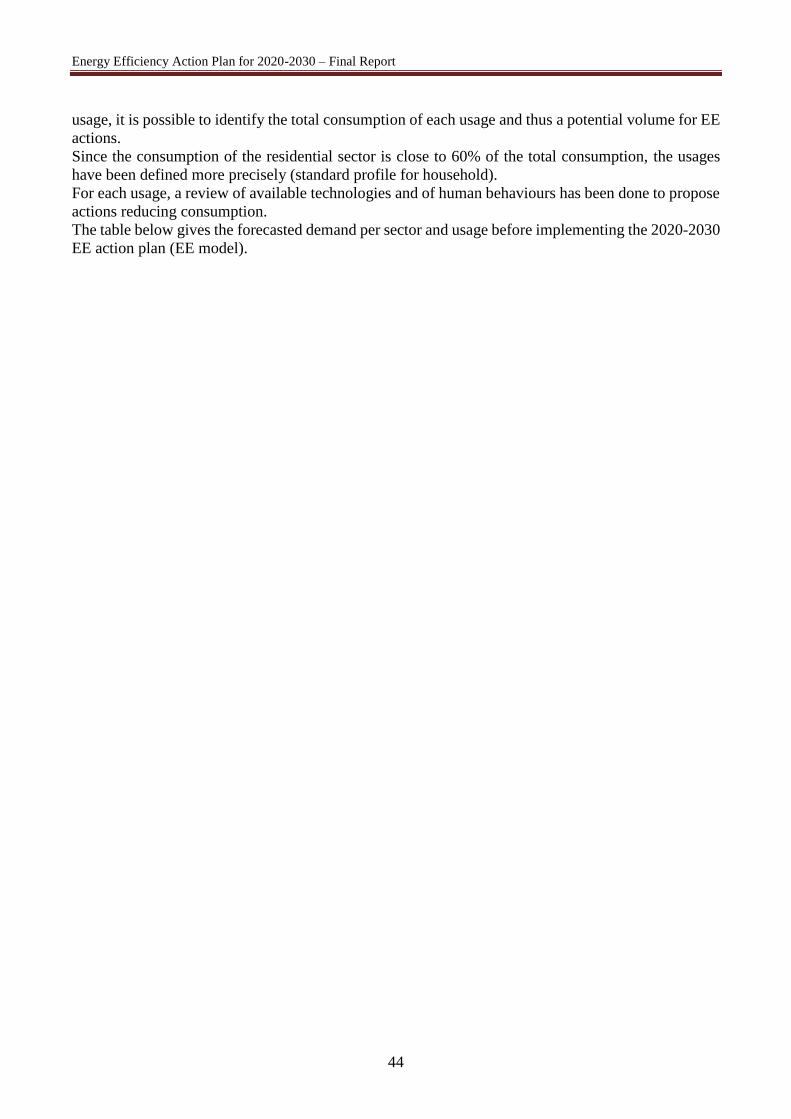
Energy Efficiency Action Plan for 2020-2030 – Final Report
44
usage, it is possible to identify the total consumption of each usage and thus a potential volume for EE
actions.
Since the consumption of the residential sector is close to 60% of the total consumption, the usages
have been defined more precisely (standard profile for household).
For each usage, a review of available technologies and of human behaviours has been done to propose
actions reducing consumption.
The table below gives the forecasted demand per sector and usage before implementing the 2020-2030
EE action plan (EE model).
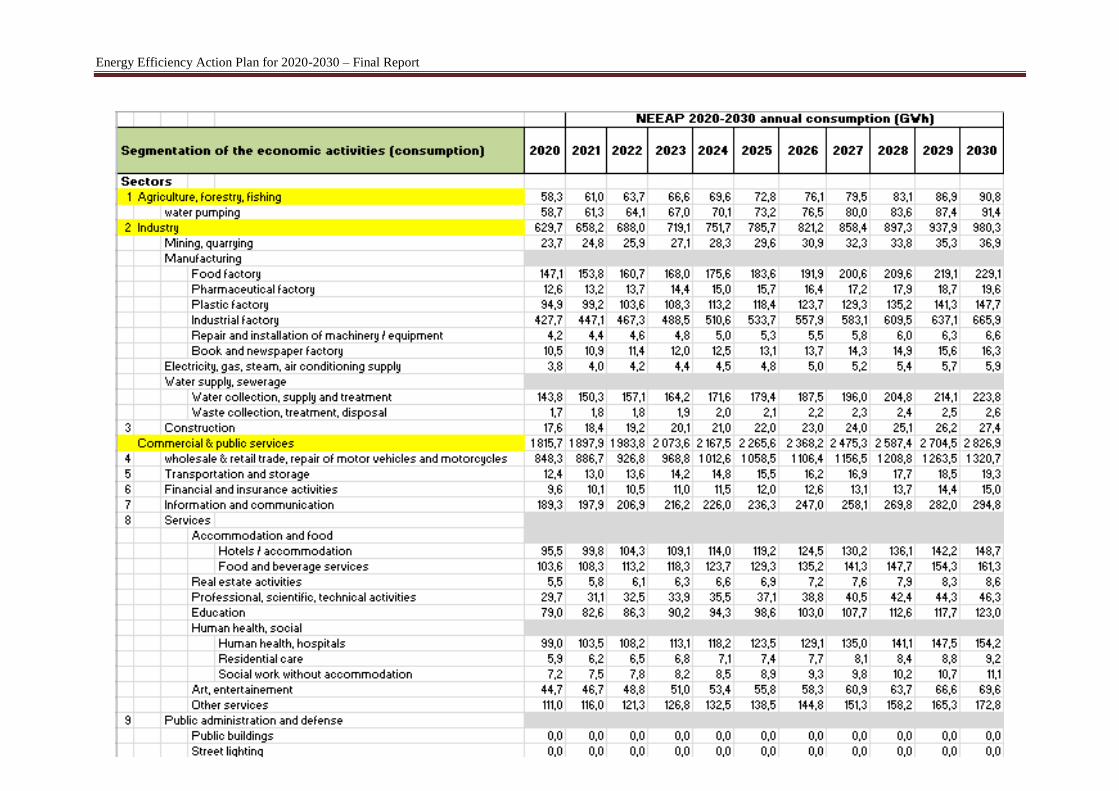
Energy Efficiency Action Plan for 2020-2030 – Final Report
45
Energy Efficiency Action Plan for 2020-2030 – Final Report
46
(Demand forecasts for 2020-2030)
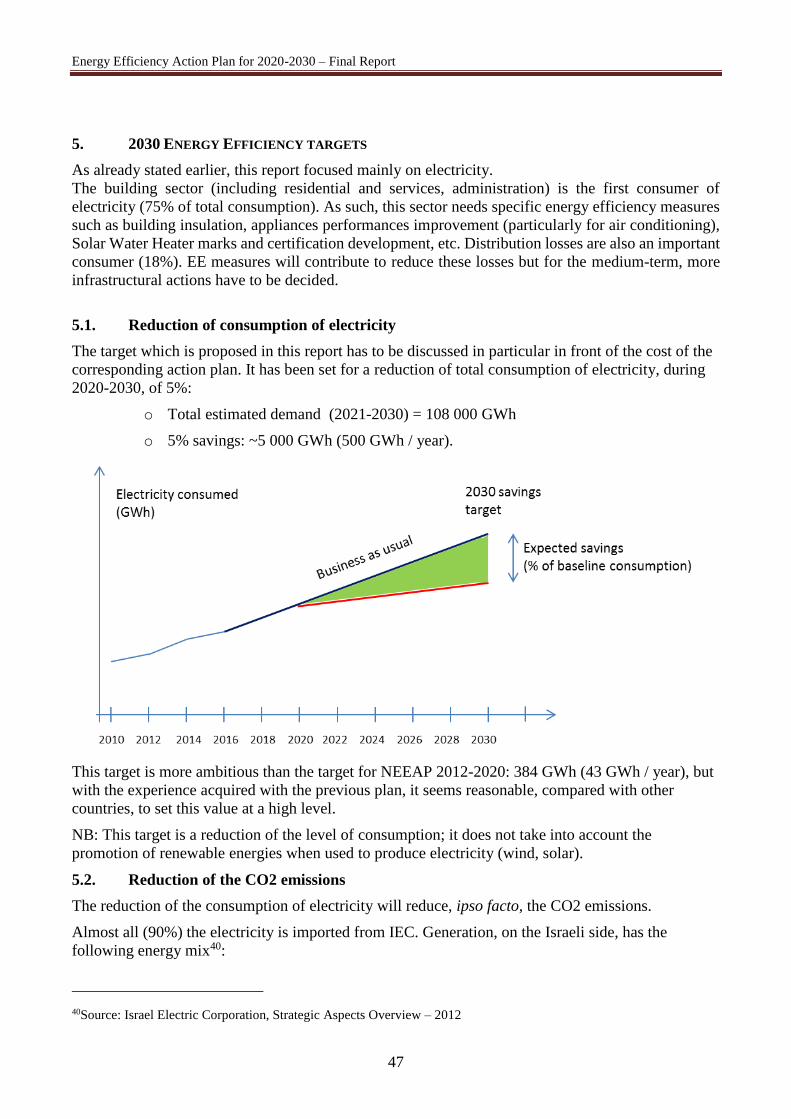
Energy Efficiency Action Plan for 2020-2030 – Final Report
47
5. 2030 ENERGY EFFICIENCY TARGETS
As already stated earlier, this report focused mainly on electricity.
The building sector (including residential and services, administration) is the first consumer of
electricity (75% of total consumption). As such, this sector needs specific energy efficiency measures
such as building insulation, appliances performances improvement (particularly for air conditioning),
Solar Water Heater marks and certification development, etc. Distribution losses are also an important
consumer (18%). EE measures will contribute to reduce these losses but for the medium-term, more
infrastructural actions have to be decided.
5.1. Reduction of consumption of electricity
The target which is proposed in this report has to be discussed in particular in front of the cost of the
corresponding action plan. It has been set for a reduction of total consumption of electricity, during
2020-2030, of 5%:
o Total estimated demand (2021-2030) = 108 000 GWh
o 5% savings: ~5 000 GWh (500 GWh / year).
This target is more ambitious than the target for NEEAP 2012-2020: 384 GWh (43 GWh / year), but
with the experience acquired with the previous plan, it seems reasonable, compared with other
countries, to set this value at a high level.
NB: This target is a reduction of the level of consumption; it does not take into account the
promotion of renewable energies when used to produce electricity (wind, solar).
5.2. Reduction of the CO2 emissions
The reduction of the consumption of electricity will reduce, ipso facto, the CO2 emissions.
Almost all (90%) the electricity is imported from IEC. Generation, on the Israeli side, has the
following energy mix40:
40Source: Israel Electric Corporation, Strategic Aspects Overview – 2012
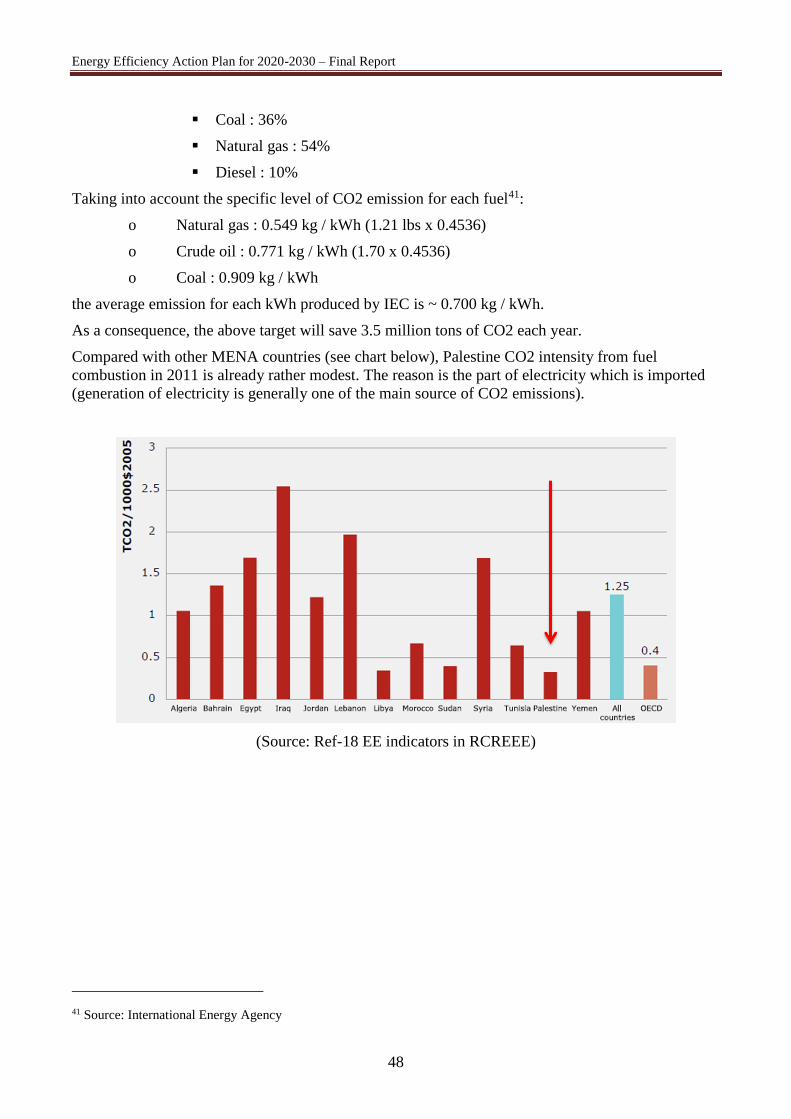
Energy Efficiency Action Plan for 2020-2030 – Final Report
48
Coal : 36%
Natural gas : 54%
Diesel : 10%
Taking into account the specific level of CO2 emission for each fuel41:
o Natural gas : 0.549 kg / kWh (1.21 lbs x 0.4536)
o Crude oil : 0.771 kg / kWh (1.70 x 0.4536)
o Coal : 0.909 kg / kWh
the average emission for each kWh produced by IEC is ~ 0.700 kg / kWh.
As a consequence, the above target will save 3.5 million tons of CO2 each year.
Compared with other MENA countries (see chart below), Palestine CO2 intensity from fuel
combustion in 2011 is already rather modest. The reason is the part of electricity which is imported
(generation of electricity is generally one of the main source of CO2 emissions).
(Source: Ref-18 EE indicators in RCREEE)
41 Source: International Energy Agency
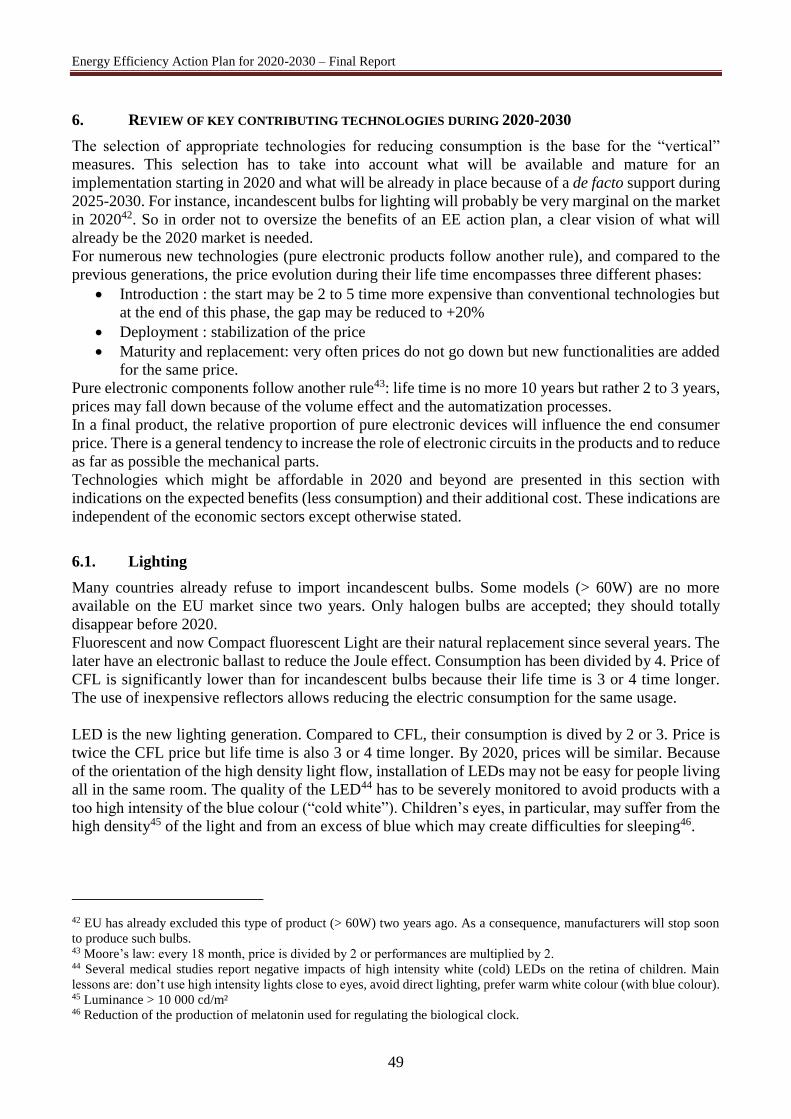
Energy Efficiency Action Plan for 2020-2030 – Final Report
49
6. REVIEW OF KEY CONTRIBUTING TECHNOLOGIES DURING 2020-2030
The selection of appropriate technologies for reducing consumption is the base for the “vertical”
measures. This selection has to take into account what will be available and mature for an
implementation starting in 2020 and what will be already in place because of a de facto support during
2025-2030. For instance, incandescent bulbs for lighting will probably be very marginal on the market
in 202042. So in order not to oversize the benefits of an EE action plan, a clear vision of what will
already be the 2020 market is needed.
For numerous new technologies (pure electronic products follow another rule), and compared to the
previous generations, the price evolution during their life time encompasses three different phases:
Introduction : the start may be 2 to 5 time more expensive than conventional technologies but
at the end of this phase, the gap may be reduced to +20%
Deployment : stabilization of the price
Maturity and replacement: very often prices do not go down but new functionalities are added
for the same price.
Pure electronic components follow another rule43: life time is no more 10 years but rather 2 to 3 years,
prices may fall down because of the volume effect and the automatization processes.
In a final product, the relative proportion of pure electronic devices will influence the end consumer
price. There is a general tendency to increase the role of electronic circuits in the products and to reduce
as far as possible the mechanical parts.
Technologies which might be affordable in 2020 and beyond are presented in this section with
indications on the expected benefits (less consumption) and their additional cost. These indications are
independent of the economic sectors except otherwise stated.
6.1. Lighting
Many countries already refuse to import incandescent bulbs. Some models (> 60W) are no more
available on the EU market since two years. Only halogen bulbs are accepted; they should totally
disappear before 2020.
Fluorescent and now Compact fluorescent Light are their natural replacement since several years. The
later have an electronic ballast to reduce the Joule effect. Consumption has been divided by 4. Price of
CFL is significantly lower than for incandescent bulbs because their life time is 3 or 4 time longer.
The use of inexpensive reflectors allows reducing the electric consumption for the same usage.
LED is the new lighting generation. Compared to CFL, their consumption is dived by 2 or 3. Price is
twice the CFL price but life time is also 3 or 4 time longer. By 2020, prices will be similar. Because
of the orientation of the high density light flow, installation of LEDs may not be easy for people living
all in the same room. The quality of the LED44 has to be severely monitored to avoid products with a
too high intensity of the blue colour (“cold white”). Children’s eyes, in particular, may suffer from the
high density45 of the light and from an excess of blue which may create difficulties for sleeping46.
42 EU has already excluded this type of product (> 60W) two years ago. As a consequence, manufacturers will stop soon
to produce such bulbs. 43 Moore’s law: every 18 month, price is divided by 2 or performances are multiplied by 2. 44 Several medical studies report negative impacts of high intensity white (cold) LEDs on the retina of children. Main
lessons are: don’t use high intensity lights close to eyes, avoid direct lighting, prefer warm white colour (with blue colour). 45 Luminance > 10 000 cd/m² 46 Reduction of the production of melatonin used for regulating the biological clock.
Energy Efficiency Action Plan for 2020-2030 – Final Report
50
Type of light Efficiency (lm / W) Life time (‘000 h) Unit price ratio
incandescent 10 - 15 1 - 2 1
Halogen 15 - 30 1 - 2 1.2
CFL 50 - 100 4 - 8 1.8
LED 100 - 150 30 - 40 2.3
The next step will be the integration of an Infra-Red / presence detector in order to switch the light on
in a room only when there is somebody inside. Light is switched off automatically when leaving the
room.
6.2. Electric motors
Such motors are used everywhere: industry, residential sector, transportation, etc. Traditional
synchronous / asynchronous engines are now replaced with models controlled with an electronic
circuit47. This circuit is used to improve the efficiency of the start/stop phases and control the speed in
relation with the load. The benefits of these devices are quite substantial: reduction of the required
capacity of the engine, compensation of the reactive power, reduction of the electromagnetic and heat
losses, dynamic adaptation to the load, reduced energy costs.
In the industry sector, motors can’t be replaced without an energy audit because direct costs may be
quite high especially if existing pieces of equipment are not yet amortized.
On the consumer side (residential sector), manufacturers are almost all planning such change in their
products. The main marketing argument is a lower consumption (dishwasher, washing machine). In
2020 and beyond, this argument will not be new anymore: for the same cost, manufacturer will propose
this generation of electric motors as an industry standard. As a consequence, it would be sufficient to
impose an EE label for imported products and encourage replacing appliances which are more than 10
year old. This effort on labelling should be done with the NEEAP 2012-2020 so that for the 2020-2030
period of time, market will offer (only) effective solutions for customers willing to replace their
appliances.
As for the other technologies, the price of such motors in 2015 is higher (+20%) but it should go down
in the future. Because of the volume effect, it is anticipated that prices in 2020 will be back at the same
level the previous generation is today.
6.3. Room heating and air conditioning
The lowest level of monthly consumption is obtained when room heating and air conditioning are not
used (falls and autumn): 400 GWh48. In summer, because of the use of AC appliances, consumption
raises to 460 GWh per month. In winter, the consumption reaches 496 GWh. If thermal insulation may
address both heating and cooling, the switch from electricity to gas (LPG) for room heating would
make sense in the future. This should be done not only for renovation in the residential sector, for new
buildings (residential, commercial) but also for the industry when boilers are used.
The main driver for that switch would be the operating cost. With the following assumptions:
47 e.g. variable voltage frequency (VFD: Variable Frequency Drives). 48 2013 consumption of electricity.
Energy Efficiency Action Plan for 2020-2030 – Final Report
51
Price for LPG (12kg): 62 NIS (5.2 NIS / kg),
1 kg of LPG produces 13.8 kWh, with an efficiency ratio of 90%,
Cost of 1 kWh produced with LPG: ~ 0.419 NIS.
and compared to the cost of electricity (USD 0.15 / kWh or NIS 0.58), LPG seems to be less expensive
than electricity. However, gas appliances are certainly much more expensive.
6.4. Fridges (residential sector)
This type of appliance has mainly two components: a compressor and an isolated cabinet. Compressors
should follow the same trend as for the electric motors. More EE compressors will become the new
industry standard. As a consequence, the EE labelling is a key measure to be implemented during
NEEAP 2012-2020 because it should be avoided to import less efficient appliances that will be used
for the next 10 years. Regulation of the second hand market should be considered at this stage.
6.5. Water heating
Solar water heaters have been very well developed in the past but their proportion among households
is decreasing (66.9% in 2012 and 56.5% in Jan 201549). In addition, a significant proportion is out of
order (46% of installed SWH).
Repairing these systems is a priority. Electricity is used as the main source for 59.5% of the households.
For heating water, the use of electricity is not an efficient usage. Indeed, if the ratio final energy /
primary energy is close to 80-90% for gas, it falls to 25% for electricity50. The switch to LPG (or
natural gas if available) has thus to be encouraged when there is no more room on the roof.
6.6. Smart homes
New devices: smart thermostat, communication and control of home appliances from a smart phone.
6.7. Building renovation and nearly Zero Energy Buildings
The energy losses for the building in the residential sector are estimated to be:
30% with the roof,
25% with the external walls, and
15% with windows and doors
Insulation of roofs should be the first step to start with.
If this renovation is done for 50% of the houses (i.e. 25% of the households) the consumption of
electricity used for heating could be reduced by:
For room heating: (496-400 GWh) * 2 month * 25% = 48 GWh / year.
As far as AC is considered, the insulation of walls, windows and doors with the use of more efficient
appliances could be applied to reduce the electricity consumption.
6.8. Smart metering
Smart meters offer direct access to information (display at home, independent of the meter location).
In addition, they can be used for demand side management.
49 Ref-7 : Households Energy 2015 book. 50 For producing electricity from gas, this ratio is already 50% (thermodynamics) plus transmission and distribution losses
+ appliance losses. Electricity should be reserved for the usages where no other energy can replace electricity.

Energy Efficiency Action Plan for 2020-2030 – Final Report
52
6.9. Smart grids
One of the expected benefits is to extend the capacity of existing infrastructures thanks to the use of
communication and computer-aided equipment. The insertion of distributed renewable energy (PV for
instance) is a good solution to reduce distribution losses.
6.10. Miscellaneous
Other potential sources of EE can be found in EE process technology and energy management, in
efficiency of water pumping or in sewage plants. They have not been considered in this report because
of the relatively small impact they have for Palestine.
Energy Efficiency Action Plan for 2020-2030 – Final Report
53
7. ENERGY EFFICIENCY ACTION PLAN FOR 2020-2030
7.1. Global strategy and main assumptions
Since electricity consumption by the residential sector accounts for almost two thirds of the national
consumption, it is of paramount importance for citizens to take ownership of the proposed NEEAP II
to benefit from new technologies and to reduce their bills. Vulnerable consumers should be recognized
and protected.
Electricity which is not consumed is electricity which does not have to be produced. As a consequence,
this plan contributes to reduce the dependence of Palestine on power imports and enhance its energy
security. It is also a matter of human behaviour. As long as cost of energy (NIS) and consumption
(kWh) are not transparent and easily accessed by consumers, it is difficult to ask them to modify their
behaviour. That is the reason why smart meters will play an important role in the information of the
consumers51.
It is also important for DISCOs to improve the operation of their distribution grids in particular when
physical limits are often reached. The progressive introduction of “smart grid” techniques may help to
go beyond these limits and delay investments because of the development of real-time communication
between equipment.
The proposed Action Plan presents a list of interventions with associated costs and benefits52 for each
of them. A cost per kWh saved is provided so that it can help to select the most appropriate actions.
This plan is mainly focused on the two most intensive consumers of electricity: the residential sector
and the distribution grid losses. An Excel spreadsheet model has been designed to identify the specific
consumption per usage.
Among the proposed actions, a selection has been made in order to minimize the cost for end-users
and for the Palestinian government. To do that, it is proposed to adopt EU market directives when
appropriate for Palestine. This is the case for instance for lighting: traditional bulbs and halogen are
no longer imported in Europe above 60W. As a consequence, manufacturers propose now CFLs and
LEDs at an affordable price. If the same decision was implemented in Palestine for 2019, the need to
subsidy CFLs would disappear. This decision has to be decided during NEEAP 2012-2020 so that the
market will be ready in 2020.
The proposed Action Plan is structured along three different phases. These phases are not subsequent
points in time. They rather correspond to a layer of measures classified according to their complexity
as shown below.
51 Real time information is a key element to associate a particular usage and its associated consumption. When a bill is
received one month later, it is often impossible to make the link with a particular usage. 52 The list of all the proposed EE actions leads to double the savings targeted in Section 5. That is the reason why a selection
within this list has to be made, in particular to take into account their cost and their political and social applicability to West
Bank and Gaza.
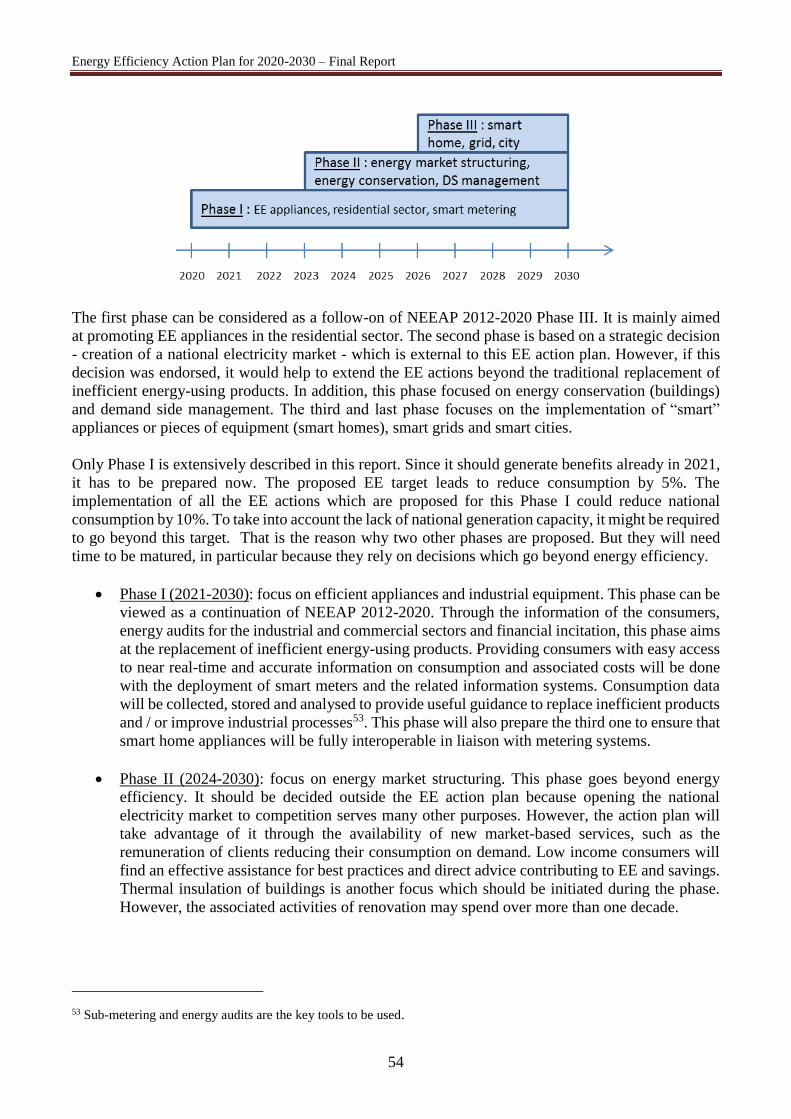
Energy Efficiency Action Plan for 2020-2030 – Final Report
54
The first phase can be considered as a follow-on of NEEAP 2012-2020 Phase III. It is mainly aimed
at promoting EE appliances in the residential sector. The second phase is based on a strategic decision
- creation of a national electricity market - which is external to this EE action plan. However, if this
decision was endorsed, it would help to extend the EE actions beyond the traditional replacement of
inefficient energy-using products. In addition, this phase focused on energy conservation (buildings)
and demand side management. The third and last phase focuses on the implementation of “smart”
appliances or pieces of equipment (smart homes), smart grids and smart cities.
Only Phase I is extensively described in this report. Since it should generate benefits already in 2021,
it has to be prepared now. The proposed EE target leads to reduce consumption by 5%. The
implementation of all the EE actions which are proposed for this Phase I could reduce national
consumption by 10%. To take into account the lack of national generation capacity, it might be required
to go beyond this target. That is the reason why two other phases are proposed. But they will need
time to be matured, in particular because they rely on decisions which go beyond energy efficiency.
Phase I (2021-2030): focus on efficient appliances and industrial equipment. This phase can be
viewed as a continuation of NEEAP 2012-2020. Through the information of the consumers,
energy audits for the industrial and commercial sectors and financial incitation, this phase aims
at the replacement of inefficient energy-using products. Providing consumers with easy access
to near real-time and accurate information on consumption and associated costs will be done
with the deployment of smart meters and the related information systems. Consumption data
will be collected, stored and analysed to provide useful guidance to replace inefficient products
and / or improve industrial processes53. This phase will also prepare the third one to ensure that
smart home appliances will be fully interoperable in liaison with metering systems.
Phase II (2024-2030): focus on energy market structuring. This phase goes beyond energy
efficiency. It should be decided outside the EE action plan because opening the national
electricity market to competition serves many other purposes. However, the action plan will
take advantage of it through the availability of new market-based services, such as the
remuneration of clients reducing their consumption on demand. Low income consumers will
find an effective assistance for best practices and direct advice contributing to EE and savings.
Thermal insulation of buildings is another focus which should be initiated during the phase.
However, the associated activities of renovation may spend over more than one decade.
53 Sub-metering and energy audits are the key tools to be used.
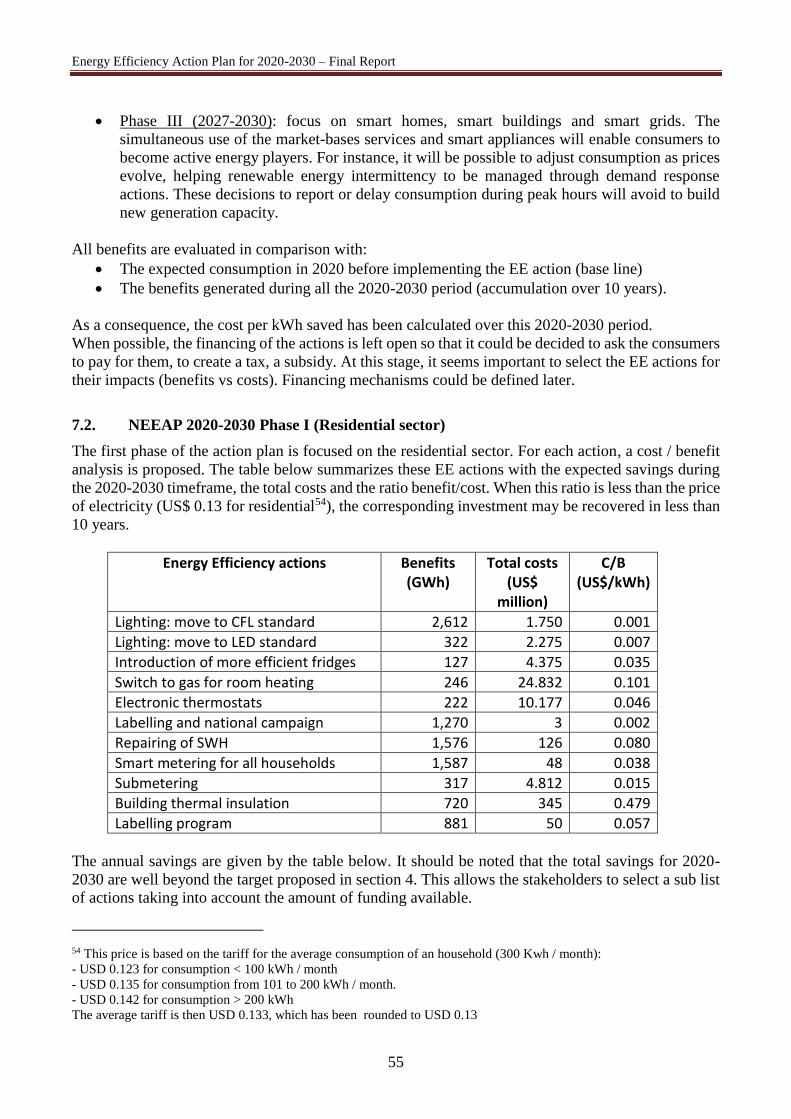
Energy Efficiency Action Plan for 2020-2030 – Final Report
55
Phase III (2027-2030): focus on smart homes, smart buildings and smart grids. The
simultaneous use of the market-bases services and smart appliances will enable consumers to
become active energy players. For instance, it will be possible to adjust consumption as prices
evolve, helping renewable energy intermittency to be managed through demand response
actions. These decisions to report or delay consumption during peak hours will avoid to build
new generation capacity.
All benefits are evaluated in comparison with:
The expected consumption in 2020 before implementing the EE action (base line)
The benefits generated during all the 2020-2030 period (accumulation over 10 years).
As a consequence, the cost per kWh saved has been calculated over this 2020-2030 period.
When possible, the financing of the actions is left open so that it could be decided to ask the consumers
to pay for them, to create a tax, a subsidy. At this stage, it seems important to select the EE actions for
their impacts (benefits vs costs). Financing mechanisms could be defined later.
7.2. NEEAP 2020-2030 Phase I (Residential sector)
The first phase of the action plan is focused on the residential sector. For each action, a cost / benefit
analysis is proposed. The table below summarizes these EE actions with the expected savings during
the 2020-2030 timeframe, the total costs and the ratio benefit/cost. When this ratio is less than the price
of electricity (US$ 0.13 for residential54), the corresponding investment may be recovered in less than
10 years.
Energy Efficiency actions Benefits (GWh)
Total costs (US$
million)
C/B (US$/kWh)
Lighting: move to CFL standard 2,612 1.750 0.001
Lighting: move to LED standard 322 2.275 0.007
Introduction of more efficient fridges 127 4.375 0.035
Switch to gas for room heating 246 24.832 0.101
Electronic thermostats 222 10.177 0.046
Labelling and national campaign 1,270 3 0.002
Repairing of SWH 1,576 126 0.080
Smart metering for all households 1,587 48 0.038
Submetering 317 4.812 0.015
Building thermal insulation 720 345 0.479
Labelling program 881 50 0.057
The annual savings are given by the table below. It should be noted that the total savings for 2020-
2030 are well beyond the target proposed in section 4. This allows the stakeholders to select a sub list
of actions taking into account the amount of funding available.
54 This price is based on the tariff for the average consumption of an household (300 Kwh / month):
- USD 0.123 for consumption < 100 kWh / month
- USD 0.135 for consumption from 101 to 200 kWh / month.
- USD 0.142 for consumption > 200 kWh
The average tariff is then USD 0.133, which has been rounded to USD 0.13
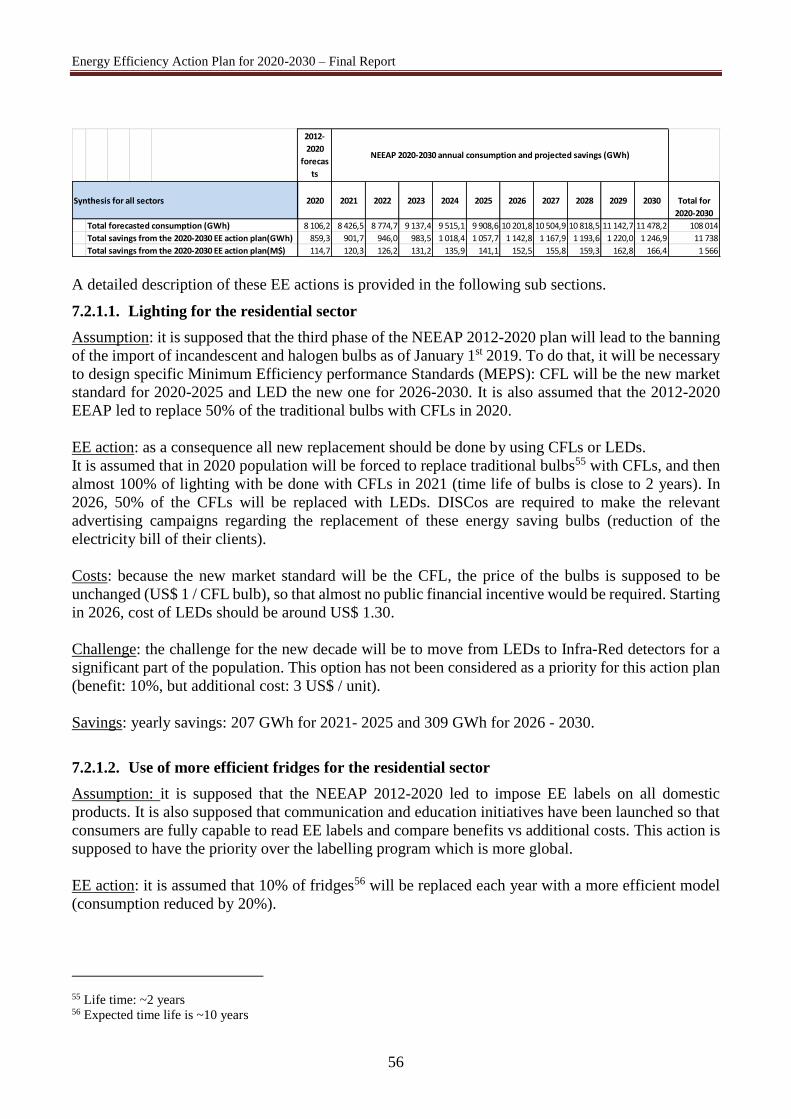
Energy Efficiency Action Plan for 2020-2030 – Final Report
56
A detailed description of these EE actions is provided in the following sub sections.
7.2.1.1. Lighting for the residential sector
Assumption: it is supposed that the third phase of the NEEAP 2012-2020 plan will lead to the banning
of the import of incandescent and halogen bulbs as of January 1st 2019. To do that, it will be necessary
to design specific Minimum Efficiency performance Standards (MEPS): CFL will be the new market
standard for 2020-2025 and LED the new one for 2026-2030. It is also assumed that the 2012-2020
EEAP led to replace 50% of the traditional bulbs with CFLs in 2020.
EE action: as a consequence all new replacement should be done by using CFLs or LEDs.
It is assumed that in 2020 population will be forced to replace traditional bulbs55 with CFLs, and then
almost 100% of lighting with be done with CFLs in 2021 (time life of bulbs is close to 2 years). In
2026, 50% of the CFLs will be replaced with LEDs. DISCos are required to make the relevant
advertising campaigns regarding the replacement of these energy saving bulbs (reduction of the
electricity bill of their clients).
Costs: because the new market standard will be the CFL, the price of the bulbs is supposed to be
unchanged (US$ 1 / CFL bulb), so that almost no public financial incentive would be required. Starting
in 2026, cost of LEDs should be around US$ 1.30.
Challenge: the challenge for the new decade will be to move from LEDs to Infra-Red detectors for a
significant part of the population. This option has not been considered as a priority for this action plan
(benefit: 10%, but additional cost: 3 US$ / unit).
Savings: yearly savings: 207 GWh for 2021- 2025 and 309 GWh for 2026 - 2030.
7.2.1.2. Use of more efficient fridges for the residential sector
Assumption: it is supposed that the NEEAP 2012-2020 led to impose EE labels on all domestic
products. It is also supposed that communication and education initiatives have been launched so that
consumers are fully capable to read EE labels and compare benefits vs additional costs. This action is
supposed to have the priority over the labelling program which is more global.
EE action: it is assumed that 10% of fridges56 will be replaced each year with a more efficient model
(consumption reduced by 20%).
55 Life time: ~2 years 56 Expected time life is ~10 years
Synthesis for all sectors 2020 2021 2022 2023 2024 2025 2026 2027 2028 2029 2030 Total for
2020-2030
Total forecasted consumption (GWh) 8 106,2 8 426,5 8 774,7 9 137,4 9 515,1 9 908,6 10 201,8 10 504,9 10 818,5 11 142,7 11 478,2 108 014
Total savings from the 2020-2030 EE action plan(GWh) 859,3 901,7 946,0 983,5 1 018,4 1 057,7 1 142,8 1 167,9 1 193,6 1 220,0 1 246,9 11 738
Total savings from the 2020-2030 EE action plan(M$) 114,7 120,3 126,2 131,2 135,9 141,1 152,5 155,8 159,3 162,8 166,4 1 566
NEEAP 2020-2030 annual consumption and projected savings (GWh)
2012-
2020
forecas
ts
Energy Efficiency Action Plan for 2020-2030 – Final Report
57
Costs: as for lighting, manufacturers will progressively introduce more efficient models and remove
the less ones57. Compared with today’s prices, there should not be additional cost for the entry models
in 2020. However, in order to encourage consumers to move rapidly towards EE products, a subsidy
of USD 50 will be offered when destroying a 10 year old fridge and replacing it with a more efficient
model. This subsidy would be limited to 10% of the households (87,000) and available during two
years only.
Challenge: the second hand market with non-efficient products coming from foreign countries is a
major risk. Communication and education are key to limit these imports. The obligation to have an EE
label on each product is also an important measure to decide.
Savings: yearly savings for 2021: 10.1 GWh.
7.2.1.3. Sub metering for families sharing the same meter
Assumption: during the households survey58 (2013), it has been noted that 63 families / 3000 where
not informed of their own consumption since they shared the meter with other families. An average of
10% has been considered.
EE action: additional meters will be distributed behind the global meter to inform the consumers.
Costs: total cost is estimated around US$ 4.8 million.
Challenge: these families are not seen as individual clients by the DISCOs. The point is not to establish
a new contract for them but rather to inform them about their consumption. This is a typical commercial
issue to be solved case by case by DISCOs.
Savings: yearly savings for 2021: 24 GWh (5% per family).
7.2.1.4. Replacement of electric room heaters with gas systems (residential sector)
Assumption: according to the consumption profile (see section 4.3.2), room heater is the second usage
by level of consumption. The situation is probably very different for households located near Jericho
and Central / North of West Bank. Heating with electricity is probably the usage having the lowest
efficiency if one takes into account the primary energy for producing final kWh59. On the other hand,
burning LPG may produce heat with 85-90% efficiency. The strategy which is proposed here for
individual houses (renovation and new) and new buildings is based on the following priorities:
1. Promote use of Solar Water Heating as far as possible to reduce the consumption of other
energies
2. Promote the use of gas (natural gas if available or LPG60) for central heating in order to
suppress electric room heaters
3. Keep electric room heaters for very limited usages
57 For this type of appliance in Europe today, only A, A+, A++ and A+++ models are widely available. 58 Source : Ref-16 Survey households – 2013 (300 respondents). 59 The ratio final energy / primary energy is close to 25% (because of generation, transmission and distribution losses). 60 Bottles and external tanks.
Energy Efficiency Action Plan for 2020-2030 – Final Report
58
EE action: As a consequence, a national policy is developed to implement the above strategy. It is
assumed that all new buildings will provide gas heating and that 2% of existing individual houses61,
each year and during 3 years, will move from electricity to SWH and gas.
Costs: a USD 1,000 subsidy is proposed for each household willing to move to gas. The annual cost is
closed to USD 8.3 million.
Challenge: the new place of gas within the energy mix is the central part of the discussion. The use of
LPG requires a well-structured distribution infrastructure and security standards to build gas tanks
closed to buildings. In addition, LPG is imported from Israel where gas fields don’t contain a high
proportion of LPG. The opportunity to implement a natural gas distribution grid in West Bank and
Gaza goes beyond this study.
Savings: expected savings are 26 GWh the third year.
7.2.1.5. Introduction of programmable electronic thermostats for individual regulation of the
temperature
Assumption: for electric room heaters, the use of electronic thermostats to adjust the temperature of
each room should reduce consumption. Two solutions are available: either to replace electric heaters
with a model having such electronic regulation, or to add to the existing installation a centralized
thermostat driving individual heaters (3 per household as an average). The second one is recommended
for immediate implementation within this EE action plan.
EE action: Make sure that electric room heaters with electronic regulation are available on the market.
It is assumed that 20% of the households will adopt this device.
Costs: USD 180 for an electronic thermostat, US$ 10.2 million for the total cost.
Savings: expected savings are 17GWh per year (10% of the consumption per household compared to
mechanical thermostats).
7.2.1.6. Communication plan for other electric appliances for residential and commercial
sectors
Assumption: it is supposed that during 2012-2020 NEEAP, labelling of residential appliances has been
defined and that EE cards are available.
EE action: Three national campaigns will be organized at the beginning of each phase of the NEEAP
2020-2030. The targets will be the domestic and the commercial sectors for all electric appliances. The
key messages will be the labelling, the promotion of EE appliances and the energy conservation
behaviours (medias, TV Ads, etc.). The deployment of smart meters for all households and all
commercial enterprises will also complete the information of the consumers. A strong cooperation has
to be established with DISCOs in order to make sure the consumers will take advantage of the almost
real time data delivered by smart meters. In particular, DISCOs should provide their customers with
cost comparisons done with similar clients.
61 47.3% of households are individual houses but probably only a part of them use electricity for heating.
Energy Efficiency Action Plan for 2020-2030 – Final Report
59
Costs: USD 1 million per campaign in addition to the deployment of about 875,000 smart meters (one
per household) in parallel.
NB: the cost of the meters (~USD 50 million) is taken into account in the section: reduction of
distribution grid losses.
Savings: each campaign aims at decreasing the yearly consumption of these two sectors by 2%. As
already seen in other countries, this reduction is not sustainable overtime. That is the reason why the
national campaigns will be repeated during the 2020-2030 timeframe to maintain a 2% reduction of
the consumption.
Residential sector: yearly savings for 2021: 97 GWh
Commercial / services sectors: yearly savings for 2021: 36 GWh
7.2.1.7. Smart metering for all the residential sector
EE action: The deployment of smart meters for each households aims at informing consumers, so that
they can act on their consumption. For the DISCOs, this deployment will help to reduce commercial
and technical losses. This deployment requires also implementing an advanced information system to
monitor losses and provide comparisons between similar clients. The goal is also to enable consumers
for detecting extra consumption.
Costs: USD 48.1 million for the deployment of about 875,000 smart meters (one per household).
Savings: according to similar projects implemented in others countries, the expected reduction of
consumption is about 2.5%. In addition, reduction of distribution grid losses should reach at least 2%.
Globally, 218 GWh / year could be saved.
7.2.1.8. Building thermal insulation for individual houses
Assumption: thermal insulation is important for reducing energy consumption for both heating and
cooling. It is generally estimated that the loss of energy in winter may reach 15% for windows and
doors, 25% for the external walls and up to 30% for the roof. It is also assumed that in summer, this
insulation will reduce AC consumption in the same proportion.
EE action: individual houses are targeted for the thermal insulation. Actions should be focused on the
replacement of windows and doors and on the insulation of the roof. One third of the individual
houses62 are targeted by this action.
Costs: cost for insulation an individual house is estimated around US$ 2,500 for reducing the
consumption of energy for heating by 25%. Total cost is estimated around US$ 345 million.
Savings: based on a reduction of 25% of the electricity consumed for heating, the total savings are
around 33 GWh / year.
7.2.1.9. Implementation of labelling program for domestic appliances
Assumption: this program has been initiated during NEEAP 2012-2020 with the development of
testing facilities.
62 About one household over two leaves in an individual house (source: PCBS household survey).
Energy Efficiency Action Plan for 2020-2030 – Final Report
60
EE action: a simplified EE labelling program for domestic appliances is defined. Trainings are
organized for professionals, media awareness campaigns are dedicated to the use of the EE cards,
laboratories are certified for testing and validating the characteristics of various appliances (fridge,
washing machines, HVAC, lighting, …) either imported or locally manufactured. Control mechanisms
are defined such as the test of randomly selected samples of domestic products.
Costs: US$ 50 million for the first certified laboratory.
Savings: 69 MWh / year (8% of the annual consumption of the main domestic appliances).
7.2.1.10. Repairing existing solar water heating systems
Assumption: According to households survey for 2014 (PCBS), 25.8% of existing SWH are out of
order. It is proposed to repair these installations. This should lead to save 50% of the electricity used
producing hot water for an average surface of 1 m2 per household.
EE action: repairing out of order installations.
Costs: cost is assumed to be similar to the one for a new installation (US$ 700). Total cost is estimated
around US$ 126 million.
Savings: based on a reduction of 50% of electricity consumed, the total savings are around 121 GWh
/ year.
7.3. NEEAP 2020-2030 Phase I (other sectors)
7.3.1.1. Sub metering for large enterprises
Assumption: for large enterprises and public services, the consumption of electricity is a kind of
stranded cost: it is difficult to relate electricity consumption with activities and specific behaviours.
This is true in particular for post-paid metering. In addition, for the large organisations, payments and
consumption are not managed in an interactive manner. 5% of the 51,000 industrial and commercial
enterprises63 representing 238,000 employees should be targeted.
EE action: additional (sub) meters will be distributed behind the totalizing meter to inform the manager
of various activities (production, sales, administration, R&D…). Ideally, the information provided by
sub metering should encompass daily and monthly consumptions so that enterprises will be able to
associate efficiency measures with results. In addition, the designation of an “energy manager” in the
large enterprises should help to realize where energy is consumed and for what benefit.
Costs: total cost is estimated around US$ 5 million (based on 10 sub meters per enterprise at US$ 200
per sub meter).
63 According to Ref-8 statistical yearbook of Palestine 2014: 16,200 industrial enterprises, 500 construction firms, 600
information & communication enterprises and 33,400 service companies.
Energy Efficiency Action Plan for 2020-2030 – Final Report
61
Challenge: Disco should be involved in the selection of the “strategic” locations where to install sub
metering in order to reflect an objective consumption per activity.
Savings: yearly savings for 2021: 6 GWh.
7.3.1.2. Reduction of the distribution losses (part-1)
EE action: The deployment of smart meters for each household aims at informing DISCos in real time
and at detecting thefts by comparing energy delivered by LV feeders and the total consumption of the
related consumers. This deployment requires also implementing an advanced information system to
monitor losses.
Costs: USD 48.1 million for the deployment of about 875,000 smart meters (one per household).
Savings: reduction of distribution grid losses should reach at least 2% or about 100 GWh per year.
7.3.1.3. Reduction of the distribution losses (part-2)
A specific action plan needs to be built by DISCos for reducing these losses. Among the most frequent
operations to undertake, the following one seems to be the priority, for the part of the distribution grid
they manage:
Use state of the art troubleshooting tools to improve maintenance of MV/LV lines
Reduce the length of LV lines by implementing additional MV/LV transformers close to the
loads
Increase the detection and the measure of unbalanced loads on 3-phase lines (MV and LV)
Install additional meters on the feeders to detect thefts (difference between the total amount of
energy leaving the transformer and the total metered energy on the consumer side)
Organize regularly technical inspections
Make sure that street lighting has a specific meter
Remove all non-metered consumption
7.4. NEEAP 2020-2030 Phase II
7.4.1.1. Demand side management
The proposed NEEAP II focuses on energy consumption (not generation). Since Palestine is mainly a
consumer importing energy from IEC, the efficient use of energy needs to be the priority. However, in
the future, Palestine should become more independent and, as such, will be responsible to manage its
domestic generation and in particular the peak demand. For a given annual consumption of energy, the
generation costs are not the same if the consumption profile is relatively flat or if this profile has severe
peaks of demand. Indeed, a power plant which is used for the peaks only (a few hundreds of hours /
year) will have higher operating costs than a power plant used for supplying the base load.
In order to shave these peaks of demand and report consumption later, a communication mechanism
is needed between the system operator and the consumers. The deployment of smart meters will be the
base for this type of communication. Additional mechanisms, such as a ToU (time of use) tariff may
help to convince customers to reduce temporarily their consumption.
Energy Efficiency Action Plan for 2020-2030 – Final Report
62
The value of this type of service is based on the generation costs which are avoided during a peak
demand.
7.4.1.2. Building thermal insulation
The short-term action proposed in Phase I is the thermal insulation of existing buildings. For new
buildings, it will be necessary to design specific Minimum Efficiency performance Standards (MEPS)
and building codes, in order to avoid less efficient a posteriori actions. The concept of nearly Zero
Energy Building (nZEB) is an attempt to standardize the consumption of energy per m2 per year.
Building codes for existing and new buildings will have to be revisited in order to introduce this
concept of nZEB. This will be mandatory for all public building and subject to a financial incitation
for the residential sector. The use of renewable sources of energy has to be considered in order to limit
the use of energy “imported” by the buildings.
A building renovation strategy needs to be defined for the residential sector in order to improve thermal
insulation (starting with the coldest and the hottest regions).
7.5. NEEAP 2020-2030 Phase III
In the proposed EE Action Plan, Phase I prepares the “smart homes”. In this phase, the introduction of
“communicating” appliances should improve the consumption of energy but the main benefits should
have been collected during the previous phases. In addition, the future price for this type of product is
not yet stable enough to freeze firm technical orientations.
Phase II is the foundation for building smart cities. From a pure energy efficiency perspective, the
additional benefits of the communication between components (street lighting, car parks,
transportation …) are more related to an optimization of the use of the energy at a more global scale.
However, this phase introduce a major breakthrough for the design of distribution grids.
7.5.1.1. Towards the implementation of smart grids
Until recently, the 280 connection points from Palestinian electricity distributors with IEC were mostly
build at low voltage (LV) with undersized equipment. This is one of the explanations of the high level
of technical losses. With the completion and the interconnection of the 4 substations in the West Bank,
all these interconnections should be reconsidered. Progressively, all LV connection with IEC should
be replaced by a new link to an output feeder of these substations. This reconstruction of the
distribution grid will take time.
The introduction of smart grid component is a first attempt to build this new architecture. In order to
reduce technical losses and to prepare the insertion of distributed generation (PV, wind), the use of
this new technology should avoid to implement a new grid with obsolete (traditional) components.
The reduction of technical loses is not sufficient to justify the introduction of smart grids. The ability
to support RE at the distribution level will remove any barrier for connecting a high proportion of
intermittent sources onto the new grid.
7.6. Impacts of this EE action plan on the creation of jobs
Potential EE domains may become opportunities for creating new jobs. This has been already
demonstrated in several MENA countries (Lebanon, Egypt).
For instance, the use of more efficient appliances may create new business opportunities: these
appliances could be locally manufactured and not imported. High efficiency lighting is such an
Energy Efficiency Action Plan for 2020-2030 – Final Report
63
opportunity with the need to produce CFLs and LEDs. Encouraging the creation of local factories
manufacturing these new products should reduce the import costs and create new jobs:
For the manufacturing of bulbs and the final assembly
For the manufacturing of the electronic circuit
For testing and packaging
The market size is probably more than 2 million energy saving bulbs (50% of the households, average
of 4 bulbs per household).
Solar water heating is another source of job creation with the installation of new systems and the
maintenance of existing ones.
Thermal insulation of buildings is the main source of job creation. According to the review of
European NEEAP, 1 Mtoe/year energy savings (11 630 GWh) will enable the creation of 5 000 new
jobs mainly in the construction sector, energy certifiers and auditors, inspectors of heating / air
conditioning systems. For a target of 5 000 GWh, 2150 jobs could be created in Palestine.
Energy Efficiency actions lead to net employment generation given that energy efficiency activity is
more labor intensive (and less capital intensive) than the production of energy saved.
For building insulation and renovation, a study64 in Europe concluded that about 1 million new jobs
related to energy renovations have been created in Europe during the period 2005-2015. Compared
to the investment level, this is equivalent to the creation of 12 to 17 new jobs for each €1 million
invested. Similarly, bases on this ratio, the NEAAP 2020-2030 which is proposed here for building
renovation could lead to create between 3600 and 5100 new jobs in Palestine.
According to another study made in Europe65, the employments within EU28 dealing with energy
efficiency goods and services sold in 2010 amounted to approximately 1% of total EU employment.
A direct comparison with Palestine could lead to 18,000 jobs dedicated to energy efficiency.
However, the target accepted by EU (-20%) is more ambitious than the Palestinian one (5%).
7.7. Recommendations for an implementation plan
This section provides indications about how to roll-out and implement the energy efficiency included
in the action plan. In order to contribute to identify roles and responsibilities, a RACI66 approach is
proposed.
The table below summarizes the main steps and actions. For all these actions, the PENRA/ Energy
efficiency Team has the responsibility to organize the advertising campaigns and to follow up on.
For all the actions PEC has the responsibility to propose financial incentives and devise the appropriate
business model to each measure. From the table below, the “A” means Accountable, while the “R”
means Responsible.
64 Jobs creation through energy renovation of the house stock (Frits Meijer, Henk Visscher, Nico Nieboer, Robert Kroese
Neujobs working paper D14.2 – december 2012 65 Assessing the Employment and Social Impact of Energy Efficiency - Final report Volume 1: Main report - Cambridge
Econometrics November 2015 66 RACI is a responsibility assignment matrix.
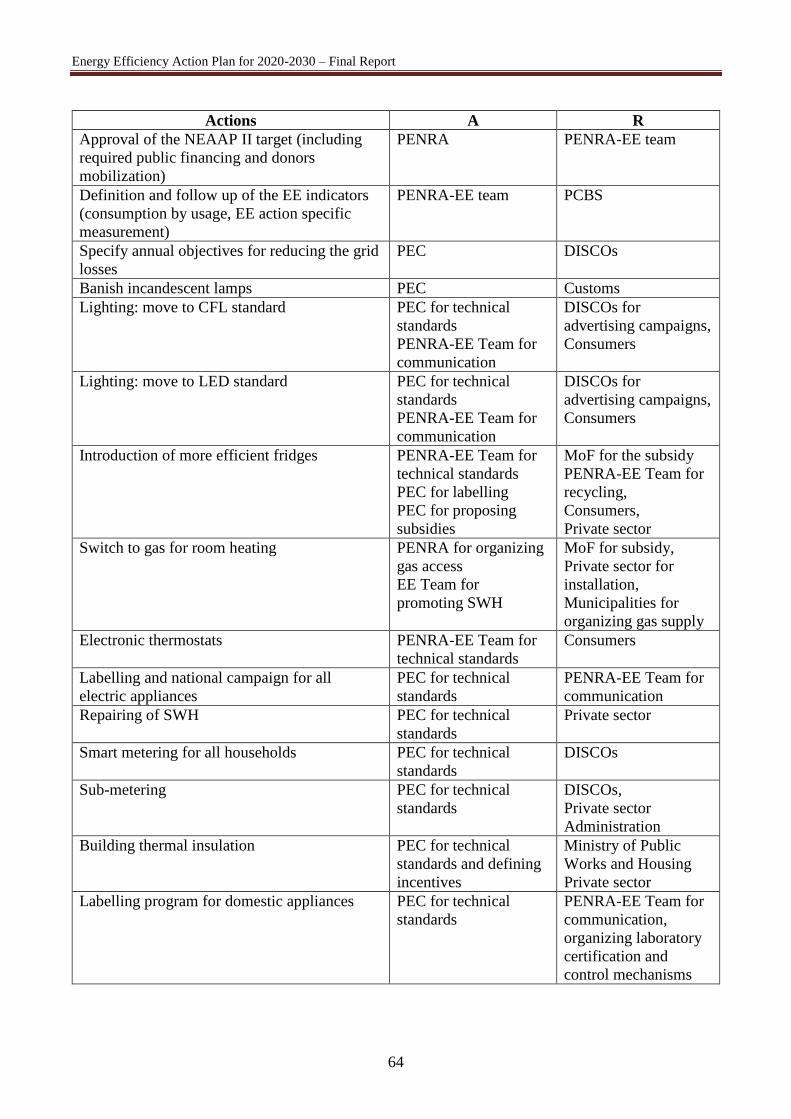
Energy Efficiency Action Plan for 2020-2030 – Final Report
64
Actions A R
Approval of the NEAAP II target (including
required public financing and donors
mobilization)
PENRA PENRA-EE team
Definition and follow up of the EE indicators
(consumption by usage, EE action specific
measurement)
PENRA-EE team PCBS
Specify annual objectives for reducing the grid
losses
PEC DISCOs
Banish incandescent lamps PEC Customs
Lighting: move to CFL standard PEC for technical
standards
PENRA-EE Team for
communication
DISCOs for
advertising campaigns,
Consumers
Lighting: move to LED standard PEC for technical
standards
PENRA-EE Team for
communication
DISCOs for
advertising campaigns,
Consumers
Introduction of more efficient fridges PENRA-EE Team for
technical standards
PEC for labelling
PEC for proposing
subsidies
MoF for the subsidy
PENRA-EE Team for
recycling,
Consumers,
Private sector
Switch to gas for room heating PENRA for organizing
gas access
EE Team for
promoting SWH
MoF for subsidy,
Private sector for
installation,
Municipalities for
organizing gas supply
Electronic thermostats PENRA-EE Team for
technical standards
Consumers
Labelling and national campaign for all
electric appliances
PEC for technical
standards
PENRA-EE Team for
communication
Repairing of SWH PEC for technical
standards
Private sector
Smart metering for all households PEC for technical
standards
DISCOs
Sub-metering PEC for technical
standards
DISCOs,
Private sector
Administration
Building thermal insulation PEC for technical
standards and defining
incentives
Ministry of Public
Works and Housing
Private sector
Labelling program for domestic appliances PEC for technical
standards
PENRA-EE Team for
communication,
organizing laboratory
certification and
control mechanisms
Energy Efficiency Action Plan for 2020-2030 – Final Report
65
All these actions could be implemented in parallel. For each action, the leader “A” should build a
business plan identifying the expected benefits, costs and possible needs for public funding / subsidies.
The business plan would include a detailed implementation plan for submission to a NEEAP steering
committee composed of senior representatives from PEC, PENRA-EE Team, MoF, DISCOs,
municipalities and consumers. The main role of this committee will be to monitor and support
implementation of each action and to ensure that implementation delivers the expected results.
8. CONCLUSION
The Energy Efficiency Action Plan for 2020-2030 (NEEAP II) for Palestine puts forward additional
opportunities for energy efficiency to reach an ambitious target to reduce total electricity consumption
by 500 MWh per year. The Action Plan focuses on measures to reduce the consumption of electricity
in the residential sector (two thirds of the national consumption) because of its largest savings potential.
Indeed, electricity is the main source of energy in the Palestinian energy mix, and for this source, the
residential sector is the main consumer. Other energy sources have their own leading consumption
sector. Diesel and gasoline are mainly consumed by the transport sector, LPG by the residential sector.
These sources might need also a specific EE action plan.
The NEEAP II is composed of a layering of three phases: Phase I starts in 2020; Phase II starts in 2023
and Phase III starts in 2026. Phase I of this plan focuses on “low hanging fruits” i.e. the most energy-
hungry appliances (lighting, room heating, fridge and HVAC systems). Phase II and III are
implemented in parallel with the first one but are delayed by 3 years each. They are dedicated to more
complex actions based on the structuring of a national energy market and on the rehabilitation of the
distribution grid. It is recommended to already start preparing the implementation of Phase I in order
to ensure that energy saving benefits are reaped by 2021.
The NEEAP II includes a cost/benefit ratio (US$/kWh) per each proposed action to rank their cost-
effectiveness. All actions have pay-back periods of less than ten years, except for the building thermal
insulation. The source of funding for these investments is not prescribed since many actions could be
financed by the consumers themselves but the introduction of public funding could help accelerate
their implementation. Some very efficient actions do not require large investments, such as new
regulation, awareness campaigns and improved organization, and could be effective if stakeholders
are well identified. This is the case for example for the technical specifications (Minimum Efficiency
Performance Standard) used to remove the least energy efficient appliances.
For the sake of efficiency, it is recommended to build upon existing high-quality standards and
regulations such as those from the European Union (EU), e.g. labelling. Technical specifications
could be simplified, but regulatory action should be undertaken as soon as possible to send appropriate
signals to market actors (consumers and manufacturers) and attract private capital for required
investments.
The energy efficiency actions put forward in the Action Plan 2020-2030 have been selected based on
a consumption model designed with input data mostly from the Palestinian Central Bureau of Statistics
(PCBS) to reflect the part of each usage within the total consumption. In the absence of statistics related
to quantitative usages of electricity, a daily consumption profile has been designed. This model has
been used to size the EE potential for activity sectors and usages of electricity within each sector but
it could be used also in the future to dimension generation capacity on a daily basis.
Managing the demand for energy is a priority today but managing the power capacity (peak loads) will
become important when an independent transmission grid will be operated by Palestinian Electricity
Transmission Company Limited (PETL). At present, Palestinian electricity distributors purchase
Energy Efficiency Action Plan for 2020-2030 – Final Report
66
electricity from the Israel Electric Corporation (IEC) at a high price but the latter is responsible for
managing the flexibility of the demand. In the future, PETL could purchase “blocks” of electricity on
the international market at a lower price, but it will have the responsibility to make daily forecasts and
balance demand and generation in real time. To be effective as a system operator, PETL will have to
know the consumption and the factors influencing it: external temperature, commercial activities, and
consumption behaviours.
Among the proposed EE actions in the NEEAP II, two of them may require a complex implementation
program:
The first action is the generalization of the smart meters for the residential sector. This program
aims at providing relevant information to the consumers so that they will be in a position to
better manage their consumption. These meters are the visible part of the iceberg. A
sophisticated information system is simultaneously required from DISCos to prepare energy
audits per household, compare consumption profiles to detect non-efficient usages, recommend
the replacement of appliances, etc. Home displays or equivalent devices (e.g. mobile
application) will help the consumers to relate their daily behaviours and the impacts on their
consumption. Monthly billing information is not sufficient to create the link between usage and
energy. The same program should help DISCOs to improve their quality of service (detection
of failures) and reduce technical / commercial losses. However, smart meters are not sufficient.
Internal processes have to be implemented to randomly check the consumption and detect
unbalanced low-voltage (LV) lines.
The second action is to promote a switch from electricity to gas (LPG and/or natural gas) for
room heating. With an efficiency ratio of only 25%, it does not make sense to use electricity to
heat air or water from an energy perspective. Electricity should be reserved to usages where
there are no replacements (motors, electronics …). For consumers, the main argument in favour
of electricity is the low cost of appliances. However, the operational costs of gas are much
lower in the long run. This switch cannot be initiated without a national strategy for gas so that
the cost of the required infrastructures (transportation and storage of gas) will be shared
between all the actors. The development of solar water heating is part of this issue since it
would decrease the need to use non-renewable energy. Palestine has been a regional leader in
the implementation of solar water heaters, but this position is rapidly being eroded. The action
which is proposed suggests starting with repairing the existing systems which are no longer
functional.
Several of the recommended energy efficiency actions should contribute to create jobs. Job-related
benefits are not included the economic analysis. However, international experiences such as in the EU
and Lebanon confirm that EE measures in the building sector, i.e. insulation, contribute to create the
largest number of jobs, followed by solar water heaters and CFL manufacturing. As for other EE
actions proposed in this plan, communication campaigns and technical assistance for market
structuring could also contribute to job creation. The success of solar water heaters in Palestine could
be a future reference to develop and support the take-off of other local industries: relatively simple
components, simple financing mechanisms and acceptable return on investment for the development
of thriving companies all along the supply chain.
Energy Efficiency Action Plan for 2020-2030 – Final Report
67
9. REFERENCES
1. The Palestinian National Energy Efficiency Action Plan (NEEAP)
2. Forecasted Demand Study – PENRA (2009)
3. The National Energy Efficiency Action Plan for Lebanon (NEEAP 2011-2015)
4. Annual Report 2011 - PERC
5. World Population Prospects (2015 revision) – United Nations
6. World Urbanization prospects (2014 revision) – United Nations
7. Households Energy 2015 Book 2134 - Palestinian Central Bureau of Statistics
8. Palestine 2014 book 2093 - Palestinian Central Bureau of Statistics
9. Energy Efficiency Indicators Fundamentals on Statistics - IEA (2014)
10. Fiscal Developments: Fourth quarter and Full Year 2014 – Ministry of Finance State of Palestine
11. National Energy Efficiency Economic Model for Palestine (PEA – 2013)
12. Results of Energy Audits Findings, Analysis and recommendations (Palestinian Energy
Efficiency Team – 2013)
13. World Bank data (pse_country 2015)
14. Economic Forecast Report, 2014 (PMA – December 2013)
15. Economic survey 2014 book 2155 - Palestinian Central Bureau of Statistics
16. Survey Households 2013 – 300 respondents
17. Survey commercial buildings – 20 buildings / 2674 employees
18. Energy Efficiency Indicators in RCREEE (Regional Center for Renewable Energy and Energy
Efficiency) Member states (2014)