Embed Size (px)
Citation preview
West African Monsoon 2010
Large-Scale Overview
Ros Cornforth
Department of Meteorology, University of Reading
•Above average rainfall over much of W. Africa, Chad and Central African Republic, and parts of Nn Ethiopia.
Highlights
•Precipitation and Convection
•Monthly Atmospheric Fields over Africa
Interannual Variability
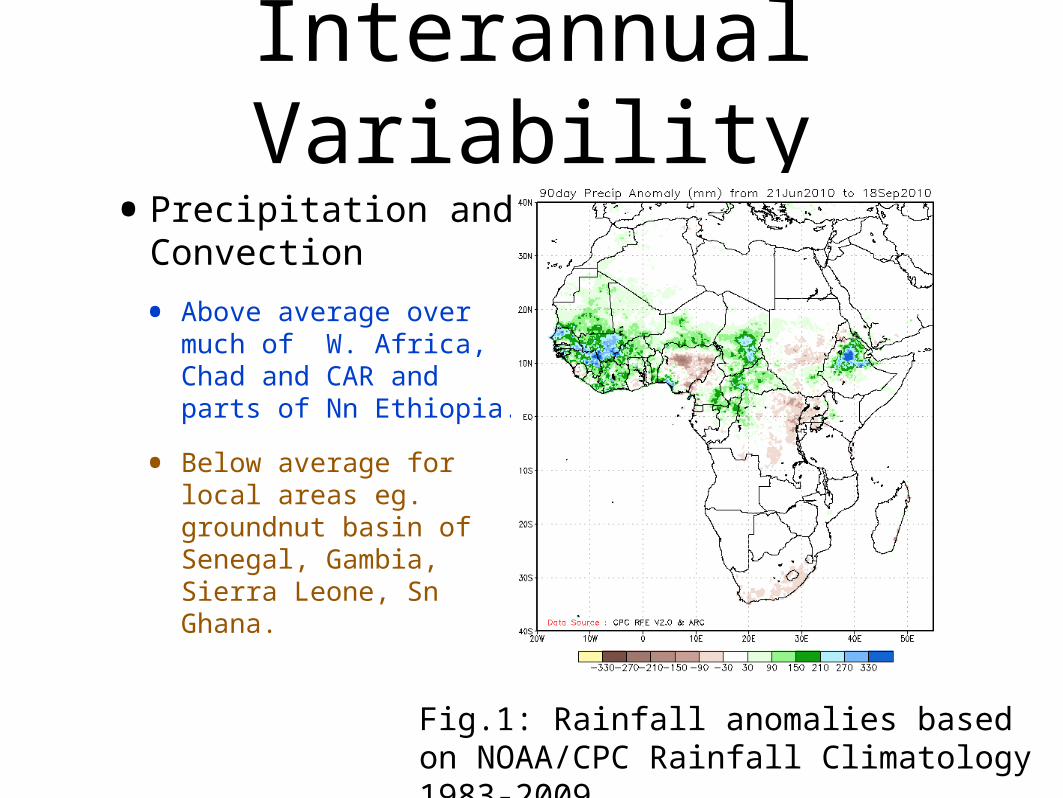
•Precipitation and Convection
• Above average over much of W. Africa, Chad and CAR and parts of Nn Ethiopia.
• Below average for local areas eg. groundnut basin of Senegal, Gambia, Sierra Leone, Sn Ghana.
Interannual Variability
Fig.1: Rainfall anomalies based on NOAA/CPC Rainfall Climatology 1983-2009.
Interannual Variability
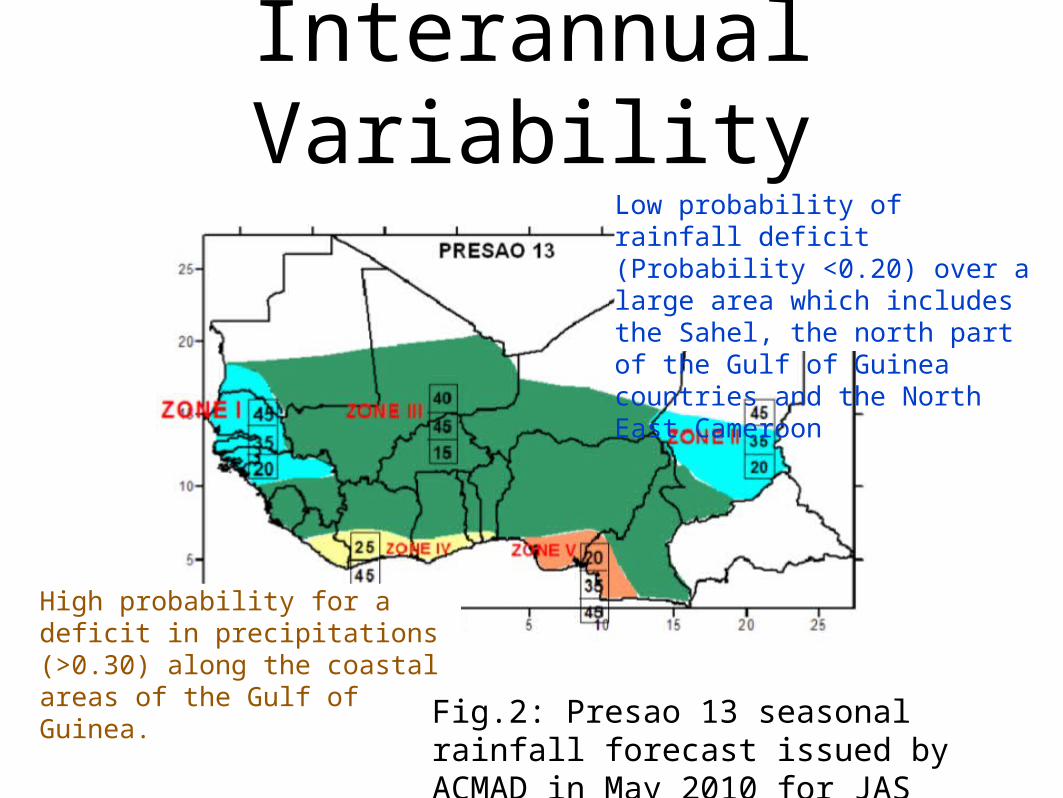
Fig.2: Presao 13 seasonal rainfall forecast issued by ACMAD in May 2010 for JAS
High probability for a deficit in precipitations (>0.30) along the coastal areas of the Gulf of Guinea.
Low probability of rainfall deficit (Probability <0.20) over a large area which includes the Sahel, the north part of the Gulf of Guinea countries and the North East Cameroon
Interannual Variability
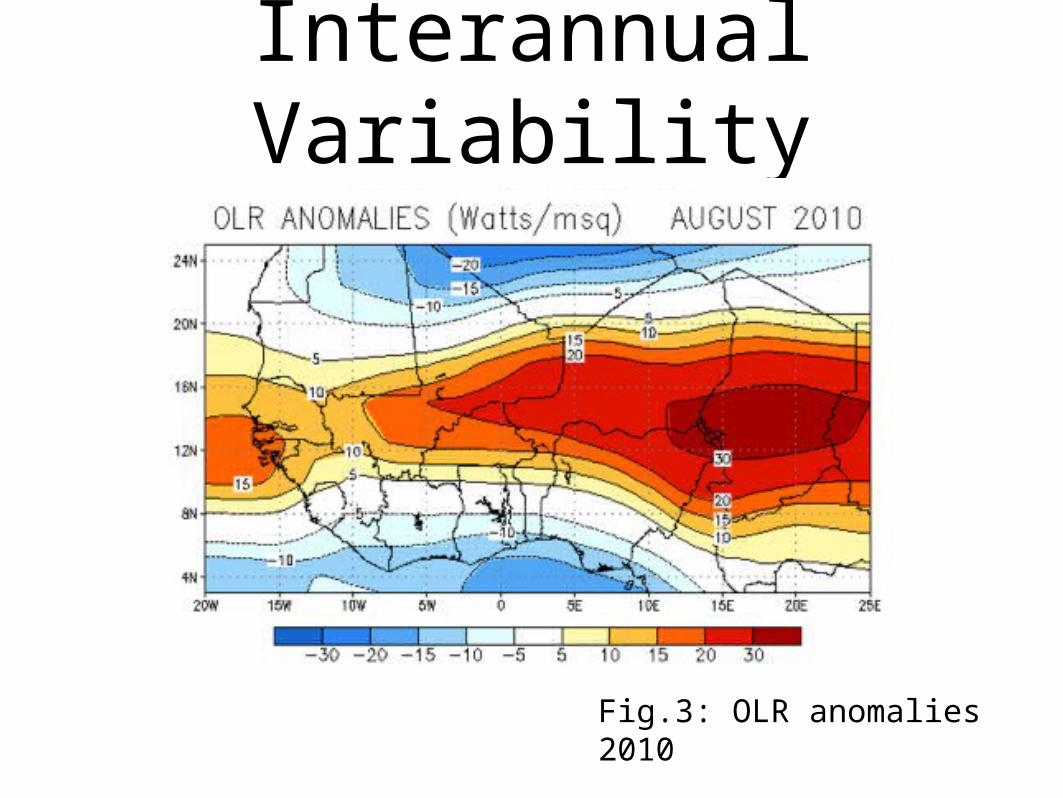
Fig.3: OLR anomalies 2010
Interannual Variability
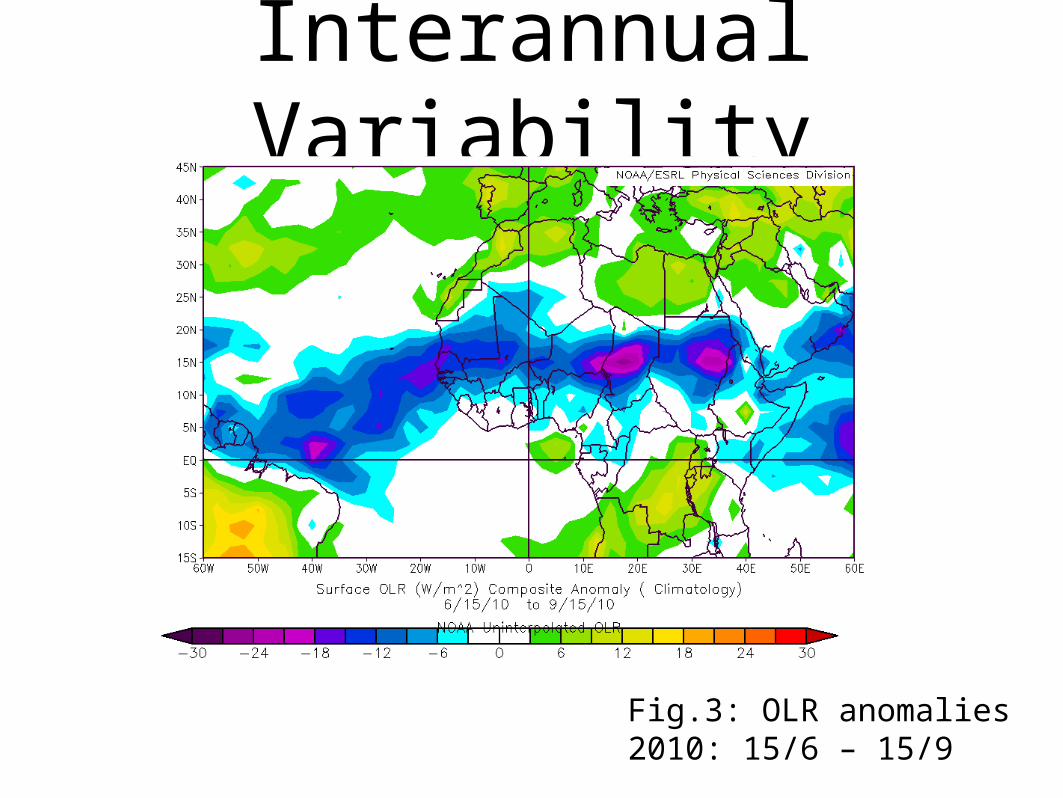
Fig.3: OLR anomalies 2010: 15/6 – 15/9
Interannual Variability
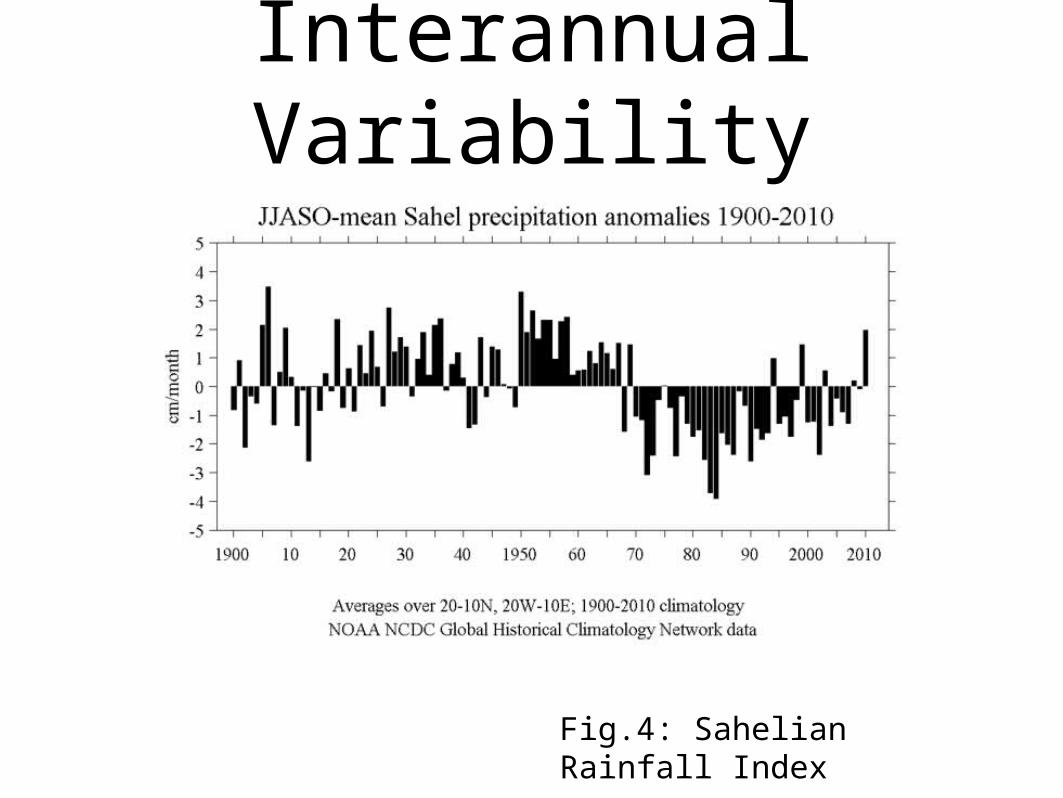
Fig.4: Sahelian Rainfall Index
“Apart from July where most places in Ghana experienced reduced rainfall, almost everywhere in Ghana was extremely wet during the period. The lake Volta which supplies water for hydroelectricity generation was so full and the water managers had no option but to open the spill way after 20 years that it was kept closed.” Charles Yorke, GMET, Ghana (pers comms)
Interannual Variability
Interannual Variability
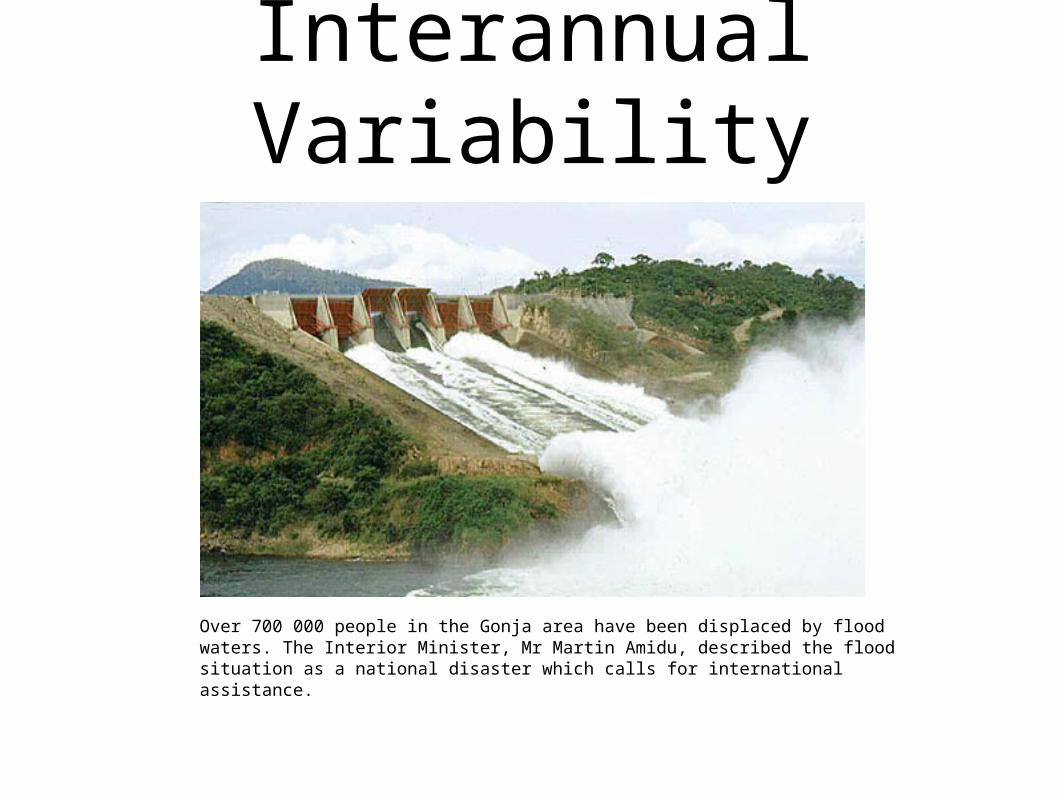
Over 700 000 people in the Gonja area have been displaced by flood waters. The Interior Minister, Mr Martin Amidu, described the flood situation as a national disaster which calls for international assistance.
Interannual Variability
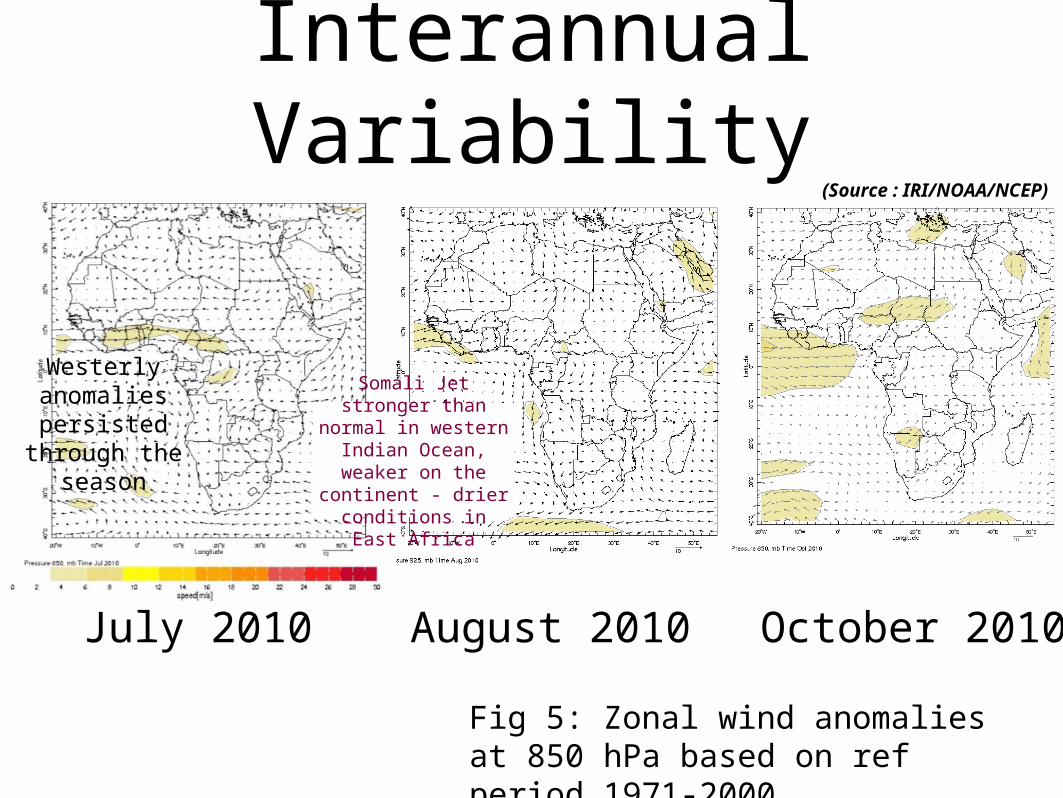
Fig 5: Zonal wind anomalies at 850 hPa based on ref period 1971-2000.
October 2010
(Source : IRI/NOAA/NCEP)
Westerly anomalies persisted
through the season
July 2010 August 2010
Somali Jet stronger than normal in western Indian
Ocean, weaker on the continent - drier conditions in East
Africa
Interannual Variability
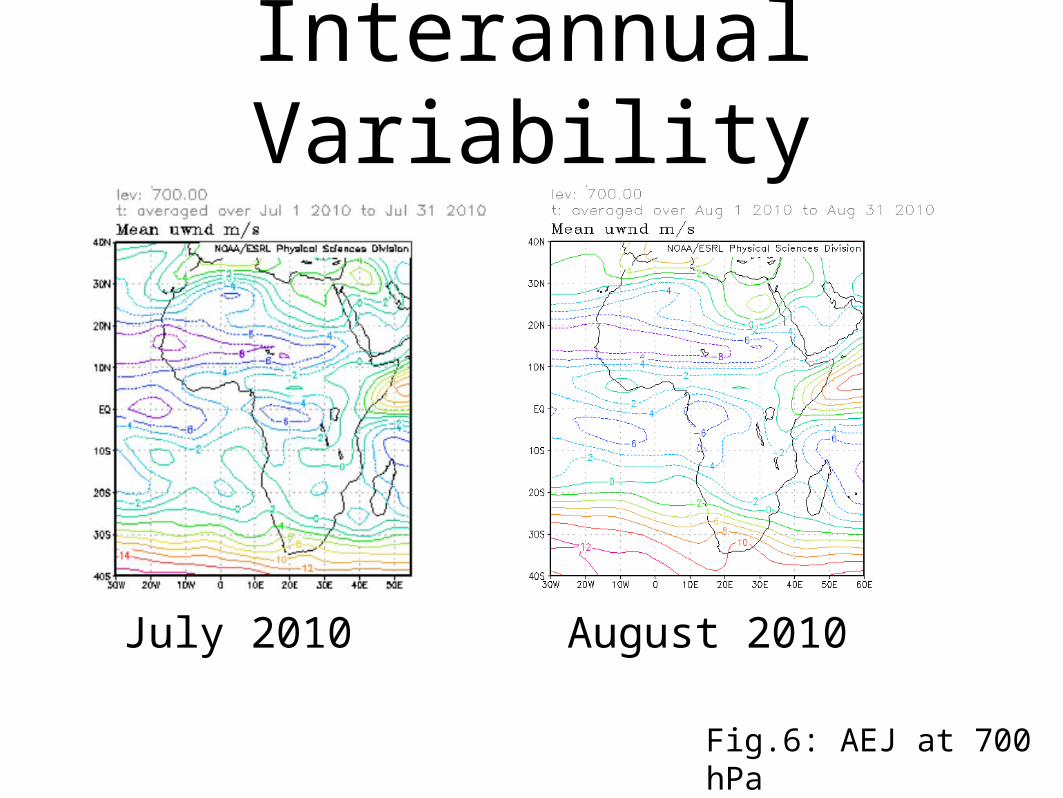
Fig.6: AEJ at 700 hPa
August 2010July 2010
Annual cycle and Monsoon onset•Sudden early migration of the ITCZ
due to mid-lat trough strengthening Malian low.
•Also responsible for the cyclonic wind flow over much of West Africa.
• Intensification of Mascarene high also pumped huge amounts of moisture into the source region of the convective systems tracking over West Africa (from the Congo basin up to Ethiopia).
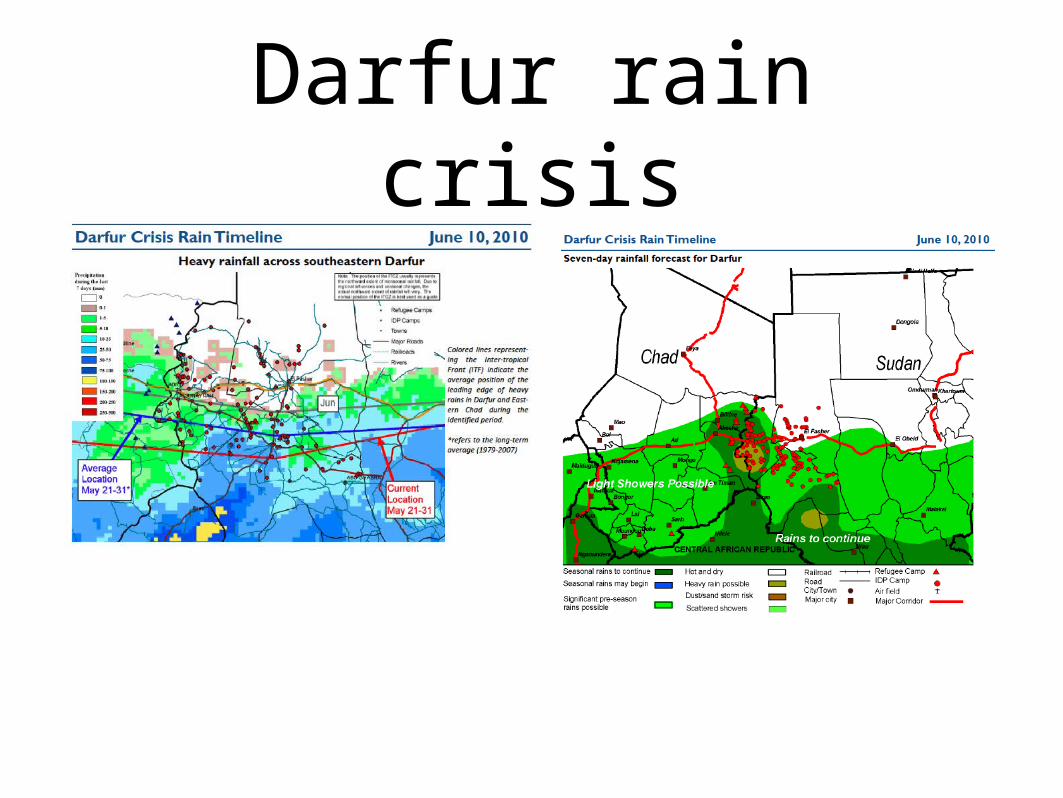
Darfur rain crisis
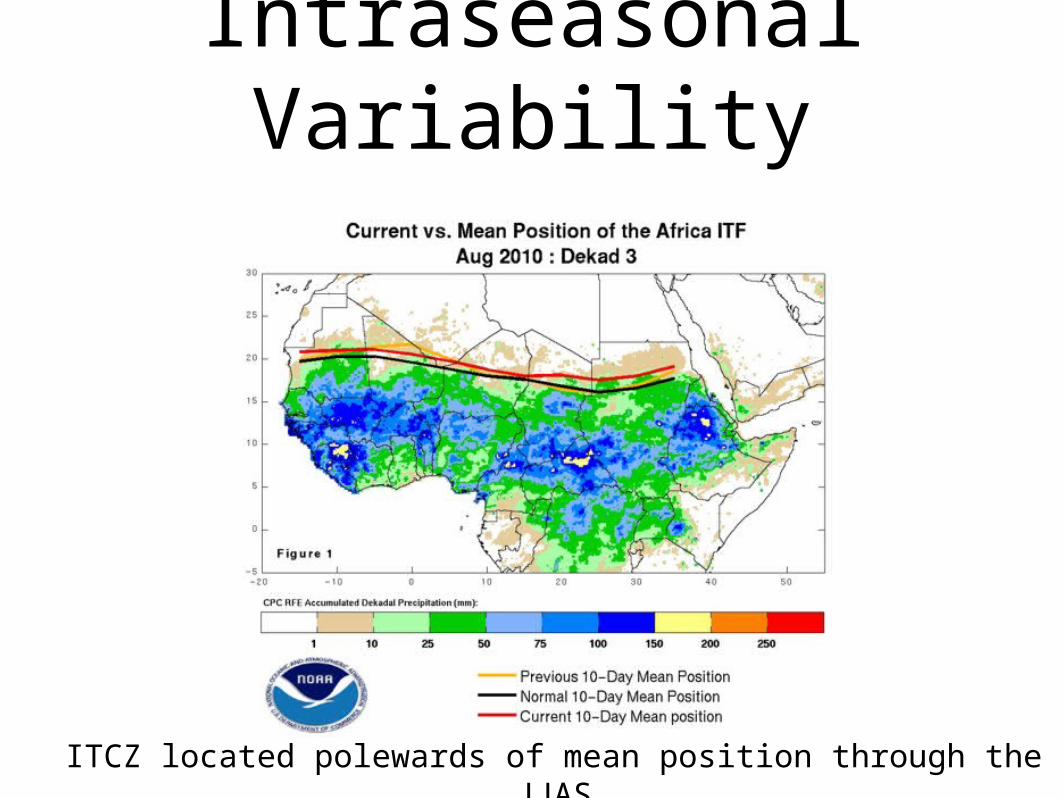
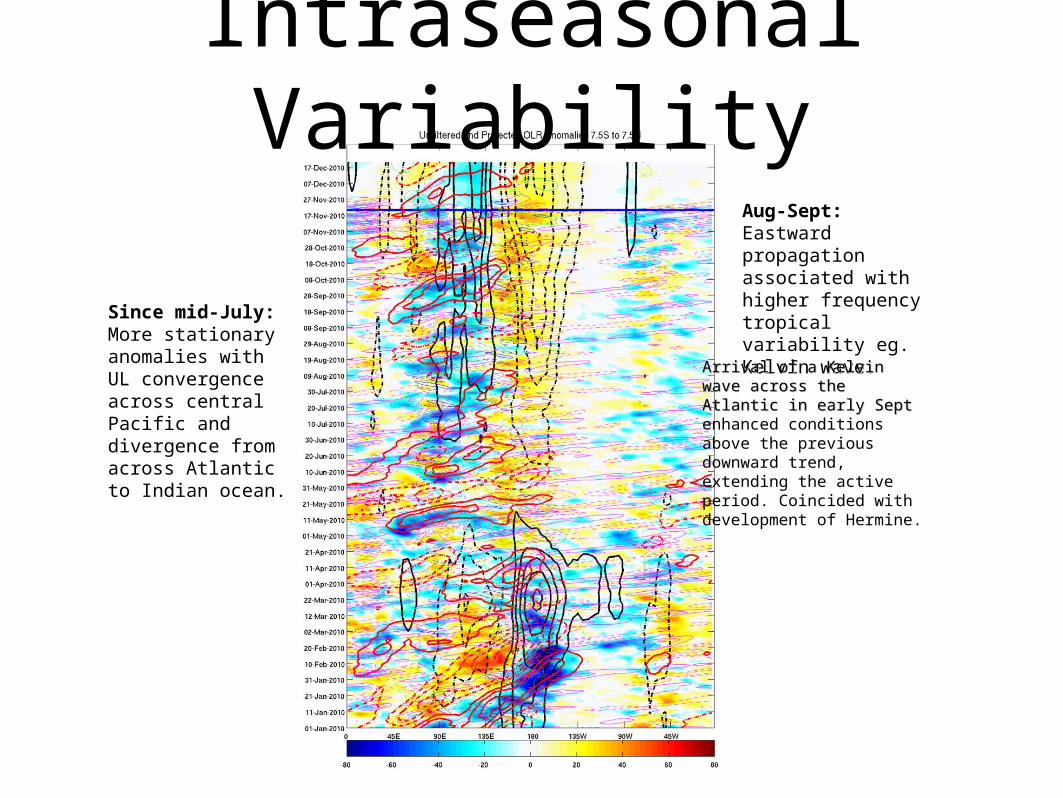
Intraseasonal Variability
ITCZ located polewards of mean position through the JJAS
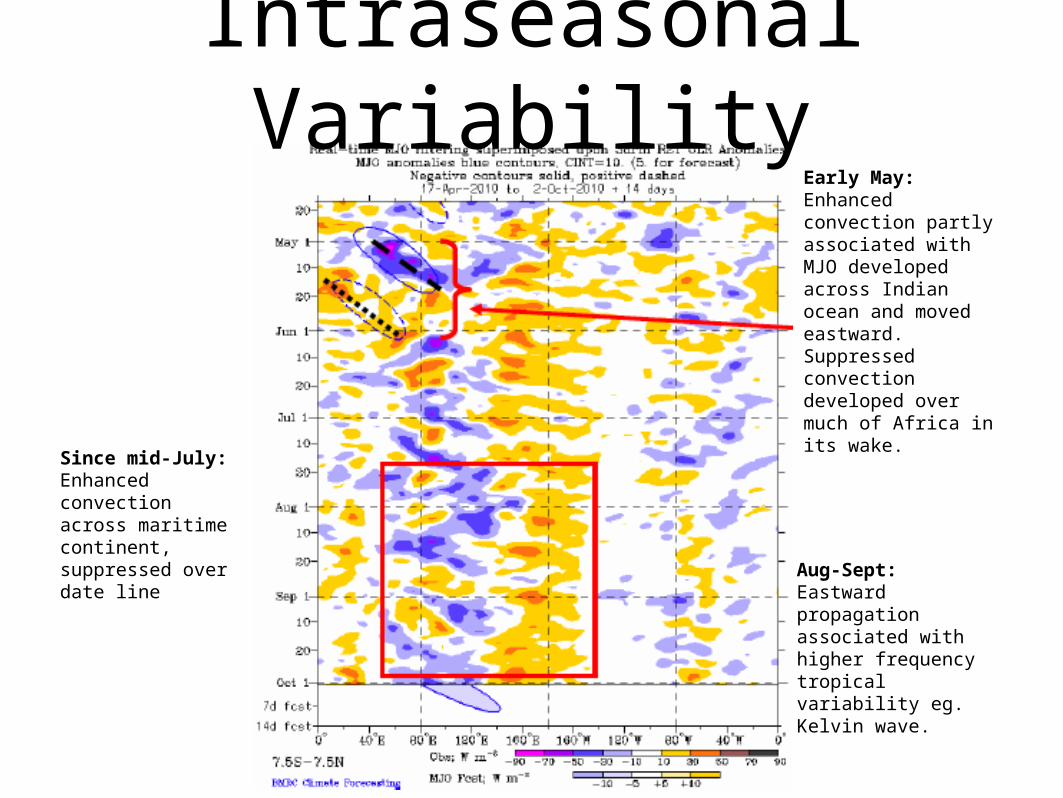
Early May: Enhanced convection partly associated with MJO developed across Indian ocean and moved eastward. Suppressed convection developed over much of Africa in its wake.
Since mid-July: Enhanced convection across maritime continent, suppressed over date line Aug-Sept:
Eastward propagation associated with higher frequency tropical variability eg. Kelvin wave.
Intraseasonal Variability
Intraseasonal Variability
Since mid-July: Enhanced
convection across maritime continent,
suppressed over date line
Aug-Sept:Eastward
propagation associated with
higher frequency tropical variability eg. Kelvin wave
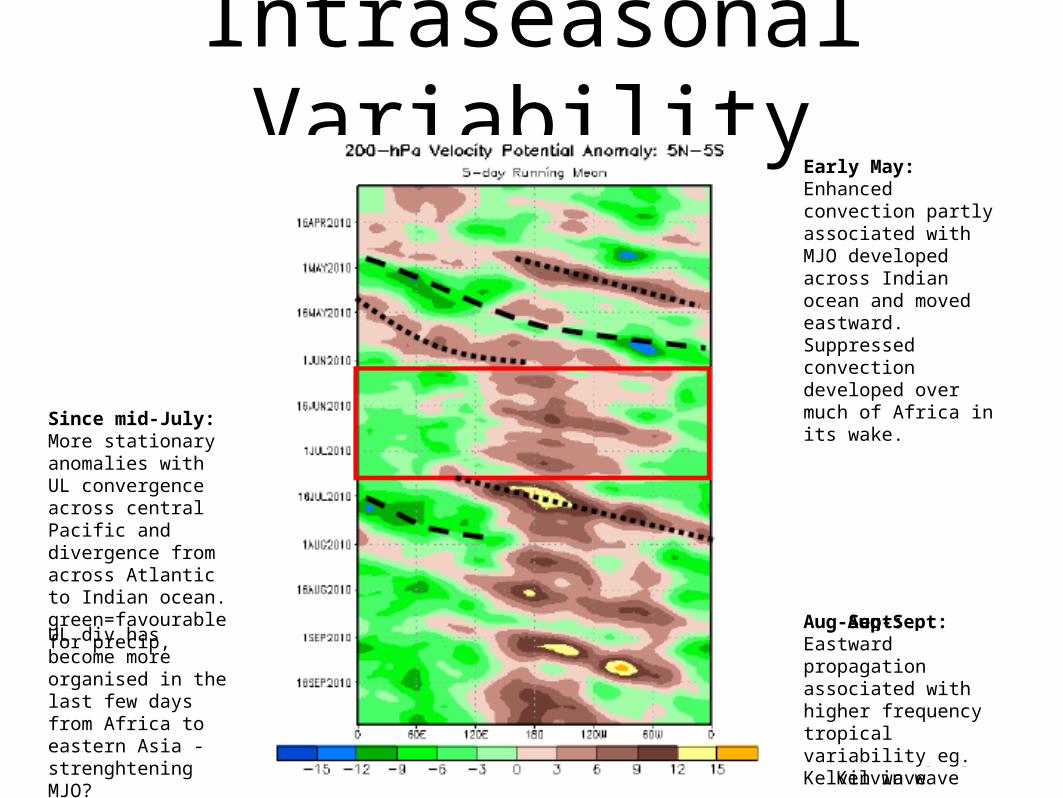
Early May: Enhanced convection partly associated with MJO developed across Indian ocean and moved eastward. Suppressed convection developed over much of Africa in its wake.
Since mid-July: More stationary anomalies with UL convergence across central Pacific and divergence from across Atlantic to Indian ocean. green=favourable for precip, Aug-Sept:
Eastward propagation associated with higher frequency tropical variability eg. Kelvin wave
UL div has become more organised in the last few days from Africa to eastern Asia - strenghtening MJO?
Aug-Sept:Eastward propagation associated with higher frequency tropical variability eg. Kelvin wave.
Since mid-July: More stationary anomalies with UL convergence across central Pacific and divergence from across Atlantic to Indian ocean.
Arrival of a Kelvin wave Arrival of a Kelvin wave across the Atlantic in early across the Atlantic in early SeptSept enhanced conditions above the previous downward trend, extending the active period. Coincided with development of Hermine.
Intraseasonal Variability
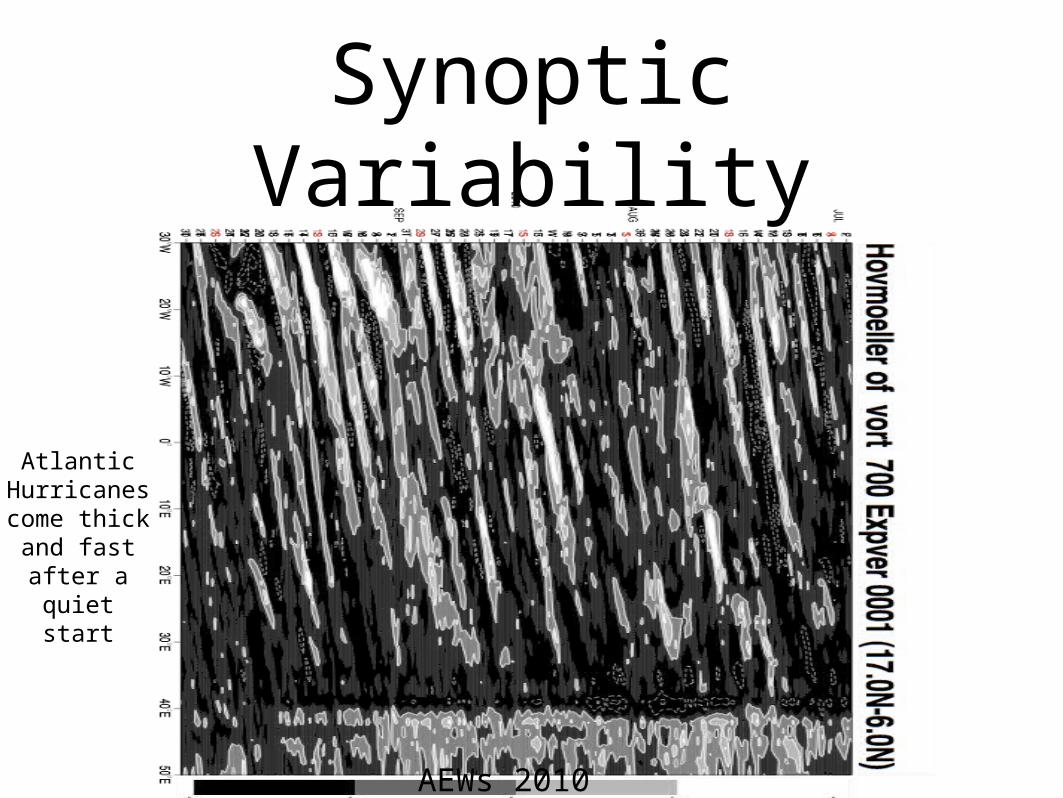
Synoptic Variability
Atlantic Hurricanes come thick
and fast after a quiet
start
AEWs 2010

Synoptic Variability
AEWs 2006
Compare 2006 AEWs with 2010
Easterly anomalies persisted over W. Pac during last 5-10 days
Westerly anomalies persisted over E. Pac but weakened in the Atlantic
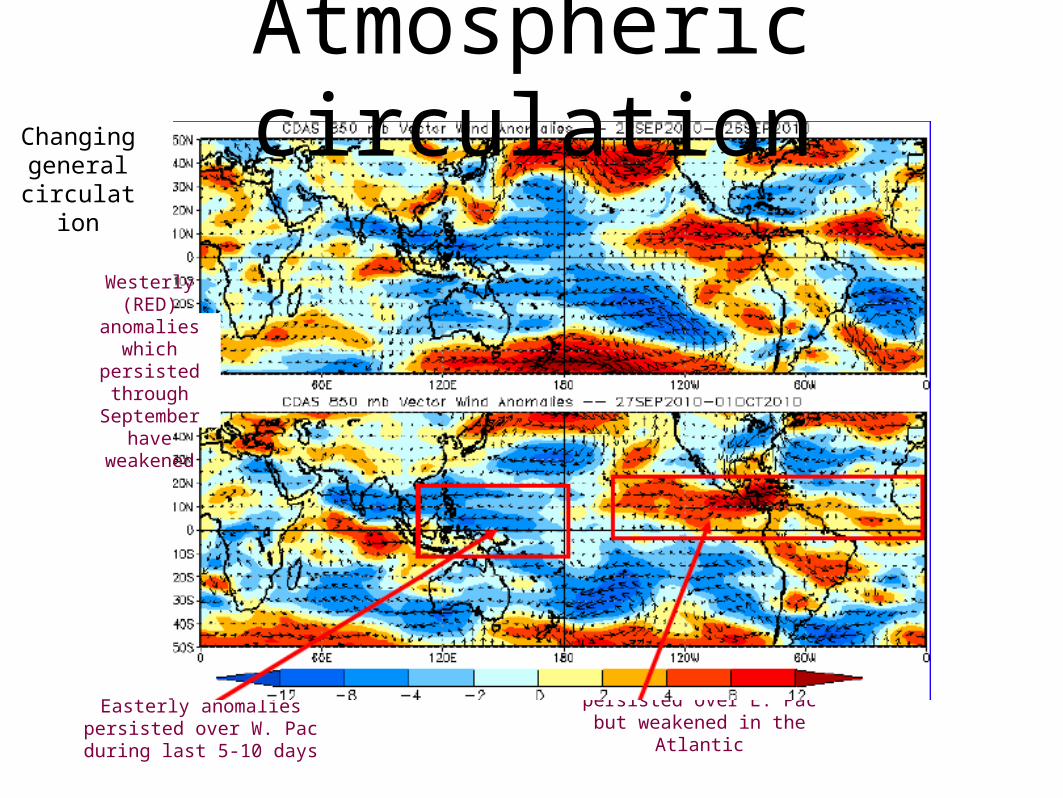
Atmospheric circulation
Westerly (RED)
anomalies which
persisted through
September have
weakened
Changing general
circulation
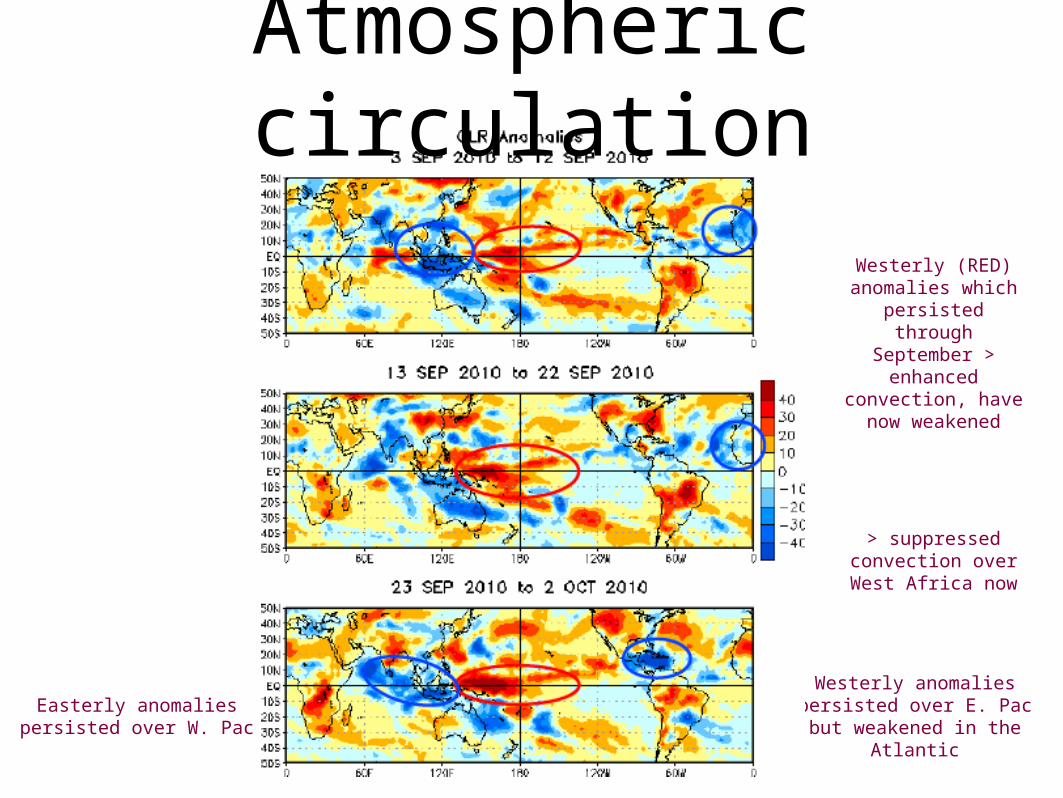
Easterly anomalies persisted over W. Pac
Westerly anomalies persisted over E. Pac but weakened in the Atlantic
Westerly (RED) anomalies which persisted through
September > enhanced
convection, have now weakened
> suppressed convection over West Africa now
Atmospheric circulation
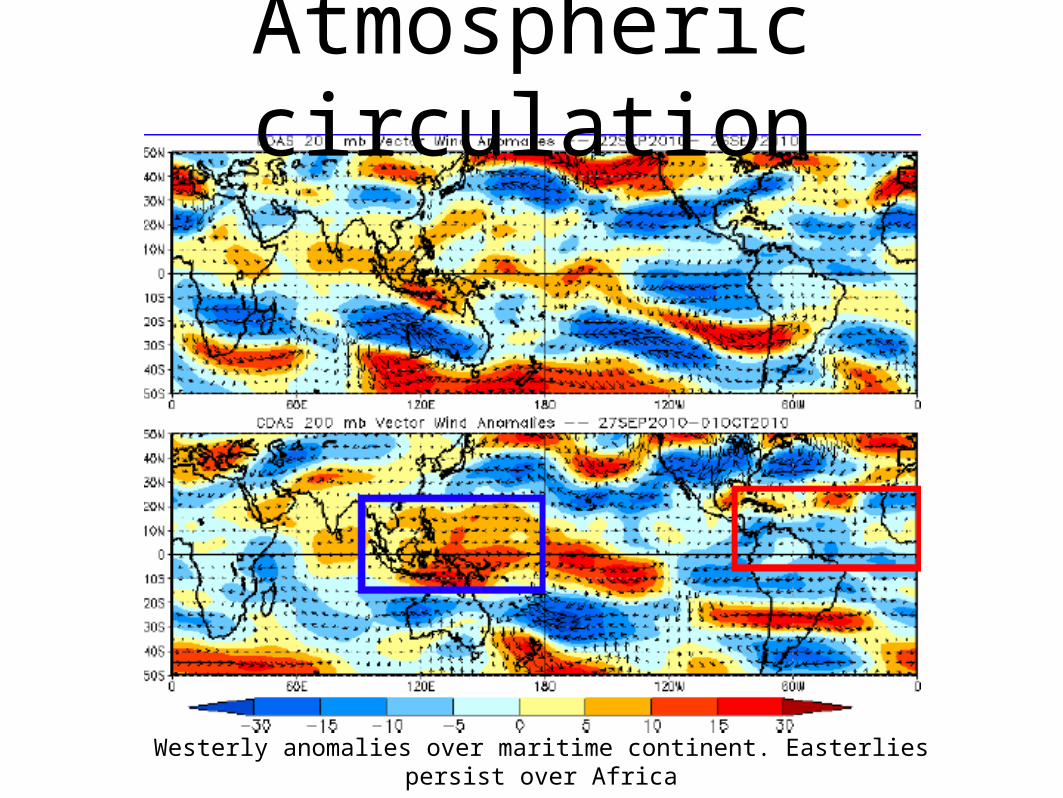
Westerly anomalies over maritime continent. Easterlies persist over Africa
Atmospheric circulation

Atlantic Activity
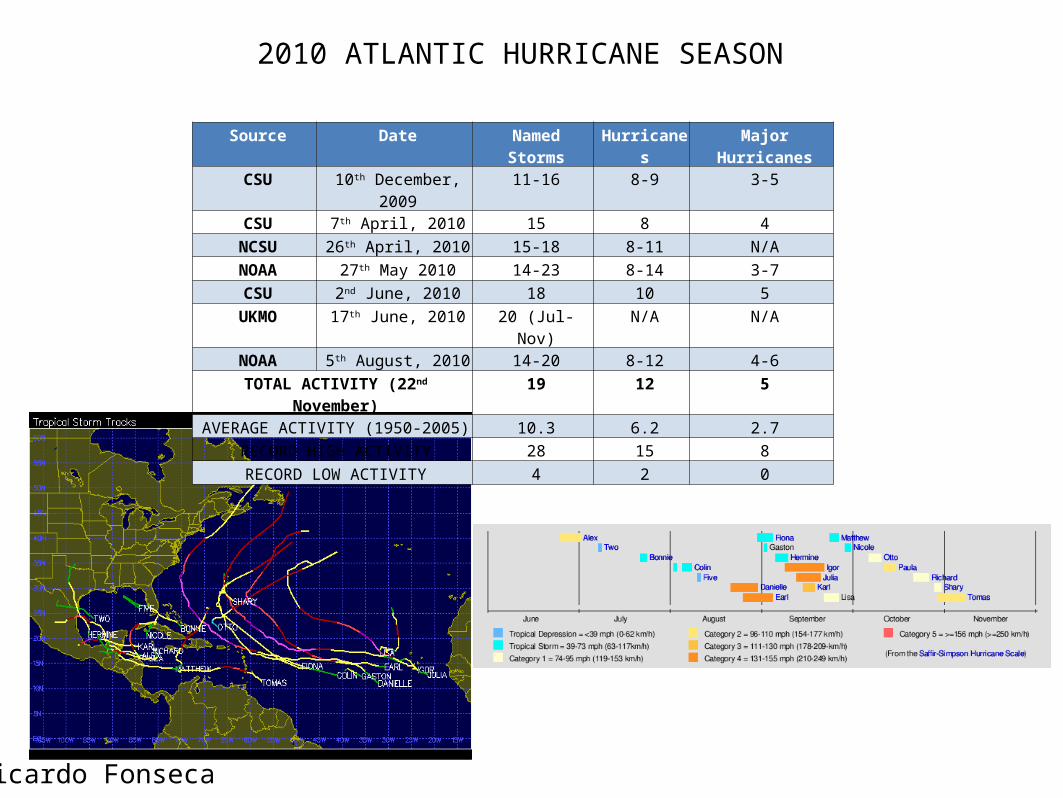
2010 ATLANTIC HURRICANE SEASON
Source Date Named Storms Hurricanes Major Hurricanes
CSU 10th December, 2009 11-16 8-9 3-5
CSU 7th April, 2010 15 8 4
NCSU 26th April, 2010 15-18 8-11 N/A
NOAA 27th May 2010 14-23 8-14 3-7
CSU 2nd June, 2010 18 10 5
UKMO 17th June, 2010 20 (Jul-Nov) N/A N/A
NOAA 5th August, 2010 14-20 8-12 4-6
TOTAL ACTIVITY (22nd November) 19 12 5
AVERAGE ACTIVITY (1950-2005) 10.3 6.2 2.7
RECORD HIGH ACTIVITY 28 15 8
RECORD LOW ACTIVITY 4 2 0
Ricardo Fonseca
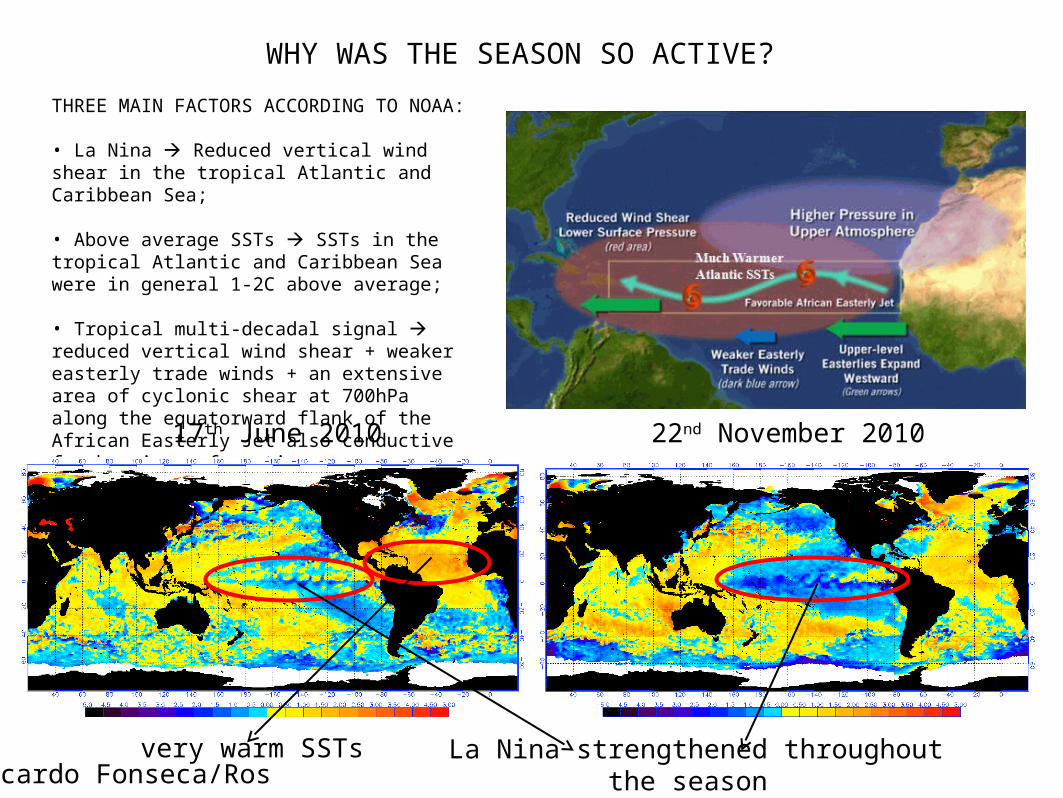
WHY WAS THE SEASON SO ACTIVE?
THREE MAIN FACTORS ACCORDING TO NOAA:
• La Nina Reduced vertical wind shear in the tropical Atlantic and Caribbean Sea;
• Above average SSTs SSTs in the tropical Atlantic and Caribbean Sea were in general 1-2C above average;
• Tropical multi-decadal signal reduced vertical wind shear + weaker easterly trade winds + an extensive area of cyclonic shear at 700hPa along the equatorward flank of the African Easterly Jet also conductive for hurricane formation.
17th June 2010 22nd November 2010
very warm SSTs La Nina strengthened throughout the season Ricardo Fonseca/Ros
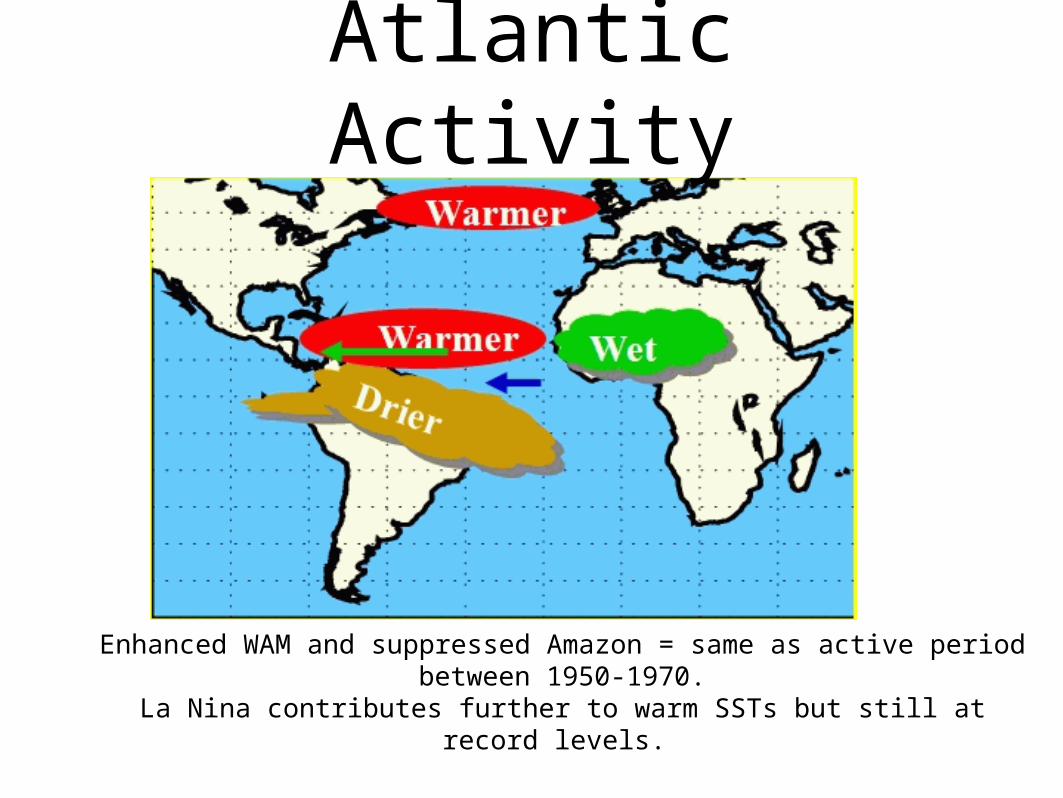
Atlantic Activity
Enhanced WAM and suppressed Amazon = same as active period between 1950-1970.
La Nina contributes further to warm SSTs but still at record levels.
From August 22 - September 29, we had 11 named storm formations (Danielle - Nicole) but no cat 3 or above landfalling hurricanes....
This is the most storms that have formed in the Atlantic during this period. In a tie for second place over the August 22 - September 29 period with 9 named storm formations are: 1933, 1949, 1984 and 2002.
Atlantic Activity
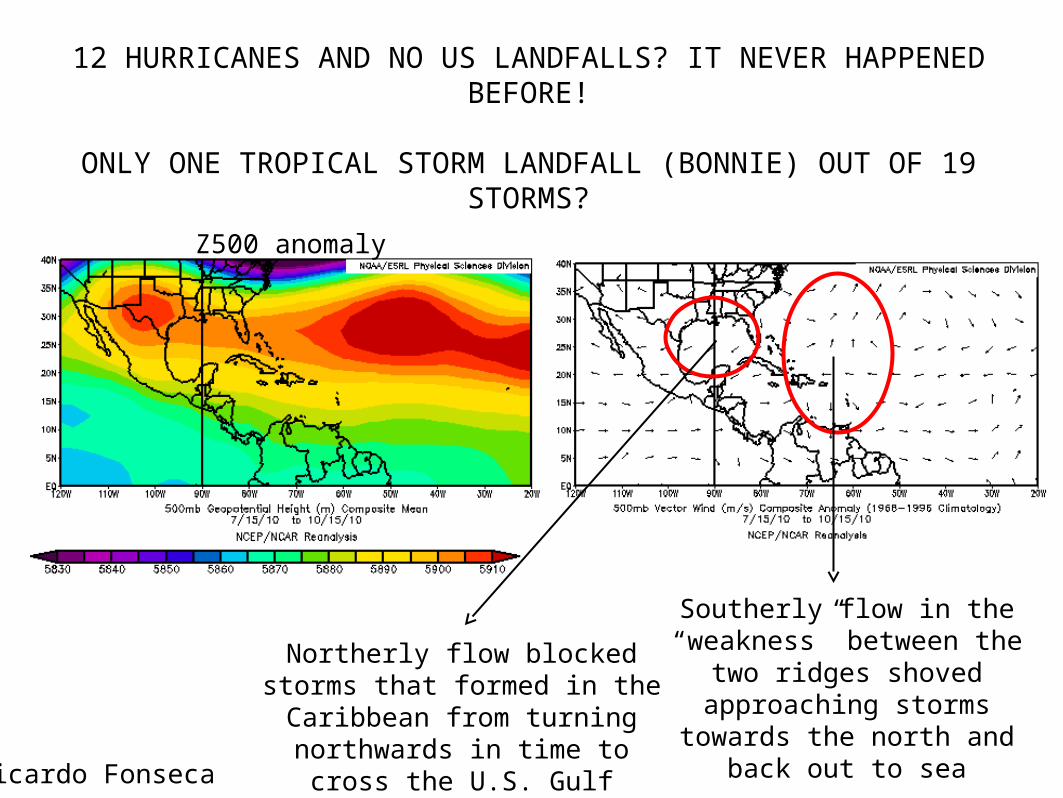
12 HURRICANES AND NO US LANDFALLS? IT NEVER HAPPENED BEFORE!
ONLY ONE TROPICAL STORM LANDFALL (BONNIE) OUT OF 19 STORMS?
Southerly flow in the “weakness” between the two ridges shoved approaching storms towards the
north and back out to sea
Northerly flow blocked storms that formed in the Caribbean from
turning northwards in time to cross the U.S. Gulf Coast.
Ricardo Fonseca
Z500 anomaly
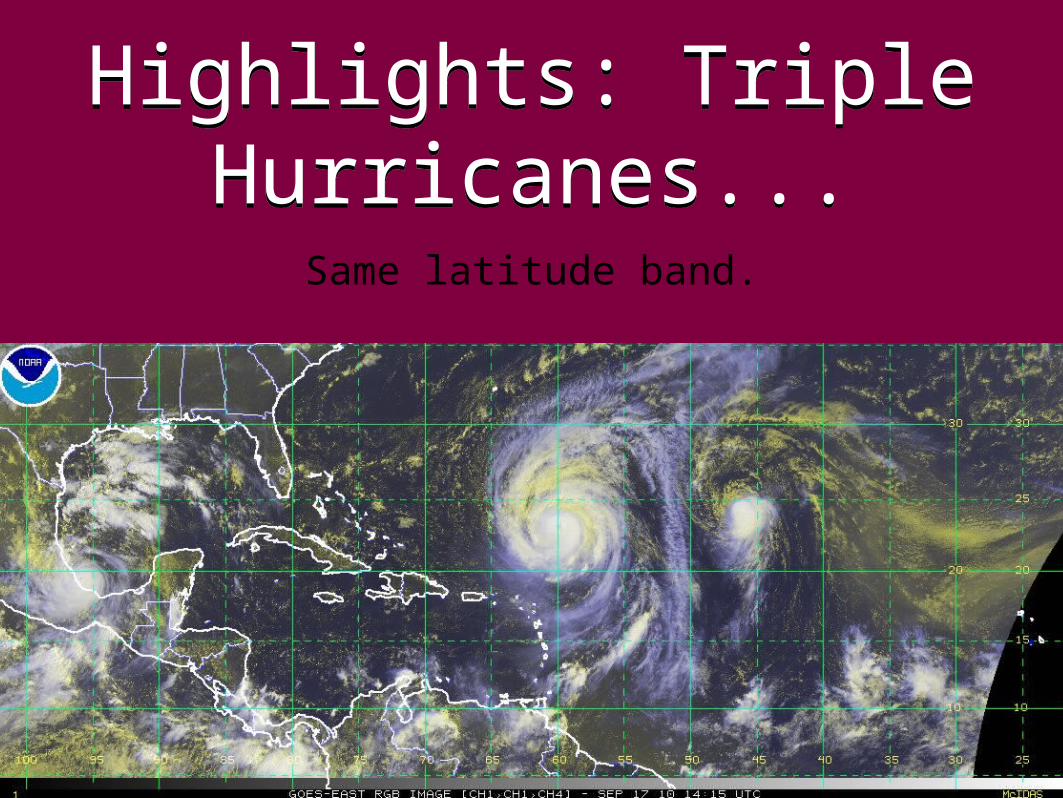
Highlights: Triple Hurricanes...
Highlights: Triple Hurricanes...
Same latitude band.
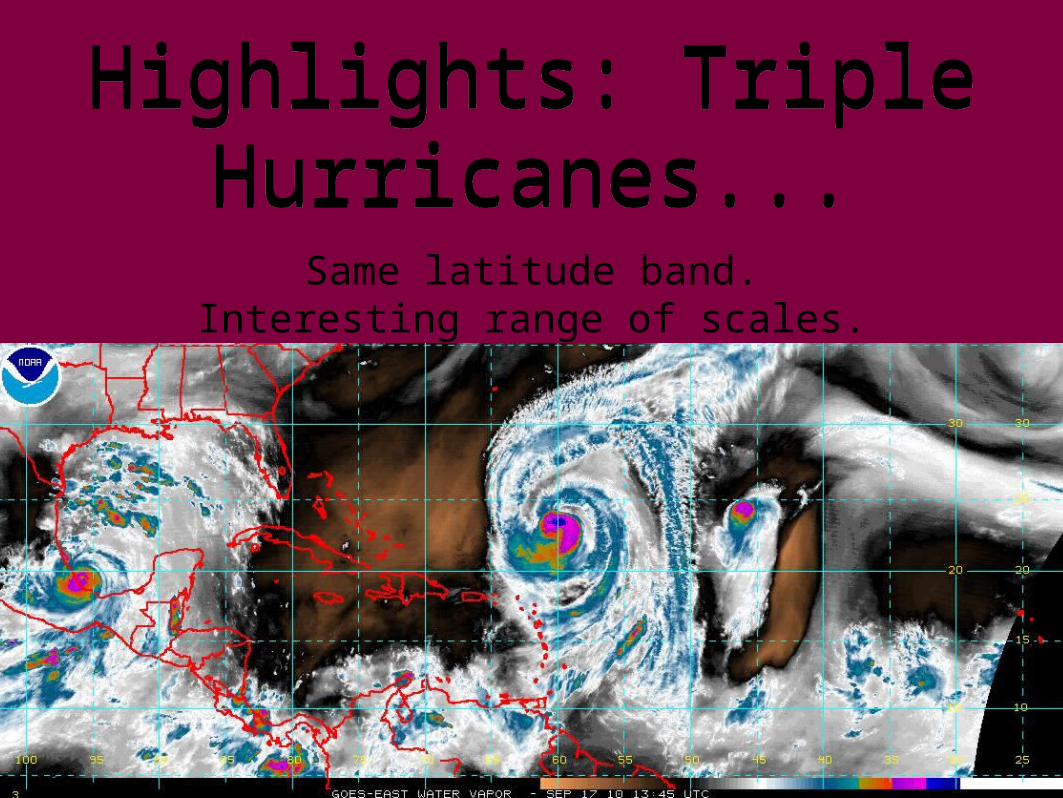
Same latitude band.Interesting range of scales.
Highlights: Triple Hurricanes...
Highlights: Triple Hurricanes...
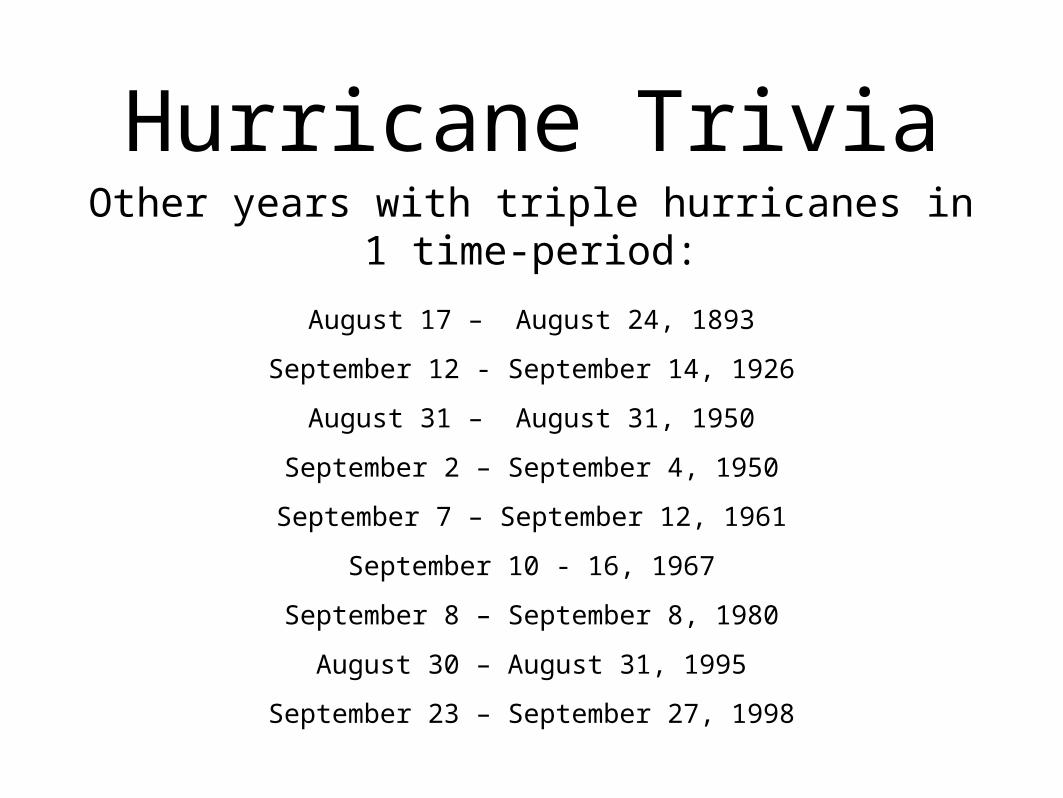
Hurricane TriviaOther years with triple hurricanes in 1 time-
period:
August 17 – August 24, 1893
September 12 - September 14, 1926
August 31 – August 31, 1950
September 2 – September 4, 1950
September 7 – September 12, 1961
September 10 - 16, 1967
September 8 – September 8, 1980
August 30 – August 31, 1995
September 23 – September 27, 1998