Embed Size (px)
Citation preview
Welsh Organic Production and Market Report 2008
Simon Moakes and Nicolas Lampkin
Institute of Biological, Environmental and Rural Sciences
January 2009
Welsh Organic Production and Market Report 2008 ii Organic Centre Wales, IBERS, Aberystwyth University
Published by Organic Centre Wales P: Institute of Biological, Environmental and Rural Sciences, Aberystwyth University, Ceredigion, SY23 3AL, UK T: +44 (0)1970 622248 E: [email protected] W: www.organic.aber.ac.uk
Whilst every effort is made to ensure the accuracy of information presented, Organic Centre Wales and its constituent partners cannot accept any responsibility for the consequences of any actions taken on the basis of its publications.

Acknowledgements
We are very grateful to the many people who have assisted us in making this report possible, in particular:
All the producers who participated in the survey – we are aware how much the organic sector is over-surveyed and therefore we hope that this report, and any actions that stem form it, will go some way to making your time input worthwhile!
The Institute of Biological, Environmental and Rural Sciences, Aberystwyth University, staff who helped with the phone interviews and collating the survey responses: Tegid Roberts, Rowland Davies, Nick Reeves, Ian Williams, Huw Williams, Dylan Jones, Eric Jones, Eileen Edwards, Wyn Morris and Brenda Jones, as well as Tony O’Regan for making their input possible.
Nigel Chapman of the Institute of Biological, Environmental and Rural Sciences for analysing the costs of production data presented in this report.
Sue Fowler, Susanne Padel and Neil Pearson for editorial input and Organic Centre Wales staff for developing and administering the survey, including planning mailing, database management and follow up tasks: Pat Elkins, Tony Little, Phil Jones, Jane Powell, Carolyn Wacher as well as OCW partners Dave Frost (ADAS), Roger Hitchings (Organic Research Centre – Elm Farm) and Heather McCalman (IBERS) for input at the design stage.
We are also very grateful to Farming Connect and Welsh Assembly Government for financial support to cover the staff time and printing costs.
While every effort has been made to ensure the accuracy of the results presented in this report, responsibility for any errors rests with the authors and feedback is always welcome! However, the quantification of the scale of the Welsh organic sector is still an imprecise art and there significant margins for error, which we will be working to improve in future publications.
Welsh Organic Production and Market Report 2008 i Organic Centre Wales, IBERS, Aberystwyth University
Crynodeb
Cynhaliwyd arolwg cynhyrchu a marchnad organig Cymru 2008 yn ystod mis Hydref a mis Tachwedd 2008. Dosbarthwyd cyfanswm o 678 o arolygon organig gyda 410 o gynhyrchwyr yn ymateb – cyfradd ddychwelyd o 60%. Anfonwyd yr arolwg o gynhyrchwyr newydd sy’n troi’n organig at 262 o gynhyrchwyr, gyda 173 yn ymateb – cyfradd ymateb o 66%.
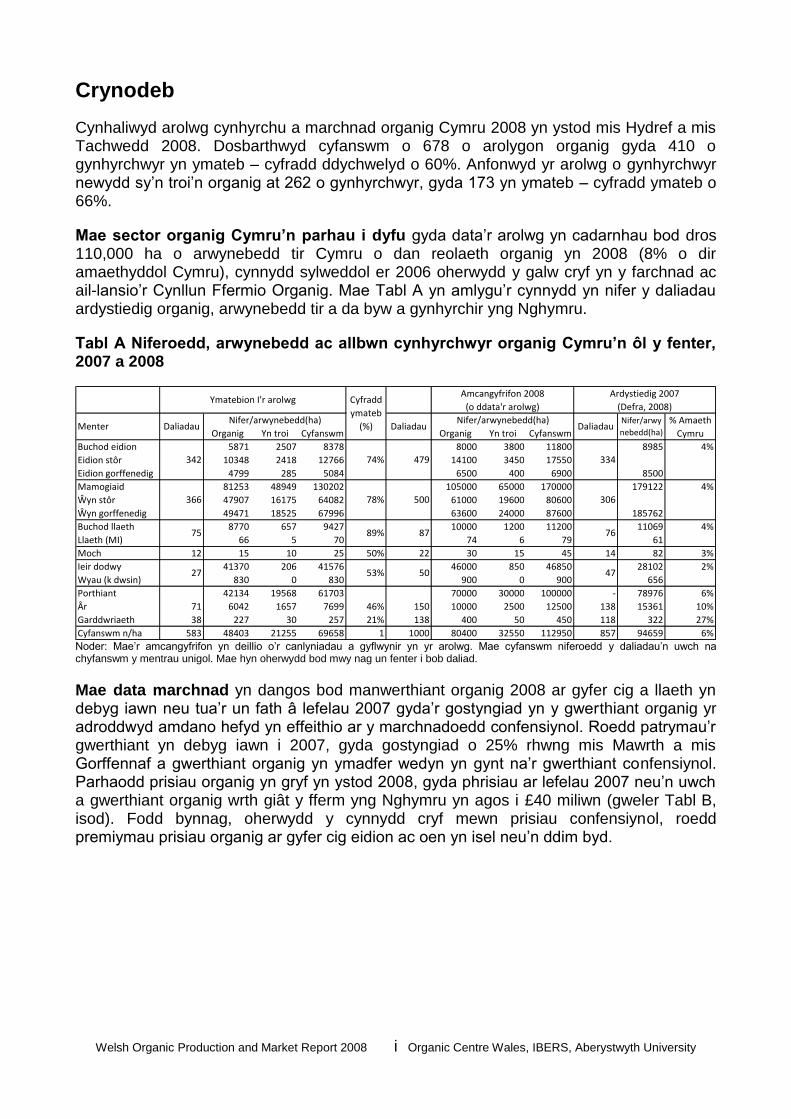
Mae sector organig Cymru’n parhau i dyfu gyda data’r arolwg yn cadarnhau bod dros 110,000 ha o arwynebedd tir Cymru o dan reolaeth organig yn 2008 (8% o dir amaethyddol Cymru), cynnydd sylweddol er 2006 oherwydd y galw cryf yn y farchnad ac ail-lansio’r Cynllun Ffermio Organig. Mae Tabl A yn amlygu’r cynnydd yn nifer y daliadau ardystiedig organig, arwynebedd tir a da byw a gynhyrchir yng Nghymru.
Tabl A Niferoedd, arwynebedd ac allbwn cynhyrchwyr organig Cymru’n ôl y fenter, 2007 a 2008
Organig Yn troi Cyfanswm Organig Yn troi Cyfanswm
Buchod eidion 5871 2507 8378 8000 3800 11800 8985 4%
Eidion stôr 10348 2418 12766 14100 3450 17550
Eidion gorffenedig 4799 285 5084 6500 400 6900 8500
Mamogiaid 81253 48949 130202 105000 65000 170000 179122 4%
Ŵyn stôr 47907 16175 64082 61000 19600 80600
Ŵyn gorffenedig 49471 18525 67996 63600 24000 87600 185762
Buchod llaeth 8770 657 9427 10000 1200 11200 11069 4%
Llaeth (MI) 66 5 70 74 6 79 61
Moch 12 15 10 25 50% 22 30 15 45 14 82 3%
Ieir dodwy 41370 206 41576 46000 850 46850 28102 2%
Wyau (k dwsin) 830 0 830 900 0 900 656
Porthiant 42134 19568 61703 70000 30000 100000 - 78976 6%
Âr 71 6042 1657 7699 46% 150 10000 2500 12500 138 15361 10%
Garddwriaeth 38 227 30 257 21% 138 400 50 450 118 322 27%
Cyfanswm n/ha 583 48403 21255 69658 1 1000 80400 32550 112950 857 94659 6%
50 47
75 89% 87 76
27 53%
342 74% 479 334
366 78% 500 306
Menter DaliadauNifer/arwynebedd(ha)
DaliadauNifer/arwynebedd(ha)
Daliadau
Ymatebion I'r arolwg Cyfradd
ymateb
(%)
Amcangyfrifon 2008 Ardystiedig 2007
(o ddata'r arolwg) (Defra, 2008)
Nifer/arwy
nebedd(ha)
% Amaeth
Cymru
Noder: Mae’r amcangyfrifon yn deillio o’r canlyniadau a gyflwynir yn yr arolwg. Mae cyfanswm niferoedd y daliadau’n uwch na chyfanswm y mentrau unigol. Mae hyn oherwydd bod mwy nag un fenter i bob daliad.
Mae data marchnad yn dangos bod manwerthiant organig 2008 ar gyfer cig a llaeth yn debyg iawn neu tua’r un fath â lefelau 2007 gyda’r gostyngiad yn y gwerthiant organig yr adroddwyd amdano hefyd yn effeithio ar y marchnadoedd confensiynol. Roedd patrymau’r gwerthiant yn debyg iawn i 2007, gyda gostyngiad o 25% rhwng mis Mawrth a mis Gorffennaf a gwerthiant organig yn ymadfer wedyn yn gynt na’r gwerthiant confensiynol. Parhaodd prisiau organig yn gryf yn ystod 2008, gyda phrisiau ar lefelau 2007 neu’n uwch a gwerthiant organig wrth giât y fferm yng Nghymru yn agos i £40 miliwn (gweler Tabl B, isod). Fodd bynnag, oherwydd y cynnydd cryf mewn prisiau confensiynol, roedd premiymau prisiau organig ar gyfer cig eidion ac oen yn isel neu’n ddim byd.
Welsh Organic Production and Market Report 2008 ii Organic Centre Wales, IBERS, Aberystwyth University
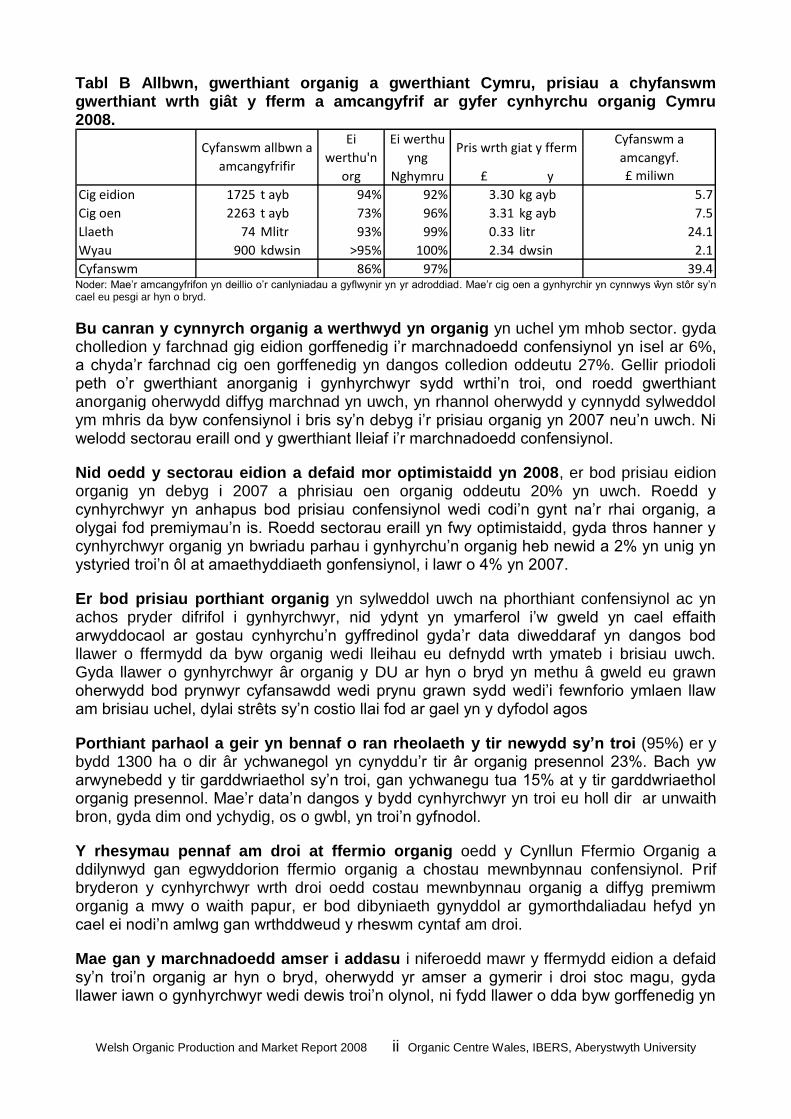
Tabl B Allbwn, gwerthiant organig a gwerthiant Cymru, prisiau a chyfanswm gwerthiant wrth giât y fferm a amcangyfrif ar gyfer cynhyrchu organig Cymru 2008.
£ y
Cig eidion 1725 t ayb 94% 92% 3.30 kg ayb
Cig oen 2263 t ayb 73% 96% 3.31 kg ayb
Llaeth 74 Mlitr 93% 99% 0.33 litr
Wyau 900 kdwsin >95% 100% 2.34 dwsin
Cyfanswm 86% 97% 39.4
2.1
5.7
7.5
24.1
Ei
werthu'n
org
Ei werthu
yng
Nghymru
Cyfanswm allbwn a
amcangyfrifir
Pris wrth giat y ffermCyfanswm a
amcangyf.
£ miliwn
Noder: Mae’r amcangyfrifon yn deillio o’r canlyniadau a gyflwynir yn yr adroddiad. Mae’r cig oen a gynhyrchir yn cynnwys ŵyn stôr sy’n cael eu pesgi ar hyn o bryd.
Bu canran y cynnyrch organig a werthwyd yn organig yn uchel ym mhob sector. gyda cholledion y farchnad gig eidion gorffenedig i’r marchnadoedd confensiynol yn isel ar 6%, a chyda’r farchnad cig oen gorffenedig yn dangos colledion oddeutu 27%. Gellir priodoli peth o’r gwerthiant anorganig i gynhyrchwyr sydd wrthi’n troi, ond roedd gwerthiant anorganig oherwydd diffyg marchnad yn uwch, yn rhannol oherwydd y cynnydd sylweddol ym mhris da byw confensiynol i bris sy’n debyg i’r prisiau organig yn 2007 neu’n uwch. Ni welodd sectorau eraill ond y gwerthiant lleiaf i’r marchnadoedd confensiynol.
Nid oedd y sectorau eidion a defaid mor optimistaidd yn 2008, er bod prisiau eidion organig yn debyg i 2007 a phrisiau oen organig oddeutu 20% yn uwch. Roedd y cynhyrchwyr yn anhapus bod prisiau confensiynol wedi codi’n gynt na’r rhai organig, a olygai fod premiymau’n is. Roedd sectorau eraill yn fwy optimistaidd, gyda thros hanner y cynhyrchwyr organig yn bwriadu parhau i gynhyrchu’n organig heb newid a 2% yn unig yn ystyried troi’n ôl at amaethyddiaeth gonfensiynol, i lawr o 4% yn 2007.
Er bod prisiau porthiant organig yn sylweddol uwch na phorthiant confensiynol ac yn achos pryder difrifol i gynhyrchwyr, nid ydynt yn ymarferol i’w gweld yn cael effaith arwyddocaol ar gostau cynhyrchu’n gyffredinol gyda’r data diweddaraf yn dangos bod llawer o ffermydd da byw organig wedi lleihau eu defnydd wrth ymateb i brisiau uwch. Gyda llawer o gynhyrchwyr âr organig y DU ar hyn o bryd yn methu â gweld eu grawn oherwydd bod prynwyr cyfansawdd wedi prynu grawn sydd wedi’i fewnforio ymlaen llaw am brisiau uchel, dylai strêts sy’n costio llai fod ar gael yn y dyfodol agos
Porthiant parhaol a geir yn bennaf o ran rheolaeth y tir newydd sy’n troi (95%) er y bydd 1300 ha o dir âr ychwanegol yn cynyddu’r tir âr organig presennol 23%. Bach yw arwynebedd y tir garddwriaethol sy’n troi, gan ychwanegu tua 15% at y tir garddwriaethol organig presennol. Mae’r data’n dangos y bydd cynhyrchwyr yn troi eu holl dir ar unwaith bron, gyda dim ond ychydig, os o gwbl, yn troi’n gyfnodol.
Y rhesymau pennaf am droi at ffermio organig oedd y Cynllun Ffermio Organig a ddilynwyd gan egwyddorion ffermio organig a chostau mewnbynnau confensiynol. Prif bryderon y cynhyrchwyr wrth droi oedd costau mewnbynnau organig a diffyg premiwm organig a mwy o waith papur, er bod dibyniaeth gynyddol ar gymorthdaliadau hefyd yn cael ei nodi’n amlwg gan wrthddweud y rheswm cyntaf am droi.
Mae gan y marchnadoedd amser i addasu i niferoedd mawr y ffermydd eidion a defaid sy’n troi’n organig ar hyn o bryd, oherwydd yr amser a gymerir i droi stoc magu, gyda llawer iawn o gynhyrchwyr wedi dewis troi’n olynol, ni fydd llawer o dda byw gorffenedig yn
Welsh Organic Production and Market Report 2008 iii Organic Centre Wales, IBERS, Aberystwyth University
dod i’r farchnad tan 2010 neu 2011. Fodd bynnag, rhaid i gyrff y diwydiant fod yn rhagweithiol wrth feithrin marchnadoedd i gynnal y niferoedd ychwanegol.
I gloi, mae sector organig Cymru’n parhau i dyfu ac, er gwaethaf dyfalu’r Cyfryngau, mae’r rhan fwyaf o’r cynnyrch yn dal i gael ei werthu i farchnadoedd organig, gyda phrisiau da byw confensiynol yn gweithredu fel clustog i’r marchnadoedd eidion a defaid organig. Bydd niferoedd mawr o gynhyrchwyr sy’n troi’n ymestyn y sector organig yn Nghymru, a dylid defnyddio’r amser a gymerir i droi gan randdeiliaid y diwydiant a’r cynhyrchwyr eu hunain i ddatblygu marchnadoedd newydd yn ogystal â’r rhai sy’n bodoli eisoes. Er gwaetha’r ansicrwydd oherwydd yr argyfwng credyd, gall cynhyrchwyr organig Cymru fod yn optimistaidd. Mae potensial i farchnadoedd gael eu datblygu ar gyfer y cynnyrch presennol ac er mwyn amsugno gwerthiant gan ddaliadau sydd newydd droi wrth i’w cynnyrch gyrraedd y farchnad.
Welsh Organic Production and Market Report 2008 iv Organic Centre Wales, IBERS, Aberystwyth University
Summary
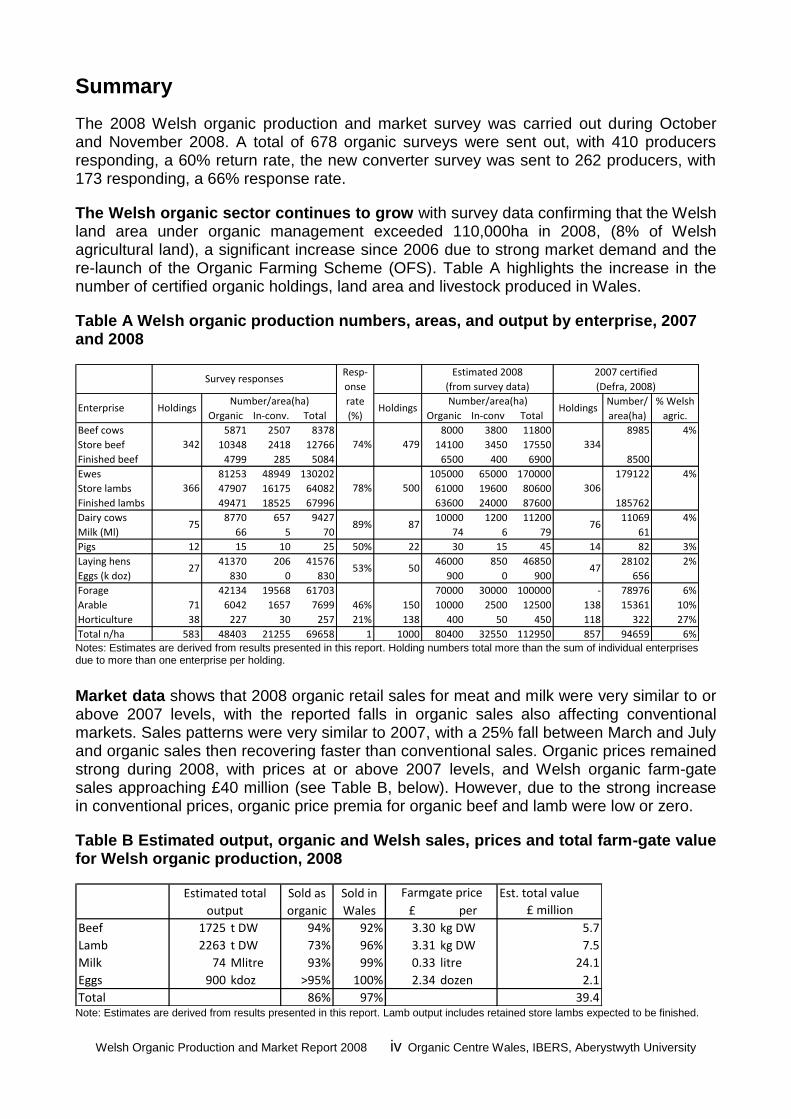
The 2008 Welsh organic production and market survey was carried out during October and November 2008. A total of 678 organic surveys were sent out, with 410 producers responding, a 60% return rate, the new converter survey was sent to 262 producers, with 173 responding, a 66% response rate.
The Welsh organic sector continues to grow with survey data confirming that the Welsh land area under organic management exceeded 110,000ha in 2008, (8% of Welsh agricultural land), a significant increase since 2006 due to strong market demand and the re-launch of the Organic Farming Scheme (OFS). Table A highlights the increase in the number of certified organic holdings, land area and livestock produced in Wales.
Table A Welsh organic production numbers, areas, and output by enterprise, 2007 and 2008
Organic In-conv. Total Organic In-conv Total
Beef cows 5871 2507 8378 8000 3800 11800 8985 4%
Store beef 10348 2418 12766 14100 3450 17550
Finished beef 4799 285 5084 6500 400 6900 8500
Ewes 81253 48949 130202 105000 65000 170000 179122 4%
Store lambs 47907 16175 64082 61000 19600 80600
Finished lambs 49471 18525 67996 63600 24000 87600 185762
Dairy cows 8770 657 9427 10000 1200 11200 11069 4%
Milk (Ml) 66 5 70 74 6 79 61
Pigs 12 15 10 25 50% 22 30 15 45 14 82 3%
Laying hens 41370 206 41576 46000 850 46850 28102 2%
Eggs (k doz) 830 0 830 900 0 900 656
Forage 42134 19568 61703 70000 30000 100000 - 78976 6%
Arable 71 6042 1657 7699 46% 150 10000 2500 12500 138 15361 10%
Horticulture 38 227 30 257 21% 138 400 50 450 118 322 27%
Total n/ha 583 48403 21255 69658 1 1000 80400 32550 112950 857 94659 6%
78%
89%
53% 50
500
87
74%
47
Number/
area(ha)HoldingsHoldings
479
27
Holdings% Welsh
agric.
(Defra, 2008)
Estimated 2008Resp-
onse
rate
(%)
(from survey data)
334
306
2007 certified
76
Number/area(ha)
Survey responses
Enterprise
342
366
75
Number/area(ha)
Notes: Estimates are derived from results presented in this report. Holding numbers total more than the sum of individual enterprises due to more than one enterprise per holding.
Market data shows that 2008 organic retail sales for meat and milk were very similar to or above 2007 levels, with the reported falls in organic sales also affecting conventional markets. Sales patterns were very similar to 2007, with a 25% fall between March and July and organic sales then recovering faster than conventional sales. Organic prices remained strong during 2008, with prices at or above 2007 levels, and Welsh organic farm-gate sales approaching £40 million (see Table B, below). However, due to the strong increase in conventional prices, organic price premia for organic beef and lamb were low or zero.
Table B Estimated output, organic and Welsh sales, prices and total farm-gate value for Welsh organic production, 2008
Est. total value
£ per
Beef 1725 t DW 94% 92% 3.30 kg DW
Lamb 2263 t DW 73% 96% 3.31 kg DW
Milk 74 Mlitre 93% 99% 0.33 litre
Eggs 900 kdoz >95% 100% 2.34 dozen
Total 86% 97% 39.4
5.7
7.5
24.1
2.1
Estimated total
output
Sold as
organic
Sold in
Wales
Farmgate price
£ million
Note: Estimates are derived from results presented in this report. Lamb output includes retained store lambs expected to be finished.
Welsh Organic Production and Market Report 2008 v Organic Centre Wales, IBERS, Aberystwyth University
The share of organic produce sold as organic was high for all sectors, with the finished beef market having low losses to conventional markets of 6%, and the finished lamb market showing losses of around 27%. Some of the non-organic sales were due to in-conversion producers, but non-organic sales due to a lack of market were higher, partly due to the significant increase in the price of conventional livestock to price similar to or above organic prices in 2007. Other sectors saw minimal sales into conventional markets.
The beef and sheep sectors were less optimistic in 2008, despite organic beef prices similar to 2007 and organic lamb prices around 20% higher. Producers’ were unhappy that conventional prices had risen faster than organic, meaning premiums were lower. Other sectors were more optimistic, with over half of organic producers intending to continue organic production without change, and only 2% considering reverting to conventional agriculture, down from 4% in 2007.
Organic feed prices, although significantly higher than conventional feeds and a cause of serious concern to producers, do not in practice appear to be having significant impact on overall costs of production, with the latest data showing many organic livestock farms have reduced usage in response to high prices. With many UK organic arable producers currently unable to sell their grain because compounders purchased imported grain in advance at high prices, lower cost straights should become available in the near future.
New converter land management is dominated by permanent forage (95%), though an additional 1300 ha of arable land will increase existing organic arable land by 23%. The area of horticultural land in conversion is small, adding around 15% to current organic horticultural land. The data indicates that producers are converting virtually all their land at once, with few, if any pursuing staged conversion.
Primary reasons for converting to organic farming were the Organic Farming Scheme (OFS) followed by organic farming principles and costs of conventional inputs. Producers main concerns whilst converting were costs of organic inputs, a lack of organic premium and increased paperwork, though increased reliance on support payments also featured highly and contradicts the primary reason for converting.
Markets have time to adjust to the large numbers of beef and sheep farms currently in-conversion, as due to the time taken to convert breeding stock, with many producers having opted for consecutive conversion, finished organic livestock will not be entering the marketplace until 2010 or 2011. However, industry bodies need to be proactively building markets to accommodate the extra volume.
In conclusion, the Welsh organic sector continues to grow and, despite media speculation, the majority of produce is still being sold into organic markets, with high conventional livestock prices acting as a buffer to organic beef and sheep markets. Large numbers of producers converting will extend the Welsh organic sector, and the time taken for their conversion should be used by industry stakeholders and producers themselves to develop existing and new markets. Despite the uncertainty due to the credit crunch, Welsh organic producers can be optimistic. There is potential for markets to be developed both for existing producers and to absorb sales from newly converted holdings as their produce comes to the marketplace.
Welsh Organic Production and Market Report 2008 vi Organic Centre Wales, IBERS, Aberystwyth University
Contents
Crynodeb ............................................................................................................................................................ i
Summary .......................................................................................................................................................... iv
Contents ........................................................................................................................................................... vi
List of tables ................................................................................................................................................... viii
List of figures ..................................................................................................................................................... x
1. Introduction ................................................................................................................................................ 1
1.1. Approach .......................................................................................................................................... 1
1.2. Response rates ................................................................................................................................ 2
1.3. Structure of organic and converting farms ....................................................................................... 3
2. Economic environment .............................................................................................................................. 7
2.1. Meat sector ....................................................................................................................................... 7
2.2. Dairy sector .................................................................................................................................... 10
2.3. Pig and poultry sectors ................................................................................................................... 12
2.4. Fruit and vegetables ....................................................................................................................... 12
2.5. Cereals and other grains ................................................................................................................ 12
3. Future intentions of producers ................................................................................................................. 13
3.1. Future intentions of organic producers ........................................................................................... 13
4. Livestock .................................................................................................................................................. 18
4.1. Breeding livestock numbers ........................................................................................................... 18
4.2. Livestock sales ............................................................................................................................... 20
4.2.1. Cattle sales .............................................................................................................................. 20
4.2.2. Sheep sales ............................................................................................................................. 21
4.2.3. Milk sales ................................................................................................................................. 22
4.2.4. Egg sales ................................................................................................................................. 23
4.2.5. Pig sales .................................................................................................................................. 23
4.3. Marketing routes ............................................................................................................................. 23
4.3.1. Finished meat, milk and egg marketing routes ........................................................................ 23
4.3.2. Store livestock marketing routes.............................................................................................. 24
4.4. Perceptions of cost, price and production trends ........................................................................... 25
Welsh Organic Production and Market Report 2008 vii Organic Centre Wales, IBERS, Aberystwyth University
4.4.1. Cattle trends ............................................................................................................................. 25
4.4.2. Sheep and lamb trends ............................................................................................................ 26
4.4.3. Milk trends ................................................................................................................................ 28
4.4.4. Pig and table poultry trends ..................................................................................................... 28
4.4.5. Egg producer trends ................................................................................................................ 28
4.5. Livestock feed & fodder .................................................................................................................. 29
4.6. Costs of production for milk, beef and lamb ................................................................................... 31
5. Horticulture and arable cropping ............................................................................................................. 34
5.1. Horticulture ..................................................................................................................................... 34
5.2. Arable cropping .............................................................................................................................. 35
6. Fodder...................................................................................................................................................... 36
7. Direct sales .............................................................................................................................................. 37
8. Conclusions and recommendations ........................................................................................................ 38
Welsh Organic Production and Market Report 2008 viii Organic Centre Wales, IBERS, Aberystwyth University
List of tables
Table A Welsh organic production numbers, areas, and output by enterprise, 2007 and 2008 ....................... iv
Table B Estimated output, organic and Welsh sales, prices and total farm-gate value for Welsh organic production, 2008 ................................................................................................................................................ iv
Table 1 Methods of survey completion for both organic, new converter and combined results ....................... 2
Table 2 Completed survey sections compared to enterprises identified from certification data ....................... 3
Table 3 Welsh certified organic and in-conversion holdings and land use, 2006 and 2007 ............................. 3
Table 4 Organic and in-conversion land area (ha) in Wales (survey results and raised estimates), 2008 ....... 4
Table 5 Organic and in-conversion area estimates, with comparison data from Defra 2006 and 2007 data, WAG Organic Farming Scheme data (OFS, 2008) and Welsh total agricultural areas .................................... 5
Table 6 Number of survey sections completed, the percentage of sample returns completed for each enterprise and calculated enterprise types present on Welsh organic and in-conversion farms, 2008 ............ 6
Table 7 Level of diversification within Welsh organic and converting farm businesses (% of producers diversified within survey sample), 2008 ............................................................................................................. 6
Table 8 Welsh organic producers’ future organic farming intentions, 2008 (Fully organic producers only) ... 13
Table 9 Are current (2008) prices for products sufficiently high to continue producing them organically? (Fully organic producers only) ................................................................................................................................... 13
Table 10 Expected change in Welsh organic production levels by enterprise over the next 12 months (to October 2009) (Fully organic producers only) ................................................................................................. 14
Table 11 New converter land areas by use before, during and post conversion (ha. actual survey data) ..... 15
Table 12 Calculated total Welsh new converter land areas and use before, during and post conversion (2008) ......................................................................................................................................................................... 15
Table 13 New converters’ current enterprises (2008) and planned changes during conversion .................... 16
Table 14 New converters’ reasons for converting to organic farming ............................................................. 16
Table 15 New converters’ main concerns about converting to organic farming .............................................. 17
Table 16 Organic breeding stock retained in 2008 and 2007, and calculated totals ...................................... 18
Table 17 New converters’ livestock numbers pre, during and post conversion .............................................. 19
Table 18 Date of reaching full organic status for in-conversion livestock, including Welsh total estimate ..... 19
Table 19 Combined totals for organic and new converter livestock data, including Welsh total estimate ...... 20
Table 20 Livestock farming produce (actual sales with 2007 data for comparison) ....................................... 20
Table 21 Estimated total Welsh organic livestock sales by organic status (with 2007 data for comparison) . 21
Table 22 Non-organic livestock produce sales split by reason for lack of organic market .............................. 22
Table 23 Organic finished meat, milk and egg sales by market route ............................................................ 24
Table 24 Organic store livestock sales by market route .................................................................................. 25
Welsh Organic Production and Market Report 2008 ix Organic Centre Wales, IBERS, Aberystwyth University
Table 25 Organic finished cattle producer perceptions of price, cost and production trends ......................... 25
Table 26 Organic store cattle producer perceptions of price, cost and production trends .............................. 26
Table 27 Organic finished lamb producer perceptions of price, cost and production trends .......................... 26
Table 28 Organic store lamb producer perceptions of price, cost and production trends ............................... 27
Table 29 Organic producers experiencing light lamb marketing difficulties .................................................... 27
Table 30 Organic lamb producers’ awareness and willingness to participate in light lamb initiatives ............ 27
Table 31 Organic milk producer perceptions of price, cost and production trends ......................................... 28
Table 32 Organic pig and table poultry producer perceptions of price, cost and production trends ............... 28
Table 33 Organic egg producer perceptions of price, cost and production trends ......................................... 29
Table 34 Chicks purchased, price and availability .......................................................................................... 29
Table 35 Organic livestock feed use, proportion bought-in, prices and availability (fully organic holdings only) ......................................................................................................................................................................... 30
Table 36 Difficulties in obtaining organic feed, and changes in price ............................................................. 30
Table 37 Welsh organic and conventional milk production costs and margins (pence per litre), 2006/7 and 2007/8, with additional margins shown assuming same price for organic and conventional sectors ............. 32
Table 38 Welsh organic and conventional beef and lamb production costs and margins (pence per kg), 2006/7 and 2007/8, with additional margins shown assuming same price for organic and conventional sectors ............................................................................................................................................................. 33
Table 39 Horticulture production, prices and market split ............................................................................... 34
Table 40 Fruit and vegetable producer perceptions of price, cost and production trends .............................. 34
Table 41 Arable production, prices and market split ....................................................................................... 35
Table 42 Grain & pulse producer perceptions of price, cost and production trends ....................................... 35
Table 43 Forage sales quantity and price ....................................................................................................... 36
Table 44 Fodder producer perceptions of price, cost and production trends .................................................. 36
Table 45 Main type of produce sold ................................................................................................................ 37
Table 46 Direct sales changes during previous and next year........................................................................ 37
Table 47 Box scheme data for previous and next year ................................................................................... 37
Welsh Organic Production and Market Report 2008 x Organic Centre Wales, IBERS, Aberystwyth University
List of figures
Figure 1 Organic and conventional retail meat sales volume, 2006, 2007, and 2008 ...................................... 7
Figure 2 Organic and conventional retail meat sales volume contrasted, 2007 and 2008 ............................... 8
Figure 3 Organic and conventional retail meat price, 2006, 2007, 2008 ........................................................... 8
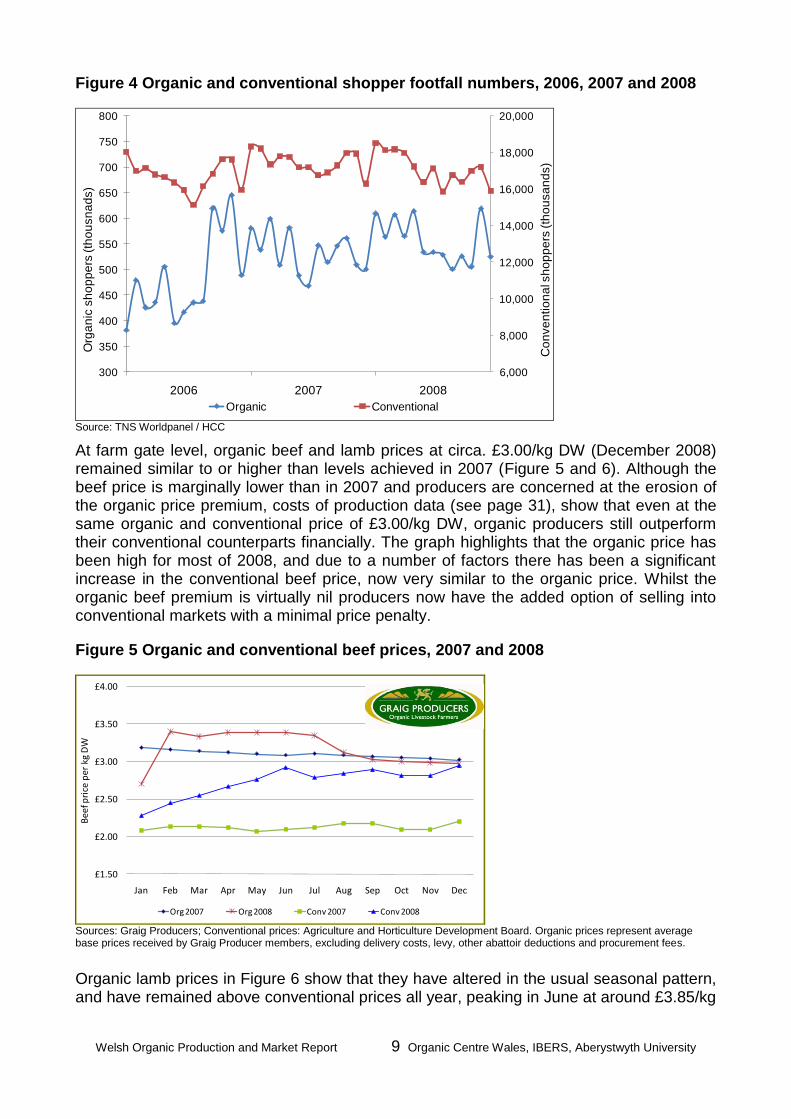
Figure 4 Organic and conventional shopper footfall numbers, 2006, 2007 and 2008 ...................................... 9
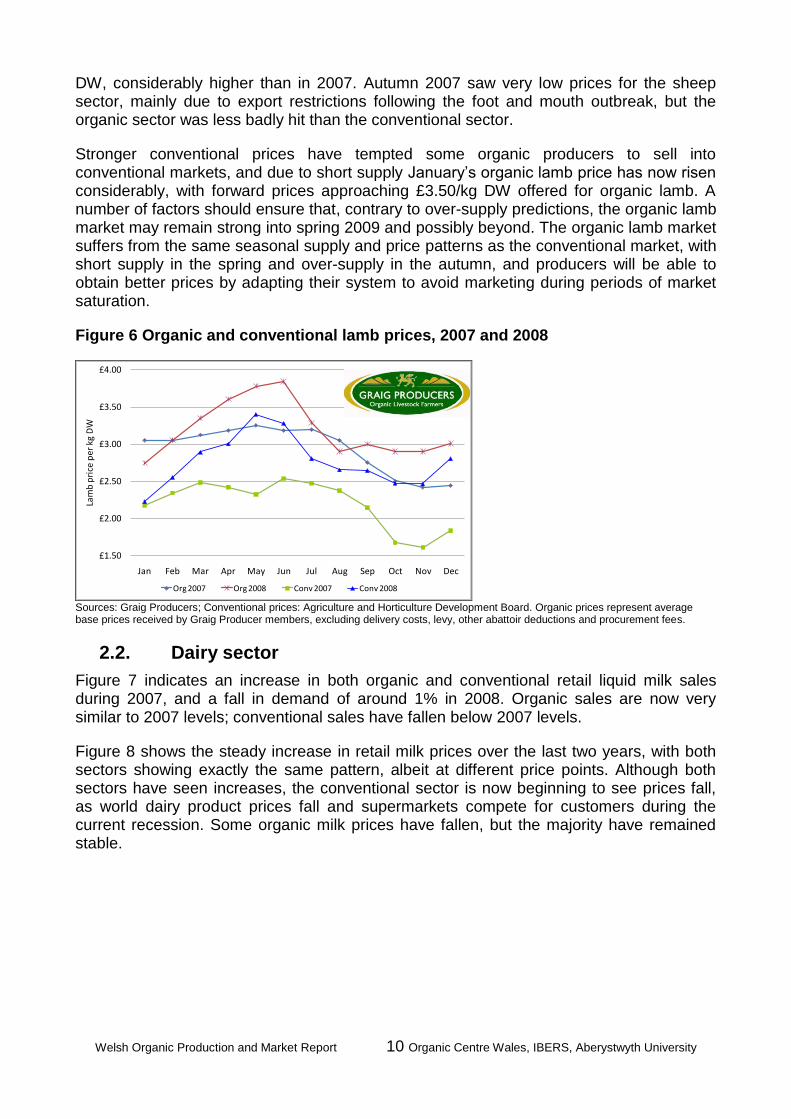
Figure 5 Organic and conventional beef prices, 2007 and 2008 ....................................................................... 9
Figure 6 Organic and conventional lamb prices, 2007 and 2008 .................................................................... 10
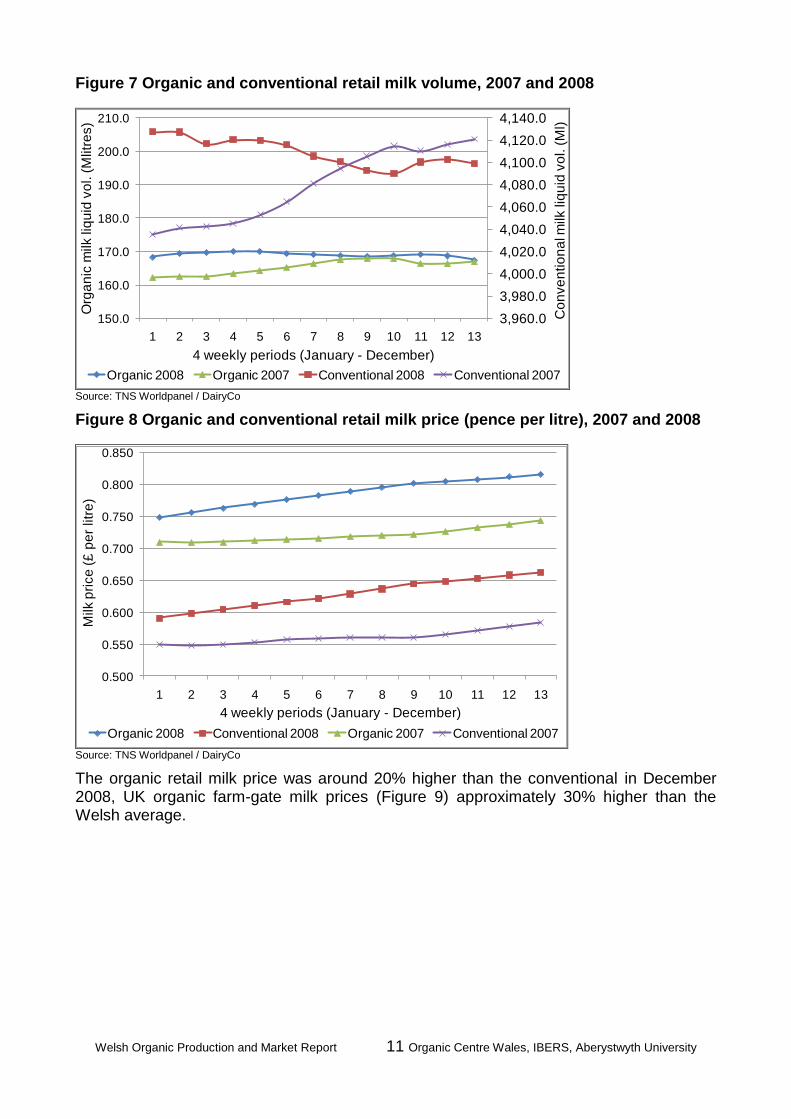
Figure 7 Organic and conventional retail milk volume, 2007 and 2008 .......................................................... 11
Figure 8 Organic and conventional retail milk price (pence per litre), 2007 and 2008 .................................... 11
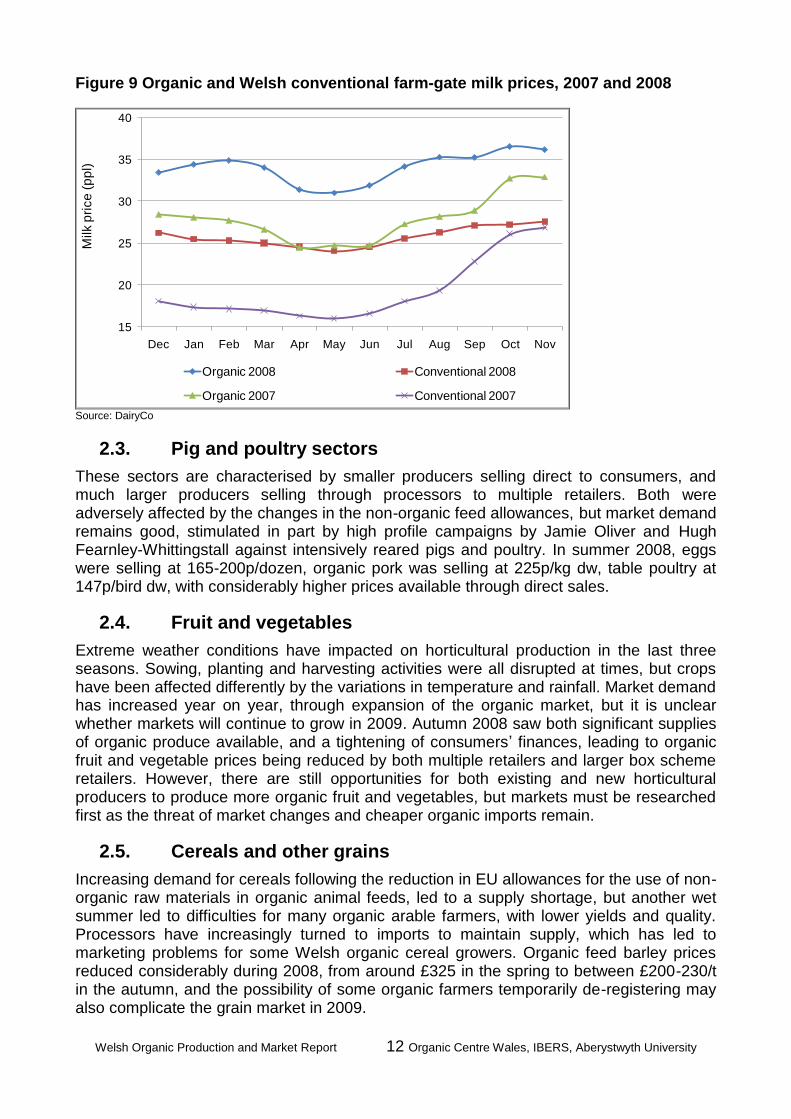
Figure 9 Organic and Welsh conventional farm-gate milk prices, 2007 and 2008 .......................................... 12
Welsh Organic Producer Survey 1 Organic Centre Wales, IBERS, Aberystwyth University
1. Introduction
Prior to the 2007 Organic Centre Wales (OCW) Producer Survey, it was identified that the Welsh organic sector still lacked data availability in a number of key areas. There was an increasing availability of data, but it was still difficult to answer many questions about the sector, such as sales or the number of organic animals sold through conventional markets. The 2007 survey was able to assist in answering some of these questions, but the data collected is only accurate for a limited period after collection. In addition to this the Welsh organic sector has experienced significant changes during the last 12 months, with a further influx of new converters, and more recently the effects of the recession within the UK and abroad.
With all of these factors in mind, the necessity to carry out a further survey in 2008 was even greater than in 2007. Therefore, in consultation with the Welsh Assembly Government (WAG), OCW undertook the survey process again during Autumn 2008, and it is planned that this will now continue on an annual basis. An annual survey, although slightly modified between years, allows for year to year comparisons and trends to be observed.
In 2007 all certified producers, organic and in-conversion, completed the same questionnaire, and in 2008 it was felt that, with the large numbers of new converters since 2006, two individual surveys would be a better solution, to allow for tailoring of questions to each sub-sector.
1.1. Approach
The survey was carried out by Organic Centre Wales with support from staff of the Institute of Biological, Environmental and Rural Sciences (IBERS), Aberystwyth University. The two survey documents (organic and in-conversion) were developed during September (2008), in consultation with industry stakeholders, and finalised in October. Following consultation with WAG and the organic certification bodies the organic survey was sent out to 678 producers registered as organic before end 2006, and the new converter survey was sent to 262 in-conversion holdings registered in 2007 and 2008.
The organic survey comprised of a general information and land use section as well as sections specific to each enterprise. Data received in the 2007 survey allowed most producers to be only sent sections relevant to their business, reducing the size of the survey documents sent out, ensuring financial and environmental savings as well as a less intimidating document for producers to complete. All surveys were accompanied by a covering letter, explaining the benefit to the industry of producers completing the survey, and illustrating that only through accurate information can support organisations such as OCW, WAG and HCC direct attention to the most relevant areas.
Survey documents were sent out to producers in mid-October, with a postal closing date of 31st October. Following the two week postal return period, all producers with outstanding surveys were then contacted by IBERS staff by telephone. All producers contacted by this method were asked whether they were aware of the survey, and after a brief explanation given the option of either completing their survey by phone, or returning their survey by post. Following the follow up phone calls a further reminder letter was sent out, and an additional week was allowed for postal surveys to be returned, before data analysis began.
Welsh Organic Production and Market Report 2 Organic Centre Wales, IBERS, Aberystwyth University
Data collation and analysis was carried out using the same methodology used previously; data from individual MS Excel workbooks extracted to form a large database of results, for analysis, from which the results within this summary are presented.
1.2. Response rates
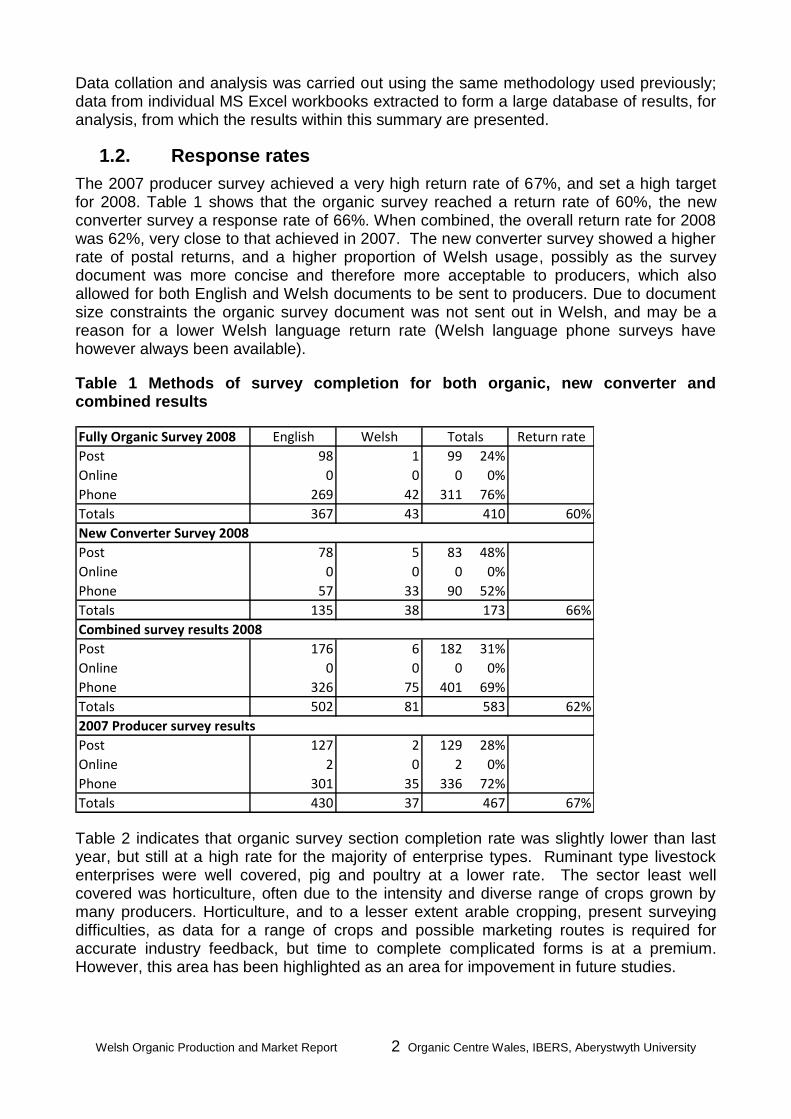
The 2007 producer survey achieved a very high return rate of 67%, and set a high target for 2008. Table 1 shows that the organic survey reached a return rate of 60%, the new converter survey a response rate of 66%. When combined, the overall return rate for 2008 was 62%, very close to that achieved in 2007. The new converter survey showed a higher rate of postal returns, and a higher proportion of Welsh usage, possibly as the survey document was more concise and therefore more acceptable to producers, which also allowed for both English and Welsh documents to be sent to producers. Due to document size constraints the organic survey document was not sent out in Welsh, and may be a reason for a lower Welsh language return rate (Welsh language phone surveys have however always been available).
Table 1 Methods of survey completion for both organic, new converter and combined results
Fully Organic Survey 2008
Post 99 24%
Online 0 0%
Phone 311 76%
Totals
Post 83 48%
Online 0 0%
Phone 90 52%
Totals
Post 182 31%
Online 0 0%
Phone 401 69%
Totals
Post 129 28%
Online 2 0%
Phone 336 72%
Totals
New Converter Survey 2008
Combined survey results 2008
2007 Producer survey results
127 2
430 37 467 67%
0 0
5
38
35
60%43 410
Return rate
66%
367
2
176 6
173135
33
78
0
301
English
269
0 0
326 75
Welsh
1
583 62%81
0
57
Totals
98
0
502
42
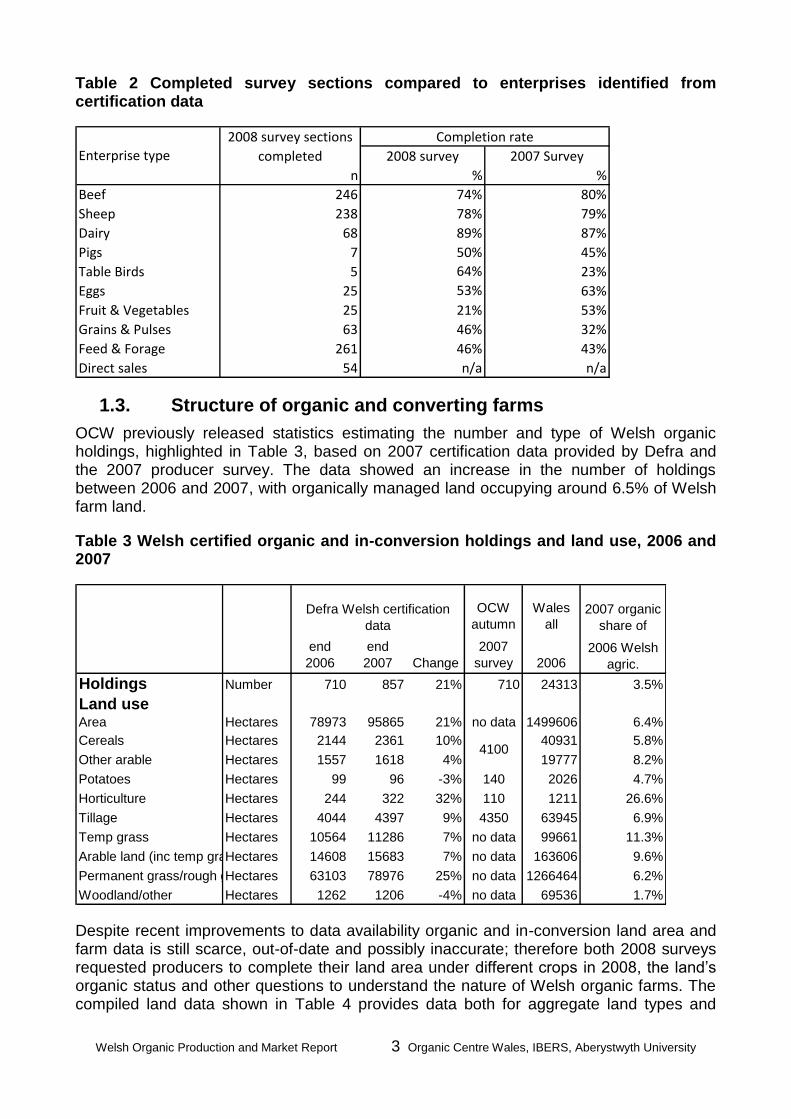
Table 2 indicates that organic survey section completion rate was slightly lower than last year, but still at a high rate for the majority of enterprise types. Ruminant type livestock enterprises were well covered, pig and poultry at a lower rate. The sector least well covered was horticulture, often due to the intensity and diverse range of crops grown by many producers. Horticulture, and to a lesser extent arable cropping, present surveying difficulties, as data for a range of crops and possible marketing routes is required for accurate industry feedback, but time to complete complicated forms is at a premium. However, this area has been highlighted as an area for impovement in future studies.
Welsh Organic Production and Market Report 3 Organic Centre Wales, IBERS, Aberystwyth University
Table 2 Completed survey sections compared to enterprises identified from certification data
Beef
Sheep
Dairy
Pigs
Table Birds
Eggs
Fruit & Vegetables
Grains & Pulses
Feed & Forage
Direct sales
23%
63%
21%
46%
46%
n/a
64%
238
68
80%
79%
87%
261
53%
32%
74%
7
25
54
53%
246
n/a
Enterprise type
Completion rate2008 survey sections
completed
43%
25
5
89%
50% 45%
n
2007 Survey
63
2008 survey
% %
78%
1.3. Structure of organic and converting farms
OCW previously released statistics estimating the number and type of Welsh organic holdings, highlighted in Table 3, based on 2007 certification data provided by Defra and the 2007 producer survey. The data showed an increase in the number of holdings between 2006 and 2007, with organically managed land occupying around 6.5% of Welsh farm land.
Table 3 Welsh certified organic and in-conversion holdings and land use, 2006 and 2007
OCW
autumn
Wales
all
end
2006
end
2007 Change
2007
survey 2006
Holdings Number 710 857 21% 710 24313
Land useArea Hectares 78973 95865 21% no data 1499606
Cereals Hectares 2144 2361 10% 40931
Other arable Hectares 1557 1618 4% 19777
Potatoes Hectares 99 96 -3% 140 2026
Horticulture Hectares 244 322 32% 110 1211
Tillage Hectares 4044 4397 9% 4350 63945
Temp grass Hectares 10564 11286 7% no data 99661
Arable land (inc temp grass)Hectares 14608 15683 7% no data 163606
Permanent grass/rough grazingHectares 63103 78976 25% no data 1266464
Woodland/other Hectares 1262 1206 -4% no data 69536 1.7%
4.7%
26.6%
6.9%
11.3%
9.6%
6.2%
Defra Welsh certification
data
4100
3.5%
6.4%
5.8%
8.2%
2007 organic
share of
2006 Welsh
agric.
Despite recent improvements to data availability organic and in-conversion land area and farm data is still scarce, out-of-date and possibly inaccurate; therefore both 2008 surveys requested producers to complete their land area under different crops in 2008, the land’s organic status and other questions to understand the nature of Welsh organic farms. The compiled land data shown in Table 4 provides data both for aggregate land types and
Welsh Organic Production and Market Report 4 Organic Centre Wales, IBERS, Aberystwyth University
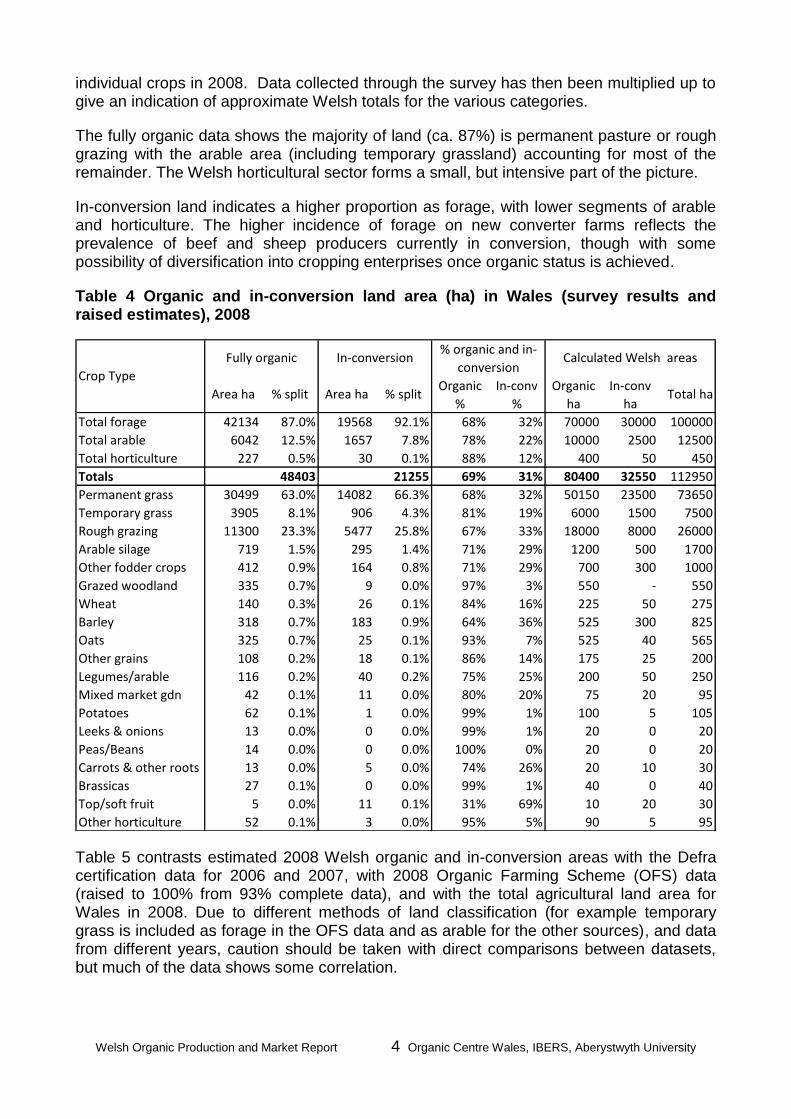
individual crops in 2008. Data collected through the survey has then been multiplied up to give an indication of approximate Welsh totals for the various categories.
The fully organic data shows the majority of land (ca. 87%) is permanent pasture or rough grazing with the arable area (including temporary grassland) accounting for most of the remainder. The Welsh horticultural sector forms a small, but intensive part of the picture.
In-conversion land indicates a higher proportion as forage, with lower segments of arable and horticulture. The higher incidence of forage on new converter farms reflects the prevalence of beef and sheep producers currently in conversion, though with some possibility of diversification into cropping enterprises once organic status is achieved.
Table 4 Organic and in-conversion land area (ha) in Wales (survey results and raised estimates), 2008
Total forage 42134 87.0% 19568 92.1% 68% 32% 70000 30000 100000
Total arable 6042 12.5% 1657 7.8% 78% 22% 10000 2500 12500
Total horticulture 227 0.5% 30 0.1% 88% 12% 400 50 450
Totals 69% 31% 80400 32550 112950
Permanent grass 30499 63.0% 14082 66.3% 68% 32% 50150 23500 73650
Temporary grass 3905 8.1% 906 4.3% 81% 19% 6000 1500 7500
Rough grazing 11300 23.3% 5477 25.8% 67% 33% 18000 8000 26000
Arable silage 719 1.5% 295 1.4% 71% 29% 1200 500 1700
Other fodder crops 412 0.9% 164 0.8% 71% 29% 700 300 1000
Grazed woodland 335 0.7% 9 0.0% 97% 3% 550 - 550
Wheat 140 0.3% 26 0.1% 84% 16% 225 50 275
Barley 318 0.7% 183 0.9% 64% 36% 525 300 825
Oats 325 0.7% 25 0.1% 93% 7% 525 40 565
Other grains 108 0.2% 18 0.1% 86% 14% 175 25 200
Legumes/arable 116 0.2% 40 0.2% 75% 25% 200 50 250
Mixed market gdn 42 0.1% 11 0.0% 80% 20% 75 20 95
Potatoes 62 0.1% 1 0.0% 99% 1% 100 5 105
Leeks & onions 13 0.0% 0 0.0% 99% 1% 20 0 20
Peas/Beans 14 0.0% 0 0.0% 100% 0% 20 0 20
Carrots & other roots 13 0.0% 5 0.0% 74% 26% 20 10 30
Brassicas 27 0.1% 0 0.0% 99% 1% 40 0 40
Top/soft fruit 5 0.0% 11 0.1% 31% 69% 10 20 30
Other horticulture 52 0.1% 3 0.0% 95% 5% 90 5 95
In-conv
ha
Organic
%
In-conv
%
Organic
ha% split
% organic and in-
conversionIn-conversion
% split
Fully organic
Area haArea ha
Crop Type
Calculated Welsh areas
2125548403
Total ha
Table 5 contrasts estimated 2008 Welsh organic and in-conversion areas with the Defra certification data for 2006 and 2007, with 2008 Organic Farming Scheme (OFS) data (raised to 100% from 93% complete data), and with the total agricultural land area for Wales in 2008. Due to different methods of land classification (for example temporary grass is included as forage in the OFS data and as arable for the other sources), and data from different years, caution should be taken with direct comparisons between datasets, but much of the data shows some correlation.
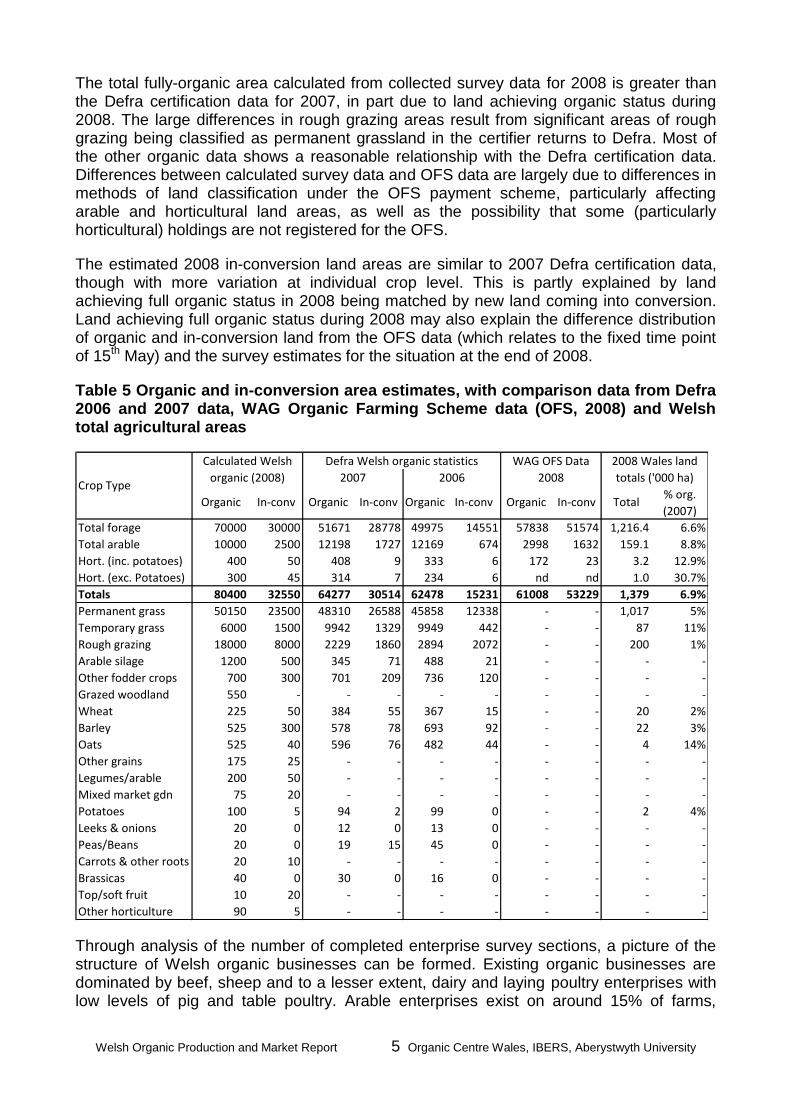
Welsh Organic Production and Market Report 5 Organic Centre Wales, IBERS, Aberystwyth University
The total fully-organic area calculated from collected survey data for 2008 is greater than the Defra certification data for 2007, in part due to land achieving organic status during 2008. The large differences in rough grazing areas result from significant areas of rough grazing being classified as permanent grassland in the certifier returns to Defra. Most of the other organic data shows a reasonable relationship with the Defra certification data. Differences between calculated survey data and OFS data are largely due to differences in methods of land classification under the OFS payment scheme, particularly affecting arable and horticultural land areas, as well as the possibility that some (particularly horticultural) holdings are not registered for the OFS.
The estimated 2008 in-conversion land areas are similar to 2007 Defra certification data, though with more variation at individual crop level. This is partly explained by land achieving full organic status in 2008 being matched by new land coming into conversion. Land achieving full organic status during 2008 may also explain the difference distribution of organic and in-conversion land from the OFS data (which relates to the fixed time point of 15th May) and the survey estimates for the situation at the end of 2008.
Table 5 Organic and in-conversion area estimates, with comparison data from Defra 2006 and 2007 data, WAG Organic Farming Scheme data (OFS, 2008) and Welsh total agricultural areas
Total forage 70000 30000 51671 28778 49975 14551 57838 51574 1,216.4 6.6%
Total arable 10000 2500 12198 1727 12169 674 2998 1632 159.1 8.8%
Hort. (inc. potatoes) 400 50 408 9 333 6 172 23 3.2 12.9%
Hort. (exc. Potatoes) 300 45 314 7 234 6 nd nd 1.0 30.7%
Totals 80400 32550 64277 30514 62478 15231 61008 53229 1,379 6.9%
Permanent grass 50150 23500 48310 26588 45858 12338 - - 1,017 5%
Temporary grass 6000 1500 9942 1329 9949 442 - - 87 11%
Rough grazing 18000 8000 2229 1860 2894 2072 - - 200 1%
Arable silage 1200 500 345 71 488 21 - - - -
Other fodder crops 700 300 701 209 736 120 - - - -
Grazed woodland 550 - - - - - - - - -
Wheat 225 50 384 55 367 15 - - 20 2%
Barley 525 300 578 78 693 92 - - 22 3%
Oats 525 40 596 76 482 44 - - 4 14%
Other grains 175 25 - - - - - - - -
Legumes/arable 200 50 - - - - - - - -
Mixed market gdn 75 20 - - - - - - - -
Potatoes 100 5 94 2 99 0 - - 2 4%
Leeks & onions 20 0 12 0 13 0 - - - -
Peas/Beans 20 0 19 15 45 0 - - - -
Carrots & other roots 20 10 - - - - - - - -
Brassicas 40 0 30 0 16 0 - - - -
Top/soft fruit 10 20 - - - - - - - -
Other horticulture 90 5 - - - - - - - -
2008
Organic In-conv
WAG OFS Data 2008 Wales land
totals ('000 ha)
% org.
(2007)Total
Defra Welsh organic statistics
Crop Type20062007
Calculated Welsh
organic (2008)
Organic In-conv Organic Organic In-convIn-conv
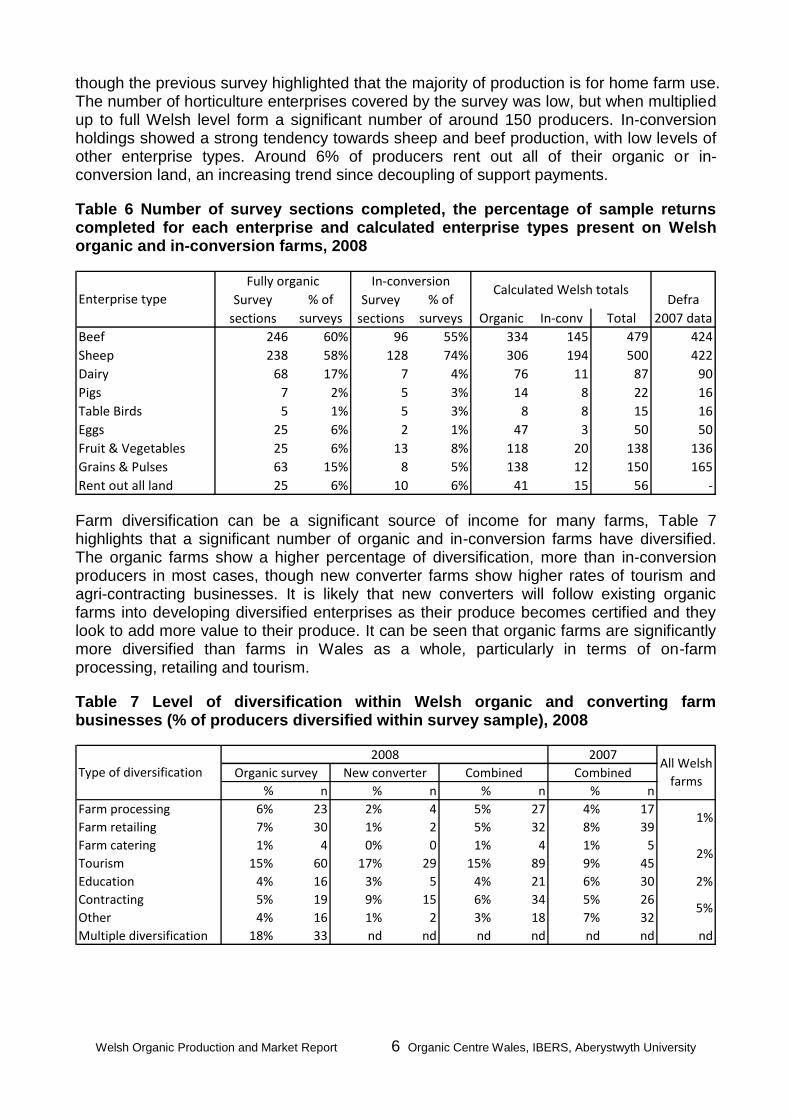
Through analysis of the number of completed enterprise survey sections, a picture of the structure of Welsh organic businesses can be formed. Existing organic businesses are dominated by beef, sheep and to a lesser extent, dairy and laying poultry enterprises with low levels of pig and table poultry. Arable enterprises exist on around 15% of farms,
Welsh Organic Production and Market Report 6 Organic Centre Wales, IBERS, Aberystwyth University
though the previous survey highlighted that the majority of production is for home farm use. The number of horticulture enterprises covered by the survey was low, but when multiplied up to full Welsh level form a significant number of around 150 producers. In-conversion holdings showed a strong tendency towards sheep and beef production, with low levels of other enterprise types. Around 6% of producers rent out all of their organic or in-conversion land, an increasing trend since decoupling of support payments.
Table 6 Number of survey sections completed, the percentage of sample returns completed for each enterprise and calculated enterprise types present on Welsh organic and in-conversion farms, 2008
Organic In-conv Total
Beef 246 60% 96 55% 334 145 479 424
Sheep 238 58% 128 74% 306 194 500 422
Dairy 68 17% 7 4% 76 11 87 90
Pigs 7 2% 5 3% 14 8 22 16
Table Birds 5 1% 5 3% 8 8 15 16
Eggs 25 6% 2 1% 47 3 50 50
Fruit & Vegetables 25 6% 13 8% 118 20 138 136
Grains & Pulses 63 15% 8 5% 138 12 150 165
Rent out all land 25 6% 10 6% 41 15 56 -
Enterprise type Survey
sections
% of
surveys
Fully organic
Defra
2007 data
In-conversion
Survey
sections
% of
surveys
Calculated Welsh totals
Farm diversification can be a significant source of income for many farms, Table 7 highlights that a significant number of organic and in-conversion farms have diversified. The organic farms show a higher percentage of diversification, more than in-conversion producers in most cases, though new converter farms show higher rates of tourism and agri-contracting businesses. It is likely that new converters will follow existing organic farms into developing diversified enterprises as their produce becomes certified and they look to add more value to their produce. It can be seen that organic farms are significantly more diversified than farms in Wales as a whole, particularly in terms of on-farm processing, retailing and tourism.
Table 7 Level of diversification within Welsh organic and converting farm businesses (% of producers diversified within survey sample), 2008
% n % n % n % n
Farm processing 6% 23 2% 4 5% 27 4% 17
Farm retailing 7% 30 1% 2 5% 32 8% 39
Farm catering 1% 4 0% 0 1% 4 1% 5
Tourism 15% 60 17% 29 15% 89 9% 45
Education 4% 16 3% 5 4% 21 6% 30 2%
Contracting 5% 19 9% 15 6% 34 5% 26
Other 4% 16 1% 2 3% 18 7% 32
Multiple diversification 18% 33 nd nd nd nd nd nd nd
Organic survey New converter Combined
2008
Type of diversification Combined
2007
1%
2%
5%
All Welsh
farms
Welsh Organic Production and Market Report 7 Organic Centre Wales, IBERS, Aberystwyth University
2. Economic environment
During the second half of 2008 as the credit crunch began to impact on consumers across the UK the media highlighted a decline in organic sales. The picture is however not as simple as has been portrayed in the popular press.
2.1. Meat sector
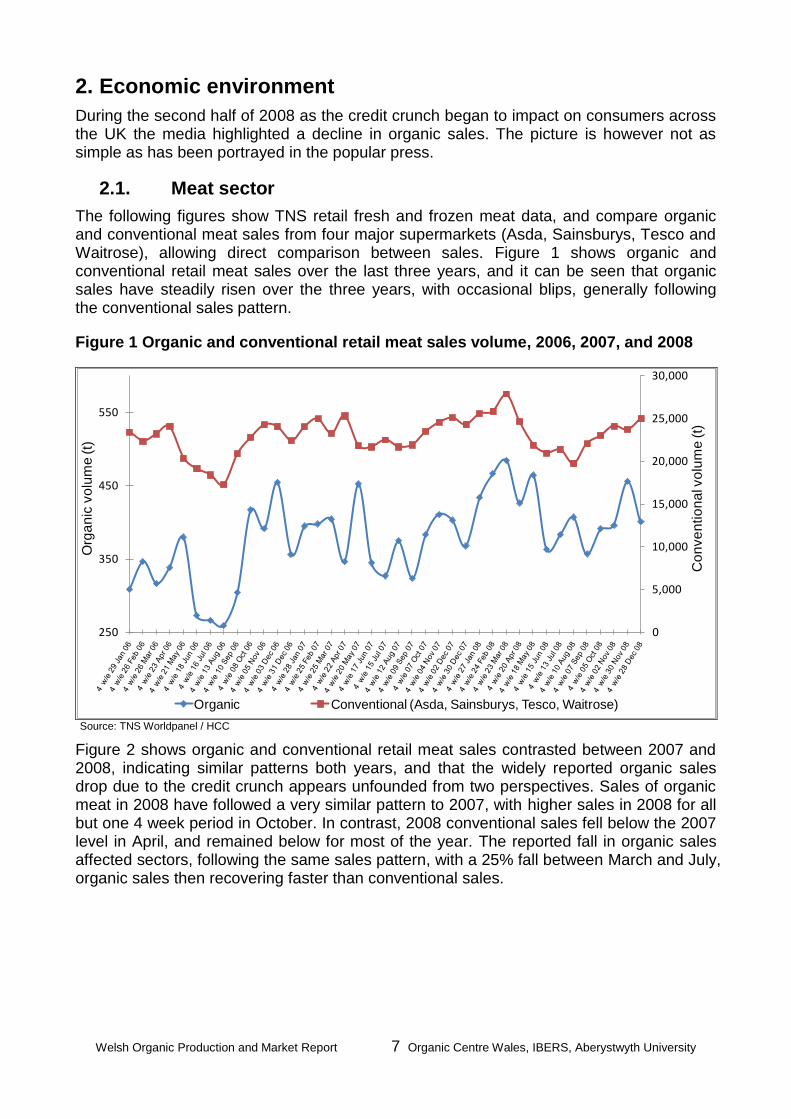
The following figures show TNS retail fresh and frozen meat data, and compare organic and conventional meat sales from four major supermarkets (Asda, Sainsburys, Tesco and Waitrose), allowing direct comparison between sales. Figure 1 shows organic and conventional retail meat sales over the last three years, and it can be seen that organic sales have steadily risen over the three years, with occasional blips, generally following the conventional sales pattern.
Figure 1 Organic and conventional retail meat sales volume, 2006, 2007, and 2008
0
5,000
10,000
15,000
20,000
25,000
30,000
250
350
450
550
Co
nve
ntio
na
l vo
lum
e (t)
Org
an
ic v
olu
me
(t)
Organic Conventional (Asda, Sainsburys, Tesco, Waitrose)
Source: TNS Worldpanel / HCC
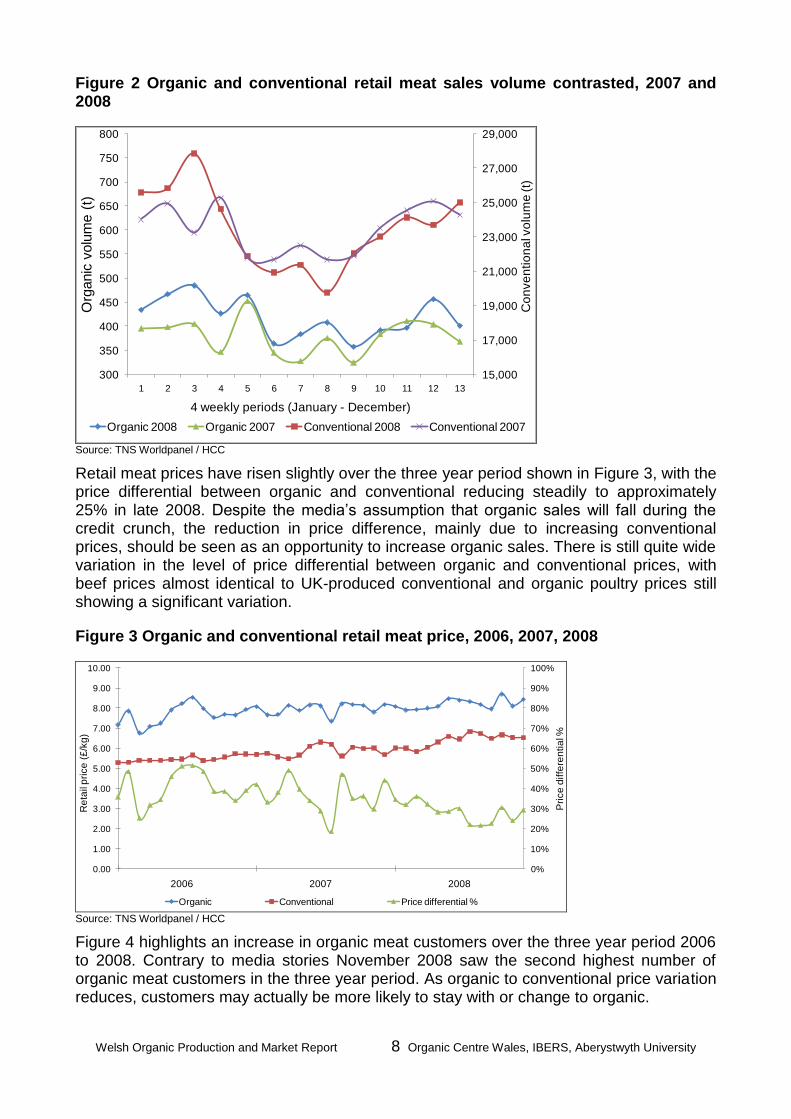
Figure 2 shows organic and conventional retail meat sales contrasted between 2007 and 2008, indicating similar patterns both years, and that the widely reported organic sales drop due to the credit crunch appears unfounded from two perspectives. Sales of organic meat in 2008 have followed a very similar pattern to 2007, with higher sales in 2008 for all but one 4 week period in October. In contrast, 2008 conventional sales fell below the 2007 level in April, and remained below for most of the year. The reported fall in organic sales affected sectors, following the same sales pattern, with a 25% fall between March and July, organic sales then recovering faster than conventional sales.
Welsh Organic Production and Market Report 8 Organic Centre Wales, IBERS, Aberystwyth University
Figure 2 Organic and conventional retail meat sales volume contrasted, 2007 and 2008
15,000
17,000
19,000
21,000
23,000
25,000
27,000
29,000
300
350
400
450
500
550
600
650
700
750
800
1 2 3 4 5 6 7 8 9 10 11 12 13
Co
nve
ntio
na
l vo
lum
e (t)
Org
anic
volu
me (
t)
4 weekly periods (January - December)
Organic 2008 Organic 2007 Conventional 2008 Conventional 2007
Source: TNS Worldpanel / HCC
Retail meat prices have risen slightly over the three year period shown in Figure 3, with the price differential between organic and conventional reducing steadily to approximately 25% in late 2008. Despite the media’s assumption that organic sales will fall during the credit crunch, the reduction in price difference, mainly due to increasing conventional prices, should be seen as an opportunity to increase organic sales. There is still quite wide variation in the level of price differential between organic and conventional prices, with beef prices almost identical to UK-produced conventional and organic poultry prices still showing a significant variation.
Figure 3 Organic and conventional retail meat price, 2006, 2007, 2008
0%
10%
20%
30%
40%
50%
60%
70%
80%
90%
100%
0.00
1.00
2.00
3.00
4.00
5.00
6.00
7.00
8.00
9.00
10.00
2006 2007 2008
Pri
ce
diffe
ren
tia
l %
Re
tail p
rice
(£
/kg
)
Organic Conventional Price differential % Source: TNS Worldpanel / HCC
Figure 4 highlights an increase in organic meat customers over the three year period 2006 to 2008. Contrary to media stories November 2008 saw the second highest number of organic meat customers in the three year period. As organic to conventional price variation reduces, customers may actually be more likely to stay with or change to organic.
Welsh Organic Production and Market Report 9 Organic Centre Wales, IBERS, Aberystwyth University
Figure 4 Organic and conventional shopper footfall numbers, 2006, 2007 and 2008
6,000
8,000
10,000
12,000
14,000
16,000
18,000
20,000
300
350
400
450
500
550
600
650
700
750
800
2006 2007 2008
Co
nve
ntio
na
l sh
op
pe
rs (th
ou
sa
nd
s)
Org
an
ic s
ho
pp
ers
(th
ou
sn
ad
s)
Organic Conventional
Source: TNS Worldpanel / HCC
At farm gate level, organic beef and lamb prices at circa. £3.00/kg DW (December 2008) remained similar to or higher than levels achieved in 2007 (Figure 5 and 6). Although the beef price is marginally lower than in 2007 and producers are concerned at the erosion of the organic price premium, costs of production data (see page 31), show that even at the same organic and conventional price of £3.00/kg DW, organic producers still outperform their conventional counterparts financially. The graph highlights that the organic price has been high for most of 2008, and due to a number of factors there has been a significant increase in the conventional beef price, now very similar to the organic price. Whilst the organic beef premium is virtually nil producers now have the added option of selling into conventional markets with a minimal price penalty.
Figure 5 Organic and conventional beef prices, 2007 and 2008
£1.50
£2.00
£2.50
£3.00
£3.50
£4.00
Jan Feb Mar Apr May Jun Jul Aug Sep Oct Nov Dec
Bee
f pri
ce p
er k
g D
W
Org 2007 Org 2008 Conv 2007 Conv 2008
Sources: Graig Producers; Conventional prices: Agriculture and Horticulture Development Board. Organic prices represent average base prices received by Graig Producer members, excluding delivery costs, levy, other abattoir deductions and procurement fees.
Organic lamb prices in Figure 6 show that they have altered in the usual seasonal pattern, and have remained above conventional prices all year, peaking in June at around £3.85/kg
Welsh Organic Production and Market Report 10 Organic Centre Wales, IBERS, Aberystwyth University
DW, considerably higher than in 2007. Autumn 2007 saw very low prices for the sheep sector, mainly due to export restrictions following the foot and mouth outbreak, but the organic sector was less badly hit than the conventional sector.
Stronger conventional prices have tempted some organic producers to sell into conventional markets, and due to short supply January’s organic lamb price has now risen considerably, with forward prices approaching £3.50/kg DW offered for organic lamb. A number of factors should ensure that, contrary to over-supply predictions, the organic lamb market may remain strong into spring 2009 and possibly beyond. The organic lamb market suffers from the same seasonal supply and price patterns as the conventional market, with short supply in the spring and over-supply in the autumn, and producers will be able to obtain better prices by adapting their system to avoid marketing during periods of market saturation.
Figure 6 Organic and conventional lamb prices, 2007 and 2008
£1.50
£2.00
£2.50
£3.00
£3.50
£4.00
Jan Feb Mar Apr May Jun Jul Aug Sep Oct Nov Dec
Lam
b p
rice
per
kg
DW
Org 2007 Org 2008 Conv 2007 Conv 2008
Sources: Graig Producers; Conventional prices: Agriculture and Horticulture Development Board. Organic prices represent average base prices received by Graig Producer members, excluding delivery costs, levy, other abattoir deductions and procurement fees.
2.2. Dairy sector
Figure 7 indicates an increase in both organic and conventional retail liquid milk sales during 2007, and a fall in demand of around 1% in 2008. Organic sales are now very similar to 2007 levels; conventional sales have fallen below 2007 levels.
Figure 8 shows the steady increase in retail milk prices over the last two years, with both sectors showing exactly the same pattern, albeit at different price points. Although both sectors have seen increases, the conventional sector is now beginning to see prices fall, as world dairy product prices fall and supermarkets compete for customers during the current recession. Some organic milk prices have fallen, but the majority have remained stable.
Welsh Organic Production and Market Report 11 Organic Centre Wales, IBERS, Aberystwyth University
Figure 7 Organic and conventional retail milk volume, 2007 and 2008
3,960.0
3,980.0
4,000.0
4,020.0
4,040.0
4,060.0
4,080.0
4,100.0
4,120.0
4,140.0
150.0
160.0
170.0
180.0
190.0
200.0
210.0
1 2 3 4 5 6 7 8 9 10 11 12 13
Co
nve
ntio
na
l milk liq
uid
vo
l. (
Ml)
Org
an
ic m
ilk liq
uid
vo
l. (
Mlitr
es)
4 weekly periods (January - December)
Organic 2008 Organic 2007 Conventional 2008 Conventional 2007
Source: TNS Worldpanel / DairyCo
Figure 8 Organic and conventional retail milk price (pence per litre), 2007 and 2008
0.500
0.550
0.600
0.650
0.700
0.750
0.800
0.850
1 2 3 4 5 6 7 8 9 10 11 12 13
Milk p
rice
(£
pe
r litr
e)
4 weekly periods (January - December)
Organic 2008 Conventional 2008 Organic 2007 Conventional 2007
Source: TNS Worldpanel / DairyCo
The organic retail milk price was around 20% higher than the conventional in December 2008, UK organic farm-gate milk prices (Figure 9) approximately 30% higher than the Welsh average.
Welsh Organic Production and Market Report 12 Organic Centre Wales, IBERS, Aberystwyth University
Figure 9 Organic and Welsh conventional farm-gate milk prices, 2007 and 2008
15
20
25
30
35
40
Dec Jan Feb Mar Apr May Jun Jul Aug Sep Oct Nov
Milk p
rice
(p
pl)
Organic 2008 Conventional 2008
Organic 2007 Conventional 2007
Source: DairyCo
2.3. Pig and poultry sectors
These sectors are characterised by smaller producers selling direct to consumers, and much larger producers selling through processors to multiple retailers. Both were adversely affected by the changes in the non-organic feed allowances, but market demand remains good, stimulated in part by high profile campaigns by Jamie Oliver and Hugh Fearnley-Whittingstall against intensively reared pigs and poultry. In summer 2008, eggs were selling at 165-200p/dozen, organic pork was selling at 225p/kg dw, table poultry at 147p/bird dw, with considerably higher prices available through direct sales.
2.4. Fruit and vegetables
Extreme weather conditions have impacted on horticultural production in the last three seasons. Sowing, planting and harvesting activities were all disrupted at times, but crops have been affected differently by the variations in temperature and rainfall. Market demand has increased year on year, through expansion of the organic market, but it is unclear whether markets will continue to grow in 2009. Autumn 2008 saw both significant supplies of organic produce available, and a tightening of consumers’ finances, leading to organic fruit and vegetable prices being reduced by both multiple retailers and larger box scheme retailers. However, there are still opportunities for both existing and new horticultural producers to produce more organic fruit and vegetables, but markets must be researched first as the threat of market changes and cheaper organic imports remain.
2.5. Cereals and other grains
Increasing demand for cereals following the reduction in EU allowances for the use of non-organic raw materials in organic animal feeds, led to a supply shortage, but another wet summer led to difficulties for many organic arable farmers, with lower yields and quality. Processors have increasingly turned to imports to maintain supply, which has led to marketing problems for some Welsh organic cereal growers. Organic feed barley prices reduced considerably during 2008, from around £325 in the spring to between £200-230/t in the autumn, and the possibility of some organic farmers temporarily de-registering may also complicate the grain market in 2009.
Welsh Organic Production and Market Report 13 Organic Centre Wales, IBERS, Aberystwyth University
3. Future intentions of producers
3.1. Future intentions of organic producers
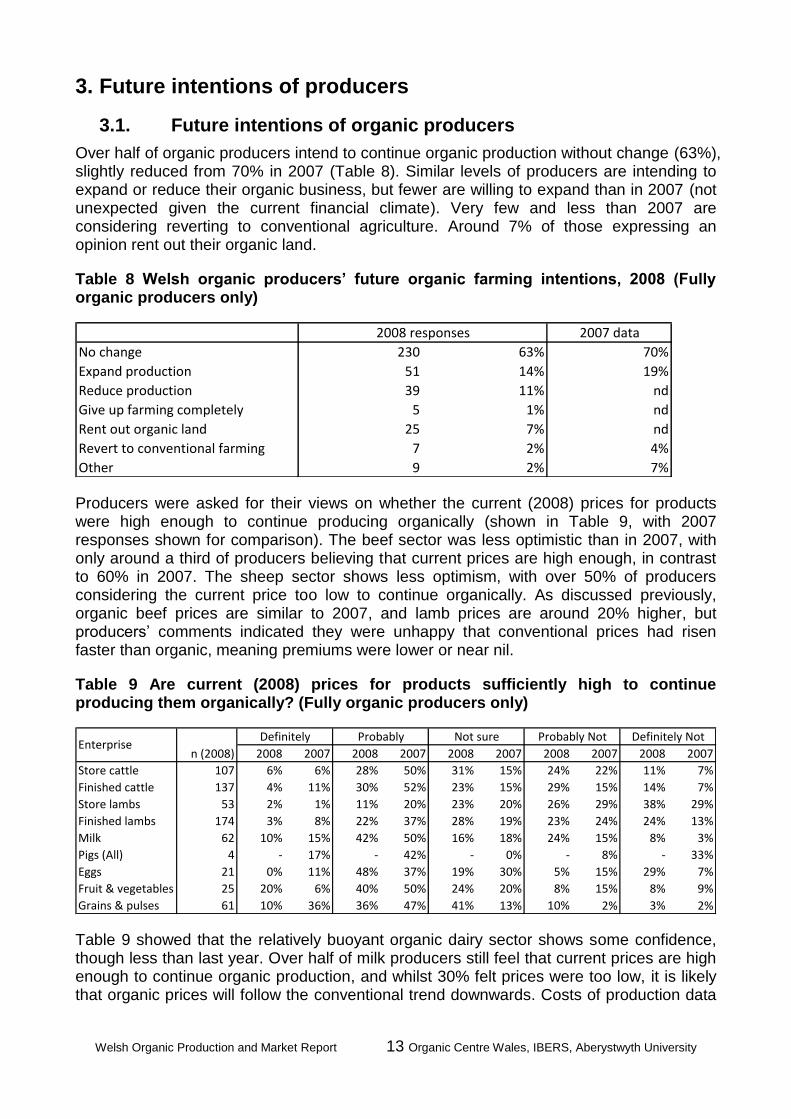
Over half of organic producers intend to continue organic production without change (63%), slightly reduced from 70% in 2007 (Table 8). Similar levels of producers are intending to expand or reduce their organic business, but fewer are willing to expand than in 2007 (not unexpected given the current financial climate). Very few and less than 2007 are considering reverting to conventional agriculture. Around 7% of those expressing an opinion rent out their organic land.
Table 8 Welsh organic producers’ future organic farming intentions, 2008 (Fully organic producers only)
No change
Expand production
Reduce production
Give up farming completely
Rent out organic land
Revert to conventional farming
Other 7%
7%
9
63%
14%
11%
1%
51
39
2007 data
70%
19%
2008 responses
230
2%
2%
25
5
7
nd
nd
nd
4%
Producers were asked for their views on whether the current (2008) prices for products were high enough to continue producing organically (shown in Table 9, with 2007 responses shown for comparison). The beef sector was less optimistic than in 2007, with only around a third of producers believing that current prices are high enough, in contrast to 60% in 2007. The sheep sector shows less optimism, with over 50% of producers considering the current price too low to continue organically. As discussed previously, organic beef prices are similar to 2007, and lamb prices are around 20% higher, but producers’ comments indicated they were unhappy that conventional prices had risen faster than organic, meaning premiums were lower or near nil.
Table 9 Are current (2008) prices for products sufficiently high to continue producing them organically? (Fully organic producers only)
n (2008) 2008 2007 2008 2007 2008 2007 2008 2007 2008 2007
107 6% 6% 28% 50% 31% 15% 24% 22% 11% 7%
137 4% 11% 30% 52% 23% 15% 29% 15% 14% 7%
53 2% 1% 11% 20% 23% 20% 26% 29% 38% 29%
174 3% 8% 22% 37% 28% 19% 23% 24% 24% 13%
62 10% 15% 42% 50% 16% 18% 24% 15% 8% 3%
4 - 17% - 42% - 0% - 8% - 33%
21 0% 11% 48% 37% 19% 30% 5% 15% 29% 7%
25 20% 6% 40% 50% 24% 20% 8% 15% 8% 9%
61 10% 36% 36% 47% 41% 13% 10% 2% 3% 2%
Store cattle
Probably Probably Not Definitely NotNot sure
Finished lambs
Milk
Pigs (All)
Eggs
Grains & pulses
Definitely
Store lambs
Finished cattle
Fruit & vegetables
Enterprise
Table 9 showed that the relatively buoyant organic dairy sector shows some confidence, though less than last year. Over half of milk producers still feel that current prices are high enough to continue organic production, and whilst 30% felt prices were too low, it is likely that organic prices will follow the conventional trend downwards. Costs of production data
Welsh Organic Production and Market Report 14 Organic Centre Wales, IBERS, Aberystwyth University
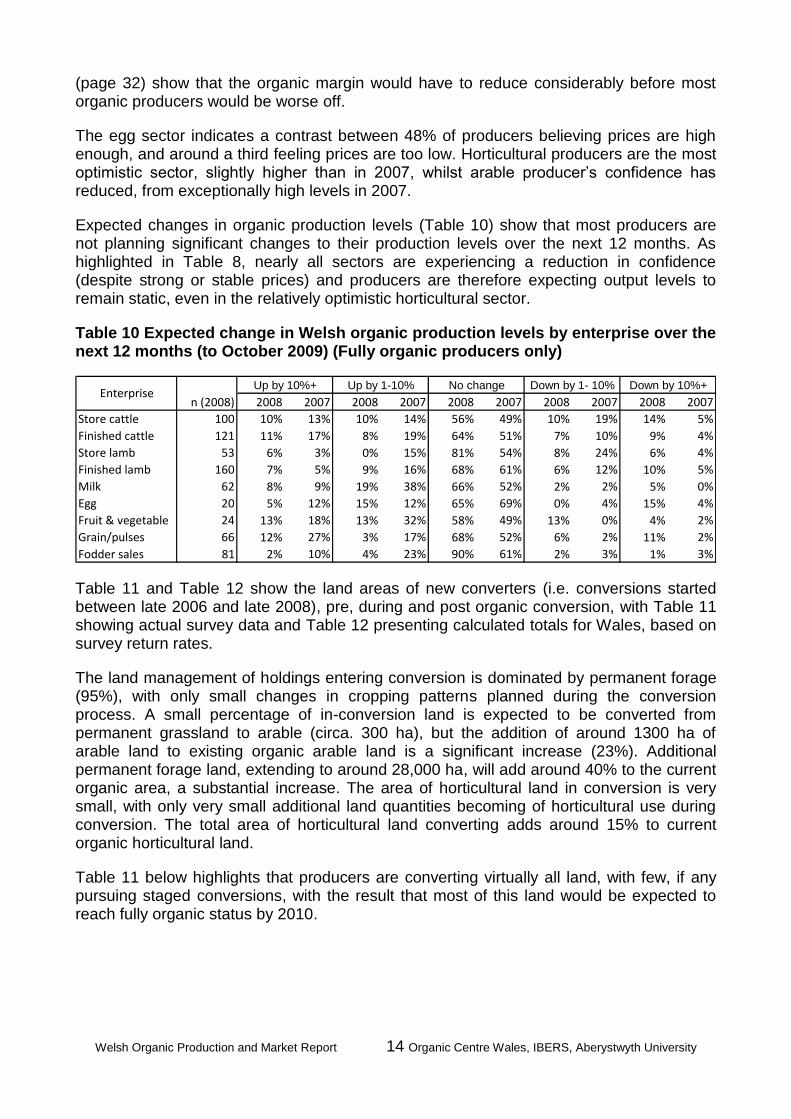
(page 32) show that the organic margin would have to reduce considerably before most organic producers would be worse off.
The egg sector indicates a contrast between 48% of producers believing prices are high enough, and around a third feeling prices are too low. Horticultural producers are the most optimistic sector, slightly higher than in 2007, whilst arable producer’s confidence has reduced, from exceptionally high levels in 2007.
Expected changes in organic production levels (Table 10) show that most producers are not planning significant changes to their production levels over the next 12 months. As highlighted in Table 8, nearly all sectors are experiencing a reduction in confidence (despite strong or stable prices) and producers are therefore expecting output levels to remain static, even in the relatively optimistic horticultural sector.
Table 10 Expected change in Welsh organic production levels by enterprise over the next 12 months (to October 2009) (Fully organic producers only)
n (2008) 2008 2007 2008 2007 2008 2007 2008 2007 2008 2007
100 10% 13% 10% 14% 56% 49% 10% 19% 14% 5%
121 11% 17% 8% 19% 64% 51% 7% 10% 9% 4%
53 6% 3% 0% 15% 81% 54% 8% 24% 6% 4%
160 7% 5% 9% 16% 68% 61% 6% 12% 10% 5%
62 8% 9% 19% 38% 66% 52% 2% 2% 5% 0%
20 5% 12% 15% 12% 65% 69% 0% 4% 15% 4%
24 13% 18% 13% 32% 58% 49% 13% 0% 4% 2%
66 12% 27% 3% 17% 68% 52% 6% 2% 11% 2%
81 2% 10% 4% 23% 90% 61% 2% 3% 1% 3%
Enterprise
Store cattle
Finished cattle
Store lamb
Finished lamb
Milk
Grain/pulses
Fodder sales
Egg
Fruit & vegetable
Up by 10%+ Up by 1-10% No change Down by 1- 10% Down by 10%+
Table 11 and Table 12 show the land areas of new converters (i.e. conversions started between late 2006 and late 2008), pre, during and post organic conversion, with Table 11 showing actual survey data and Table 12 presenting calculated totals for Wales, based on survey return rates.
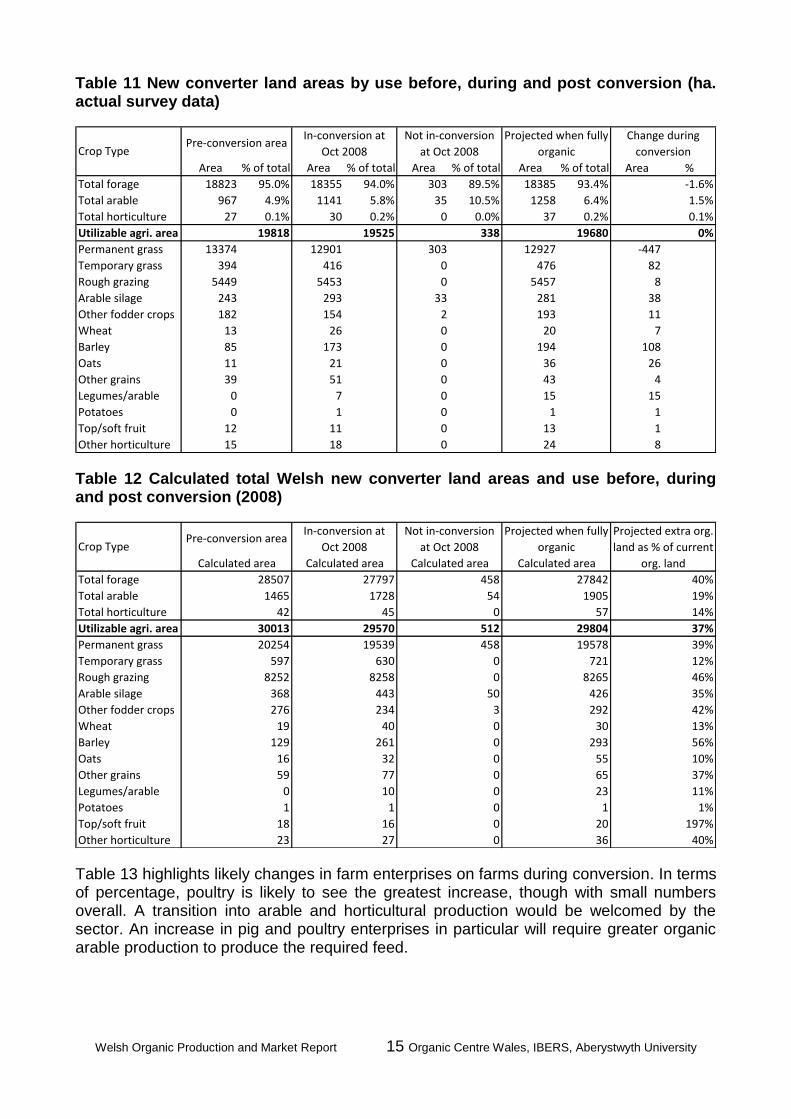
The land management of holdings entering conversion is dominated by permanent forage (95%), with only small changes in cropping patterns planned during the conversion process. A small percentage of in-conversion land is expected to be converted from permanent grassland to arable (circa. 300 ha), but the addition of around 1300 ha of arable land to existing organic arable land is a significant increase (23%). Additional permanent forage land, extending to around 28,000 ha, will add around 40% to the current organic area, a substantial increase. The area of horticultural land in conversion is very small, with only very small additional land quantities becoming of horticultural use during conversion. The total area of horticultural land converting adds around 15% to current organic horticultural land.
Table 11 below highlights that producers are converting virtually all land, with few, if any pursuing staged conversions, with the result that most of this land would be expected to reach fully organic status by 2010.
Welsh Organic Production and Market Report 15 Organic Centre Wales, IBERS, Aberystwyth University
Table 11 New converter land areas by use before, during and post conversion (ha. actual survey data)
Area % of total Area % of total Area % of total Area % of total Area %
Total forage 18823 95.0% 18355 94.0% 303 89.5% 18385 93.4%
Total arable 967 4.9% 1141 5.8% 35 10.5% 1258 6.4%
Total horticulture 27 0.1% 30 0.2% 0 0.0% 37 0.2%
Utilizable agri. area
Permanent grass 13374 12901 303 12927 -447
Temporary grass 394 416 0 476 82
Rough grazing 5449 5453 0 5457 8
Arable silage 243 293 33 281 38
Other fodder crops 182 154 2 193 11
Wheat 13 26 0 20 7
Barley 85 173 0 194 108
Oats 11 21 0 36 26
Other grains 39 51 0 43 4
Legumes/arable 0 7 0 15 15
Potatoes 0 1 0 1 1
Top/soft fruit 12 11 0 13 1
Other horticulture 15 18 0 24 8
Change during
conversion
0%19818
Pre-conversion area
1.5%
0.1%
-1.6%
Not in-conversion
at Oct 2008
In-conversion at
Oct 2008
19525 338 19680
Projected when fully
organicCrop Type
Table 12 Calculated total Welsh new converter land areas and use before, during and post conversion (2008)
Total forage
Total arable
Total horticulture
Utilizable agri. area
Permanent grass
Temporary grass
Rough grazing
Arable silage
Other fodder crops
Wheat
Barley
Oats
Other grains
Legumes/arable
Potatoes
Top/soft fruit
Other horticulture
Calculated area Calculated area Calculated area Calculated area
45
20254
29804
19539 458 19578
54
37%
39%
27797
0
30013 29570 512
1728 1905
57
458
8265
Crop TypePre-conversion area
In-conversion at
Oct 2008
Not in-conversion
at Oct 2008
Projected when fully
organic
Projected extra org.
land as % of current
org. land
40%
19%
14%
28507
1465
27842
597 630 0 721 12%
8252 46%8258 0
368 443 50 426 35%
276 234 3 292 42%
19 40 0 30 13%
129 261 0 293 56%
16 32 0 55 10%
59 77 0 65 37%
0 10 0 23 11%
1 1 0 1 1%
20 197%
27 0 36 40%23
42
18 16 0
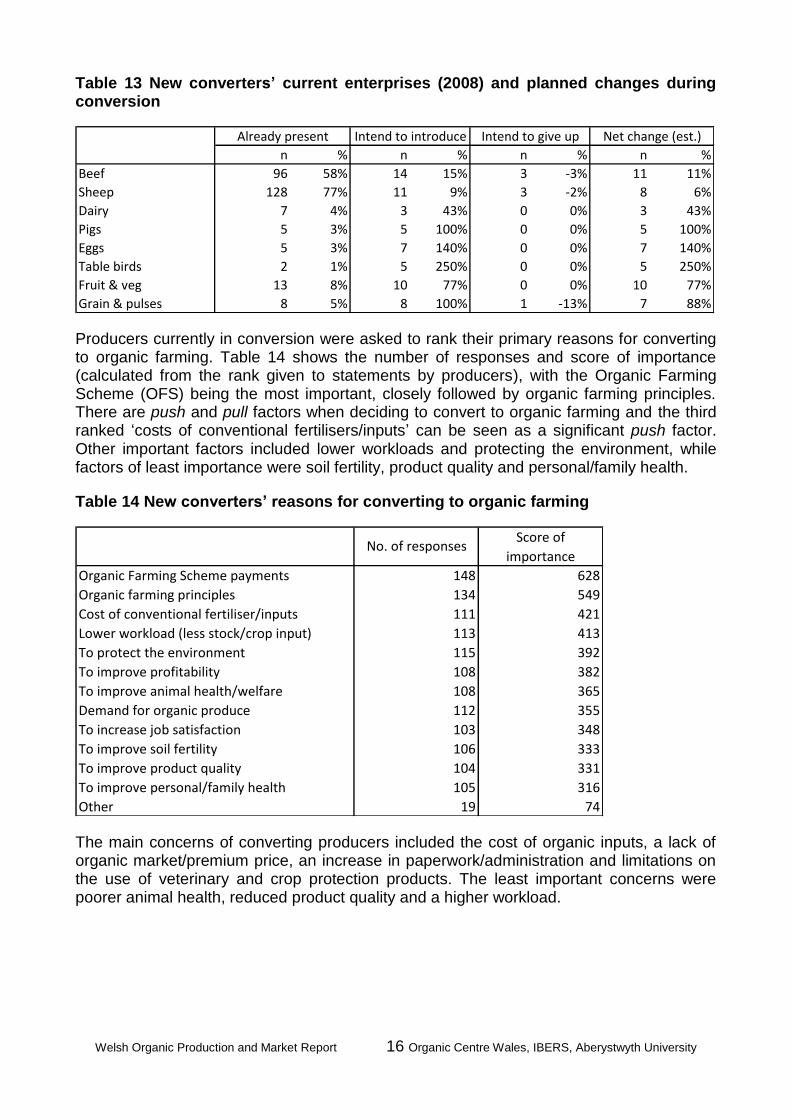
Table 13 highlights likely changes in farm enterprises on farms during conversion. In terms of percentage, poultry is likely to see the greatest increase, though with small numbers overall. A transition into arable and horticultural production would be welcomed by the sector. An increase in pig and poultry enterprises in particular will require greater organic arable production to produce the required feed.
Welsh Organic Production and Market Report 16 Organic Centre Wales, IBERS, Aberystwyth University
Table 13 New converters’ current enterprises (2008) and planned changes during conversion
n % n % n % n %
Beef 96 58% 14 15% 3 -3% 11 11%
Sheep 128 77% 11 9% 3 -2% 8 6%
Dairy 7 4% 3 43% 0 0% 3 43%
Pigs 5 3% 5 100% 0 0% 5 100%
Eggs 5 3% 7 140% 0 0% 7 140%
Table birds 2 1% 5 250% 0 0% 5 250%
Fruit & veg 13 8% 10 77% 0 0% 10 77%
Grain & pulses 8 5% 8 100% 1 -13% 7 88%
Intend to give up Net change (est.)Already present Intend to introduce
Producers currently in conversion were asked to rank their primary reasons for converting to organic farming. Table 14 shows the number of responses and score of importance (calculated from the rank given to statements by producers), with the Organic Farming Scheme (OFS) being the most important, closely followed by organic farming principles. There are push and pull factors when deciding to convert to organic farming and the third ranked ‘costs of conventional fertilisers/inputs’ can be seen as a significant push factor. Other important factors included lower workloads and protecting the environment, while factors of least importance were soil fertility, product quality and personal/family health.
Table 14 New converters’ reasons for converting to organic farming
Organic Farming Scheme payments
Organic farming principles
Cost of conventional fertiliser/inputs
Lower workload (less stock/crop input)
To protect the environment
To improve profitability
To improve animal health/welfare
Demand for organic produce
To increase job satisfaction
To improve soil fertility
To improve product quality
To improve personal/family health
Other 74
Score of
importanceNo. of responses
365
355
348
333
331
316
148
134
111
113
115
108
108
112
103
106
104
105
19
628
549
421
413
392
382
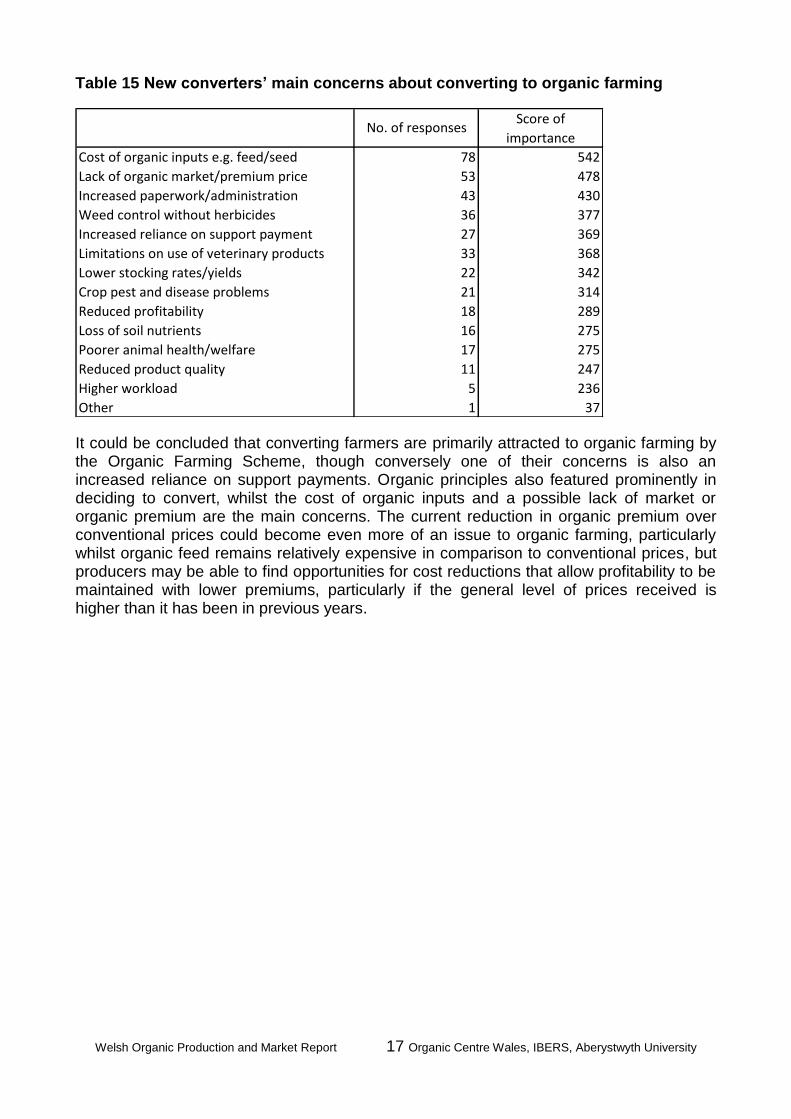
The main concerns of converting producers included the cost of organic inputs, a lack of organic market/premium price, an increase in paperwork/administration and limitations on the use of veterinary and crop protection products. The least important concerns were poorer animal health, reduced product quality and a higher workload.
Welsh Organic Production and Market Report 17 Organic Centre Wales, IBERS, Aberystwyth University
Table 15 New converters’ main concerns about converting to organic farming
No. of responses
78
53
542
478
Score of
importance
43
36
27
33
22
21
430
377
369
368
18
16
17
11
5
1
342
314
289
275
275
247
236
37
Cost of organic inputs e.g. feed/seed
Lack of organic market/premium price
Increased paperwork/administration
Weed control without herbicides
Increased reliance on support payment
Limitations on use of veterinary products
Lower stocking rates/yields
Crop pest and disease problems
Reduced profitability
Loss of soil nutrients
Poorer animal health/welfare
Reduced product quality
Higher workload
Other
It could be concluded that converting farmers are primarily attracted to organic farming by the Organic Farming Scheme, though conversely one of their concerns is also an increased reliance on support payments. Organic principles also featured prominently in deciding to convert, whilst the cost of organic inputs and a possible lack of market or organic premium are the main concerns. The current reduction in organic premium over conventional prices could become even more of an issue to organic farming, particularly whilst organic feed remains relatively expensive in comparison to conventional prices, but producers may be able to find opportunities for cost reductions that allow profitability to be maintained with lower premiums, particularly if the general level of prices received is higher than it has been in previous years.
Welsh Organic Production and Market Report 18 Organic Centre Wales, IBERS, Aberystwyth University
4. Livestock
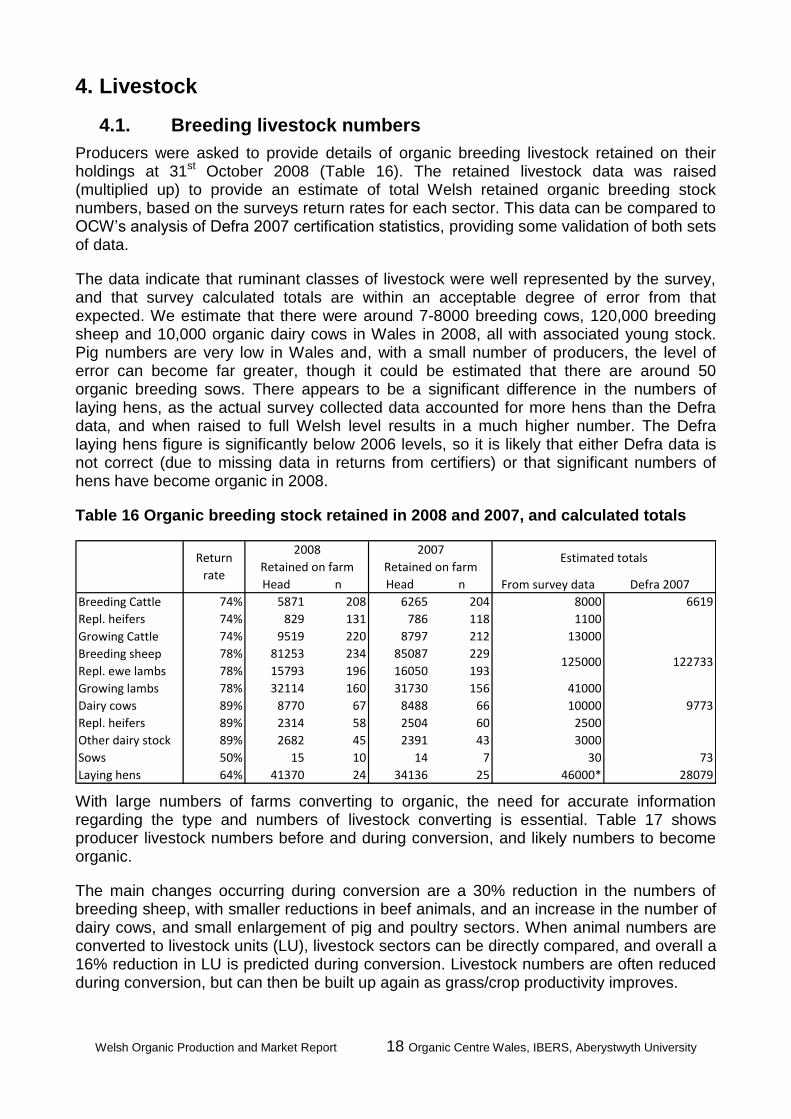
4.1. Breeding livestock numbers
Producers were asked to provide details of organic breeding livestock retained on their holdings at 31st October 2008 (Table 16). The retained livestock data was raised (multiplied up) to provide an estimate of total Welsh retained organic breeding stock numbers, based on the surveys return rates for each sector. This data can be compared to OCW’s analysis of Defra 2007 certification statistics, providing some validation of both sets of data.
The data indicate that ruminant classes of livestock were well represented by the survey, and that survey calculated totals are within an acceptable degree of error from that expected. We estimate that there were around 7-8000 breeding cows, 120,000 breeding sheep and 10,000 organic dairy cows in Wales in 2008, all with associated young stock. Pig numbers are very low in Wales and, with a small number of producers, the level of error can become far greater, though it could be estimated that there are around 50 organic breeding sows. There appears to be a significant difference in the numbers of laying hens, as the actual survey collected data accounted for more hens than the Defra data, and when raised to full Welsh level results in a much higher number. The Defra laying hens figure is significantly below 2006 levels, so it is likely that either Defra data is not correct (due to missing data in returns from certifiers) or that significant numbers of hens have become organic in 2008.
Table 16 Organic breeding stock retained in 2008 and 2007, and calculated totals
Head n Head n
Breeding Cattle 74% 5871 208 6265 204
Repl. heifers 74% 829 131 786 118
Growing Cattle 74% 9519 220 8797 212
Breeding sheep 78% 81253 234 85087 229
Repl. ewe lambs 78% 15793 196 16050 193
Growing lambs 78% 32114 160 31730 156
Dairy cows 89% 8770 67 8488 66
Repl. heifers 89% 2314 58 2504 60
Other dairy stock 89% 2682 45 2391 43
Sows 50% 15 10 14 7
Laying hens 64% 41370 24 34136 25
125000
10000
2500
From survey data
8000
1100
13000
41000
30
9773
73
2807946000*
3000
2008
Retained on farm
2007
Retained on farmReturn
rate
Estimated totals
Defra 2007
6619
122733
With large numbers of farms converting to organic, the need for accurate information regarding the type and numbers of livestock converting is essential. Table 17 shows producer livestock numbers before and during conversion, and likely numbers to become organic.
The main changes occurring during conversion are a 30% reduction in the numbers of breeding sheep, with smaller reductions in beef animals, and an increase in the number of dairy cows, and small enlargement of pig and poultry sectors. When animal numbers are converted to livestock units (LU), livestock sectors can be directly compared, and overall a 16% reduction in LU is predicted during conversion. Livestock numbers are often reduced during conversion, but can then be built up again as grass/crop productivity improves.
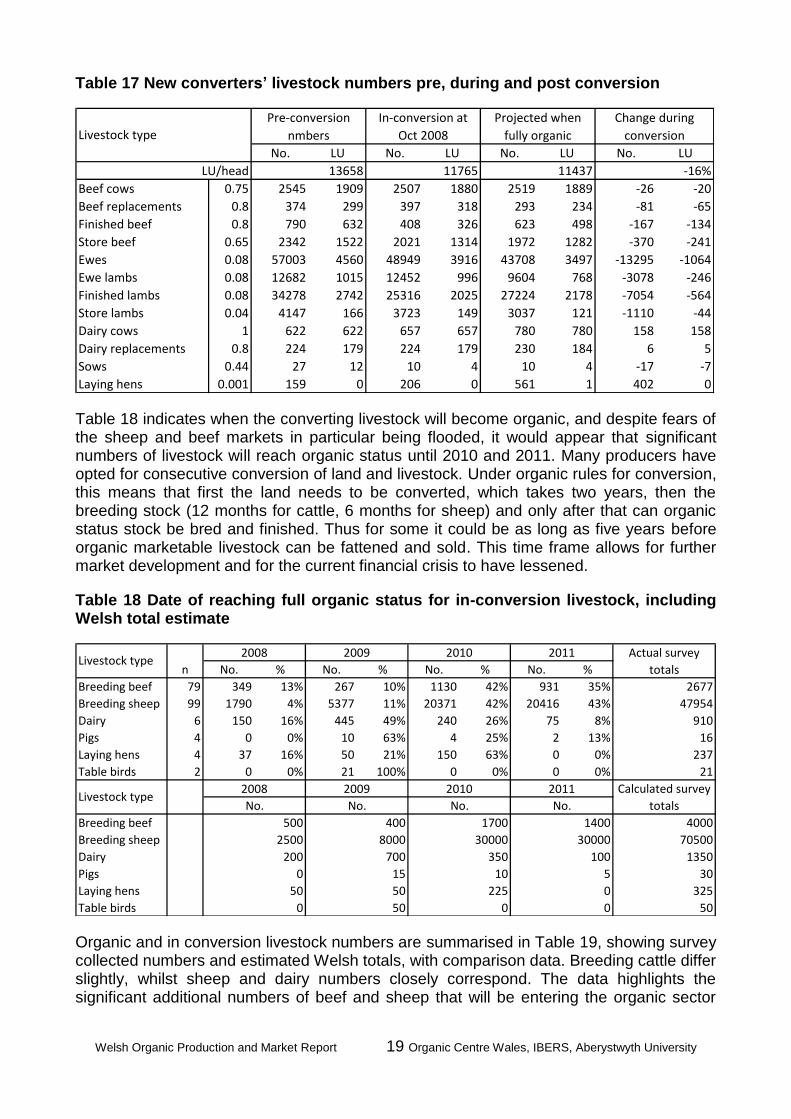
Welsh Organic Production and Market Report 19 Organic Centre Wales, IBERS, Aberystwyth University
Table 17 New converters’ livestock numbers pre, during and post conversion
No. LU No. LU No. LU No. LU
LU/head
Beef cows 0.75 2545 1909 2507 1880 2519 1889 -26 -20
Beef replacements 0.8 374 299 397 318 293 234 -81 -65
Finished beef 0.8 790 632 408 326 623 498 -167 -134
Store beef 0.65 2342 1522 2021 1314 1972 1282 -370 -241
Ewes 0.08 57003 4560 48949 3916 43708 3497 -13295 -1064
Ewe lambs 0.08 12682 1015 12452 996 9604 768 -3078 -246
Finished lambs 0.08 34278 2742 25316 2025 27224 2178 -7054 -564
Store lambs 0.04 4147 166 3723 149 3037 121 -1110 -44
Dairy cows 1 622 622 657 657 780 780 158 158
Dairy replacements 0.8 224 179 224 179 230 184 6 5
Sows 0.44 27 12 10 4 10 4 -17 -7
Laying hens 0.001 159 0 206 0 561 1 402 0
Livestock type
13658
Pre-conversion
nmbers
11437
Change during
conversion
In-conversion at
Oct 2008
Projected when
fully organic
-16%11765
Table 18 indicates when the converting livestock will become organic, and despite fears of the sheep and beef markets in particular being flooded, it would appear that significant numbers of livestock will reach organic status until 2010 and 2011. Many producers have opted for consecutive conversion of land and livestock. Under organic rules for conversion, this means that first the land needs to be converted, which takes two years, then the breeding stock (12 months for cattle, 6 months for sheep) and only after that can organic status stock be bred and finished. Thus for some it could be as long as five years before organic marketable livestock can be fattened and sold. This time frame allows for further market development and for the current financial crisis to have lessened.
Table 18 Date of reaching full organic status for in-conversion livestock, including Welsh total estimate
No. % No. % No. % No. %
Breeding beef 79 349 13% 267 10% 1130 42% 931 35%
Breeding sheep 99 1790 4% 5377 11% 20371 42% 20416 43%
Dairy 6 150 16% 445 49% 240 26% 75 8%
Pigs 4 0 0% 10 63% 4 25% 2 13%
Laying hens 4 37 16% 50 21% 150 63% 0 0%
Table birds 2 0 0% 21 100% 0 0% 0 0%
Breeding beef
Breeding sheep
Dairy
Pigs
Laying hens
Table birds
Actual survey
totals
Calculated survey
totals
2008 2009 2010 2011
21
2677
47954
910
Livestock typen
2010 2011
16
237
4000
70500
1350
30
325
5050
500
2500
200
0
50
0
30000
350
10
225
0
400
8000
700
15
50
1400
No. No. No. No.
1700
100
5
0
0
30000
2008 2009Livestock type
Organic and in conversion livestock numbers are summarised in Table 19, showing survey collected numbers and estimated Welsh totals, with comparison data. Breeding cattle differ slightly, whilst sheep and dairy numbers closely correspond. The data highlights the significant additional numbers of beef and sheep that will be entering the organic sector
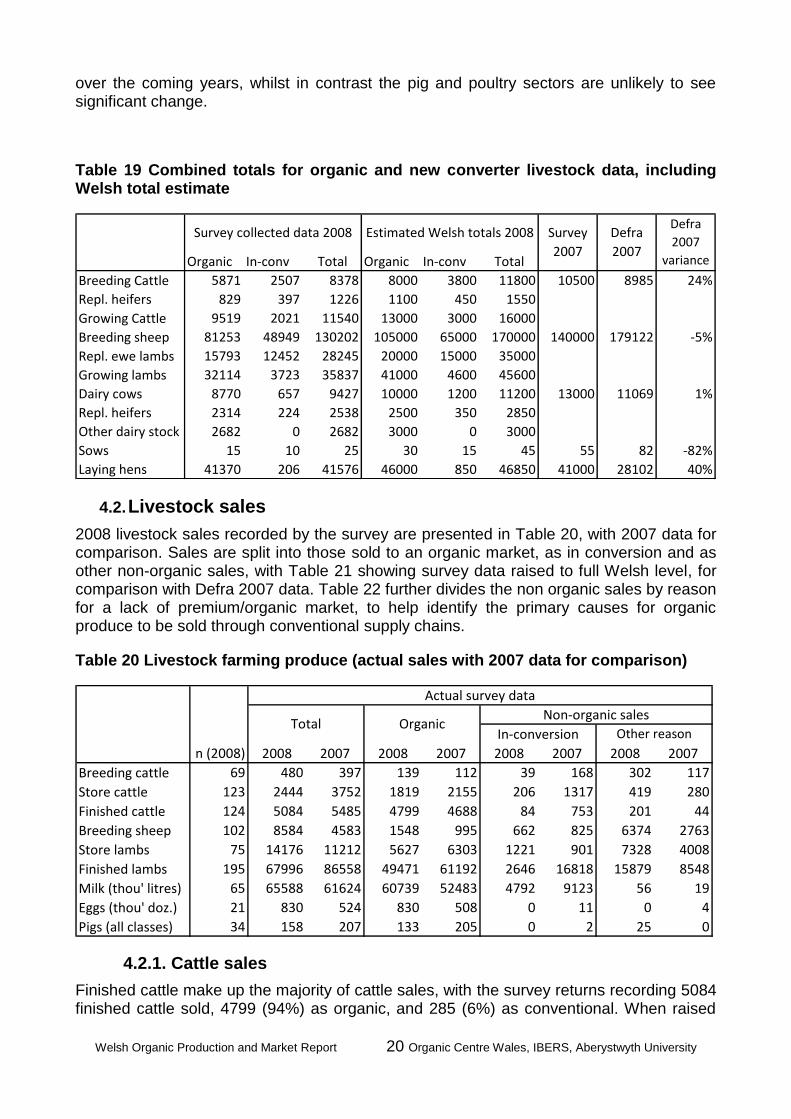
Welsh Organic Production and Market Report 20 Organic Centre Wales, IBERS, Aberystwyth University
over the coming years, whilst in contrast the pig and poultry sectors are unlikely to see significant change.
Table 19 Combined totals for organic and new converter livestock data, including Welsh total estimate
Organic In-conv Total Organic In-conv Total
Breeding Cattle 5871 2507 8378 8000 3800 11800 10500 8985 24%
Repl. heifers 829 397 1226 1100 450 1550
Growing Cattle 9519 2021 11540 13000 3000 16000
Breeding sheep 81253 48949 130202 105000 65000 170000 140000 179122 -5%
Repl. ewe lambs 15793 12452 28245 20000 15000 35000
Growing lambs 32114 3723 35837 41000 4600 45600
Dairy cows 8770 657 9427 10000 1200 11200 13000 11069 1%
Repl. heifers 2314 224 2538 2500 350 2850
Other dairy stock 2682 0 2682 3000 0 3000
Sows 15 10 25 30 15 45 55 82 -82%
Laying hens 41370 206 41576 46000 850 46850 41000 28102 40%
Defra
2007
Estimated Welsh totals 2008Survey collected data 2008 Survey
2007
Defra
2007
variance
4.2. Livestock sales
2008 livestock sales recorded by the survey are presented in Table 20, with 2007 data for comparison. Sales are split into those sold to an organic market, as in conversion and as other non-organic sales, with Table 21 showing survey data raised to full Welsh level, for comparison with Defra 2007 data. Table 22 further divides the non organic sales by reason for a lack of premium/organic market, to help identify the primary causes for organic produce to be sold through conventional supply chains.
Table 20 Livestock farming produce (actual sales with 2007 data for comparison)
n (2008) 2008 2007 2008 2007 2008 2007 2008 2007
Breeding cattle 69 480 397 139 112 39 168 302 117
Store cattle 123 2444 3752 1819 2155 206 1317 419 280
Finished cattle 124 5084 5485 4799 4688 84 753 201 44
Breeding sheep 102 8584 4583 1548 995 662 825 6374 2763
Store lambs 75 14176 11212 5627 6303 1221 901 7328 4008
Finished lambs 195 67996 86558 49471 61192 2646 16818 15879 8548
Milk (thou' litres) 65 65588 61624 60739 52483 4792 9123 56 19
Eggs (thou' doz.) 21 830 524 830 508 0 11 0 4
Pigs (all classes) 34 158 207 133 205 0 2 25 0
In-conversion Other reason
Actual survey data
Total OrganicNon-organic sales
4.2.1. Cattle sales
Finished cattle make up the majority of cattle sales, with the survey returns recording 5084 finished cattle sold, 4799 (94%) as organic, and 285 (6%) as conventional. When raised
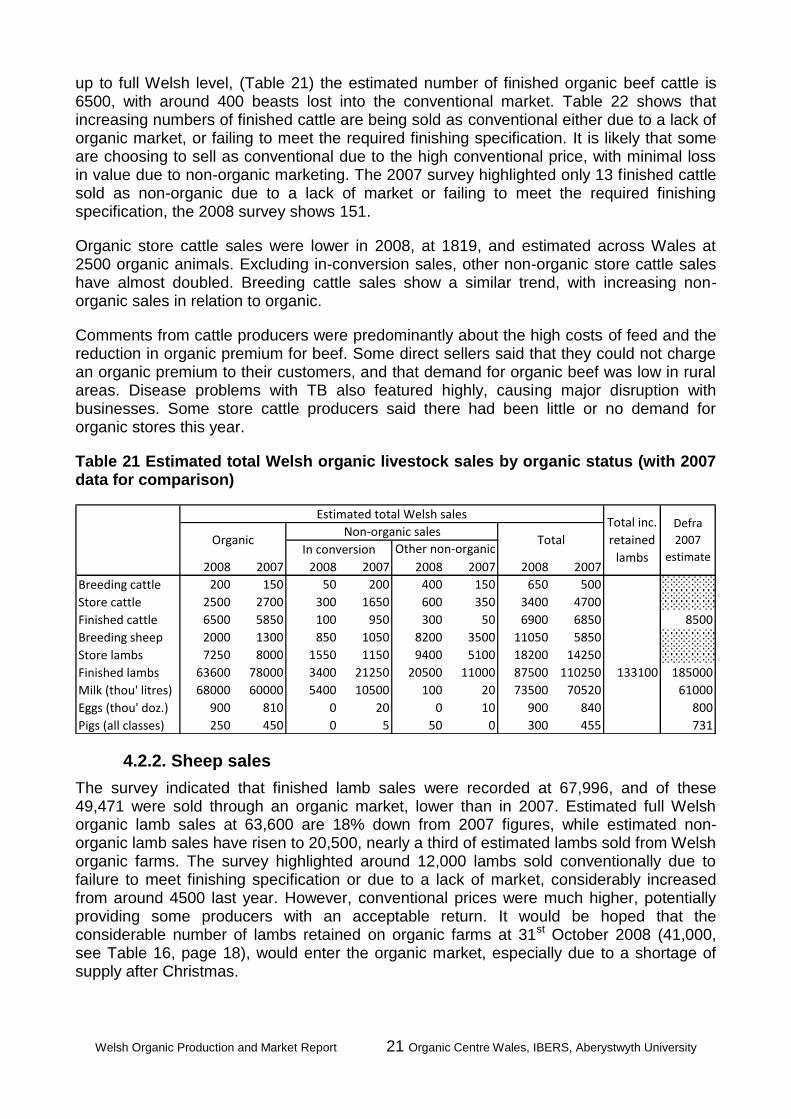
Welsh Organic Production and Market Report 21 Organic Centre Wales, IBERS, Aberystwyth University
up to full Welsh level, (Table 21) the estimated number of finished organic beef cattle is 6500, with around 400 beasts lost into the conventional market. Table 22 shows that increasing numbers of finished cattle are being sold as conventional either due to a lack of organic market, or failing to meet the required finishing specification. It is likely that some are choosing to sell as conventional due to the high conventional price, with minimal loss in value due to non-organic marketing. The 2007 survey highlighted only 13 finished cattle sold as non-organic due to a lack of market or failing to meet the required finishing specification, the 2008 survey shows 151.
Organic store cattle sales were lower in 2008, at 1819, and estimated across Wales at 2500 organic animals. Excluding in-conversion sales, other non-organic store cattle sales have almost doubled. Breeding cattle sales show a similar trend, with increasing non-organic sales in relation to organic.
Comments from cattle producers were predominantly about the high costs of feed and the reduction in organic premium for beef. Some direct sellers said that they could not charge an organic premium to their customers, and that demand for organic beef was low in rural areas. Disease problems with TB also featured highly, causing major disruption with businesses. Some store cattle producers said there had been little or no demand for organic stores this year.
Table 21 Estimated total Welsh organic livestock sales by organic status (with 2007 data for comparison)
2008 2007 2008 2007 2008 2007 2008 2007
Breeding cattle 200 150 50 200 400 150 650 500
Store cattle 2500 2700 300 1650 600 350 3400 4700
Finished cattle 6500 5850 100 950 300 50 6900 6850 8500
Breeding sheep 2000 1300 850 1050 8200 3500 11050 5850
Store lambs 7250 8000 1550 1150 9400 5100 18200 14250
Finished lambs 63600 78000 3400 21250 20500 11000 87500 110250 133100 185000
Milk (thou' litres) 68000 60000 5400 10500 100 20 73500 70520 61000
Eggs (thou' doz.) 900 810 0 20 0 10 900 840 800
Pigs (all classes) 250 450 0 5 50 0 300 455 731
Non-organic sales
In conversion Other non-organicOrganic
Estimated total Welsh salesTotal inc.
retained
lambs
Total
Defra
2007
estimate
4.2.2. Sheep sales
The survey indicated that finished lamb sales were recorded at 67,996, and of these 49,471 were sold through an organic market, lower than in 2007. Estimated full Welsh organic lamb sales at 63,600 are 18% down from 2007 figures, while estimated non-organic lamb sales have risen to 20,500, nearly a third of estimated lambs sold from Welsh organic farms. The survey highlighted around 12,000 lambs sold conventionally due to failure to meet finishing specification or due to a lack of market, considerably increased from around 4500 last year. However, conventional prices were much higher, potentially providing some producers with an acceptable return. It would be hoped that the considerable number of lambs retained on organic farms at 31st October 2008 (41,000, see Table 16, page 18), would enter the organic market, especially due to a shortage of supply after Christmas.
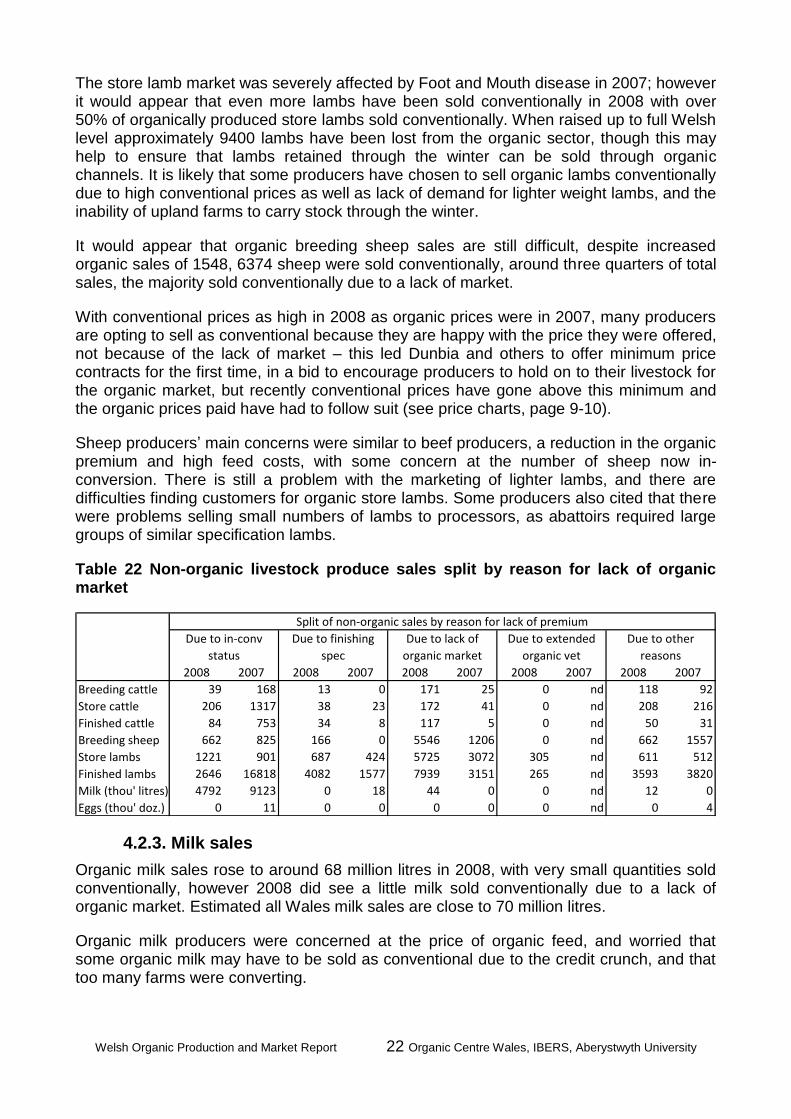
Welsh Organic Production and Market Report 22 Organic Centre Wales, IBERS, Aberystwyth University
The store lamb market was severely affected by Foot and Mouth disease in 2007; however it would appear that even more lambs have been sold conventionally in 2008 with over 50% of organically produced store lambs sold conventionally. When raised up to full Welsh level approximately 9400 lambs have been lost from the organic sector, though this may help to ensure that lambs retained through the winter can be sold through organic channels. It is likely that some producers have chosen to sell organic lambs conventionally due to high conventional prices as well as lack of demand for lighter weight lambs, and the inability of upland farms to carry stock through the winter.
It would appear that organic breeding sheep sales are still difficult, despite increased organic sales of 1548, 6374 sheep were sold conventionally, around three quarters of total sales, the majority sold conventionally due to a lack of market.
With conventional prices as high in 2008 as organic prices were in 2007, many producers are opting to sell as conventional because they are happy with the price they were offered, not because of the lack of market – this led Dunbia and others to offer minimum price contracts for the first time, in a bid to encourage producers to hold on to their livestock for the organic market, but recently conventional prices have gone above this minimum and the organic prices paid have had to follow suit (see price charts, page 9-10).
Sheep producers’ main concerns were similar to beef producers, a reduction in the organic premium and high feed costs, with some concern at the number of sheep now in-conversion. There is still a problem with the marketing of lighter lambs, and there are difficulties finding customers for organic store lambs. Some producers also cited that there were problems selling small numbers of lambs to processors, as abattoirs required large groups of similar specification lambs.
Table 22 Non-organic livestock produce sales split by reason for lack of organic market
2008 2007 2008 2007 2008 2007 2008 2007 2008 2007
Breeding cattle 39 168 13 0 171 25 0 nd 118 92
Store cattle 206 1317 38 23 172 41 0 nd 208 216
Finished cattle 84 753 34 8 117 5 0 nd 50 31
Breeding sheep 662 825 166 0 5546 1206 0 nd 662 1557
Store lambs 1221 901 687 424 5725 3072 305 nd 611 512
Finished lambs 2646 16818 4082 1577 7939 3151 265 nd 3593 3820
Milk (thou' litres) 4792 9123 0 18 44 0 0 nd 12 0
Eggs (thou' doz.) 0 11 0 0 0 0 0 nd 0 4
Due to other
reasons
Split of non-organic sales by reason for lack of premium
Due to in-conv
status
Due to finishing
spec
Due to lack of
organic market
Due to extended
organic vet
4.2.3. Milk sales
Organic milk sales rose to around 68 million litres in 2008, with very small quantities sold conventionally, however 2008 did see a little milk sold conventionally due to a lack of organic market. Estimated all Wales milk sales are close to 70 million litres.
Organic milk producers were concerned at the price of organic feed, and worried that some organic milk may have to be sold as conventional due to the credit crunch, and that too many farms were converting.
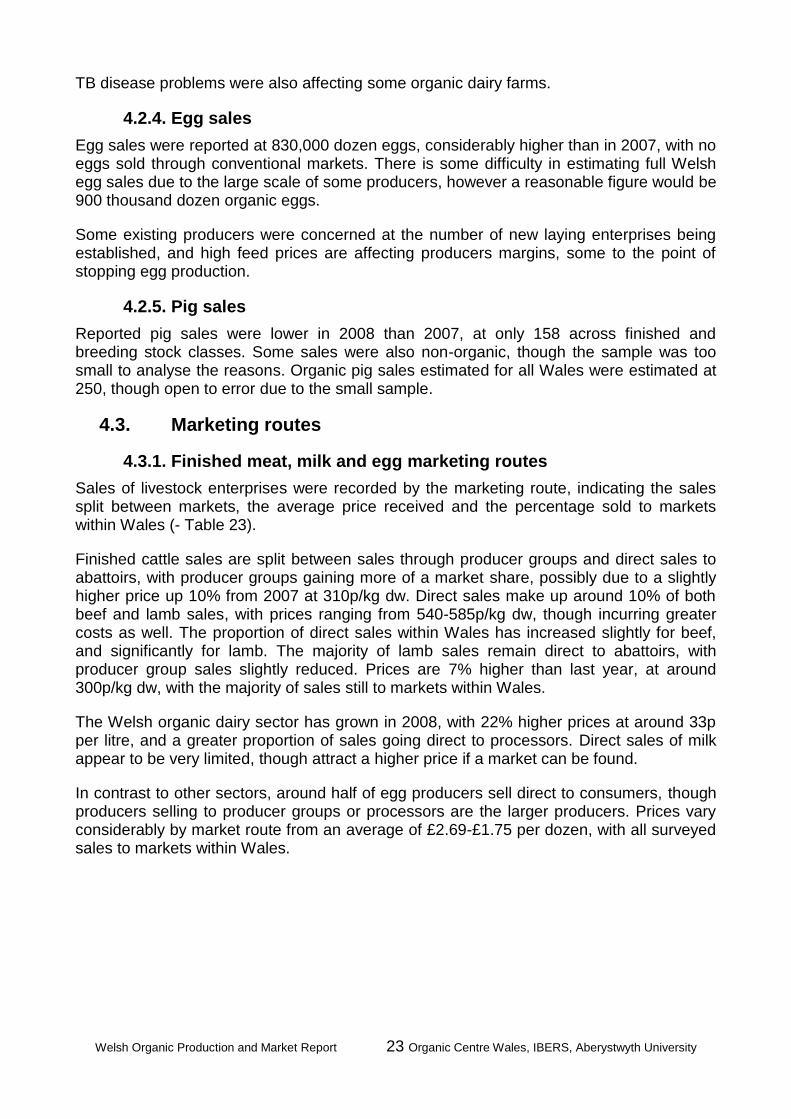
Welsh Organic Production and Market Report 23 Organic Centre Wales, IBERS, Aberystwyth University
TB disease problems were also affecting some organic dairy farms.
4.2.4. Egg sales
Egg sales were reported at 830,000 dozen eggs, considerably higher than in 2007, with no eggs sold through conventional markets. There is some difficulty in estimating full Welsh egg sales due to the large scale of some producers, however a reasonable figure would be 900 thousand dozen organic eggs.
Some existing producers were concerned at the number of new laying enterprises being established, and high feed prices are affecting producers margins, some to the point of stopping egg production.
4.2.5. Pig sales
Reported pig sales were lower in 2008 than 2007, at only 158 across finished and breeding stock classes. Some sales were also non-organic, though the sample was too small to analyse the reasons. Organic pig sales estimated for all Wales were estimated at 250, though open to error due to the small sample.
4.3. Marketing routes
4.3.1. Finished meat, milk and egg marketing routes
Sales of livestock enterprises were recorded by the marketing route, indicating the sales split between markets, the average price received and the percentage sold to markets within Wales (- Table 23).
Finished cattle sales are split between sales through producer groups and direct sales to abattoirs, with producer groups gaining more of a market share, possibly due to a slightly higher price up 10% from 2007 at 310p/kg dw. Direct sales make up around 10% of both beef and lamb sales, with prices ranging from 540-585p/kg dw, though incurring greater costs as well. The proportion of direct sales within Wales has increased slightly for beef, and significantly for lamb. The majority of lamb sales remain direct to abattoirs, with producer group sales slightly reduced. Prices are 7% higher than last year, at around 300p/kg dw, with the majority of sales still to markets within Wales.
The Welsh organic dairy sector has grown in 2008, with 22% higher prices at around 33p per litre, and a greater proportion of sales going direct to processors. Direct sales of milk appear to be very limited, though attract a higher price if a market can be found.
In contrast to other sectors, around half of egg producers sell direct to consumers, though producers selling to producer groups or processors are the larger producers. Prices vary considerably by market route from an average of £2.69-£1.75 per dozen, with all surveyed sales to markets within Wales.
Welsh Organic Production and Market Report 24 Organic Centre Wales, IBERS, Aberystwyth University
Table 23 Organic finished meat, milk and egg sales by market route
2007 2007 2007
Finished cattle n % % n p/kg dw p/kg dw n % %
Producer Group 47 38% 31% 45 310 283 33 97% 96%
Direct to Abattoir 56 47% 54% 55 305 286 22 93% 89%
Direct sales 18 10% 11% 18 541 629 15 79% 72%
Other sales 6 5% 5% 5 293 273 2 75% 96%
Finished lamb n % % n p/kg dw p/kg dw n % %
Producer Group 46 27.5% 31% 39 301 280 35 100% 97%
Direct to Abattoir 95 56.0% 54% 88 297 280 78 99% 99%
Direct sales 22 10.1% 10% 21 585 568 17 79% 49%
Other sales 14 6.4% 5% 4 355 263 10 85% 97%
Milk sales n % % n ppl ppl n % %
Producer Group 50 77% 83% 49 32.6 26.9 33 94% 92%
Direct to Processor 15 22% 8% 15 33.5 26.9 4 100% 0%
Direct sales 0 0% 6% 0 0.0 43.2 0 0% 98%
Other sales 2 0% 2% 2 44.5 25.5 1 100% 100%
Eggs n % % n p/dozen p/dozen n % %
Producer Group 4 17% 16% 3 175 154 1 100% 100%
Direct to Processor 4 15% 14% 3 190 198 1 100% 100%
Direct sales 13 47% 54% 10 269 258 8 100% 100%
Other sales 6 21% 16% 5 234 221 5 100% 100%
20082008
Marketing routes
2008
Average price Sold within Wales
4.3.2. Store livestock marketing routes
The Welsh organic store market is small in comparison to finished livestock sales, but provides producers with an opportunity to adjust stock levels as necessary, and comprises sales of around 2500 cattle and 7000 lambs. Table 24 shows that over half of store cattle sales are direct to another producer, achieving a slightly higher average price than the 44% sold via a livestock market, with the reminder sold via an agent or a producer group. Store cattle prices have risen further than finished prices, by an average of 20% to around £566 per head, as a result of increased demand from cattle buyers, organic and conventional.
The majority of organic store lambs are sold through livestock markets, achieving a slightly lower average price (£28 per head), than selling direct to another producer. Store lamb prices are almost identical to 2007 levels, with a greater proportion sold into conventional markets, supported by higher conventional prices.
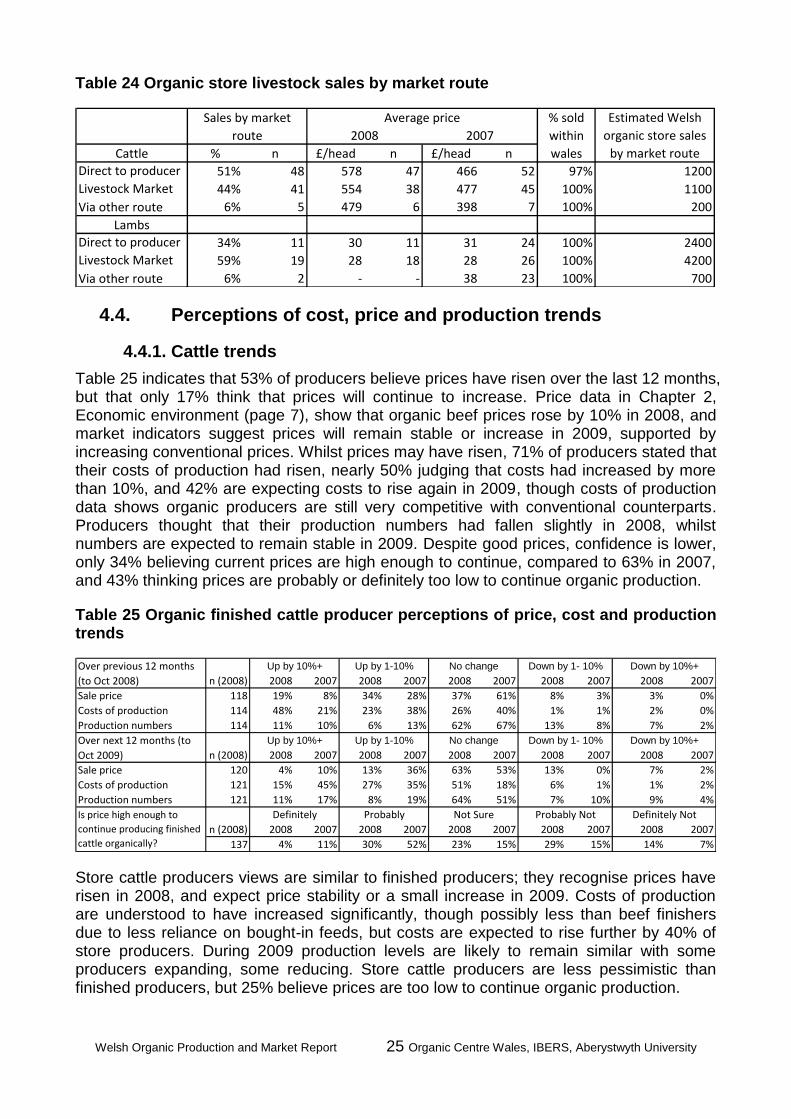
Welsh Organic Production and Market Report 25 Organic Centre Wales, IBERS, Aberystwyth University
Table 24 Organic store livestock sales by market route
% n £/head n £/head n
51% 48 578 47 466 52 97%
44% 41 554 38 477 45 100%
6% 5 479 6 398 7 100%
34% 11 30 11 31 24 100%
59% 19 28 18 28 26 100%
6% 2 - - 38 23 100%
% sold
within
wales
2400
Via other route
1100
200
Livestock Market
Via other route
Sales by market
route
Lambs
Direct to producer
700
4200
1200
Estimated Welsh
organic store sales
by market route
Average price
2008
Cattle
Direct to producer
Livestock Market
2007
4.4. Perceptions of cost, price and production trends
4.4.1. Cattle trends
Table 25 indicates that 53% of producers believe prices have risen over the last 12 months, but that only 17% think that prices will continue to increase. Price data in Chapter 2, Economic environment (page 7), show that organic beef prices rose by 10% in 2008, and market indicators suggest prices will remain stable or increase in 2009, supported by increasing conventional prices. Whilst prices may have risen, 71% of producers stated that their costs of production had risen, nearly 50% judging that costs had increased by more than 10%, and 42% are expecting costs to rise again in 2009, though costs of production data shows organic producers are still very competitive with conventional counterparts. Producers thought that their production numbers had fallen slightly in 2008, whilst numbers are expected to remain stable in 2009. Despite good prices, confidence is lower, only 34% believing current prices are high enough to continue, compared to 63% in 2007, and 43% thinking prices are probably or definitely too low to continue organic production.
Table 25 Organic finished cattle producer perceptions of price, cost and production trends
n (2008) 2008 2007 2008 2007 2008 2007 2008 2007 2008 2007
118 19% 8% 34% 28% 37% 61% 8% 3% 3% 0%
114 48% 21% 23% 38% 26% 40% 1% 1% 2% 0%
114 11% 10% 6% 13% 62% 67% 13% 8% 7% 2%
n (2008) 2008 2007 2008 2007 2008 2007 2008 2007 2008 2007
120 4% 10% 13% 36% 63% 53% 13% 0% 7% 2%
121 15% 45% 27% 35% 51% 18% 6% 1% 1% 2%
121 11% 17% 8% 19% 64% 51% 7% 10% 9% 4%
n (2008) 2008 2007 2008 2007 2008 2007 2008 2007 2008 2007
137 4% 11% 30% 52% 23% 15% 29% 15% 14% 7%
Up by 10%+
Up by 10%+
Production numbers
Sale price
Costs of production
Over next 12 months (to
Oct 2009)
Over previous 12 months
(to Oct 2008)
Is price high enough to
continue producing finished
cattle organically?
Probably Not Sure Probably NotDefinitely
Sale price
Down by 1- 10%
Up by 1-10% No change
Up by 1-10% Down by 10%+
Definitely Not
No change
Down by 10%+Down by 1- 10%
Costs of production
Production numbers
Store cattle producers views are similar to finished producers; they recognise prices have risen in 2008, and expect price stability or a small increase in 2009. Costs of production are understood to have increased significantly, though possibly less than beef finishers due to less reliance on bought-in feeds, but costs are expected to rise further by 40% of store producers. During 2009 production levels are likely to remain similar with some producers expanding, some reducing. Store cattle producers are less pessimistic than finished producers, but 25% believe prices are too low to continue organic production.
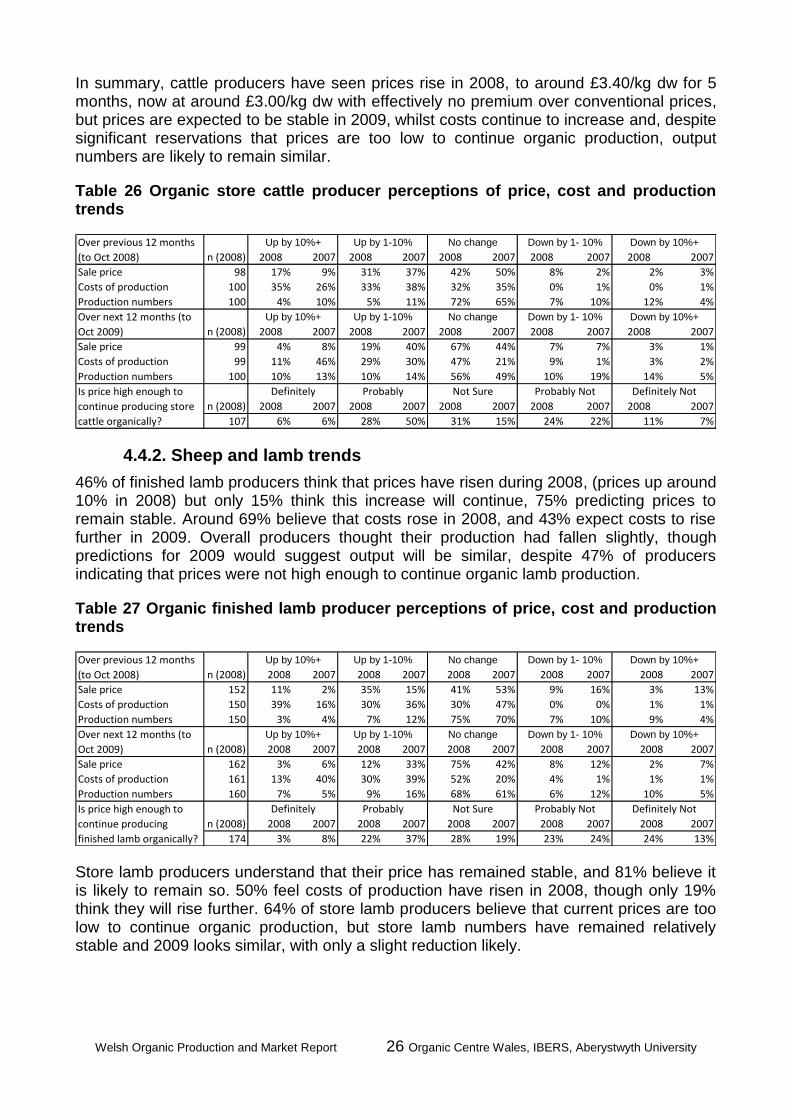
Welsh Organic Production and Market Report 26 Organic Centre Wales, IBERS, Aberystwyth University
In summary, cattle producers have seen prices rise in 2008, to around £3.40/kg dw for 5 months, now at around £3.00/kg dw with effectively no premium over conventional prices, but prices are expected to be stable in 2009, whilst costs continue to increase and, despite significant reservations that prices are too low to continue organic production, output numbers are likely to remain similar.
Table 26 Organic store cattle producer perceptions of price, cost and production trends
n (2008) 2008 2007 2008 2007 2008 2007 2008 2007 2008 2007
98 17% 9% 31% 37% 42% 50% 8% 2% 2% 3%
100 35% 26% 33% 38% 32% 35% 0% 1% 0% 1%
100 4% 10% 5% 11% 72% 65% 7% 10% 12% 4%
n (2008) 2008 2007 2008 2007 2008 2007 2008 2007 2008 2007
99 4% 8% 19% 40% 67% 44% 7% 7% 3% 1%
99 11% 46% 29% 30% 47% 21% 9% 1% 3% 2%
100 10% 13% 10% 14% 56% 49% 10% 19% 14% 5%
n (2008) 2008 2007 2008 2007 2008 2007 2008 2007 2008 2007
107 6% 6% 28% 50% 31% 15% 24% 22% 11% 7%
Up by 10%+
Up by 10%+
Costs of production
Production numbers
Down by 1- 10%
Down by 10%+
Down by 10%+
Probably Not Sure Probably Not Definitely NotIs price high enough to
continue producing store
cattle organically?
Up by 1-10% No change Down by 1- 10%Over next 12 months (to
Oct 2009)
Production numbers
Sale price
Costs of production
Sale price
Over previous 12 months
(to Oct 2008)
Definitely
Up by 1-10% No change
4.4.2. Sheep and lamb trends
46% of finished lamb producers think that prices have risen during 2008, (prices up around 10% in 2008) but only 15% think this increase will continue, 75% predicting prices to remain stable. Around 69% believe that costs rose in 2008, and 43% expect costs to rise further in 2009. Overall producers thought their production had fallen slightly, though predictions for 2009 would suggest output will be similar, despite 47% of producers indicating that prices were not high enough to continue organic lamb production.
Table 27 Organic finished lamb producer perceptions of price, cost and production trends
n (2008) 2008 2007 2008 2007 2008 2007 2008 2007 2008 2007
152 11% 2% 35% 15% 41% 53% 9% 16% 3% 13%
150 39% 16% 30% 36% 30% 47% 0% 0% 1% 1%
150 3% 4% 7% 12% 75% 70% 7% 10% 9% 4%
n (2008) 2008 2007 2008 2007 2008 2007 2008 2007 2008 2007
162 3% 6% 12% 33% 75% 42% 8% 12% 2% 7%
161 13% 40% 30% 39% 52% 20% 4% 1% 1% 1%
160 7% 5% 9% 16% 68% 61% 6% 12% 10% 5%
n (2008) 2008 2007 2008 2007 2008 2007 2008 2007 2008 2007
174 3% 8% 22% 37% 28% 19% 23% 24% 24% 13%
Definitely
Down by 1- 10% Down by 10%+
Probably Not Definitely Not
Sale price
Costs of production
Production numbers
Over next 12 months (to
Oct 2009)
Up by 1-10% No changeUp by 10%+
Over previous 12 months
(to Oct 2008)
Up by 1-10% No change Down by 1- 10% Down by 10%+Up by 10%+
Is price high enough to
continue producing
finished lamb organically?
Probably Not Sure
Costs of production
Production numbers
Sale price
Store lamb producers understand that their price has remained stable, and 81% believe it is likely to remain so. 50% feel costs of production have risen in 2008, though only 19% think they will rise further. 64% of store lamb producers believe that current prices are too low to continue organic production, but store lamb numbers have remained relatively stable and 2009 looks similar, with only a slight reduction likely.
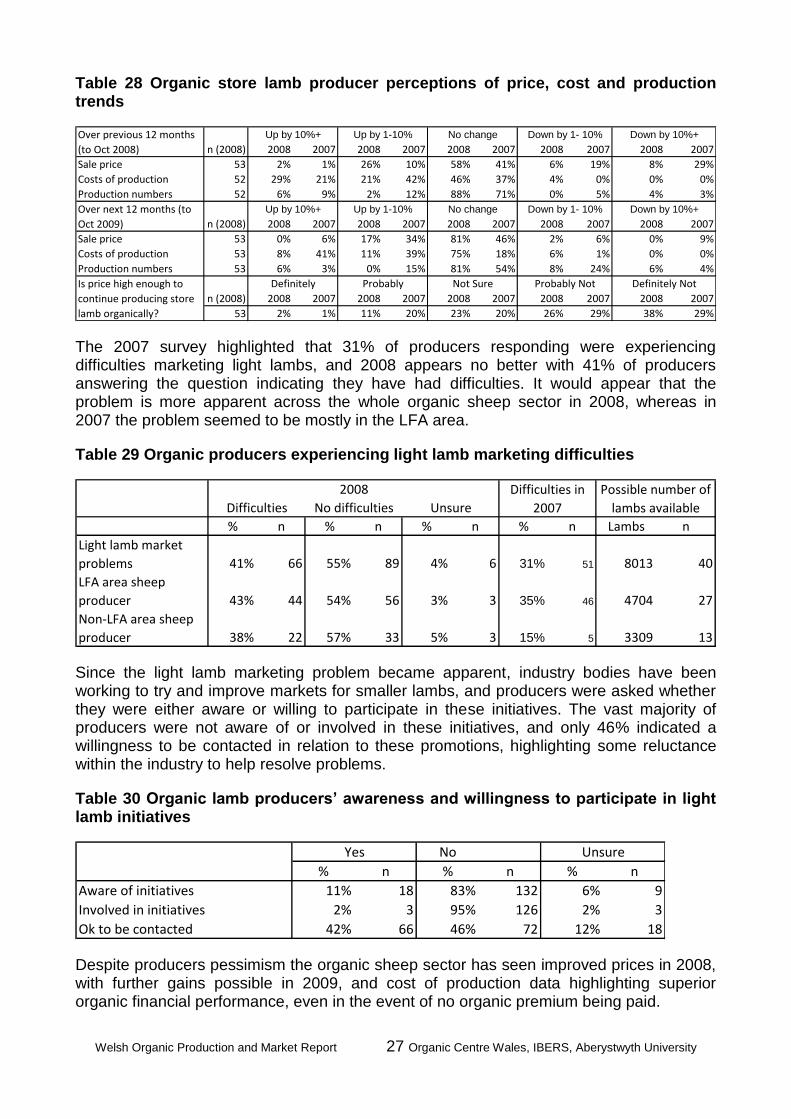
Welsh Organic Production and Market Report 27 Organic Centre Wales, IBERS, Aberystwyth University
Table 28 Organic store lamb producer perceptions of price, cost and production trends
n (2008) 2008 2007 2008 2007 2008 2007 2008 2007 2008 2007
53 2% 1% 26% 10% 58% 41% 6% 19% 8% 29%
52 29% 21% 21% 42% 46% 37% 4% 0% 0% 0%
52 6% 9% 2% 12% 88% 71% 0% 5% 4% 3%
n (2008) 2008 2007 2008 2007 2008 2007 2008 2007 2008 2007
53 0% 6% 17% 34% 81% 46% 2% 6% 0% 9%
53 8% 41% 11% 39% 75% 18% 6% 1% 0% 0%
53 6% 3% 0% 15% 81% 54% 8% 24% 6% 4%
n (2008) 2008 2007 2008 2007 2008 2007 2008 2007 2008 2007
53 2% 1% 11% 20% 23% 20% 26% 29% 38% 29%
Definitely NotDefinitely
Sale price
Costs of production
Production numbers
Is price high enough to
continue producing store
lamb organically?
Probably Not Sure
No change Down by 1- 10% Down by 10%+Up by 10%+
Probably Not
Over previous 12 months
(to Oct 2008)
Up by 1-10% No change Down by 1- 10% Down by 10%+Up by 10%+
Up by 1-10%
Production numbers
Over next 12 months (to
Oct 2009)
Sale price
Costs of production
The 2007 survey highlighted that 31% of producers responding were experiencing difficulties marketing light lambs, and 2008 appears no better with 41% of producers answering the question indicating they have had difficulties. It would appear that the problem is more apparent across the whole organic sheep sector in 2008, whereas in 2007 the problem seemed to be mostly in the LFA area.
Table 29 Organic producers experiencing light lamb marketing difficulties
% n % n % n % n Lambs n
41% 66 55% 89 4% 6 31% 51 8013 40
43% 44 54% 56 3% 3 35% 46 4704 27
38% 22 57% 33 5% 3 15% 5 3309 13
No difficulties
Light lamb market
problems
2008 Difficulties in
2007
LFA area sheep
producer
Non-LFA area sheep
producer
Possible number of
lambs availableUnsureDifficulties
Since the light lamb marketing problem became apparent, industry bodies have been working to try and improve markets for smaller lambs, and producers were asked whether they were either aware or willing to participate in these initiatives. The vast majority of producers were not aware of or involved in these initiatives, and only 46% indicated a willingness to be contacted in relation to these promotions, highlighting some reluctance within the industry to help resolve problems.
Table 30 Organic lamb producers’ awareness and willingness to participate in light lamb initiatives
No
% n % n % n
11% 18 83% 132 6% 9
2% 3 95% 126 2% 3
42% 66 46% 72 12% 18Ok to be contacted
Unsure
Aware of initiatives
Involved in initiatives
Yes
Despite producers pessimism the organic sheep sector has seen improved prices in 2008, with further gains possible in 2009, and cost of production data highlighting superior organic financial performance, even in the event of no organic premium being paid.
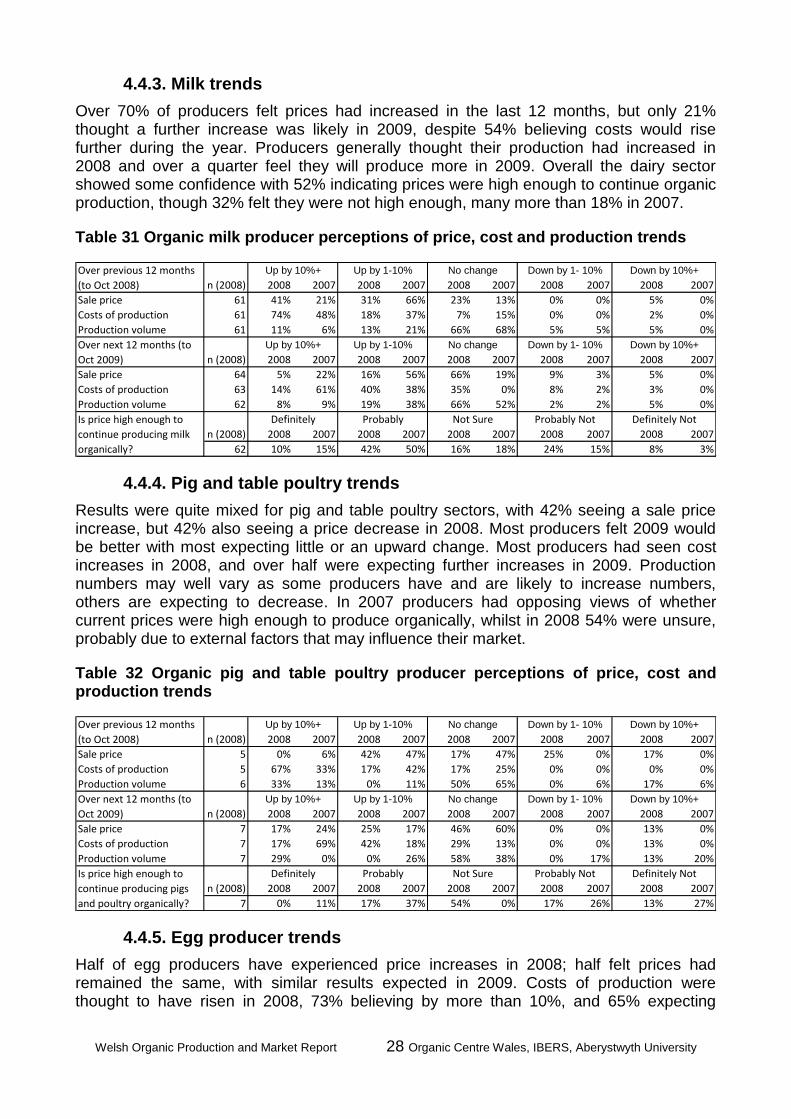
Welsh Organic Production and Market Report 28 Organic Centre Wales, IBERS, Aberystwyth University
4.4.3. Milk trends
Over 70% of producers felt prices had increased in the last 12 months, but only 21% thought a further increase was likely in 2009, despite 54% believing costs would rise further during the year. Producers generally thought their production had increased in 2008 and over a quarter feel they will produce more in 2009. Overall the dairy sector showed some confidence with 52% indicating prices were high enough to continue organic production, though 32% felt they were not high enough, many more than 18% in 2007.
Table 31 Organic milk producer perceptions of price, cost and production trends
n (2008) 2008 2007 2008 2007 2008 2007 2008 2007 2008 2007
61 41% 21% 31% 66% 23% 13% 0% 0% 5% 0%
61 74% 48% 18% 37% 7% 15% 0% 0% 2% 0%
61 11% 6% 13% 21% 66% 68% 5% 5% 5% 0%
n (2008) 2008 2007 2008 2007 2008 2007 2008 2007 2008 2007
64 5% 22% 16% 56% 66% 19% 9% 3% 5% 0%
63 14% 61% 40% 38% 35% 0% 8% 2% 3% 0%
62 8% 9% 19% 38% 66% 52% 2% 2% 5% 0%
n (2008) 2008 2007 2008 2007 2008 2007 2008 2007 2008 2007
62 10% 15% 42% 50% 16% 18% 24% 15% 8% 3%
Definitely Not
Down by 1- 10% Down by 10%+
Sale price
Costs of production
Definitely Probably Not Sure
Production volume
Is price high enough to
continue producing milk
organically?
Probably Not
Sale price
Costs of production
Production volume
Over next 12 months (to
Oct 2009)
Up by 10%+ Up by 1-10%
Up by 10%+ Up by 1-10% No change Down by 1- 10% Down by 10%+
No change
Over previous 12 months
(to Oct 2008)
4.4.4. Pig and table poultry trends
Results were quite mixed for pig and table poultry sectors, with 42% seeing a sale price increase, but 42% also seeing a price decrease in 2008. Most producers felt 2009 would be better with most expecting little or an upward change. Most producers had seen cost increases in 2008, and over half were expecting further increases in 2009. Production numbers may well vary as some producers have and are likely to increase numbers, others are expecting to decrease. In 2007 producers had opposing views of whether current prices were high enough to produce organically, whilst in 2008 54% were unsure, probably due to external factors that may influence their market.
Table 32 Organic pig and table poultry producer perceptions of price, cost and production trends
n (2008) 2008 2007 2008 2007 2008 2007 2008 2007 2008 2007
5 0% 6% 42% 47% 17% 47% 25% 0% 17% 0%
5 67% 33% 17% 42% 17% 25% 0% 0% 0% 0%
6 33% 13% 0% 11% 50% 65% 0% 6% 17% 6%
n (2008) 2008 2007 2008 2007 2008 2007 2008 2007 2008 2007
7 17% 24% 25% 17% 46% 60% 0% 0% 13% 0%
7 17% 69% 42% 18% 29% 13% 0% 0% 13% 0%
7 29% 0% 0% 26% 58% 38% 0% 17% 13% 20%
n (2008) 2008 2007 2008 2007 2008 2007 2008 2007 2008 2007
7 0% 11% 17% 37% 54% 0% 17% 26% 13% 27%
Definitely Not
Sale price
Costs of production
Down by 10%+
Definitely Probably
Costs of production
Not Sure Probably Not
Production volume
Over next 12 months (to
Oct 2009)
Up by 10%+ Up by 1-10%
Production volume
Is price high enough to
continue producing pigs
and poultry organically?
Up by 10%+ Up by 1-10% No change Down by 1- 10%
Sale price
No change Down by 1- 10% Down by 10%+
Over previous 12 months
(to Oct 2008)
4.4.5. Egg producer trends
Half of egg producers have experienced price increases in 2008; half felt prices had remained the same, with similar results expected in 2009. Costs of production were thought to have risen in 2008, 73% believing by more than 10%, and 65% expecting
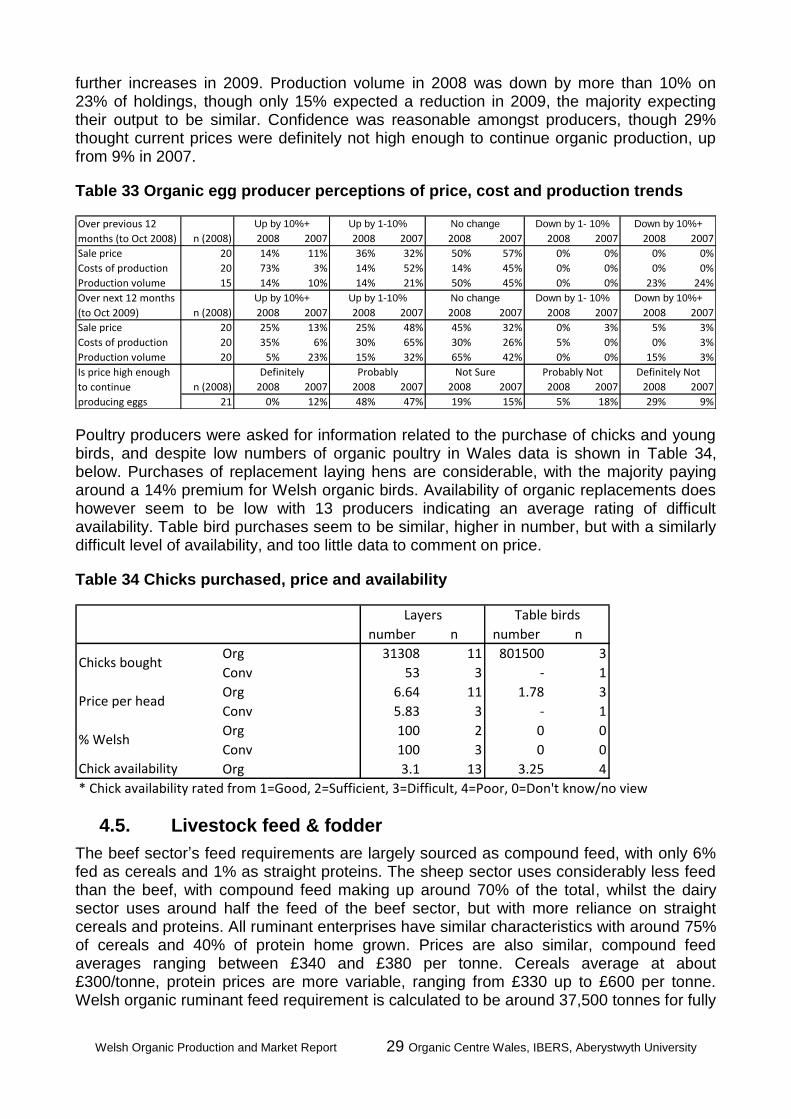
Welsh Organic Production and Market Report 29 Organic Centre Wales, IBERS, Aberystwyth University
further increases in 2009. Production volume in 2008 was down by more than 10% on 23% of holdings, though only 15% expected a reduction in 2009, the majority expecting their output to be similar. Confidence was reasonable amongst producers, though 29% thought current prices were definitely not high enough to continue organic production, up from 9% in 2007.
Table 33 Organic egg producer perceptions of price, cost and production trends
n (2008) 2008 2007 2008 2007 2008 2007 2008 2007 2008 2007
20 14% 11% 36% 32% 50% 57% 0% 0% 0% 0%
20 73% 3% 14% 52% 14% 45% 0% 0% 0% 0%
15 14% 10% 14% 21% 50% 45% 0% 0% 23% 24%
n (2008) 2008 2007 2008 2007 2008 2007 2008 2007 2008 2007
20 25% 13% 25% 48% 45% 32% 0% 3% 5% 3%
20 35% 6% 30% 65% 30% 26% 5% 0% 0% 3%
20 5% 23% 15% 32% 65% 42% 0% 0% 15% 3%
n (2008) 2008 2007 2008 2007 2008 2007 2008 2007 2008 2007
21 0% 12% 48% 47% 19% 15% 5% 18% 29% 9%
Over previous 12
months (to Oct 2008)
Up by 10%+ Up by 1-10% No change Down by 1- 10% Down by 10%+
Sale price
Costs of production
Production volume
Over next 12 months
(to Oct 2009)
Up by 10%+ Up by 1-10% No change Down by 1- 10% Down by 10%+
Sale price
Costs of production
Production volume
Is price high enough
to continue
producing eggs
Definitely Probably Not Sure Probably Not Definitely Not
Poultry producers were asked for information related to the purchase of chicks and young birds, and despite low numbers of organic poultry in Wales data is shown in Table 34, below. Purchases of replacement laying hens are considerable, with the majority paying around a 14% premium for Welsh organic birds. Availability of organic replacements does however seem to be low with 13 producers indicating an average rating of difficult availability. Table bird purchases seem to be similar, higher in number, but with a similarly difficult level of availability, and too little data to comment on price.
Table 34 Chicks purchased, price and availability
number n number n
31308 11 801500 3
53 3 - 1
6.64 11 1.78 3
5.83 3 - 1
100 2 0 0
100 3 0 0
3.1 13 3.25 4
* Chick availability rated from 1=Good, 2=Sufficient, 3=Difficult, 4=Poor, 0=Don't know/no view
% Welsh
Chick availability
Layers Table birds
Chicks bought
Price per head
Org
Conv
Org
Org
Conv
Conv
Org
4.5. Livestock feed & fodder
The beef sector’s feed requirements are largely sourced as compound feed, with only 6% fed as cereals and 1% as straight proteins. The sheep sector uses considerably less feed than the beef, with compound feed making up around 70% of the total, whilst the dairy sector uses around half the feed of the beef sector, but with more reliance on straight cereals and proteins. All ruminant enterprises have similar characteristics with around 75% of cereals and 40% of protein home grown. Prices are also similar, compound feed averages ranging between £340 and £380 per tonne. Cereals average at about £300/tonne, protein prices are more variable, ranging from £330 up to £600 per tonne. Welsh organic ruminant feed requirement is calculated to be around 37,500 tonnes for fully
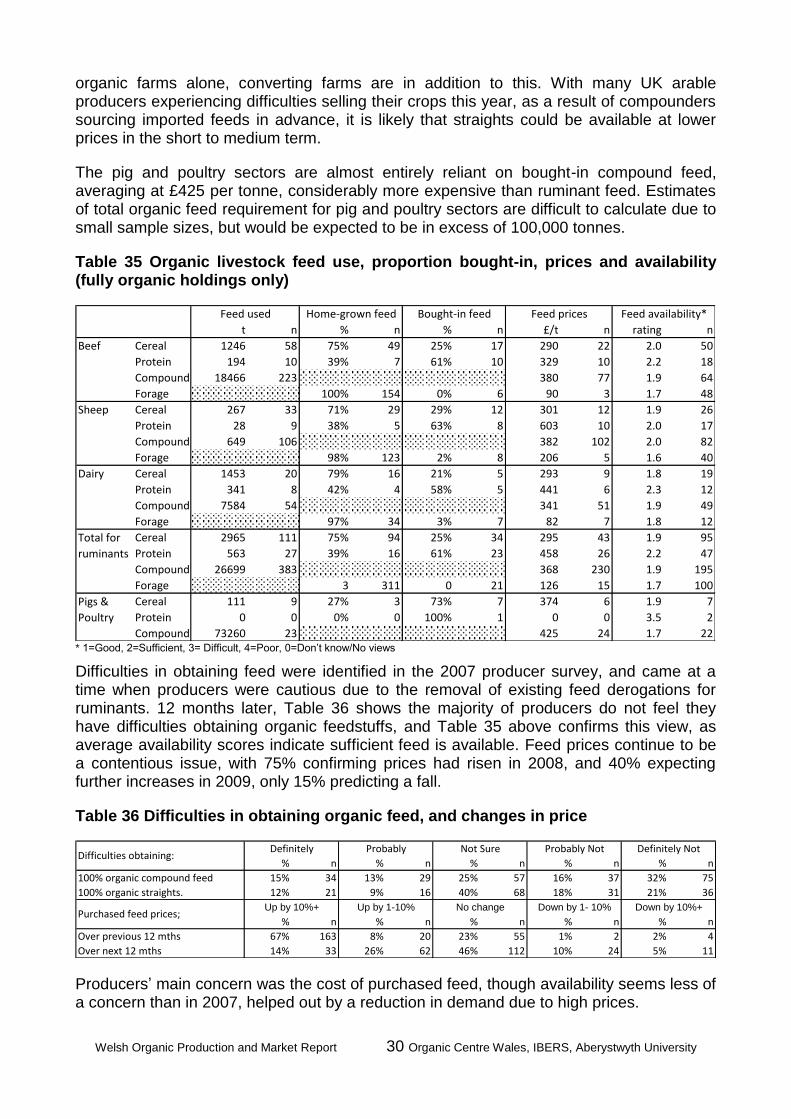
Welsh Organic Production and Market Report 30 Organic Centre Wales, IBERS, Aberystwyth University
organic farms alone, converting farms are in addition to this. With many UK arable producers experiencing difficulties selling their crops this year, as a result of compounders sourcing imported feeds in advance, it is likely that straights could be available at lower prices in the short to medium term.
The pig and poultry sectors are almost entirely reliant on bought-in compound feed, averaging at £425 per tonne, considerably more expensive than ruminant feed. Estimates of total organic feed requirement for pig and poultry sectors are difficult to calculate due to small sample sizes, but would be expected to be in excess of 100,000 tonnes.
Table 35 Organic livestock feed use, proportion bought-in, prices and availability (fully organic holdings only)
t n % n % n £/t n rating n
Beef Cereal 1246 58 75% 49 25% 17 290 22 2.0 50
Protein 194 10 39% 7 61% 10 329 10 2.2 18
Compound 18466 223 380 77 1.9 64
Forage 100% 154 0% 6 90 3 1.7 48
Sheep Cereal 267 33 71% 29 29% 12 301 12 1.9 26
Protein 28 9 38% 5 63% 8 603 10 2.0 17
Compound 649 106 382 102 2.0 82
Forage 98% 123 2% 8 206 5 1.6 40
Dairy Cereal 1453 20 79% 16 21% 5 293 9 1.8 19
Protein 341 8 42% 4 58% 5 441 6 2.3 12
Compound 7584 54 341 51 1.9 49
Forage 97% 34 3% 7 82 7 1.8 12
Cereal 2965 111 75% 94 25% 34 295 43 1.9 95
Protein 563 27 39% 16 61% 23 458 26 2.2 47
Compound 26699 383 368 230 1.9 195
Forage 3 311 0 21 126 15 1.7 100
Cereal 111 9 27% 3 73% 7 374 6 1.9 7
Protein 0 0 0% 0 100% 1 0 0 3.5 2
Compound 73260 23 425 24 1.7 22
Pigs &
Poultry
Total for
ruminants
Feed availability*Feed used Feed pricesHome-grown feed Bought-in feed
* 1=Good, 2=Sufficient, 3= Difficult, 4=Poor, 0=Don’t know/No views
Difficulties in obtaining feed were identified in the 2007 producer survey, and came at a time when producers were cautious due to the removal of existing feed derogations for ruminants. 12 months later, Table 36 shows the majority of producers do not feel they have difficulties obtaining organic feedstuffs, and Table 35 above confirms this view, as average availability scores indicate sufficient feed is available. Feed prices continue to be a contentious issue, with 75% confirming prices had risen in 2008, and 40% expecting further increases in 2009, only 15% predicting a fall.
Table 36 Difficulties in obtaining organic feed, and changes in price
% n % n % n % n % n
100% organic compound feed 15% 34 13% 29 25% 57 16% 37 32% 75
100% organic straights. 12% 21 9% 16 40% 68 18% 31 21% 36
% n % n % n % n % n
Over previous 12 mths 67% 163 8% 20 23% 55 1% 2 2% 4
Over next 12 mths 14% 33 26% 62 46% 112 10% 24 5% 11
Difficulties obtaining:
Purchased feed prices;
Probably NotNot Sure
Up by 10%+ Up by 1-10% No change
Definitely Not
Down by 1- 10% Down by 10%+
Definitely Probably
Producers’ main concern was the cost of purchased feed, though availability seems less of a concern than in 2007, helped out by a reduction in demand due to high prices.
Welsh Organic Production and Market Report 31 Organic Centre Wales, IBERS, Aberystwyth University
4.6. Costs of production for milk, beef and lamb
Benchmarking data collected for 38 Welsh organic farms by the Welsh Farm Business Survey based at IBERS, Aberystwyth University, show that Welsh organic farms were generally producing better returns than conventional farms in 2007/8, before the credit crunch started to impact on the organic market. Organic output was higher or similar in all cases, with lower or similar variable costs. Where organic yields per ha were lower, overhead costs per kg were higher, as were the value of own resources used and support payments. Despite this, overall net returns per litre or kg were higher, although this does not necessarily translate to better per ha performance.
The net margin for organic milk at 9.4 pence per litre (ppl) was significantly higher than that for conventional at 5.6ppl. Organic production costs were higher at 18.9ppl, compared with 16.2 ppl for conventional, but the higher costs were more than offset by higher organic output (30%). Organic output was higher in 2008, increasing by 24% in 12 months, with very similar costs, while conventional prices rose by only 19%, and costs went up by 14%. Milk yields were similar, though organic milk commanded a considerably higher price, and whilst organic feed costs were slightly higher, other variable costs were similar. Sensitivity analysis shows that if conventional prices were paid for organic milk, organic farms would be at a disadvantage, and whilst this unlikely to happen in the short term, producers need to bear in mind that organic farms have higher costs, and look at ways to reduce them, to remain competitive.
Organic finished beef production in 2007/08 showed a considerable improvement, with a net margin of 4p/kg DW compared with -38p/kg for conventional beef. Variable costs were almost identical, higher organic overheads per kg (mainly due to lower yield per ha), more than offset by the greater output value. Net margin for organic breeding beef at -118p/kg LW was lower than conventional beef at -69p/kg, mainly due to lower output per hectare. Organic variable costs were lower than conventional, as was output, but organic fixed costs were higher per kilogram. When support payments were included in the net margin however there was little difference between the two systems, with organic at 47p/kg and conventional at 57p/kg.
Both organic and conventional lamb net margins were negative, at -44p/kg DW and -71p/kg DW respectively. Organic output was higher as a result of higher prices, while variable costs were lower and overheads higher. The organic net margin including support payments was 77p/kg or £200/ha, while conventional remained negative at -43p/kg or £-110/ha.
During 2008 the price differential between organic and conventional meat has contracted, to a point where the organic premium for beef has almost evaporated, and for lamb is considerable reduced from a year previously (see market information, page 7). Lower differentials between organic and conventional prices mean it is likely that this relatively favourable picture may look less good in 2008/9.
To understand the possible affects of similar prices, the last row of Table 37 and Table 38 show the net margins if produce was sold at conventional prices, and highlights that although margins are reduced they are likely to remain superior or at least similar to conventional margins. It does however highlight the need for organic producers to be aware of their costs of production, and reduce them where possible. Purchased feed remains the largest cost, and could possibly be reduced through better use of forage, or by growing alternative feeds, to replace purchased concentrates.
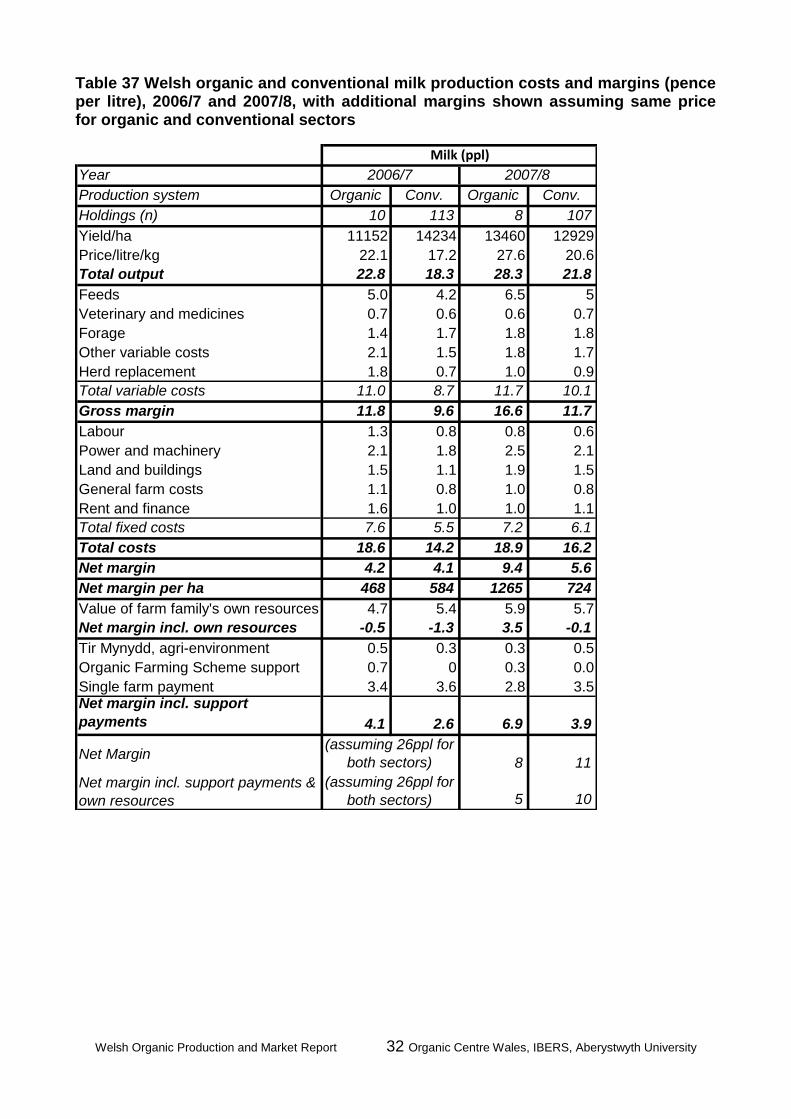
Welsh Organic Production and Market Report 32 Organic Centre Wales, IBERS, Aberystwyth University
Table 37 Welsh organic and conventional milk production costs and margins (pence per litre), 2006/7 and 2007/8, with additional margins shown assuming same price for organic and conventional sectors
Year
Production system Organic Conv. Organic Conv.
Holdings (n) 10 113 8 107
Yield/ha 11152 14234 13460 12929
Price/litre/kg 22.1 17.2 27.6 20.6
Total output 22.8 18.3 28.3 21.8
Feeds 5.0 4.2 6.5 5
Veterinary and medicines 0.7 0.6 0.6 0.7
Forage 1.4 1.7 1.8 1.8
Other variable costs 2.1 1.5 1.8 1.7
Herd replacement 1.8 0.7 1.0 0.9
Total variable costs 11.0 8.7 11.7 10.1
Gross margin 11.8 9.6 16.6 11.7
Labour 1.3 0.8 0.8 0.6
Power and machinery 2.1 1.8 2.5 2.1
Land and buildings 1.5 1.1 1.9 1.5
General farm costs 1.1 0.8 1.0 0.8
Rent and finance 1.6 1.0 1.0 1.1
Total fixed costs 7.6 5.5 7.2 6.1
Total costs 18.6 14.2 18.9 16.2
Net margin 4.2 4.1 9.4 5.6
Net margin per ha 468 584 1265 724
Value of farm family's own resources 4.7 5.4 5.9 5.7
Net margin incl. own resources -0.5 -1.3 3.5 -0.1
Tir Mynydd, agri-environment 0.5 0.3 0.3 0.5
Organic Farming Scheme support 0.7 0 0.3 0.0
Single farm payment 3.4 3.6 2.8 3.5Net margin incl. support
payments 4.1 2.6 6.9 3.9
Net Margin8 11
Net margin incl. support payments &
own resources 5 10
Milk (ppl)
2006/7 2007/8
(assuming 26ppl for
both sectors)
(assuming 26ppl for
both sectors)
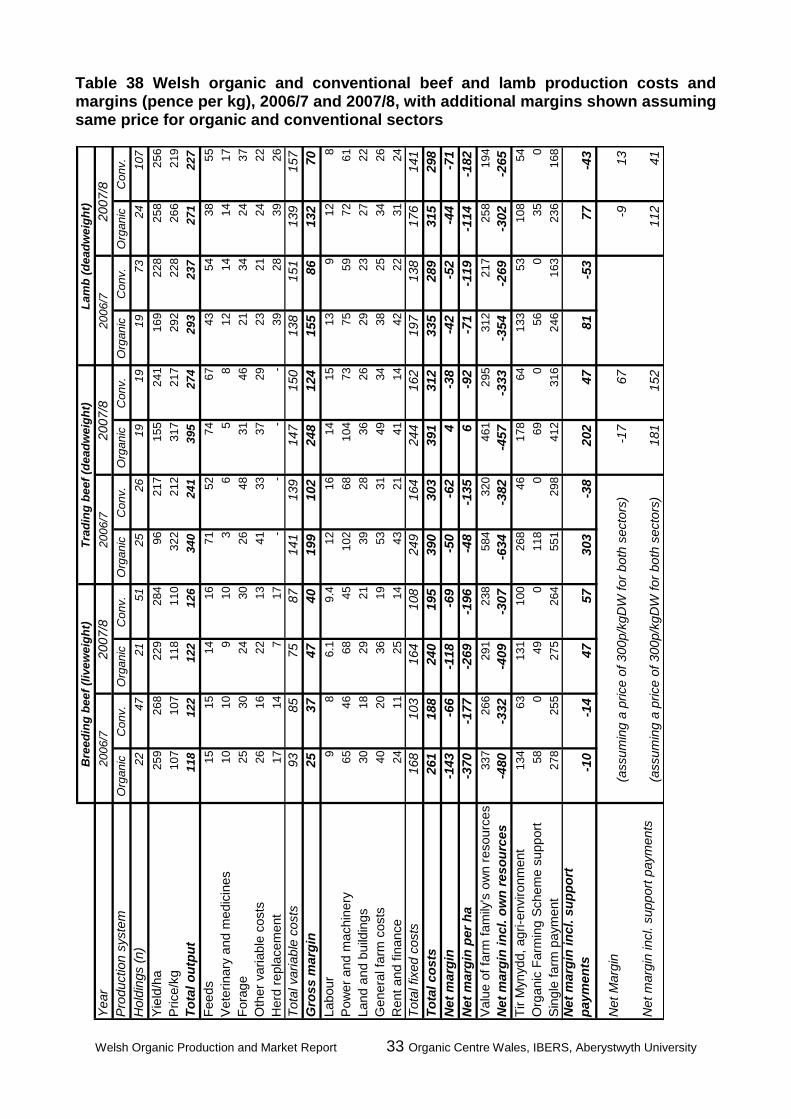
Welsh Organic Production and Market Report 33 Organic Centre Wales, IBERS, Aberystwyth University
Table 38 Welsh organic and conventional beef and lamb production costs and margins (pence per kg), 2006/7 and 2007/8, with additional margins shown assuming same price for organic and conventional sectors
Year
Pro
duction s
yste
mO
rganic
Conv.
Org
anic
Conv.
Org
anic
Conv.
Org
anic
Conv.
Org
anic
Conv.
Org
anic
Conv.
Hold
ings (
n)
22
47
21
51
25
26
19
19
19
73
24
107
Yie
ld/h
a259
268
229
284
96
217
155
241
169
228
258
256
Price/k
g107
107
118
110
322
212
317
217
292
228
266
219
To
tal
ou
tpu
t118
122
122
126
340
241
395
274
293
237
271
227
Feeds
15
15
14
16
71
52
74
67
43
54
38
55
Vete
rinary
and m
edic
ines
10
10
910
36
58
12
14
14
17
Fora
ge
25
30
24
30
26
48
31
46
21
34
24
37
Oth
er
variable
costs
26
16
22
13
41
33
37
29
23
21
24
22
Herd
repla
cem
ent
17
14
717
--
--
39
28
39
26
Tota
l variable
costs
93
85
75
87
141
139
147
150
138
151
139
157
Gro
ss m
arg
in25
37
47
40
199
102
248
124
155
86
132
70
Labour
9
86.1
9.4
12
16
14
15
13
912
8
Pow
er
and m
achin
ery
65
46
68
45
102
68
104
73
75
59
72
61
Land a
nd b
uild
ing
s
30
18
29
21
39
28
36
26
29
23
27
22
Genera
l fa
rm c
osts
40
20
36
19
53
31
49
34
38
25
34
26
Rent
and f
inance
24
11
25
14
43
21
41
14
42
22
31
24
Tota
l fixed c
osts
168
103
164
108
249
164
244
162
197
138
176
141
To
tal
co
sts
261
188
240
195
390
303
391
312
335
289
315
298
Net
marg
in-1
43
-66
-118
-69
-50
-62
4-3
8-4
2-5
2-4
4-7
1
Net
marg
in p
er
ha
-370
-177
-269
-196
-48
-135
6-9
2-7
1-1
19
-114
-182
Valu
e o
f fa
rm f
am
ily's
ow
n r
esourc
es
337
266
291
238
584
320
461
295
312
217
258
194
Net
marg
in i
ncl.
ow
n r
eso
urc
es
-480
-332
-409
-307
-634
-382
-457
-333
-354
-269
-302
-265
Tir M
ynydd,
ag
ri-e
nvironm
ent
134
63
131
100
268
46
178
64
133
53
108
54
Org
anic
Farm
ing
Schem
e s
upport
58
049
0118
069
056
035
0
Sin
gle
farm
paym
ent
278
255
275
264
551
298
412
316
246
163
236
168
Net
marg
in i
ncl.
su
pp
ort
paym
en
ts-1
0-1
447
57
303
-38
202
47
81
-53
77
-43
Net
Marg
in-1
767
-913
Net
marg
in incl. s
upport
paym
ents
181
152
112
41
Bre
ed
ing
beef
(liv
ew
eig
ht)
Tra
din
g b
eef
(dead
weig
ht)
Lam
b (
dead
weig
ht)
2006/7
2007/8
2006/7
2007/8
(assum
ing a
price o
f 300p/k
gD
W f
or
both
secto
rs)
(assum
ing a
price o
f 300p/k
gD
W f
or
both
secto
rs)
2006/7
2007/8
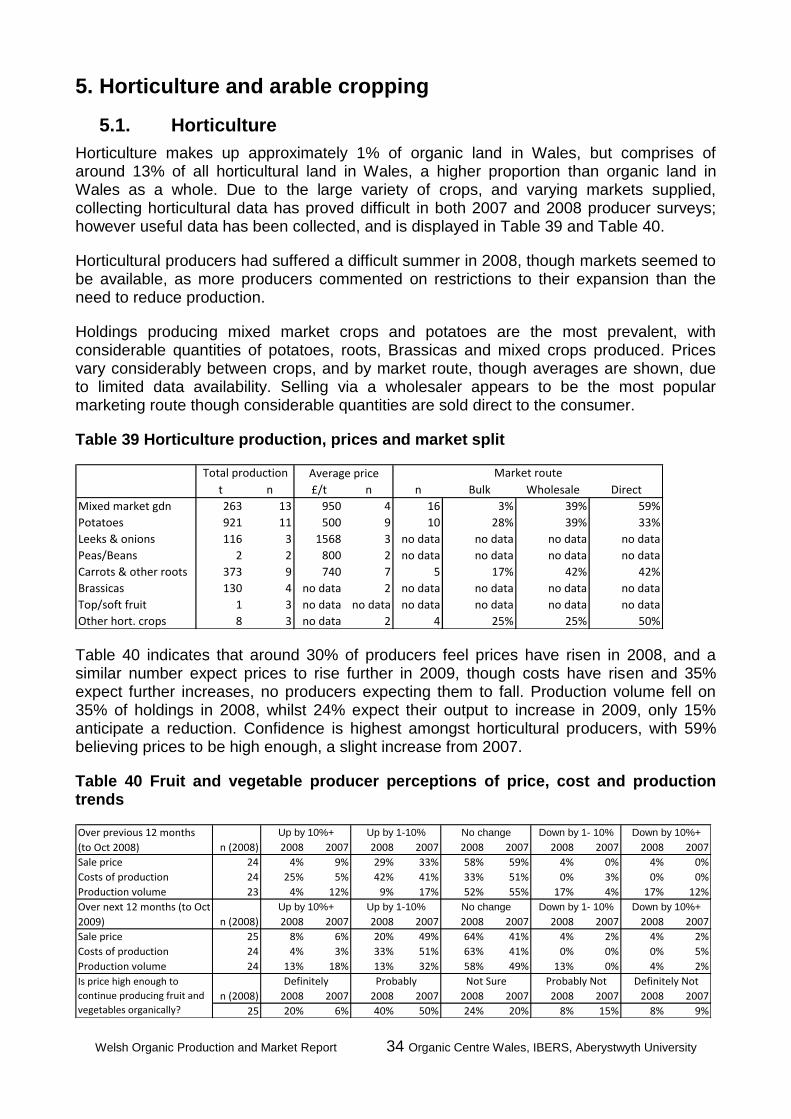
Welsh Organic Production and Market Report 34 Organic Centre Wales, IBERS, Aberystwyth University
5. Horticulture and arable cropping
5.1. Horticulture
Horticulture makes up approximately 1% of organic land in Wales, but comprises of around 13% of all horticultural land in Wales, a higher proportion than organic land in Wales as a whole. Due to the large variety of crops, and varying markets supplied, collecting horticultural data has proved difficult in both 2007 and 2008 producer surveys; however useful data has been collected, and is displayed in Table 39 and Table 40.
Horticultural producers had suffered a difficult summer in 2008, though markets seemed to be available, as more producers commented on restrictions to their expansion than the need to reduce production.
Holdings producing mixed market crops and potatoes are the most prevalent, with considerable quantities of potatoes, roots, Brassicas and mixed crops produced. Prices vary considerably between crops, and by market route, though averages are shown, due to limited data availability. Selling via a wholesaler appears to be the most popular marketing route though considerable quantities are sold direct to the consumer.
Table 39 Horticulture production, prices and market split
t n £/t n n
Mixed market gdn 263 13 950 4 16
Potatoes 921 11 500 9 10
Leeks & onions 116 3 1568 3 no data
Peas/Beans 2 2 800 2 no data
Carrots & other roots 373 9 740 7 5
Brassicas 130 4 no data 2 no data
Top/soft fruit 1 3 no data no data no data
Other hort. crops 8 3 no data 2 4
Market route
3% 39% 59%
Total production Average price
28% 39% 33%
Direct
no data
no data
no data
no data
no data
no data
17% 42% 42%
Bulk Wholesale
no data
no data
25% 25%
no data
no data
no data
no data
50%
Table 40 indicates that around 30% of producers feel prices have risen in 2008, and a similar number expect prices to rise further in 2009, though costs have risen and 35% expect further increases, no producers expecting them to fall. Production volume fell on 35% of holdings in 2008, whilst 24% expect their output to increase in 2009, only 15% anticipate a reduction. Confidence is highest amongst horticultural producers, with 59% believing prices to be high enough, a slight increase from 2007.
Table 40 Fruit and vegetable producer perceptions of price, cost and production trends
n (2008) 2008 2007 2008 2007 2008 2007 2008 2007 2008 2007
24 4% 9% 29% 33% 58% 59% 4% 0% 4% 0%
24 25% 5% 42% 41% 33% 51% 0% 3% 0% 0%
23 4% 12% 9% 17% 52% 55% 17% 4% 17% 12%
n (2008) 2008 2007 2008 2007 2008 2007 2008 2007 2008 2007
25 8% 6% 20% 49% 64% 41% 4% 2% 4% 2%
24 4% 3% 33% 51% 63% 41% 0% 0% 0% 5%
24 13% 18% 13% 32% 58% 49% 13% 0% 4% 2%
n (2008) 2008 2007 2008 2007 2008 2007 2008 2007 2008 2007
25 20% 6% 40% 50% 24% 20% 8% 15% 8% 9%
Production volume
Is price high enough to
continue producing fruit and
vegetables organically?
Definitely NotDefinitely Probably Not Sure Probably Not
Down by 10%+
Sale price
Costs of production
No change Down by 1- 10%Over next 12 months (to Oct
2009)
Up by 10%+ Up by 1-10%
Sale price
Costs of production
No change Down by 1- 10%Up by 10%+ Up by 1-10%Over previous 12 months
(to Oct 2008)
Down by 10%+
Production volume
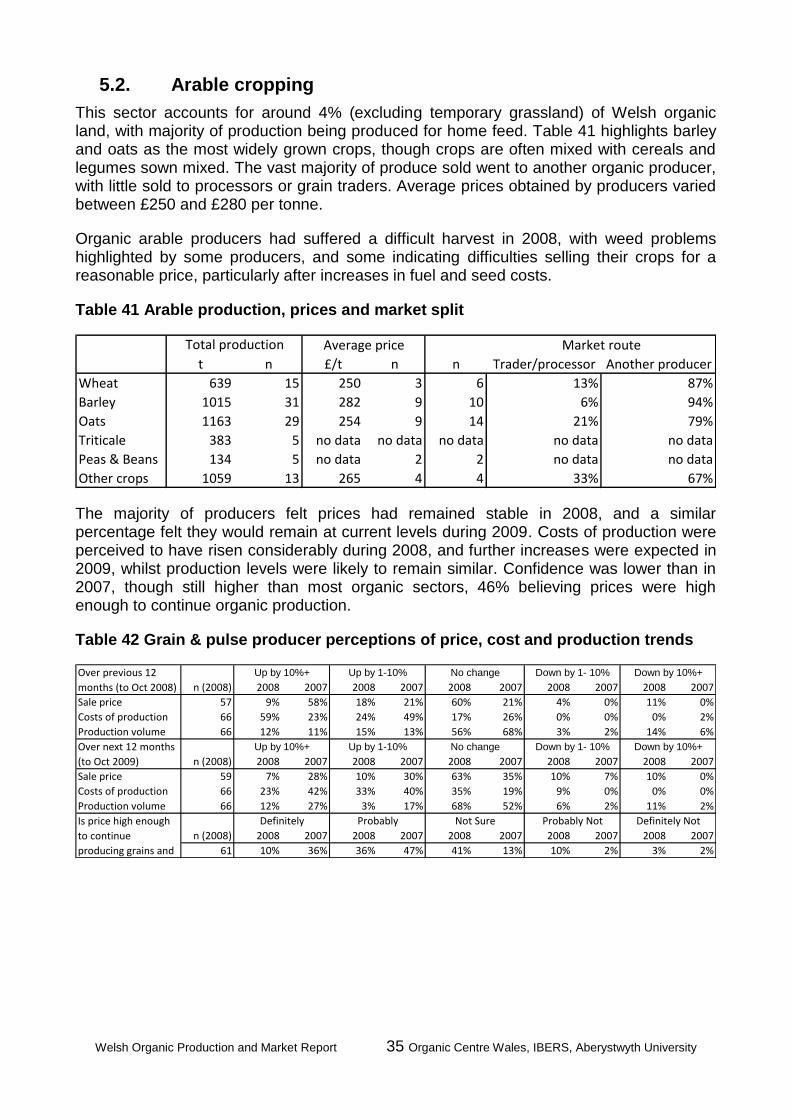
Welsh Organic Production and Market Report 35 Organic Centre Wales, IBERS, Aberystwyth University
5.2. Arable cropping
This sector accounts for around 4% (excluding temporary grassland) of Welsh organic land, with majority of production being produced for home feed. Table 41 highlights barley and oats as the most widely grown crops, though crops are often mixed with cereals and legumes sown mixed. The vast majority of produce sold went to another organic producer, with little sold to processors or grain traders. Average prices obtained by producers varied between £250 and £280 per tonne.
Organic arable producers had suffered a difficult harvest in 2008, with weed problems highlighted by some producers, and some indicating difficulties selling their crops for a reasonable price, particularly after increases in fuel and seed costs.
Table 41 Arable production, prices and market split
t n £/t n n
Wheat 639 15 250 3 6
Barley 1015 31 282 9 10
Oats 1163 29 254 9 14
Triticale 383 5 no data no data no data
Peas & Beans 134 5 no data 2 2
Other crops 1059 13 265 4 4 33%
87%
94%
79%
no data
no data
67%
no data
13%
Average price
Trader/processor Another producer
Total production
6%
21%
no data
Market route
The majority of producers felt prices had remained stable in 2008, and a similar percentage felt they would remain at current levels during 2009. Costs of production were perceived to have risen considerably during 2008, and further increases were expected in 2009, whilst production levels were likely to remain similar. Confidence was lower than in 2007, though still higher than most organic sectors, 46% believing prices were high enough to continue organic production.
Table 42 Grain & pulse producer perceptions of price, cost and production trends
n (2008) 2008 2007 2008 2007 2008 2007 2008 2007 2008 2007
57 9% 58% 18% 21% 60% 21% 4% 0% 11% 0%
66 59% 23% 24% 49% 17% 26% 0% 0% 0% 2%
66 12% 11% 15% 13% 56% 68% 3% 2% 14% 6%
n (2008) 2008 2007 2008 2007 2008 2007 2008 2007 2008 2007
59 7% 28% 10% 30% 63% 35% 10% 7% 10% 0%
66 23% 42% 33% 40% 35% 19% 9% 0% 0% 0%
66 12% 27% 3% 17% 68% 52% 6% 2% 11% 2%
n (2008) 2008 2007 2008 2007 2008 2007 2008 2007 2008 2007
61 10% 36% 36% 47% 41% 13% 10% 2% 3% 2%
Production volume
Is price high enough
to continue
producing grains and
Definitely Probably Not Sure Probably Not
No change Down by 1- 10%Over next 12 months
(to Oct 2009)
Up by 10%+ Up by 1-10% Down by 10%+
Sale price
Costs of production
Definitely Not
Sale price
Production volume
Over previous 12
months (to Oct 2008)
Up by 10%+ Up by 1-10% No change Down by 10%+
Costs of production
Down by 1- 10%
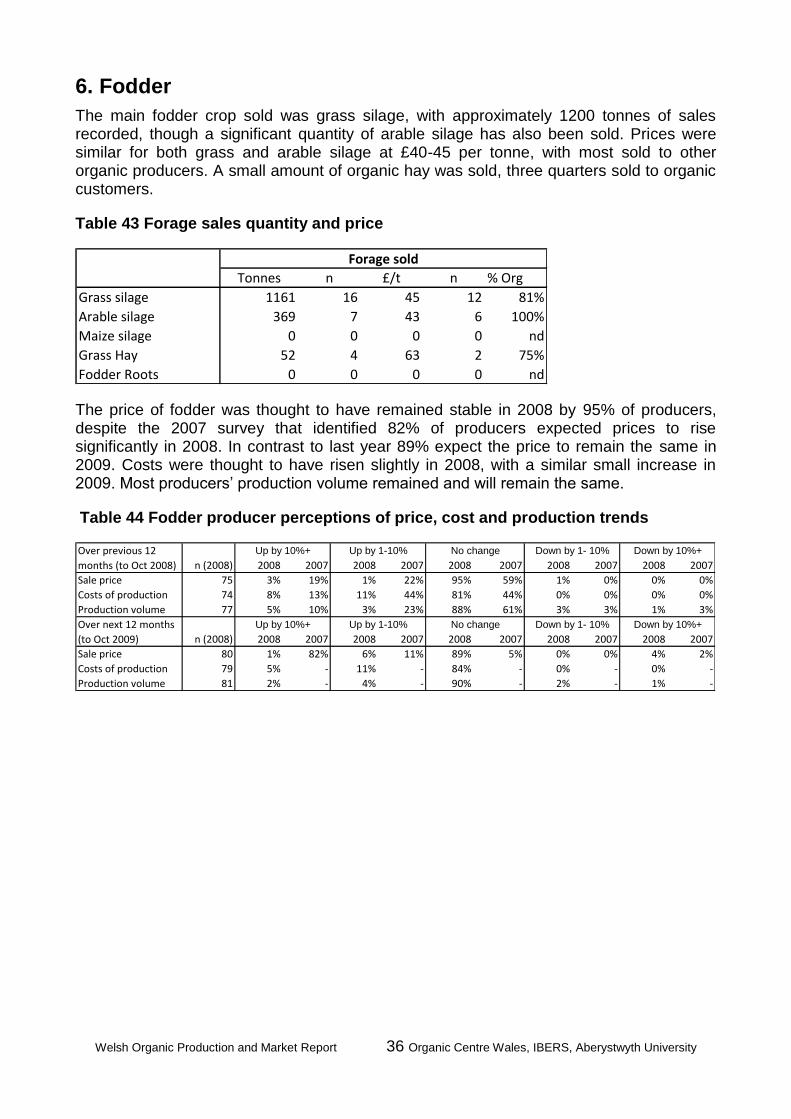
Welsh Organic Production and Market Report 36 Organic Centre Wales, IBERS, Aberystwyth University
6. Fodder
The main fodder crop sold was grass silage, with approximately 1200 tonnes of sales recorded, though a significant quantity of arable silage has also been sold. Prices were similar for both grass and arable silage at £40-45 per tonne, with most sold to other organic producers. A small amount of organic hay was sold, three quarters sold to organic customers.
Table 43 Forage sales quantity and price
Tonnes n £/t n % Org
1161 16 45 12 81%
369 7 43 6 100%
0 0 0 0 nd
52 4 63 2 75%
0 0 0 0 nd
Grass silage
Arable silage
Maize silage
Grass Hay
Fodder Roots
Forage sold
The price of fodder was thought to have remained stable in 2008 by 95% of producers, despite the 2007 survey that identified 82% of producers expected prices to rise significantly in 2008. In contrast to last year 89% expect the price to remain the same in 2009. Costs were thought to have risen slightly in 2008, with a similar small increase in 2009. Most producers’ production volume remained and will remain the same.
Table 44 Fodder producer perceptions of price, cost and production trends
n (2008) 2008 2007 2008 2007 2008 2007 2008 2007 2008 2007
75 3% 19% 1% 22% 95% 59% 1% 0% 0% 0%
74 8% 13% 11% 44% 81% 44% 0% 0% 0% 0%
77 5% 10% 3% 23% 88% 61% 3% 3% 1% 3%
n (2008) 2008 2007 2008 2007 2008 2007 2008 2007 2008 2007
80 1% 82% 6% 11% 89% 5% 0% 0% 4% 2%
79 5% - 11% - 84% - 0% - 0% -
81 2% - 4% - 90% - 2% - 1% -
No change Down by 1- 10%
No change Down by 1- 10%
Production volume
Costs of production
Sale price
Over next 12 months
(to Oct 2009)
Up by 10%+ Down by 10%+
Sale price
Up by 1-10%
Costs of production
Production volume
Up by 10%+ Up by 1-10%Over previous 12
months (to Oct 2008)
Down by 10%+
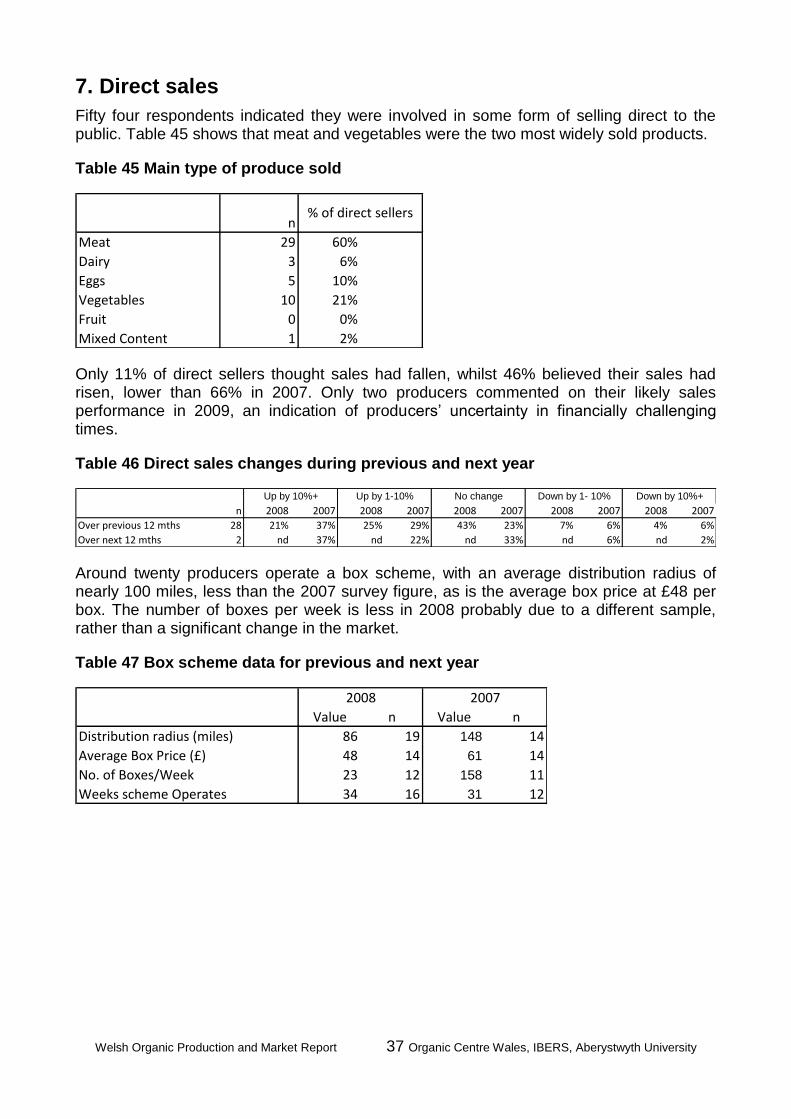
Welsh Organic Production and Market Report 37 Organic Centre Wales, IBERS, Aberystwyth University
7. Direct sales
Fifty four respondents indicated they were involved in some form of selling direct to the public. Table 45 shows that meat and vegetables were the two most widely sold products.
Table 45 Main type of produce sold
n
Meat 29 60%
Dairy 3 6%
Eggs 5 10%
Vegetables 10 21%
Fruit 0 0%
Mixed Content 1 2%
% of direct sellers
Only 11% of direct sellers thought sales had fallen, whilst 46% believed their sales had risen, lower than 66% in 2007. Only two producers commented on their likely sales performance in 2009, an indication of producers’ uncertainty in financially challenging times.
Table 46 Direct sales changes during previous and next year
n 2008 2007 2008 2007 2008 2007 2008 2007 2008 2007
Over previous 12 mths 28 21% 37% 25% 29% 43% 23% 7% 6% 4% 6%
Over next 12 mths 2 nd 37% nd 22% nd 33% nd 6% nd 2%
Down by 10%+Down by 1- 10%Up by 10%+ Up by 1-10% No change
Around twenty producers operate a box scheme, with an average distribution radius of nearly 100 miles, less than the 2007 survey figure, as is the average box price at £48 per box. The number of boxes per week is less in 2008 probably due to a different sample, rather than a significant change in the market.
Table 47 Box scheme data for previous and next year
Value n Value n
Distribution radius (miles) 86 19 148 14
Average Box Price (£) 48 14 61 14
No. of Boxes/Week 23 12 158 11
Weeks scheme Operates 34 16 31 12
20072008
Welsh Organic Production and Market Report 38 Organic Centre Wales, IBERS, Aberystwyth University
8. Conclusions and recommendations
The 2008 Welsh organic producer survey has built upon the 2007 survey, providing a detailed insight into the Welsh organic sector. As in the previous report the results are summarised in the executive summary, and show that the sector remains strong, but with some concerns from producers.
Producer concerns and solutions
1. Reduction in organic premium was the primary concern of organic farmers, evident in some sectors. Beef and sheep farmers are being paid around £3.00/kg DW, which many view as too low, particularly when conventional prices are similar, and organic feed is still at around £360-£400/tonne. There is however evidence that the credit crunch has not reduced demand for organic products as much as has been widely reported, and TNS retail sales data shows that sales are at least as high as in 2007
2. Lamb market is over-supplied. The seasonal sheep market has periods of over and under-supply, meaning there may be periods when producers cannot easily sell their lambs as organic. If producers wish to maximise their returns they need to be marketing lamb more evenly over 12 months, with processors currently offering attractive forward prices due to a shortage of Spring lamb supplies.
3. Apprehension at the numbers of sheep in-conversion is to be expected considering the large numbers now in conversion. Due to the time taken to convert, it will be two year before large numbers of extra organic lamb comes to the market, and industry bodies need to be proactively building markets to accommodate the extra volume.
4. Difficulty marketing light lambs continues to be a problem for some producers. Although difficult for individual producers to solve, industry stakeholders need to help build sustainable supply chain routes, which will probably involve developing foreign markets.
5. Organic feed prices continue to make media headlines, and although they are higher than conventional feeds, do not appear to be significantly harming the industry. Costs of production data shows that many organic livestock farms have reduced usage in response to high prices. Ruminant farmers have the option of increasing forage quality and utilisation to reduce bought-in feed, which in turn will improve supply, and reduce feed prices for poultry and pig sectors.
Outlook
Industry stakeholders and producers themselves need to be proactive to develop existing and new markets. The low number of lamb producers willing to engage in light lamb marketing initiatives shows a lack of trust in industry development bodies, and highlights the need to build close links to primary producers. The organic sector needs to tackle perceptions that organic produce is always more expensive and needs to re-emphasise the pivotal role it can play in achieving societal goals such as the environment and animal welfare, and whilst producers are not content with similar organic and conventional prices, it allows consumers to move to organic produce with minimal extra outlay. It is therefore envisaged that organic produce sales can continue to increase, despite the credit crunch, and therefore absorb newly converted holdings sales as their produce comes to the marketplace.