Embed Size (px)
Citation preview

1
Welsh Index of Multiple Deprivation: A guide to analysing indicator data1
About the guidance
This article gives guidance on analysing the Welsh Index of Multiple Deprivation indicator data, including a
guide to what indicator data has been published, how to access it, “do's and don'ts” for analysis, and links
to existing analysis. Additional StatsWales data with age splits for selected indicators were also released on
1 December 2015, as well as an “Area Analysis of Child Deprivation 2014” statistical article based on the
indicator data. More information about the indicator data and accompanying analyses can be found here.
Contents
1. Introduction to WIMD ................................................................................................................... 2
2. Accessing WIMD Indicator Data .................................................................................................. 3
3. Indicator Data ............................................................................................................................... 6
4. Population Data ......................................................................................................................... 14
5. Data for other UK countries ........................................................................................................ 15
6. LSOA Boundary Changes .......................................................................................................... 16
7. Dos and Don’ts .......................................................................................................................... 17
8. Example Analyses ..................................................................................................................... 18
9. Case Study ................................................................................................................................ 20
10. Future Plans ............................................................................................................................. 22
11. Notes on the use of statistical articles ...................................................................................... 23
Annex ............................................................................................................................................. 24
Date of publication: 1 December 2015 (Last updated 30 January 2018)
Next update: Not a regular output
Statistician: Nia Jones, Social Justice Statistics, Knowledge and Analytical Services
E-mail: [email protected]
Telephone: 0300 025 7371
Twitter: www.twitter.com/statisticswales | www.twitter.com/ystadegaucymru
1 Notes on the use of statistical articles can be found in section 11 at the end of this document.
This document is also available in Welsh.

2
1. Introduction to WIMD
What is WIMD?
The Welsh Index of Multiple Deprivation (WIMD) is the Welsh Government’s official measure of relative
deprivation for small areas in Wales. It is designed to identify those small areas where there are the highest
concentrations of several different types of deprivation. It is a National Statistic and is produced by
statisticians at the Welsh Government.
What is an index?
An index is a group of separate measurements which are combined into a single number. They are
designed to show changes in a complicated variable like industrial output, prices or in this case deprivation.
An index then allows comparisons between different values – in the case of WIMD, the comparison is
between small areas (see below).
WIMD ranks all small areas in Wales from 1 (most deprived) to 1,909 (least deprived).
What does WIMD measure?
WIMD is a measure of multiple deprivation that is both an area-based measure and a measure of relative
deprivation.
WIMD is currently made up of eight separate domains (or types) of deprivation. Each domain is compiled
from a range of different indicators.
a) Income
b) Employment
c) Health
d) Education
e) Access to Services
f) Community Safety
g) Physical Environment
h) Housing
What is WIMD indicator data?
The domains are built up from sets of indicators; these are measurable quantities which capture the
concept of deprivation for each domain (e.g. the percentage of working age people in receipt of
employment-related benefits for the employment domain; Key Stage scores in the education domain; all
cause death rate in the health domain, etc.).This is the data that this document focuses on. The diagram on
page 3 outlines the domains and indicators used in WIMD 2014.
Indicator data is released alongside the main WIMD index for 2008, 2011 and 2014. From 2011 selected
indicator data has been updated annually, even in years when no Index is calculated. Where possible,
indicator data is also published for a range of geographies, as detailed in Section 3. On 1 December 2015,
indicator data was released broken down by age for the first time.

3
The annual Indicator datasets aim to provide new information to those interested in analysing deprivation
for areas and/or age groups, allowing some analysis over time, comparisons between areas beyond a
simple ranking, and the future addition of other useful indicators not included in the main Index. Analysis of
the indicator data has often been expressed as a priority for users since we began to publish the detailed
data.
Figure 1: WIMD 2014 Domains and Indicators
WIMD 2014 Domains and Indicators
Income Employment Health Education Access to Services
Community
Safety
Physical Environment
Housing
Percentage of population
in Income Deprivation. Those who
are: in receipt of Income-
Related Benefits; in
receipt of Tax Credits with and income 60% below the Wales
median; or a Supported
Asylum Seeker.
Percentage of working age population in
receipt of Employment-
Related Benefits
All-Cause Death Rate,
Cancer Incidence
Long-Term
Limiting Illness
and Low Birth
Weight.
Key Stage 2
Average Point Score, Key
Stage 4 Capped Point
Score, Key Stage 4 Level
2 Inclusive, Repeat
Absenteeism, Proportion of 18-19 year
olds not entering Higher
Education, and Proportion of 25-64 year olds with No Qualifications
Average travel time by public
and private transport to the nearest: Food Shop,
General Practitioner
(GP) Surgery, Post Office,
Public Library, Leisure Centre, Primary School,
Secondary School,
Pharmacy, and Petrol
Station (private
transport only)
Police Recorded
Violent Crime, Police
Recorded Criminal Damage,
Police Recorded Burglary,
Police Recorded Theft, Anti-
Social Behaviour, and Fire
Incidence
Air Concentrations, Air Emissions, Flood Risk, and
Proximity to Waste and
Industrial Sites
Overcrowding (bedroom
occupancy) and Lack of
Central Heating
Further information
You can find more background information on WIMD at the following sources:
The WIMD Webpage
WIMD - Annual indicator data
WIMD 2014 Main Report
WIMD 2014 Guidance on Use
WIMD 2014 Frequently Asked Questions
WIMD 2014 Technical Report
WIMD 2014: A guide to analysing deprivation in rural areas
WIMD Interactive Tool
WIMD: Technical information on all the indicators
4
2. Accessing WIMD indicator data
All WIMD indicator data can be accessed at this webpage
The data is organised by the geography that it covers. For LSOA-level or age-split data, the user will also
need to decide on a particular deprivation domain or indicator to view, since there is too much information
to show all domains at the same time. More information on geographies can be found in Section 3.
Note that the webpage covers 2014 and later indicator data only. Indicator data from earlier years
(specifically 2008, 2011, 2012 and 2013) can all be accessed via the ‘Pre WIMD 2014 indicator data’ tab on
the left side of the page.
Manipulating WIMD data
WIMD data is presented in what are known as StatsWales cubes. These are a way to view data
dynamically, allowing the user to rearrange the data to suit their needs. We will use the ‘Indicator data by
Deprivation Tenths - All Domains’ cube, to demonstrate this (see picture below).

5
When first opened the webpage presents the user with a simple table; the geography (in this case areas of
deprivation) on the left, tabulated against the different indicators (or age-splits) along the top of the page.
This view will likely be suitable for most users.
However, there are drop down boxes at the top left of the page for each dimension – these allow you to
hide (untick) or show (tick) certain elements – for example to look at data for Wales as a whole, or remove
the education domain indicators. The small buttons with plus and minus signs also allow the user to expand
(+) or collapse (-) certain categories.
For older WIMD data a third dimension will be visible above the table: Year. The corresponding drop down
button can be used to select any year’s data. Alternatively, this box can be dragged into the table to have
the data broken down by year.
Further guidance on using StatsWales and cubes is available here.
Downloading WIMD data
Once happy with the chosen layout, the user can download the data with the same arrangement of rows
and columns. To do this, simply choose the ‘Export’ button above the table. The cube will offer the options
of including the table title and metadata in the download, as well as a choice of 3 formats:
Comma separated (.csv);
Excel 2007-2010 (.xls);
Statistical Data and Metadata Exchange (SDMX).
The user can then carry out analysis of this data using their preferred software package.
Sharing WIMD data
Once happy with the chosen layout, the user can save or share a link to the data with the same
arrangement of rows and columns. To do this, simply choose the ‘Link’ button above the table, copy the
URL provided, and paste into an email or document.
Open data
Open Data, refers to the premise of data being made freely available in understandable format that can be
used by anyone. Many of our StatsWales cubes are now available via an OData service which can be used
to query the data to fit the users’ needs. OData can be analysed using Microsoft Excel’s Power Query add
on, Microsoft's Power BI, or other business intelligence products. Useful OData service queries can be
found in StatsWales by scrolling down and using the ‘Open Data’ tab at the bottom of the
dataset view. The following symbol, if seen next to a listed StatsWales table, indicates the
availability of that dataset via OData:
OData guidance videos.
Additional WIMD resources
This document only looks at analysing WIMD Indicator Data, but other WIMD information such as relative
deprivation ranks is also published online as well as interactive mapping of WIMD domains. Guidance on
using this data is available in the main WIMD guidance document mentioned in Section 1.

6
3. Indicator data
There is a broad range of indicator data available on StatsWales, with each indicator falling into one of the
eight domains of deprivation listed earlier in the document.
3.1 Geographies
All WIMD data are published at the Lower Layer Super Output Area (LSOA) geography and at Wales level,
but many indicators are also available for additional geographies, including:
Communities First Areas
Deprivation Tenths (Areas of deprivation according the main WIMD Index, as outlined for WIMD
2014 on page 8 of the WIMD Technical Report)
Local Authorities
Middle Layer Super Output Areas (MSOAs)
Strategic Regeneration Areas
Rural/Urban Classifications
Rural/Urban Classifications within Local Authorities
Built Up Areas (BUA)1
Reference (‘lookup’) files which enable users to link different geographies (e.g. postcode to LSOA and
Communities First Clusters) can be found on StatsWales:
StatsWales website: WIMD 2014
StatsWales website: Communities First
It is also possible to visualise geographies on a map using the WIMD interactive product.
3.2 Age breakdowns
Indicator data used for WIMD 2014 were broken down by age and published on StatsWales on 1
December 2015. The age breakdown used for each indicator varied based on the usefulness of each and
disclosure issues. The data were released for a range of geographies.
The indicators covered relate to the Income, Employment, Heath, Education and Housing domains and
come from a range of sources including the 2011 Census, survey and administrative data. A full list of the
indicators, geographies and age splits available can be seen in Tables 1 and 2 in the Annex.
The scope of the data broken down by age published on 1 December does not include some aggregate
geographies covered by other indicator tables, nor some other indicators which may feasibly be broken
down by age (Cancer incidence, Death rate, and Low Birth Weight). We prioritised our work disaggregating
the indicators to focus on data judged to be of most use to users, but welcome feedback to inform future
work.
1 The definition of BUAs used to calculate the WIMD Indicator Data is the best-fit built-up area sub-divisions (BUASD)
with a threshold of 2000 people.

7
Although detailed age splits are not available before WIMD 2014, some indicator data for children was
published alongside the 2008 and 2011 WIMD Child Indices, accessible through StatsWales as described
in section 2.
3.3 Individual indicators
The following sub-sections provide a summary of the indicators in each domain, including an indication of
whether indicators published alongside WIMD 2014 are comparable with previous data. A more complete
definition of all indicators can be found in the Technical Report, and the Technical Information on
Indicators.
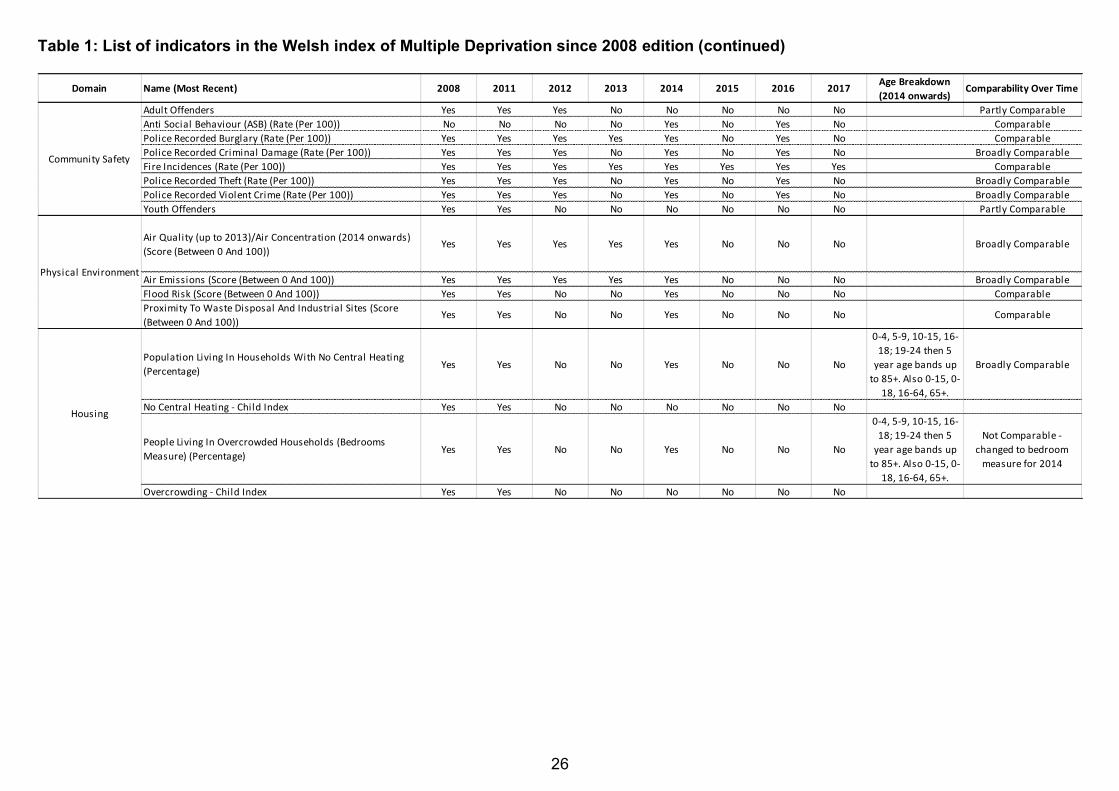
In addition tables in the Annex provide further information. Table 1 outlines the indicators for each domain,
the years for which they’ve been published and their comparability over time. Table 2 outlines the different
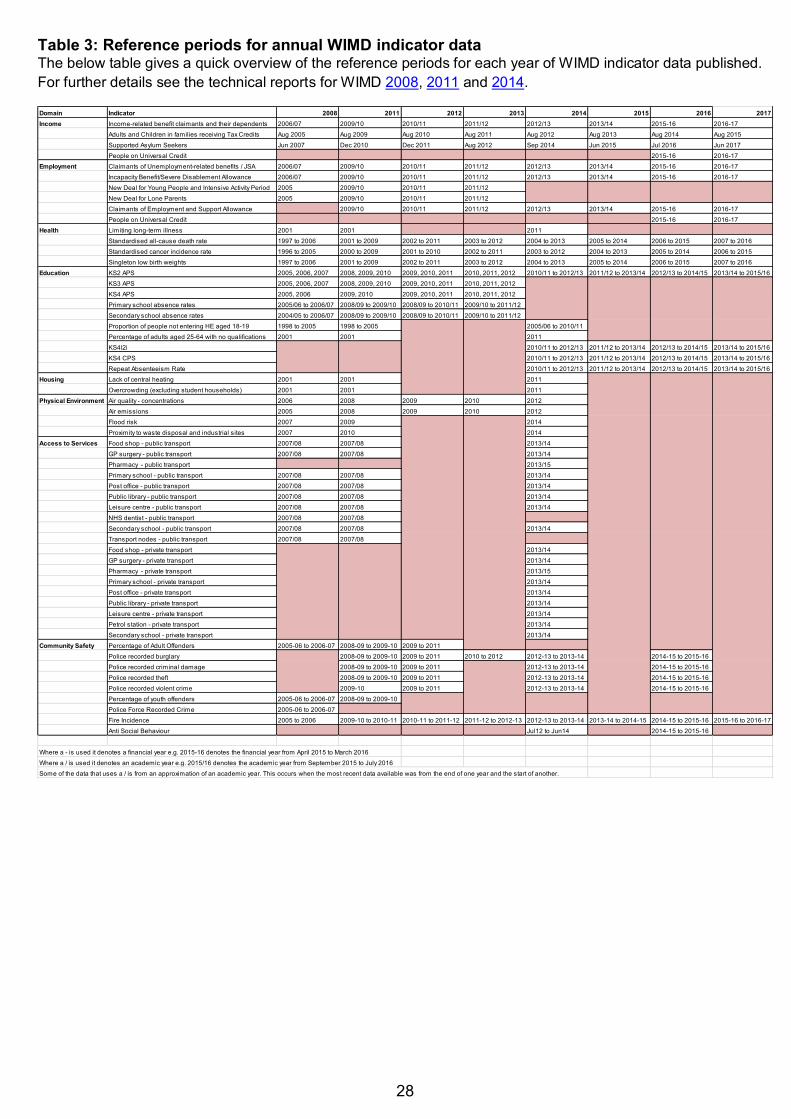
geographies for which each indicator is available for each year. Table 3 details the reference period of the
underlying data for each indicator by year of publication. Table 6 provides a log of revisions made to
StatsWales WIMD indicator data, from August 2015.
Note also that LSOAs are designed to provide statistics for small areas. However with small area statistics
there is an increased likelihood that individuals may be identified based on certain characteristics. As a
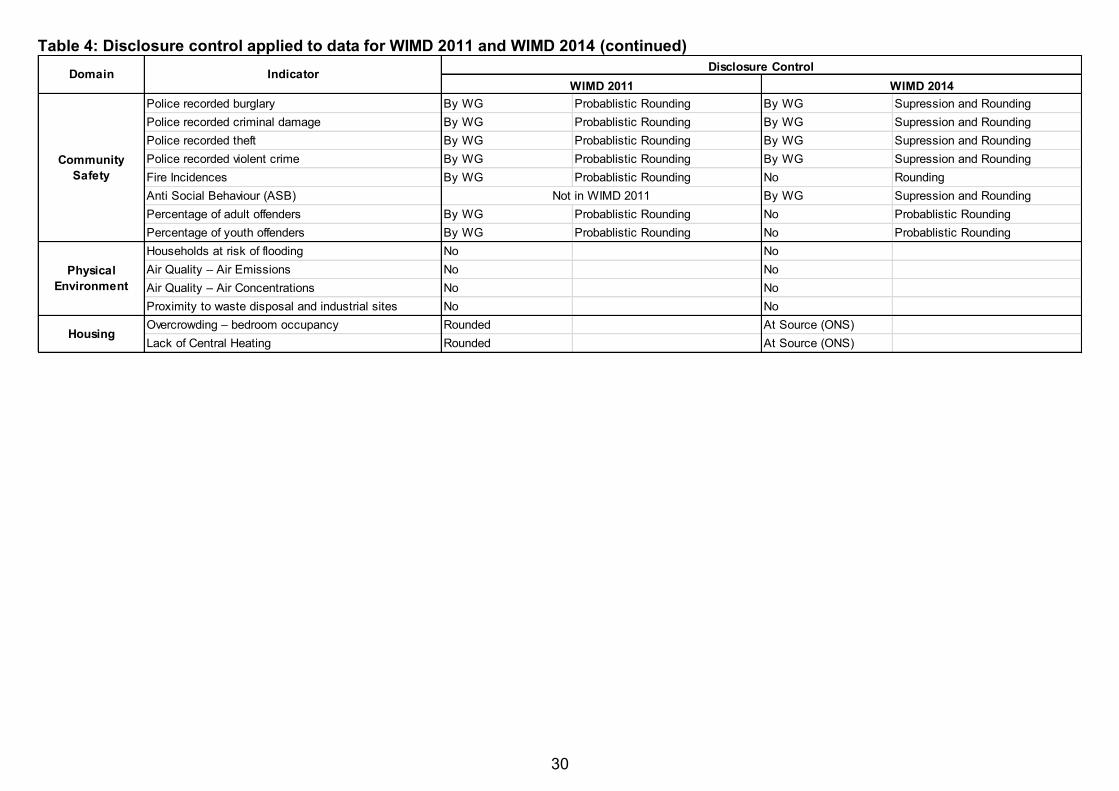
consequence it has been necessary to suppress the values for some indicators to avoid this. Table 4 in the
Annex outlines the indicators for which steps have been taken to avoid disclosure for the 2011 and 2014
editions of WIMD.
Income domain
The Income domain includes one indicator: the percentage of population in income deprivation. Until the
2015 update (published May 2016), this indicator was made up of three elements; income-related benefit2
claimants (data from the Department for Work and Pensions), tax credit3 recipients (from Her Majesty’s
Revenue & Customs), and supported asylum seekers4 (from the Home Office). It sums claimants and
dependent children for the three elements, and then divides this by the total resident population.
The 2016 and 2017 indicator data includes some individuals on Universal Credit (UC), following its
introduction in Wales on a phased basis from 2014. Claims are made at a household level, and the data
used includes all individuals on a UC claim except those “working with no requirements” (that is, with
individual or household earnings over the level at which conditionality applies). This is regardless of
whether the claim is in payment in the given period (reasons for payments being reduced could include an
individual within the household claim having other income, sanctions applied, repaying an advance etc).
For the 2017 indicator data, it became possible to include child dependents of UC claimants, where these
are covered in DWP’s “Children in out-of-work-benefit households” dataset. The numbers of UC claimants
and dependents in the 2017 income deprivation data are relatively small (under 5 per cent of the overall
total)5. Rollout initially included uncomplicated cases for single adults with no dependent children, and for
2 Includes Income Support, Job Seekers Allowance, Income Based Employment and Support Allowance, and Pension
Credit 3 Includes Child Tax Credit and Working Tax Credit
4 Those who were supported under Section 95
5 Statistics on Universal Credit are available online.

8
the 2016-17 reference period there were still relatively few (likely to be fewer than 1,000) child dependents
of UC claimants in Wales.
We did not include UC claimants in the 2015 indicator data. There were a small number of new, single
unemployed UC claimants in the Shotton (North Wales) Job Centre District from May 2014, falling into the
end of the reference period for 2015 indicators. Therefore decreases in the 2015 indicator data for LSOAs
near Shotton may in part be explained by the omission of new UC claimants who would previously have
moved onto Job-Seekers’ Allowance. However the effect is estimated to be small in the scale of other
changes to the welfare system.
The income indicator is published for every year. There were no methodological changes in the income
domain between WIMD 2011 and WIMD 2014. However, changes to the welfare system mean that
eligibility thresholds and criteria for some benefits have changed. From the 2016 update, it also includes
some Universal Credit claimants (and in 2017, their dependents) as outlined above. As a result indicator
data are not strictly comparable over time.
Employment domain
The Employment domain includes just one indicator: the percentage of working-age population in receipt of
employment related benefits, from the Department for Work and Pensions. Until the 2015 update
(published May 2016), this was calculated from a count of individuals (i.e. those who claim multiple benefits
are only counted once) entitled to incapacity benefit (which replaced Severe Disablement Allowance), Job
Seekers Allowance (JSA), and Employment and Support Allowance (ESA). This indicator is expressed as a
percentage of the working age population for each LSOA.
Following the introduction of Universal Credit (UC) in Wales on a phased basis from 2014, the 2016 and
2017 employment indicator data now includes people on UC with no employment marker. The numbers of
UC claimants in the 2016 and 2017 employment deprivation data are relatively small (just under 2 and 7
per cent of the overall total, respectively)6, and rollout initially included uncomplicated cases for single
adults with no dependent children. We will continue to review how we include UC claimants for future
annual updates, aiming for minimum changes until a full review ahead of the next Index year (2019).
We did not include UC claimants in the 2015 indicator data. There were a small number of new, single
unemployed UC claimants in the Shotton (North Wales) Job Centre District from May 2014, falling into the
end of the reference period for 2015 indicators. Therefore decreases in the 2015 indicator data for LSOAs
near Shotton may in part be explained by the omission of new UC claimants who would previously have
moved onto Job-Seekers’ Allowance. However the effect is estimated to be small in the scale of other
changes to the welfare system.
Since WIMD 2014, New Deal participants are no longer included in this domain. This programme was
replaced by the Work Programme, which requires a participant to be claiming either Job Seekers
Allowance or Employment and Support Allowance. Both of these benefits are already included in the
indicator. In addition to this, changes to the welfare system mean that eligibility thresholds and criteria for
some benefits have changed. From the 2016 update, it also includes some Universal Credit claimants as
outlined above. As a result, although the employment indicator is published for every year, data are not
strictly comparable over time.
6 Statistics on Universal Credit are available online.

9
Health domain
The health domain includes four indicators:
Cancer Incidence
Limiting Long-Term Illness
All-Cause Death Rate
Low Birth Weight
Cancer incidence (indirectly age-sex standardised)
This indicator uses counts of all cases of cancer including all malignancies, excluding non-melanoma skin
cancer (data from Public Health Wales) and population data. This indicator is based on ten years of data,
and is rolled forward every year. Indicator data are not strictly comparable over time because the technique
of indirect standardisation involves using updated age-sex specific rates for Wales in calculating rates for
small areas.
Limiting long-term illness (indirectly age-sex standardised)
Limiting Long-Term Illness covers any long-term illness, health problem or disability that limits daily
activities or work. This indicator is based on Census data, and is not comparable over time because of
changes to the Census question between 2001 and 2011, and also due to the indirect standardisation
applied.
Death rate (indirectly age-sex standardised)
This indicator is based on 10 years of data for the all-cause death rate, from the Office for National
Statistics. It is published for every year, but is not strictly comparable over time due to the use of indirect
standardisation.
The indicators above are counts of unique individuals (i.e. duplicates were removed), so that the indicators
can be summed and expressed as a rate per 100,000 for the LSOA. There were no methodological
changes in the health domain between WIMD 2011 and WIMD 2014.
Low birth weight
This indicator is the percentage of live single births (singletons) for which birth weight is less than 2.5kg,
and is calculated as a 10 year average, using data from the Office for National Statistics. This indicator is
published for every year and is comparable over time.

10
Education domain
The education domain includes six indicators (calculated by the Welsh Government unless otherwise
stated):
Key Stage 2 Average Points Score
Key Stage 4 Capped Points Score
Key Stage 4 Level 2 Inclusive
People Not Entering Higher Education Aged 18-19 (data from the Higher Education Funding Council
for England)
Adults Aged 25-64 With No Qualifications (Census data)
Repeat Absenteeism
Three of the six indicators in the WIMD 2014 education domain were present in WIMD 2011:
Key Stage 2 Average Point Score
Proportion of people aged 18-19 not entering Higher Education
Number of Adults aged 25-64 with No Qualifications
Of these three indicators, the age specification of adults with no qualifications indicator has changed slightly
since WIMD 2011, due to the increase in state pension age for women from 59 to 64 years old. The other
two indicators remain unchanged.
The Key Stage 3 Means Point Score has been removed since WIMD 2011 and the Key Stage 4 Average
Wider Point Score indicator has been replaced by two Key Stage 4 indicators included in WIMD 2014. The
two absenteeism indicators included in WIMD 2011 have been replaced with one Repeat Absenteeism
indicator which covers both Secondary and Primary School.
There was a small improvement made to the methodology for the Repeat Absenteeism indicator for the
2016 indicator data publication. Previously (for 2015), data on Welsh pupils at English “All-Through”
schools had not been included in the indicator, but from 2016 the relatively small number of pupils affected
are now accounted for in the indicator.
From the 2017 publication, the Key Stage 2 Average Point Score indicator will only contain information from
pupils in Welsh schools as pupils who live in Wales but go to English schools will no longer have the same
assessment.

11
Access to services domain
The Access to Services Domain has changed its indicators for WIMD 2014. The indicators that contribute
to this domain are outlined below.
Average Private Travel Time to Food Shop (minutes)
Average Private Travel Time to GP Surgery (minutes)
Average Private Travel Time to Leisure Centre (minutes)
Average Private Travel Time to Public Library (minutes)
Average Private Travel Time to Petrol Station (minutes)
Average Private Travel Time to Pharmacy (minutes)
Average Private Travel Time to Post Office (minutes)
Average Private Travel Time to Primary School (minutes)
Average Private Travel Time to Secondary School (minutes)
Average Public Travel Time to Food Shop (minutes)
Average Public Travel Time to GP Surgery (minutes)
Average Public Travel Time to Leisure Centre (minutes)
Average Public Travel Time to Public Library (minutes)
Average Public Travel Time to Pharmacy (minutes)
Average Public Travel Time to Post Office (minutes)
Average Public Travel Time to Primary School (minutes)
Average Public Travel Time to Secondary School (minutes)
The indicators used prior to WIMD 2014 are in Table 1 of the Annex, and indicators have not been updated
in between indexes. The Technical Report outlines the exact specification of each of the indicators above.
For 2014 the calculations for this domain include travel times to pharmacies and petrol stations for the first
time, along with those for all services using public transport. At the same time figures for NHS dentists and
transport nodes were taken out. Further to this, travel times are now measured to the nearest service point
for each indicator, rather than the nearest 10 service points. Because of this the Access to Services
Domain for WIMD 2014 is not comparable with that for WIMD 2011.

12
Community safety domain
The Community Safety Domain considers deprivation with relation to living in a safe community. There are
six indicators which make up the community safety domain and these are outlined below. These are
sourced from Welsh Police Forces (unless otherwise stated) and include:
Police Recorded Criminal Damage
Police Recorded Violent Crime
Police Recorded Anti-Social Behaviour
Police Recorded Theft
Police Recorded Burglary
Fire Incidents (Welsh Government)
Since WIMD 2011, the Percentage of Youth Offenders and Percentage of Adult Offenders indicators have
been replaced by the Police Recorded Anti-Social Behaviour indicator. In comparison with WIMD 2011, the
Police Recorded Theft, Violent Crime, and Criminal Damage indicators have changed for WIMD 2014 with
the removal of the non-resident working population from the denominator. More information can be found
under the background section of the WIMD webpages.
The introduction of the Police Recorded Anti-Social Behaviour indicator means that this indicator is not
comparable with its WIMD 2011 counterparts (Percentage of Youth Offenders and Percentage of Adult
Offenders). The five other WIMD 2014 indicators included in the Community Safety domain are comparable
with WIMD 2011.
The 2016 indicators show an increase in the rate of violent crime across Wales since the last update for
this indicator, in 2014. This increase can be partly explained by improvements in police recording practices,
particularly in relation to violence against the person offences. This is explained further in the ONS output
‘Crime in England and Wales: year ending Mar 2016’, found here, which states:
“These increases need to be seen in the context of the renewed focus on the quality of crime recording by
the police, in light of the inspections of forces by Her Majesty’s Inspectorate of Constabulary (HMIC), the
Public Administration Select Committee (PASC) inquiry into crime statistics and the UK Statistics
Authority’s decision to remove the National Statistics designation from police recorded crime statistics. This
renewed focus is thought to have led to improved compliance with the National Crime Recording Standard
(NCRS), leading to the recording of a greater proportion of crimes coming to the attention of the police.”

13
Physical environment domain
The data, and the associated technical expertise, for this domain are provided by Natural Resources Wales
(NRW). There are three subdomains that make up the Physical Environment domain: Air Quality, Flood
Risk, and Proximity to Waste Disposal and Industrial Sites. The Air Quality subdomain is split into two
indicators: Air Concentrations and Air Emissions. The Air Concentrations and Air Emissions indicators have
had some technical changes since WIMD 2011 (details can be seen in the Technical Report), but they are
still both broadly comparable.
Housing domain
The purpose of the housing domain is to measure deprivation in terms of the lack of adequate housing due
to physical housing conditions, living arrangements or availability of housing. The data for this domain is
supplied by the Office for National Statistics (ONS) as part of the 2011 Census. Due to the lack of
appropriate data, the housing domain is measured through two indicators: the proportion of people living in
overcrowded households, and the proportion of people living in households with no central heating.
The overcrowded households indicator used in WIMD 2014 is not comparable with that for WIMD 2011
because it was based on bedrooms rather than all rooms as used in the 2011 edition. The WIMD 2011
indicator also excluded all student households whereas the WIMD 2014 indicator included them.
The percentage of population living in households with no central heating indicator is comparable with
WIMD 2011 although there was a slight wording change between the 2001 and 2011 Censuses. For more
information on the comparability between these two censuses please see the 2011-2001 Census
Questionnaire Comparability Report.

14
4. Population data
Many of the WIMD indicators are presented as a rate, whether percentage, per hundred or per hundred
thousand. To calculate these rates a range of population bases are used as denominators. The main ones
are outlined below along with information on where to find data for them.
2011 Census
The census is the most complete source of information about the population that is available. It is the only
survey which provides a detailed picture of the entire population, and is unique because it covers everyone
at the same time and asks the same core questions everywhere. This makes it easy to compare different
parts of the country. However due to its’ size the Census is only carried out every ten years.
The most recent census provides estimates of the characteristics of all people and households in the UK on
census day, 27 March 2011. The census provides statistics from a national to a local level for these
characteristics, including smaller geographies such as those used for WIMD.
Some data from the 2011 Census can be found on the StatsWales website.
A wide range of information from the 2011 Census can be found on the ONS website.
A more complete range of information for small areas can be obtained from the NOMIS website which
enables the user to query the data for a variety of geographies and indicators.
Mid-year population estimates
The Office for National Statistics (ONS) produces estimates of the resident population of England and
Wales which give a stock count of people living in England, Wales, the regions of England, local authorities
and small areas by age and sex, as at 30 June each year. For consistency, lower layer Super Output Area
(LSOA) mid-year population estimates are constrained to middle layer Super Output Area (MSOA)
estimates which in turn are constrained to local authority estimates.
Small area population estimates (SAPE) for mid-2001 to mid-2013 SOAs have been produced on 2011
census boundaries. Some indicator data in WIMD 2014 were based on SAPE for mid-2012. For some
indicators the relevant population group was defined by age (e.g. for employment domain the ‘working age’
age group was used).
SAPE for all LSOAs in Wales for years from mid-2001 onwards by age group can be found on the
StatsWales website.
More detailed estimates, by single year of age (up to age 89, then grouped for age 90+), are available on
the ONS website.
Pupil Level Annual School Census (PLASC) data
The PLASC is the annual count of pupils in all schools across Wales, including those of non-statutory
school age (i.e. 5-16). It covers nursery, primary, secondary and independent schools and is based on
those enrolled on the school census day in January each year.
Many of the indicators for the education domain are calculated using PLASC data for the relevant age
group. PLASC data broken down by age group, gender, school, attendance type (i.e. part time or full time),
local authority and constituency can be obtained from the StatsWales website.

15
5. Data for other UK countries
England, Scotland and Northern Ireland also produce indices of deprivation for their respective areas. The
principle approach is similar to that for WIMD however there are differences in the detailed methodology
between each of the outputs. As with WIMD, data can be obtained for the indicators contained in each
index. It is advisable though to read the notes, definitions and associated information for each dataset to
verify comparability with data from WIMD.
England
The latest English indices of deprivation: including underlying indicators and population denominators.
Scotland
The latest Scottish Index of Multiple Deprivation: including underlying indicators and population
denominators.
Northern Ireland
The latest multiple deprivation measure for Northern Ireland: including underlying indicators and population
denominators.
16
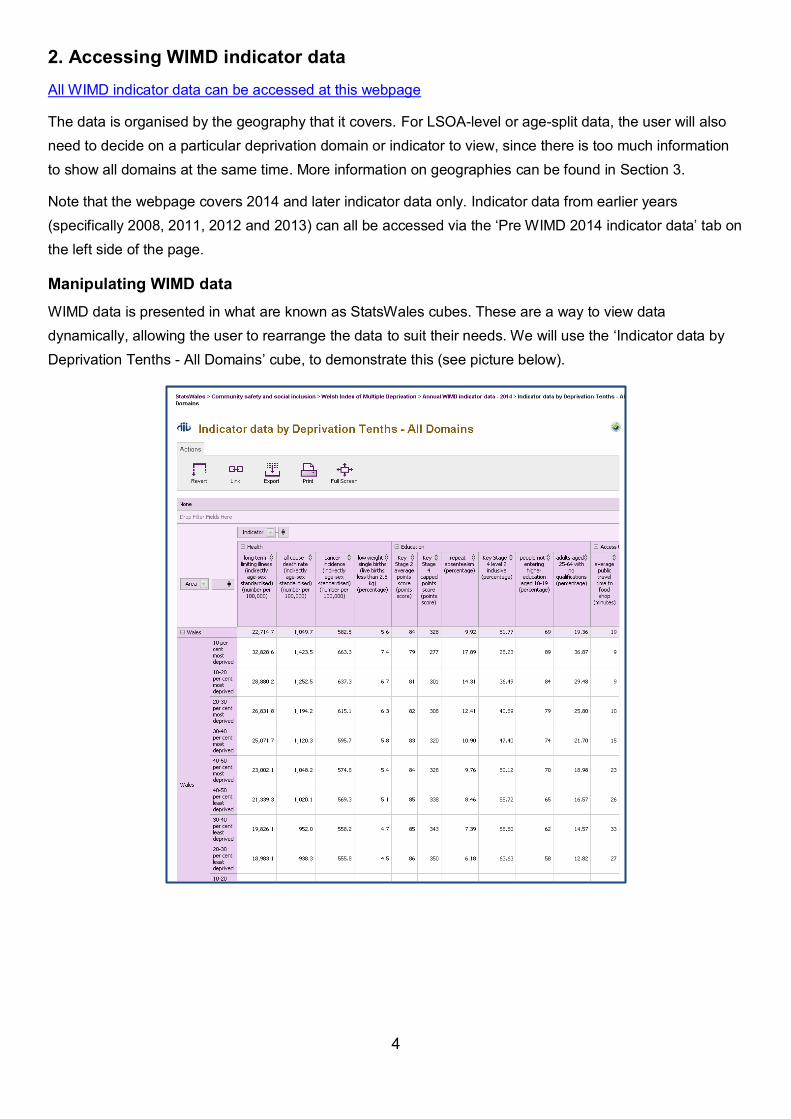
6. LSOA boundary changes
Geographic unit
The geographic areas used in the calculation of WIMD 2014 are the 1,909 Lower layer Super Output Areas
(LSOAs). LSOAs were used as the geographic unit in WIMD 2005, 2008 and 2011, and were designed for
the reporting of small area statistics. The other three UK nations also calculate their indexes at the LSOA
geographical unit.
Changes between 2001 Census and 2011 Census
The aim of the statistical geographies used for the census is that boundaries do not change significantly
between censuses. Nevertheless some LSOA boundaries are revised following each Census, to take into
account changes in population. WIMD 2014 is the first Welsh Index of Multiple Deprivation to use the
revised boundaries, following the 2011 Census. In the 2001 Census, there were 1,896 LSOAs; 49 of these
have been discontinued and 61 new LSOAs have been created.
There have been changes to LSOA boundaries where populations have:
become too big, so an LSOA has been split into two or more areas;
become too small, so an LSOA has been merged with an adjacent one; or
changed in a complex way, so there has been a combination of the two cases above.
In some cases there have also been changes following the Output Geography Consultation, run by the
Office for National Statistics in 2010. Where LSOAs have changed, the old code has been deleted and a
new code has been assigned. To ensure ease of use, English and Welsh names have been allocated to
each of the LSOA codes. Each LSOA name has been determined by the local authority to which the LSOA
belongs.
In WIMD 2014, there are 1847 LSOAs with unchanged boundaries since WIMD 2011, 61 LSOAs with
boundaries resulting from a merge with or split from an adjacent LSOA, and 12 LSOAs with boundaries
resulting from more complex changes. A summary of LSOA boundary changes is provided in table 5 in the
Annex.
Postcode to LSOA allocation changes
Data for some indicators are produced from postcode data that are mapped to LSOAs using the grid
reference of the population weighted centre of the postcode (known as best fit). So postcodes are allocated
to the LSOA where most of the population from that postcode fall. This best fit method is needed as
postcodes can sometimes be split between two or more LSOAs. In early 2016, some postcodes were
allocated to different LSOAs following improvements to the allocation of grid references by Ordnance
Survey. In most cases, these changes will not have resulted in noticeable changes to data, but in some
cases changes are more prominent. For example, death rates may be affected more if there is a care home
in a postcode which changes LSOA.

17
7. Dos and Don’t’s
The following extract from the WIMD guidance infographic shows guidelines for analysing WIMD rank data:
However, when it comes to indicator data the guidelines are different.
Geographical comparisons
DO compare data between different geographies, e.g. between one Communities First area or LSOA and another.
DON’T forget about changes in geography – e.g. some LSOAs will not be comparable over time if their boundaries have changed.
DON’T ignore the effect the presence of particular population groups can have on different areas, e.g. students.
Comparing over time
DO compare indicator over time, BUT…
DON’T ignore changes in indicator definitions.
DON’T ignore changes in geography boundaries.
DON’T forget to check for variations between years caused by small numbers in either the count for the indicator or the base population.
Comparing indicators
DO consider different indicators – e.g. the performance of a range of indicators over time or within a certain area.
DON’T forget to check which direction is considered positive – e.g. a higher KS2 average score is a positive thing, a higher repeat absenteeism score is negative.
DON’T forget to make sure you know what each indicator actually measures.
Comparing against deprivation data
DO compare data against overall WIMD deprivation data.
DO use the deprivation tenths geography to do this if available.
DON’T forget that the indicators themselves actually feed into this overall deprivation measure (with varying weight per domain and indicator).
DON’T forget the reference period for the deprivation indicator data.
DON’T compare Index ranks over time.
18
Comparing between age groups
DO compare indicator values between different age groups.
DON’T forget that different indicators use different age splits.
DON’T forget to check for variations between years caused by small numbers in either the count for the indicator or the base population (this may be especially relevant for narrow age bands).
8. Example analyses
There are some existing sources of WIMD indicator data analysis which can act as examples. These are in
addition to the Case Study presented in Chapter 9 of this article.
Welsh Index of Multiple Deprivation 2014: A guide to analysing deprivation in rural areas - Revised
This article was published alongside WIMD 2014, and looks at analysing deprivation in rural areas, taking
into account settlement size. In particular, sections 8 and 9 of this report look at analysing Access to
Services and Income indicator data.
Analysis of the Access to Services Domain in the WIMD by type of settlement (WIMD Indicators
2014)
This output provides analysis of WIMD data to examine areas that may have issues with access to
services. It looks at both the deprivation rankings for the Access to Services domain and the travel
times used in the construction of the rankings.
Area Analysis of Child Deprivation (WIMD Indicators 2014)
On 1 December 2015 a Statistical Article was published which showed how deprivation varies for children
across Wales, using a range of WIMD indicator data for the relevant age groups.
How to analyse by deprivation group
In order to summarise and analyse data representing 1,909 LSOAs, statistical methods may be used to
group the data. For example, this may be done using deciles, quintiles, or WIMD deprivation groups (top 10
percent, 10 to 20 percent, 20 to 30 percent, 30 to 50 percent, bottom 50 percent of LSOAs). This approach
can be used for the overall index, domain or individual indicator under consideration. In 2016, the WIMD
spreadsheet of domain ranks was amended to include a lookup for WIMD 2014 deciles, quartiles and
quintiles, using the overall WIMD rank.
For example, it is possible to see whether an area is in the “worst” 10 per cent of areas for the no
qualifications indicator, and then to compare this to its position against another indicator such as
employment deprivation.
Briefly, the typical approach is to:
Rank LSOAs (1-1909) according to chosen indicator values, from most deprived to least deprived.
Decide on categorisation to use and assign a category to each LSOA e.g. if using deciles the first
category (top 10 percent most deprived) would normally include LSOAs ranked 1-191.

19
Where ties exist (e.g. the LSOAs ranked 191 and ranked 192 have the same indicator value) then
LSOAs are usually assigned to the more deprived category (so LSOA ranked 192 in our example
would be included in our “top 10 percent”).
Some of the types of analysis then possible include:
Thematic maps, using a different shade for each category.
Cross-tabulations of LSOAs according to two different categorisations e.g. two different domains of
deprivation, or an indicator at two different time periods.
Boxplot of indicator values by category, for example plotting the spread of violent crime rates within
categories of income domain deprivation.
After matching LSOAs to local authorities (or other higher geographies), tabulating the proportion of
LSOAs which are in each category.
Present a boxplot of the spread of values for LSOAs within each local authority.
Analysing over time
Section 3.3 refers to comparability of indicators over time, with further information in the Annex tables and
in other supporting WIMD documentation on changes to indicator definitions.
Often, change in indicator definitions means data are not strictly comparable over time. However, although
care should be taken in interpreting absolute changes in indicator values, it is still possible to analyse
relative changes over time. For example, to compare relative deprivation between 2011 and 2014 users
can group LSOAs into deciles according to the relevant indicator data, and look at those areas which have
moved up or down deciles. So we can surmise that an area moving from the third decile (20-30 percent
most deprived areas) in 2011 to the first decile (top 10 percent most deprived areas) in 2014 has worsened
in terms of, say, its relative child income deprivation. However, it is important to remember not to compare
individual ranks over time, as they are a relative measure.
Although detailed age splits are not available before WIMD 2014, some indicator data for children was
published alongside the 2008 and 2011 WIMD Child Indices, accessible through StatsWales as described
in section 2. Care should be taken comparing previously published child indicator data with data from
WIMD 2014 or later. Indicator data for children for years earlier than 2014 may differ in definition from the
age breakdowns provided from 2014 (e.g. 0-15 and 0-18), so users should read relevant notes in WIMD
documentation if comparing over time.
20
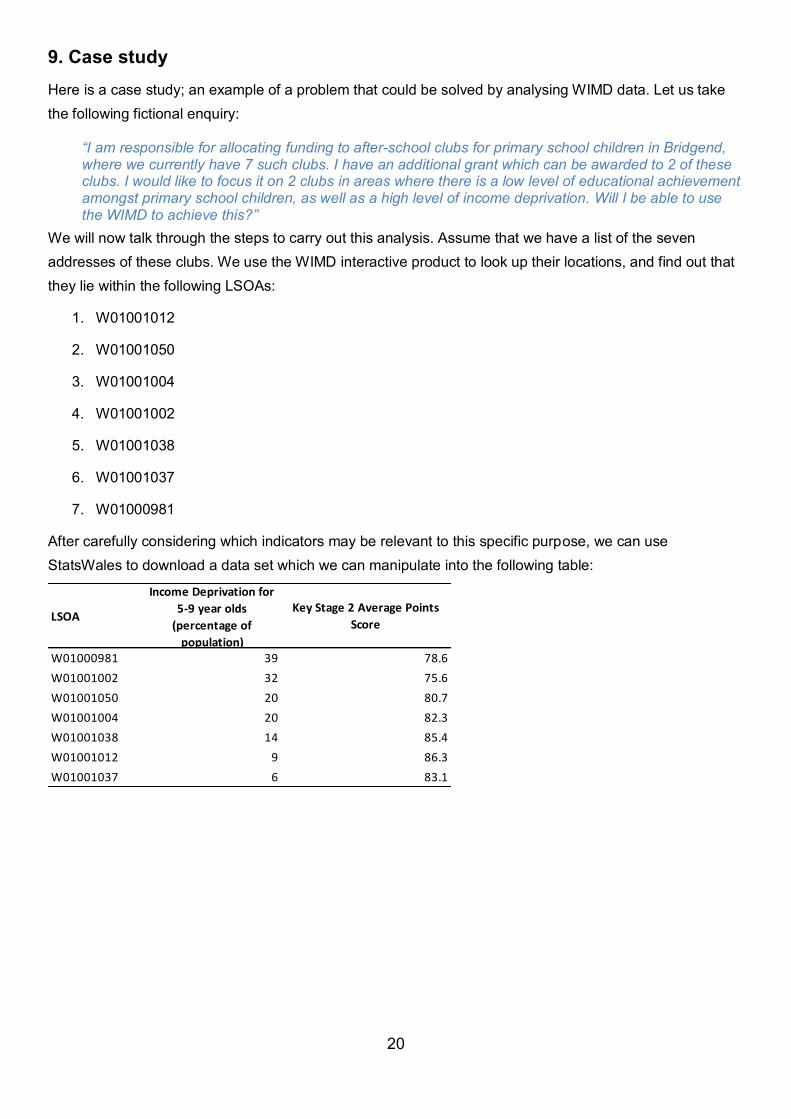
9. Case study
Here is a case study; an example of a problem that could be solved by analysing WIMD data. Let us take
the following fictional enquiry:
“I am responsible for allocating funding to after-school clubs for primary school children in Bridgend, where we currently have 7 such clubs. I have an additional grant which can be awarded to 2 of these clubs. I would like to focus it on 2 clubs in areas where there is a low level of educational achievement amongst primary school children, as well as a high level of income deprivation. Will I be able to use the WIMD to achieve this?”
We will now talk through the steps to carry out this analysis. Assume that we have a list of the seven
addresses of these clubs. We use the WIMD interactive product to look up their locations, and find out that
they lie within the following LSOAs:
1. W01001012
2. W01001050
3. W01001004
4. W01001002
5. W01001038
6. W01001037
7. W01000981
After carefully considering which indicators may be relevant to this specific purpose, we can use
StatsWales to download a data set which we can manipulate into the following table:
LSOA
Income Deprivation for
5-9 year olds
(percentage of
population)
Key Stage 2 Average Points
Score
W01000981 39 78.6
W01001002 32 75.6
W01001050 20 80.7
W01001004 20 82.3
W01001038 14 85.4
W01001012 9 86.3
W01001037 6 83.1

21
We can plot these results in a bar chart for easy analysis:
0
10
20
30
40
50
60
70
80
90
100
W01000981 W01001002 W01001050 W01001004 W01001038 W01001012 W01001037
Ind
icat
or
Val
ue
LSOA
Income Deprivation for 5-9 year olds (percentage of population) Key Stage 2 Average Points Score
It is clear that the first two LSOAs above (W01000981 and W01001002) have both the highest levels of
income deprivation and the lowest KS2 average point scores. Based on the preferences expressed, the
enquirer should consider allocating the funds to the two clubs in these areas. However, it is worth taking
into consideration that the analysis uses the location of the club rather than the residential address of
attendees. Therefore, in this scenario, WIMD can be used as a guide, but local knowledge shouldn’t be
ignored.

22
10. Future plans
Indicator data
The latest edition of WIMD was published on 27 November 2014, along with supporting indicator data. As
part of our annual Indicator data updates, we updated WIMD indicator data which became available during
2015 on StatsWales in May 2016, data which became available in 2016 in December 2016 (and April 2017
for some Community Safety indicators), and data which came available in 2017 in December 2017 (and
January 2018 for income deprivation, low birth weight, and death rate indicators). As in previous years, we
continue to prioritise the indicator data which is updated annually (e.g. not updating the resource intensive
Access to Service indicators each year), taking into account likely usefulness and available resources for
this work.
Next edition of WIMD
In 2016 we conducted a user survey to seek feedback on when the next Index update should happen. The
WIMD Timing Survey Report is now available on our website. Based on the survey feedback we will work
towards a full Index update in 2019.
We welcome feedback on all WIMD products, including the range of indicator datasets made available. You
can contact us at [email protected].

23
11. Notes on the use of statistical articles
Statistical articles generally relate to one-off analyses for which there are no updates planned, at least in
the short-term, and serve to make such analyses available to a wider audience than might otherwise be the
case. They are mainly used to publish analyses that are exploratory in some way, for example:
Introducing a new experimental series of data;
A partial analysis of an issue which provides a useful starting point for further research but that
nevertheless is a useful analysis in its own right;
Drawing attention to research undertaken by other organisations, either commissioned by the Welsh
Government or otherwise, where it is useful to highlight the conclusions, or to build further upon the
research;
An analysis where the results may not be of as high quality as those in our routine statistical
releases and bulletins, but where meaningful conclusions can still be drawn from the results.
Where quality is an issue, this may arise in one or more of the following ways:
being unable to accurately specify the timeframe used (as can be the case when using an
administrative source);
the quality of the data source or data used; or
other specified reasons.
However, the level of quality will be such that it does not significantly impact upon the conclusions. For
example, the exact timeframe may not be central to the conclusions that can be drawn, or it is the order of
magnitude of the results, rather than the exact results, that are of interest to the audience.
The analysis presented does not constitute a National Statistic, but may be based on National Statistics
outputs and will nevertheless have been subject to careful consideration and detailed checking before
publication. An assessment of the strengths and weaknesses in the analysis will be included in the article,
for example comparisons with other sources, along with guidance on how the analysis might be used, and
a description of the methodology applied.
Articles are subject to the release practices as defined by the release practices protocol, and so, for
example, are published on a pre-announced date in the same way as other statistical outputs.
Missing value symbols used in the article follow the standards used in other statistical outputs, as outlined
below.
.. The data item is not available
. The data item is not applicable
- The data item is not exactly zero, but estimated as zero or less than half the final digit
shown
* The data item is disclosive or not sufficiently robust for publication
All content is available under the Open Government Licence v3.0 , except where otherwise stated.

24
Annex
Table 1: List of indicators in the Welsh Index of Multiple Deprivation since 2008 edition
Domain Name (Most Recent) 2008 2011 2012 2013 2014 2015 2016 2017Age Breakdown
(2014 onwards)Comparability Over Time
Income Deprivation (Percentage Of Population) Yes Yes Yes Yes Yes Yes Yes Yes
0-4; 5-9; 10-15; 16-
18; 19-24; 25-34; 35-
44; 45-54; 55-64; 65-
74; Over 75. Also 0-
15, 0-18, 16-64,
65+.
Broadly comparable -
affected by changes to
welfare system
Income-Related Benefits - Child Index Yes Yes No No No No No No
EmploymentEmployment Related Benefits (Percentage Of Working-Age
Population)Yes Yes Yes Yes Yes Yes Yes Yes
16-18; 19-24; 25-29;
30-34; 35-39; 40-44;
45-49; 50-54; 55-59;
60-64
Broadly comparable -
affected by changes to
welfare system
Cancer Incidence (Indirectly Age-Sex Standardised) (Number
Per 100,000)Yes Yes Yes Yes Yes Yes Yes Yes Not strictly comparable
All Cause Death Rate (Indirectly Age-Sex Standardised)
(Number Per 100,000)Yes Yes Yes Yes Yes Yes Yes Yes Not strictly comparable
Low Weight Single Births (Live Births Less Than 2.5 Kg)
(Percentage)Yes Yes Yes Yes Yes Yes Yes Yes Comparable
Long Term Limiting Il lness (Indirectly Age-Sex Standardised)
(Number Per 100,000)Yes Yes No No Yes No No No
0-4, 5-9, 10-15, 16-
18; 19-24 then 5
year age bands up
to 85+. Also 0-15, 0-
18, 16-64, 65+.
Not comparable
Limiting Long-Term Illness -Child Index Yes Yes No No No No No No
Primary School Absence Rate Yes Yes Yes Yes No No No No Partly Comparable
Secondary School Absence Rate Yes Yes Yes Yes No No No No Partly Comparable
Key Stage 2 Average Points Score (Points Score) Yes Yes Yes Yes Yes Yes Yes YesComparable up to data
published in 2016
Key Stage 3 Mean Points Score Yes Yes Yes Yes No No No No Partly Comparable
Key Stage 4 Mean Points Score Yes Yes Yes Yes No No No No Partly Comparable
Key Stage 4 Capped Points Score (Points Score) No No No No Yes Yes Yes Yes Comparable
Key Stage 4 Level 2 Inclusive (Percentage) No No No No Yes Yes Yes Yes Comparable
People Not Entering Higher Education Aged 18-19
(Percentage)Yes Yes Yes Yes Yes No No No Comparable
Adults Aged 25-64 With No Qualifications (Percentage) Yes Yes No No Yes No No No Broadly comparable
Repeat Absenteeism (Percentage) No No No No Yes Yes Yes YesPrimary and
SecondaryComparable
Health
Income
Education

25
Table 1: List of indicators in the Welsh Index of Multiple Deprivation since 2008 edition (continued)
Domain Name (Most Recent) 2008 2011 2012 2013 2014 2015 2016 2017Age Breakdown
(2014 onwards)Comparability Over Time
Average Private Travel Time To Food Shop (Minutes) No No No No Yes No No No Not currently
Average Private Travel Time To GP Surgery (Minutes) No No No No Yes No No No Not currently
Average Private Travel Time To Leisure Centre (Minutes) No No No No Yes No No No Not currently
Average Private Travel Time To Public Library (Minutes) No No No No Yes No No No Not currently
Average Private Travel Time To Petrol Station (Private
Transport Only) (Minutes)No No No No Yes No No No Not currently
Average Private Travel Time To Pharmacy (Minutes) No No No No Yes No No No Not currently
Average Private Travel Time To Post Office (Minutes) No No No No Yes No No No Not currently
Average Private Travel Time To Primary School (Minutes) No No No No Yes No No No Not currently
Average Private Travel Time To Secondary School (Minutes) No No No No Yes No No No Not currently
Average Public Travel Time To Food Shop (Minutes) No No No No Yes No No No Not currently
Average Public Travel Time To GP Surgery (Minutes) No No No No Yes No No No Not currently
Average Public Travel Time To Leisure Centre (Minutes) No No No No Yes No No No Not currently
Average Public Travel Time To Public Library (Minutes) No No No No Yes No No No Not currently
Average Public Travel Time To Pharmacy (Minutes) No No No No Yes No No No Not currently
Average Public Travel Time To Post Office (Minutes) No No No No Yes No No No Not currently
Average Public Travel Time To Primary School (Minutes) No No No No Yes No No No Not currently
Average Public Travel Time To Secondary School (Minutes) No No No No Yes No No No Not currently
Average Travel Time To An NHS Dentist Yes Yes No No No No No No Partly Comparable
Average Travel Time To A Food Shop Yes Yes No No No No No No Partly Comparable
Average Travel Time To A GPs Surgery Yes Yes No No No No No No Partly Comparable
Average Travel Time To A Leisure Centre Yes Yes No No No No No No Partly Comparable
Average Travel Time To A Library Yes Yes No No No No No No Partly Comparable
Average Travel Time To A Post Office Yes Yes No No No No No No Partly Comparable
Average Travel Time To A Primary School Yes Yes No No No No No No Partly Comparable
Average Travel Time To Public Transport Yes Yes No No No No No No Partly Comparable
Average Travel Time To A Secondary School Yes Yes No No No No No No Partly Comparable
Access to Services
26
Table 1: List of indicators in the Welsh index of Multiple Deprivation since 2008 edition (continued)
Domain Name (Most Recent) 2008 2011 2012 2013 2014 2015 2016 2017Age Breakdown
(2014 onwards)Comparability Over Time
Adult Offenders Yes Yes Yes No No No No No Partly Comparable
Anti Social Behaviour (ASB) (Rate (Per 100)) No No No No Yes No Yes No Comparable
Police Recorded Burglary (Rate (Per 100)) Yes Yes Yes Yes Yes No Yes No Comparable
Police Recorded Criminal Damage (Rate (Per 100)) Yes Yes Yes No Yes No Yes No Broadly Comparable
Fire Incidences (Rate (Per 100)) Yes Yes Yes Yes Yes Yes Yes Yes Comparable
Police Recorded Theft (Rate (Per 100)) Yes Yes Yes No Yes No Yes No Broadly Comparable
Police Recorded Violent Crime (Rate (Per 100)) Yes Yes Yes No Yes No Yes No Broadly Comparable
Youth Offenders Yes Yes No No No No No No Partly Comparable
Air Quality (up to 2013)/Air Concentration (2014 onwards)
(Score (Between 0 And 100))Yes Yes Yes Yes Yes No No No Broadly Comparable
Air Emissions (Score (Between 0 And 100)) Yes Yes Yes Yes Yes No No No Broadly Comparable
Flood Risk (Score (Between 0 And 100)) Yes Yes No No Yes No No No Comparable
Proximity To Waste Disposal And Industrial Sites (Score
(Between 0 And 100))Yes Yes No No Yes No No No Comparable
Population Living In Households With No Central Heating
(Percentage)Yes Yes No No Yes No No No
0-4, 5-9, 10-15, 16-
18; 19-24 then 5
year age bands up
to 85+. Also 0-15, 0-
18, 16-64, 65+.
Broadly Comparable
No Central Heating - Child Index Yes Yes No No No No No No
People Living In Overcrowded Households (Bedrooms
Measure) (Percentage)Yes Yes No No Yes No No No
0-4, 5-9, 10-15, 16-
18; 19-24 then 5
year age bands up
to 85+. Also 0-15, 0-
18, 16-64, 65+.
Not Comparable -
changed to bedroom
measure for 2014
Overcrowding - Child Index Yes Yes No No No No No No
Housing
Community Safety
Physical Environment

27
WIMD 2008 WIMD 2011 2012 2013 2014 2015 2016 2017
INDICATOR
LS
OA
MS
OA
LA
SR
A
RU
CF
A
DE
CIL
E
LA
-RU
LS
OA
MS
OA
LA
SR
A
RU
CF
A
DE
CIL
E
LA
-RU
LS
OA
MS
OA
LA
SR
A
RU
CF
A
DE
CIL
E
LA
-RU
LS
OA
MS
OA
LA
SR
A
RU
CF
A
DE
CIL
E
LA
-RU
LS
OA
MS
OA
LA
SR
A
RU
CF
A
DE
CIL
E
LA
-RU
LS
OA
MS
OA
LA
SR
A
RU
CF
A
DE
CIL
E
LA
-RU
BU
A
LS
OA
MS
OA
LA
SR
A
RU
CF
A
DE
CIL
E
LA
-RU
BU
A
LS
OA
MS
OA
LA
SR
A
RU
CF
A
DE
CIL
E
LA
-RU
BU
A
Income
Income Deprivation (%)
Income Related Benefits - Child Index (%) P P P P P P P P P P P P P P P PEmployment
Employment Related Benefits (% of working-age population)
Health
Death Rate (rate per 100,000)
Low Birth Weight (%)
Cancer Incidence Rate (rate per 100,000)
Limiting Long Term Illness (rate per 100,000)P P P P P P P P P P P P P P P P P P P P P P P P
Limiting Long Term Illness - Child IndexP P P P P P P P
Education
Key Stage 2 Mean Points Score
Key Stage 3 Mean Points Score
Key Stage 4 Mean Points Score
Primary School Absence Rate (%)
Secondary School Absence Rate (%)
Key Stage 4 Level 2 Inclusive (%)
Key Stage 2 Average Points Score (points score)
Key Stage 4 Capped Points Score (points score)
Repeat Absenteeism (%)
No Qualifications Aged 25-64 (%)
Not entering Higher Education Aged 18-19 (%)
Housing
No Central Heating (%)
Overcrowding within a Household (%)
No Central Heating - Child Index (%)
Overcrowding - Child Index (%)
Access to Services
Average Private Travel Time to Food Shop (mins)
Average Private Travel Time to GP Surgery (mins)
Average Private Travel Time to Leisure Centre (mins)
Average Private Travel Time to Public Library (mins)
Average Private Travel Time to Petrol Station (mins
Average Private Travel Time to Pharmacy (mins)
Average Private Travel Time to Post Office (mins)
Average Private Travel Time to Primary School (mins)
Average Private Travel Time to Secondary School (mins)
Average Public Travel Time to Food Shop (mins)
Average Public Travel Time to GP Surgery (mins)
Average Public Travel Time to Leisure Centre (mins)
Average Public Travel Time to Public Library (mins)
Average Public Travel Time to Pharmacy (mins)
Average Public Travel Time to Post Office (mins)
Average Public Travel Time to Primary School (mins)
Average Public Travel Time to Secondary School (mins)
Average Travel time to an NHS Dentist (mins)
Average Travel time to a Food Shop (mins)
Average Travel time to a GPs Surgery (mins)
Average Travel time to a Leisure Centre (mins)
Average Travel time to a Library (mins)
Average Travel time to a Post Office (mins)
Average Travel time to a Primary School (mins)
Average Travel time to a Secondary School (mins)
Average Travel time to Transport Node (mins)
Community Safety
Police Recorded Criminal Damage (Rate Per 100)
Police Recorded Violent Crime (Rate Per 100) P P P P P P P P P P P P P P P P P P P P P P P P P P P P P P P P P P P P P P P PPolice Recorded Theft (Rate Per 100) P P P P P P P P P P P P P P P P P P P P P P P P P P P P P P P P P P P P P P P PPolice Recorded Burglary (Rate Per 100) P P P P P P P P P P P P P P P P P P P P P P P P P P P P P P P P P P P P P P P P P P P P P P PFire Incidents (Rate Per 100) P P P P P P P P P P P P P P P P P P P P P P P P P P P P P P P P P P P P P P P P P P P P P P P P P P P P P P P P P P P P P P PPolice Recorded Anti-Social Behaviour (Rate Per 100)
P P P P P P P P P P P P P P P PYouth Offenders (%) P P P P P P P P P P P P P P P PAdult Offenders (%) P P P P P P P P P P P P P P P P P P P P P P P PPhysical Environment
Air concentrations (Air Quality subdomain)
Air Emissions (Air Quality subdomain)
Flood Risk (score between 0 and 100) P P P P P P P P P P PProximity to Waste Disposal and Industrial Sites P P P P PKey: LSOA - Lower Super Output Area; MSOA - Middle Super Output Area; LA - Local Authority; SRA - Strategic Regeneration Area;RU - Rural/Urban Classification; CFA - Communities First Area; DECILE; LA-RA - Rural/Urban Classification within Local Authority; BUA - Built Up Area
P P P P P P P P
P P P P P P P P
P P P P P P P P
AGGREGATION LEVEL
P P P P P P P P
P P P P P P PP
P P P P P P P
P P P P P P PP
AGGREGATION LEVEL
P P P P P P P
P P P
P
P P P P PP P
P P P P
P P P P P P P P P
P P P P P P P
Table 2: List of WIMD Indicators by Aggregation
Level as at 30 Jan 2018
P P
P
P
P
P
P
P PP
P
PP P P P
P P P P
AGGREGATION LEVEL
P P
P P P P P P P
P P P
P
P P P P P P
AGGREGATION LEVEL
P P P P P P P P
PP P P P
P
P P
P PP
P
P P
P PP P
P P P P P P
P P P P P P
P
P P P P P P
P P P P P P
P P P P P P
AGGREGATION LEVEL
P P P P P P
P P P P P P
P P P P P P P
PP P P P P P
P
AGGREGATION LEVEL
P P P P P P
P
PP
P P P P P P
P P P P P P P
P P P P P P P
P P P P P P
P
P P
AGGREGATION LEVEL
P P P P P
P P
P
P
P P P P P P P
P
P P P P P P P P
P P P PP P
P P
P
P
P P
P P
P P P P P
AGGREGATION LEVEL
P P P P P P P
P P P P P P P
P P P P P P P P
P P P P P P P P
P P P P P P P P
28
Table 3: Reference periods for annual WIMD indicator data The below table gives a quick overview of the reference periods for each year of WIMD indicator data published.
For further details see the technical reports for WIMD 2008, 2011 and 2014.
Domain Indicator 2008 2011 2012 2013 2014 2015 2016 2017
Income Income-related benefit claimants and their dependents 2006/07 2009/10 2010/11 2011/12 2012/13 2013/14 2015-16 2016-17
Adults and Children in families receiving Tax Credits Aug 2005 Aug 2009 Aug 2010 Aug 2011 Aug 2012 Aug 2013 Aug 2014 Aug 2015
Supported Asylum Seekers Jun 2007 Dec 2010 Dec 2011 Aug 2012 Sep 2014 Jun 2015 Jul 2016 Jun 2017
People on Universal Credit 2015-16 2016-17
Employment Claimants of Unemployment-related benefits / JSA 2006/07 2009/10 2010/11 2011/12 2012/13 2013/14 2015-16 2016-17
Incapacity Benefit/Severe Disablement Allowance 2006/07 2009/10 2010/11 2011/12 2012/13 2013/14 2015-16 2016-17
New Deal for Young People and Intensive Activity Period 2005 2009/10 2010/11 2011/12
New Deal for Lone Parents 2005 2009/10 2010/11 2011/12
Claimants of Employment and Support Allowance 2009/10 2010/11 2011/12 2012/13 2013/14 2015-16 2016-17
People on Universal Credit 2015-16 2016-17
Health Limiting long-term illness 2001 2001 2011
Standardised all-cause death rate 1997 to 2006 2001 to 2009 2002 to 2011 2003 to 2012 2004 to 2013 2005 to 2014 2006 to 2015 2007 to 2016
Standardised cancer incidence rate 1996 to 2005 2000 to 2009 2001 to 2010 2002 to 2011 2003 to 2012 2004 to 2013 2005 to 2014 2006 to 2015
Singleton low birth weights 1997 to 2006 2001 to 2009 2002 to 2011 2003 to 2012 2004 to 2013 2005 to 2014 2006 to 2015 2007 to 2016
Education KS2 APS 2005, 2006, 2007 2008, 2009, 2010 2009, 2010, 2011 2010, 2011, 2012 2010/11 to 2012/13 2011/12 to 2013/14 2012/13 to 2014/15 2013/14 to 2015/16
KS3 APS 2005, 2006, 2007 2008, 2009, 2010 2009, 2010, 2011 2010, 2011, 2012
KS4 APS 2005, 2006 2009, 2010 2009, 2010, 2011 2010, 2011, 2012
Primary school absence rates 2005/06 to 2006/07 2008/09 to 2009/10 2008/09 to 2010/11 2009/10 to 2011/12
Secondary school absence rates 2004/05 to 2006/07 2008/09 to 2009/10 2008/09 to 2010/11 2009/10 to 2011/12
Proportion of people not entering HE aged 18-19 1998 to 2005 1998 to 2005 2005/06 to 2010/11
Percentage of adults aged 25-64 with no qualifications 2001 2001 2011
KS4l2i 2010/11 to 2012/13 2011/12 to 2013/14 2012/13 to 2014/15 2013/14 to 2015/16
KS4 CPS 2010/11 to 2012/13 2011/12 to 2013/14 2012/13 to 2014/15 2013/14 to 2015/16
Repeat Absenteeism Rate 2010/11 to 2012/13 2011/12 to 2013/14 2012/13 to 2014/15 2013/14 to 2015/16
Housing Lack of central heating 2001 2001 2011
Overcrowding (excluding student households) 2001 2001 2011
Physical Environment Air quality - concentrations 2006 2008 2009 2010 2012
Air emissions 2005 2008 2009 2010 2012
Flood risk 2007 2009 2014
Proximity to waste disposal and industrial sites 2007 2010 2014
Access to Services Food shop - public transport 2007/08 2007/08 2013/14
GP surgery - public transport 2007/08 2007/08 2013/14
Pharmacy - public transport 2013/15
Primary school - public transport 2007/08 2007/08 2013/14
Post office - public transport 2007/08 2007/08 2013/14
Public library - public transport 2007/08 2007/08 2013/14
Leisure centre - public transport 2007/08 2007/08 2013/14
NHS dentist - public transport 2007/08 2007/08
Secondary school - public transport 2007/08 2007/08 2013/14
Transport nodes - public transport 2007/08 2007/08
Food shop - private transport 2013/14
GP surgery - private transport 2013/14
Pharmacy - private transport 2013/15
Primary school - private transport 2013/14
Post office - private transport 2013/14
Public library - private transport 2013/14
Leisure centre - private transport 2013/14
Petrol station - private transport 2013/14
Secondary school - private transport 2013/14
Community Safety Percentage of Adult Offenders 2005-06 to 2006-07 2008-09 to 2009-10 2009 to 2011
Police recorded burglary 2008-09 to 2009-10 2009 to 2011 2010 to 2012 2012-13 to 2013-14 2014-15 to 2015-16
Police recorded criminal damage 2008-09 to 2009-10 2009 to 2011 2012-13 to 2013-14 2014-15 to 2015-16
Police recorded theft 2008-09 to 2009-10 2009 to 2011 2012-13 to 2013-14 2014-15 to 2015-16
Police recorded violent crime 2009-10 2009 to 2011 2012-13 to 2013-14 2014-15 to 2015-16
Percentage of youth offenders 2005-06 to 2006-07 2008-09 to 2009-10
Police Force Recorded Crime 2005-06 to 2006-07
Fire Incidence 2005 to 2006 2009-10 to 2010-11 2010-11 to 2011-12 2011-12 to 2012-13 2012-13 to 2013-14 2013-14 to 2014-15 2014-15 to 2015-16 2015-16 to 2016-17
Anti Social Behaviour Jul12 to Jun14 2014-15 to 2015-16
Where a - is used it denotes a financial year e.g. 2015-16 denotes the financial year from April 2015 to March 2016
Where a / is used it denotes an academic year e.g. 2015/16 denotes the academic year from September 2015 to July 2016
Some of the data that uses a / is from an approximation of an academic year. This occurs when the most recent data available was from the end of one year and the start of another.

29
Table 4: Disclosure control applied to data for WIMD 2011 and WIMD 2014
Disclosure Control
WIMD 2011 WIMD 2014
Applied Method Applied Method
Income Income deprivation composite indicator By WG At Source (DWP)Some suppression also applied by
WG
EmploymentProportion of working-age population on Employment
related benefitsBy WG At Source (DWP)
Cancer incidence By WG Probablistic Rounding By WG Supression
Long Term Limiting Illness By WG At Source (ONS)
Low Birth Weight By WG Probablistic Rounding By WG Supression
All Cause Death Rate By WG Probablistic Rounding By WG Supression
Key Stage 2 Average Point Score By WG Rounded By WG Supression and Rounding
Key Stage 4 Average Capped Point Score By WG Rounded By WG Supression and Rounding
Key Stage 4 Level 2 Inclusive Not in WIMD 2011 By WG Supression and Rounding
Repeat Absenteeism Combined Indicator not in WIMD 2011 By WG Supression and Rounding
Proportion of people not entering Higher Education
aged 18-19By WG Probablistic Rounding By WG Supression and Rounding
Number of Adults aged 25-64 with No Qualifications By WG Probablistic Rounding At Source (ONS)
Food shops No
GP surgeries No
Primary schools No
Secondary schools No
Post office No
Public library No
Leisure centre No
Pharmacies No
Petrol stations (private transport only) No
Domain Indicator
Health
Education
Access to
services
30
Table 4: Disclosure control applied to data for WIMD 2011 and WIMD 2014 (continued)
Disclosure Control
WIMD 2011 WIMD 2014
Police recorded burglary By WG Probablistic Rounding By WG Supression and Rounding
Police recorded criminal damage By WG Probablistic Rounding By WG Supression and Rounding
Police recorded theft By WG Probablistic Rounding By WG Supression and Rounding
Police recorded violent crime By WG Probablistic Rounding By WG Supression and Rounding
Fire Incidences By WG Probablistic Rounding No Rounding
Anti Social Behaviour (ASB) Not in WIMD 2011 By WG Supression and Rounding
Percentage of adult offenders By WG Probablistic Rounding No Probablistic Rounding
Percentage of youth offenders By WG Probablistic Rounding No Probablistic Rounding
Households at risk of flooding No No
Air Quality – Air Emissions No No
Air Quality – Air Concentrations No No
Proximity to waste disposal and industrial sites No No
Overcrowding – bedroom occupancy Rounded At Source (ONS)
Lack of Central Heating Rounded At Source (ONS)
Domain Indicator
Community
Safety
Physical
Environment
Housing

31
Table 5: LSOA changes between the 2001 Census and 2011 Census
LSOA 2001 Local Authority LSOA 2001 Name LSOA 2011 LSOA 2011 Name Change
W01000045 Gwynedd Aberdaron W01001932 Aberdaron / Botwnnog & Tudweiliog M
W01000046 Gwynedd Aberdovey W01001933 Aberdovey / Bryn-crug / Llanfihangel M
W01000055 Gwynedd Botwnnog & Tudweiliog W01001932 Aberdaron / Botwnnog & Tudweiliog M
W01000058 Gwynedd Bryn-crug/Llanfihangel W01001933 Aberdovey / Bryn-crug / Llanfihangel M
W01000120 Conwy Abergele Pensarn W01001927 Abergele Pensarn 1 S
W01000120 Conwy Abergele Pensarn W01001928 Abergele Pensarn 2 S
W01000160 Conwy Llansanffraid 1 W01001926 Llansanffraid M
W01000161 Conwy Llansanffraid 2 W01001926 Llansanffraid M
W01000357 Wrexham Dyffryn Ceiriog/Ceiriog Valley 1 W01001930 Ceiriog Valley 3 M
W01000358 Wrexham Dyffryn Ceiriog/Ceiriog Valley 2 W01001930 Ceiriog Valley 3 M
W01000421 Wrexham Smithfield W01001929 Smithfield 2 S
W01000421 Wrexham Smithfield W01001931 Smithfield 3 S
W01000435 Powys Crickhowell 1 W01001903 Crickhowell X
W01000436 Powys Crickhowell 2 W01001904 Llangattock and Glangrwyney X
W01000437 Powys Cwm-twrch W01001899 Cwm-twrch X
W01000462 Powys Llangattock W01001904 Llangattock and Glangrwyney X
W01000463 Powys Llangors & Bwlch W01001905 Llangors, Bwlch & Grwyney X
W01000468 Powys Llanrhaeadr-ym-Mochnant W01001906 Llanrhaeadr-ym-Mochnant X
W01000469 Powys Llanrhaeadr-ym-Mochnant/Llansilin W01001907 Llansilin X
W01000490 Powys St. John 1 W01001901 St. John 1 X
W01000491 Powys St. John 2 W01001902 St. John 2 X
W01000495 Powys Talybont-on-Usk W01001897 Talybont-on-Usk X
W01000514 Ceredigion Aberystwyth Gogledd/North W01001934 Penglais M
W01000520 Ceredigion Borth 1 W01001937 Borth M
W01000521 Ceredigion Borth 2 W01001937 Borth M
W01000526 Ceredigion Faenor 2 W01001934 Penglais M
W01000530 Ceredigion Llanbadarn Fawr - Padarn & Llanbadarn Fawr - Sulien W01001935 Llanbadarn Fawr South S
W01000530 Ceredigion Llanbadarn Fawr - Padarn & Llanbadarn Fawr - Sulien W01001936 Llanbadarn Fawr North S

32
Table 5: LSOA changes between the 2001 Census and 2011 Census continued
LSOA 2001 Local Authority LSOA 2001 Name LSOA 2011 LSOA 2011 Name Change
W01000661 Carmarthenshire Glanymor 3 W01001923 Glanymor 3 S
W01000661 Carmarthenshire Glanymor 3 W01001924 Glanymor 4 S
W01000668 Carmarthenshire Hengoed (Carmarthenshire) 2 W01001925 Hengoed 2 M
W01000669 Carmarthenshire Hengoed (Carmarthenshire) 3 W01001925 Hengoed 2 M
W01000743 Swansea Castle 2 W01001955 Castle 2 North S
W01000743 Swansea Castle 2 W01001958 Castle 2 South S
W01000748 Swansea Castle 7 W01001938 Castle 7 East S
W01000748 Swansea Castle 7 W01001957 Castle 7 West S
W01000780 Swansea Killay North 1 W01001956 Killay 3 M
W01000783 Swansea Killay South 2 W01001956 Killay 3 M
W01000972 Neath Port Talbot Ystalyfera 1 W01001900 Ystalyfera 1 X
W01000988 Bridgend Bryntirion, Laleston and Merthyr Mawr 1 W01001918 Bryntirion Laleston and Merthyr Mawr 1 S
W01000988 Bridgend Bryntirion, Laleston and Merthyr Mawr 1 W01001919 Bryntirion Laleston and Merthyr Mawr 4 S
W01000988 Bridgend Bryntirion, Laleston and Merthyr Mawr 1 W01001920 Bryntirion Laleston and Merthyr Mawr 5 S
W01000988 Bridgend Bryntirion, Laleston and Merthyr Mawr 1 W01001921 Bryntirion Laleston and Merthyr Mawr 6 S
W01001074 The Vale of Glamorgan Castleland 2 W01001910 Castleland 2G S
W01001074 The Vale of Glamorgan Castleland 2 W01001911 Castleland 2H S
W01001163 Rhondda Cynon Taf Church Village 2 W01001915 Church Village 2 S
W01001163 Rhondda Cynon Taf Church Village 2 W01001916 Church Village 3 S
W01001254 Rhondda Cynon Taf Tonyrefail West 2 W01001914 Tonyrefail West 2 S
W01001254 Rhondda Cynon Taf Tonyrefail West 2 W01001917 Tonyrefail West 4 S
W01001323 Merthyr Tydfil Vaynor 1 W01001898 Vaynor 1 X
W01001544 Monmouthshire Caldicot Castle 2 W01001908 Dewstow M
W01001547 Monmouthshire Croesonen W01001909 Croesonen M
W01001550 Monmouthshire Dewstow & Green Lane 1 W01001908 Dewstow M
W01001570 Monmouthshire Mardy 1 W01001909 Croesonen M
W01001656 Newport Marshfield 1 W01001912 Marshfield 4 S
W01001656 Newport Marshfield 1 W01001913 Marshfield 5 S

33
Table 5: LSOA changes between the 2001 Census and 2011 Census continued
LSOA 2001 Local Authority LSOA 2001 Name LSOA 2011 LSOA 2011 Name Change
W01001700 Cardiff Butetown 2 W01001942 Butetown 3 S
W01001700 Cardiff Butetown 2 W01001950 Butetown 6 S
W01001700 Cardiff Butetown 2 W01001952 Butetown 8 S
W01001701 Cardiff Butetown 3 W01001940 Butetown 2 S
W01001701 Cardiff Butetown 3 W01001943 Butetown 4 S
W01001701 Cardiff Butetown 3 W01001944 Butetown 5 S
W01001701 Cardiff Butetown 3 W01001951 Butetown 7 S
W01001723 Cardiff Cathays 6 W01001922 Cathays 9 S
W01001723 Cardiff Cathays 6 W01001939 Cathays 10 S
W01001723 Cardiff Cathays 6 W01001941 Cathays 11 S
W01001763 Cardiff Grangetown 5 W01001945 Grangetown 10 S
W01001763 Cardiff Grangetown 5 W01001947 Grangetown 12 S
W01001763 Cardiff Grangetown 5 W01001946 Grangetown 11 S
W01001801 Cardiff Llanishen 11 W01001949 Llanishen 11 S
W01001801 Cardiff Llanishen 11 W01001953 Llanishen 12 S
W01001845 Cardiff Radyr 1 W01001948 Radyr & Morganstown 3 S
W01001845 Cardiff Radyr 1 W01001954 Radyr & Morganstown 4 S
M = merge, S = split, X = complex change
Further information on geographical boundary changes between the 2001 and 2011 Census can be found on the Office for National Statistics website.

34
Table 6: WIMD indicator data revisions log
Date Detail of revision
12/08/15 The Department for Work and Pensions discovered an error in the income
indicator data they had provided for the income domain of WIMD 2014
which relates to the accidental exclusion of some data on tax credits.
17/11/15 Following revision of 2014 Income Indicator data above, further
investigation revealed that similar errors affected the 2012 and 2013
Income Indicator data.
09/02/16 The rural urban geography was re-published for pre-2014 indicator data
due to an adjustment to improve the precision of the data.