Embed Size (px)
Citation preview
Wells Fargo Energy
Monday June 8, 2015 SPEE Annual Meeting Halifax, Nova Scotia Phil Kandel, P.E., P.Eng. Sr. Petroleum Engineer Oil & Gas Division – Denver Wells Fargo Energy Group

Presentation Outline
3 Wells Fargo Energy
Presentation Outline
Introduction
Borrowing Base Methodology
Lending Value Price Decks
Operating Costs
Capital Costs
Development Plans
Creative Thinking; Creative Solutions
Conclusions
4 Wells Fargo Energy
Our Outstanding Reputation
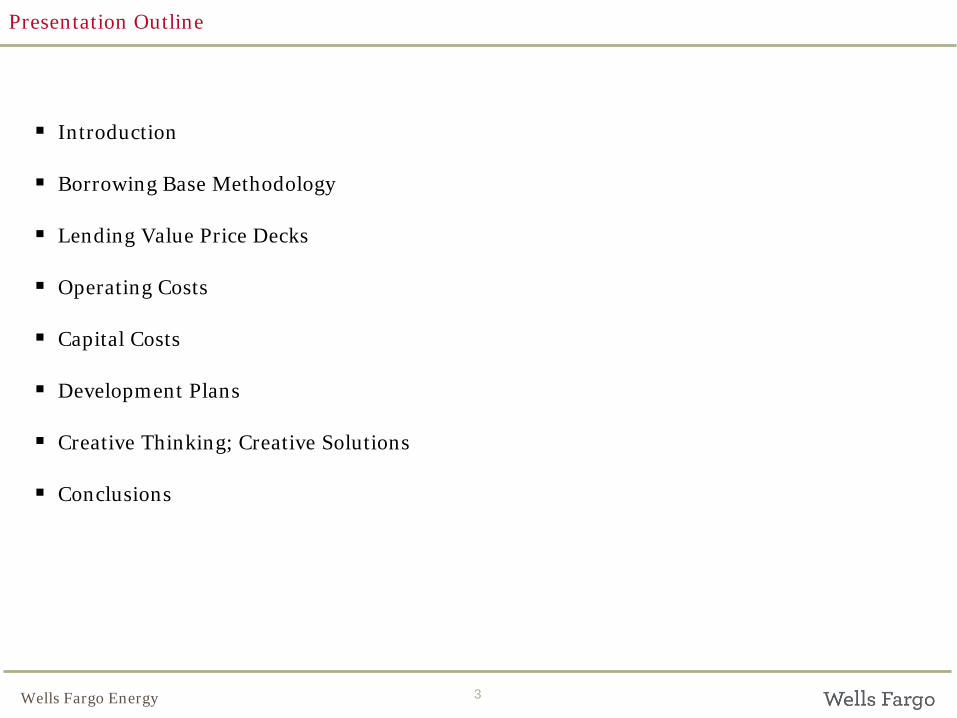
FORTUNE World’s 22nd Most Admired Company (2014) Barron’s World’s 11th Most Respected Company (2014) Forbes 8th Biggest Public Company in the World
(2014) Brand Z/Brand Finance Most Valuable brand in banking/in the World
(2014)
The Chronicle of Philanthropy America’s #2 Most Generous Cash Donor
(2014) Global Finance Best Mobile Solution Provider (2014)
Euromoney Best Global Bank and Best U.S. Bank (2013)
Oil and gas loan syndications1
Best Trade Finance Bank3
Mortgage servicer, Inside Mortgage Finance, 2014 REIT preferred stock underwriter4
Asset-based left lead bookrunner1
Real estate loan syndications1
REIT loan syndications1
Utilities loan syndications1
No. 4 in U.S.
No. 2 in U.S.
No. 3 in U.S.
No. 1 in U.S.
Company data as of December 31, 2014 14Q14 Thomson Reuters, LPC, 24Q14 Deal Logic, 32014 Global Trade Review, 44Q14 Company Filings, 52014 Barron’s
Full-service retail brokerage provider based on number of Financial Advisors in 4Q14, Company and Competitor reports
Hotel & Gaming loan syndications1 Bookrunner for BDCs (Business Development
Companies) 2 Non-investment grade loan syndications1
REIT common stock underwriter 2
High grade loan syndications1
Financial services loan syndications1 Wealth management provider, assets under
management of accounts greater than $5 million5
5 Wells Fargo Energy 5
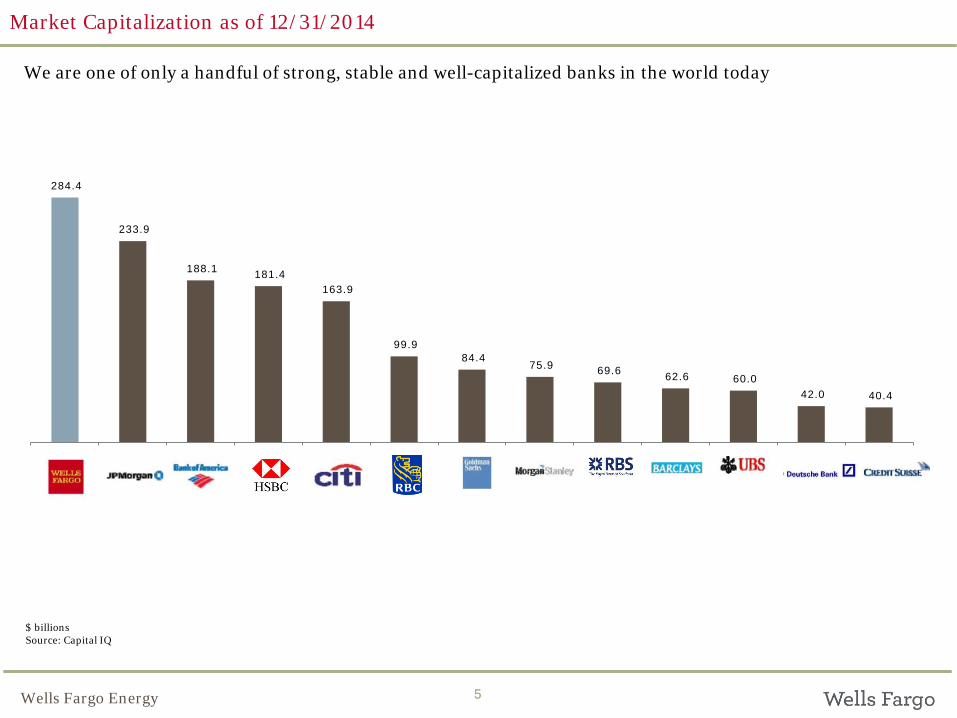
Market Capitalization as of 12/31/2014
We are one of only a handful of strong, stable and well-capitalized banks in the world today
$ billions Source: Capital IQ
284.4
233.9
188.1 181.4 163.9
99.9 84.4
75.9 69.6 62.6 60.0 42.0 40.4
6 Wells Fargo Energy
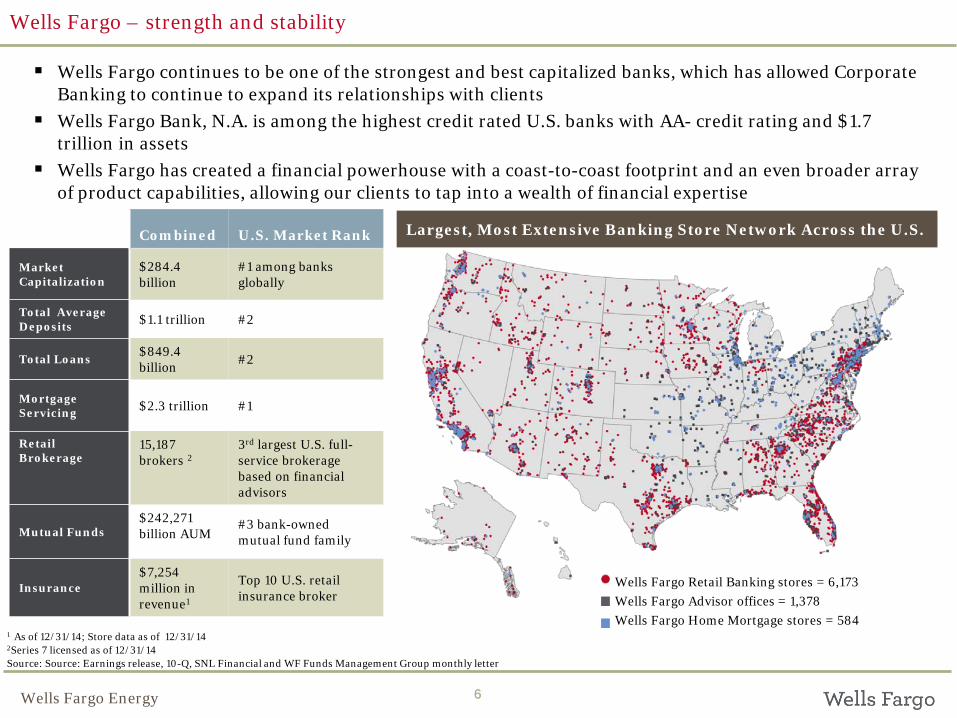
Wells Fargo continues to be one of the strongest and best capitalized banks, which has allowed Corporate Banking to continue to expand its relationships with clients
Wells Fargo Bank, N.A. is among the highest credit rated U.S. banks with AA- credit rating and $1.7 trillion in assets
Wells Fargo has created a financial powerhouse with a coast-to-coast footprint and an even broader array of product capabilities, allowing our clients to tap into a wealth of financial expertise
6
Wells Fargo – strength and stability
Combined U.S. Market Rank
Market Capitalization
$284.4 billion
#1 among banks globally
Total Average Deposits $1.1 trillion #2
Total Loans $849.4 billion #2
Mortgage Servicing $2.3 trillion #1
Retail Brokerage
15,187 brokers 2
3rd largest U.S. full-service brokerage based on financial advisors
Mutual Funds $242,271 billion AUM
#3 bank-owned mutual fund family
Insurance $7,254 million in revenue1
Top 10 U.S. retail insurance broker
Largest, Most Extensive Banking Store Network Across the U.S.
1 As of 12/31/14; Store data as of 12/31/14 2Series 7 licensed as of 12/31/14 Source: Source: Earnings release, 10-Q, SNL Financial and WF Funds Management Group monthly letter
Wells Fargo Retail Banking stores = 6,173 Wells Fargo Advisor offices = 1,378 Wells Fargo Home Mortgage stores = 584
Wells Fargo Energy Group Overview
8 Wells Fargo Energy 8
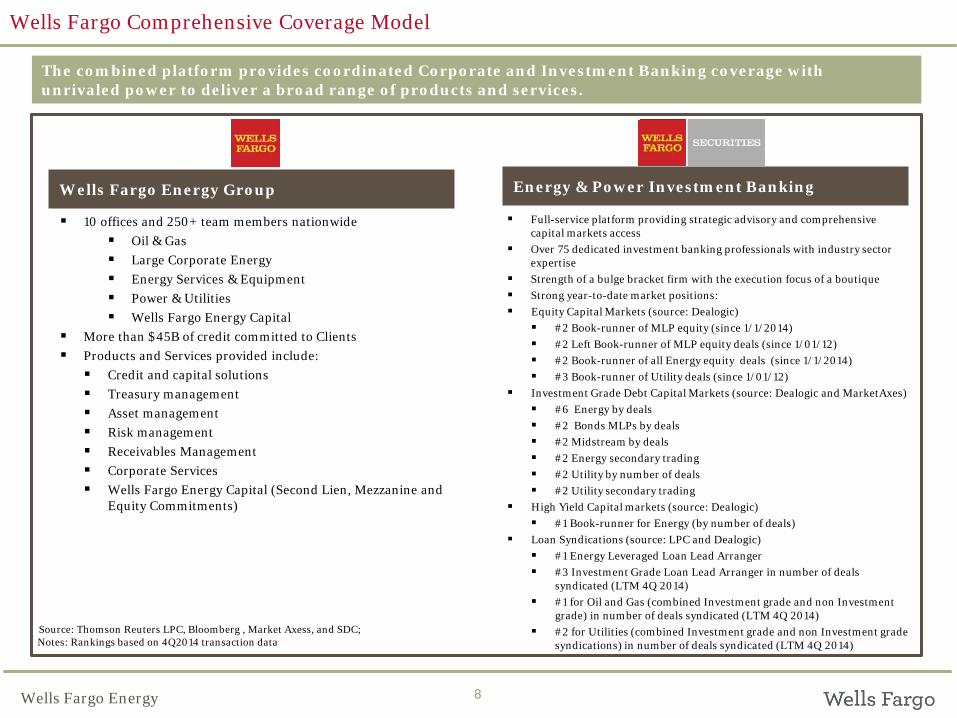
Wells Fargo Comprehensive Coverage Model
10 offices and 250+ team members nationwide Oil & Gas Large Corporate Energy Energy Services & Equipment Power & Utilities Wells Fargo Energy Capital
More than $45B of credit committed to Clients Products and Services provided include: Credit and capital solutions Treasury management Asset management Risk management Receivables Management Corporate Services Wells Fargo Energy Capital (Second Lien, Mezzanine and
Equity Commitments)
Full-service platform providing strategic advisory and comprehensive capital markets access
Over 75 dedicated investment banking professionals with industry sector expertise
Strength of a bulge bracket firm with the execution focus of a boutique Strong year-to-date market positions: Equity Capital Markets (source: Dealogic)
#2 Book-runner of MLP equity (since 1/1/2014) #2 Left Book-runner of MLP equity deals (since 1/01/12) #2 Book-runner of all Energy equity deals (since 1/1/2014) #3 Book-runner of Utility deals (since 1/01/12)
Investment Grade Debt Capital Markets (source: Dealogic and MarketAxes) #6 Energy by deals #2 Bonds MLPs by deals #2 Midstream by deals #2 Energy secondary trading #2 Utility by number of deals #2 Utility secondary trading
High Yield Capital markets (source: Dealogic) #1 Book-runner for Energy (by number of deals)
Loan Syndications (source: LPC and Dealogic) #1 Energy Leveraged Loan Lead Arranger #3 Investment Grade Loan Lead Arranger in number of deals
syndicated (LTM 4Q 2014) #1 for Oil and Gas (combined Investment grade and non Investment
grade) in number of deals syndicated (LTM 4Q 2014) #2 for Utilities (combined Investment grade and non Investment grade
syndications) in number of deals syndicated (LTM 4Q 2014)
Energy & Power Investment Banking Wells Fargo Energy Group
The combined platform provides coordinated Corporate and Investment Banking coverage with unrivaled power to deliver a broad range of products and services.
Source: Thomson Reuters LPC, Bloomberg , Market Axess, and SDC; Notes: Rankings based on 4Q2014 transaction data
Tales of Wells Fargo
Large Corporate
Energy and Power & Utilities
Head: Steve Melton
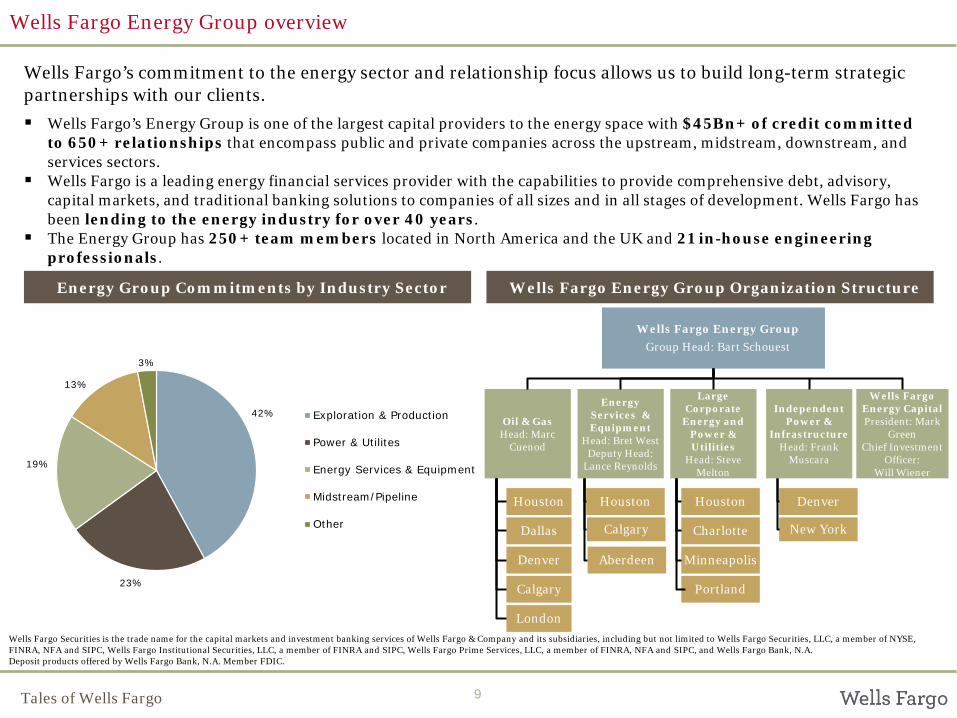
Wells Fargo’s Energy Group is one of the largest capital providers to the energy space with $45Bn+ of credit committed to 650+ relationships that encompass public and private companies across the upstream, midstream, downstream, and services sectors.
Wells Fargo is a leading energy financial services provider with the capabilities to provide comprehensive debt, advisory, capital markets, and traditional banking solutions to companies of all sizes and in all stages of development. Wells Fargo has been lending to the energy industry for over 40 years.
The Energy Group has 250+ team members located in North America and the UK and 21 in-house engineering professionals.
9
Wells Fargo Energy Group overview
Wells Fargo’s commitment to the energy sector and relationship focus allows us to build long-term strategic partnerships with our clients.
Energy Group Commitments by Industry Sector Wells Fargo Energy Group Organization Structure
Wells Fargo Securities is the trade name for the capital markets and investment banking services of Wells Fargo & Company and its subsidiaries, including but not limited to Wells Fargo Securities, LLC, a member of NYSE, FINRA, NFA and SIPC, Wells Fargo Institutional Securities, LLC, a member of FINRA and SIPC, Wells Fargo Prime Services, LLC, a member of FINRA, NFA and SIPC, and Wells Fargo Bank, N.A. Deposit products offered by Wells Fargo Bank, N.A. Member FDIC.
Wells Fargo Energy Group Group Head: Bart Schouest
Oil & Gas Head: Marc
Cuenod
Houston
Dallas
Denver
Calgary
Wells Fargo Energy Capital President: Mark
Green Chief Investment
Officer: Will Wiener
42%
23%
19%
13%
3%
Exploration & Production
Power & Utilites
Energy Services & Equipment
Midstream/Pipeline
Other Charlotte
Portland
Calgary
Houston
Minneapolis Aberdeen
London
Energy
Services & Equipment
Head: Bret West Deputy Head:
Lance Reynolds
New York
Denver
Independent
Power & Infrastructure
Head: Frank Muscara
Houston
Tales of Wells Fargo 10
Wells Fargo Energy Oil & Gas overview
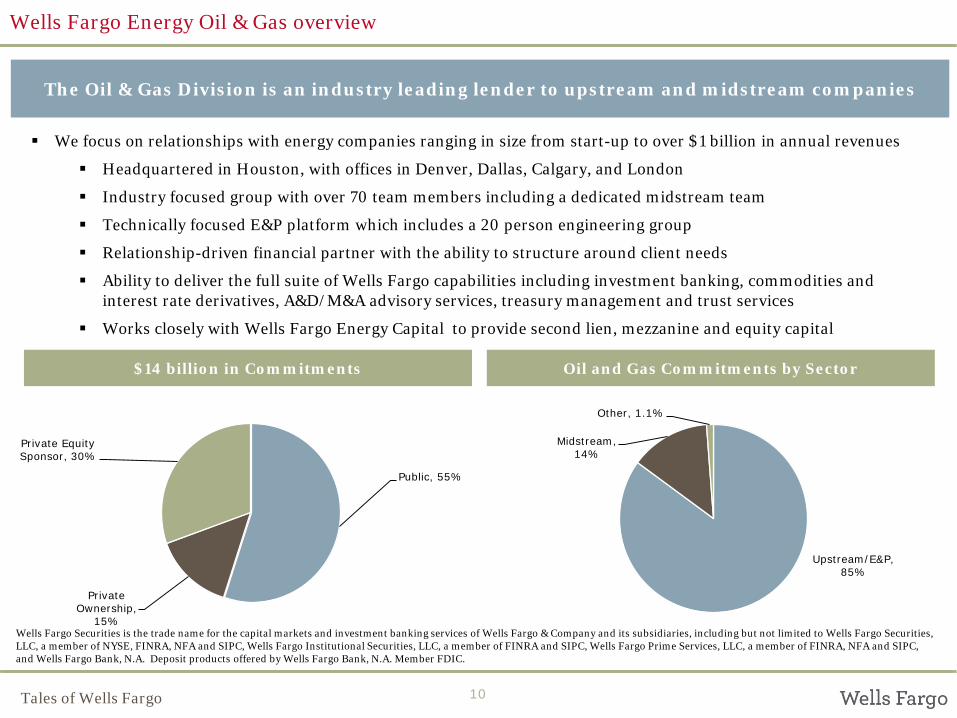
The Oil & Gas Division is an industry leading lender to upstream and midstream companies
Oil and Gas Commitments by Sector $14 billion in Commitments
Wells Fargo Securities is the trade name for the capital markets and investment banking services of Wells Fargo & Company and its subsidiaries, including but not limited to Wells Fargo Securities, LLC, a member of NYSE, FINRA, NFA and SIPC, Wells Fargo Institutional Securities, LLC, a member of FINRA and SIPC, Wells Fargo Prime Services, LLC, a member of FINRA, NFA and SIPC, and Wells Fargo Bank, N.A. Deposit products offered by Wells Fargo Bank, N.A. Member FDIC.
We focus on relationships with energy companies ranging in size from start-up to over $1 billion in annual revenues
Headquartered in Houston, with offices in Denver, Dallas, Calgary, and London
Industry focused group with over 70 team members including a dedicated midstream team
Technically focused E&P platform which includes a 20 person engineering group
Relationship-driven financial partner with the ability to structure around client needs
Ability to deliver the full suite of Wells Fargo capabilities including investment banking, commodities and interest rate derivatives, A&D/M&A advisory services, treasury management and trust services
Works closely with Wells Fargo Energy Capital to provide second lien, mezzanine and equity capital
Public, 55%
Private Ownership,
15%
Private Equity Sponsor, 30%
Upstream/E&P, 85%
Midstream, 14%
Other, 1.1%
Borrowing Base Structure & Methodology
12 Wells Fargo Energy
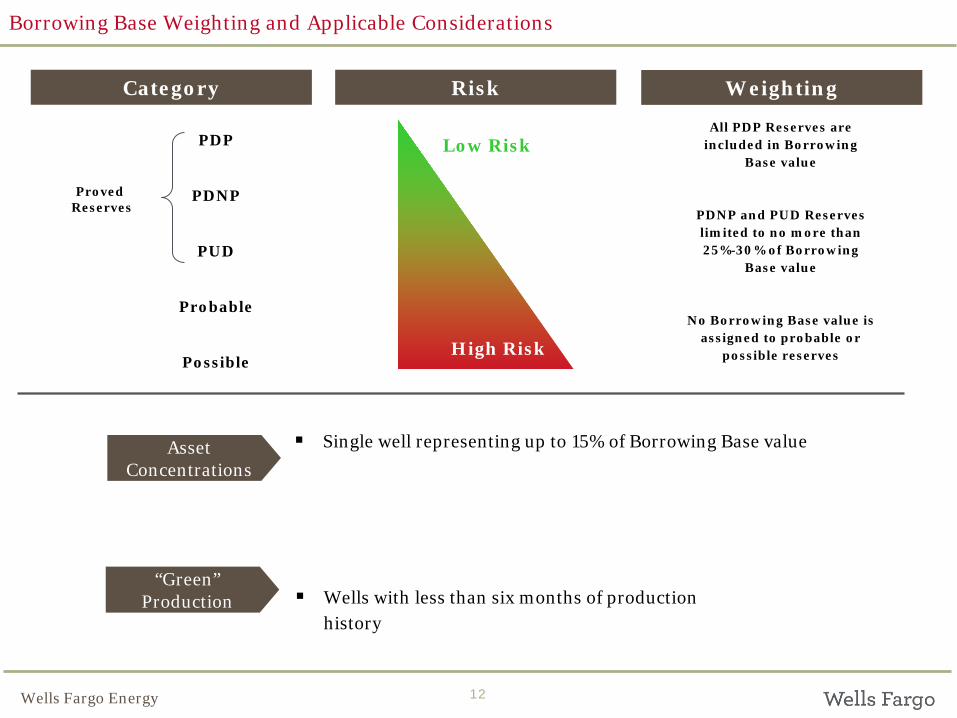
Borrowing Base Weighting and Applicable Considerations
High Risk
Weighting
PDP
PDNP
PUD
Probable
Possible
Low Risk All PDP Reserves are
included in Borrowing Base value
PDNP and PUD Reserves limited to no more than 25%-30% of Borrowing
Base value
No Borrowing Base value is assigned to probable or
possible reserves
Proved Reserves
High Risk
Risk Category
Single well representing up to 15% of Borrowing Base value
Asset Concentrations
“Green” Production Wells with less than six months of production
history
13 Wells Fargo Energy
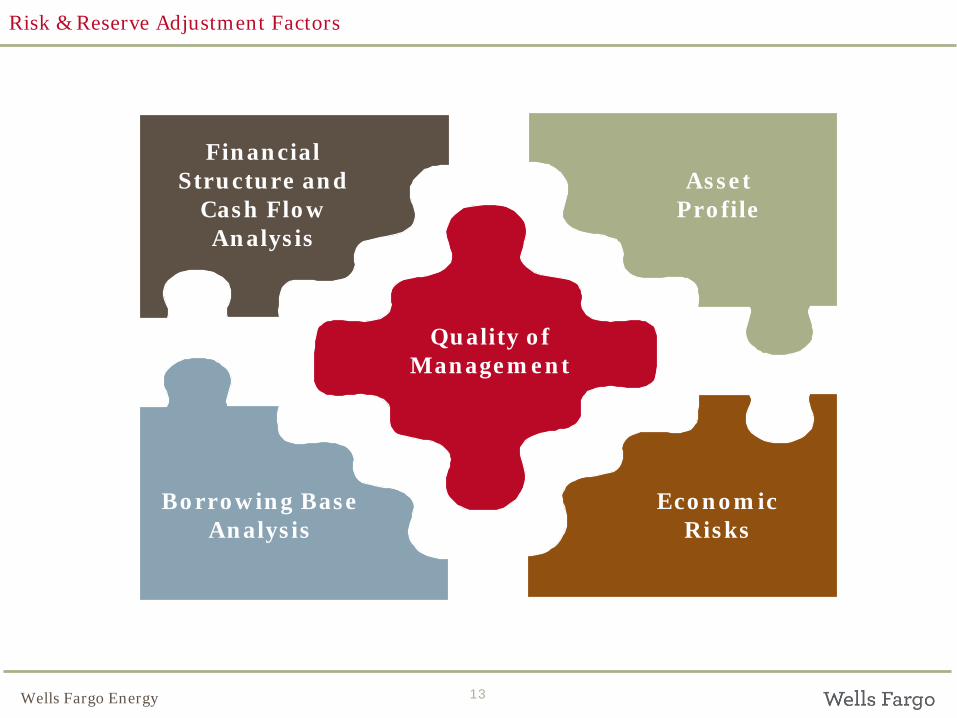
Risk & Reserve Adjustment Factors
Quality of Management
Financial Structure and
Cash Flow Analysis
Asset Profile
Borrowing Base Analysis
Economic Risks

Lending Value Price Decks
15 Wells Fargo Energy
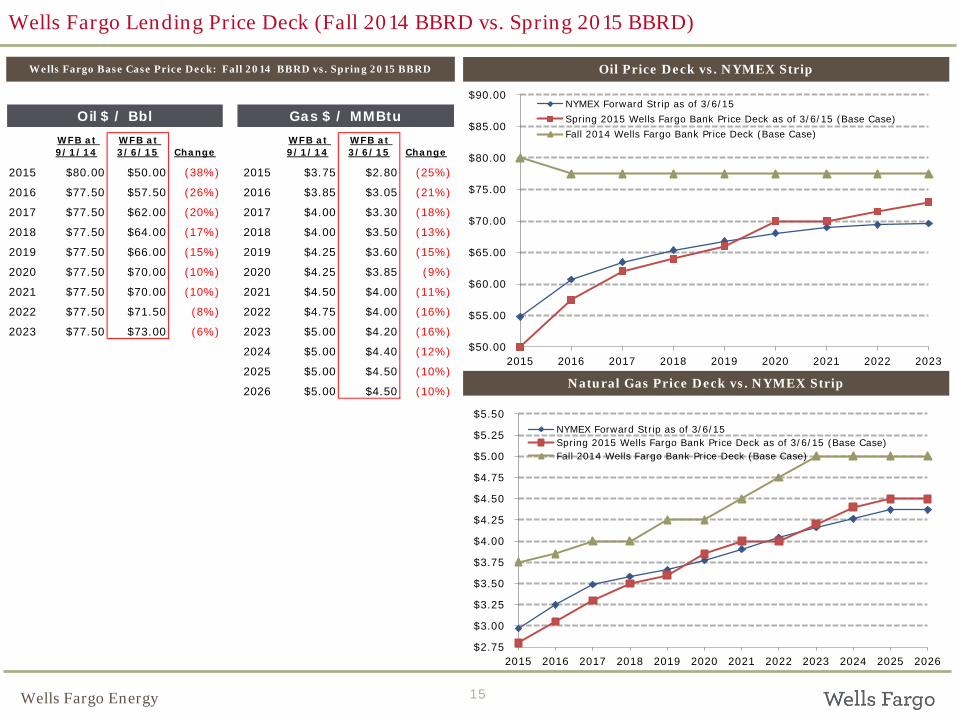
Wells Fargo Base Case Price Deck: Fall 2014 BBRD vs. Spring 2015 BBRD
Wells Fargo Lending Price Deck (Fall 2014 BBRD vs. Spring 2015 BBRD)
Oil Price Deck vs. NYMEX Strip
Natural Gas Price Deck vs. NYMEX Strip
WFB at 9/1/14
WFB at 3/6/15 Change
WFB at 9/1/14
WFB at 3/6/15 Change
2015 $80.00 $50.00 (38%) 2015 $3.75 $2.80 (25%)
2016 $77.50 $57.50 (26%) 2016 $3.85 $3.05 (21%)
2017 $77.50 $62.00 (20%) 2017 $4.00 $3.30 (18%)
2018 $77.50 $64.00 (17%) 2018 $4.00 $3.50 (13%)
2019 $77.50 $66.00 (15%) 2019 $4.25 $3.60 (15%)
2020 $77.50 $70.00 (10%) 2020 $4.25 $3.85 (9%)
2021 $77.50 $70.00 (10%) 2021 $4.50 $4.00 (11%)
2022 $77.50 $71.50 (8%) 2022 $4.75 $4.00 (16%)
2023 $77.50 $73.00 (6%) 2023 $5.00 $4.20 (16%)
2024 $5.00 $4.40 (12%)
2025 $5.00 $4.50 (10%)
2026 $5.00 $4.50 (10%)
Oil $ / Bbl Gas $ / MMBtu
$50.00
$55.00
$60.00
$65.00
$70.00
$75.00
$80.00
$85.00
$90.00
2015 2016 2017 2018 2019 2020 2021 2022 2023
NYMEX Forward Strip as of 3/6/15Spring 2015 Wells Fargo Bank Price Deck as of 3/6/15 (Base Case)Fall 2014 Wells Fargo Bank Price Deck (Base Case)
$2.75
$3.00
$3.25
$3.50
$3.75
$4.00
$4.25
$4.50
$4.75
$5.00
$5.25
$5.50
2015 2016 2017 2018 2019 2020 2021 2022 2023 2024 2025 2026
NYMEX Forward Strip as of 3/6/15Spring 2015 Wells Fargo Bank Price Deck as of 3/6/15 (Base Case)Fall 2014 Wells Fargo Bank Price Deck (Base Case)
Operating Costs (OPEX)
17 Wells Fargo Energy
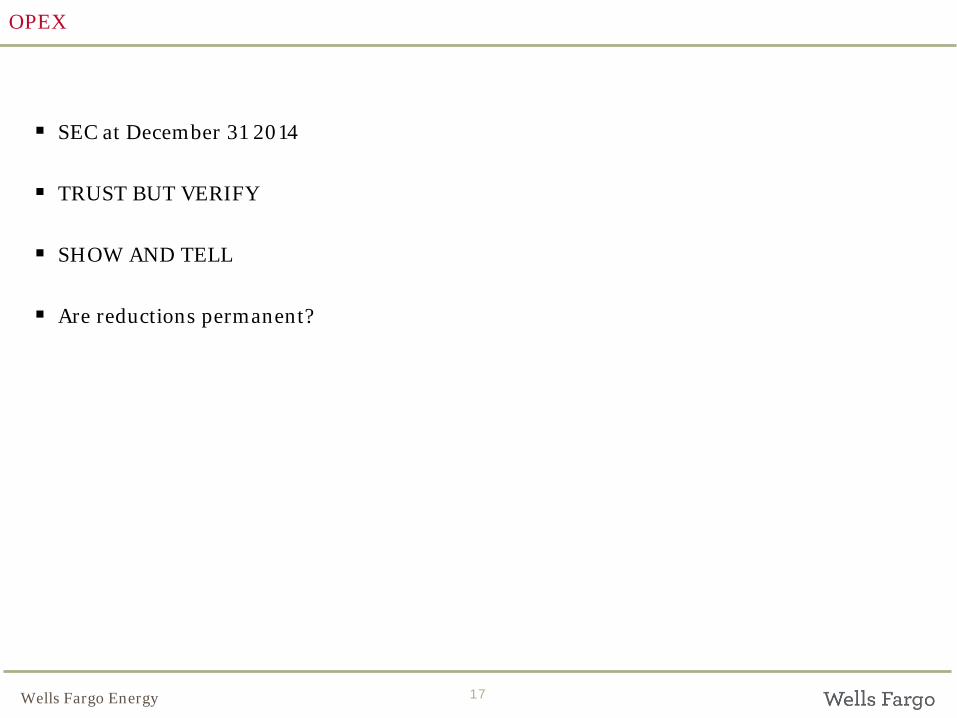
OPEX
SEC at December 31 2014
TRUST BUT VERIFY
SHOW AND TELL
Are reductions permanent?
18 Wells Fargo Energy 18
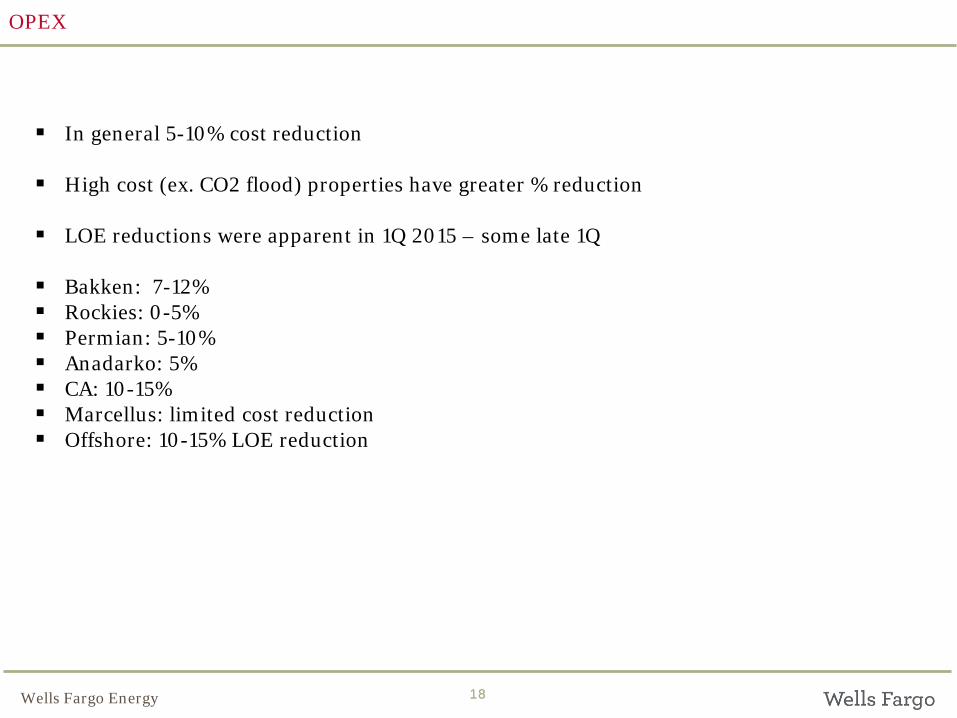
OPEX
In general 5-10% cost reduction
High cost (ex. CO2 flood) properties have greater % reduction
LOE reductions were apparent in 1Q 2015 – some late 1Q
Bakken: 7-12% Rockies: 0-5% Permian: 5-10% Anadarko: 5% CA: 10-15% Marcellus: limited cost reduction Offshore: 10-15% LOE reduction
Capital Costs (CAPEX)
20 Wells Fargo Energy
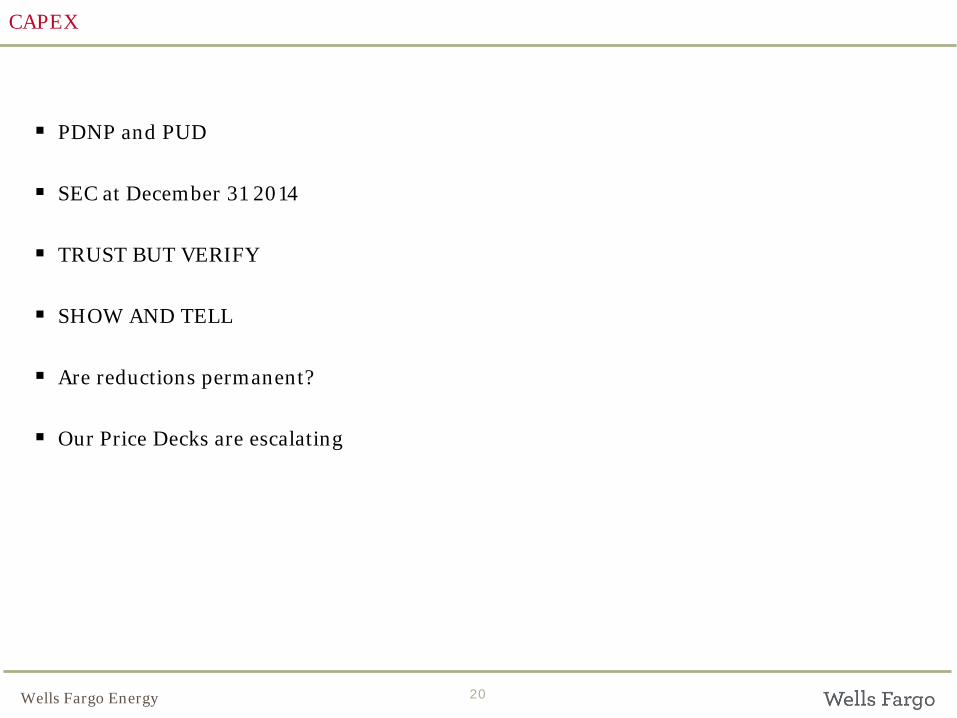
CAPEX
PDNP and PUD
SEC at December 31 2014
TRUST BUT VERIFY
SHOW AND TELL
Are reductions permanent?
Our Price Decks are escalating
21 Wells Fargo Energy 21
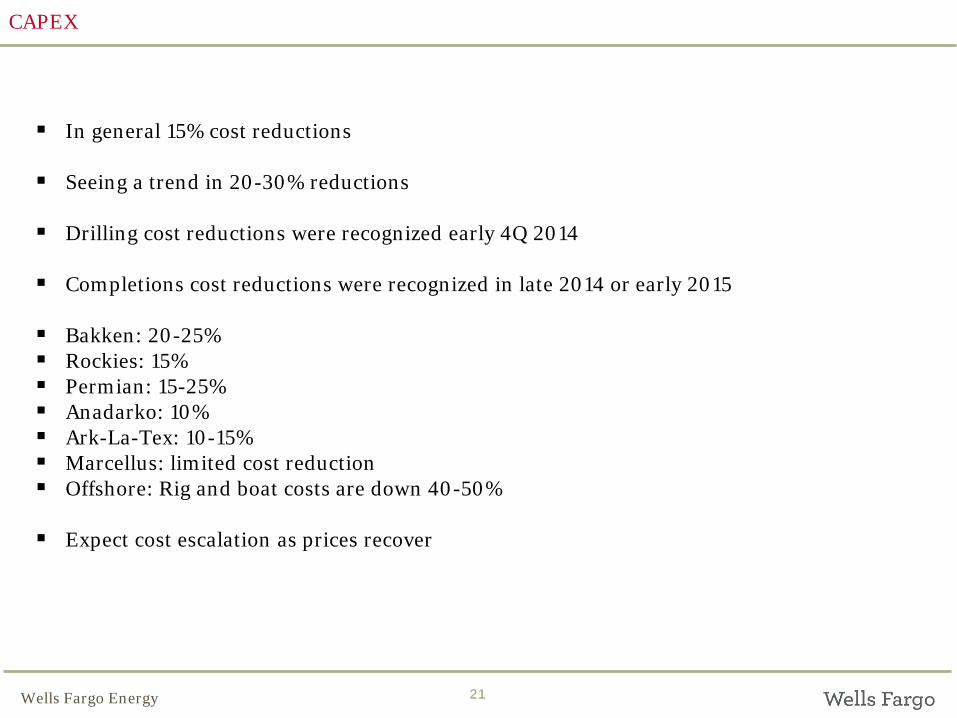
CAPEX
In general 15% cost reductions
Seeing a trend in 20-30% reductions
Drilling cost reductions were recognized early 4Q 2014
Completions cost reductions were recognized in late 2014 or early 2015
Bakken: 20-25% Rockies: 15% Permian: 15-25% Anadarko: 10% Ark-La-Tex: 10-15% Marcellus: limited cost reduction Offshore: Rig and boat costs are down 40-50%
Expect cost escalation as prices recover

Development Plans
23 Wells Fargo Energy
Development Plans
PDNP and PUD
SEC at December 31 2014
1st Quarter update
Revised budgets
24 Wells Fargo Energy
Development Plans
Reserves and production included in the BB?
December 31 2014 or January 1 2015 effective dates
April 1 or May 1 2015 BBRD renewal dates
October 1 or November 1 2015 next BBRD review

Creative Thinking ; Creative Solutions
26 Wells Fargo Energy
Creative Thinking : Creative Solutions
Mix Reserves Engineering with Sound Business Principles
PRMS, SEC and Business Approach Hybrid
PDP, PDNP, PUD Fixation?
Management: Relationship
Equity Sponsor
Financial and Technical/Operations Track Record?
Doing What’s Right For The Customer?
Staggered OPEX and CAPEX reductions related to prices
Multi-Stage BB

Conclusions
28 Wells Fargo Energy
Conclusions
Active and frequent communication between Borrowers and Lenders
Borrowers should engage Banks now to estimate future BB’s, liquidity needs and covenants t0 position for the rest of 2015 and 2016
Banks are more willing to accommodate Borrowers that take pragmatic steps to manage in this environment
Balance the risk
Spring 2015 BBRD season closed
Fall 2015 BBRD season

Thank You

Questions?
31 Wells Fargo Energy
Disclaimer
This document and any other materials accompanying this document (collectively, the “Materials”) are provided for general informational purposes. By accepting any Materials, the recipient thereof acknowledges and agrees to the matters set forth below in this notice. Wells Fargo Securities makes no representation or warranty (express or implied) regarding the adequacy, accuracy or completeness of any information in the Materials. Information in the Materials is preliminary and is not intended to be complete, and such information is qualified in its entirety. Any opinions or estimates contained in the Materials represent the judgment of Wells Fargo Securities at this time, and are subject to change without notice. Interested parties are advised to contact Wells Fargo Securities for more information. The Materials are not an offer to sell, or a solicitation of an offer to buy, the securities or instruments named or described herein. The Materials are not intended to provide, and must not be relied on for, accounting, legal, regulatory, tax, business, financial or related advice or investment recommendations. No person providing any Materials is acting as fiduciary or advisor with respect to the Materials. You must consult with your own advisors as to the legal, regulatory, tax, business, financial, investment and other aspects of the Materials. Wells Fargo Securities is the trade name for certain capital markets and investment banking services of Wells Fargo & Company and its subsidiaries, including Wells Fargo Securities, LLC, member FINRA and SIPC, and Wachovia Bank, National Association. Notwithstanding anything to the contrary contained in the Materials, all persons may disclose to any and all persons, without limitations of any kind, the U.S. federal, state or local tax treatment or tax structure of any transaction, any fact that may be relevant to understanding the U.S. federal, state or local tax treatment or tax structure of any transaction, and all materials of any kind (including opinions or other tax analyses) relating to such U.S. federal, state or local tax treatment or tax structure, other than the name of the parties or any other person named herein, or information that would permit identification of the parties or such other persons, and any pricing terms or nonpublic business or financial information that is unrelated to the U.S. federal, state or local tax treatment or tax structure of the transaction to the taxpayer and is not relevant to understanding the U.S. federal, state or local tax treatment or tax structure of the transaction to the taxpayer. IRS Circular 230 Disclosure: To ensure compliance with requirements imposed by the IRS, we inform you that any tax advice contained in the Materials is not intended or written to be used, and cannot be used, for the purpose of (i) avoiding tax penalties or (ii) promoting, marketing or recommending to another party any transaction or matter addressed herein.