Embed Size (px)
DESCRIPTION
Citation preview

Heritage Growth Equity
www.wellscap.com Third Quarter 2012
WELLS CAPITAL MANAGEMENT® is a registered service mark of Wells Capital Management, Inc.
Heritage U.S. Large Cap Growth Equity represents the Heritage Large Cap Growth Equity strategy within this document.
Heritage U.S. Premier Growth Equity represents the Heritage Premier Growth Equity strategy within this document.
Heritage U.S. All Cap Growth Equity represents the Heritage All Cap Growth Equity strategy within this document.
Wells Capital Management is the trade name of the investment management services provided by certain subsidiaries of Wells Fargo & Company and marketed by Wells
Fargo Securities International Limited and Wells Capital Management, Inc. Wells Fargo Securities International Limited is authorised and regulated by the U.K. Financial
Services Authority.

2 Heritage Growth Equity – Third Quarter 2012
Table of Contents
I. Firm Overview
II. Heritage Growth Strategy
III. Investment Process
IV. Heritage U.S. Large Cap Growth Equity Portfolio Characteristics & Performance
V. Heritage U.S. Premier Growth Equity Portfolio Characteristics & Performance
VI. Heritage U.S. All Cap Growth Equity Portfolio Characteristics & Performance
VII. Addendum
VIII. Supplemental Information

3 Heritage Growth Equity – Third Quarter 2012
Firm Overview

4 Heritage Growth Equity – Third Quarter 2012
Wells Capital Management (“WellsCap”) is a
leading institutional investment management
firm with the strength and resources of our
parent, Wells Fargo Bank, N.A.
Wells Capital Management
Autonomous Investment Teams
Preserve agility and focus
Consistently generate alpha
Have freedom from the distractions of running a business
Dynamic Client Relationships
We listen, inform, and analyze
We customize solutions as appropriate
We are consultative to meet clients’ evolving needs
Independent Risk Management
Instills a culture of accountability for performance
Facilitates a detailed understanding of portfolio risk
Impels portfolio managers to deliver results consistent
with client expectations
Focused on three key principles that allow us to exceed our clients’ expectations
We believe skillful, autonomous investment
boutiques are successful with the support of
independent risk management.
We are committed to delivering superior
investment service to our clients with
expertise in all traditional asset classes.

5 Heritage Growth Equity – Third Quarter 2012
U.S. Fixed Income2
(30%)
Blend
(3%)
U.S. Equity
(27%)
Short Duration3
(30%)
Non-U.S. Equity
(6%)
Non-U.S. Fixed Income2
(4%)
Breadth of Investment Management Expertise
By Sector1 AUM (USD B)
Equity 65
Fixed Income2 66
Short Duration3 59
Blend 5
WellsCap Assets Under Management As at 30 September 2012 – Diversified Client and Asset Base in excess of USD 331B
1 Total firm assets under management are in excess of USD 331B. The charts above exclude USD 136B in Money Market Mutual Funds and other Wells Fargo
Affiliated Money Market Accounts. Assets under management, excluding Money Market Mutual Funds and other Wells Fargo Affiliated Money Market
accounts total USD 195B.
2 Includes accounts with durations over 1-5 year benchmarks.
3 Includes accounts with durations up to 1-5 year benchmarks, excluding Money Market Funds.
4 Sub-Advisory consists of USD 81B in long-term funds sub-advised for Wells Fargo and USD 24B in external sub-advisory funds.
By Client Type1 AUM (USD B) Assets (%)
Corporate 52 26
Foundation/Endowment/Non-Profit 10 5
Public/Government 16 8
Sovereign Wealth Fund/Central Bank 5 3
Union 2 1
Sub-Advisory4 105 54
Other 5 3

6 Heritage Growth Equity – Third Quarter 2012
Representative Client List*
Baptist Health Care Corporation Endowments and Foundations
City of Fort Walton Beach General Pension
City of Pinellas Park Police Officers Pension Fund
Congregation of St. Joseph Foundation
Edyth Bush Charitable Foundation
Ft. Myers Firefighters’ Pension Plan
Ft. Myers General Employees’ Pension Plan
Gundersen Lutheran Administrative Services
Gundersen Lutheran Medical Foundation
International Council For Shopping Centers
Kennametal
Kissimmee Utility Authority Employees Retirement Plan
Life Technologies
London Steam-Ship Owners
Marquette University Educational Endowment
McAllen Firemen’s Relief and Retirement Plan
*As of September 30, 2012. The companies listed herein are representative of Wells Capital Management’s Heritage Growth Equity clients. Only clients
within this Composite who gave us permission to do so are included on this list. Neither performance data nor account size was used as a means of selecting
their inclusion. The use of their names does not constitute an endorsement of our products or services.
Heritage Growth Equity
As of September 30, 2012
Assets Under Management Amount ($M)
Heritage Large Cap Growth Equity 1,770.8
Heritage Premier Growth Equity 2,492.2
Heritage All Cap Growth Equity 12,687.5
Heritage Small Cap Growth Equity 1,651.2
Total $18,601.7
Miami Children's Hospital
Missouri Local Government Employees Retirement System
Orlando Utilities Commission
Pensacola Police Pension Plan
Plumbers and Fitters Local 101 Pension and Supplemental Plan
Plumbers, Steamfitters, and Apprentices Local 206 Pension Plan
Public Service Company of New Mexico
Sibley Memorial Hospital
Southeastern Pennsylvania Transportation Authority Pension Plan
St. Procopius Abbey Foundation
Stetson University
Swedish American Hospital
The Lynde and Harry Bradley Foundation
The Police Retirement System of St. Louis
Tower Automotive
Westminster Retirement Communities Foundation

7 Heritage Growth Equity – Third Quarter 2012
Heritage Growth Strategy

8 Heritage Growth Equity – Third Quarter 2012
Heritage Growth Equity
Distinguishing Characteristics
30-year history with investment philosophy and process
A nimble team dedicated to “pure growth”
Informational advantage from all cap research expertise
Successful sell discipline highlighting integration of risk management with investment process

9 Heritage Growth Equity – Third Quarter 2012
Relationship
Management
Douglas Basile
Associate Portfolio Specialist
Kevin Gaughan, CFA
Senior Portfolio Specialist
Donna Lelinski
Research Associate
Brian Mulligan, CFA
Senior Relationship Manager
Thomas Galfano
Senior Relationship Manager
Joseph Conroy, CFA
Senior Relationship Manager
Heritage Growth Team
Portfolio
Management,
Research, and
Implementation
Thomas Ognar, CFA
Senior Portfolio Manager Health Care, Technology, Consumer
Peter Birmingham
Senior Research Analyst Consumer, Energy, Transportation
Bruce Olson, CFA
Senior Portfolio Manager Consumer, Financials, Energy
Robert Gruendyke, CFA
Senior Research Analyst Technology, Financials, Health Care
Joseph Eberhardy, CFA
Portfolio Manager Health Care, Industrials, Materials
David Nazaret
Senior Research Analyst Technology, Health Care
John Krueger, CFA
Senior Portfolio Specialist
John Svolos
Senior Research Analyst Technology
Brandon Oak
Research Analyst Industrials
Note: CFA® and Chartered Financial Analyst® are trademarks owned by CFA Institute.
Trading Karen Winston
Trader
Jim Mirsberger
Trader
Consistency
Key decision makers average over 18 years
of experience
Track record since 1994
Communication
Streamlined and frictionless environment
Dual research coverage on all holdings
Focus
1 strategy – growth that is Robust, Sustainable,
and Underappreciated

10 Heritage Growth Equity – Third Quarter 2012
Investment Philosophy
We believe
The best investments exhibit both robust and sustainable growth
Opportunities arise when a “Gap” exists between a company’s future growth and market
expectations for that growth
A dedicated, decisive team is critical to managing risk when that “Gap” changes
Time
Pri
ce
BUY REGION SELL/AVOID REGION BUY REGION
Phase I: Growth
Expectations
Too Low
Early Stage
Growth:
Acceleration
Growth Trap:
Deceleration/
Decline
Growth
Opportunity:
Sustainability/
Reacceleration
Phase III: Growth
Expectations Too High
True Earnings Power
Consensus Expectations
Phase II: Growth
Expectations Rise
But Still Too Low Phase IV: Growth
Expectations Fall

11 Heritage Growth Equity – Third Quarter 2012
Investment Process

12 Heritage Growth Equity – Third Quarter 2012
Investment Process Overview
All Cap
Research
Underappreciated
We Are Rigid About Our Discipline…

13 Heritage Growth Equity – Third Quarter 2012
Investment Process
Companies are identified for research from a variety of sources
Proprietary Quantitative Model and Screens
Minimum growth requirements based on market
cap, industry, and sustainability
Revenue/earnings growth acceleration
Positive revenue/earnings surprises and revisions
Margin expansion
Estimate dispersion
Qualitative Sources
Senior management contacts
Suppliers and distributors
Customers
Competitors
Industry experts
Industry and research conferences
Idea Generation
Underappreciated
All Cap
Research

14 Heritage Growth Equity – Third Quarter 2012
Investment Process
All Cap Research
Is growth robust and sustainable?
Senior
Management
Suppliers/
Distributors
Customers
Is growth sustainable?
Potential Investment
Competitors
Industry
Experts
Assessment
of Business
Model
Assessment
of Competitive
Advantages
Assessment
of Capital
Structure
Assessment
of Cash Flow
Assessment of
Earnings Power
Is growth robust? Quantitative
Analysis
Underappreciated
All Cap
Research
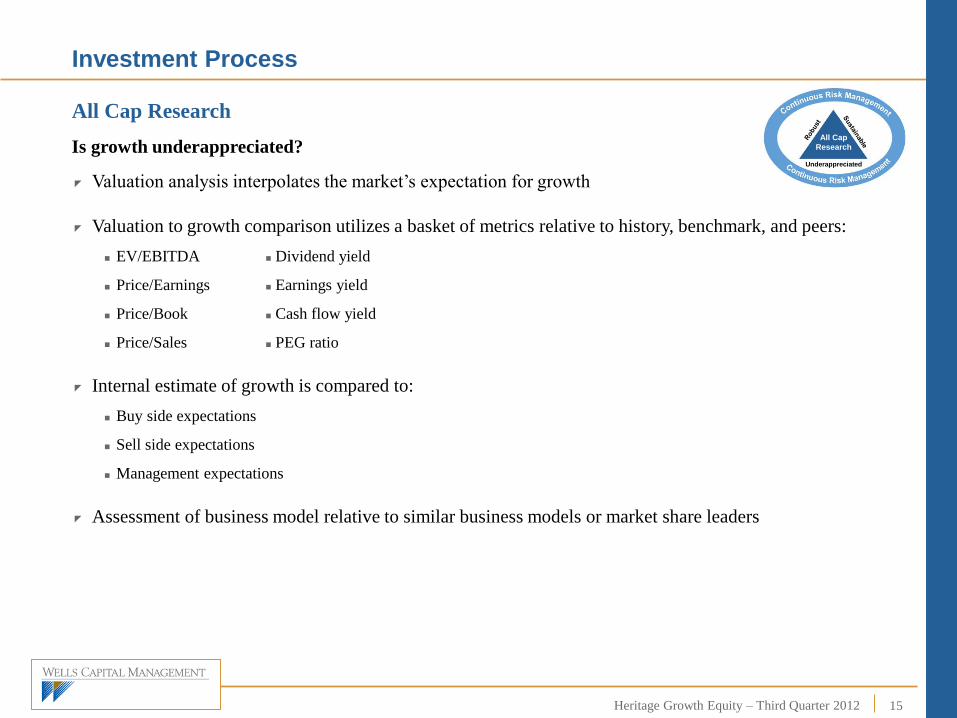
15 Heritage Growth Equity – Third Quarter 2012
Investment Process
Valuation analysis interpolates the market’s expectation for growth
Valuation to growth comparison utilizes a basket of metrics relative to history, benchmark, and peers:
EV/EBITDA Dividend yield
Price/Earnings Earnings yield
Price/Book Cash flow yield
Price/Sales PEG ratio
Internal estimate of growth is compared to:
Buy side expectations
Sell side expectations
Management expectations
Assessment of business model relative to similar business models or market share leaders
All Cap Research
Is growth underappreciated? Underappreciated
All Cap
Research

16 Heritage Growth Equity – Third Quarter 2012
Investment Process
Portfolio Construction Guidelines
Heritage All Cap Growth, Heritage Small Cap Growth, and Heritage Premier Growth typically
own 80-100 securities; Heritage Large Cap Growth typically owns 70-90 securities
Individual positions are limited to 7% at market value
Top 10 holdings typically 25-30% of portfolio
Sector weights limited to 0.5x-2.0x benchmark weight for three traditional growth sectors
Sector weights limited to 0.0x-5.0x benchmark weight for all other sectors
Buy Discipline
In order to invest in a company, growth must be:
Robust
Sustainable
Underappreciated
Portfolio Construction
Underappreciated
All Cap
Research

17 Heritage Growth Equity – Third Quarter 2012
Investment Process
Portfolio Construction
We sell or trim a company
When the “Gap” between a company’s true earnings power and market expectations narrows
To avoid deteriorating growth before it’s captured in the stock price
To manage portfolio risk
Underappreciated
All Cap
Research Sell Discipline
The following chart, which depicts relative returns generated by stocks in the six months after
they were sold from the portfolio, is a proof statement that our sell discipline helps capture
alpha for our clients.
Heritage U.S. Large Cap
Growth Equity Post-Sale
Relative Return1
Heritage U.S. Premier
Growth Equity Post-Sale
Relative Return1
Heritage U.S. All Cap Growth
Equity Post-Sale Relative
Return2
Heritage Small Cap Growth
Equity Post-Sale Relative
Return3
Stocks sold in 2005 -3.1% -0.4% -1.0% -8.2%
Stocks sold in 2006 -0.8% -3.5% -4.7% -1.1%
Stocks sold in 2007 -7.0% -5.8% -8.3% -11.7%
Stocks sold in 2008 3.4% -2.1% -4.0% -8.2%
Stocks sold in 2009 -2.9% -6.2% -7.3% -4.8%
Stocks sold in 2010 -5.5% -6.2% -6.5% -9.1%
Stocks sold in 2011 -7.2% -4.1% -4.7% 2.6%
Average -3.3% -4.0% -5.2% -5.8%
1Based on the median six month post sale excess return of stocks relative to the Russell 1000 Growth Index for positions completely sold from the portfolio. 2Based on the median six month post sale excess return of stocks relative to the Russell 3000 Growth Index for positions completely sold from the portfolio. 3Based on the median six month post sale excess return of stocks relative to the Russell 2000 Growth Index for positions completely sold from the portfolio.

18 Heritage Growth Equity – Third Quarter 2012
Risk Management Team
Weekly and monthly risk reports
Risk-adjusted return analysis
Performance attribution
Style analysis
Custom analytics at team’s request
Standing quarterly reviews with Risk
Management Team and with Office of CIO
Investment Process
Investment Team
Continuously stress test all assumptions
Monitor the “Gap”
Quantitatively screen the portfolio to combat
human biases
Sell or trim according to Sell Discipline
Focus on the sustainability of growth
Risk Management
An integrated approach to risk incorporates monitoring at team level
and firm level Underappreciated
All Cap
Research

19 Heritage Growth Equity – Third Quarter 2012
Heritage Growth Equity
Summary
30-year history with investment philosophy and process
A nimble team dedicated to “pure growth”
Informational advantage from all cap research expertise
Successful sell discipline highlighting integration of risk management with investment process

20 Heritage Growth Equity – Third Quarter 2012
Heritage U.S. Large Cap Growth Equity Portfolio
Characteristics & Performance

21 Heritage Growth Equity – Third Quarter 2012
Heritage U.S. Large Cap Growth Equity
Portfolio Characteristics – As of September 30, 2012
Characteristics
Portfolio Characteristics Portfolio*
Russell 1000
Growth Index
Weighted Median Market Cap ($B) 30.8 47.1
Weighted Average Market Cap ($B) 98.8 112.8
Portfolio P/E-I/B/E/S 1-Year Forecast 18.8 15.5
Long-Term Growth Forecast – I/B/E/S Median (%) 17.2 13.9
Return on Equity – 5-Year Average 24.6 23.7
Number of Holdings 76 567
Turnover (%) 44
*This information is based on a representative account within the Heritage U.S. Large Cap Growth Equity Composite. The representative account has been
selected by meeting the following criteria: 1) the account is in the Heritage U.S. Large Cap Growth Equity Composite, 2) Wells Capital Management represents
that the holdings, characteristics and risk profile are representative of the strategy/style of the Heritage U.S. Large Cap Growth Equity Composite. Any changes
to the representative account must be approved by the director of investment risk management. 1Top ten holdings are based on market value of the representative account and not necessarily held in all client portfolios. The information shown is not intended
to be, nor should it be construed to be, a recommendation to buy or sell an individual security. Past performance is not indicative of future results. A list of all
holdings from the prior one-year period is available upon request.
Source: Bank of New York Mellon Corporation and FactSet
Sector Distribution
Top Ten Equity Holdings1
Company Market Cap ($B)
Portfolio*
Weight (%)
Apple Inc. 625.3 8.9
Google Inc. 246.7 3.9
Alexion Pharmaceuticals Inc. 22.1 3.2
QUALCOMM Inc. 107.0 3.0
eBay Inc. 62.3 2.8
Cognizant Technology Solutions Corp. 20.9 2.6
MasterCard Inc. 56.4 2.5
Whole Foods Market Inc. 18.0 2.3
Dollar Tree Inc. 11.1 2.1
Union Pacific Corp. 56.2 2.0
Total 33.2

22 Heritage Growth Equity – Third Quarter 2012
Heritage U.S. Large Cap Growth Equity
Up Market and Down Market Capture
Manager Databases via Zephyr Style Advisor
Note: The GIPS compliant presentation can be found at the end of this presentation.
Alpha vs.
Market
Beta vs.
Market
Sharpe
Ratio
Batting Average
vs. Market
Up Capture
vs. Market
Down Capture
vs. Market
R-Squared
vs. Market
Heritage U.S. Large Cap Growth – Gross 3.5% 0.96 0.4 59.2% 105.4% 94.3% 77.5%
Heritage U.S. Large Cap Growth – Net 2.7% 0.96 0.4 56.3% 103.4% 95.3% 77.6%
Russell 1000 Growth Index 0.0% 1.00 0.3 0.0% 100.0% 100.0% 100.0%
January 1995 – September 2012 (Single Computation)
Upsid
e%
Downside%
Upside / DownsideJanuary 1995 - September 2012 (Single Computation)
Upsid
e%
94
96
98
100
102
104
106
Downside%
94 96 98 100 102 104 106
Heritage Large Cap Growth (gross)
Heritage Large Cap Growth (net)
Russell 1000 Growth
January 1995 - September 2012: Summary Statistics
Heritage Large Cap Growth (gross)
Heritage Large Cap Growth (net)
Russell 1000 Growth
Alphavs.
Market
Betavs.
Market
SharpeRatio
BattingAverage
vs.Market
UpCapture
vs.Market
DownCapture
vs.Market
R-Squaredvs.
Market
3.5 0.96 0.4 59.2 105.4 94.3 77.5
2.7 0.96 0.4 56.3 103.4 95.4 77.6
0.0 1.00 0.3 0.0 100.0 100.0 100.0

23 Heritage Growth Equity – Third Quarter 2012
Heritage U.S. Large Cap Growth Equity
Annualized Performance Peer Universe Rankings
Source: eVestment Alliance Large Cap Growth Universe. All returns greater than one year are annualized. Note: The GIPS compliant presentation can be
found at the end of this presentation.
As of September 30, 2012
Heritage U.S. Large Cap Growth Equity – Gross

24 Heritage Growth Equity – Third Quarter 2012
Heritage U.S. Premier Growth Equity Portfolio
Characteristics & Performance

25 Heritage Growth Equity – Third Quarter 2012
Heritage U.S. Premier Growth Equity
Portfolio Characteristics – As of September 30, 2012
Characteristics
Portfolio Characteristics Portfolio*
Russell 1000
Growth Index
Weighted Median Market Cap ($B) 21.3 47.1
Weighted Average Market Cap ($B) 92.1 112.8
Portfolio P/E-I/B/E/S 1-Year Forecast 18.6 15.5
Long-Term Growth Forecast – I/B/E/S Median (%) 17.8 13.9
Return on Equity – 5-Year Average 23.5 23.7
Number of Holdings 84 567
Turnover (%) 47
*This information is based on a representative account within the Heritage U.S. Premier Growth Equity Composite. The representative account has been selected
by meeting the following criteria: 1) the account is in the Heritage U.S. Premier Growth Equity Composite, 2) Wells Capital Management represents that the
holdings, characteristics and risk profile are representative of the strategy/style of the Heritage U.S. Premier Growth Equity Composite. Any changes to the
representative account must be approved by the director of investment risk management. 1Top ten holdings are based on market value of the representative account and not necessarily held in all client portfolios. The information shown is not intended
to be, nor should it be construed to be, a recommendation to buy or sell an individual security. Past performance is not indicative of future results. A list of all
holdings from the prior one-year period is available upon request.
Source: Bank of New York Mellon Corporation and FactSet
Sector Distribution
Top Ten Equity Holdings1
Company Market Cap ($B)
Portfolio*
Weight (%)
Apple Inc. 625.3 8.9
Google Inc. 246.7 4.0
eBay Inc. 62.3 3.3
Cognizant Technology Solutions Corp. 20.9 3.3
Alexion Pharmaceuticals Inc. 22.1 3.2
Kansas City Southern 8.3 2.8
Whole Foods Market Inc. 18.0 2.4
Tractor Supply Co. 7.0 2.3
Dollar Tree Inc. 11.1 2.2
EMC Corp. 57.2 2.1
Total 34.4

26 Heritage Growth Equity – Third Quarter 2012
Heritage U.S. Premier Growth Equity
Up Market and Down Market Capture
Manager Databases via Zephyr Style Advisor
Note: The GIPS compliant presentation can be found at the end of this presentation.
Alpha vs.
Market
Beta vs.
Market
Sharpe
Ratio
Batting Average
vs. Market
Up Capture
vs. Market
Down Capture
vs. Market
R-Squared
vs. Market
Heritage U.S. Premier Growth – Gross 6.1% 0.93 0.3 61.3% 115.3% 91.7% 83.1%
Heritage U.S. Premier Growth – Net 5.3% 0.93 0.2 60.0% 113.3% 92.9% 83.1%
Russell 1000 Growth Index 0.0% 1.00 -0.1 0.0% 100.0% 100.0% 100.0%
June 1999 – September 2012 (Single Computation)
Upsid
e%
Downside%
Upside / DownsideJune 1999 - September 2012 (Single Computation)
Upsid
e%
80
85
90
95
100
105
110
115
120
Downside%
80 85 90 95 100 105 110 115 120
Heritage Premier Growth (Gross)
Heritage Premier Growth (Net)
Russell 1000 Growth
June 1999 - September 2012: Summary Statistics
Heritage Premier Growth (Gross)
Heritage Premier Growth (Net)
Russell 1000 Growth
Alphavs.
Market
Betavs.
Market
SharpeRatio
BattingAverage
vs.Market
UpCapture
vs.Market
DownCapture
vs.Market
R-Squaredvs.
Market
6.1 0.93 0.3 61.3 115.3 91.7 83.1
5.3 0.93 0.2 60.0 113.3 92.9 83.1
0.0 1.0 -0.1 0.0 100.0 100.0 100.0

27 Heritage Growth Equity – Third Quarter 2012
Heritage U.S. Premier Growth Equity
Annualized Performance Peer Universe Rankings
Source: eVestment Alliance Large Cap Growth Universe. All returns greater than one year are annualized.
Note: The GIPS compliant presentation can be found at the end of this presentation.
As of September 30, 2012
Heritage U.S. Premier Growth – Gross

28 Heritage Growth Equity – Third Quarter 2012
Heritage U.S. All Cap Growth Equity Portfolio
Characteristics & Performance

29 Heritage Growth Equity – Third Quarter 2012
Heritage U.S. All Cap Growth Equity
Portfolio Characteristics – As of September 30, 2012
Top Ten Equity Holdings1
Company
Market
Cap ($B)
Portfolio*
Weight (%)
Apple Inc. 625.3 8.5
Google Inc. 246.7 3.5
Alexion Pharmaceuticals Inc. 22.1 3.4
eBay Inc. 62.3 3.3
Cognizant Technology Solutions Corp. 20.9 3.1
Kansas City Southern 8.3 2.8
Tractor Supply Co. 7.0 2.4
Whole Foods Market Inc. 18.0 2.3
Rackspace Hosting Inc. 9.0 2.3
Ulta Salon Cosmetics & Fragrance Inc. 6.1 2.1
Total 33.7
Characteristics
Portfolio Characteristics Portfolio*
Russell 3000
Growth Index
Weighted Median Market Cap ($B) 12.8 47.1
Weighted Average Market Cap ($B) 81.3 112.8
Portfolio P/E-I/B/E/S 1-Year Forecast 20.4 15.5
Long-Term Growth Forecast – I/B/E/S Median (%) 19.1 13.9
Return on Equity – 5-Year Average 22.5 23.7
Number of Holdings 95 1,679
Turnover (%) 48
*This information is based on a representative account within the Heritage U.S. All Cap Growth Equity Composite. The representative account has been selected
by meeting the following criteria: 1) the account is in the Heritage U.S. All Cap Growth Equity Composite, 2) Wells Capital Management represents that the
holdings, characteristics and risk profile are representative of the strategy/style of the Heritage U.S. All Cap Growth Equity Composite. Any changes to the
representative account must be approved by the director of investment risk management. 1Top ten holdings are based on market value of the representative account and not necessarily held in all client portfolios. The information shown is not intended
to be, nor should it be construed to be, a recommendation to buy or sell an individual security. Past performance is not indicative of future results. A list of all
holdings from the prior one-year period is available upon request.
Source: Bank of New York Mellon Corporation and FactSet
Sector Distribution

30 Heritage Growth Equity – Third Quarter 2012
Heritage U.S. All Cap Growth Equity
Up Market and Down Market Capture
Manager Databases via Zephyr Style Advisor
Note: The GIPS compliant presentation can be found at the end of this presentation.
Alpha vs.
Market
Beta vs.
Market
Sharpe
Ratio
Batting Average
vs. Market
Up Capture
vs. Market
Down Capture
vs. Market
R-Squared
vs. Market
Heritage U.S. All Cap Growth – Gross 8.8% 1.01 0.4 66.9% 130.4% 93.5% 83.0%
Heritage U.S. All Cap Growth – Net 7.9% 1.01 0.3 64.4% 128.1% 94.7% 83.0%
Russell 3000 Growth Index 0.0% 1.00 0.0 0.0% 100.0% 100.0% 100.0%
June 1999 – September 2012 (Single Computation)
Upsid
e%
Downside%
Upside / DownsideJune 1999 - September 2012 (Single Computation)
Upsid
e%
60
70
80
90
100
110
120
130
140
Downside%
60 70 80 90 100 110 120 130 140
Heritage All Cap Growth (gross)Heritage All Cap Growth (net)Russell 3000 Growth
June 1999 - September 2012: Summary Statistics
Heritage All Cap Growth (gross)
Heritage All Cap Growth (net)
Russell 3000 Growth
Alphavs.
Market
Betavs.
Market
SharpeRatio
BattingAverage
vs.Market
UpCapture
vs.Market
DownCapture
vs.Market
R-Squaredvs.
Market
8.8% 1.01 0.4 66.9% 130.4% 93.5% 83.0%
7.9% 1.01 0.3 64.4% 128.1% 94.7% 83.0%
0.0% 1.00 -0.0 0.0% 100.0% 100.0% 100.0%

31 Heritage Growth Equity – Third Quarter 2012
Heritage U.S. All Cap Growth Equity
Annualized Performance Peer Universe Rankings
Source: eVestment Alliance All Cap Growth Universe. All returns greater than one year are annualized. Note: The GIPS compliant presentation can be
found at the end of this presentation.
Heritage U.S. All Cap Growth Equity – Gross
As of September 30, 2012

32 Heritage Growth Equity – Third Quarter 2012
Addendum

33 Heritage Growth Equity – Third Quarter 2012
Heritage Growth Team Biographies
Note: CFA® and Chartered Financial Analyst® are trademarks owned by CFA Institute.
Thomas C. Ognar, CFA
Managing Director and Senior Portfolio Manager
Thomas Ognar is a managing director and senior portfolio manager for the Heritage Growth Equity team at Wells Capital Management.
Tom has oversight and portfolio management responsibility for the team’s Small Capitalization, All Capitalization and Large
Capitalization Growth portfolios. He joined Wells Capital Management with the acquisition of assets from Strong Capital Management.
Tom entered the investment industry in 1993 and joined Strong in 1998 as a research analyst. Prior to Strong, he was a research analyst
with M&I Investment Management, Inc. and a trader with Republic Securities, Inc. Tom earned a bachelor’s degree in finance from
Miami University. He earned a master’s degree in finance from the University of Wisconsin, Madison, and is an alumnus of the Applied
Security Analysis Program. Tom has earned the right to use the CFA designation.
Bruce C. Olson, CFA
Managing Director and Senior Portfolio Manager
Bruce Olson is a managing director and senior portfolio manager for the Heritage Growth Equity team at Wells Capital Management.
He joined Wells Capital Management from Strong Capital Management where he held a similar position. Bruce entered the investment
industry in 1982 and prior to joining Strong in 1994, he served as a managing partner of a private holding company. Previously, he was
employed with Minton Investment Corporation, American National Bank and Trust of Chicago, and the Travelers Corporation. Bruce
earned a bachelor’s degree from Gustavus Adolphus College. He has earned the right to use the CFA designation.
Joseph M. Eberhardy, CFA
Portfolio Manager
Joseph Eberhardy is a portfolio manager for the Heritage Growth Equity team at Wells Capital Management. Joe joined Wells Capital
Management from Strong Capital Management, having joined Strong in 1994. Prior to his current role, Joe was a senior research analyst
with the Heritage Growth Equity team. Before joining the Heritage Growth Equity team in 2000, his previous roles at Strong Capital
Management included small to mid cap equity analyst, high yield bond trader and fixed income accounting manager. Joe earned a
bachelor's degree in accounting from the University of Wisconsin, Milwaukee. He is a Certified Public Accountant and has earned the
right to use the CFA designation.

34 Heritage Growth Equity – Third Quarter 2012
Heritage Growth Team Biographies (continued)
John Krueger, CFA
Senior Portfolio Specialist
John Krueger is a senior portfolio specialist for the Heritage Growth Equity team at Wells Capital Management. John joined Wells Capital
Management in 2010 from Cleary Gull where he was the Director of Portfolio Management. He was responsible for developing,
implementing, and then communicating investment strategies for foundations, endowments, and high net worth individuals. Prior to
joining Cleary in 1998, he was a portfolio manager for M&I Corporation. There, he conducted money manager due diligence and managed
foundations, endowments, and high net worth portfolios. He also served as an equity trader and a senior auditor while at M&I. John earned
his bachelor’s degree in finance from the University of Wisconsin, Whitewater and an MBA from the University of Chicago. He is a
member of the Investment Analyst Society of Milwaukee. John has earned the right to use the CFA designation.
Peter Birmingham
Senior Research Analyst
Peter Birmingham is a senior research analyst for the Heritage Growth Equity team at Wells Capital Management. He covers the
consumer, energy, and transportation sectors. Before joining WellsCap in 2008, Peter served as vice president for Wells Fargo Funds
Management. Prior to that, he served as vice president of institutional equity sales for Morgan Stanley. Peter began his investment industry
career in 1992 as first vice president for Robert W. Baird & Co. He earned a bachelor’s degree in finance, investments and banking from
the University of Wisconsin, Madison, and a master’s degree in accounting from the University of Wisconsin, Milwaukee. Peter has
completed Level I of the CFA Program.
Robert Gruendyke, CFA
Senior Research Analyst
Robert Gruendyke is a senior research analyst for the Heritage Growth Equity team at Wells Capital Management, covering the
technology, financial, and health care sectors. Before joining WellsCap in 2008, Bob served as a senior research associate, and earlier, as a
senior compliance adviser, for Raymond James Financial. Prior to that, he served as a financial consultant for AG Edwards and Sons,
where he began his investment industry career in 1999. He earned a bachelor’s degree in economics and history from Duke University.
Bob has earned the right to use the CFA designation.
David Nazaret
Senior Research Analyst
David Nazaret is a senior research analyst for the Heritage Growth Equity team at Wells Capital Management, covering the technology,
and health care sectors. David began his investment industry career in 2000. Previously, he was a senior research associate at Raymond
James. He has earned a bachelor’s degree in economics from Vanderbilt University in Nashville, TN. David has completed Level II of the
CFA Program.

35 Heritage Growth Equity – Third Quarter 2012
Heritage Growth Team Biographies (continued)
John Svolos
Senior Research Analyst
John Svolos is a senior research analyst for the Heritage Growth Equity team at Wells Capital Management covering the technology
sector, specifically the semiconductor, hardware, networking, and internet industries. John entered the investment industry at Merrill
Lynch in 1997, providing research sales coverage to investment managers across the Midwest. Starting in 1998, John narrowed his focus
to become a technology sector specialist. He developed an integrated view of the global technology supply chain, meeting with technology
corporate managements and touring global manufacturing operations in Canada, Mexico, Taiwan, China, Hong Kong, and the United
States. John joined Credit Agricole Securities in 2009 where he expanded his focus to the growing consumer end markets of Asia. He
earned a bachelor’s degree in economics from Northwestern University and a juris doctorate from Harvard Law School. John is a
candidate for Level III of the CFA program.
Brandon Oak
Research Analyst
Brandon Oak is a research analyst for the Heritage Growth Equity team at Wells Capital Management, co-covering the industrial sector
with Joseph Eberhardy. Before joining WellsCap in 2011, he served as a senior investment performance analyst at Cambridge Associates,
LLC. Brandon earned bachelors’ degrees in economics and mathematics from Vanderbilt University and an MBA from the Kelley School
of Business at Indiana University. Brandon has completed Level I of the CFA Program.
Karen Winston
Trader
Karen Winston is a trader on the Heritage Growth Equity team at Wells Capital Management. She joined Wells Capital Management from
Strong Capital Management where she held a similar role, having joined Strong in 1989. Karen earned an associate degree in business
from Stratton College in Milwaukee.
James Mirsberger
Trader
James Mirsberger is a trader for the Heritage Growth Equity team at Wells Capital Management. He joined Wells Capital Management
from Strong Capital Management where he held a similar role. Jim joined Strong in 1992 as a mutual fund accountant and became a trader
in 1993. He earned bachelor's degrees in finance and marketing from the University of Wisconsin, Madison and a master's degree in
business administration from Marquette University.

36 Heritage Growth Equity – Third Quarter 2012
Heritage Growth Team Biographies (continued)
Douglas Basile
Associate Portfolio Specialist
Douglas Basile is an associate portfolio specialist for the Heritage Growth Equity team at Wells Capital Management. Doug joined
WellsCap in 2012 from Wells Fargo Funds Distributor where he was an internal wholesaler in the Northern California independent
channel. Prior to working at Wells Fargo, Doug served as an options market maker and member of the Chicago Board Options Exchange
for Timber Hill for nine years. He has been in the investment industry since 1996. He earned a bachelor’s degree in history from West
Virginia Wesleyan College and a master’s degree in business administration from Elmhurst College.
Donna Lelinski
Research Associate
Donna Lelinski is a research associate with the Heritage Growth Equity team at Wells Capital Management. She is responsible for day-to-
day coordination and all administrative duties for the Heritage team. Donna joined WellsCap from Strong Capital Management, where she
served in a similar role since 1999. Earlier in her career, she served as a compliance associate and a research associate at Strong.
Brian Mulligan, CFA
Senior Relationship Manager
Brian Mulligan is a senior relationship manager at Wells Capital Management. Brian also leads a team of client service relationship
managers who service a variety of investment products, including value, emerging markets, and small growth. Previously, he managed
private client assets, trusts, pension/retirement, and foundation portfolios. He began his investment industry career in 1981 as a portfolio
assistant at Crocker Bank, which was later acquired by Wells Fargo. Brian earned a bachelor’s degree in business management from
Skidmore College, Saratoga Springs, New York. He has earned the right to use the CFA designation and is a member of CFA Institute and
the Security Analysts of San Francisco.
Thomas Galfano
Senior Relationship Manager
Thomas Galfano is a senior relationship manager for institutional relationships at Wells Capital Management. He joined Wells Capital
Management from Strong Capital Management where he held a similar role. Tom joined Strong in 1996 and became a part of Strong's
institutional team in 2002. Prior to this, Tom was an associate in Strong's technology group. Tom began his career at The Swiss Colony,
Inc., followed by three years at the Medical College of Wisconsin in the technology area. He earned his bachelor’s degree in
communications from the University of Wisconsin, Madison and a master’s degree in business administration from Marquette University
in Milwaukee, Wisconsin.

37 Heritage Growth Equity – Third Quarter 2012
Heritage Growth Team Biographies (continued)
Joseph Conroy, CFA
Senior Relationship Manager
Joseph Conroy is a senior relationship manager on the Equity Management team at Wells Capital Management. He joined WellsCap from
Evergreen Investments, where he served as a relationship manager since 2000. His most recent Evergreen experience includes serving as a
relationship manager for multiple investment strategies for a wide range of clients, including pensions, endowments, foundations, and not
for profit entities. Prior to joining Evergreen, he served as a portfolio/client relationship manager at Wilmington Trust. Earlier, Joe served
in the Treasury department at Catholic Health Initiatives. Joe began his career at Mellon Bank, N.A. He earned a bachelor’s degree in
finance with a concentration in accounting from LaSalle University in Philadelphia. Joe has earned the right to use the CFA designation
and is a member of the CFA Society of Philadelphia.
Kevin Gaughan, CFA
Managing Director and Senior Portfolio Specialist
Kevin Gaughan is a managing director and senior portfolio specialist for the Heritage Growth Equity and Core Equity teams at Wells
Capital Management, with specific responsibility in economic and sector research. Kevin joined Wells Capital Management from Strong
Capital Management with more than 25 years of experience in the investment industry. While at Strong, he developed and managed many
of the firm's largest client relationships and served as a key member of the firm's risk management and investment product committees.
Prior to joining Strong in 1990, Kevin was a partner at the institutional investment management firm, Brinson Partners, Inc. Kevin earned
a bachelor's degree in finance and a master's degree in business administration from DePaul University. He is a member of the Investment
Analysts Society of Chicago. Kevin has earned the right to use the CFA designation.

38 Heritage Growth Equity – Third Quarter 2012
Heritage U.S. All Cap Growth
First $25 Million 0.85%
Next $25 Million 0.75%
Next $50 Million 0.70%
Over $100 Million 0.65%
Minimum Annual Fee $85,000
Separate Account Investment Management Fees
Note: The GIPS compliant presentation can be found at the end of this presentation.
Heritage U.S. Large Cap Growth
First $25 million 0.75%
Next $25 million 0.65%
Next $50 million 0.50%
Over $100 million 0.40%
Minimum Annual Fee $75,000
Heritage U.S. Premier Growth
First $25 Million 0.75%
Next $25 Million 0.65%
Next $50 Million 0.60%
Over $100 Million 0.55%
Minimum Annual Fee $75,000

39 Heritage Growth Equity – Third Quarter 2012
Supplemental Information

40 Heritage Growth Equity – Third Quarter 2012
Heritage U.S. Large Cap Growth Equity
Portfolio Characteristics – As of September 30, 2012
Characteristics
Portfolio Characteristics Portfolio* S&P 5002
Weighted Median Market Cap ($B) 30.8 57.5
Weighted Average Market Cap ($B) 98.8 122.1
Portfolio P/E-I/B/E/S 1-Year Forecast 18.8 13.3
Long-Term Growth Forecast – I/B/E/S Median (%) 17.2 10.7
Return on Equity – 5-Year Average 24.6 19.3
Number of Holdings 76 500
Turnover (%) 44
*This information is based on a representative account within the Heritage U.S. Large Cap Growth Equity Composite. The representative account has been
selected by meeting the following criteria: 1) the account is in the Heritage U.S. Large Cap Growth Equity Composite, 2) Wells Capital Management represents
that the holdings, characteristics and risk profile are representative of the strategy/style of the Heritage U.S. Large Cap Growth Equity Composite. Any changes
to the representative account must be approved by the director of investment risk management. 1Top ten holdings are based on market value of the representative account and not necessarily held in all client portfolios. The information shown is not intended
to be, nor should it be construed to be, a recommendation to buy or sell an individual security. Past performance is not indicative of future results. A list of all
holdings from the prior one-year period is available upon request. 2S&P 500 is for illustrative purposes only.
Source: Bank of New York Mellon Corporation and FactSet
Sector Distribution
Top Ten Equity Holdings1
Company Market Cap ($B)
Portfolio*
Weight (%)
Apple Inc. 625.3 8.9
Google Inc. 246.7 3.9
Alexion Pharmaceuticals Inc. 22.1 3.2
QUALCOMM Inc. 107.0 3.0
eBay Inc. 62.3 2.8
Cognizant Technology Solutions Corp. 20.9 2.6
MasterCard Inc. 56.4 2.5
Whole Foods Market Inc. 18.0 2.3
Dollar Tree Inc. 11.1 2.1
Union Pacific Corp. 56.2 2.0
Total 33.2
2

41 Heritage Growth Equity – Third Quarter 2012
Heritage U.S. Large Cap Growth Equity
Up Market and Down Market Capture
*S&P 500 is for illustrative purposes only.
Manager Databases via Zephyr Style Advisor
Note: The GIPS compliant presentation can be found at the end of this presentation.
Alpha vs.
Market
Beta vs.
Market
Sharpe
Ratio
Batting
Average
vs. Market
Up Capture
vs. Market
Down
Capture vs.
Market
R-Squared
vs. Market
Heritage U.S. Large Cap Growth – Gross 2.7% 1.00 0.4 56.6% 110.5% 100.9% 63.6%
Heritage U.S. Large Cap Growth – Net 1.9% 1.00 0.4 55.9% 108.2% 102.2% 63.6%
S&P 500* 0.0% 1.00 0.4 0.0% 100.0% 100.0% 100.0%
January 1995 – June 2012 (Single Computation)
Downside%
Upsid
e%
Upside / DownsideJanuary 1995 - September 2012 (Single Computation)
Upsid
e%
85
90
95
100
105
110
Downside%
85 90 95 100 105 110
Heritage Large Cap Growth (gross)
Heritage Large Cap Growth (net)
S&P 500
January 1995 - September 2012: Summary Statistics
Heritage Large Cap Growth (gross)
Heritage Large Cap Growth (net)
S&P 500
Alphavs.
Market
Betavs.
Market
SharpeRatio
BattingAverage
vs.Market
UpCapture
vs.Market
DownCapture
vs.Market
R-Squaredvs.
Market
2.7 1.00 0.4 56.3 110.5 100.9 63.6
1.9 1.00 0.4 55.9 108.2 102.2 63.6
0.0 1.0 0.4 0.0 100.0 100.0 100.0

42 Heritage Growth Equity – Third Quarter 2012
Heritage U.S. Large Cap Growth Equity
Annualized Performance Peer Universe Rankings
*S&P 500 is for illustrative purposes only.
Source: eVestment Alliance Large Cap Growth Universe. All returns greater than one year are annualized. Note: The GIPS compliant presentation can be
found at the end of this presentation.
As of September 30, 2012
Heritage U.S. Large Cap Growth Equity – Gross
S&P 500*

43 Heritage Growth Equity – Third Quarter 2012
Heritage U.S. Premier Growth Equity
Portfolio Characteristics – As of September 30, 2012
Characteristics
Portfolio Characteristics Portfolio* S&P 5002
Weighted Median Market Cap ($B) 21.3 57.5
Weighted Average Market Cap ($B) 92.1 122.1
Portfolio P/E-I/B/E/S 1-Year Forecast 18.6 13.3
Long-Term Growth Forecast – I/B/E/S Median (%) 17.8 10.7
Return on Equity – 5-Year Average 23.5 19.3
Number of Holdings 84 500
Turnover (%) 47
*This information is based on a representative account within the Heritage U.S. Premier Growth Equity Composite. The representative account has been selected
by meeting the following criteria: 1) the account is in the Heritage U.S. Premier Growth Equity Composite, 2) Wells Capital Management represents that the
holdings, characteristics and risk profile are representative of the strategy/style of the Heritage U.S. Premier Growth Equity Composite. Any changes to the
representative account must be approved by the director of investment risk management. 1Top ten holdings are based on market value of the representative account and not necessarily held in all client portfolios. The information shown is not intended
to be, nor should it be construed to be, a recommendation to buy or sell an individual security. Past performance is not indicative of future results. A list of all
holdings from the prior one-year period is available upon request. 2S&P 500 is for illustrative purposes only.
Source: Bank of New York Mellon Corporation and FactSet
Sector Distribution
2
Top Ten Equity Holdings1
Company Market Cap ($B)
Portfolio*
Weight (%)
Apple Inc. 625.3 8.9
Google Inc. 246.7 4.0
eBay Inc. 62.3 3.3
Cognizant Technology Solutions Corp. 20.9 3.3
Alexion Pharmaceuticals Inc. 22.1 3.2
Kansas City Southern 8.3 2.8
Whole Foods Market Inc. 18.0 2.4
Tractor Supply Co. 7.0 2.3
Dollar Tree Inc. 11.1 2.2
EMC Corp. 57.2 2.1
Total 34.4

44 Heritage Growth Equity – Third Quarter 2012
Heritage U.S. Premier Growth Equity
Up Market and Down Market Capture
*S&P 500 is for illustrative purposes only.
Manager Databases via Zephyr Style Advisor
Note: The GIPS compliant presentation can be found at the end of this presentation.
Alpha vs.
Market
Beta vs.
Market
Sharpe
Ratio
Batting Average
vs. Market
Up Capture
vs. Market
Down Capture
vs. Market
R-Squared
vs. Market
Heritage U.S. Premier Growth – Gross 5.0% 1.02 0.3 58.8% 123.0% 99.3% 73.0%
Heritage U.S. Premier Growth – Net 4.2% 1.02 0.2 58.1% 120.5% 100.5% 73.0%
S&P 500* 0.0% 1.00 0.0 0.0% 100.0% 100.0% 100.0%
June 1999 – September 2012 (Single Computation)
Upsid
e%
Downside%
Upside / DownsideJune 1999 - September 2012 (Single Computation)
Upsid
e%
70
80
90
100
110
120
130
Downside%
70 80 90 100 110 120 130
Heritage Premier Growth (Gross)
Heritage Premier Growth (Net)
S&P 500
June 1999 - September 2012: Summary Statistics
Heritage Premier Growth (Gross)
Heritage Premier Growth (Net)
S&P 500
Alphavs.
Market
Betavs.
Market
SharpeRatio
BattingAverage
vs.Market
UpCapture
vs.Market
DownCapture
vs.Market
R-Squaredvs.
Market
5.0 1.02 0.3 58.8 123.0 99.3 73.0
4.2 1.02 0.2 58.1 120.5 100.5 73.0
0.0 1.0 0.0 0.0 100.0 100.0 100.0

45 Heritage Growth Equity – Third Quarter 2012
Heritage U.S. Premier Growth Equity
Annualized Performance Peer Universe Rankings
*S&P 500 is for illustrative purposes only.
Source: eVestment Alliance U.S. Large Cap Equity Universe. All returns greater than one year are annualized. There may be a small return difference in
charts generated by eVestment Alliance due to rounding. Note: The GIPS compliant presentation can be found at the end of this presentation.
Heritage U.S. Premier Growth – Gross
S&P 500*
As of September 30, 2012

46 Heritage Growth Equity – Third Quarter 2012
Heritage U.S. All Cap Growth Equity
Portfolio Characteristics – As of September 30, 2012
Top Ten Equity Holdings1
Company
Market Cap
($B)
Portfolio*
Weight (%)
Apple Inc. 625.3 8.5
Google Inc. 246.7 3.5
Alexion Pharmaceuticals Inc. 22.1 3.4
eBay Inc. 62.3 3.3
Cognizant Technology Solutions Corp. 20.9 3.1
Kansas City Southern 8.3 2.8
Tractor Supply Co. 7.0 2.4
Whole Foods Market Inc. 18.0 2.3
Rackspace Hosting Inc. 9.0 2.3
Ulta Salon Cosmetics & Fragrance Inc. 6.1 2.1
Total 33.7
Characteristics
Portfolio Characteristics Portfolio* S&P 5002
Weighted Median Market Cap ($B) 12.8 57.5
Weighted Average Market Cap ($B) 81.3 122.1
Portfolio P/E-I/B/E/S 1-Year Forecast 20.4 13.3
Long-Term Growth Forecast – I/B/E/S Median (%) 19.1 10.7
Return on Equity – 5-Year Average 22.5 19.3
Number of Holdings 95 500
Turnover (%) 48
*This information is based on a representative account within the Heritage U.S. All Cap Growth Equity Composite. The representative account has been selected
by meeting the following criteria: 1) the account is in the Heritage U.S. All Cap Growth Equity Composite, 2) Wells Capital Management represents that the
holdings, characteristics and risk profile are representative of the strategy/style of the Heritage U.S. All Cap Growth Equity Composite. Any changes to the
representative account must be approved by the director of investment risk management. 1Top ten holdings are based on market value of the representative account and not necessarily held in all client portfolios. The information shown is not intended
to be, nor should it be construed to be, a recommendation to buy or sell an individual security. Past performance is not indicative of future results. A list of all
holdings from the prior one-year period is available upon request. 2S&P 500 is for illustrative purposes only.
Source: Bank of New York Mellon Corporation and FactSet
Sector Distribution
2

47 Heritage Growth Equity – Third Quarter 2012
Heritage U.S. All Cap Growth Equity
Up Market and Down Market Capture
*S&P 500 is for illustrative purposes only.
Manager Databases via Zephyr Style Advisor
Note: The GIPS compliant presentation can be found at the end of this presentation.
Alpha vs.
Market
Beta vs.
Market
Sharpe
Ratio
Batting Average
vs. Market
Up Capture
vs. Market
Down Capture
vs. Market
R-Squared
vs. Market
Heritage U.S. All Cap Growth
Equity – Gross 7.9% 1.07 0.4 64.4% 142.9% 102.3% 67.3%
Heritage U.S. All Cap Growth
Equity – Net 7.1% 1.07 0.3 63.1% 140.2% 103.6% 67.3%
S&P 500* 0.0% 1.00 0.0 0.0% 100.0% 100.0% 100.0%
June 1999 – September 2012 (Single Computation)
Upsid
e%
Downside%
Upside / DownsideJune 1999 - September 2012 (Single Computation)
Upsid
e%
40
60
80
100
120
140
160
Downside%
40 60 80 100 120 140 160
Heritage All Cap Growth (gross)Heritage All Cap Growth (net)S&P 500
June 1999 - September 2012: Summary Statistics
Heritage All Cap Growth (gross)
Heritage All Cap Growth (net)
S&P 500
Alphavs.
Market
Betavs.
Market
SharpeRatio
BattingAverage
vs.Market
UpCapture
vs.Market
DownCapture
vs.Market
R-Squaredvs.
Market
7.9% 1.07 0.4 64.4% 142.9% 102.3% 67.3%
7.1% 1.07 0.3 63.1% 140.2% 103.6% 67.3%
0.0 1.0 0.0 0.0 100.0 100.0 100.0

48 Heritage Growth Equity – Third Quarter 2012
Heritage U.S. All Cap Growth Equity
Annualized Performance Peer Universe Rankings
*S&P 500 is for illustrative purposes only.
Source: eVestment Alliance U.S. Large Cap Equity Universe. All returns greater than one year are annualized. There may be a small return difference in
charts generated by eVestment Alliance due to rounding. Note: The GIPS compliant presentation can be found at the end of this presentation.
As of September 30, 2012
Heritage U.S. All Cap Growth Equity – Gross
S&P 500*

49 Heritage Growth Equity – Third Quarter 2012
This document is for your information only and is not an offer to sell, or a solicitation of an offer to buy, the securities or instruments
named or described in this document. Interested parties are advised to contact the entity with which they deal, or the entity that provided
this document to them, if they desire further information. The information in this document has been obtained or derived from sources
believed by Wells Capital Management to be reliable, but Wells Capital Management does not represent that this information is accurate or
complete. Any opinions or estimates contained in this document represent the judgment of Wells Capital Management, at this time, and
are subject to change without notice. Wells Capital Management and its affiliates may from time to time provide advice with respect to,
acquire, hold, or sell a position in, the securities or instruments named or described in this document.
Wells Capital Management is the trade name of the investment management services provided by certain subsidiaries of Wells
Fargo & Company and marketed by Wells Fargo Securities International Limited and Wells Capital Management, Inc. Wells
Fargo Securities International Limited is authorised and regulated by the U.K. Financial Services Authority.
Wells Capital Management provides investment advisory services to institutional clients. The rules contained under the Financial Services
and Markets Act 2000 concerning the protection of Retail Clients does not apply, nor will the Financial Services Compensation Scheme be
available.
For the purposes of Section 21, U.K. Financial Services and Markets Act 2000 (the “Act”), the content of this communication has been
approved by Wells Fargo Securities International Limited, a regulated person under the Act.
Disclaimer

50 Heritage Growth Equity – Third Quarter 2012
Primary Index : Russell 1000® Growth Index
1.Wells Capital Management (“WellsCap”) claims compliance with the Global Investment Performance Standards (GIPS®) and has prepared and presented this report in compliance with the GIPS standards. WellsCap has been
independently verified for the periods from January 1, 1997 through December 31, 2011. Verification assesses whether (1) the firm has complied with all the composite construction requirements of the GIPS standards on a firm-wide
basis and (2) the firm’s policies and procedures are designed to calculate and present performance in compliance with the GIPS standards. The Heritage Large Cap Growth Equity Composite has been examined for the periods from
January 1, 1995 through December 31, 2011. The verification and performance examination reports are available upon request.
2.WellsCap is a registered investment adviser and a wholly owned subsidiary of Wells Fargo Bank, N.A. Since the firm’s creation in 1996, the firm has acquired a number of investment teams and/or assets through mergers and
acquisitions. These include assets and/or investment teams from Norwest Investment Management Inc., Sutter Advisors, LLC, Montgomery Asset Management, Benson Associates, Strong Financial Corporation, Evergreen
Investments, First International Advisors, LLC, Metropolitan West Capital Management, LLC and EverKey Global Partners. In all cases, the investment teams involved in each acquisition and merger remain autonomous teams within
WellsCap.
3.The Heritage Large Cap Growth Equity Composite (“Composite”) consists of all discretionary accounts managed in this style. The Heritage Growth Equity team joined WellsCap in January 2005 and as such the "Total Firm Assets"
are only applicable since the date of acquisition. The Composite contains accounts investing primarily in the equities of growth companies. These companies generally have above average growth prospects, accelerating earnings and
sales, expanding market share, positive earnings surprises, and innovative new products and technologies. Certain accounts included in the Composite have the ability to utilize futures, options, swaps, and forward contracts for the
purposes of hedging or creating synthetic positions. The accounts have the ability to invest up to 100% of their assets in such securities. More restrictive investment limitations may be imposed. Such securities have ranged from 0.0%
to 3.0% of composite assets. Accounts are generally limited to medium–large market capitalization stocks. Investment results are measured versus the Russell 1000 Growth Index. On June 30, 2003, Ron Ognar, Co-Portfolio Manager,
left the firm. The Composite was created in 1999.
4.Composite returns are net of transaction costs and non-reclaimable withholding taxes, if any, are expressed in US dollars, and reflect the reinvestment of dividends and other earnings. A model fee is utilized for the net composite
returns, which is the maximum annual advisory fee based upon the fee schedule in effect during each respective performance period. Any changes to the fee schedule are reflected in the calculation of the net composite returns
beginning with the period in which the fee schedule is revised. Actual fees may vary depending on, among other things, the applicable fee schedule and portfolio size. The Composite may contain accounts with performance-based
fees. WellsCap’s fee schedules are available upon request and may also be found in Part 2 of Form ADV. The published fee schedule for this strategy is 0.75% for the first $25mm, 0.65% for the next $25mm, 0.50% for the next
$50mm and 0.40% over $100mm. Additional information regarding WellsCap’s policies for valuing accounts, calculating performance and preparing compliant presentations are available upon request.
5.Internal dispersion is the equal weighted standard deviation of the annual gross returns of all accounts included in the composite for the entire year. For years where there are fewer than 5 accounts in the composite for the entire year,
dispersion is not presented as it is not a meaningful statistical calculation. The three-year annualized standard deviation measures the variability of the gross composite returns and the index returns over the preceding 36-month time
period.
6.Index returns are provided to represent the investment environment existing during the time periods shown and are not covered by the report of independent verifiers. The Russell 1000 Growth Index measures the performance of the
large-cap growth segment of the U.S. equity universe. It includes those Russell 1000 Index companies with higher price-to-book ratios and higher forecasted growth values. For comparison purposes, the index is fully invested, which
includes the reinvestment of income. The returns for the index do not include any transaction costs, management fees or other costs.
7.Actual performance results may differ from composite returns, depending on the size of the account, investment guidelines and/or restrictions, inception date and other factors. Past performance is not indicative of future results. As
with any investment vehicle, there is always the potential for gains as well as the possibility of losses. Our registration as an Investment Adviser does not imply any level of skill or training. For a complete list of WellsCap composite
descriptions, please see https://www.wellscap.com/about/business_risk_compliance.html.
2002 2003 2004 2005 2006 2007 2008 2009 2010 2011
Gross Annual Returns (%) -25.2 29.8 12.5 8.9 5.1 19.8 -38.1 37.0 17.7 3.9
Net Annual Returns (%) -25.8 28.8 11.7 8.0 4.3 18.9 -38.5 36.0 16.9 3.1
Primary Index (%) -27.9 29.7 6.3 5.3 9.1 11.8 -38.4 37.2 16.7 2.6
Composite 3 Yr Std Dev (%) 27.82 19.69 14.95 11.16 10.48 9.78 16.49 18.91 21.22 17.56
Index 3 Yr Std Dev (%) 25.22 22.66 15.45 9.53 8.31 8.54 16.40 19.73 22.11 17.76
Internal Dispersion (%) 1.79 2.31 3.03 1.44 0.78 n/a n/a n/a n/a n/a
Number of Accounts 44 30 19 9 9 4 4 4 5 12
Composite Assets (mm) $3,312.4 $2,821.0 $2,497.6 $1,384.4 $1,314.1 $1,110.9 $654.2 $826.5 $1,647.5 $1,417.6
Total Firm Assets (mm) n/a n/a n/a $174,000 $189,100 $219,912 $252,048 $363,451 $365,552 $330,855
GIPS® Compliant Presentation
Heritage Large Cap Growth Equity Composite

51 Heritage Growth Equity – Third Quarter 2012
Primary and Secondary Index: Russell 1000® Growth Index and Russell 3000® Growth Index
1.Wells Capital Management (“WellsCap”) claims compliance with the Global Investment Performance Standards (GIPS®) and has prepared and presented this report in compliance with the GIPS standards. WellsCap has been
independently verified for the periods from January 1, 1997 through December 31, 2011. Verification assesses whether (1) the firm has complied with all the composite construction requirements of the GIPS standards on a firm-wide
basis and (2) the firm’s policies and procedures are designed to calculate and present performance in compliance with the GIPS standards. The Heritage Premier Growth Equity Composite has been examined for the periods from
January 1, 2011 through December 31, 2011. The verification and performance examination reports are available upon request.
2.WellsCap is a registered investment adviser and a wholly owned subsidiary of Wells Fargo Bank, N.A. Since the firm’s creation in 1996, the firm has acquired a number of investment teams and/or assets through mergers and
acquisitions. These include assets and/or investment teams from Norwest Investment Management Inc., Sutter Advisors, LLC, Montgomery Asset Management, Benson Associates, Strong Financial Corporation, Evergreen
Investments, First International Advisors, LLC, Metropolitan West Capital Management, LLC and EverKey Global Partners. In all cases, the investment teams involved in each acquisition and merger remain autonomous teams within
WellsCap.
3.The Heritage Premier Growth Equity Composite (“Composite”), previously named the Heritage Opportunistic Growth Equity Composite and the Growth Equity Composite, contains all discretionary accounts managed in this style.
The Heritage Growth Equity team joined WellsCap in January 2005 and as such the "Total Firm Assets" are only applicable since the date of acquisition. The composite includes accounts primarily investing in equities of large cap
growth companies with some exposure to mid cap and more limited exposure to small cap growth equities. These companies typically have above average growth prospects often indicated by robust growth in sales and earnings,
expanding market share, and innovative new products and technologies. Accounts generally emphasize medium to large market capitalization stocks. Investment results are measured versus the Russell 1000 Growth Index and the
Russell 3000 Growth Index. The Composite was created in March 2007.
4.Composite returns are net of transaction costs and non-reclaimable withholding taxes, if any, are expressed in US dollars, and reflect the reinvestment of dividends and other earnings. A model fee is utilized for the net composite
returns, which is the maximum annual advisory fee based upon the fee schedule in effect during each respective performance period. Any changes to the fee schedule are reflected in the calculation of the net composite returns
beginning with the period in which the fee schedule is revised. Actual fees may vary depending on, among other things, the applicable fee schedule and portfolio size. WellsCap’s fee schedules are available upon request and may also
be found in Part 2 of Form ADV. The published fee schedule for this strategy is 0.75% for the first $25mm, 0.65% for the next $25mm, 0.60% for the next $50mm and 0.55% over $100mm. Additional information regarding
WellsCap’s policies for valuing accounts, calculating performance and preparing compliant presentations are available upon request.
5.Internal dispersion is the equal weighted standard deviation of the annual gross returns of all accounts included in the composite for the entire year. For years where there are fewer than 5 accounts in the composite for the entire year,
dispersion is not presented as it is not a meaningful statistical calculation. The three-year annualized standard deviation measures the variability of the gross composite returns and the index returns over the preceding 36-month time
period.
6.Index returns are provided to represent the investment environment existing during the time periods shown and are not covered by the report of independent verifiers. The Russell 1000 Growth Index measures the performance of the
large-cap growth segment of the U.S. equity universe. It includes those Russell 1000 Index companies with higher price-to-book ratios and higher forecasted growth values. The Russell 3000 Growth Index measures the performance
of the broad-growth segment of the U.S. equity universe. It includes those Russell 3000 Index companies with higher price-to-book ratios and higher forecasted growth values. For comparison purposes, both indices are fully invested,
which includes the reinvestment of income. The returns for the indices do not include any transaction costs, management fees or other costs.
7.Actual performance results may differ from composite returns, depending on the size of the account, investment guidelines and/or restrictions, inception date and other factors. Past performance is not indicative of future results. As
with any investment vehicle, there is always the potential for gains as well as the possibility of losses. Our registration as an Investment Adviser does not imply any level of skill or training. For a complete list of WellsCap composite
descriptions, please see https://www.wellscap.com/about/business_risk_compliance.html.
2002 2003 2004 2005 2006 2007 2008 2009 2010 2011
Gross Annual Returns (%) -28.3 29.5 11.5 10.6 9.0 27.5 -38.4 44.7 22.1 7.5
Net Annual Returns (%) -28.8 28.6 10.7 9.8 8.2 26.6 -38.9 43.7 21.2 6.7
Primary Index (%) -27.9 29.7 6.3 5.3 9.1 11.8 -38.4 37.2 16.7 2.6
Secondary Index (%) -28.0 31.0 6.9 5.2 9.5 11.4 -38.4 37.0 17.6 2.2
Composite 3 Yr Std Dev (%) 22.36 18.56 15.34 12.25 12.46 11.85 18.26 19.98 21.88 17.71
Primary Index 3 Yr Std Dev (%) 25.22 22.66 15.45 9.53 8.31 8.54 16.40 19.73 22.11 17.76
Secondary Index 3 Yr Std Dev (%) 25.29 22.74 15.66 9.95 8.78 8.88 16.68 20.02 22.45 18.17
Internal Dispersion (%) n/a n/a n/a n/a n/a n/a n/a n/a n/a n/a
Number of Accounts 1 1 1 1 1 1 1 1 1 4
Composite Assets (mm) $34.9 $44.9 $49.7 $54.7 $50.3 $54.8 $32.1 $46.0 $37.9 $1,024.2
Total Firm Assets (mm) n/a n/a n/a $174,000 $189,100 $219,912 $252,048 $363,451 $365,552 $330,855
GIPS® Compliant Presentation
Heritage Premier Growth Equity Composite

52 Heritage Growth Equity – Third Quarter 2012
2002 2003 2004 2005 2006 2007 2008 2009 2010 2011
Gross Annual Returns (%) -22.7 36.3 20.0 14.6 9.4 29.3 -39.5 49.3 27.8 9.3
Net Annual Returns (%) -23.4 35.2 19.1 13.6 8.5 28.3 -40.0 48.1 26.8 8.5
Primary Index (%) -28.0 31.0 6.9 5.2 9.5 11.4 -38.4 37.0 17.6 2.2
Composite 3 Yr Std Dev (%) 26.29 21.67 16.58 13.51 13.84 13.01 18.80 20.41 22.58 18.43
Index 3 Yr Std Dev (%) 25.29 22.74 15.66 9.95 8.78 8.88 16.68 20.02 22.45 18.17
Internal Dispersion (%) n/a n/a n/a n/a n/a n/a n/a 0.77 0.58 0.46
Number of Accounts 1 1 1 2 2 4 5 6 11 30
Composite Assets (mm) $8.7 $16.9 $20.0 $1,442.0 $1,383.3 $1,718.5 $1,032.9 $1,643.6 $3,024.9 $8,285.5
Total Firm Assets (mm) n/a n/a n/a $174,000 $189,100 $219,912 $252,048 $363,451 $365,552 $330,855
Primary Index : Russell 3000® Growth Index
1.Wells Capital Management (“WellsCap”) claims compliance with the Global Investment Performance Standards (GIPS®) and has prepared and presented this report in compliance with the GIPS standards. WellsCap has been
independently verified for the periods from January 1, 1997 through December 31, 2011. Verification assesses whether (1) the firm has complied with all the composite construction requirements of the GIPS standards on a firm-
wide basis and (2) the firm’s policies and procedures are designed to calculate and present performance in compliance with the GIPS standards. The Heritage All Cap Growth Equity Composite has been examined for the periods
from January 1, 2005 through December 31, 2011. The verification and performance examination reports are available upon request.
2.WellsCap is a registered investment adviser and a wholly owned subsidiary of Wells Fargo Bank, N.A. Since the firm’s creation in 1996, the firm has acquired a number of investment teams and/or assets through mergers and
acquisitions. These include assets and/or investment teams from Norwest Investment Management Inc., Sutter Advisors, LLC, Montgomery Asset Management, Benson Associates, Strong Financial Corporation, Evergreen
Investments, First International Advisors, LLC, Metropolitan West Capital Management, LLC and EverKey Global Partners. In all cases, the investment teams involved in each acquisition and merger remain autonomous teams
within WellsCap.
3.The Heritage All Cap Growth Equity Composite (“Composite”) consists of all discretionary accounts managed in this style. The Heritage Growth Equity team joined WellsCap in January 2005 and as such the "Total Firm Assets"
are only applicable since the date of acquisition. The Composite contains accounts investing primarily in the equities of growth companies. These companies generally have above average growth prospects, accelerating earnings
and sales, expanding market share, positive earnings surprises, and innovative new products and technologies. Accounts consist of all market capitalization stocks. Certain accounts included in the Composite have the ability to
utilize futures, options, swaps, and forward contracts for the purposes of hedging or creating synthetic positions. The accounts have the ability to invest up to 100% of their assets in such securities. More restrictive investment
limitations may be imposed. Such securities have ranged from 0.0% to 3.0% of composite assets. Investment results are measured versus the Russell 3000 Growth Index. On March 31, 2008 Brandon Nelson, Co-Portfolio Manager,
left WellsCap. The Composite was created in October 2005.
4.Composite returns are net of transaction costs and non-reclaimable withholding taxes, if any, are expressed in US dollars, and reflect the reinvestment of dividends and other earnings. A model fee is utilized for the net composite
returns, which is the maximum annual advisory fee based upon the fee schedule in effect during each respective performance period. Any changes to the fee schedule are reflected in the calculation of the net composite returns
beginning with the period in which the fee schedule is revised. Actual fees may vary depending on, among other things, the applicable fee schedule and portfolio size. WellsCap’s fee schedules are available upon request and may
also be found in Part 2 of Form ADV. The published fee schedule for this strategy is 0.85% for the first $25mm, 0.75% for the next $25mm, 0.70% for the next $50mm and 0.65% over $100mm. Additional information regarding
WellsCap’s policies for valuing accounts, calculating performance and preparing compliant presentations are available upon request.
5.Internal dispersion is the equal weighted standard deviation of the annual gross returns of all accounts included in the composite for the entire year. For years where there are fewer than 5 accounts in the composite for the entire
year, dispersion is not presented as it is not a meaningful statistical calculation. The three-year annualized standard deviation measures the variability of the gross composite returns and the index returns over the preceding 36-
month time period.
6.Index returns are provided to represent the investment environment existing during the time periods shown and are not covered by the report of independent verifiers. The Russell 3000 Growth Index measures the performance of
the broad-growth segment of the U.S. equity universe. It includes those Russell 3000 Index companies with higher price-to-book ratios and higher forecasted growth values. For comparison purposes, the index is fully invested,
which includes the reinvestment of income. The returns for the index do not include any transaction costs, management fees or other costs.
7.Actual performance results may differ from composite returns, depending on the size of the account, investment guidelines and/or restrictions, inception date and other factors. Past performance is not indicative of future results.
As with any investment vehicle, there is always the potential for gains as well as the possibility of losses. Our registration as an Investment Adviser does not imply any level of skill or training. For a complete list of WellsCap
composite descriptions, please see https://www.wellscap.com/about/business_risk_compliance.html
GIPS® Compliant Presentation
Heritage All Cap Growth Equity Composite Performance Summary