Embed Size (px)
Citation preview
Wellhead, Conductor and Casing Fatigue – Causes and Mitigation
Tze King Lim, Elizabeth Tellier, Hugh Howells 2H Offshore Engineering
ABSTRACT Drilling operations for subsea wells are typically carried out using drilling risers with subsea BOP stacks deployed from mobile drilling units. The drilling risers are subject to wave-induced motions both from vessel motions and direct wave loading, as well as vortex-induced vibration (VIV) due to current flow past the riser. The motions are transferred down the riser to the wellhead, conductor and casing system and can cause fatigue issues at critical connectors and welds. The potential for severe fatigue loading of the wellhead system has increased over the last few years due to the use of 5th and 6th generation drilling vessels with larger BOP’s and considerably longer well operations, required to maximise output. Equipment selection is often based on what has been used on previous wells and is not always application specific. Analyses done during the conceptual design stage often focuses on the drilling riser and the fatigue performance of the wellhead and conductor are often overlooked. This paper describes the parameters that influence the riser motions transferred to the wellhead, conductor and casing system, and highlights those that are most damaging to fatigue performance. The options available to mitigate the fatigue issues through improved equipment configuration and specification are also discussed, together with various monitoring and fatigue tracking strategies to address these potential concerns. INTRODUCTION Subsea wellhead, conductor and casing systems are subject to cyclic lateral loads from the connected drilling riser. A typical drilling riser stack-up is shown in Figure 1. Waves cause vessel surge and sway motions which are then transferred to the top of the drilling riser. Additionally, there is direct hydrodynamic load on the riser from the waves. Vortex-induced vibration (VIV) is another source of riser motions. This phenomenon occurs when the frequency of the vortices shed by current flow around the riser matches a natural frequency of the riser system, resulting in lateral motions of the riser of over a diameter in amplitude. Failure of wellhead systems may occur due to excessive fatigue accumulation, [1]. Trends in BOP stack size and duration of drilling operations in recent years have increased risk of high fatigue accumulation at the wellhead, conductor and casing. The BOP stacks used on the newer 5th and 6th generation semisubmersible drilling rigs and drillships are larger in both height and mass than those deployed from older vessels. There is also a trend for more complex well completions which result in longer periods where the riser is connected to the wellhead. Drilling activities are also being performed at new locations with potentially more severe waves and currents.
Learn more at www.2hoffshore.com
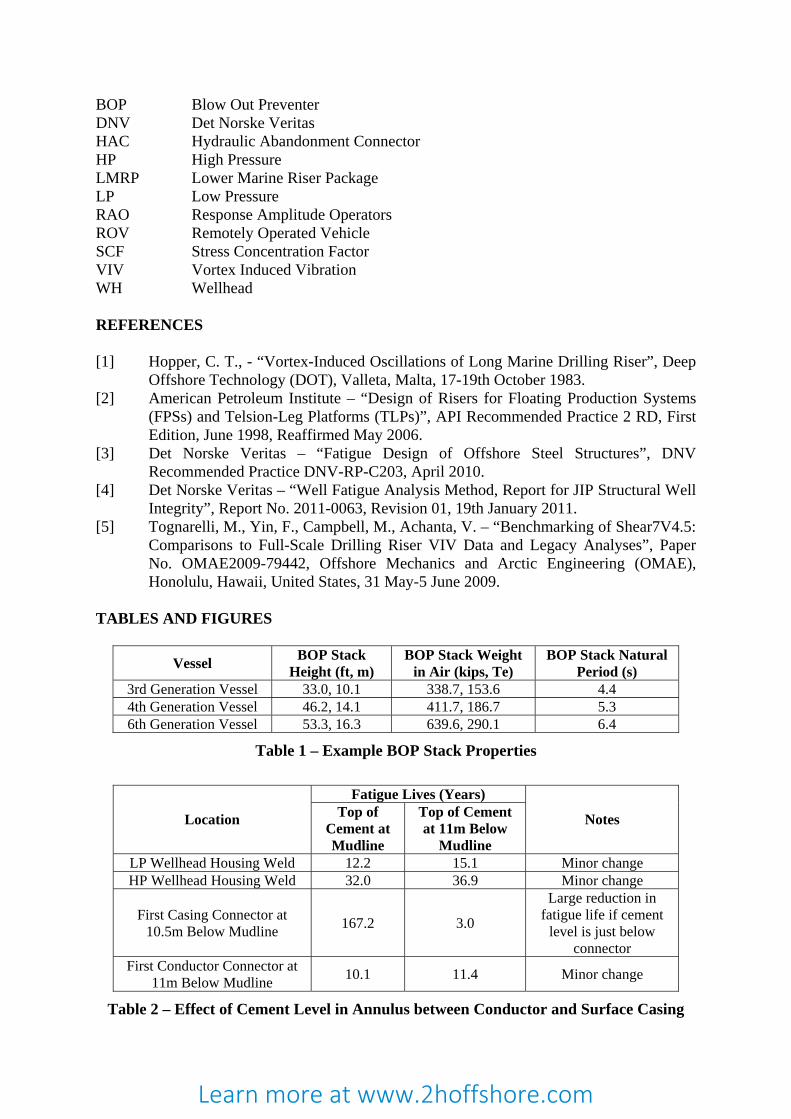
The fatigue critical locations along the wellhead, conductor and surface casing are shown in Figure 2. These consist of all welds and connectors from the base of the wellhead housings to a depth of 10-15m below the mudline. Theses locations may have high stress concentrations that amplify the stresses from the cyclic loading and become points where fatigue cracks can initiate and grow. The wellhead, conductor and casing however are not accessible for inspections, and hence a safety factor of 10 is often adopted, as recommended by API [2]. PARAMETERS AFFECTING FATIGUE PERFORMANCE Soil Strength Soft soils give rise to increase fatigue accumulation along the conductor and surface casing. Example fatigue analysis results showing the effect of soft soils is shown in Figure 3. In soft soils, the peak bending moment typically occurs at 5 to 10m below the mudline. Hence, the conductor and surface casing connectors at these depths become the most fatigue critical components due to their proximity to the peak bending loads. The magnitude of the bending loads are also larger in soft soils as larger deflections of the BOP stack can occur, resulting in further reductions in fatigue life. In stiff soils, peak bending loads occur at depths of 5m or less below the mudline, resulting in greatest fatigue accumulation at the welds and connectors near the mudline. BOP Stack Size Longer and heavier BOP stacks, and the presence of a horizontal subsea tree, cause worse fatigue lives along the wellhead, conductor and surface casing. The BOP stacks of the new 5th and 6th generation vessels are up to 1.6x longer and 2x heavier than the BOP stacks on older 3rd or 4th generation vessels, as shown by examples in Table 1. The increased size of the stack increases the fatigue loads in two ways: • A larger height and weight results in larger bending moments at the wellhead, conductor
and casing for the same lateral displacement; • A larger size increases the natural period of the BOP stack into the typical range of
periods where waves and VIV motions occur. Larger BOP motions are generated if the period of riser motions is close to the BOP stack natural period, as shown in Figure 4. In this example, 6 second waves or VIV cause BOP stack motions for the 6th generation vessels which are a factor of 3.0 and 1.4 larger than those for the 3rd and 4th generation vessels respectively. This corresponds to an increase in fatigue damage accumulation of approximately 81 and 3.8 times respectively.
The BOP stack natural period is also affected by the following: • Conductor size – A large conductor diameter or wall thickness decreases the BOP stack
natural period. • Soil strength – Softer soil increases the natural period of the BOP stack. In combination
with the other effects of soft soil previously described, this is particularly detrimental to fatigue performance.
Conductor and Casing Design The connectors along the conductor and surface casing are highly susceptible to fatigue if these are located in the region of high bending loads below the mudline. In the example shown in Figure 5, the connector for Conductor A has very low fatigue life due to this effect. This configuration is typically seen in conductors with Hydraulic Abandonment Connectors
Learn more at www.2hoffshore.com
(HACs), which are typically installed 1-5m below the mudline for exploration wells. Conductor B has a longer first joint and the connector is positioned well below the peak bending loads. The minimum fatigue life, now governed by the welds below the low pressure wellhead housing, is improved by a factor of 83. The first conductor or casing joint may also have additional welds for joint extensions, gimbal profiles, cement return ports, lifting lugs, and anti-rotation fins which introduce additional fatigue hotspots. These features are often overlooked during design or may even be incorporated after completion of the design process. These welds can potentially become the most fatigue critical location in the system due to their proximity to the location of maximum bending moment. The cement level in the annulus between the conductor and surface casing has negligible effect on the conductor fatigue life but may have a large effect on the high pressure housing weld and the surface casing, as shown by example results in Table 2. Lower fatigue lives are obtained at the casing connectors if the top of cement is just below the connector. Wellhead Design Subsea wellheads can be classified as rigid or non-rigid lockdown. Non-rigid lockdown wellheads may allow relative rotation between the housings to occur, as shown in Figure 6. This causes more bending loads and hence lower fatigue lives in the surface casing compared to a rigid lockdown wellhead. Example results with rigid and non-rigid lockdown wellheads are shown in Table 3. The results also show that cementing the surface casing to surface for a well with a non-rigid lockdown wellhead can provide similar results as a rigid lockdown wellhead. MITIGATION MEASURES Although vessels with better motion characteristics and smaller BOP stacks are preferred in order to give better fatigue performance, rig selection is often constrained by availability of the vessels and drilling depth capability. Careful design of the wellhead, conductor and surface casing can provide the required improvement in fatigue performance even in challenging environments and if large BOP stacks are used. The options available for designing fatigue tolerant wellhead, conductor and casing systems are as described below and the improvements in fatigue lives that can be obtained are summarised in Table 4. Relocating the Conductor and Casing Connector Positioning the conductor and casing connectors away from the region of high bending loads below the mudline is the most effective measure to improve fatigue lives at these connectors. This can be achieved by welding extensions to the existing casing or conductor joint as shown in Figure 7. The maximum lengths of these longer joints are typically limited to 18m due to transportation and handling constraints. Even though, this introduces additional welds that may be fatigue critical. Optimising the position of the connectors can provide improvements in fatigue life of up to 100x. Increase in Conductor Wall Thickness or Diameter Improvements in fatigue lives can be obtained by utilising a larger conductor diameter or wall thickness. Improvements in fatigue life by a factor of 1.5 to 3 may be expected for increasing wall thickness. Increasing wall thickness beyond 2 inches however may present manufacturing difficulties.
Learn more at www.2hoffshore.com
Increase in Casing Wall Thickness Increasing the surface casing wall thickness provides improvement at the high pressure housing weld by reducing the bending stresses at this location. For a typical 20” casing, increasing the wall thickness from 0.625” to 1” will increase fatigue life at the high pressure housing weld approximately by a factor of 2. Utilising a Rigid Lockdown Wellhead Compared to a non-rigid lockdown wellhead, a rigid lockdown wellhead transfers more loading into the stiffer conductor instead of the surface casing. Although this reduces the fatigue life at the low pressure housing weld by 20-40%, the fatigue life at the high pressure housing weld and casing connectors may be improved by a factor of 10. During installation, steps must be taken to ensure proper engagement of the wellhead lockdown mechanisms as otherwise the improvements cannot be relied upon. Improving Weld Quality The welds at the base of the high pressure and low pressure wellheads, and between the connectors to conductor or casing pipe, are typically classified as F or E-class by industry standards such as DNV-RP-C203, [3]. Fatigue critical welds can be upgraded to C1-class by careful design and fabrication control to include grinding the welds flush with the pipe wall on both the outer and inner surfaces to remove defects. Changing the housing welds from F-class and E-class to C1-class will increase the fatigue lives at these locations by factors of about 6.3 and 2.5, respectively. It should be noted that achieving C1-class welds may not be feasible for the higher grade materials used in the wellhead housings and conductor or casing connectors. Vendors should be consulted to ensure that this weld quality is achievable. Avoiding Additional Welds Additional welds along the first conductor and casing joints must be avoided in the region of high bending loads. Close control on the fatigue design specification through all stages of component manufacture and installation is required to ensure that changes are not inadvertently introduced. Improving Connector Fatigue Details The fatigue lives at the critical first conductor and casing connectors can be improved by considering connectors with better fatigue characteristics. A typical non fatigue resistant connector has a stress concentration factor (SCF) of about 5. Improving the SCF from 5 to 2.2, which is typical of fatigue resistant connectors, improves fatigue lives by a factor of 16. Integral connectors, which have the connector threads machined directly on to the ends of the pipe, have the added benefit of not requiring welding to the conductor or casing pipe. Alternatively, welded-on connections with improved SCFs may also be considered. However, higher quality C1-class welds may be required for the connector-to-pipe welds to maximise the benefit of the connectors. CONSERVATISMS IN ANALYSIS The fatigue analysis methodology for wellhead, conductor and casing systems are presently being refined, [4]. Fatigue analysis tends to result in conservative estimates of fatigue lives due to the wide range of assumptions that need to be made.
Learn more at www.2hoffshore.com
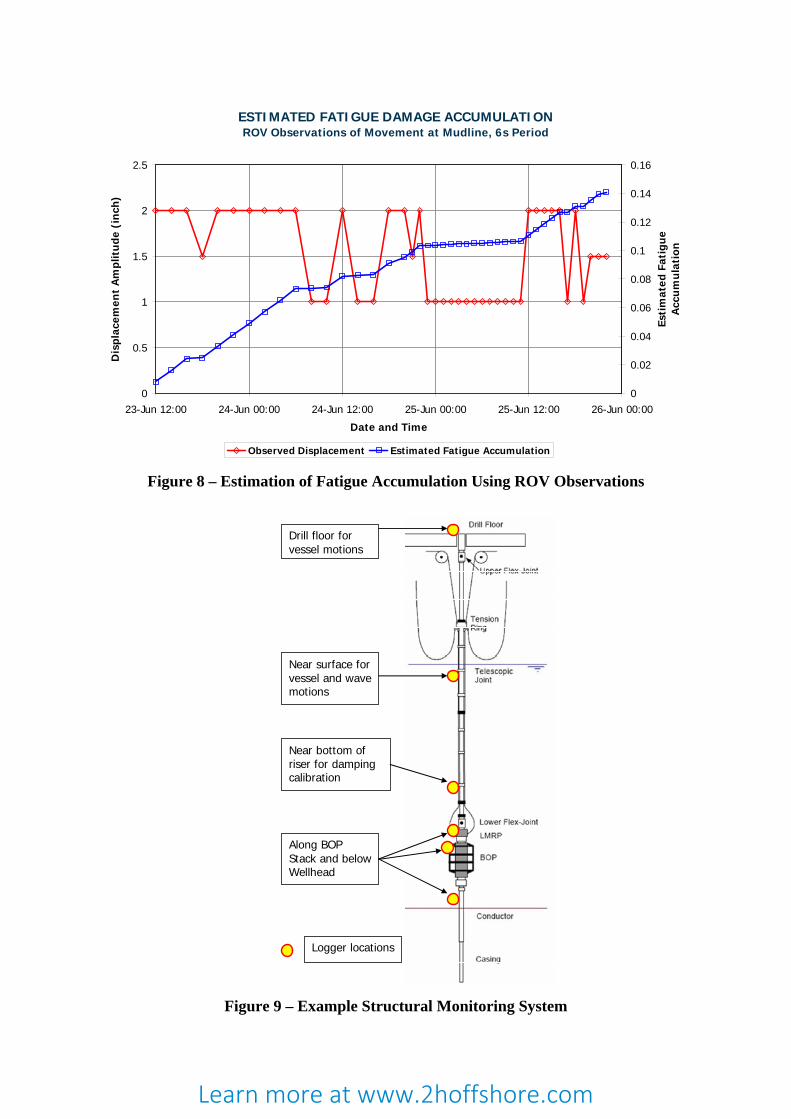
Connector Stress Concentrations Fatigue testing or finite element analyses of connectors are often not performed, and hence conservative assumptions may need to be made as to the connector SCF. Where fatigue testing is done by connector fabricators, the test results often show an order of magnitude improvement in fatigue life compared to finite element analysis, which indicates that SCF values are lower in reality. Cement Level Around Surface Casing Adopting the worst case cement levels and worst case housing interface tolerances can result in increased loading at the high pressure housing weld and surface casing, which may then become the fatigue critical components in the wellhead system. Casing Preload Casing preload affects the distribution of load between the conductor and casing. In a non-rigid lockdown well, analyses typically considers the lowest casing buoyant weight to increase the likelihood of high pressure housing lift-off. The casing however may be further lifted by cementing operations and temperature increase. Soil Data Lower bound soil data are typically quoted in geotechnical reports. These provide conservative fatigue results as softer soils will result in larger bending moments occurring closer to the critical welds and connectors along the conductor. Directionality of Loading Weather directionality, wave spreading, vessel RAO’s are almost always dealt with conservatively in fatigue analysis. These effects combined can result in overestimation of fatigue damage by a factor of 2 or more. However, it is often difficult to justify use of non-conservative assumptions at design stage. MONITORING AND FATIGUE TRACKING Methods for fatigue tracking of wellhead, conductor and surface casing fatigue damage accumulation are provided below. This assists in risk management by accounting for uncertainties in environmental and soil data, and qualification of any conservatism inherent in the analysis. ROV Observations Visual surveys using remotely-operated vehicles (ROVs) are useful to capture any obvious deviation of the system in terms of wellhead stickup and wellhead inclination, and can also provide a qualitative assessment of BOP stack movements. Fatigue accumulation rates can be determined for varying lateral displacements of the guide base or other reference point on the BOP stack. These can then be used to provide an estimate the accumulated fatigue damage at the critical hotspots, as showed by the example in Figure 8, and to calibrate analysis findings. Condition Monitoring The fatigue damage can be tracked by measuring waves using wave radars, through-depth currents using Acoustic Doppler Current Profilers (ADCPs), and dynamic vessel motions using 6 degree of freedom (6DOF) monitoring systems installed on the rig. Finite element analysis is used to map the effects of measured waves, currents and vessel motions to fatigue damage accumulation rates.
Learn more at www.2hoffshore.com
Structural Monitoring Structural monitoring involves the component-level motion and strain measurements which allows for the actual fatigue accumulation to be determined. Riser, BOP stack and wellhead motions can be measured using accelerometers and inclinometers. Strain monitoring devices can also be used to measure tensile bending variations. An example structural monitoring system is shown in Figure 9. This shows an array of accelerometers and angular rate sensors installed along the riser, BOP stack and wellhead as follows: • Vessel drill floor to measure vessel motions which allows correlation to measured riser
motions; • 20-50m below sea surface for measuring riser motions from vessel, waves and currents; • Near bottom of riser to determine amount of damping along riser; • Along BOP stack, wellhead and/or conductor to measure amount of motions transferred
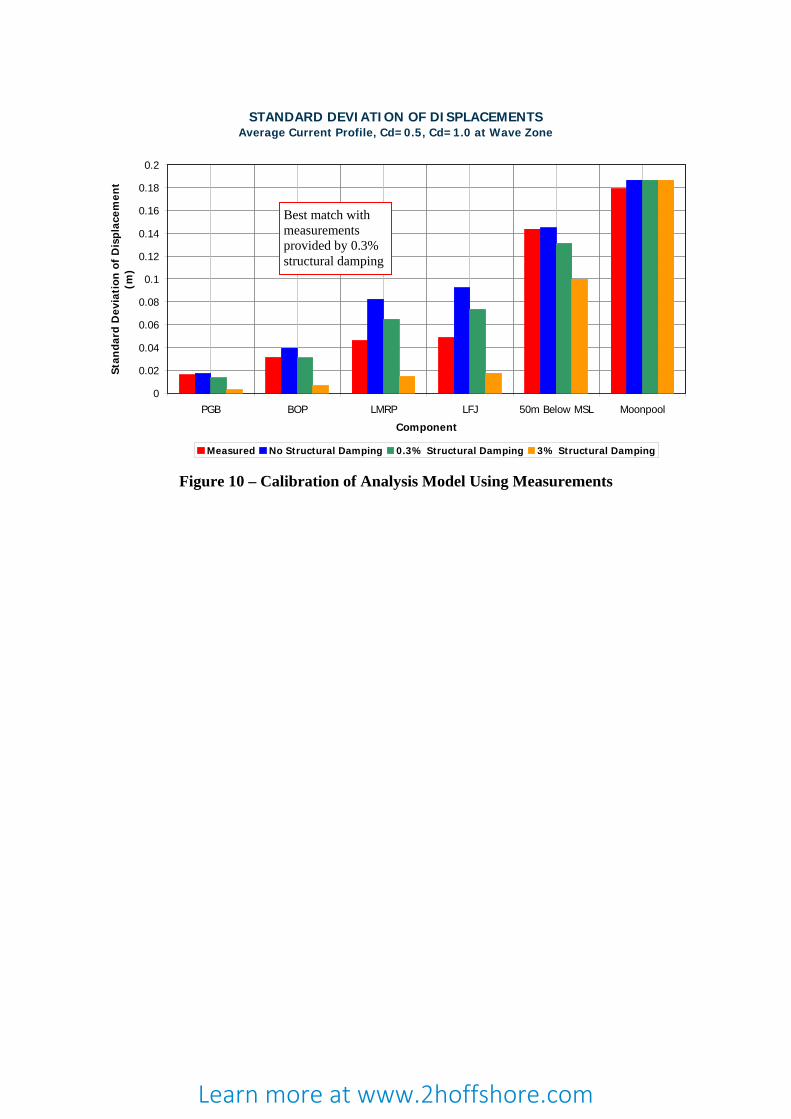
from the riser into the wellhead and conductor. Post processing of the measured data in both the time and frequency domain allows for the source of the motions to be identified as wave-induced or VIV. The amplitude of the measured motions is then processed into stress range and combined with number of cycles measured to obtain fatigue accumulation. The measured motion response also allows for the analysis models to be refined, [5]. An example showing the use of measured displacements to calibrate the drag and structural damping coefficients is shown in Figure 10. CONCLUSIONS Wave and current-induced motions are transferred down the drilling riser into the wellhead, conductor and surface casing, and can cause fatigue issues at critical welds and connectors. The main causes of large fatigue damage accumulation are soft soils, large BOP stack size and non-optimal wellhead, conductor and casing design. Recent trends in increasing BOP stack size and longer well operations have increased the risk of fatigue failure. The fatigue performance can be improved by taking due precautions during design. The most effective measure to improve fatigue performance at the conductor and casing connectors is to position these components away from the region of high bending loads below the mudline. The fatigue performance of welds can be improved by grinding the welds flush. Fatigue resistant connectors, rigid lockdown wellheads, as well as increasing conductor and casing size can also give improvements. Monitoring and fatigue tracking strategies can help in situations where fatigue life predictions are marginal. ROV observations can be used to provide an estimation of fatigue accumulation. Recording wave, current and vessel motion data during drilling and completion operations allows for the fatigue accumulation to be tracked using analysis to map measurements to fatigue accumulation. More detailed structural monitoring allows for the actual fatigue accumulation to be determined and allows for fine-tuning of analysis models. NOMENCLATURE 6DOF 6 Degrees Of Freedom ADCP Acoustic Doppler Current Profiler API American Petroleum Institute
Learn more at www.2hoffshore.com
BOP Blow Out Preventer DNV Det Norske Veritas HAC Hydraulic Abandonment Connector HP High Pressure LMRP Lower Marine Riser Package LP Low Pressure RAO Response Amplitude Operators ROV Remotely Operated Vehicle SCF Stress Concentration Factor VIV Vortex Induced Vibration WH Wellhead REFERENCES [1] Hopper, C. T., - “Vortex-Induced Oscillations of Long Marine Drilling Riser”, Deep
Offshore Technology (DOT), Valleta, Malta, 17-19th October 1983. [2] American Petroleum Institute – “Design of Risers for Floating Production Systems
(FPSs) and Telsion-Leg Platforms (TLPs)”, API Recommended Practice 2 RD, First Edition, June 1998, Reaffirmed May 2006.
[3] Det Norske Veritas – “Fatigue Design of Offshore Steel Structures”, DNV Recommended Practice DNV-RP-C203, April 2010.
[4] Det Norske Veritas – “Well Fatigue Analysis Method, Report for JIP Structural Well Integrity”, Report No. 2011-0063, Revision 01, 19th January 2011.
[5] Tognarelli, M., Yin, F., Campbell, M., Achanta, V. – “Benchmarking of Shear7V4.5: Comparisons to Full-Scale Drilling Riser VIV Data and Legacy Analyses”, Paper No. OMAE2009-79442, Offshore Mechanics and Arctic Engineering (OMAE), Honolulu, Hawaii, United States, 31 May-5 June 2009.
TABLES AND FIGURES
Vessel BOP Stack Height (ft, m)
BOP Stack Weight in Air (kips, Te)
BOP Stack Natural Period (s)
3rd Generation Vessel 33.0, 10.1 338.7, 153.6 4.4 4th Generation Vessel 46.2, 14.1 411.7, 186.7 5.3 6th Generation Vessel 53.3, 16.3 639.6, 290.1 6.4
Table 1 – Example BOP Stack Properties
Fatigue Lives (Years)
Location Top of Cement at Mudline
Top of Cement at 11m Below
Mudline
Notes
LP Wellhead Housing Weld 12.2 15.1 Minor change HP Wellhead Housing Weld 32.0 36.9 Minor change
First Casing Connector at 10.5m Below Mudline 167.2 3.0
Large reduction in fatigue life if cement
level is just below connector
First Conductor Connector at 11m Below Mudline 10.1 11.4 Minor change
Table 2 – Effect of Cement Level in Annulus between Conductor and Surface Casing
Learn more at www.2hoffshore.com
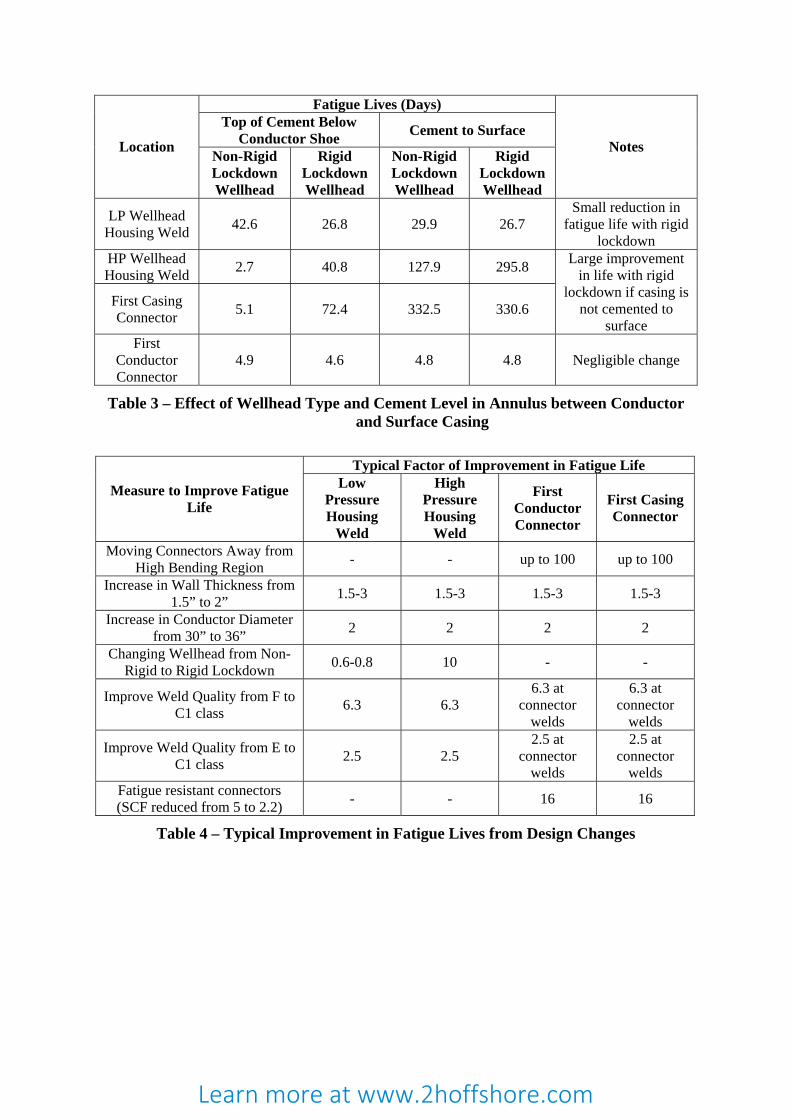
Fatigue Lives (Days) Top of Cement Below
Conductor Shoe Cement to Surface Location Non-Rigid
Lockdown Wellhead
Rigid Lockdown Wellhead
Non-Rigid Lockdown Wellhead
Rigid Lockdown Wellhead
Notes
LP Wellhead Housing Weld 42.6 26.8 29.9 26.7
Small reduction in fatigue life with rigid
lockdown HP Wellhead Housing Weld 2.7 40.8 127.9 295.8
First Casing Connector 5.1 72.4 332.5 330.6
Large improvement in life with rigid
lockdown if casing is not cemented to
surface First
Conductor Connector
4.9 4.6 4.8 4.8 Negligible change
Table 3 – Effect of Wellhead Type and Cement Level in Annulus between Conductor and Surface Casing
Typical Factor of Improvement in Fatigue Life
Measure to Improve Fatigue Life
Low Pressure Housing
Weld
High Pressure Housing
Weld
First Conductor Connector
First Casing Connector
Moving Connectors Away from High Bending Region - - up to 100 up to 100
Increase in Wall Thickness from 1.5” to 2” 1.5-3 1.5-3 1.5-3 1.5-3
Increase in Conductor Diameter from 30” to 36” 2 2 2 2
Changing Wellhead from Non-Rigid to Rigid Lockdown 0.6-0.8 10 - -
Improve Weld Quality from F to C1 class 6.3 6.3
6.3 at connector
welds
6.3 at connector
welds
Improve Weld Quality from E to C1 class 2.5 2.5
2.5 at connector
welds
2.5 at connector
welds Fatigue resistant connectors (SCF reduced from 5 to 2.2) - - 16 16
Table 4 – Typical Improvement in Fatigue Lives from Design Changes
Learn more at www.2hoffshore.com
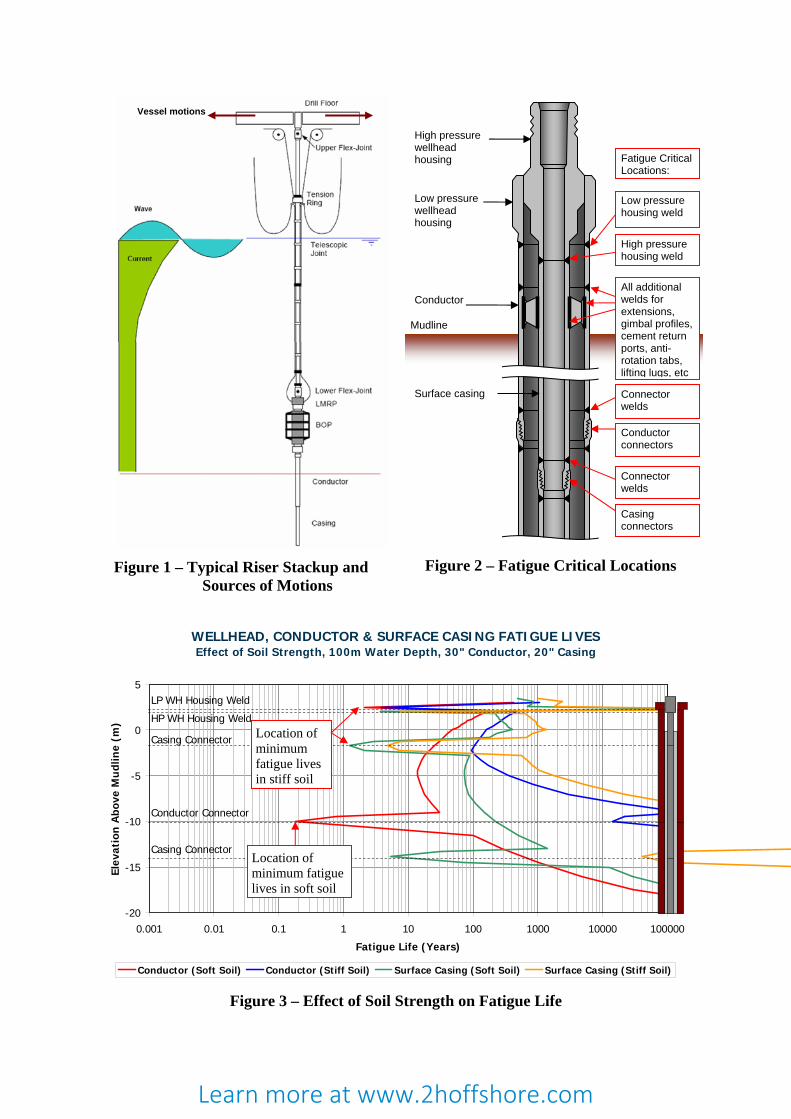
Figure 1 – Typical Riser Stackup and
Sources of Motions
Figure 2 – Fatigue Critical Locations
WELLHEAD, CONDUCTOR & SURFACE CASING FATIGUE LIVESEffect of Soil Strength, 100m Water Depth, 30" Conductor, 20" Casing
-20
-15
-10
-5
0
5
0.001 0.01 0.1 1 10 100 1000 10000 100000
Fatigue Life (Years)
Elev
atio
n A
bove
Mu
dlin
e (m
)
Conductor (Soft Soil) Conductor (Stiff Soil) Surface Casing (Soft Soil) Surface Casing (Stiff Soil)
LP WH Housing Weld
HP WH Housing Weld
Casing Connector
Conductor Connector
Casing Connector
Figure 3 – Effect of Soil Strength on Fatigue Life
Low pressure housing weld
High pressure housing weld
All additional welds for extensions, gimbal profiles, cement return ports, anti-rotation tabs, lifting lugs, etc
Connector welds
Conductor connectors
Connector welds
Casing connectors
Fatigue Critical Locations:
Low pressure wellhead housing
Conductor
Surface casing
Mudline
High pressure wellhead housing
Vessel motions
Location of minimum fatigue lives in stiff soil
Location of minimum fatigue lives in soft soil
Learn more at www.2hoffshore.com
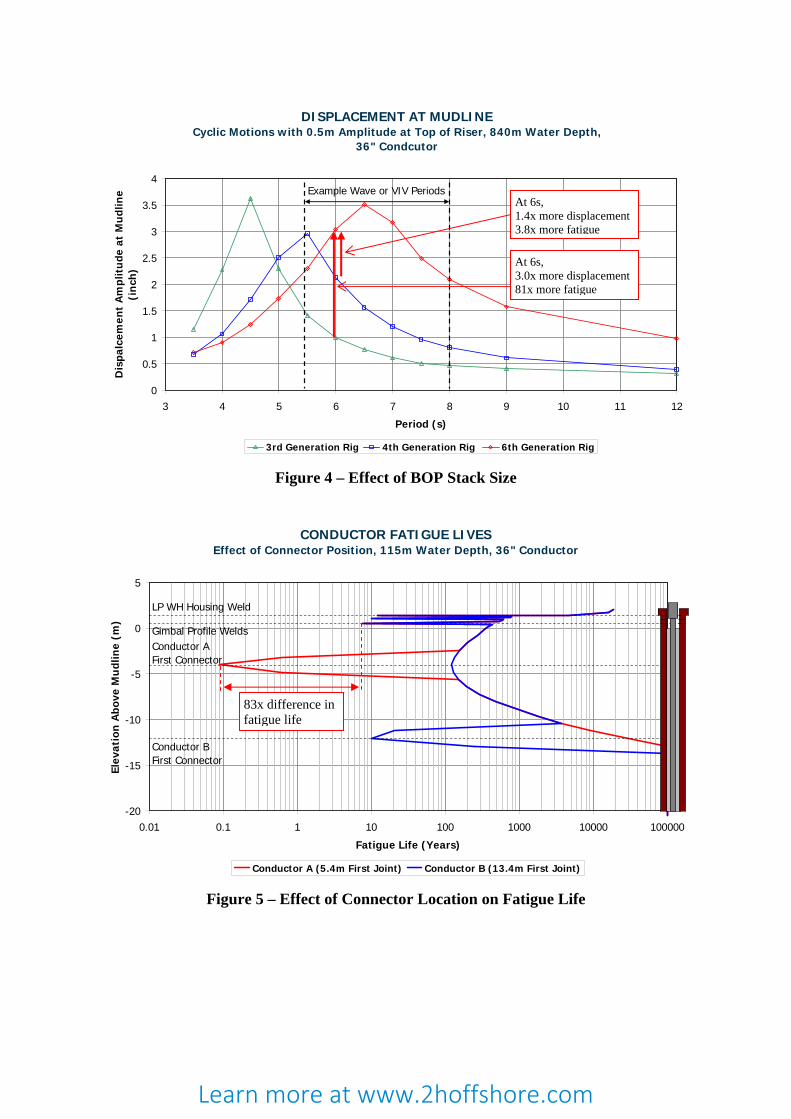
DISPLACEMENT AT MUDLINECyclic Motions with 0.5m Amplitude at Top of Riser, 840m Water Depth,
36" Condcutor
0
0.5
1
1.5
2
2.5
3
3.5
4
3 4 5 6 7 8 9 10 11 12
Period (s)
Dis
palc
emen
t A
mpl
itu
de a
t M
udl
ine
(in
ch)
3rd Generation Rig 4th Generation Rig 6th Generation Rig
Example Wave or VIV Periods
Figure 4 – Effect of BOP Stack Size
CONDUCTOR FATIGUE LIVESEffect of Connector Position, 115m Water Depth, 36" Conductor
-20
-15
-10
-5
0
5
0.01 0.1 1 10 100 1000 10000 100000
Fatigue Life (Years)
Elev
atio
n A
bove
Mu
dlin
e (m
)
Conductor A (5.4m First Joint) Conductor B (13.4m First Joint)
LP WH Housing Weld
Conductor BFirst Connector
Conductor AFirst Connector
Gimbal Profile Welds
Figure 5 – Effect of Connector Location on Fatigue Life
At 6s, 1.4x more displacement 3.8x more fatigue
At 6s, 3.0x more displacement 81x more fatigue
83x difference in fatigue life
Learn more at www.2hoffshore.com
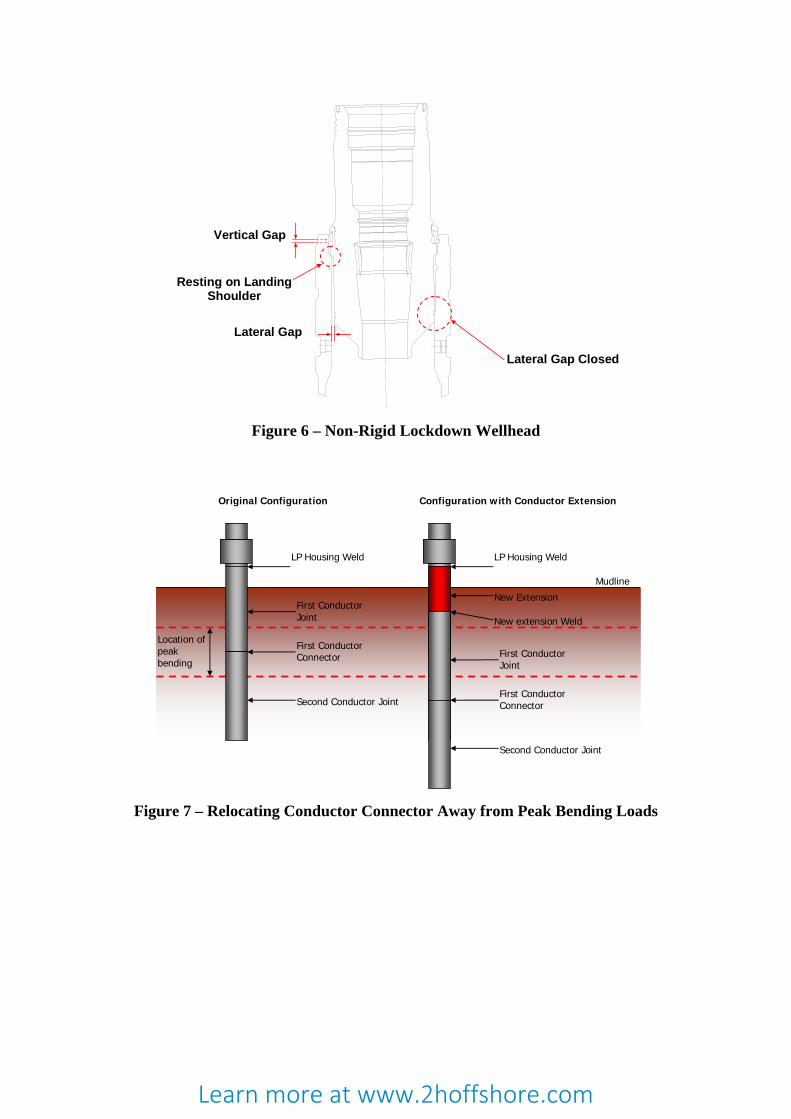
Resting on Landing Shoulder
Lateral Gap Closed
Vertical Gap
Lateral Gap
Figure 6 – Non-Rigid Lockdown Wellhead
LP Housing Weld
New ExtensionFirst Conductor Joint
Mudline
Second Conductor Joint
First Conductor Connector
LP Housing Weld
First Conductor Joint
Second Conductor Joint
First Conductor Connector
New extension Weld
Original Configuration Configuration with Conductor Extension
Location of peak bending
Figure 7 – Relocating Conductor Connector Away from Peak Bending Loads
Learn more at www.2hoffshore.com
ESTIMATED FATIGUE DAMAGE ACCUMULATIONROV Observations of Movement at Mudline, 6s Period
0
0.5
1
1.5
2
2.5
23-Jun 12:00 24-Jun 00:00 24-Jun 12:00 25-Jun 00:00 25-Jun 12:00 26-Jun 00:00
Date and Time
Dis
plac
emen
t A
mpl
itu
de (
inch
)
0
0.02
0.04
0.06
0.08
0.1
0.12
0.14
0.16
Esti
mat
ed F
atig
ue
Acc
um
ula
tion
Observed Displacement Estimated Fatigue Accumulation Figure 8 – Estimation of Fatigue Accumulation Using ROV Observations
Logger locations
Drill floor for vessel motions
Near surface for vessel and wave motions
Near bottom of riser for damping calibration
Along BOP Stack and below Wellhead
Figure 9 – Example Structural Monitoring System
Learn more at www.2hoffshore.com
STANDARD DEVIATION OF DISPLACEMENTSAverage Current Profile, Cd=0.5, Cd=1.0 at Wave Zone
0
0.02
0.04
0.06
0.08
0.1
0.12
0.14
0.16
0.18
0.2
PGB BOP LMRP LFJ 50m Below MSL Moonpool
Component
Stan
dard
Dev
iati
on o
f D
ispl
acem
ent
(m)
Measured No Structural Damping 0.3% Structural Damping 3% Structural Damping Figure 10 – Calibration of Analysis Model Using Measurements
Best match with measurements provided by 0.3% structural damping
Learn more at www.2hoffshore.com