Embed Size (px)
Citation preview

PROCEEDINGS, 44th Workshop on Geothermal Reservoir Engineering
Stanford University, Stanford, California, February 11-13, 2019
SGP-TR-214
1
Wellbore Simulation to Model Calcite Deposition on the Ngatamariki Geothermal Field, NZ
George Allan1, Justin Pogacnik, Farrell Siega, Simon Addison
Mercury NZ, 283 Vaughan Rd, Rotorua, New Zealand
Keywords: calcite, scaling, wellbore simulation, reservoir engineering, Ngatamariki, reservoir management
ABSTRACT
Calcite scaling in geothermal production wells is a major cause of decline in many geothermal fields worldwide. Reservoir fluid,
saturated with respect to calcite, flows up the wellbore and begins to flash to two-phase. During flashing, dissolved CO2 migrates into
the vapour phase, and calcite in the liquid phase becomes oversaturated. This mechanism has been observed in the Ngatamariki
reservoir in New Zealand, and has resulted in production decline in several wells. Anti-scalant injection, mechanical cleaning, and
chemical cleaning have all been used to manage wellbore calcite scaling at Ngatamariki.
Previous modelling work on calcite deposition has focused on the geochemical mechanism behind the formation of scale in a wellbore
or reservoir formation. Based on this work, wellbore simulation has been used at Ngatamariki to predict the location and extent of
deposition in wells to assist clean-out operations, forecast fuel capacity, and manage production wells effectively. This paper aims to
summarise the observations at Ngatamariki and describe the methods in which wellbore simulation has helped field operation.
1. INTRODUCTION
1.1 The Ngatamariki Geothermal Field
The Ngatamariki geothermal field is located in the Taupo Volcanic Zone (TVZ), in the centre of the North Island of New Zealand,
shown in Figure 1. An 83 MWe binary power station was commissioned in 2013, with a resource consent to take up to 60,000 t/d of
geothermal fluid. The power station is supplied by up to four production wells in the centre of the field (NM5, NM7, NM12, and
NM13), and nominally 100% of produced fluid is injected into up to four injection wells (NM6, NM8, NM9, and NM10) to manage
pressure drawdown. The reservoir is in a compressed liquid state, with production temperatures of 280-290°C and dilute chloride waters
with gas content less than 0.3wt%, of which ~95% is CO2.
Figure 1. Left: Map of identified geothermal fields in the Taupo Volcanic Zone. Ngatamariki is shown in bold (Bibby, et al.,
1995). Right: Layout of Ngatamariki geothermal field (Quinao, et al., 2017).
Allan, Pognacik, Siega and Addison
2
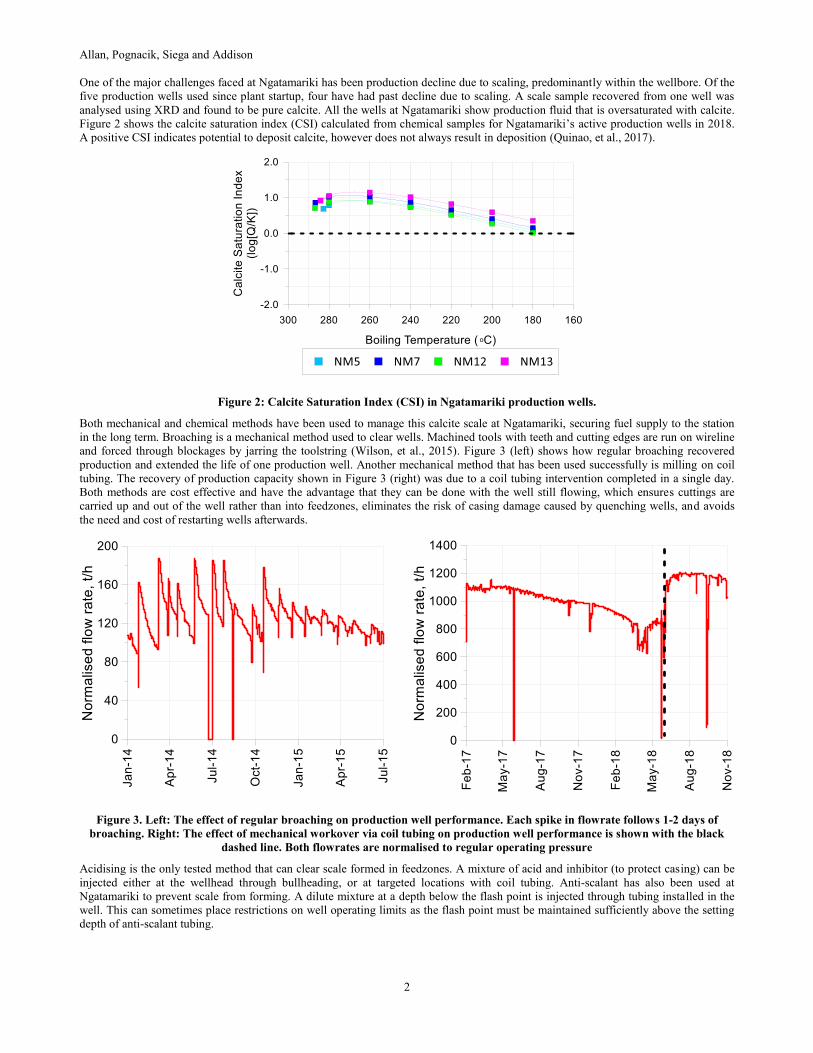
One of the major challenges faced at Ngatamariki has been production decline due to scaling, predominantly within the wellbore. Of the
five production wells used since plant startup, four have had past decline due to scaling. A scale sample recovered from one well was
analysed using XRD and found to be pure calcite. All the wells at Ngatamariki show production fluid that is oversaturated with calcite.
Figure 2 shows the calcite saturation index (CSI) calculated from chemical samples for Ngatamariki’s active production wells in 2018.
A positive CSI indicates potential to deposit calcite, however does not always result in deposition (Quinao, et al., 2017).
Figure 2: Calcite Saturation Index (CSI) in Ngatamariki production wells.
Both mechanical and chemical methods have been used to manage this calcite scale at Ngatamariki, securing fuel supply to the station
in the long term. Broaching is a mechanical method used to clear wells. Machined tools with teeth and cutting edges are run on wireline
and forced through blockages by jarring the toolstring (Wilson, et al., 2015). Figure 3 (left) shows how regular broaching recovered
production and extended the life of one production well. Another mechanical method that has been used successfully is milling on coil
tubing. The recovery of production capacity shown in Figure 3 (right) was due to a coil tubing intervention completed in a single day.
Both methods are cost effective and have the advantage that they can be done with the well still flowing, which ensures cuttings are
carried up and out of the well rather than into feedzones, eliminates the risk of casing damage caused by quenching wells, and avoids
the need and cost of restarting wells afterwards.
Figure 3. Left: The effect of regular broaching on production well performance. Each spike in flowrate follows 1-2 days of
broaching. Right: The effect of mechanical workover via coil tubing on production well performance is shown with the black
dashed line. Both flowrates are normalised to regular operating pressure
Acidising is the only tested method that can clear scale formed in feedzones. A mixture of acid and inhibitor (to protect casing) can be
injected either at the wellhead through bullheading, or at targeted locations with coil tubing. Anti-scalant has also been used at
Ngatamariki to prevent scale from forming. A dilute mixture at a depth below the flash point is injected through tubing installed in the
well. This can sometimes place restrictions on well operating limits as the flash point must be maintained sufficiently above the setting
depth of anti-scalant tubing.
Allan, Pognacik, Siega and Addison
3
1.2 Calcite Deposition
The planning and execution of any job to manage calcite scale requires an understanding of how and where calcite scale deposits. Hot
liquid produced from a reservoir will be in equilibrium with surrounding rock, generally controlled by the equilibrium reaction Eq(1):
2233
2 2 COOHCaCOHCOCa (1)
As compressed liquid flows into and up a wellbore, pressure decreases until the saturation pressure of the liquid is reached, and vapour
begins to form. This depth is known as the flash point or boiling point. The saturation pressure can depend heavily on the concentrations
of various gases and salt in the reservoir fluid. When vapour is formed, CO2 concentration in the liquid phase drops rapidly through gas
migration into the vapour phase, shifting the equilibrium reaction to produce more CO2, thereby depositing CaCO3, calcite.
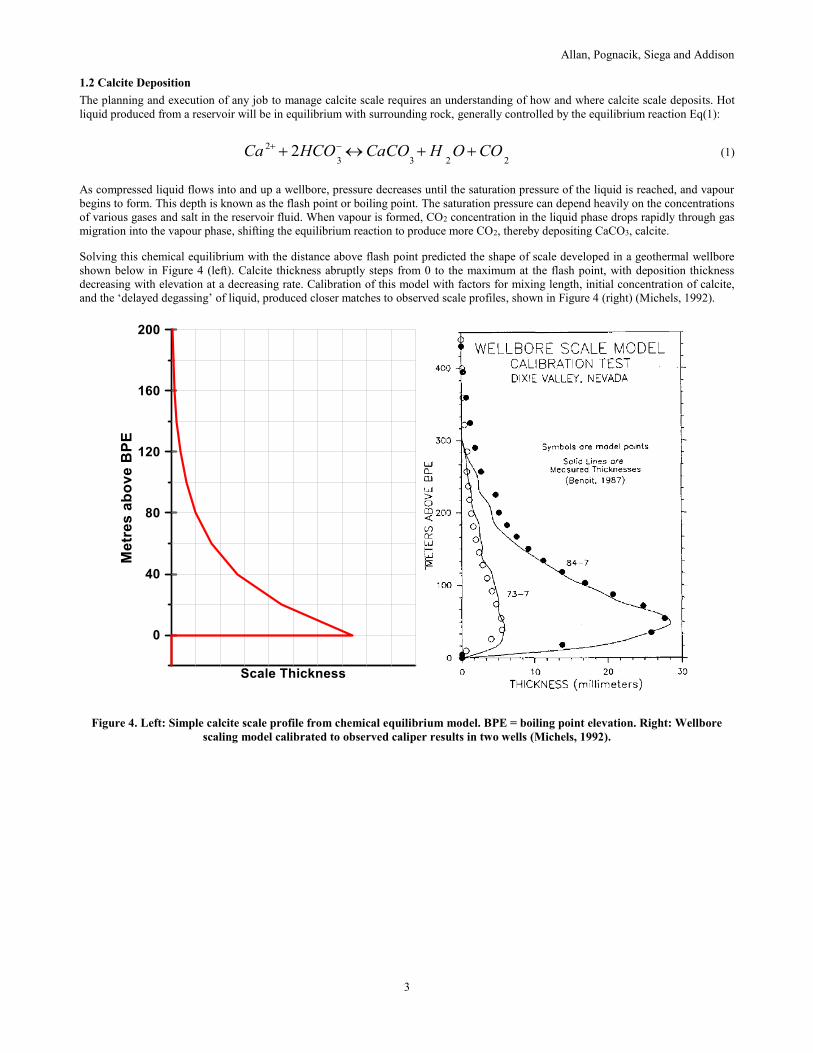
Solving this chemical equilibrium with the distance above flash point predicted the shape of scale developed in a geothermal wellbore
shown below in Figure 4 (left). Calcite thickness abruptly steps from 0 to the maximum at the flash point, with deposition thickness
decreasing with elevation at a decreasing rate. Calibration of this model with factors for mixing length, initial concentration of calcite,
and the ‘delayed degassing’ of liquid, produced closer matches to observed scale profiles, shown in Figure 4 (right) (Michels, 1992).
Figure 4. Left: Simple calcite scale profile from chemical equilibrium model. BPE = boiling point elevation. Right: Wellbore
scaling model calibrated to observed caliper results in two wells (Michels, 1992).
Allan, Pognacik, Siega and Addison
4
1.3 Wellbore Simulation
Wellbore simulation can be used to model the physical behaviour of a geothermal well. A bottom-up simulation begins at the lowest
feedzone with a starting pressure. The flowrate and temperature are dependent on the given feedzone parameters. With this information,
all thermodynamic properties can be calculated, as well as an expression for the change in pressure and enthalpy with elevation. Various
numerical methods can then be used to iteratively calculate the conditions at the next step up the wellbore. At Mercury an in-house
wellbore simulator named Paiwera is used for the simulation of both production and injection wells (Franz, 2015).
Based on known parameters such as casing sizes, feedzone productivities, reservoir pressures and temperatures, a good match to a
flowing PTS survey and the observed output of a well can be made. A well calibrated simulation can be used to predict how the output
of a well will be affected by changing reservoir or wellbore conditions. It can also be matched to the decline of a well to understand the
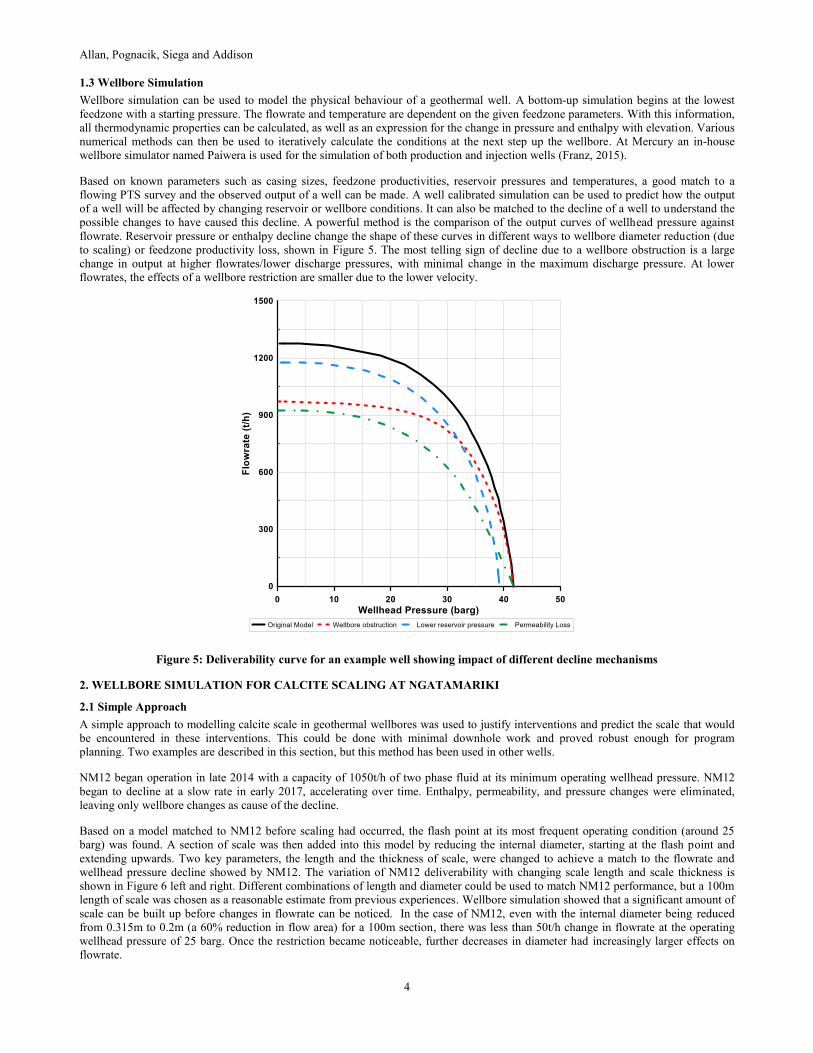
possible changes to have caused this decline. A powerful method is the comparison of the output curves of wellhead pressure against
flowrate. Reservoir pressure or enthalpy decline change the shape of these curves in different ways to wellbore diameter reduction (due
to scaling) or feedzone productivity loss, shown in Figure 5. The most telling sign of decline due to a wellbore obstruction is a large
change in output at higher flowrates/lower discharge pressures, with minimal change in the maximum discharge pressure. At lower
flowrates, the effects of a wellbore restriction are smaller due to the lower velocity.
Figure 5: Deliverability curve for an example well showing impact of different decline mechanisms
2. WELLBORE SIMULATION FOR CALCITE SCALING AT NGATAMARIKI
2.1 Simple Approach
A simple approach to modelling calcite scale in geothermal wellbores was used to justify interventions and predict the scale that would
be encountered in these interventions. This could be done with minimal downhole work and proved robust enough for program
planning. Two examples are described in this section, but this method has been used in other wells.
NM12 began operation in late 2014 with a capacity of 1050t/h of two phase fluid at its minimum operating wellhead pressure. NM12
began to decline at a slow rate in early 2017, accelerating over time. Enthalpy, permeability, and pressure changes were eliminated,
leaving only wellbore changes as cause of the decline.
Based on a model matched to NM12 before scaling had occurred, the flash point at its most frequent operating condition (around 25
barg) was found. A section of scale was then added into this model by reducing the internal diameter, starting at the flash point and
extending upwards. Two key parameters, the length and the thickness of scale, were changed to achieve a match to the flowrate and
wellhead pressure decline showed by NM12. The variation of NM12 deliverability with changing scale length and scale thickness is
shown in Figure 6 left and right. Different combinations of length and diameter could be used to match NM12 performance, but a 100m
length of scale was chosen as a reasonable estimate from previous experiences. Wellbore simulation showed that a significant amount of
scale can be built up before changes in flowrate can be noticed. In the case of NM12, even with the internal diameter being reduced
from 0.315m to 0.2m (a 60% reduction in flow area) for a 100m section, there was less than 50t/h change in flowrate at the operating
wellhead pressure of 25 barg. Once the restriction became noticeable, further decreases in diameter had increasingly larger effects on
flowrate.

Allan, Pognacik, Siega and Addison
5
Figure 6. Left: Simulated change in performance of NM12 with different scale thicknesses for 100m.
Right: Simulated change in performance with different lengths of 0.16m internal diameter in the wellbore
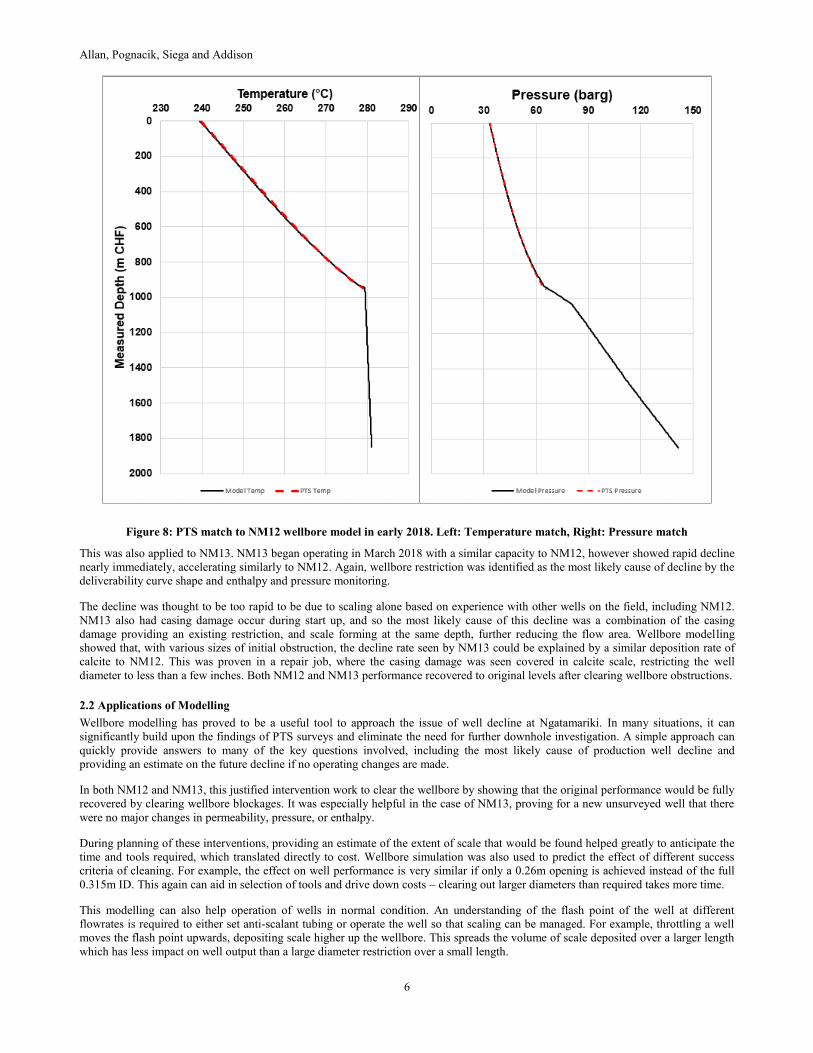
The decline of NM12 from January 2017 was matched by increasing the thickness of scale sections until the simulated output matched
the performance, shown in Figure 7. A PTS run in NM12 in early 2018 could not pass 950mD, approximately 80m above the simulated
flashpoint. The pressure and temperature measured to this depth matched closely to those predicted in the wellbore model, in Figure 8.
Based on the volume of the scale required to match NM12 decline rate, a scaling rate of 0.005m3/day at the current flowrate was
estimated to forecast the performance of NM12 shown in Figure 7. Based on these forecasts NM12 decline would continue to
accelerate, threatening Ngatamariki power station’s power output.
Figure 7: Matching performance of NM12 with increasing scale thickness and forecasting based on scaling rate
Allan, Pognacik, Siega and Addison
6
Figure 8: PTS match to NM12 wellbore model in early 2018. Left: Temperature match, Right: Pressure match
This was also applied to NM13. NM13 began operating in March 2018 with a similar capacity to NM12, however showed rapid decline
nearly immediately, accelerating similarly to NM12. Again, wellbore restriction was identified as the most likely cause of decline by the
deliverability curve shape and enthalpy and pressure monitoring.
The decline was thought to be too rapid to be due to scaling alone based on experience with other wells on the field, including NM12.
NM13 also had casing damage occur during start up, and so the most likely cause of this decline was a combination of the casing
damage providing an existing restriction, and scale forming at the same depth, further reducing the flow area. Wellbore modelling
showed that, with various sizes of initial obstruction, the decline rate seen by NM13 could be explained by a similar deposition rate of
calcite to NM12. This was proven in a repair job, where the casing damage was seen covered in calcite scale, restricting the well
diameter to less than a few inches. Both NM12 and NM13 performance recovered to original levels after clearing wellbore obstructions.
2.2 Applications of Modelling
Wellbore modelling has proved to be a useful tool to approach the issue of well decline at Ngatamariki. In many situations, it can
significantly build upon the findings of PTS surveys and eliminate the need for further downhole investigation. A simple approach can
quickly provide answers to many of the key questions involved, including the most likely cause of production well decline and
providing an estimate on the future decline if no operating changes are made.
In both NM12 and NM13, this justified intervention work to clear the wellbore by showing that the original performance would be fully
recovered by clearing wellbore blockages. It was especially helpful in the case of NM13, proving for a new unsurveyed well that there
were no major changes in permeability, pressure, or enthalpy.
During planning of these interventions, providing an estimate of the extent of scale that would be found helped greatly to anticipate the
time and tools required, which translated directly to cost. Wellbore simulation was also used to predict the effect of different success
criteria of cleaning. For example, the effect on well performance is very similar if only a 0.26m opening is achieved instead of the full
0.315m ID. This again can aid in selection of tools and drive down costs – clearing out larger diameters than required takes more time.
This modelling can also help operation of wells in normal condition. An understanding of the flash point of the well at different
flowrates is required to either set anti-scalant tubing or operate the well so that scaling can be managed. For example, throttling a well
moves the flash point upwards, depositing scale higher up the wellbore. This spreads the volume of scale deposited over a larger length
which has less impact on well output than a large diameter restriction over a small length.

Allan, Pognacik, Siega and Addison
7
2.3 Simulating Deposition Over Time
There were significant assumptions made in the modelling of scale in the previous section. The key simplifying assumption was that
wellbore scale could be modelled as a ‘block’, ignoring the shape expected from chemical modelling and experience with surveys in
other scaling wells. To attempt to recreate that shape, rather than using a chemical modelling approach, the change in the flash point of
the well over time due to increasing deposition was investigated. The chemical equilibrium solution assumed that the flash point of the
well does not change over time, which is uncommon for an operating well.
An iterative approach of layering on sections of scale was used. A basic wellbore model was solved at a given wellhead pressure, and
then a layer of scale was added extending upwards from the flash point by reducing the wellbore diameter. This was repeated, solving
the model again to represent another time step, finding the new flash point, and adding more scale.
Two different approaches were made to determine how much to reduce the wellbore diameter. The first was to reduce the diameter by a
set amount. The second approach was to take the flowrate from the model run and use it to calculate a volume of scale to deposit based
on Ngatamariki’s calcite oversaturation. An ‘excess calcite’ concentration of 1.3mg/kg was used based on the CSI of Ngatamariki
production wells and multiplied by the flowrate in kg/s. This was then multiplied by the time to simulate in each step (in this case, 5
days) and divided by the density of calcite to obtain a volume. The volume was spread evenly across a 50m length above the flash point.
This produced the scale profiles shown in Figure 9, where one line is drawn for every four simulations. The first approach produced
similar results.
Figure 9: Remaining wellbore diameter with depth from simulations
Modelling a moving flashpoint generates a similar scale profile to that observed in many scaling wells, building to a maximum
restriction and then dropping in an exponential manner.
The next step was to vary the amount deposited per time step to attempt to match the performance of scaling wells. This was attempted
in NM12 and NM13. The average wellhead pressure over 5 day periods was used to simulate NM12, aiming to match the flowrate
observed by depositing scale in the wellbore. The parameters to be changed were the time per iteration, the excess calcite concentration,
and the distance over which the volume was deposited. Future studies across more fields could provide estimates of these parameters
based on the thermodynamic and chemical conditions in the reservoir.
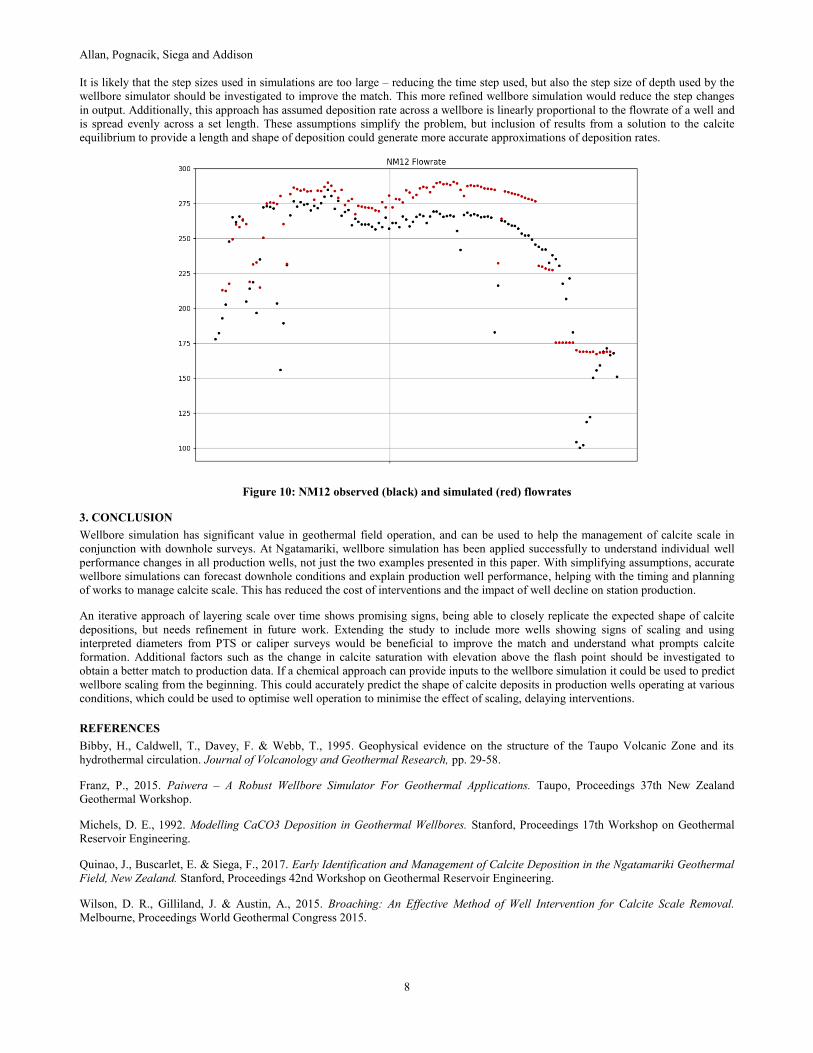
Unfortunately, attempting to match flowrate over time proved difficult. Very little impact would be seen until a critical point, at which
flowrate would suddenly step down, compared to the smooth decline expected. An example is shown in Figure 10, where 50m sections
of scale, 5 day time steps, and 0.8 mg/kg calcite oversaturation were used. A variety of combinations could not produce an accurate
match to the performance of NM12.
Allan, Pognacik, Siega and Addison
8
It is likely that the step sizes used in simulations are too large – reducing the time step used, but also the step size of depth used by the
wellbore simulator should be investigated to improve the match. This more refined wellbore simulation would reduce the step changes
in output. Additionally, this approach has assumed deposition rate across a wellbore is linearly proportional to the flowrate of a well and
is spread evenly across a set length. These assumptions simplify the problem, but inclusion of results from a solution to the calcite
equilibrium to provide a length and shape of deposition could generate more accurate approximations of deposition rates.
Figure 10: NM12 observed (black) and simulated (red) flowrates
3. CONCLUSION
Wellbore simulation has significant value in geothermal field operation, and can be used to help the management of calcite scale in
conjunction with downhole surveys. At Ngatamariki, wellbore simulation has been applied successfully to understand individual well
performance changes in all production wells, not just the two examples presented in this paper. With simplifying assumptions, accurate
wellbore simulations can forecast downhole conditions and explain production well performance, helping with the timing and planning
of works to manage calcite scale. This has reduced the cost of interventions and the impact of well decline on station production.
An iterative approach of layering scale over time shows promising signs, being able to closely replicate the expected shape of calcite
depositions, but needs refinement in future work. Extending the study to include more wells showing signs of scaling and using
interpreted diameters from PTS or caliper surveys would be beneficial to improve the match and understand what prompts calcite
formation. Additional factors such as the change in calcite saturation with elevation above the flash point should be investigated to
obtain a better match to production data. If a chemical approach can provide inputs to the wellbore simulation it could be used to predict
wellbore scaling from the beginning. This could accurately predict the shape of calcite deposits in production wells operating at various
conditions, which could be used to optimise well operation to minimise the effect of scaling, delaying interventions.
REFERENCES
Bibby, H., Caldwell, T., Davey, F. & Webb, T., 1995. Geophysical evidence on the structure of the Taupo Volcanic Zone and its
hydrothermal circulation. Journal of Volcanology and Geothermal Research, pp. 29-58.
Franz, P., 2015. Paiwera – A Robust Wellbore Simulator For Geothermal Applications. Taupo, Proceedings 37th New Zealand
Geothermal Workshop.
Michels, D. E., 1992. Modelling CaCO3 Deposition in Geothermal Wellbores. Stanford, Proceedings 17th Workshop on Geothermal
Reservoir Engineering.
Quinao, J., Buscarlet, E. & Siega, F., 2017. Early Identification and Management of Calcite Deposition in the Ngatamariki Geothermal
Field, New Zealand. Stanford, Proceedings 42nd Workshop on Geothermal Reservoir Engineering.
Wilson, D. R., Gilliland, J. & Austin, A., 2015. Broaching: An Effective Method of Well Intervention for Calcite Scale Removal.
Melbourne, Proceedings World Geothermal Congress 2015.