Embed Size (px)
Citation preview
Well-Being in Middle Childhood: An Assets-BasedPopulation-Level Research-to-Action Project
Martin Guhn & Kimberly A. Schonert-Reichl &Anne M. Gadermann & Dan Marriott & Lisa Pedrini &Shelley Hymel & Clyde Hertzman
Accepted: 31 January 2012 /Published online: 19 February 2012# Springer Science+Business Media B.V. 2012
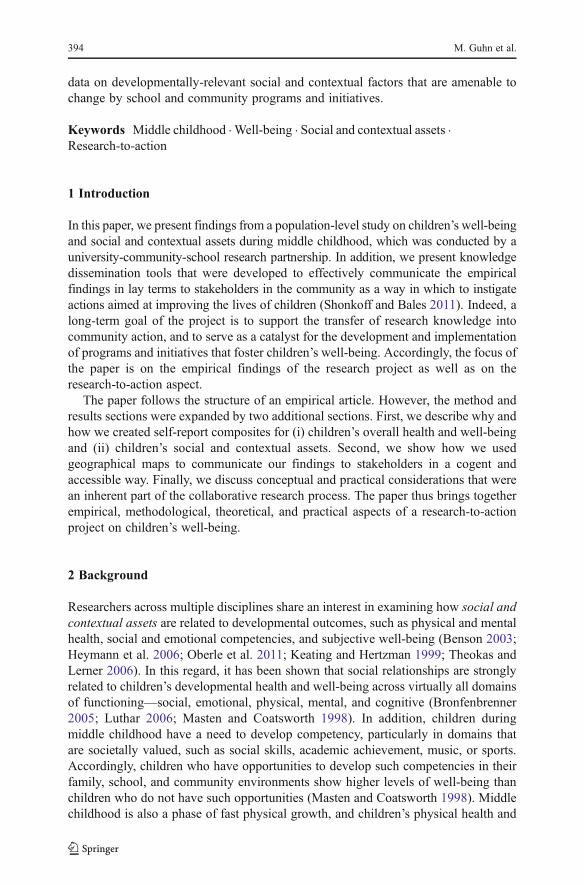
Abstract This paper presents findings from a population-level, research-to-action partnership project on children’s well-being during the middle childhoodyears. Relations between 4th graders’ (N03,026) well-being (composite of satis-faction with life, optimism, self-concept, overall health, and depressive symptoms)and their social and contextual assets (adult connectedness, peer connectedness,school experiences, health habits, after-school program participation) were examinedvia a school district-wide administration of theMiddle Years Development Instrument(MDI)—a self-report, population-based survey administered by teachers to childrenin their classrooms. Findings corroborated the premise that children’s well-being isassociated with their social and contextual assets. Specifically, after controlling forsocioeconomic status and language background, significant and positive relationshipswere found between children’s well-being and the number of social and contextualassets reported, with each additional asset associated with a significantly higher levelof well-being. In order to disseminate our findings to school and community stake-holder groups and to facilitate the translation of research into action, we developedgeographical maps that illustrate the relationship between the children’s well-beingcomposite and their social and contextual assets at the neighborhood-level. Weconclude by addressing theoretical, methodological, and practical challenges of ourresearch-to-action partnership, and by discussing the importance of collecting anddisseminating population-level data on children’s well-being in combination with
Child Ind Res (2012) 5:393–418DOI 10.1007/s12187-012-9136-8
M. Guhn (*) :K. A. Schonert-Reichl : S. Hymel : C. HertzmanUniversity of British Columbia, 4th Floor, Library Processing Centre, 2206 East Mall, Vancouver,BC V6T 1Z3, Canadae-mail: [email protected]
A. M. GadermannHarvard University, Cambridge, MA, USA
D. Marriott : L. PedriniVancouver School Board, Vancouver, BC, Canada
data on developmentally-relevant social and contextual factors that are amenable tochange by school and community programs and initiatives.
Keywords Middle childhood .Well-being . Social and contextual assets .
Research-to-action
1 Introduction
In this paper, we present findings from a population-level study on children’s well-beingand social and contextual assets during middle childhood, which was conducted by auniversity-community-school research partnership. In addition, we present knowledgedissemination tools that were developed to effectively communicate the empiricalfindings in lay terms to stakeholders in the community as a way in which to instigateactions aimed at improving the lives of children (Shonkoff and Bales 2011). Indeed, along-term goal of the project is to support the transfer of research knowledge intocommunity action, and to serve as a catalyst for the development and implementationof programs and initiatives that foster children’s well-being. Accordingly, the focus ofthe paper is on the empirical findings of the research project as well as on theresearch-to-action aspect.
The paper follows the structure of an empirical article. However, the method andresults sections were expanded by two additional sections. First, we describe why andhow we created self-report composites for (i) children’s overall health and well-beingand (ii) children’s social and contextual assets. Second, we show how we usedgeographical maps to communicate our findings to stakeholders in a cogent andaccessible way. Finally, we discuss conceptual and practical considerations that werean inherent part of the collaborative research process. The paper thus brings togetherempirical, methodological, theoretical, and practical aspects of a research-to-actionproject on children’s well-being.
2 Background
Researchers across multiple disciplines share an interest in examining how social andcontextual assets are related to developmental outcomes, such as physical and mentalhealth, social and emotional competencies, and subjective well-being (Benson 2003;Heymann et al. 2006; Oberle et al. 2011; Keating and Hertzman 1999; Theokas andLerner 2006). In this regard, it has been shown that social relationships are stronglyrelated to children’s developmental health and well-being across virtually all domainsof functioning—social, emotional, physical, mental, and cognitive (Bronfenbrenner2005; Luthar 2006; Masten and Coatsworth 1998). In addition, children duringmiddle childhood have a need to develop competency, particularly in domains thatare societally valued, such as social skills, academic achievement, music, or sports.Accordingly, children who have opportunities to develop such competencies in theirfamily, school, and community environments show higher levels of well-being thanchildren who do not have such opportunities (Masten and Coatsworth 1998). Middlechildhood is also a phase of fast physical growth, and children’s physical health and
394 M. Guhn et al.
well-being during that period is related to their nutrition (Connell et al. 2005), theirsleep quality and pattern (Smaldone et al. 2007), and their physical activities andexercise (Brown and Siegel 1988; Norris et al. 1992). Furthermore, research suggestthat indicators of quality time with one’s family (e.g., regular family meals; Eisenberget al. 2004) and certain after-school activities (e.g., sports, music) are positivelyrelated to children’s well-being (Bastian 2000; Donaldson and Ronan 2006; Posnerand Vandell 1999; Steptoe and Butler 1996). In sum, research has identified a numberof social and contextual assets that are significantly related to children’s overall healthand well-being (cf. Theokas et al. 2005).
There are numerous initiatives that aim to translate the cumulative researchevidence on children’s well-being and social and contextual assets into effectivecommunity practices, programs, and policies (Durlak et al. 2011; Durlak et al.2010; Greenberg et al. 2003; Spoth and Greenberg 2005; Shonkoff and Bales2011). Also, a number of research initiatives attempt to develop indicator systemsof children’s or adolescents’ well-being in order to raise awareness and visibility ofthe topic in public and political debate, and to allow for regional or cultural comparisonsof child and adolescent well-being (e.g., Ben-Arieh in press; Ben-Arieh and Frønes2011; Casas et al. 2011; O’Hare 2011).
However, the translation of research into action is confronted with numerouschallenges. For example, importing evidence-based programs from one context tothe next often fails (e.g., Cook et al. 2000; Rogers 1995), because local social andcultural context factors are not taken into consideration, leading to mismatchesbetween program objectives and local needs and resources (e.g., Rogers 1995),resistance to program implementation (e.g., Noblit et al. 2001), and/or a lack ofprogram integrity (Zins et al. 2000a; 2000b). This substantiates the notion that thetranslation of research evidence into effective programs, practices, or policies relies asmuch on the local cultural context and the social psychology of the implementationprocesses as on the convincing nature and internal validity of the research evidence(Rogers 1995). Accordingly, community-based research projects increasingly engagecommunity stakeholders from the beginning of the research process—that is, thedevelopment of research questions and research design—to the interpretation andcommunication of findings, the development of solutions, and the implementation ofprograms, policies, and practices. This approach aims to achieve greater success intransforming locally-created research evidence into effective community action(Greenberg et al. 2007; Lerner et al. 2000; Thompson 1999).
Likewise, the translation of research into public discourse—or, in other words, thecreation of awareness and communication of research findings to the public—hascommonly been found to be difficult. In part, the difficulty is that despite “consid-erable interest in science, the public’s attention span is typically short” (Shonkoff andBales 2011, p. 22). Furthermore, Shonkoff and Bales (2011) claim that during thetranslation of research findings by media, complex relationships occasionally getoversimplified, and they therefore recommend that scientists facilitate knowledgetransfer. Specifically, they recommend that scientists prepare stories that (i) succinctlycapture the core message of the research and (ii) relate to the public’s culturally andcontextually relevant frames of reference.
The present study was designed with the specific purpose of facilitating knowledgetransfer and the translation of research into action. Accordingly, we describe in some
An Assets-Based Population-Level Research-to-Action Project 395
detail how we created communication and dissemination tools aimed at conveyingresearch findings in succinct and contextually relevant stories.
3 Interdisciplinary Theoretical Framework and Methodological Approach
Our research project integrated theoretical frameworks and methodologicalapproaches from different disciplinary traditions. First, our study was informed bybio-ecological theories of human development (e.g., Bronfenbrenner 2005), and wetherefore collected data on multiple personal, social, and contextual home, school,and community factors that are of developmental relevance to children’s well-beingand health during middle childhood. Second, we drew from a strength- andasset-based approach toward children’s well-being. Accordingly, we focused onsocial and contextual factors that are amenable to change through school andcommunity actions, and that have been found in previous research to have thecapacity to promote children’s well-being: supportive relationships with adultsin the family, school, and community contexts; connectedness and friendshipswith peers; positive school experiences; health habits (regular breakfast, familymeals, and sleep); and participation in organized after-school activities (e.g.,Masten and Coatsworth 1998; Scales et al. 2006; Theokas et al. 2005). Third, weconceptualized children’s well-being as a multi-dimensional construct—rather than auni-dimensional construct—consisting of both (the presence of) positive outcomesand (the absence of) negative outcomes (Headey et al. 1993). Fourth, we designed theproject to collect data for an entire population of children—that is, a census, ratherthan a sample—because communicating research to multiple, non-scientific audien-ces (i.e., families, schools, communities) attracts particular attention when the targetaudiences recognize that the findings pertain to their own children and local context,and can be compared to locally representative reference points (Casas 2010; Lerneret al. 2000).
Finally, our research process followed principles of an applied developmentalscience framework (Lerner et al. 2000), in that we worked with students, teachers,parents, school administrators, community service professionals, and schoolunion members in every aspect of the research process in order to translateresearch into action: formulation of the research questions and purpose; designand content of the data collection tool; implementation of the district-widesurvey administration; data analysis and interpretation; development of thedissemination tools and strategies; presentation and discussion of researchfindings; and development of action “tool kits” and resources for programs andpractices.
4 Overview of the Current Project: Aims and Hypotheses
In Canada, there are systems in place that monitor children’s academic achievement.However, representative data on children’s well-being during middle childhood arelacking. The objective of this study was to fill this gap. Our project was designed tocomplement existing academic achievement data with data on children’s well-being
396 M. Guhn et al.
and associated social and contextual assets. Thus, our project allows us to provide thepublic with population-level data on the ‘whole child.’ The long-term goal of theproject is to thus provide stakeholders in communities and schools with local,contextualized research data that can inform their respective programs, actions, andservices.
For our study, we surveyed 9- to 10-year old children (i.e., 4th graders). Wefocused on this age group for two reasons. First, this age marks the mid-point ofmiddle childhood (commonly defined as the period from age 6 to 12 years; Collins1984), a critical period of development marked by biological, cognitive, and socialchanges and transitions (Eccles 1999). During this time, children develop self-confidence and a host of important competencies that have long-term implicationsfor later development (Huston and Ripke 2006). In addition, it is during middlechildhood that mental health problems and behavior problems frequently begin toemerge (e.g., Costello et al. 2003; Kessler et al. 2005). Second, the research literatureand our research experience in the Canadian school system suggest that one canobtain reliable and valid information via classroom-administered surveys in Grade 4(e.g., Gadermann et al. 2011; Gadermann et al. 2010).
In 2010, after 5 years of collaborative research project planning and development,our team of researchers, educators, and professional staff from the University ofBritish Columbia, the United Way of the Lower Mainland, and the Vancouver SchoolBoard administered a comprehensive self-report survey—the Middle Years Develop-ment Instrument (MDI; Schonert-Reichl et al. 2010)—to Grade 4 students in theVancouver school district.
Consistent with previous research (e.g., Scales et al. 2006; Theokas et al.2005), we expected to find that children’s well-being would be significantly andpositively correlated with social and contextual assets. Extending previous research,we examined a broad range of social and contextual factors and examinedwhether the relationship between the social and contextual assets and children’swell-being reflects a linear additive model, a diminishing return model, or amultiplicative model. Given the great variation in socioeconomic status as wellas the diversity of cultural backgrounds of children living in Vancouver—a large,multi-ethnic, and urban Canadian city—a further objective was to examine theextent to which the relationship between well-being and social and contextualassets would remain consistent after controlling for differences in socioeconomicstatus (at the child- and the neighborhood-level) and (ethno-cultural) languagebackground.
Finally, a central aim of this study was to develop knowledge translationtools that are easily accessible to multiple audiences—that is, (i) to practi-tioners, who wish to see the practical relevance of research for their ownday-to-day activities, (ii) to administrators, who wish to recognize or envisionthe data’s potential benefit for their schools, and (iii) to policy makers, whowish to obtain research evidence that enhances their political mandates. Thechallenge for the design of such dissemination tools was twofold: they had toretain the scientific rigor and the complexities of the data but also had tocommunicate key findings briefly, yet clearly to stakeholder groups who, duringtheir day-to-day work, can dedicate little time to consuming research information (cf.Shonkoff and Bales 2011).
An Assets-Based Population-Level Research-to-Action Project 397
5 Method
5.1 Sample
Participants in the district-wide administration of the MDI included 3,026 4th gradestudents (48% girls; Mage09.7, SD0 .3) from 201 classrooms in 72 elementaryschools in the diverse, urban public school district (with a student population over50,000) of Vancouver, British Columbia, Canada. The total sample represents 80% ofthe public school district’s total Grade 4 student population, with 72 of 81 elementaryschools participating, and an overall student participation rate of 93%.
With regard to first language, 40% of the participants indicated that English was theirfirst language, 33% indicated that they first learned a language other than English, and27% reported English and one other language as their first languages. The ‘languagesspoken at home’ reported most frequently in the present sample included: English(89%), Cantonese (18%), Mandarin (12%), Tagalog (6%), Punjabi (5%), Vietnamese(5%), Spanish (3%), French (3%), Korean (2%), Japanese (2%), Hindi (1%), Farsi (1%).(The total is higher than 100% becausemany children reportedmore than one language).Languages spoken at home that were reported with a frequency lower than 1% percent(making up 10% of the total sample) are not listed here.)
5.2 Procedure
TheMDIwas administered to 4th graders in Vancouver in January 2010. Participation inthe MDI project was voluntary for each school and teacher. Given that the MDI datawere collected by and in collaboration with schools, passive consent procedures wereemployed, and were approved by the University of British Columbia’s Human SubjectsInstitutional Review Board. Four weeks prior to administration of the MDI, parents/guardians were informed about the project via letters sent home with children (translatedinto multiple languages representative of the student population). These letters describedthe MDI study and indicated that if parent(s)/guardian(s) did not wish their child(ren) toparticipate, they should indicate this to their child’s teacher and that their child(ren)would be excused from participation without penalty. Parents/guardians also were toldthat they could obtain a copy of the MDI if they requested one.
The MDI was administered by classroom teachers. Teachers received a manualdescribing procedures for administering theMDI. The teachers read aloud a verbal studentassent script, informing students that participation was voluntary and that their responseswere confidential, and that there would be no consequences if they chose not to partic-ipate. To guard against biases due to variability in children’s reading proficiencies, theteacher read each item aloud, and students marked their responses accordingly. Studentswere encouraged to ask questions during the administration if they did not understand anitem. On average, completion of the MDI required two 40-min class periods.
5.3 Measures
All child-level data were drawn from students’ self-reports on the school district-wideadministration of theMiddle Years Development Instrument (MDI), and all socioeco-nomic status variables were obtained from Canadian census data.
398 M. Guhn et al.
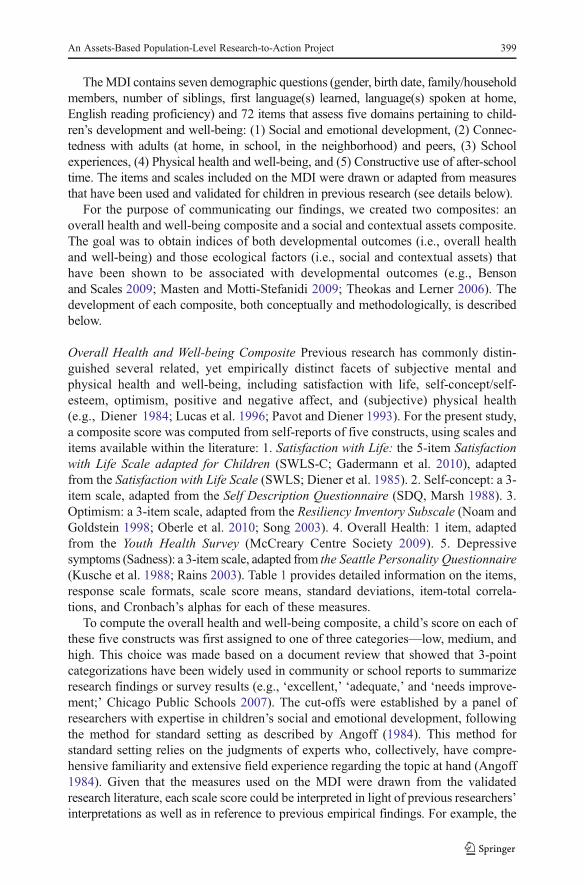
TheMDI contains seven demographic questions (gender, birth date, family/householdmembers, number of siblings, first language(s) learned, language(s) spoken at home,English reading proficiency) and 72 items that assess five domains pertaining to child-ren’s development and well-being: (1) Social and emotional development, (2) Connec-tedness with adults (at home, in school, in the neighborhood) and peers, (3) Schoolexperiences, (4) Physical health and well-being, and (5) Constructive use of after-schooltime. The items and scales included on the MDI were drawn or adapted from measuresthat have been used and validated for children in previous research (see details below).
For the purpose of communicating our findings, we created two composites: anoverall health and well-being composite and a social and contextual assets composite.The goal was to obtain indices of both developmental outcomes (i.e., overall healthand well-being) and those ecological factors (i.e., social and contextual assets) thathave been shown to be associated with developmental outcomes (e.g., Bensonand Scales 2009; Masten and Motti-Stefanidi 2009; Theokas and Lerner 2006). Thedevelopment of each composite, both conceptually and methodologically, is describedbelow.
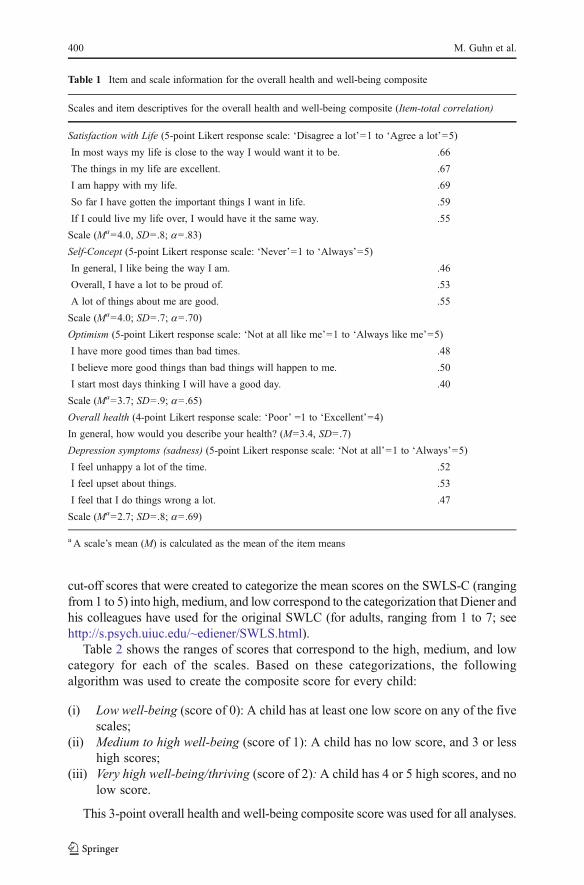
Overall Health and Well-being Composite Previous research has commonly distin-guished several related, yet empirically distinct facets of subjective mental andphysical health and well-being, including satisfaction with life, self-concept/self-esteem, optimism, positive and negative affect, and (subjective) physical health(e.g., Diener 1984; Lucas et al. 1996; Pavot and Diener 1993). For the present study,a composite score was computed from self-reports of five constructs, using scales anditems available within the literature: 1. Satisfaction with Life: the 5-item Satisfactionwith Life Scale adapted for Children (SWLS-C; Gadermann et al. 2010), adaptedfrom the Satisfaction with Life Scale (SWLS; Diener et al. 1985). 2. Self-concept: a 3-item scale, adapted from the Self Description Questionnaire (SDQ, Marsh 1988). 3.Optimism: a 3-item scale, adapted from the Resiliency Inventory Subscale (Noam andGoldstein 1998; Oberle et al. 2010; Song 2003). 4. Overall Health: 1 item, adaptedfrom the Youth Health Survey (McCreary Centre Society 2009). 5. Depressivesymptoms (Sadness): a 3-item scale, adapted from the Seattle Personality Questionnaire(Kusche et al. 1988; Rains 2003). Table 1 provides detailed information on the items,response scale formats, scale score means, standard deviations, item-total correla-tions, and Cronbach’s alphas for each of these measures.
To compute the overall health and well-being composite, a child’s score on each ofthese five constructs was first assigned to one of three categories—low, medium, andhigh. This choice was made based on a document review that showed that 3-pointcategorizations have been widely used in community or school reports to summarizeresearch findings or survey results (e.g., ‘excellent,’ ‘adequate,’ and ‘needs improve-ment;’ Chicago Public Schools 2007). The cut-offs were established by a panel ofresearchers with expertise in children’s social and emotional development, followingthe method for standard setting as described by Angoff (1984). This method forstandard setting relies on the judgments of experts who, collectively, have compre-hensive familiarity and extensive field experience regarding the topic at hand (Angoff1984). Given that the measures used on the MDI were drawn from the validatedresearch literature, each scale score could be interpreted in light of previous researchers’interpretations as well as in reference to previous empirical findings. For example, the
An Assets-Based Population-Level Research-to-Action Project 399
cut-off scores that were created to categorize the mean scores on the SWLS-C (rangingfrom 1 to 5) into high, medium, and low correspond to the categorization that Diener andhis colleagues have used for the original SWLC (for adults, ranging from 1 to 7; seehttp://s.psych.uiuc.edu/~ediener/SWLS.html).
Table 2 shows the ranges of scores that correspond to the high, medium, and lowcategory for each of the scales. Based on these categorizations, the followingalgorithm was used to create the composite score for every child:
(i) Low well-being (score of 0): A child has at least one low score on any of the fivescales;
(ii) Medium to high well-being (score of 1): A child has no low score, and 3 or lesshigh scores;
(iii) Very high well-being/thriving (score of 2): A child has 4 or 5 high scores, and nolow score.
This 3-point overall health and well-being composite score was used for all analyses.
Table 1 Item and scale information for the overall health and well-being composite
Scales and item descriptives for the overall health and well-being composite (Item-total correlation)
Satisfaction with Life (5-point Likert response scale: ‘Disagree a lot’01 to ‘Agree a lot’05)
In most ways my life is close to the way I would want it to be. .66
The things in my life are excellent. .67
I am happy with my life. .69
So far I have gotten the important things I want in life. .59
If I could live my life over, I would have it the same way. .55
Scale (Ma04.0, SD0 .8; a0 .83)
Self-Concept (5-point Likert response scale: ‘Never’01 to ‘Always’05)
In general, I like being the way I am. .46
Overall, I have a lot to be proud of. .53
A lot of things about me are good. .55
Scale (Ma04.0; SD0 .7; a0 .70)
Optimism (5-point Likert response scale: ‘Not at all like me’01 to ‘Always like me’05)
I have more good times than bad times. .48
I believe more good things than bad things will happen to me. .50
I start most days thinking I will have a good day. .40
Scale (Ma03.7; SD0 .9; a0 .65)
Overall health (4-point Likert response scale: ‘Poor’ 01 to ‘Excellent’04)
In general, how would you describe your health? (M03.4, SD0 .7)
Depression symptoms (sadness) (5-point Likert response scale: ‘Not at all’01 to ‘Always’05)
I feel unhappy a lot of the time. .52
I feel upset about things. .53
I feel that I do things wrong a lot. .47
Scale (Ma02.7; SD0 .8; a0 .69)
a A scale’s mean (M) is calculated as the mean of the item means
400 M. Guhn et al.
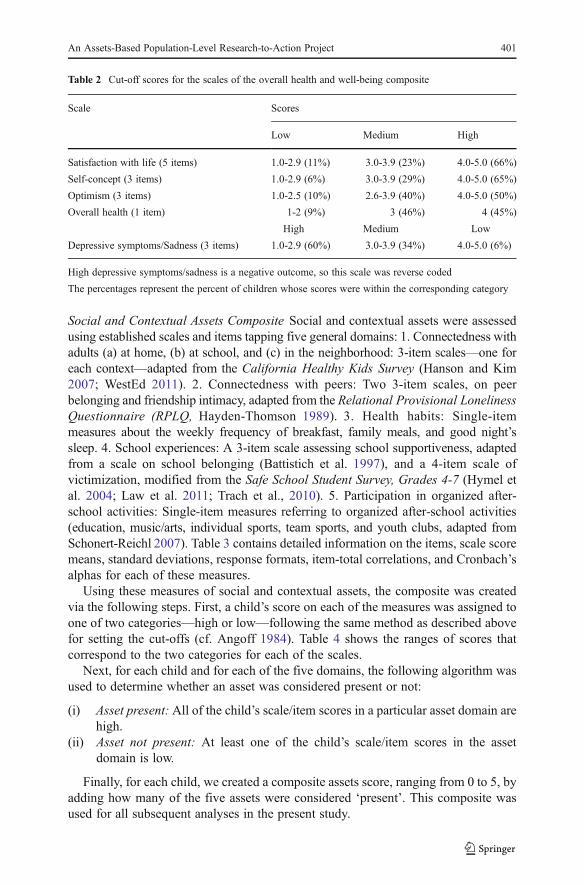
Social and Contextual Assets Composite Social and contextual assets were assessedusing established scales and items tapping five general domains: 1. Connectedness withadults (a) at home, (b) at school, and (c) in the neighborhood: 3-item scales—one foreach context—adapted from the California Healthy Kids Survey (Hanson and Kim2007; WestEd 2011). 2. Connectedness with peers: Two 3-item scales, on peerbelonging and friendship intimacy, adapted from the Relational Provisional LonelinessQuestionnaire (RPLQ, Hayden-Thomson 1989). 3. Health habits: Single-itemmeasures about the weekly frequency of breakfast, family meals, and good night’ssleep. 4. School experiences: A 3-item scale assessing school supportiveness, adaptedfrom a scale on school belonging (Battistich et al. 1997), and a 4-item scale ofvictimization, modified from the Safe School Student Survey, Grades 4-7 (Hymel etal. 2004; Law et al. 2011; Trach et al., 2010). 5. Participation in organized after-school activities: Single-item measures referring to organized after-school activities(education, music/arts, individual sports, team sports, and youth clubs, adapted fromSchonert-Reichl 2007). Table 3 contains detailed information on the items, scale scoremeans, standard deviations, response formats, item-total correlations, and Cronbach’salphas for each of these measures.
Using these measures of social and contextual assets, the composite was createdvia the following steps. First, a child’s score on each of the measures was assigned toone of two categories—high or low—following the same method as described abovefor setting the cut-offs (cf. Angoff 1984). Table 4 shows the ranges of scores thatcorrespond to the two categories for each of the scales.
Next, for each child and for each of the five domains, the following algorithm wasused to determine whether an asset was considered present or not:
(i) Asset present: All of the child’s scale/item scores in a particular asset domain arehigh.
(ii) Asset not present: At least one of the child’s scale/item scores in the assetdomain is low.
Finally, for each child, we created a composite assets score, ranging from 0 to 5, byadding how many of the five assets were considered ‘present’. This composite wasused for all subsequent analyses in the present study.
Table 2 Cut-off scores for the scales of the overall health and well-being composite
Scale Scores
Low Medium High
Satisfaction with life (5 items) 1.0-2.9 (11%) 3.0-3.9 (23%) 4.0-5.0 (66%)
Self-concept (3 items) 1.0-2.9 (6%) 3.0-3.9 (29%) 4.0-5.0 (65%)
Optimism (3 items) 1.0-2.5 (10%) 2.6-3.9 (40%) 4.0-5.0 (50%)
Overall health (1 item) 1-2 (9%) 3 (46%) 4 (45%)
High Medium Low
Depressive symptoms/Sadness (3 items) 1.0-2.9 (60%) 3.0-3.9 (34%) 4.0-5.0 (6%)
High depressive symptoms/sadness is a negative outcome, so this scale was reverse coded
The percentages represent the percent of children whose scores were within the corresponding category
An Assets-Based Population-Level Research-to-Action Project 401
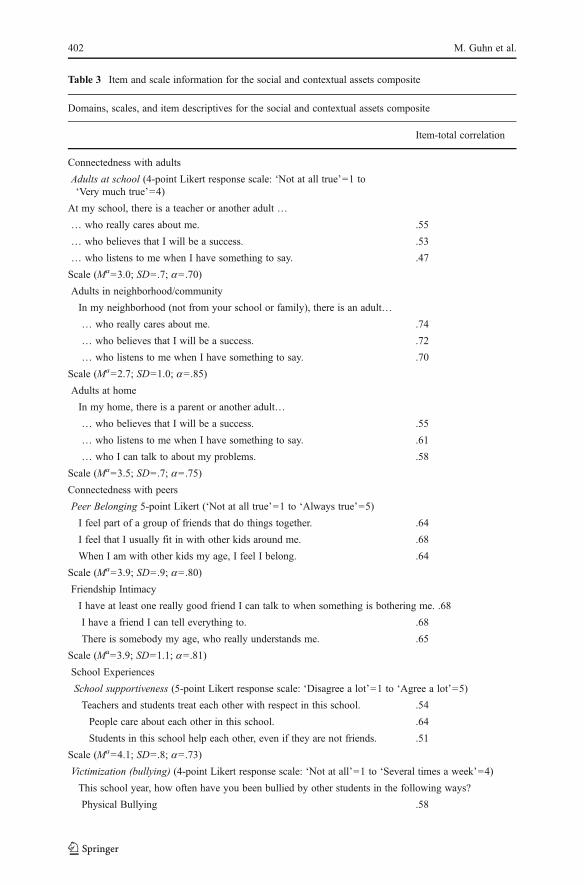
Table 3 Item and scale information for the social and contextual assets composite
Domains, scales, and item descriptives for the social and contextual assets composite
Item-total correlation
Connectedness with adults
Adults at school (4-point Likert response scale: ‘Not at all true’01 to‘Very much true’04)
At my school, there is a teacher or another adult …
… who really cares about me. .55
… who believes that I will be a success. .53
… who listens to me when I have something to say. .47
Scale (Ma03.0; SD0 .7; a0 .70)
Adults in neighborhood/community
In my neighborhood (not from your school or family), there is an adult…
… who really cares about me. .74
… who believes that I will be a success. .72
… who listens to me when I have something to say. .70
Scale (Ma02.7; SD01.0; a0 .85)
Adults at home
In my home, there is a parent or another adult…
… who believes that I will be a success. .55
… who listens to me when I have something to say. .61
… who I can talk to about my problems. .58
Scale (Ma03.5; SD0 .7; a0 .75)
Connectedness with peers
Peer Belonging 5-point Likert (‘Not at all true’01 to ‘Always true’05)
I feel part of a group of friends that do things together. .64
I feel that I usually fit in with other kids around me. .68
When I am with other kids my age, I feel I belong. .64
Scale (Ma03.9; SD0 .9; a0 .80)
Friendship Intimacy
I have at least one really good friend I can talk to when something is bothering me. .68
I have a friend I can tell everything to. .68
There is somebody my age, who really understands me. .65
Scale (Ma03.9; SD01.1; a0 .81)
School Experiences
School supportiveness (5-point Likert response scale: ‘Disagree a lot’01 to ‘Agree a lot’05)
Teachers and students treat each other with respect in this school. .54
People care about each other in this school. .64
Students in this school help each other, even if they are not friends. .51
Scale (Ma04.1; SD0 .8; a0 .73)
Victimization (bullying) (4-point Likert response scale: ‘Not at all’01 to ‘Several times a week’04)
This school year, how often have you been bullied by other students in the following ways?
Physical Bullying .58
402 M. Guhn et al.
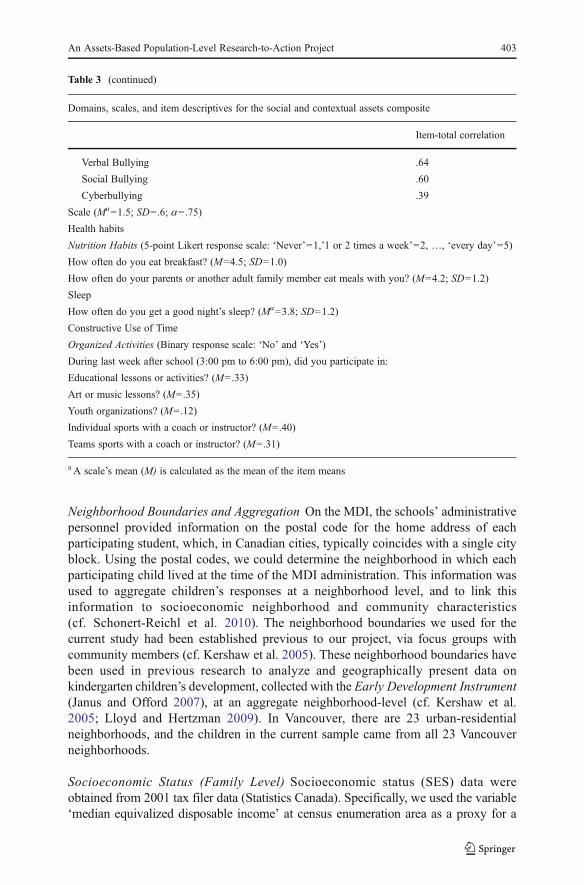
Neighborhood Boundaries and Aggregation On the MDI, the schools’ administrativepersonnel provided information on the postal code for the home address of eachparticipating student, which, in Canadian cities, typically coincides with a single cityblock. Using the postal codes, we could determine the neighborhood in which eachparticipating child lived at the time of the MDI administration. This information wasused to aggregate children’s responses at a neighborhood level, and to link thisinformation to socioeconomic neighborhood and community characteristics(cf. Schonert-Reichl et al. 2010). The neighborhood boundaries we used for thecurrent study had been established previous to our project, via focus groups withcommunity members (cf. Kershaw et al. 2005). These neighborhood boundaries havebeen used in previous research to analyze and geographically present data onkindergarten children’s development, collected with the Early Development Instrument(Janus and Offord 2007), at an aggregate neighborhood-level (cf. Kershaw et al.2005; Lloyd and Hertzman 2009). In Vancouver, there are 23 urban-residentialneighborhoods, and the children in the current sample came from all 23 Vancouverneighborhoods.
Socioeconomic Status (Family Level) Socioeconomic status (SES) data wereobtained from 2001 tax filer data (Statistics Canada). Specifically, we used the variable‘median equivalized disposable income’ at census enumeration area as a proxy for a
Table 3 (continued)
Domains, scales, and item descriptives for the social and contextual assets composite
Item-total correlation
Verbal Bullying .64
Social Bullying .60
Cyberbullying .39
Scale (Ma01.5; SD0 .6; a0 .75)
Health habits
Nutrition Habits (5-point Likert response scale: ‘Never’01,’1 or 2 times a week’02, …, ‘every day’05)
How often do you eat breakfast? (M04.5; SD01.0)
How often do your parents or another adult family member eat meals with you? (M04.2; SD01.2)
Sleep
How often do you get a good night’s sleep? (Ma03.8; SD01.2)
Constructive Use of Time
Organized Activities (Binary response scale: ‘No’ and ‘Yes’)
During last week after school (3:00 pm to 6:00 pm), did you participate in:
Educational lessons or activities? (M0 .33)
Art or music lessons? (M0 .35)
Youth organizations? (M0 .12)
Individual sports with a coach or instructor? (M0 .40)
Teams sports with a coach or instructor? (M0 .31)
a A scale’s mean (M) is calculated as the mean of the item means
An Assets-Based Population-Level Research-to-Action Project 403
child’s family’s SES background, assigned to each child according to its residentialpostal code. This income variable represents the disposable income per person within anenumeration area, equivalized according to family size and the age of family members.The variable is calculated from census family income information, but due to privacylaws, Statistics Canada provides the data at an aggregated enumeration area code level.In densely populated cities, such as Vancouver, an enumeration area typically spans 1-3street blocks, consists of about 200 to 300 census families, and coincides with the 6-digitpostal code area. Studies for the Canadian and US context have indicated that usingsmall-area aggregated census income data serve as reasonable proxy for individualfamily-level income in large-scale analyses (Krieger 1992; Mustard et al. 1999).Accordingly, previous Canadian research studies have employed the samemethodology(e.g., Guhn et al. 2010).
Socioeconomic Status (Neighborhood Level) We obtained Canadian census-basedSES composite scores for all neighborhoods in British Columbia. The SES compositescore represents a standardized continuous variable, which is composed of variablespertaining to neighborhoods’ average education levels, median income, occupationalstatus, female labor force participation, and unemployment rates (Human EarlyLearning Partnership 2009).
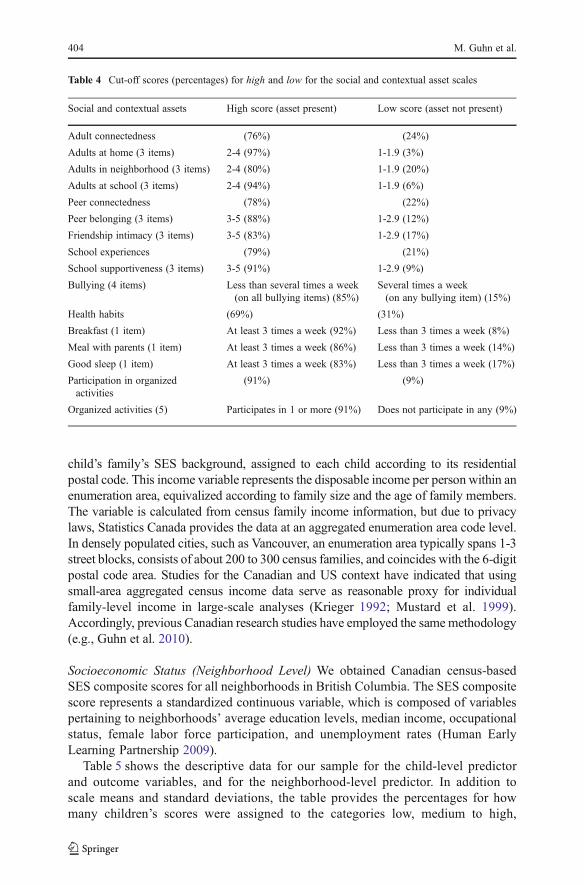
Table 5 shows the descriptive data for our sample for the child-level predictorand outcome variables, and for the neighborhood-level predictor. In addition toscale means and standard deviations, the table provides the percentages for howmany children’s scores were assigned to the categories low, medium to high,
Table 4 Cut-off scores (percentages) for high and low for the social and contextual asset scales
Social and contextual assets High score (asset present) Low score (asset not present)
Adult connectedness (76%) (24%)
Adults at home (3 items) 2-4 (97%) 1-1.9 (3%)
Adults in neighborhood (3 items) 2-4 (80%) 1-1.9 (20%)
Adults at school (3 items) 2-4 (94%) 1-1.9 (6%)
Peer connectedness (78%) (22%)
Peer belonging (3 items) 3-5 (88%) 1-2.9 (12%)
Friendship intimacy (3 items) 3-5 (83%) 1-2.9 (17%)
School experiences (79%) (21%)
School supportiveness (3 items) 3-5 (91%) 1-2.9 (9%)
Bullying (4 items) Less than several times a week(on all bullying items) (85%)
Several times a week(on any bullying item) (15%)
Health habits (69%) (31%)
Breakfast (1 item) At least 3 times a week (92%) Less than 3 times a week (8%)
Meal with parents (1 item) At least 3 times a week (86%) Less than 3 times a week (14%)
Good sleep (1 item) At least 3 times a week (83%) Less than 3 times a week (17%)
Participation in organizedactivities
(91%) (9%)
Organized activities (5) Participates in 1 or more (91%) Does not participate in any (9%)
404 M. Guhn et al.
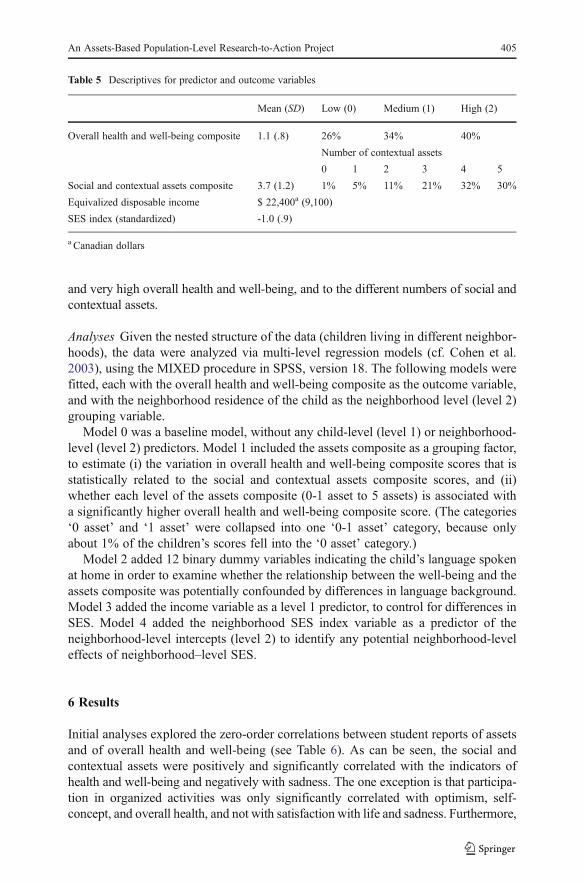
and very high overall health and well-being, and to the different numbers of social andcontextual assets.
Analyses Given the nested structure of the data (children living in different neighbor-hoods), the data were analyzed via multi-level regression models (cf. Cohen et al.2003), using the MIXED procedure in SPSS, version 18. The following models werefitted, each with the overall health and well-being composite as the outcome variable,and with the neighborhood residence of the child as the neighborhood level (level 2)grouping variable.
Model 0 was a baseline model, without any child-level (level 1) or neighborhood-level (level 2) predictors. Model 1 included the assets composite as a grouping factor,to estimate (i) the variation in overall health and well-being composite scores that isstatistically related to the social and contextual assets composite scores, and (ii)whether each level of the assets composite (0-1 asset to 5 assets) is associated witha significantly higher overall health and well-being composite score. (The categories‘0 asset’ and ‘1 asset’ were collapsed into one ‘0-1 asset’ category, because onlyabout 1% of the children’s scores fell into the ‘0 asset’ category.)
Model 2 added 12 binary dummy variables indicating the child’s language spokenat home in order to examine whether the relationship between the well-being and theassets composite was potentially confounded by differences in language background.Model 3 added the income variable as a level 1 predictor, to control for differences inSES. Model 4 added the neighborhood SES index variable as a predictor of theneighborhood-level intercepts (level 2) to identify any potential neighborhood-leveleffects of neighborhood–level SES.
6 Results
Initial analyses explored the zero-order correlations between student reports of assetsand of overall health and well-being (see Table 6). As can be seen, the social andcontextual assets were positively and significantly correlated with the indicators ofhealth and well-being and negatively with sadness. The one exception is that participa-tion in organized activities was only significantly correlated with optimism, self-concept, and overall health, and not with satisfaction with life and sadness. Furthermore,
Table 5 Descriptives for predictor and outcome variables
Mean (SD) Low (0) Medium (1) High (2)
Overall health and well-being composite 1.1 (.8) 26% 34% 40%
Number of contextual assets
0 1 2 3 4 5
Social and contextual assets composite 3.7 (1.2) 1% 5% 11% 21% 32% 30%
Equivalized disposable income $ 22,400a (9,100)
SES index (standardized) -1.0 (.9)
a Canadian dollars
An Assets-Based Population-Level Research-to-Action Project 405

the social and contextual assets were significantly correlated with one another, with theexception of the link between activity and school experiences assets. Finally, the fivescales referring to the overall health and well-being index were significantly correlatedwith one another.
In the paragraphs that follow, we present (i) Pearson and polychoric/polyserialzero-order correlations between our models’ variables (Table 7), (ii) findings from themulti-level models (Table 8), and (iii) our data dissemination tools (a graph and twogeographical maps; Figs. 1, 2 and 3) that illustrate the relationships between theoverall health and well-being composite, the social and contextual assets, and SES.
Empirical Findings Table 7 shows that the social and contextual assets compositescores were significantly correlated with the overall health and well-being compositescores. The correlations of the income variable with the well-being and the assetscomposites were also significant, but considerably smaller. We report both thePearson and the polychoric correlation, because both variables are ordinal. Likewise,
Table 6 Correlations between the five health and well-being scales (mean scores) and the five social andcontextual assets (binary scores)
1 2 3 4 5 I II III IV V
Overall health & well-being scales (1-5)
Satisfaction with life
Self-concept .64**
Optimism .55** .58**
Overall health .35** .37** .32**
Sadness -.42** -.40** -.36** -.27**
Social and contextual assets (I-V)
Adult connectedness .23** .26** .24** .17** -.14**
Peer connectedness .32** .31** .30** .18** -.21** .24**
Health habits .25** .25** .23** .14** -.23** .16** .19**
School experiences .22** .18** .18** .10** -.23** .16** .21** .18**
Organized activities .03 .06** .08** .08** -.04 .13** .08** .09** .00
Table 7 Correlations between overall health and well-being, social and contextual assets, and income
Polyserial/polychoriccorrelations Pearsoncorrelations
Overall health andwell-being composite
Social and contextualassets composite
Equivalizeddisposable income
Overall health and well-beingcomposite
rPolychoric0 .47 (p<.001) rPolyserial0 .17 (p<.001)
Social and contextual assetscomposite
rPearson0 .41 (p<.001) rPolyserial0 .16 (p<.001)
Equivalized disposable income rPearson0 .15 (p<.001) rPearson0 .16 (p<.001)
406 M. Guhn et al.
we report both the Pearson correlations and the polyserial correlations between theincome variable and the two composite variables.
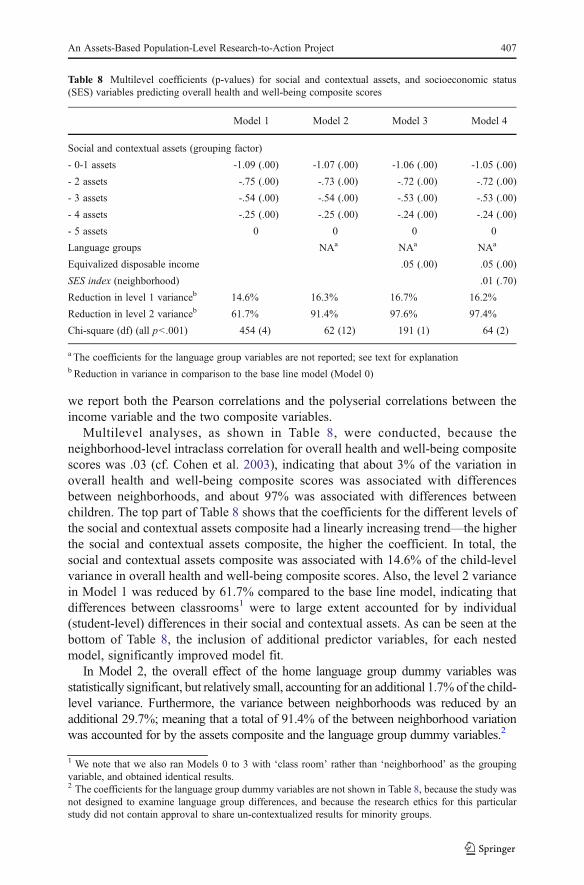
Multilevel analyses, as shown in Table 8, were conducted, because theneighborhood-level intraclass correlation for overall health and well-being compositescores was .03 (cf. Cohen et al. 2003), indicating that about 3% of the variation inoverall health and well-being composite scores was associated with differencesbetween neighborhoods, and about 97% was associated with differences betweenchildren. The top part of Table 8 shows that the coefficients for the different levels ofthe social and contextual assets composite had a linearly increasing trend—the higherthe social and contextual assets composite, the higher the coefficient. In total, thesocial and contextual assets composite was associated with 14.6% of the child-levelvariance in overall health and well-being composite scores. Also, the level 2 variancein Model 1 was reduced by 61.7% compared to the base line model, indicating thatdifferences between classrooms1 were to large extent accounted for by individual(student-level) differences in their social and contextual assets. As can be seen at thebottom of Table 8, the inclusion of additional predictor variables, for each nestedmodel, significantly improved model fit.
In Model 2, the overall effect of the home language group dummy variables wasstatistically significant, but relatively small, accounting for an additional 1.7% of the child-level variance. Furthermore, the variance between neighborhoods was reduced by anadditional 29.7%; meaning that a total of 91.4% of the between neighborhood variationwas accounted for by the assets composite and the language group dummy variables.2
1 We note that we also ran Models 0 to 3 with ‘class room’ rather than ‘neighborhood’ as the groupingvariable, and obtained identical results.
Table 8 Multilevel coefficients (p-values) for social and contextual assets, and socioeconomic status(SES) variables predicting overall health and well-being composite scores
Model 1 Model 2 Model 3 Model 4
Social and contextual assets (grouping factor)
- 0-1 assets -1.09 (.00) -1.07 (.00) -1.06 (.00) -1.05 (.00)
- 2 assets -.75 (.00) -.73 (.00) -.72 (.00) -.72 (.00)
- 3 assets -.54 (.00) -.54 (.00) -.53 (.00) -.53 (.00)
- 4 assets -.25 (.00) -.25 (.00) -.24 (.00) -.24 (.00)
- 5 assets 0 0 0 0
Language groups NAa NAa NAa
Equivalized disposable income .05 (.00) .05 (.00)
SES index (neighborhood) .01 (.70)
Reduction in level 1 varianceb 14.6% 16.3% 16.7% 16.2%
Reduction in level 2 varianceb 61.7% 91.4% 97.6% 97.4%
Chi-square (df) (all p<.001) 454 (4) 62 (12) 191 (1) 64 (2)
a The coefficients for the language group variables are not reported; see text for explanationb Reduction in variance in comparison to the base line model (Model 0)
2 The coefficients for the language group dummy variables are not shown in Table 8, because the study wasnot designed to examine language group differences, and because the research ethics for this particularstudy did not contain approval to share un-contextualized results for minority groups.
An Assets-Based Population-Level Research-to-Action Project 407
In Model 3, the family level income variable was associated with an additional,statistically significant reduction of .4% in level 1 variance, and an additionalreduction of 6.2% in level 2 variance.
Model 4 did not statistically converge,3 so the results need to be interpreted withcaution. The results suggest that there are no neighborhood SES effects independentof other variables, as the coefficient for the neighborhood-level SES index variablewas not significant, and its inclusion did not reduce the level 2 variance—whichalready was, as Models 1 to 3 showed, almost entirely (97.6%) accounted for by thethree child-level predictors (i.e., the social and contextual assets composite scores, thehome language background dummy variables, and family income).
We emphasize that, in Models 1 through 4, the coefficients for the factor levels of thecontextual assets composite all remained statistically significant and of almost identicalsize. In other words, the inclusion of the covariates (language groups, income, neigh-borhood SES) was associated with a relatively small improvement in model fit, and anadditional reduction of variance, but the relationship between the social and contextualassets composite and the overall health and well-being composite remained virtuallyunchanged by the inclusion of the covariates.
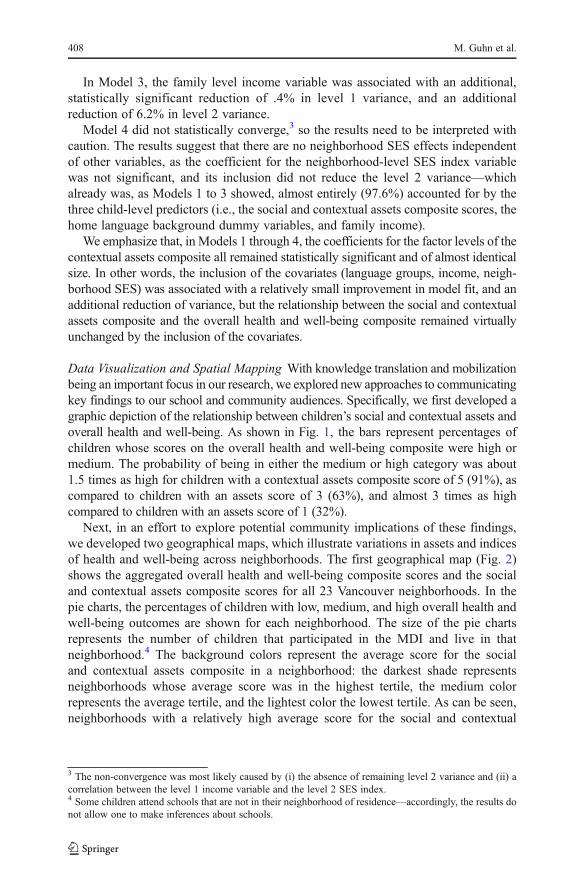
Data Visualization and Spatial Mapping With knowledge translation and mobilizationbeing an important focus in our research, we explored new approaches to communicatingkey findings to our school and community audiences. Specifically, we first developed agraphic depiction of the relationship between children’s social and contextual assets andoverall health and well-being. As shown in Fig. 1, the bars represent percentages ofchildren whose scores on the overall health and well-being composite were high ormedium. The probability of being in either the medium or high category was about1.5 times as high for children with a contextual assets composite score of 5 (91%), ascompared to children with an assets score of 3 (63%), and almost 3 times as highcompared to children with an assets score of 1 (32%).
Next, in an effort to explore potential community implications of these findings,we developed two geographical maps, which illustrate variations in assets and indicesof health and well-being across neighborhoods. The first geographical map (Fig. 2)shows the aggregated overall health and well-being composite scores and the socialand contextual assets composite scores for all 23 Vancouver neighborhoods. In thepie charts, the percentages of children with low, medium, and high overall health andwell-being outcomes are shown for each neighborhood. The size of the pie chartsrepresents the number of children that participated in the MDI and live in thatneighborhood.4 The background colors represent the average score for the socialand contextual assets composite in a neighborhood: the darkest shade representsneighborhoods whose average score was in the highest tertile, the medium colorrepresents the average tertile, and the lightest color the lowest tertile. As can be seen,neighborhoods with a relatively high average score for the social and contextual
3 The non-convergence was most likely caused by (i) the absence of remaining level 2 variance and (ii) acorrelation between the level 1 income variable and the level 2 SES index.4 Some children attend schools that are not in their neighborhood of residence—accordingly, the results donot allow one to make inferences about schools.
408 M. Guhn et al.
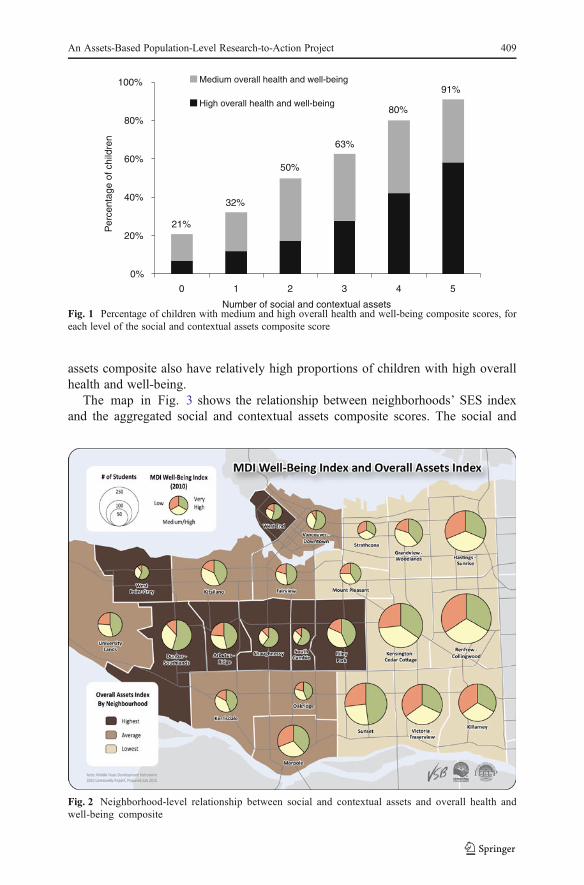
assets composite also have relatively high proportions of children with high overallhealth and well-being.
The map in Fig. 3 shows the relationship between neighborhoods’ SES indexand the aggregated social and contextual assets composite scores. The social and
Fig. 2 Neighborhood-level relationship between social and contextual assets and overall health andwell-being composite
21%
32%
50%
63%
80%
91%
0%
20%
40%
60%
80%
100%
0 1 2 3 4 5
Number of social and contextual assets
Per
cent
age
of c
hild
ren
Medium overall health and well-being
High overall health and well-being
Fig. 1 Percentage of children with medium and high overall health and well-being composite scores, foreach level of the social and contextual assets composite score
An Assets-Based Population-Level Research-to-Action Project 409
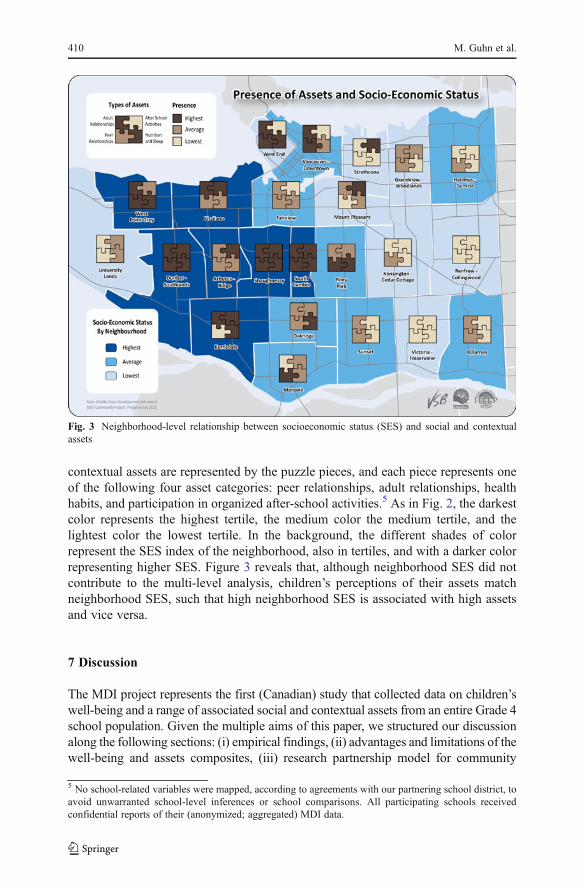
contextual assets are represented by the puzzle pieces, and each piece represents oneof the following four asset categories: peer relationships, adult relationships, healthhabits, and participation in organized after-school activities.5 As in Fig. 2, the darkestcolor represents the highest tertile, the medium color the medium tertile, and thelightest color the lowest tertile. In the background, the different shades of colorrepresent the SES index of the neighborhood, also in tertiles, and with a darker colorrepresenting higher SES. Figure 3 reveals that, although neighborhood SES did notcontribute to the multi-level analysis, children’s perceptions of their assets matchneighborhood SES, such that high neighborhood SES is associated with high assetsand vice versa.
7 Discussion
The MDI project represents the first (Canadian) study that collected data on children’swell-being and a range of associated social and contextual assets from an entire Grade 4school population. Given the multiple aims of this paper, we structured our discussionalong the following sections: (i) empirical findings, (ii) advantages and limitations of thewell-being and assets composites, (iii) research partnership model for community
Fig. 3 Neighborhood-level relationship between socioeconomic status (SES) and social and contextualassets
5 No school-related variables were mapped, according to agreements with our partnering school district, toavoid unwarranted school-level inferences or school comparisons. All participating schools receivedconfidential reports of their (anonymized; aggregated) MDI data.
410 M. Guhn et al.
learning, (iv) strengths and limitations of the study; (v) implications for knowledgetranslation research on children’s well-being.
Empirical Findings Previous research has shown that social and contextual assets arepositively correlated with children’s well-being (Scales et al. 2006; Theokas et al.2005), and our study replicates this general finding. What is noteworthy is the linear,additive relationship between the assets and well-being composites. At each level ofassets, an additional asset was associated with a significantly higher proportion ofmedium to very high well-being scores. This finding is congruent with an ecologicalsystems view on development, suggesting that a combination of social and contextualassets, across different ecological systems, is necessary for children to thrive inmultiple domains of well-being (Bronfenbrenner 2005; Theokas and Lerner 2006).
The statistical association between the social and contextual assets and the overallhealth and well-being composites remained almost identical when we controlled fordifferences in children’s socioeconomic background, and for differences in children’sethno-cultural background. Thus, the relationship between the assets and the well-beingcomposite was not confounded by differences in SES, or by factors associated withchildren’s ethno-cultural background.
The size of the association between the assets and the well-being composite—the 16% reduction in variance is equivalent to a medium to large effect size (cf.Cohen 1992)—supports the hypothesis that the social and contextual assets surveyedwith the MDI are, in the eyes of children, critically important factors in regard to theirself-perceived well-being.
Composites for Well-being and Assets We developed composite indices of children’soverall mental and physical health and well-being and for their social and contextualassets. This approach follows other indicator work in the areas of health and educa-tion, in which it is common to transform multiple items and/or scales into binary orordinal indicator variables (e.g., ‘at risk’ versus ‘not at risk’; ‘exceeding’, ‘meeting’,or ‘not meeting expectations’). The advantage is that such composites are practical insummarizing and communicating information (e.g., “Sixty-five percent of our chil-dren are thriving.”). The trade-off is that composites mask variation on the multiplescales that comprise the composite. In our case, the composites mask that well-beingand assets are multi-dimensional constructs. Accordingly, in our school and commu-nity reports, we used the composites to introduce overall findings, but then unpackedthose composites by providing detailed results on the individual well-being andhealth domains and on each social and contextual asset domain. (The MDI districtand community reports are available online at http://earlylearning.ubc.ca/mdi/).
Our approach was informed by the US-based Search Institute’s research ondevelopmental assets and youth well-being. Theokas et al. (2005) developed an indexof thriving and indices for individual assets and ecological assets. Despite somesimilarities, there are, however, also some noteworthy differences. First, our overallhealth and well-being composite included the domains of satisfaction with life,optimism, overall health, self-efficacy, and depressive symptoms, whereas the thrivingindex developed by Theokas and her colleagues contained the domains of succeeding inschool, valuing diversity, leadership, gratification delay, resiliency (i.e., overcomingadversity), physical health, and helping behavior. Second, our assets composite included
An Assets-Based Population-Level Research-to-Action Project 411
adult connectedness, peer connectedness, health habits, positive school experiences, andparticipation in organized after-school activities, whereas Theokas et al. differentiatedbetween individual assets (social conscience, personal and interpersonal values, rulesand boundaries, risk avoidance, school engagement, activity participation) and ecolog-ical assets (connection to family, community connection, school connection, contextualsafety, adult mentors, parent involvement). Despite these differences, both studiesdocumented clear links between social and contextual assets and overall indices ofwell-being.
Our operationalization of overall health and well-being is closely alignedwith the psychological literature on life satisfaction and happiness (e.g., Casas2010; Diener et al. 1985; Headey et al. 1993). In contrast, the operationalization byTheokas et al. includes characteristics that represent societally valued behaviors (suchas leadership, helping behavior, and success in school) that are commonly stated asoutcome goals in schools’ educational mission statements. Such difference in thedefinition of well-being may raise some teleological questions with respect to societalgoals for the development of children; but more important than any differences indefinition is, in our opinion, the common purpose that underlies the general approach;namely, to use children’s voices to inform initiatives that foster their own well-being(cf. Casas 2010).
A Research Partnership Model for Community Learning We believe that the MDIstudy represents a promising blueprint for effective knowledge transfer and knowl-edge mobilization research and for community learning, owing in large part to itsunique combination of integrated components. First, the study grew out of a multi-year collaboration between a university, a school district, and a community organi-zation, which aimed to ensure that the MDI data were both scientifically rigorous andof immediate relevance for educational practice and policy decisions. The MDI datawere reported back to schools and communities within 3 to 6 months of datacollection, so that the data could be used immediately by schools and communityorganizations to inform their curriculum and program planning. Currently, Vancou-ver’s Community School Teams—ministry-funded teams of teachers, family andyouth workers, program planners, and social workers that plan and conduct after-school programs—use MDI data to inform after-school program planning. Aswell, a newly-formed MDI teacher inquiry group is exploring possibilities forhow to use MDI data to enhance the school district’s social responsibility6
initiatives, and some schools use MDI data as starting points for discussions aboutcurriculum planning.
Second, we collected data from the entire district’s Grade 4 student population,allowing schools to interpret their students’ MDI data in reference to a representativedistrict average. To date, such population-level data collection initiatives on children’swell-being are scarce, but there have been increasing demands by the public to developchild indicator systems that allow one to compare data on a given subpopulation ofchildren in regard to representative norms (Casas 2010). The MDI presents aneconomical, feasible blueprint for how such a child well-being indicator system canbe implemented.
6 See www.bced.gov.bc.ca/perf_stands/social_resp.htm.
412 M. Guhn et al.
Third, to our knowledge, the well-being maps for an entire city’s 10-year-oldschool population are a ‘first’ in the literature. Using geo-spatial mapping tools tocommunicate research findings is common in epidemiology and human geography,but relatively novel with regard to children’s development, and unprecedented forwell-being and associated social and contextual assets at this young age. Importantly,the maps allow observers to directly relate findings to their own communities. In thiscase, the maps show the degree to which children’s perceptions of their assets can beconstrued as a local community issue, given the variation seen across neighborhoods.This has the capacity to guide those working with children in a given neighborhood,as to areas of potential strengths or needs.
Fourth, we have been developing a “tool kit” in close collaboration with schooldistrict staff and community organizations. The tool kit will provide educators andpractitioners with resources (e.g., links to local contact information, program websites,literature, planning tools) that are designed to facilitate planning and implementation ofevidence-based processes and practices that foster children’s well-being. Given that wehave embraced a collaborative approach towards community building, none of theMDI-related materials and resources are prescriptive with regard to policies or practices;rather, the tools are evolving out of the ongoing partnership between researchers,community organization and school district staff, and educators and practitioners. Theprimary purpose of theMDI project and the corresponding “tool kit” is not to implement(or even prescribe) specific policies or programs, but to engage schools and communi-ties in an ongoing discussion and process dedicated to optimizing children’s well-beingand health in a culturally and locally appropriate way. For some examples of thematerials that we provide to our partner school districts and communities, please seehttp://earlylearning.ubc.ca/mdi/.
What remains to be studied is to what extent our knowledge dissemination effortswill impact actual practices, programs, and policies for children and, in turn, to whatextent those practices, programs, and policies foster children’s well-being. Currently,we are developing means to systematically monitor and evaluate practices, programs,and policies that are being implemented as a consequence of the MDI project.
Strengths and Limitations Questions about the reliability and validity of youngchildren’s self-reports are common. Therefore, the MDI implementation has beenconducted after numerous validation studies on the MDI. A think-aloud protocolstudy with Grade 4-7 students in schools in British Columbia showed that children atthat age were reliable and valid informants about their well-being and the factors thatare related to their well-being (Gadermann et al. 2011). Furthermore, our pilot studiesand current MDI data indicate good reliabilities (i.e., Cronbach’s alphas) of the MDIscales.
Ideally, children’s self-reports of their well-being and social and contextualassets are complemented by information from other informants. For example,teachers could also evaluate school climate; adult community members could ratetheir connectedness to young children in their neighborhoods; and youth organ-izations could provide details on the nature of their after-school activities.Practitioners could thus determine the extent to which adults’ perceptions andgoals are compatible with the perceptions and wishes of their children/students. Mutualawareness and understanding are critical for families, schools, and communities to
An Assets-Based Population-Level Research-to-Action Project 413
engage in the planning and the implementation of meaningful, relationship-buildingactivities and programs for their children.
An analytical limitation of our study was that our neighborhood-level SES variableincluded income, education, employment data, etc., whereas we only had access to ablock-level census data income variable as the proxy for child-level SES. Althoughblock-level income variables have been used for similar analyses in previous studiesin Canada and the US, and have been found to provide valid results for population-levelsamples, it must be kept in mind that the empirical coefficients may slightly over- orunderestimate the relationship that would have been found with actual individual familylevel data (Krieger 1992; Mustard et al. 1999). In addition, income represents just oneof several variables that are commonly used to operationalize SES. Ideally, informa-tion on the educational background, employment structure, and social status of thechildren’s families would also be considered.
Given the cross-sectional design of the MDI study, we cannot make causal claimsabout the association between the social and contextual assets and the overall health andwell-being composite. According to the literature, however, the interpretation thatpositive social relationships, supportive school experiences, health habits, and partici-pation in after-school activities foster children’s well-being is well supported (Luthar2006; Masten, and Coatsworth 1998). This being said, it is important to realize that aperson’s developmental outcome at one point in time is the developmental resourcethat predicts later developmental outcomes. Depending the age period studied, agiven developmental characteristic might be considered an outcome or effect at onetime, and a predictor or cause at another time. For example, a child’s well-beingtoday may be the developmental outcome of previous experiences, or it may functionas a personal asset for the child’s further development.
Implications and Future Directions Our data suggest that most children in our sampleexperience high or very high overall health and well-being and report four or five ofthe five measured social and contextual assets. Yet, one in four children reportrelatively low overall health and well-being, and relatively low social and contextualassets. The implication for families, schools, and communities is to engage indiscussions and actions that result in opportunities for all children to access, experi-ence, and nurture the full range of these assets. In particular, families, schools, andcommunities face the challenge of how to consistently provide all their children withthe time and the opportunities to engage in activities that allow them to (i) developpersonal relationships with adults and peers over an extended period of time, (ii)establish healthy nutrition and sleep habits, and (iii) experience supportive home,school, and neighborhood environments. Research shows that local solutions to thesechallenges do not need to look alike in different contexts (cf. Durlak and DuPre 2008;Durlak et al. 2007; Noblit et al. 2001; Rogers 1995; Zins et al. 2000a, 2000b).However, the applied research literature recommends that local solutions are (i)process-oriented, collaborative, and community-based, (ii) culturally inclusive, andcognizant of differences in values and customs, (ii) based on mutual and informed,evidence-based decision making, (iii) build on local strength and focus on localneeds, and (iv) be supported and facilitated by local administrators, policy makers,and infrastructures. These principles can also inform ongoing validation research on theMDI project. With plans for the MDI to be implemented in school districts throughout
414 M. Guhn et al.
British Columbia, it becomes critical to conduct ongoing validation and evaluationresearch to examine whether any consequences growing out of the MDI project are inline with its purpose; namely, to create environments in which children experience anddevelop the social and contextual assets they need for their overall health and well-being(Guhn et al. 2011).
References
Angoff, W. H. (1984). Scales, norms, and equivalent scores. Princeton: Educational Testing Service.Bastian, H. G. (2000).Musik(erziehung) und ihre Wirkung. Eine Langzeitstudie an Berliner Grundschulen.
Mainz: Schott Musik International.Battistich, V., Solomon, D., Watson, S., & Schaps, E. (1997). Caring school communities. Educational
Psychologist, 32, 137–151.Ben-Arieh, A. (in press). How dowemeasure andmonitor the “state of our children”? Revisiting the topic in honor
of Sheila B. Kamerman. Children and Youth Services Review. doi:10.1016/j.childyouth.2011.10.008.Ben-Arieh, A., & Frønes, I. (2011). Taxonomy for child well-being indicators: a framework for the analysis
of the well-being of children. Childhood, 460–476, 18. doi:10.1177/0907568211398159.Benson, P. L. (2003). Developmental assets and asset building communities: Conceptual and empirical
foundations. In R. M. Lerner & P. L. Benson (Eds.), Developmental assets and asset-buildingcommunities: Implications for research, policy, and practice (pp. 19–43). Norwell: Kluwer.
Benson, P. L., & Scales, P. C. (2009). The definition and preliminary measurement of thriving inadolescence. Journal of Positive Psychology, 4, 85–104. doi:10.1080/17439760802399240.
Bronfenbrenner, U. (Ed.). (2005). Making human beings human. Bioecological perspectives on humandevelopment. Thousand Oaks: Sage.
Brown, J. D., & Siegel, J. M. (1988). Exercise as a buffer of life stress: a prospective study of adolescenthealth. Health Psychology, 7, 341–353.
Casas, F. (2010). Subjective social indictors and child and adolescent well-being. Child IndicatorsResearch, online first. doi:10.1007/s12187-010-9093-z.
Casas, F., Castellá Sarriera, J. Abs, D., Coenders, G., Alfaro, J., Saforcada, E., & Tonon, G. (2011).Subjective indicators of personal well-being among adolescents. Performance and results for differentscales in Latin-language speaking countries: A contribution to the international debate. Child IndicatorsResearch, online first. doi:10.1007/s12187-011-9119-1.
Chicago Public Schools (2007). Student connection survey. Retrieved from http://www.air.org/files/CFL_Sample_Score_Report_1690_northside_learning_center_high.pdf
Cohen, J. (1992). A power primer. Psychological Bulletin, 112, 155–159.Cohen, J., Cohen, P., West, S. G., & Aiken, L. S. (2003). Applied multiple regression/correlation analysis
for the behavioral sciences (3rd ed.). Mahwah: Lawrence Erlbaum Associates.Collins, W. A. (Ed.). (1984). Development during middle childhood: The years from six to twelve.
Washington: National Academy Press.Connell, C. L., Lofton, K. L., Yadrick, K., & Rehner, T. A. (2005). Children’s experiences of food
insecurity can assist in understanding its effect on their well-being. Journal of Nutrition, 135, 1683–1690.
Cook, T. D., Murphy, R. F., & Hunt, H. D. (2000). Comer’s school development program in Chicago: atheory-based evaluation. American Educational Research Journal, 37, 535–597.
Costello, E. J., Mustillo, S., Erkanli, A., Keeler, G., & Angold, A. (2003). Prevalence anddevelopment of psychiatric disorders in childhood and adolescence. Archives of General Psychiatry,60, 837–844.
Diener, E. (1984). Subjective well-being. Psychological Bulletin, 95, 542–575.Diener, E., Emmons, R. A., Larsen, R. J., & Griffin, S. (1985). The satisfaction with life scale. Journal of
Personality Assessment, 49, 71–75.Donaldson, S. J., & Ronan, K. R. (2006). The effects of sports participation on young adolescents’
emotional well-being. Adolescence, 41, 369–389.Durlak, J. A., & Dupre, E. P. (2008). Implementation matters: a review of research on the influence of
implementation on program outcomes and the factors affecting implementation. American Journal ofCommunity Psychology, 41, 327–350.
An Assets-Based Population-Level Research-to-Action Project 415
Durlak, J. A., Taylor, R. D., Kawashima, K., Pachan, M. K., DuPre, E. P., Celio, C. I., et al. (2007). Effectsof positive youth development programs on school, family, and community systems. American Journalof Community Psychology, 39, 269–286. doi:10.1007/s10464-007-9112-5.
Durlak, J. A., Weissberg, R. P., & Pachan, M. (2010). A meta-analysis of after-school programs that seek topromote personal and social skills in children and adolescents. American Journal of CommunityPsychology, 45, 294–309.
Durlak, J. A., Weissberg, R. P., Dymnicki, A. B., Taylor, R. D., & Schellinger, K. B. (2011). The impact ofenhancing students’ social and emotional learning: a meta-analysis of school-based universal inter-ventions. Child Development, 82, 405–432. doi:10.1111/j.1467-8624.2010.01564.x.
Eccles, J. S. (1999). The development of children ages 6 to 14. Future of Children, 9, 30–44.Eisenberg, M. E., Olson, R. E., Neumark-Sztainer, D., Story, M., & Bearinger, L. H. (2004). Correlations
between family meals and psychosocial well-being among adolescents. Archives of Pediatric andAdolescent Medicine, 158, 792–6.
Gadermann, A. M., Schonert-Reichl, K. A., & Zumbo, B. D. (2010). Investigating validity evidence of thesatisfaction with life scale adapted for children. Social Indicators Research, 96, 229–247.
Gadermann, A. M., Guhn, M., & Zumbo, B. D. (2011). Investigating the substantive aspect of constructvalidity for the satisfaction with life scale adapted for children: a focus on cognitive processes. SocialIndicators Research, 100, 37–60. doi:10.1007/s11205-010-9603-x.
Greenberg, M. T., Weissberg, R. P., O’Brien, M. U., Zins, J. E., Fredericks, L., Resnik, H., & Elias, M. J.(2003). Enhancing school-based prevention and youth development through coordinated social,emotional, and academic learning. American Psychologist, 58, 466–474.
Greenberg, M. T., Feinberg, M. E., Meyer-Chilenski, S., Spoth, R. L., & Redmond, C. (2007). Communityand team member factors that influence the early phases of local team partnerships in prevention: thePROSPER project. Journal of Primary Prevention, 28, 485–504.
Guhn, M., Gadermann, A. M., Hertzman, C., & Zumbo, B. D. (2010). Children’s development inkindergarten: a multilevel, population-based analysis of ESL and gender effects on socioeconomicgradients. Child Indicators Research, 3, 183–203. doi:10.1007/s12187-009-9053-7.
Guhn, M., Zumbo, B. D., Janus, M., & Hertzman, C. (Eds.) (2011). Validation theory and research for apopulation-level measure of children’s development, wellbeing, and school readiness [Specialissue]. Social Indicators Research: An International Interdisciplinary Journal for Quality of LifeMeasurement, 103(2).
Hanson, T. L., & Kim, J-O. (2007). Measuring resilience and youth development: The psychometricproperties of the healthy kids survey. (Report No. 2007-034). Washington, DC: U.S. Department ofEducation. Retrieved from http://chks.wested.org/resources/REL_RYDM2007034.pdf.
Hayden-Thomson, L. K. (1989). Children’s loneliness. Unpublished doctoral dissertation, University ofWaterloo, Waterloo, Ontario, Canada.
Headey, B., Kelley, J., & Wearing, A. (1993). Dimensions of mental health: life satisfaction, positive affect,anxiety and depression. Social Indicators Research, 29, 63–82. doi:10.1007/BF01136197.
Heymann, J., Hertzman, C., Barer, M. L., & Evans, R. G. (Eds.). (2006). Healthier societies: From analysisto action. New York: Oxford University Press.
Human Early Learning Partnership (2009). SES Mapping Package. School District 39: Vancouver. Retrievedfrom http://www.earlylearning.ubc.ca/wp-uploads/2010/03/SD39_Van_SES_T1T21.pdf.
Huston, A. C., & Ripke, M. N. (2006). Middle childhood: Contexts of development. In A. C. Huston & M.N. Ripke (Eds.), Developmental contexts in middle childhood: Bridges to adolescence and adulthood(pp. 1–22). New York: Cambridge University Press.
Hymel, S., White, A., & Ishiyama, I. (2004) Safe School Student Survey. West Vancouver School District.Janus, M., & Offord, D. (2007). Development and psychometric properties of the Early Development
Instrument (EDI): a measure of children's school readiness. Canadian Journal of Behavioural Science,39, 1–22.
Keating, D. P., & Hertzman, C. (Eds.). (1999). Developmental health and wealth of nations. New York:Guilford.
Kershaw, P., Irwin, L., Trafford, K., & Hertzman, C. (2005). The British Columbia atlas of childdevelopment, 1st ed. (Vol. 40). Vancouver: Human Early Learning Partnership, Western GeographicalPress.
Kessler, R. C., Berglund, P., Demler, O., Jin, R., Merikangas, K. R., & Walters, E. E. (2005). Lifetimeprevalence and age-of-onset distributions of DSM-IV disorders in the national comorbidity surveyreplication. Archives of General Psychiatry, 62, 593–602.
Krieger, N. (1992). Overcoming the absence of socioeconomic data in medical records: validation andapplication of a census-based methodology. American Journal of Public Health, 82, 703–710.
416 M. Guhn et al.
Kusche, C. A., Greenberg, M. T., & Beilke, R. (1988). Seattle Personality Questionnaire for young school-aged children. Unpublished manuscript. University of Washington, Department of Psychology, Seattle.
Law, D. M., Shapka, J. D., Hymel, S., Olson, B. F., & Waterhouse, T. (2011). The changing face ofbullying: An empirical comparison between traditional and internet bullying and victimization.Computers in Human Behavior.
Lerner, R. M., Fisher, C. B., & Weinberg, R. A. (2000). Toward a science for and of the people: promotingcivil society through the application of developmental science. Child Development, 71, 11–20.
Lloyd, J. E. V., & Hertzman, C. (2009). From kindergarten readiness to fourth-grade assessment: longitudinalanalysis with linked population data. Social Science and Medicine, 68, 111–123.
Lucas, R. E., Diener, E., & Suh, E. (1996). Discriminant validity of well-being measures. Journal ofPersonality & Social Psychology, 71, 616–628.
Luthar, S. S. (2006). Resilience in development: A synthesis of research across five decades. In D. Cicchetti& D. J. Cohen (Eds.), Developmental Psychopathology: Risk, disorder, and adaptation (pp. 740–795).New York: Wiley.
Marsh, H.W. (1988). Self-Description Questionnaire: A theoretical and empirical basis for the measurementof multiple dimensions of preadolescent self-concept: A test manual and a research monograph. SanAntonio: The Psychological Corporation.
Masten, A. S., & Coatsworth, J. D. (1998). The development of competence in favorable andunfavorable environments: lessons from research on successful children. American Psychologist,53, 205–220.
Masten, A. S., & Motti-Stefanidi, F. (2009). Understanding and promoting resilience in children: Promotiveand protective processes in schools. In T. B. Gutkin & C. R. Reynolds (Eds.), The handbook of schoolpsychology (4th ed.). New York: Wiley.
McCreary Centre Society (2009). A picture of health: Highlights from the 2008 BC Adolescent HealthSurvey. Retrieved from http://www.mcs.bc.ca/pdf/AHSIV_APictureOfHealth.pdf.
Mustard, C., Derksen, S., Berthelot, J.-M., & Wolfson, M. (1999). Assessing ecological proxies forhousehold income: a comparison of household income and neighborhood level income measures inthe study of population health status. Health and Place, 5, 157–171.
Noam, G. G., & Goldstein, L. S. (1998). The Resilience Inventory. Unpublished Protocol.Noblit, G. W., Malloy, W. W., & Malloy, C. E. (Eds.). (2001). “The kids got smarter”: Case studies of
successful Comer schools. Cresskil: Hampton Press.Norris, R., Carroll, D., & Cochrane, R. (1992). The effects of physical activity and exercise training on
psychological stress and well-being in an adolescent population. Journal of Psychosomatic Research,36, 55–65. doi:10.1016/0022-3999(92)90114-H.
O’Hare, W. P. (2011). Development of the child indicator movement in the United States. Child DevelopmentPerspectives. doi:10.1111/j.1750-8606.2011.00214.x.
Oberle, E., Schonert-Reichl, K. A., & Thomson, K. (2010). Understanding the link between social andemotional well-being and peer relations in early adolescence: gender-specific predictors of peeracceptance. Journal of Youth and Adolescence, 39, 1330–1342. doi:10.1007/s10964-009-9486-9.
Oberle, E., Schonert-Reichl, K. A., & Zumbo, B. (2011). Life satisfaction in early adolescence: personal,neighborhood, school, family, and peer influences. Journal of Youth and Adolescence, 40, 889–901.doi:10.1007/s10964-010-9599-1.
Pavot, W., & Diener, E. (1993). Review of the satisfaction with life scale. Psychological Assessment, 5,164–172.
Posner, J. K., &Vandell, D. L. (1999). After-school activities and the development of low-income urban children:a longitudinal study. Developmental Psychology, 35, 868–879. doi:10.1037/0012-1649.35.3.868.
Rains, C. (2003). Seattle Personality Questionnaire—Original (Fast Track Project Technical Report).Retrieved October 2005 from http://www.fasttrackproject.org//techrept/s/spq/spq3tech.pdf.
Rogers, E. M. (1995). Diffusion of innovations (4th ed.). New York: The Free Press.Scales, P. C., Benson, P. L., & Mannes, M. (2006). The contribution to adolescent well-being made by
nonfamily adults: an examination of developmental assets as contexts and processes. Journal of Commu-nity Psychology, 34, 401–413.
Schonert-Reichl, K. A. (2007). Middle childhood inside and out: The psychological and social world ofchildren ages 9 to 12. Burnaby, BC: United Way of the Lower Mainland. Retrieved from http://www.uwlm.ca/sites/default/files/webfm/Why%20United%20Way/United%20Way%20Middle%20Childhood%20Inside%20and%20Out%20Report.pdf.
Schonert-Reichl, K. A., Guhn, M., Hymel, S., Hertzman, C., Sweiss, L., Gadermann, A., et al. (2010). Ourchildren’s voices: The Middle Years Development Instrument. Measuring the developmental health andwell-being of children in middle childhood. Vancouver: United Way.
An Assets-Based Population-Level Research-to-Action Project 417
Shonkoff, J. P., & Bales, S. N. (2011). Science does not speak for itself: translating childdevelopment research for the public and its policymakers. Child Development, 82, 17–32. doi:10.1111/j.1467-8624.2010.01538.x.
Smaldone, A., Honig, J. C., & Byrne,M.W. (2007). Sleepless in America: inadequate sleep and relationships tohealth and well-being of our nation's children. Pediatrics, 119, S29–37.
Song, M. (2003). Two studies on the Resilience Inventory (RI): Toward the goal of creating a culturallysensitive measure of adolescence resilience. Unpublished doctoral dissertation, Harvard University,MA.
Spoth, R. L., & Greenberg, M. T. (2005). Toward a comprehensive strategy for effective practitioner-scientistpartnerships and larger-scale community benefits. American Journal of Community Psychology, 35,107–126.
Steptoe, A., & Butler, N. (1996). Sports participation and emotional wellbeing in adolescents. Lancet, 347,1789–92.
Theokas, C., & Lerner, R. M. (2006). Observed ecological assets in families, schools, and neighborhoods:conceptualizations, measurement, and relations with positive and negative developmental outcomes.Applied Developmental Science, 10, 61–74.
Theokas, C., Almerigi, J., Lerner, R. M., Dowling, E. M., Benson, P. L., & Scales, P. C. (2005).Conceptualizing and modeling individual and ecological asset components of thriving in earlyadolescence. Journal of Early Adolescence, 25, 113–143.
Thompson, L. S. (1999). Creating partnerships with government, communities, and universities to achieveresults for children. Applied Developmental Science, 3, 213–216.
Trach, J., Hymel, S., Waterhouse, T., & Neale, K. (2010). Bystander responses to school bullying: A cross-sectional investigation of grade and sex differences. Canadian Journal of School Psychology, 25, 114–130. doi:10.1177/0829573509357553.
WestEd (2011). California Healthy Kids Survey. Retrieved from http://chks.wested.org/administer/download.
Zins, J. E., Elias, M. J., Greenberg, M. T., & Kline Pruett, M. (Eds.). (2000a). Issues in the implementationof prevention programs [Special issue]. Journal of Educational and Psychological Consultation, 11(1).
Zins, J. E., Elias, M. J., Greenberg, M. T., & Kline Pruett, M. (Eds.). (2000b). Measurement of quality ofimplementation of prevention programs [Special issue]. Journal of Educational and PsychologicalConsultation, 11(2).
418 M. Guhn et al.


![Middle childhood org [recuperado]](https://img.pdfslide.us/doc/110x75/55b5d06dbb61eb9d0f8b47a2/middle-childhood-org-recuperado.jpg)