Embed Size (px)
Citation preview

Welfare Analysis
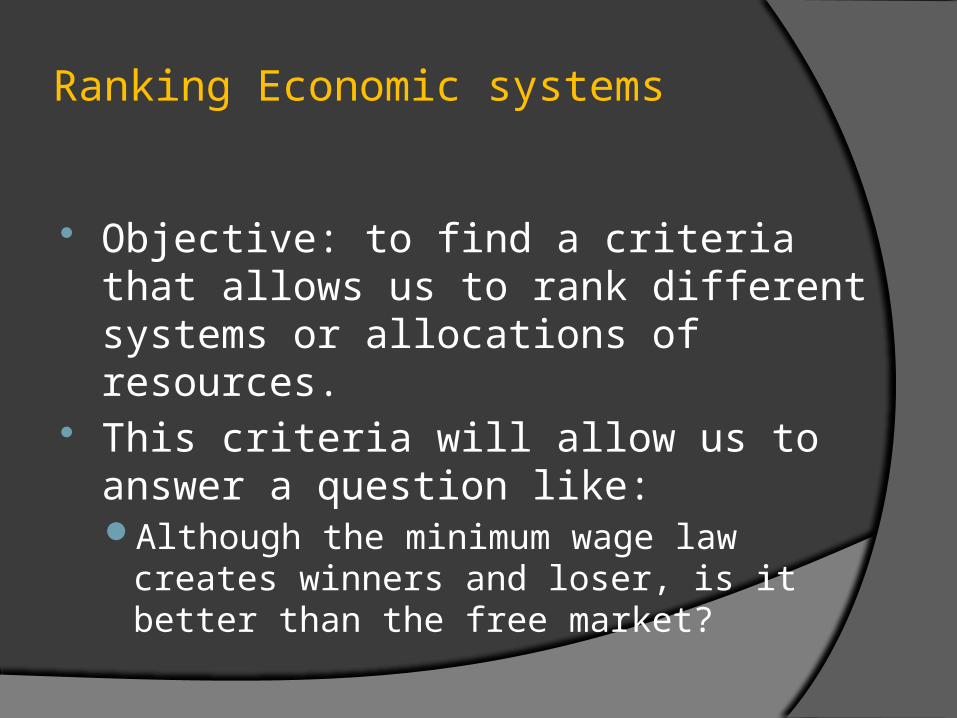
Ranking Economic systems
Objective: to find a criteria that allows us to rank different systems or allocations of resources.
This criteria will allow us to answer a question like:Although the minimum wage law creates winners
and loser, is it better than the free market?
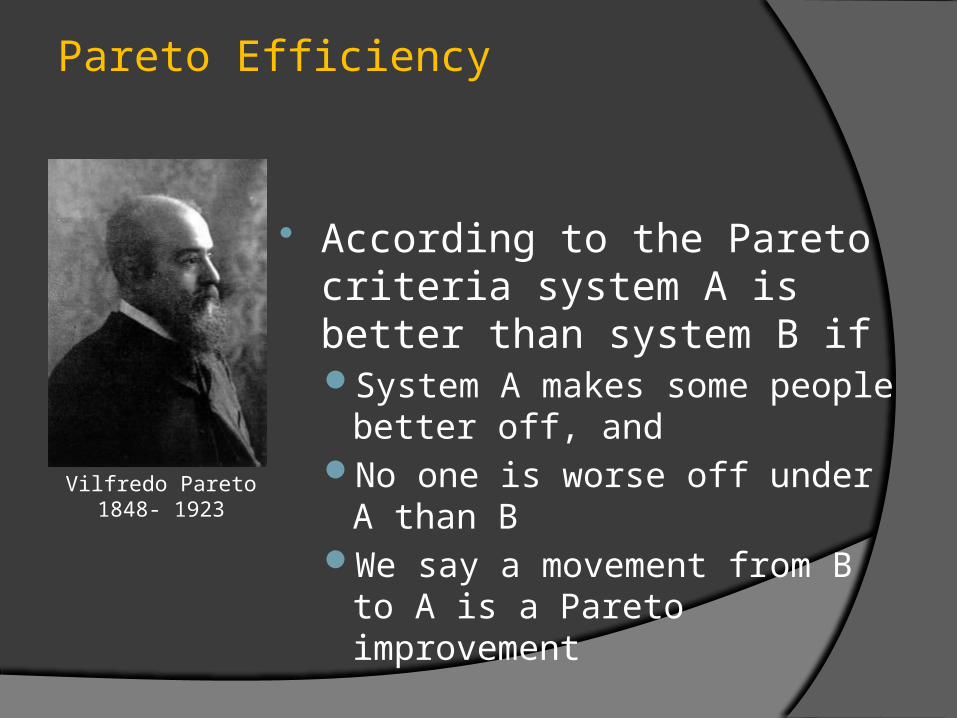
Pareto Efficiency
According to the Pareto criteria system A is better than system B ifSystem A makes some people
better off, andNo one is worse off under A than BWe say a movement from B to A is
a Pareto improvement
Vilfredo Pareto1848- 1923

Pareto Efficiency
System A is Pareto efficient ifThere exists no other system that
makes some people better off without hurting others
Vilfredo Pareto1848- 1923

Consumers, Producers and Welfare Economics
Welfare Economics can be used to answer the followingWhat is the right amount of the good that should
be produced?Can the market system ensure that this amount is
produced?If not, can government policy give us the right
amount of production?

What are the “RIGHT” quantities? Society has to decide:
What goods will be produced using the scarce resources.

What are the “RIGHT” quantities?
Society realizes a benefit from consumption of a given amount of a good.
Society bears a cost as a result of producing that good.
Society’s Objective??
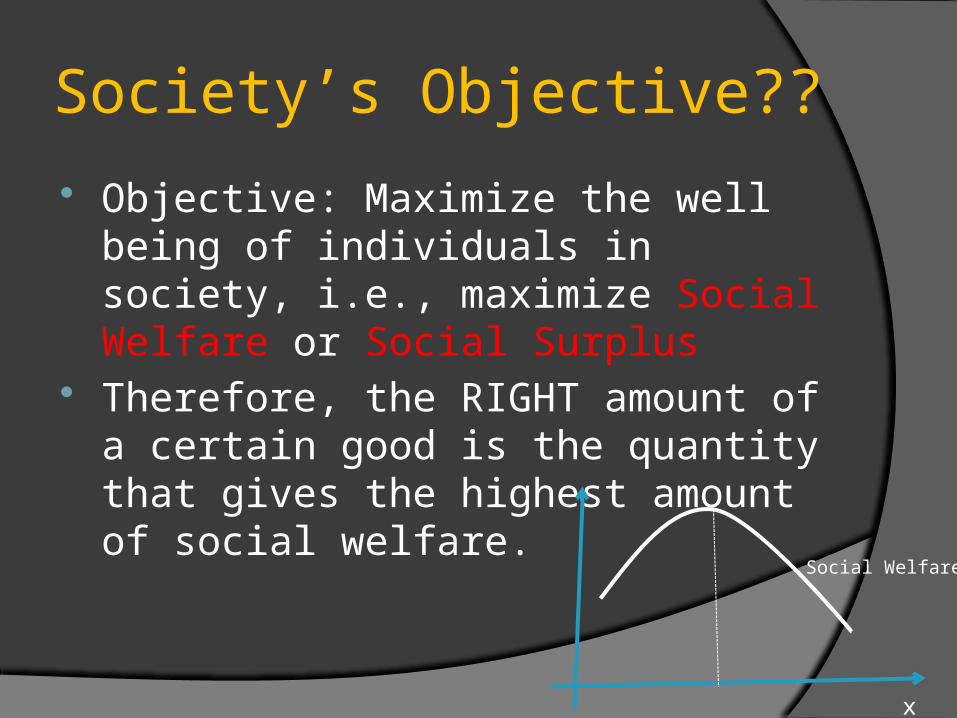
Objective: Maximize the well being of individuals in society, i.e., maximize Social Welfare or Social Surplus
Therefore, the RIGHT amount of a certain good is the quantity that gives the highest amount of social welfare.
Social Welfare
x
How to calculate social welfare?
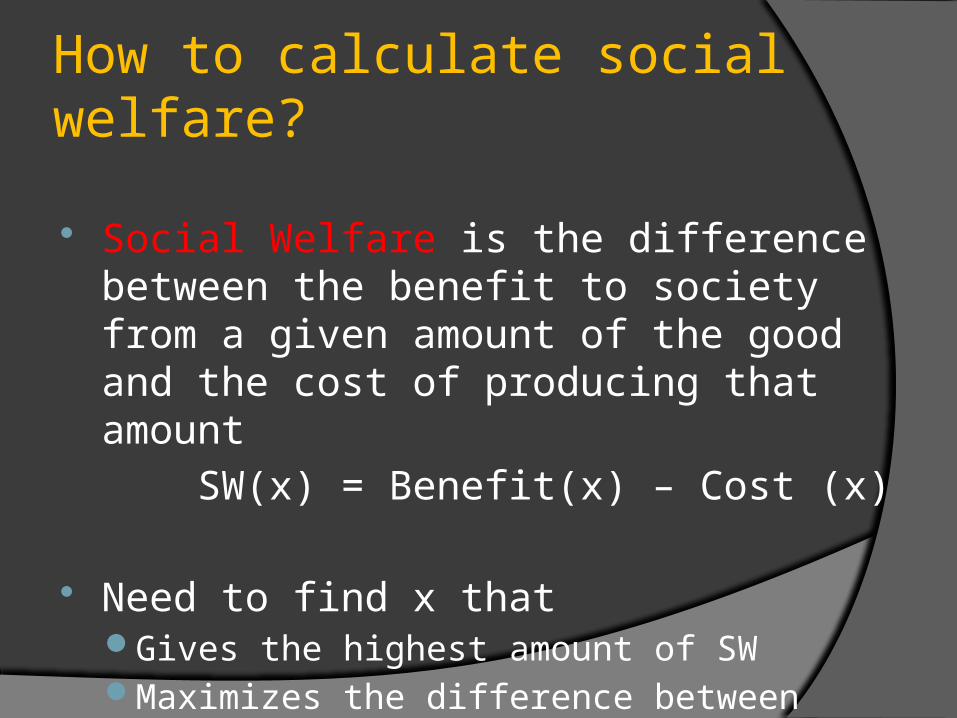
Social Welfare is the difference between the benefit to society from a given amount of the good and the cost of producing that amount
SW(x) = Benefit(x) – Cost (x)
Need to find x thatGives the highest amount of SWMaximizes the difference between benefits and
costs of a good
Marginal Analysis
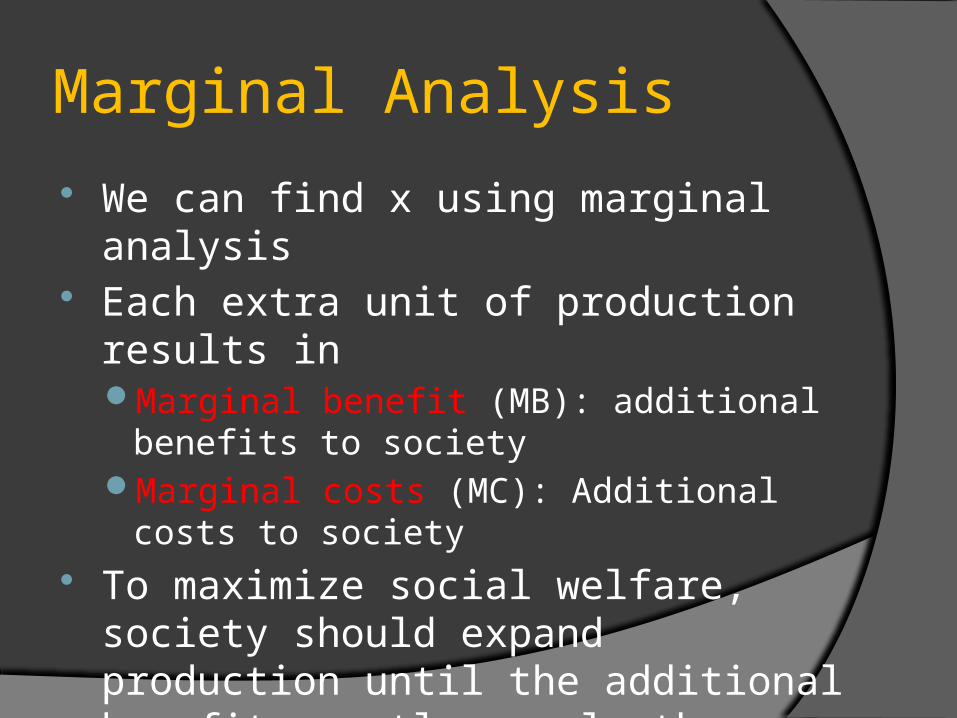
We can find x using marginal analysis Each extra unit of production results in
Marginal benefit (MB): additional benefits to society
Marginal costs (MC): Additional costs to society
To maximize social welfare, society should expand production until the additional benefit exactly equals the additional cost from production.
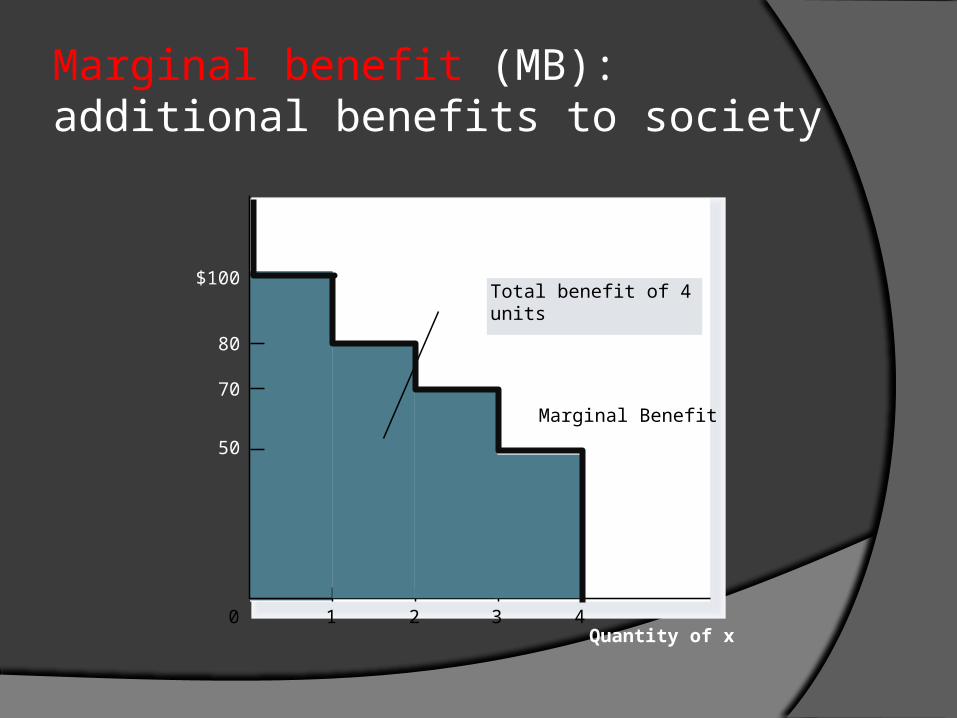
Marginal benefit (MB): additional benefits to society
50
70
80
0
$100
1 2 3 4Quantity of x
Total benefit of 4 units
Marginal Benefit
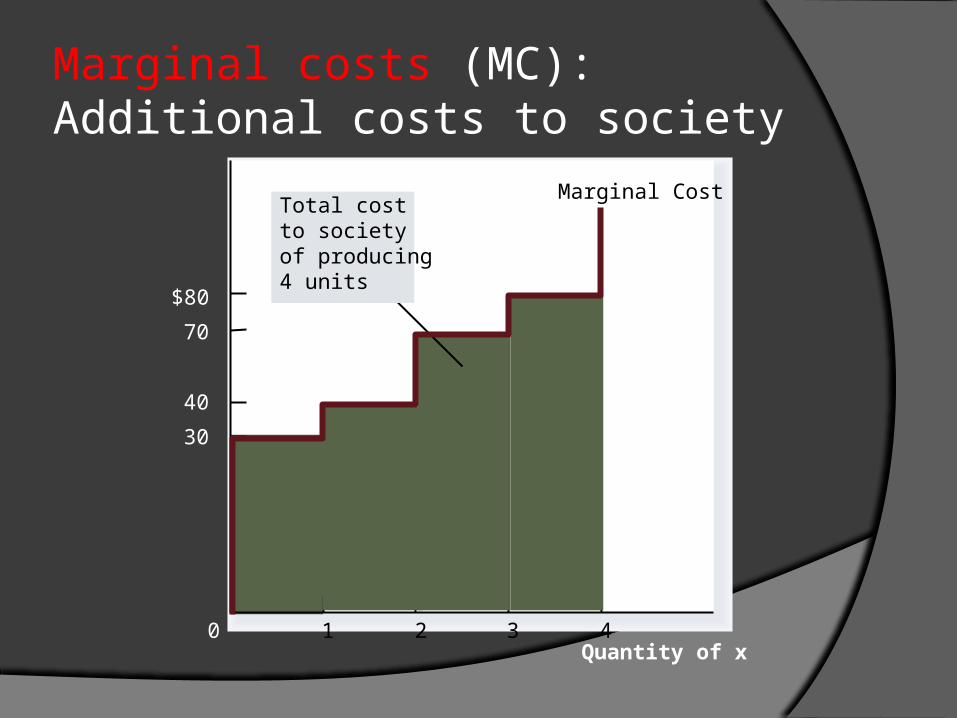
Marginal costs (MC): Additional costs to society
Quantity of x
30
70
$80
0
40
1 2 3 4
Total cost to society of producing 4 units
Marginal Cost
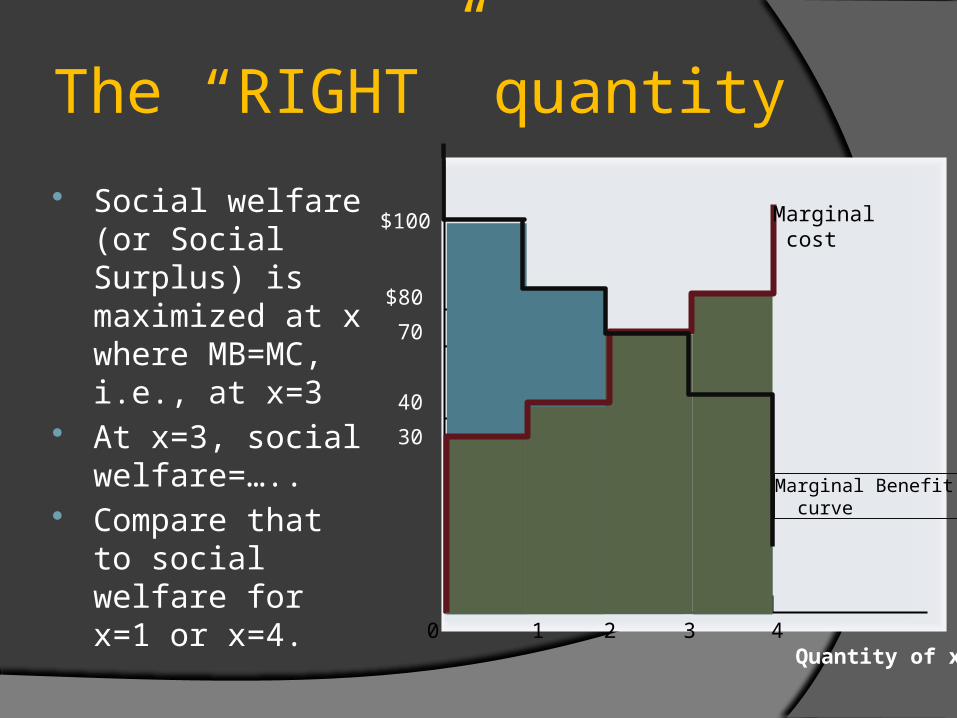
The “RIGHT” quantity
Quantity of x
30
70
$80
0
40
1 2 3 4
$100 Social welfare (or
Social Surplus) is maximized at x where MB=MC, i.e., at x=3
At x=3, social welfare=…..
Compare that to social welfare for x=1 or x=4.
Marginal cost
Marginal Benefit curve
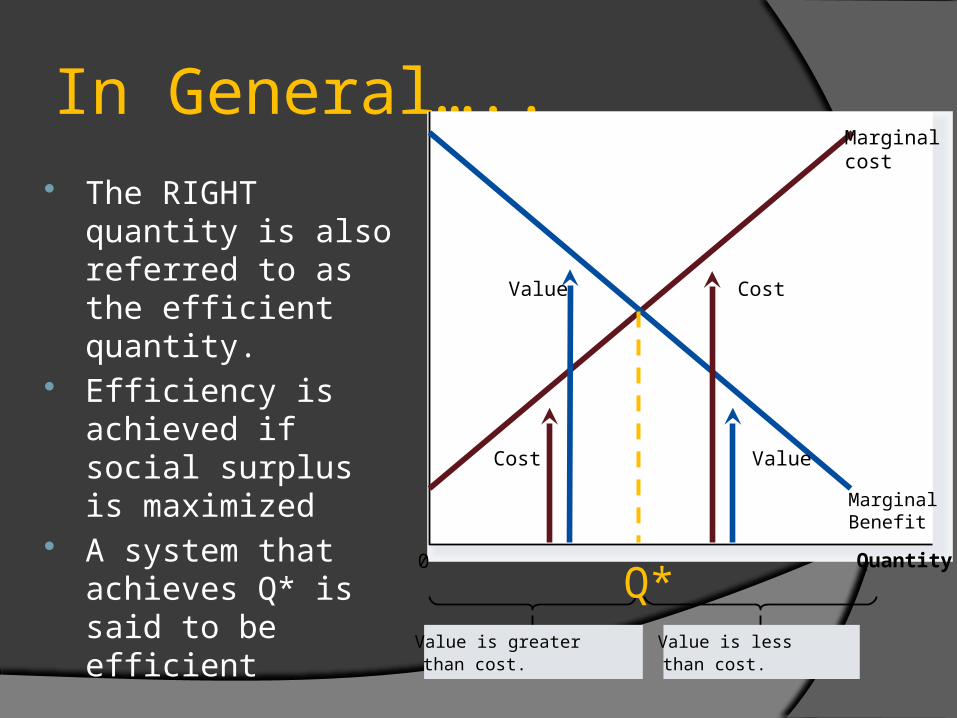
In General…..
Quantity0
Marginal cost
Marginal Benefit
Cost
CostValue
Value
Value is greaterthan cost.
Value is lessthan cost.
The RIGHT quantity is also referred to as the efficient quantity.
Efficiency is achieved if social surplus is maximized
A system that achieves Q* is said to be efficient
Q*

System 1: The Benevolent Social Planner
Lets consider a system where decisions are made by a benevolent social planner
His objective: maximizing welfare of society
Is that system efficient?

System 1: The Benevolent Social Planner
Assume the social planner has all relevant information
He uses marginal analysis: A unit is produced when the benefit
it yields is higher than or equal to its cost
The Benevolent Social Planner is efficient
System 2: The Market System Is the allocation of resources determined
by free markets in any way desirable? Can the market system produce the
output level that maximizes social welfare?

System 2: The Market System In a market system quantities are
determined by the market, the interaction of demand and supply.
Demand: reflects the benefit to consumers from the goods
Supply reflects the costs of production

Demand and Willingness to Pay Willingness to pay is the maximum
amount that an individual will pay for a good.
It measures how much he values the good or service, i.e., his benefit from the good.
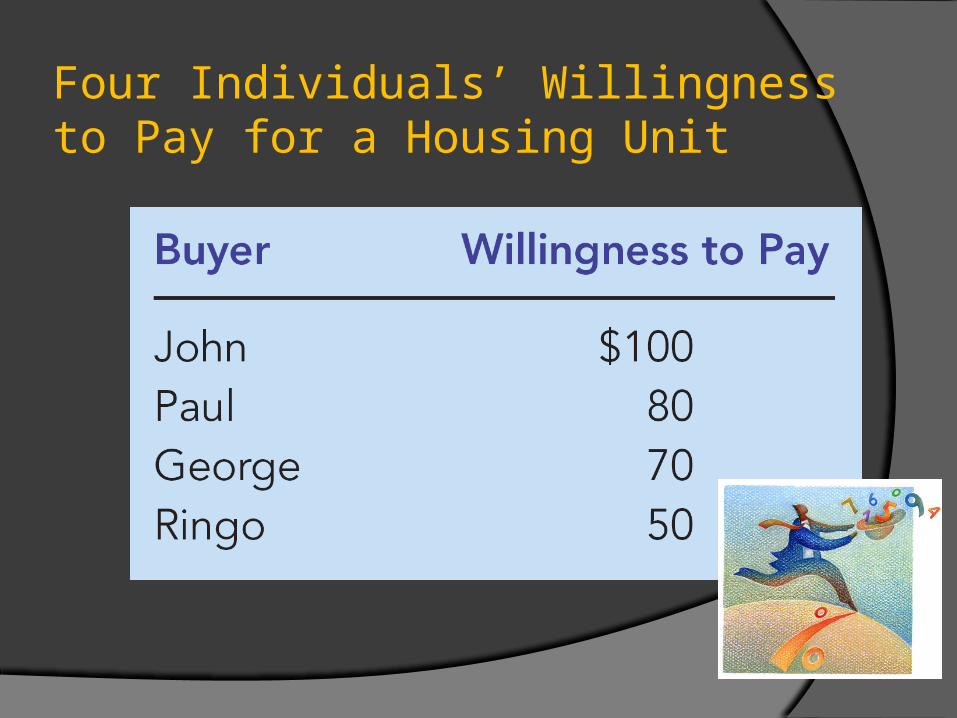
Four Individuals’ Willingness to Pay for a Housing Unit
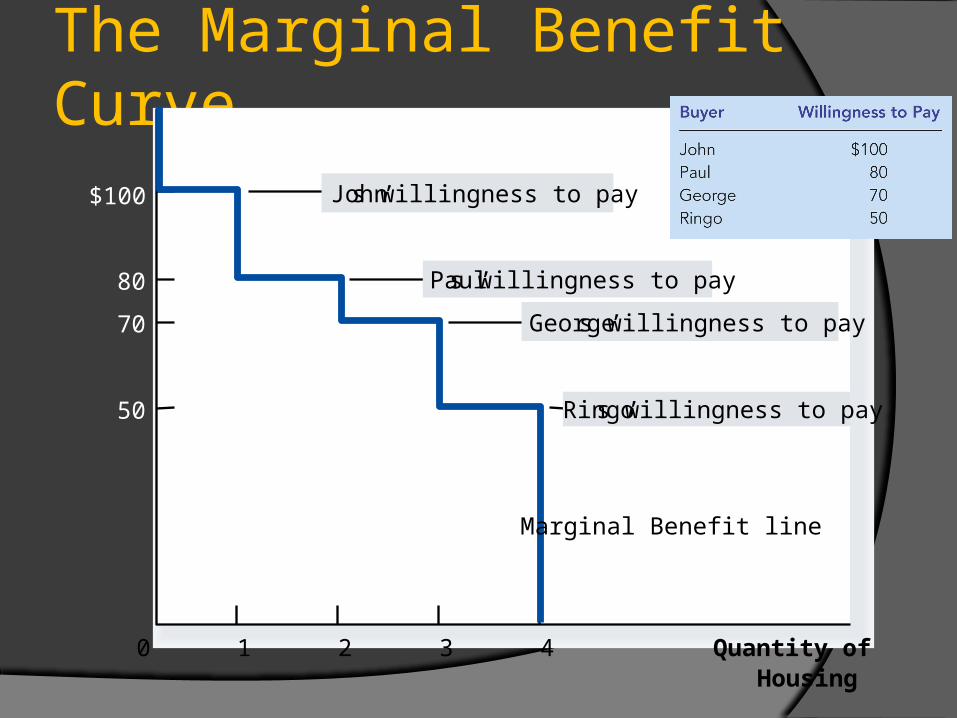
The Marginal Benefit Curve
0 Quantity ofHousing
Marginal Benefit line
1 2 3 4
$100 John’s willingness to pay
80 Paul’s willingness to pay
70 George’s willingness to pay
50 Ringo’s willingness to pay
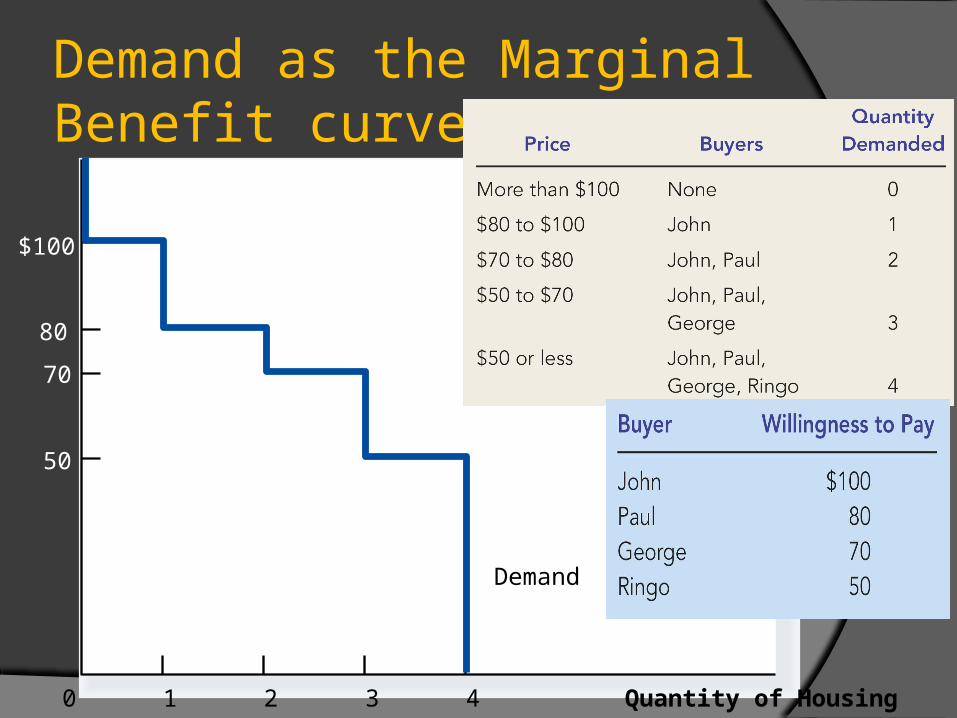
0 Quantity of Housing
Demand
1 2 3 4
$100
Demand as the Marginal Benefit curve
80
70
50
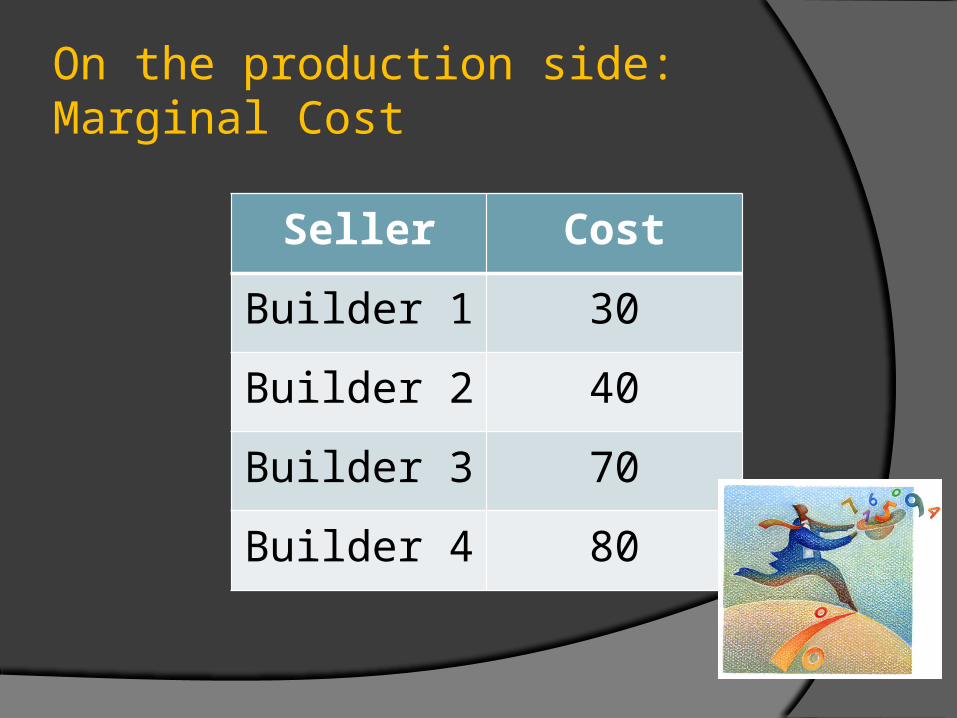
On the production side:Marginal Cost
Seller Cost
Builder 1 30
Builder 2 40
Builder 3 70
Builder 4 80
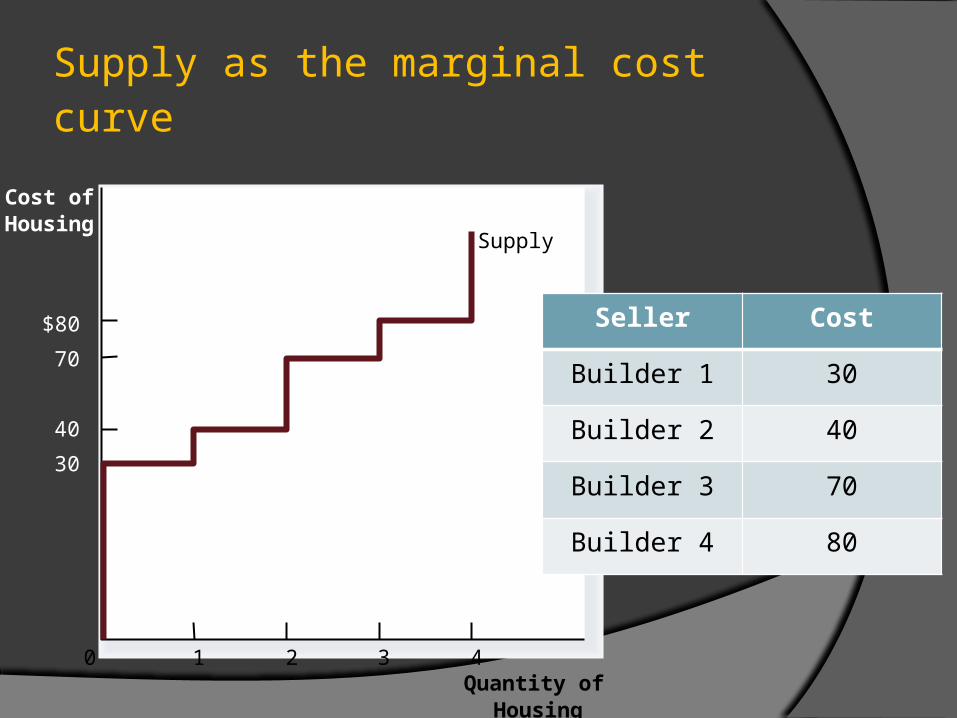
Supply as the marginal cost curve
Quantity ofHousing
Cost ofHousing
30
70
$80
0
40
1 2 3 4
Supply
Seller Cost
Builder 1 30
Builder 2 40
Builder 3 70
Builder 4 80
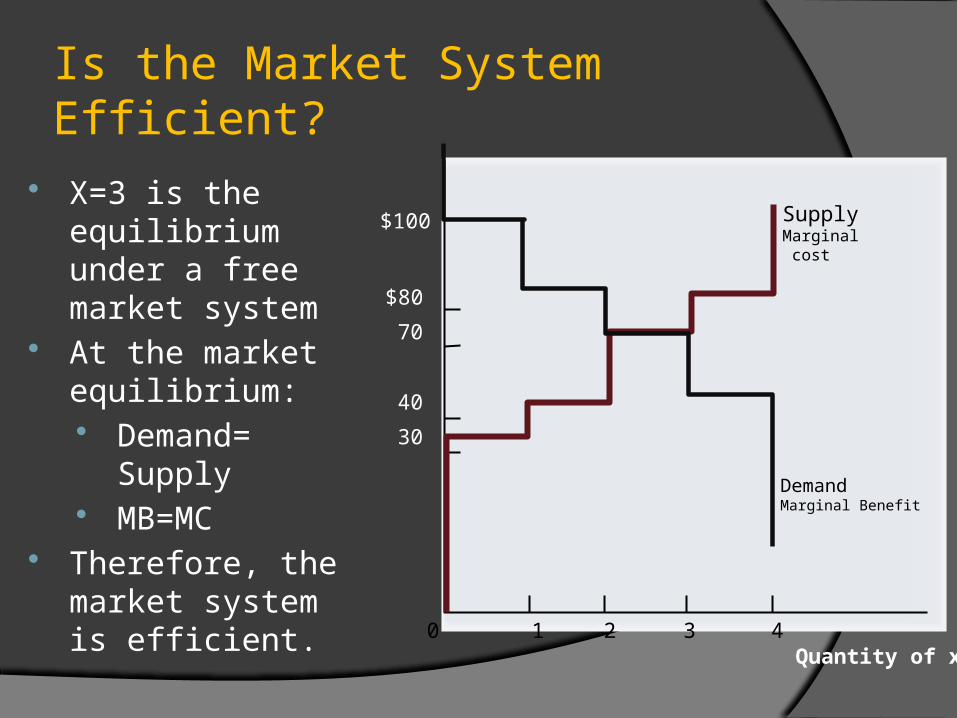
Is the Market System Efficient?
Quantity of x
30
70
$80
0
40
1 2 3 4
$100 SupplyMarginal cost
DemandMarginal Benefit
X=3 is the equilibrium under a free market system
At the market equilibrium: Demand=
Supply MB=MC
Therefore, the market system is efficient.
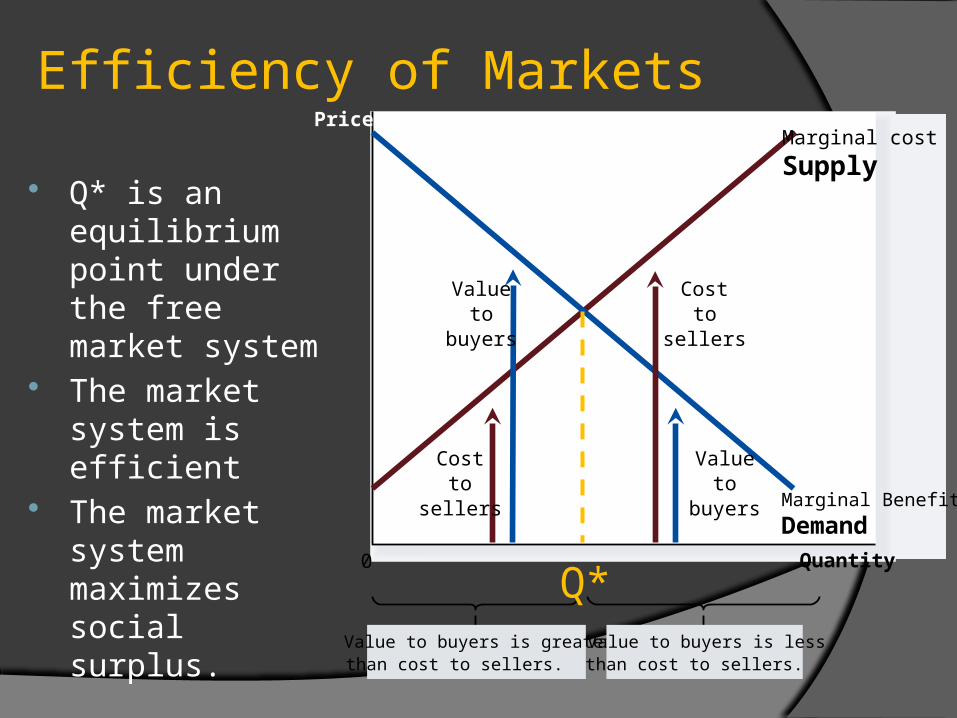
Efficiency of Markets
Quantity
Price
0
Marginal cost
Supply
Marginal Benefit
Demand
Costto
sellers
Costto
sellers
Valueto
buyers
Valueto
buyers
Value to buyers is greaterthan cost to sellers.
Value to buyers is lessthan cost to sellers.
Q*
Q* is an equilibrium point under the free market system
The market system is efficient
The market system maximizes social surplus.
Conclusion The market system is efficient when there are:
No external benefits (the demand is the marginal benefit to society)
No external costs (the supply curve is the marginal cost to society)
The planned system is efficient provided that the social planner is benevolent and has all the required information
The efficiency of the market system does not depend on benevolence but rather on self interest.

Social Surplus: Consumers and Producers Social Surplus or Social Welfare measure
net gains from trade, i.e., the satisfaction derived by consumers and producers from participating in a market
Social Surplus=
Consumers Surplus+ Producers Surplus
Consumer Surplus Consumer surplus measures economic
welfare from the buyer’s side. Consumer surplus is the buyer’s
willingness to pay for a good minus the amount the buyer actually pays for it
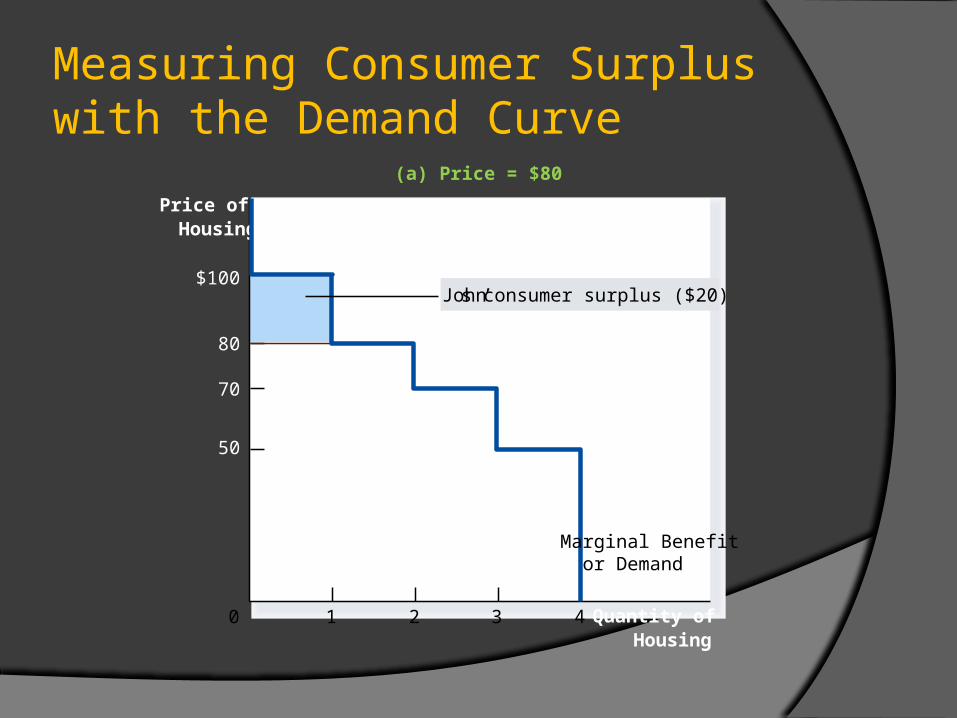
Measuring Consumer Surplus with the Demand Curve
(a) Price = $80
Price ofHousing
50
70
80
0
$100
Marginal Benefit or Demand
1 2 3 4 Quantity ofHousing
John’s consumer surplus ($20)
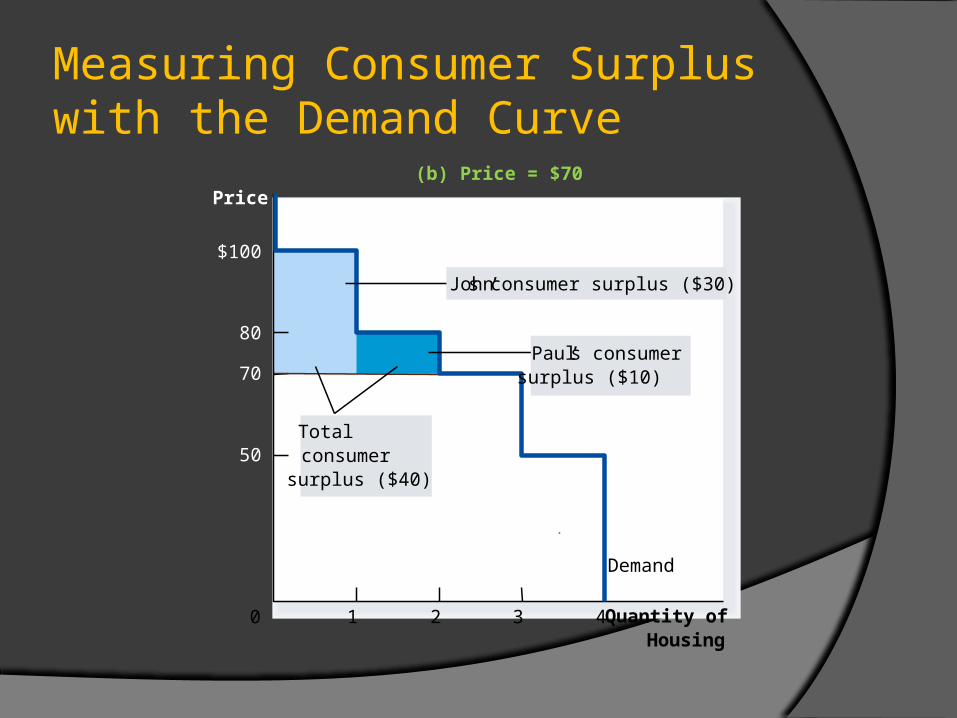
Measuring Consumer Surplus with the Demand Curve
(b) Price = $70Price
50
70
80
0
$100
Demand
1 2 3 4
Totalconsumersurplus ($40)
Quantity ofHousing
John’s consumer surplus ($30)
Paul’s consumersurplus ($10)
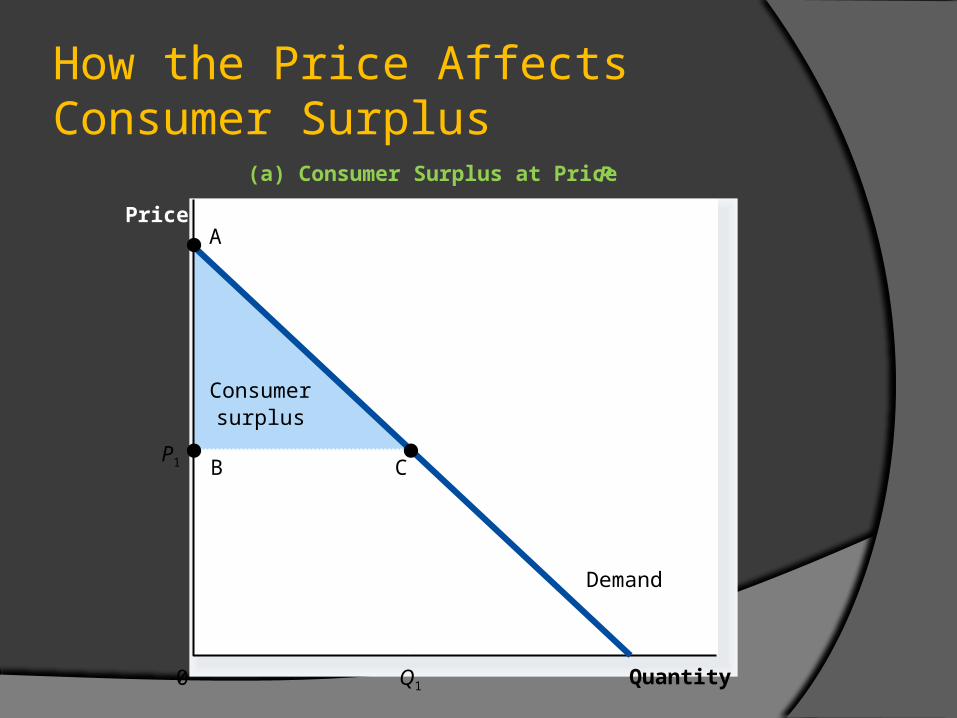
How the Price Affects Consumer Surplus
Consumersurplus
Quantity
(a) Consumer Surplus at Price P
Price
0
Demand
P1
Q1
B
A
C

PRODUCER SURPLUS
Producer surplus is the amount a seller is paid for a good minus the seller’s cost.
It measures the economic welfare from the seller’s side.
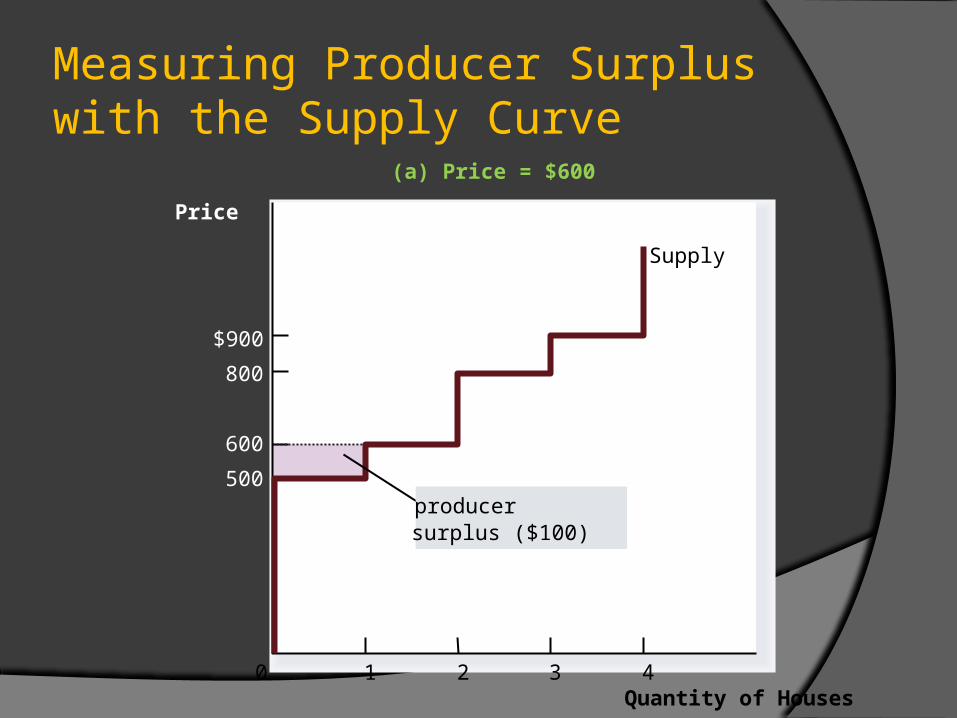
Measuring Producer Surplus with the Supply Curve
Quantity of Houses
Price
500
800
$900
0
600
1 2 3 4
(a) Price = $600
Supply
producersurplus ($100)
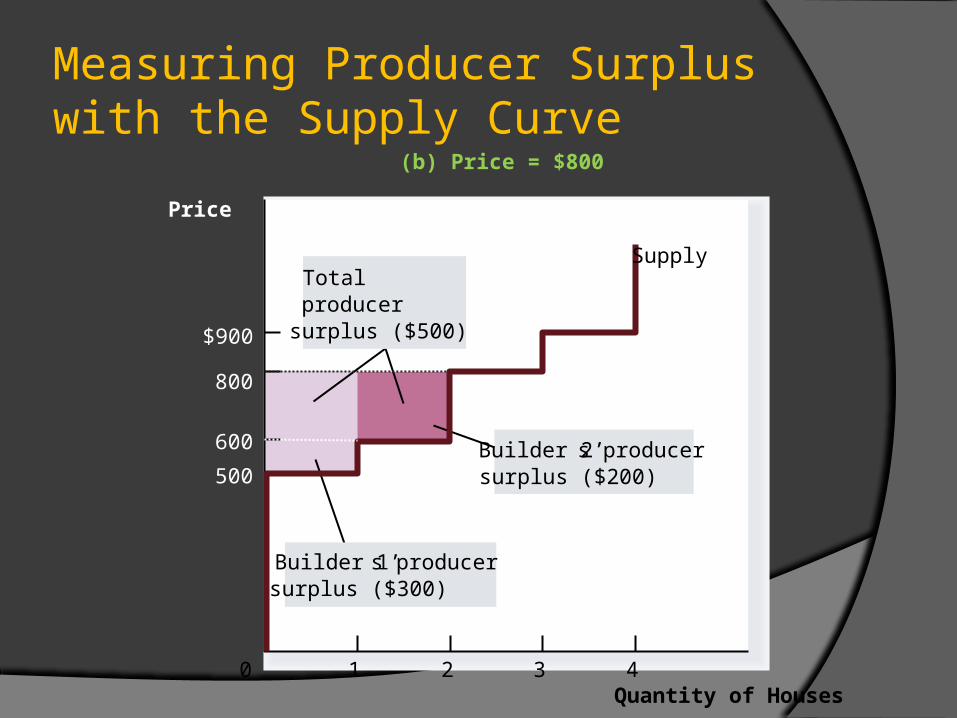
Measuring Producer Surplus with the Supply Curve
Quantity of Houses
Price
500
800
$900
0
600
1 2 3 4
(b) Price = $800
Builder 2’ s producersurplus ($200)
Totalproducersurplus ($500)
Builder 1’s producersurplus ($300)
Supply
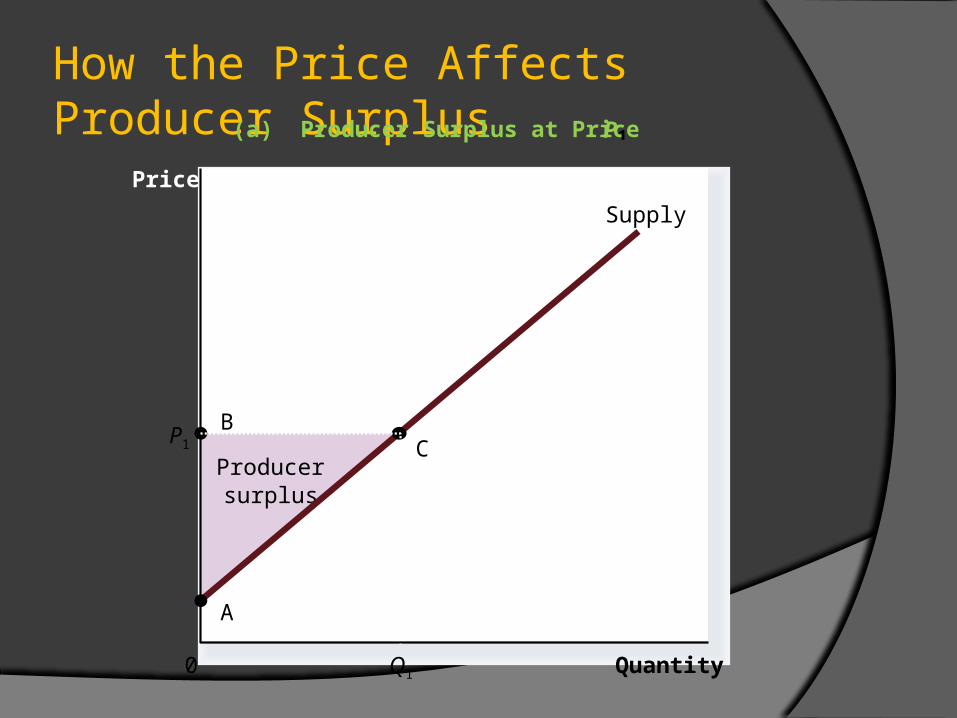
How the Price Affects Producer Surplus
Producersurplus
Quantity
(a) Producer Surplus at Price P
Price
0
Supply
B
A
C
Q1
P1
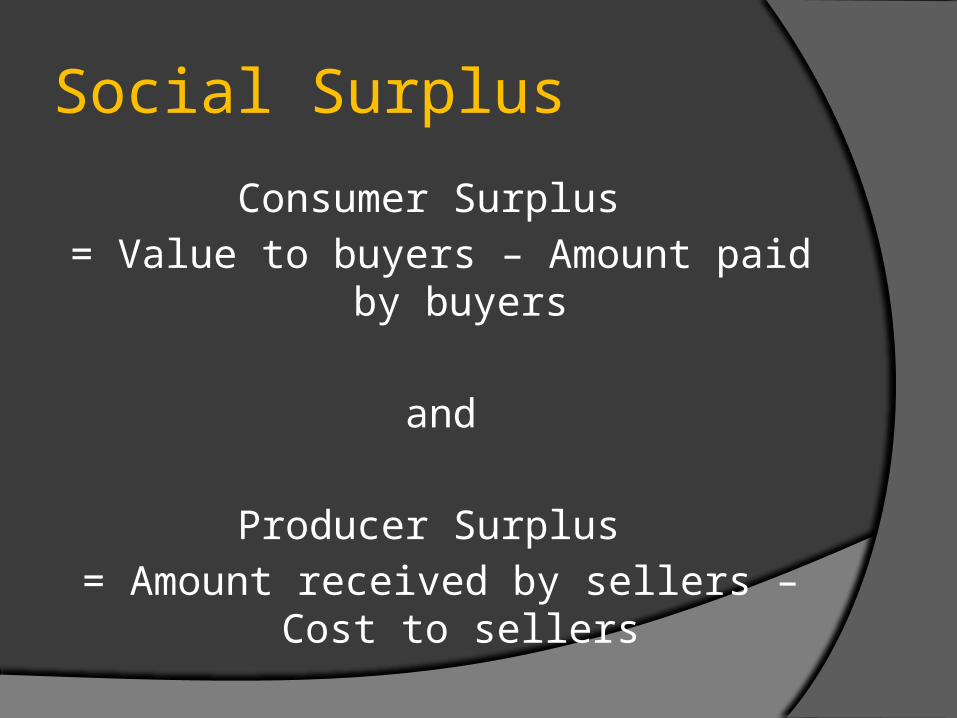
Social Surplus
Consumer Surplus
= Value to buyers – Amount paid by buyers
and
Producer Surplus
= Amount received by sellers – Cost to sellers
Total Surplus
Total surplus
= Consumer surplus + Producer surplus
or
Total surplus
= Value to buyers – Cost to sellers
Thus, the price paid by buyers will not affect total surplus although it will affect the distribution of surplus between consumers and producers.