Embed Size (px)
Citation preview

© Copyright 2006 Wipro Ltd Wipro confidenti al 1
Welcome to WiproUS Analysts/Investors Interaction Session
Feb 8, ’06NYSE, New York

© Copyright 2006 Wipro Ltd Wipro confidenti al 2
Sridhar Ramasubbu
Vice President
8, February, 2006
Wipro Overview

3
Safe HarborSafe HarborSafe HarborSafe Harbor
This presentation may contain certain “forward looking” statements, which
involve a number of risks, uncertainties and other factors that could cause
actual results to differ materially from those that may be projected by
these forward looking statements. These uncertainties have been detailed
in the reports filed by Wipro with the Securities and Exchange Commission
and these filings are available at www.sec.gov. This presentation also
contains references to findings of various reports available in the public
domain. Wipro makes no representation as to their accuracy or that the
company subscribes to those findings.

4
512
23
35
20
45
2025
35
5.2
0.9
2001 2005 2010"Sustaining
Leadership"
AdditionalPotential
"ExtendingLeadership"
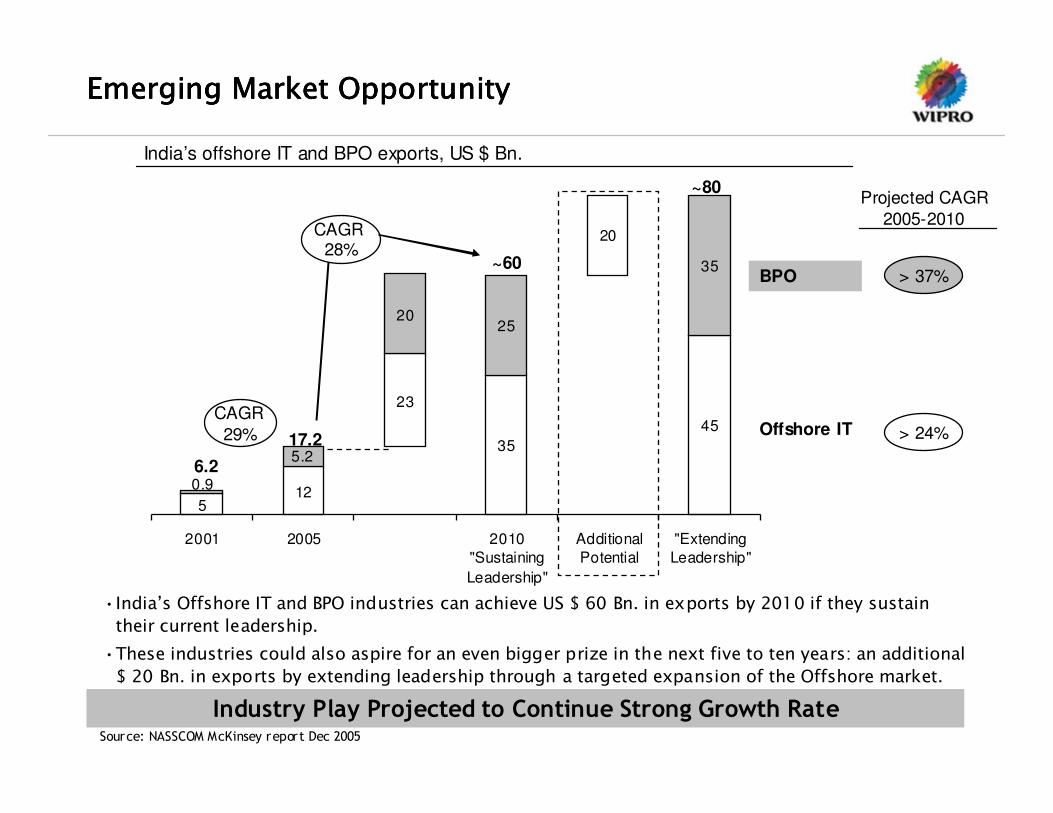
Emerging Market Opportunity for IndiaEmerging Market Opportunity for IndiaEmerging Market Opportunity for IndiaEmerging Market Opportunity for India
Industry Play Projected to Continue Strong Growth Rate
India’s offshore IT and BPO exports, US $ Bn.
Offshore IT
BPO
CAGR 28%
•India’s Offshore IT and BPO industries can achieve US $ 60 Bn. in exports by 2010 if they sustain
their current leadership.
•These industries could also aspire for an even bigger prize in the next five to ten years: an additional
$ 20 Bn. in exports by extending leadership through a targeted expansion of the Offshore market.
6.2
17.2
CAGR 29%
~60
~80Projected CAGR
2005-2010
> 24%
> 37%
Source: NASSCOM McKinsey report 2005

5
Wipro Wipro Wipro Wipro –––– Culture of SuccessCulture of SuccessCulture of SuccessCulture of Success
Global IT Services & ProductsGlobal IT Services & ProductsGlobal IT Services & ProductsGlobal IT Services & Products
1 15 28 50 73 106 149 234
382 475
943
625
1353
1813
1989-
90
1993-
94
1994-
95
1995-
96
1996-
97
1997-
98
1998-
99
1999-
00
2000-
01
2001-
02
2002-
03
2003-
04
2004-
05
2005-
06
Revenues $ MnRevenues $ MnRevenues $ MnRevenues $ Mn10101010---- Yr CAGR: 43%Yr CAGR: 43%Yr CAGR: 43%Yr CAGR: 43%
Origin & Track RecordOrigin & Track RecordOrigin & Track RecordOrigin & Track Record
� Incorporated in 1945; IPO in 1946; listed on NYSE (WIT) in 2000
� 59 years track record of growth & profitability
� Entered IT business in 1980s; IT Services business launched in early nineties
� Over 90% of Revenue & 96% of EBIT comes from IT businesses
Snapshot of Global IT businessSnapshot of Global IT businessSnapshot of Global IT businessSnapshot of Global IT business:
� 35+ offices across North America, Europe and Asia
� People from 31 different nationalities
� Part of NYSE’s TMT (Technology-Media-Telecom) Index, NSE Nifty Index and BSE Sensex
Compounded Growth Rate- Over 59 Years:
Revenues: 21%, Net Income: 31%, M-Cap: 24%
Note: FY 05-06 Revenues= Actual Revenues for Q1,Q2 & Q3 + Guidance for Q4
6
BankingBankingBankingBanking
InsuranceInsuranceInsuranceInsurance
Telecom SolutionsTelecom SolutionsTelecom SolutionsTelecom Solutions
Storage TechnologiesStorage TechnologiesStorage TechnologiesStorage Technologies
Mining the Global Market : Mining the Global Market : Mining the Global Market : Mining the Global Market : Verticalised StructureVerticalised StructureVerticalised StructureVerticalised Structure
Finance SolutionsFinance SolutionsFinance SolutionsFinance Solutions(FS)(FS)(FS)(FS)
Product EngineeringProduct EngineeringProduct EngineeringProduct EngineeringSolutions (PES)Solutions (PES)Solutions (PES)Solutions (PES)
Telecom Service Telecom Service Telecom Service Telecom Service Providers (TSP)Providers (TSP)Providers (TSP)Providers (TSP)
Enterprise SolutionsEnterprise SolutionsEnterprise SolutionsEnterprise Solutions(ES)(ES)(ES)(ES)
TechnologyTechnologyTechnologyTechnologyBusinessBusinessBusinessBusiness
EnterpriseEnterpriseEnterpriseEnterpriseBusinessBusinessBusinessBusiness
39%
32%
53%
37%
3 Yr CAGR3 Yr CAGR3 Yr CAGR3 Yr CAGRAutomotive ElectronicsAutomotive ElectronicsAutomotive ElectronicsAutomotive Electronics
Computing PeripheralsComputing PeripheralsComputing PeripheralsComputing Peripherals
Software ProductsSoftware ProductsSoftware ProductsSoftware Products
Consumer ElectronicsConsumer ElectronicsConsumer ElectronicsConsumer Electronics
Industrial Automation & AvionicsIndustrial Automation & AvionicsIndustrial Automation & AvionicsIndustrial Automation & Avionics
SemiconductorsSemiconductorsSemiconductorsSemiconductors
SecuritiesSecuritiesSecuritiesSecurities
RetailRetailRetailRetail
ManufacturingManufacturingManufacturingManufacturing
Energy & UtilitiesEnergy & UtilitiesEnergy & UtilitiesEnergy & Utilities
TMTS#TMTS#TMTS#TMTS#
37% of37% of37% of37% ofRevenue Revenue Revenue Revenue *
63% of63% of63% of63% ofRevenueRevenueRevenueRevenue****
#Travel, Media, Transportation, Service* - IT Services Revenue for Quarter ended Dec 2005
7
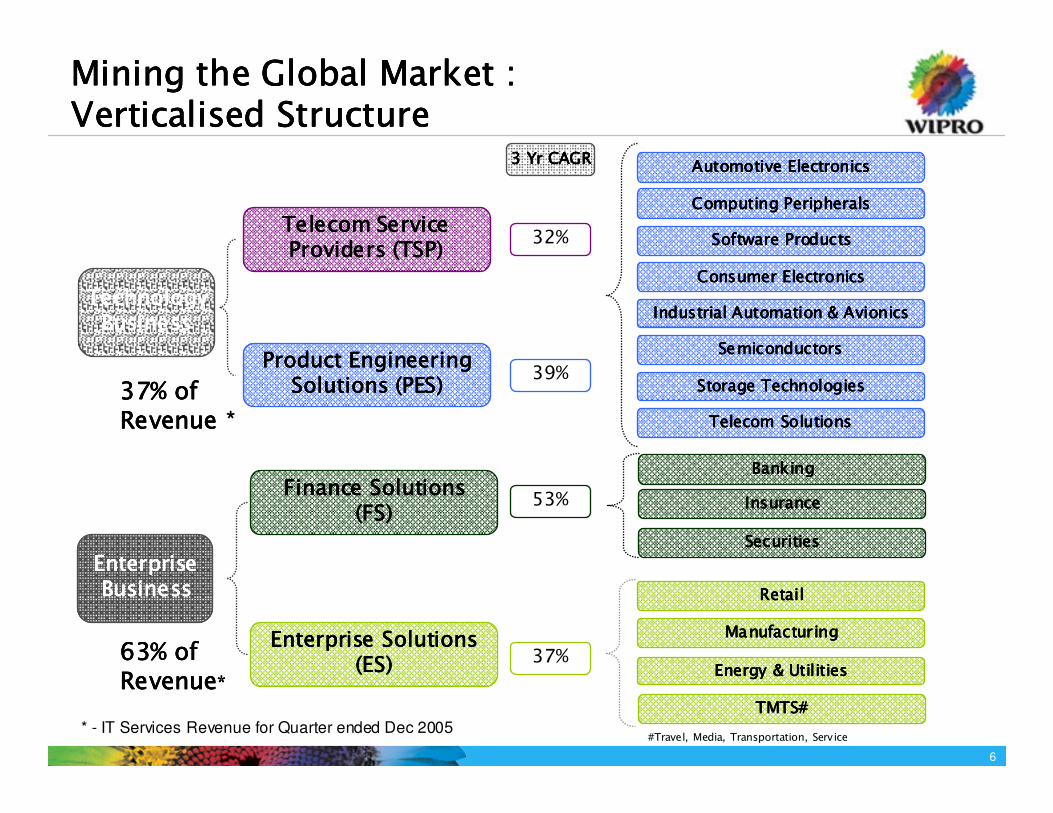
Innovating Global DeliveryInnovating Global DeliveryInnovating Global DeliveryInnovating Global Delivery
� New Services Revenue : 39% (up from 8% in 2000New Services Revenue : 39% (up from 8% in 2000New Services Revenue : 39% (up from 8% in 2000New Services Revenue : 39% (up from 8% in 2000----01)01)01)01)
� Demonstrating remote delivery execution for traditional onsite sDemonstrating remote delivery execution for traditional onsite sDemonstrating remote delivery execution for traditional onsite sDemonstrating remote delivery execution for traditional onsite serviceserviceserviceservices
� Leadership Position in Testing, TIS, BPOLeadership Position in Testing, TIS, BPOLeadership Position in Testing, TIS, BPOLeadership Position in Testing, TIS, BPO
PIPI P I
P I P IT IS
T IS
T IS TI S TI S TI S
BPO BPOB PO B PO
C o ns
C o nsC o ns C o ns
Test ing Test ing
PI
2 00 0- 0 1 20 0 1- 02 20 0 2- 03 20 0 3- 04 20 04 -0 5 Q3 2 0 05-0 6
Revenues from Newer Services(As % of Total Revenues)
Note: FY 05-06 data is for the quarter ended Dec 31, 2005Consulting revenues used here are pure consulting revenues and do not include the consulting revenues embedded in vertical r evenues
8%8%8%8%
15%15%15%15%
24%24%24%24%
36%36%36%36%
38%38%38%38%39%39%39%39%

8
� Source: Mckinsey-NASSCOM Study 2005, Company estimate ( all figures in USD B)� Percentages below the pie chart represent Wipro’s distribution of Revenues for the Quarter ended December 2005
IT Enabled IT Enabled IT Enabled IT Enabled
Services / BPOServices / BPOServices / BPOServices / BPO9% 9% 9% 9%
Package Implementation+ TestingPackage Implementation+ TestingPackage Implementation+ TestingPackage Implementation+ Testing+ Systems Integration + Systems Integration + Systems Integration + Systems Integration
21%21%21%21%
Infrastructure Infrastructure Infrastructure Infrastructure
Outsourcing Outsourcing Outsourcing Outsourcing 9% 9% 9% 9%
Consulting Consulting Consulting Consulting 1% 1% 1% 1%
CustomCustomCustomCustomApp Dev & App Dev & App Dev & App Dev &
Maintenance Maintenance Maintenance Maintenance 23% 23% 23% 23%
2.82.82.82.8
6.06.06.06.0
1.01.01.01.0
9.09.09.09.0
5.55.55.55.5
11.411.411.411.4
0.20.20.20.2
0.70.70.70.7
2.52.52.52.5
7.67.67.67.6
Indian Export Indian Export Indian Export Indian Export Potential*Potential*Potential*Potential*
FY05FY05FY05FY05
FY10FY10FY10FY10CAGR 16%CAGR 16%CAGR 16%CAGR 16%
CAGR 28%CAGR 28%CAGR 28%CAGR 28%
CAGR 55%CAGR 55%CAGR 55%CAGR 55%CAGR 25%CAGR 25%CAGR 25%CAGR 25%
CAGR 16%CAGR 16%CAGR 16%CAGR 16%
WiproWiproWiproWipro’’’’s Global IT Revenue pies Global IT Revenue pies Global IT Revenue pies Global IT Revenue pie
5.25.25.25.2
25252525CAGR 37%CAGR 37%CAGR 37%CAGR 37%
R&D Services R&D Services R&D Services R&D Services 37% 37% 37% 37%
Q3 2005Q3 2005Q3 2005Q3 2005----06060606
$473.4 M$473.4 M$473.4 M$473.4 M
Some of Our Differentiators..Some of Our Differentiators..Some of Our Differentiators..Some of Our Differentiators..A WellA WellA WellA Well----positioned Diverse Service Portfoliopositioned Diverse Service Portfoliopositioned Diverse Service Portfoliopositioned Diverse Service Portfolio

9
Some of Our Differentiators..Some of Our Differentiators..Some of Our Differentiators..Some of Our Differentiators..
Strategic AcquisitionsStrategic AcquisitionsStrategic AcquisitionsStrategic Acquisitions
Consulting in
Energy
90
E&U
AMSAMSAMSAMS
New Service
Line
2,500
BPO
SpectramindSpectramindSpectramindSpectramind
Payments
Space
Wireless, RFID,
Analog, IP
Consulting in
Securities
Benefits, Benefits, Benefits, Benefits,
Access toAccess toAccess toAccess to
351120100Domain Domain Domain Domain SpecialistSpecialistSpecialistSpecialist
Financial Services
Semi Conductors
SecuritiesSpaceSpaceSpaceSpace
mPowermPowermPowermPowerNew LogicNew LogicNew LogicNew LogicCompanyCompanyCompanyCompany
Acquisition Objectives:
� Deepening our domain competence
� Expanding or filling out our service lines
� Obtaining access to a new market
� Enhancing Technology footprint
GEG
NerveNerveNerveNerveWireWireWireWire
‘String of Pearls’ Strategy:
10
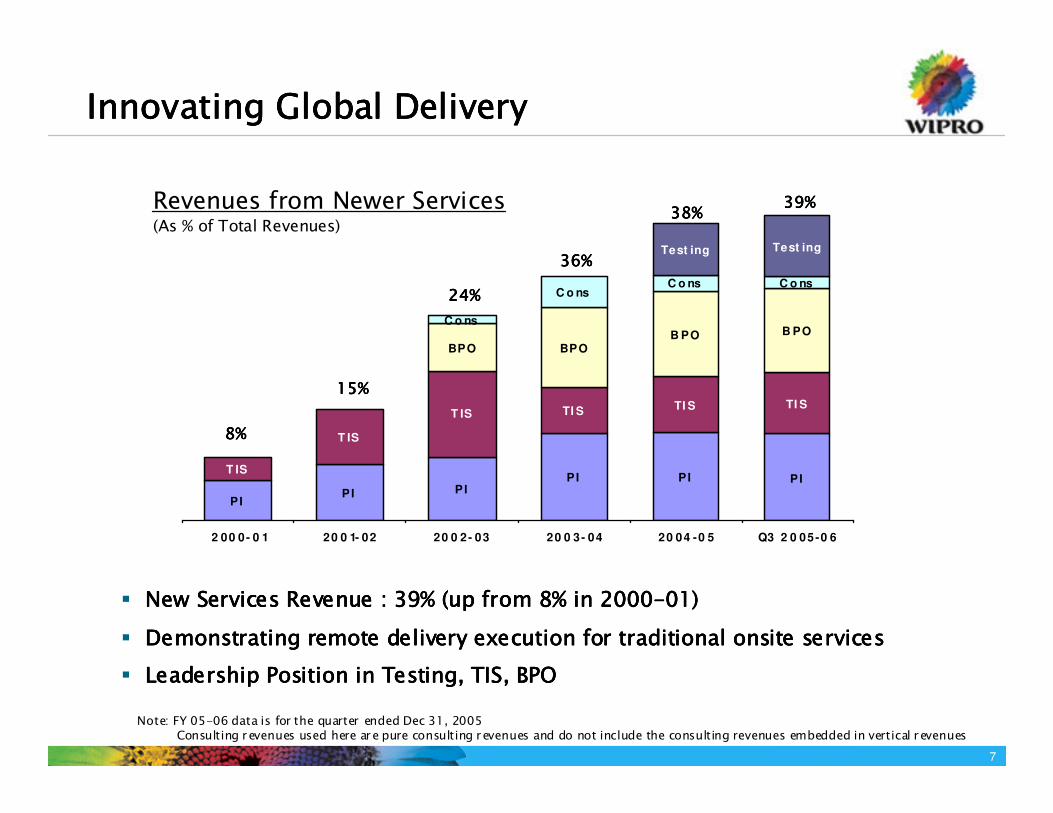
� ReReReRe----usable usable usable usable tools/componentstools/componentstools/componentstools/components
� ISO 9000ISO 9000ISO 9000ISO 9000� SEI CMM/CMMI SEI CMM/CMMI SEI CMM/CMMI SEI CMM/CMMI � BS7799BS7799BS7799BS7799
People
Process
Technology
SixSigma
� PCMM level 5PCMM level 5PCMM level 5PCMM level 5� CompetenciesCompetenciesCompetenciesCompetencies� Pro ject management Pro ject management Pro ject management Pro ject management
“Through a single-minded but judicious emphasis on quality as a guiding principle throughout its delivery processes, Wipro has shown
impressive improvements in delivery capabilities, client satisfaction, and the ability to continually reduce the cost of services, which it
aggressively passes on to its customers.” GartnerGartnerGartnerGartner
� Lower maintenance cost� Phase containment
� Increased productivity
� Schedule adherence
� Lower development cost
� Lower schedule overrun cost
Right the first time
Efficiently
On time every time
Our quality firstsOur quality firstsOur quality firstsOur quality firsts
TL 9000
WorldWorldWorldWorld’’’’s first s first s first s first software companysoftware companysoftware companysoftware company
WorldWorldWorldWorld’’’’s first s first s first s first IT companyIT companyIT companyIT company
WorldWorldWorldWorld’’’’s first s first s first s first companycompanycompanycompany
� 15,000+ employees15,000+ employees15,000+ employees15,000+ employeestrained in Six Sigma
methodologies
� 204 certified black 204 certified black 204 certified black 204 certified black beltsbeltsbeltsbelts and 10 master 10 master 10 master 10 master
black beltsblack beltsblack beltsblack belts
� Over 700 PMI700 PMI700 PMI700 PMI certified consultants, highest in
India
� All fresh recruits undergo a 3 day 3 day 3 day 3 day VelociVelociVelociVeloci----Q trainingQ trainingQ trainingQ training
� 33% business 33% business 33% business 33% business parametersparametersparametersparameters for the Wipro CEO
relate to qualityqualityqualityquality
Some of Our Differentiators..Some of Our Differentiators..Some of Our Differentiators..Some of Our Differentiators..
Process & Quality FocusProcess & Quality FocusProcess & Quality FocusProcess & Quality Focus
11
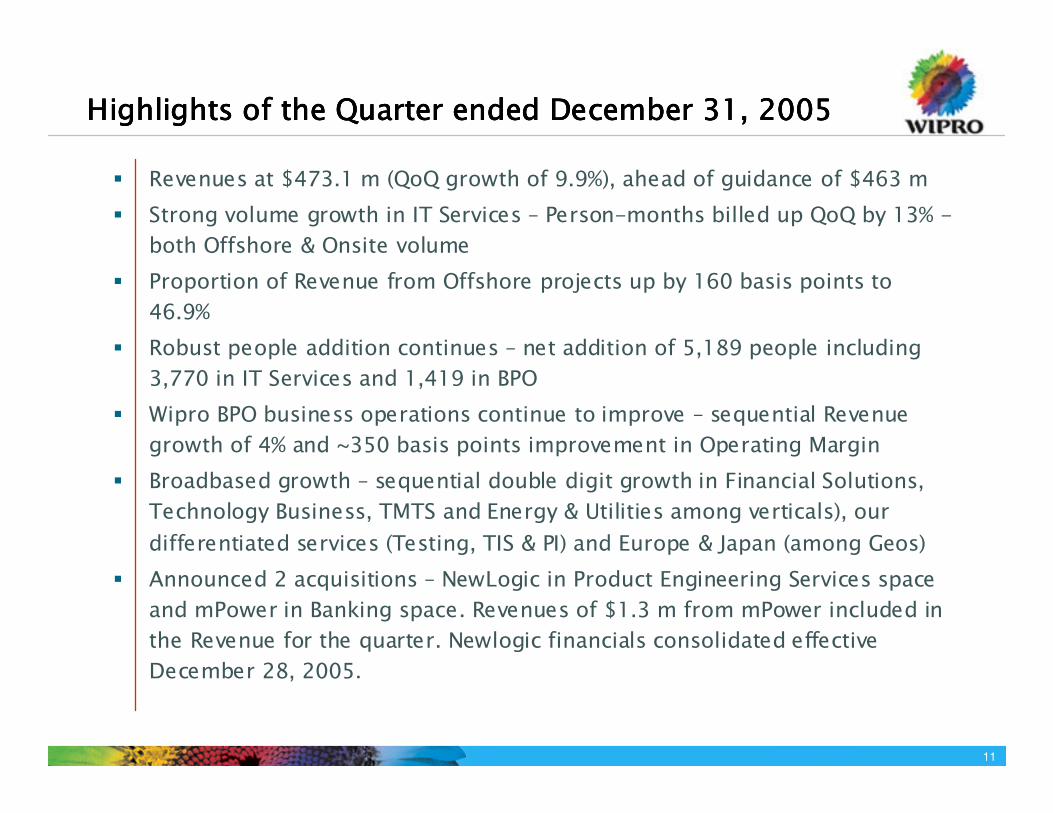
Highlights of the Quarter ended December 31, 2005Highlights of the Quarter ended December 31, 2005Highlights of the Quarter ended December 31, 2005Highlights of the Quarter ended December 31, 2005
� Revenues at $473.1 m (QoQ growth of 9.9%), ahead of guidance of $463 m
� Strong volume growth in IT Services – Person-months billed up QoQ by 13% -
both Offshore & Onsite volume
� Proportion of Revenue from Offshore projects up by 160 basis points to
46.9%
� Robust people addition continues – net addition of 5,189 people including
3,770 in IT Services and 1,419 in BPO
� Wipro BPO business operations continue to improve – sequential Revenue
growth of 4% and ~350 basis points improvement in Operating Margin
� Broadbased growth – sequential double digit growth in Financial Solutions,
Technology Business, TMTS and Energy & Utilities among verticals), our
differentiated services (Testing, TIS & PI) and Europe & Japan (among Geos)
� Announced 2 acquisitions – NewLogic in Product Engineering Services space
and mPower in Banking space. Revenues of $1.3 m from mPower included in
the Revenue for the quarter. Newlogic financials consolidated effective
December 28, 2005.

12Diversified revenue stream with broadDiversified revenue stream with broadDiversified revenue stream with broadDiversified revenue stream with broad----based growthbased growthbased growthbased growth
Strength of Business Model reflected in Strength of Business Model reflected in Strength of Business Model reflected in Strength of Business Model reflected in 3333----Dimensional GrowthDimensional GrowthDimensional GrowthDimensional Growth
45%45%45%45%Technology Infrastructure Technology Infrastructure Technology Infrastructure Technology Infrastructure
ServicesServicesServicesServices
89%89%89%89%Testing & InteropsTesting & InteropsTesting & InteropsTesting & Interops
33%33%33%33%
34%34%34%34%
YOY
Growth rates
ADMADMADMADM
Package ImplementationPackage ImplementationPackage ImplementationPackage Implementation
Service Lines
52%52%52%52%Financial ServicesFinancial ServicesFinancial ServicesFinancial Services
29%29%29%29%
40%40%40%40%
YOY
Growth Rates
Enterprise SolutionsEnterprise SolutionsEnterprise SolutionsEnterprise Solutions
R&D ServicesR&D ServicesR&D ServicesR&D Services
Business Lines
51%51%51%51%EuropeEuropeEuropeEurope
27%27%27%27%JapanJapanJapanJapan
30%30%30%30%
YOY
Growth Rates
North AmericaNorth AmericaNorth AmericaNorth America
Geographies
Growth ratesGrowth ratesGrowth ratesGrowth ratesRevenue MixRevenue MixRevenue MixRevenue Mix
For the Dec quarter 2005-06; IT Services only
Vertical distributionVertical distributionVertical distributionVertical distribution
Geographical distributionGeographical distributionGeographical distributionGeographical distribution
Others
12%
Finance21%
Retail
9%
Telecom
Service
Providers6%
Product
Engg
Services
31%Manufacturi
ng
10%
Energy &
Utilities
11%
Japan4%
Europe33%
North America
62%
ROW1%
13
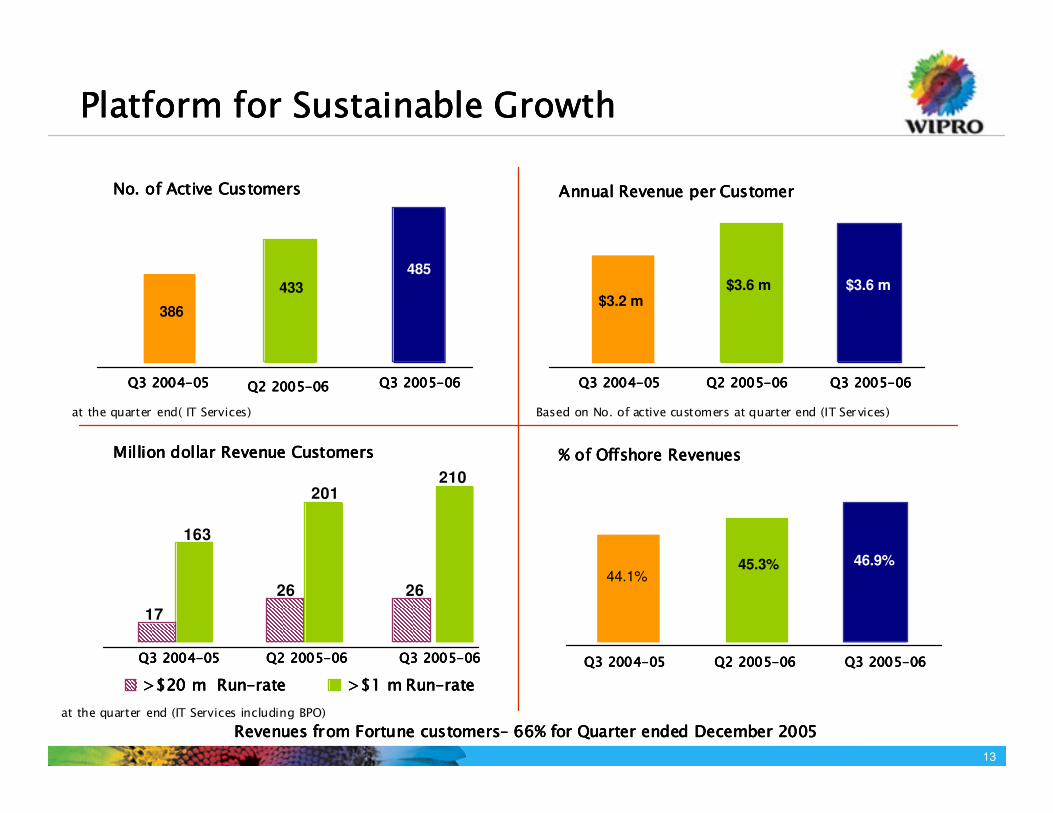
Platform for Sustainable GrowthPlatform for Sustainable GrowthPlatform for Sustainable GrowthPlatform for Sustainable Growth
Million dollar Revenue CustomersMillion dollar Revenue CustomersMillion dollar Revenue CustomersMillion dollar Revenue Customers
Annual Revenue per CustomerAnnual Revenue per CustomerAnnual Revenue per CustomerAnnual Revenue per CustomerNo. of Active CustomersNo. of Active CustomersNo. of Active CustomersNo. of Active Customers
at the quarter end (IT Services including BPO)
Revenues from Fortune customersRevenues from Fortune customersRevenues from Fortune customersRevenues from Fortune customers–––– 66% for Quarter ended December 200566% for Quarter ended December 200566% for Quarter ended December 200566% for Quarter ended December 2005
386
Q3 2004Q3 2004Q3 2004Q3 2004----05050505
17
26
163
201
>$20 m Run>$20 m Run>$20 m Run>$20 m Run----raterateraterate >$1 m Run>$1 m Run>$1 m Run>$1 m Run----raterateraterate
$3.6 m485
433 $3.6 m$3.2 m
26
210
Q2 2005Q2 2005Q2 2005Q2 2005----06060606 Q3 2005Q3 2005Q3 2005Q3 2005----06060606
at the quarter end( IT Services) Based on No. of active customers at quarter end (IT Services)
Q3 2004Q3 2004Q3 2004Q3 2004----05050505 Q2 2005Q2 2005Q2 2005Q2 2005----06060606 Q3 2005Q3 2005Q3 2005Q3 2005----06060606
Q3 2004Q3 2004Q3 2004Q3 2004----05050505 Q2 2005Q2 2005Q2 2005Q2 2005----06060606 Q3 2005Q3 2005Q3 2005Q3 2005----06060606 Q3 2004Q3 2004Q3 2004Q3 2004----05050505 Q2 2005Q2 2005Q2 2005Q2 2005----06060606 Q3 2005Q3 2005Q3 2005Q3 2005----06060606
% of Offshore Revenues% of Offshore Revenues% of Offshore Revenues% of Offshore Revenues
46.9%45.3%44.1%

14
�India emerging as the outsourcing hub for IT & IT enabled services
Outsourcing BoomOutsourcing BoomOutsourcing BoomOutsourcing Boom Engaging work environment
� Increased IT spending in India &
APAC
� Large investment in infrastructure in India
Strong GDP growth Strong GDP growth Strong GDP growth Strong GDP growth
fuelling fuelling fuelling fuelling investmentsinvestmentsinvestmentsinvestments
� Large middle class market of over 250m
� Leading player in the
FMCG industry
Consumer boom Consumer boom Consumer boom Consumer boom
from the mighty from the mighty from the mighty from the mighty Middle ClassMiddle ClassMiddle ClassMiddle Class
�FeatureFeatureFeatureFeature
ThemeThemeThemeTheme
Our businesses Our businesses Our businesses Our businesses –––– the quintessence of Indian themethe quintessence of Indian themethe quintessence of Indian themethe quintessence of Indian theme
Wipro businesses Wipro businesses Wipro businesses Wipro businesses –––– A compelling A compelling A compelling A compelling propositionpropositionpropositionproposition
�Among the top 3 IT Services companies from India
�Widest range of services
� Leader in IT space in India, Middle East & APAC
�No 1 in India in Infrastructure EnggHydraulics
� Leading player in the FMCG industry
�WiproWiproWiproWipro’’’’ssss Unique Unique Unique Unique PositionPositionPositionPosition
�76% of Revenue; 89% of Operating profits
�16% of Revenue; 9% of Operating profits
�5% of Revenue; 4% of
Operating profits�Proportion of Proportion of Proportion of Proportion of WiproWiproWiproWipro’’’’ssssBusinessBusinessBusinessBusiness
15
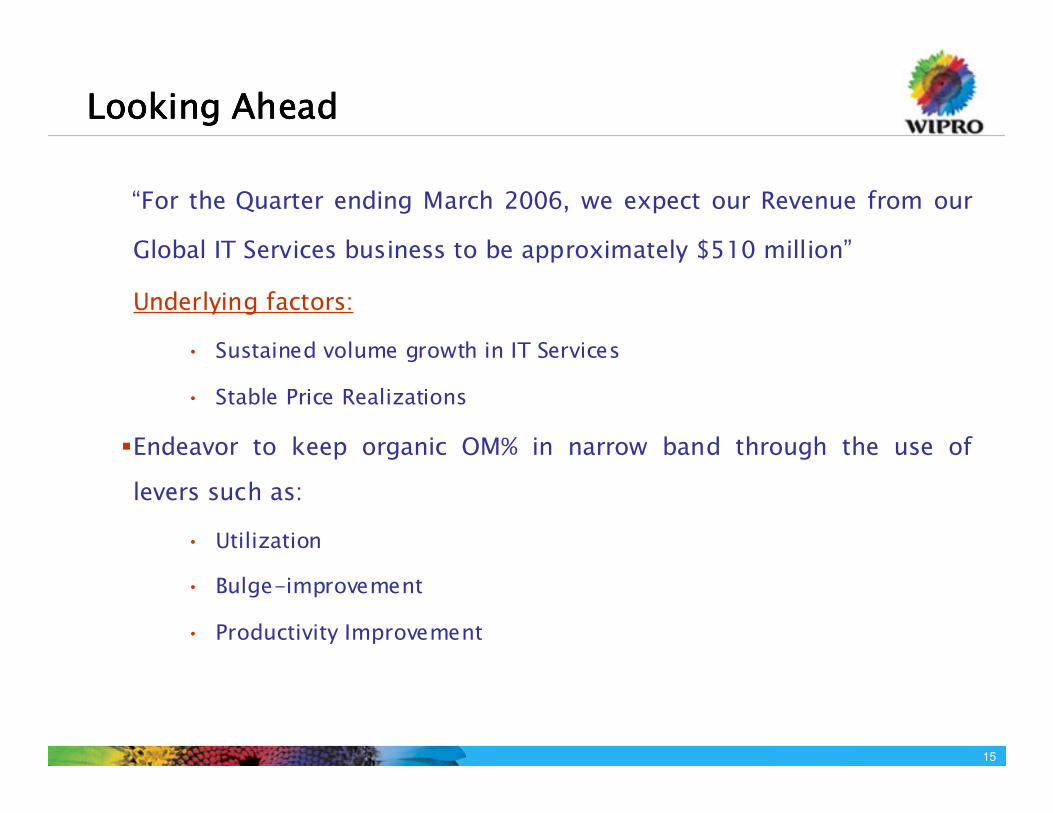
“For the Quarter ending March 2006, we expect our Revenue from our
Global IT Services business to be approximately $510 million”
Underlying factors:
• Sustained volume growth in IT Services
• Stable Price Realizations
�Endeavor to keep organic OM% in narrow band through the use of
levers such as:
• Utilization
• Bulge-improvement
• Productivity Improvement
Looking AheadLooking AheadLooking AheadLooking Ahead

16
IT Enabled IT Enabled IT Enabled IT Enabled
Services / BPOServices / BPOServices / BPOServices / BPO9% 9% 9% 9%
Package Implementation+ TestingPackage Implementation+ TestingPackage Implementation+ TestingPackage Implementation+ Testing
+ Systems Integration + Systems Integration + Systems Integration + Systems Integration 21%21%21%21%
Infrastructure Infrastructure Infrastructure Infrastructure Outsourcing Outsourcing Outsourcing Outsourcing
9% 9% 9% 9%
Consulting Consulting Consulting Consulting 1% 1% 1% 1%
CustomCustomCustomCustomApp Dev & App Dev & App Dev & App Dev &
Maintenance Maintenance Maintenance Maintenance 23% 23% 23% 23%
2.82.82.82.8
6.06.06.06.0
1.01.01.01.0
9.09.09.09.0
5.55.55.55.5
11.411.411.411.4
0.20.20.20.2
0.70.70.70.7
2.52.52.52.5
7.67.67.67.6
Indian Export Indian Export Indian Export Indian Export Potential*Potential*Potential*Potential*
FY05FY05FY05FY05
FY10FY10FY10FY10CAGR 16%CAGR 16%CAGR 16%CAGR 16%
CAGR 28%CAGR 28%CAGR 28%CAGR 28%
CAGR 55%CAGR 55%CAGR 55%CAGR 55%CAGR 25%CAGR 25%CAGR 25%CAGR 25%
CAGR 16%CAGR 16%CAGR 16%CAGR 16%
WiproWiproWiproWipro’’’’s Global IT Revenue pies Global IT Revenue pies Global IT Revenue pies Global IT Revenue pie
5.25.25.25.2
25252525CAGR 37%CAGR 37%CAGR 37%CAGR 37%
R&D Services R&D Services R&D Services R&D Services
37% 37% 37% 37%
Q3 2005Q3 2005Q3 2005Q3 2005----06060606
$473.4 M$473.4 M$473.4 M$473.4 M
TO SUM UPTO SUM UPTO SUM UPTO SUM UP
31,930
$788 M$788 M$788 M$788 M35,402 35,402 35,402 35,402
24,820
WiproWiproWiproWipro’’’’s Global IT Revenue pies Global IT Revenue pies Global IT Revenue pies Global IT Revenue pie
Widest Range of ServicesWidest Range of ServicesWidest Range of ServicesWidest Range of ServicesVerticalVerticalVerticalVertical----wise composition (% of Revenue for Quarter ended Dec 2005)wise composition (% of Revenue for Quarter ended Dec 2005)wise composition (% of Revenue for Quarter ended Dec 2005)wise composition (% of Revenue for Quarter ended Dec 2005)
Diversified Vertical ExpertiseDiversified Vertical ExpertiseDiversified Vertical ExpertiseDiversified Vertical Expertise
Strong Customer RelationshipsStrong Customer RelationshipsStrong Customer RelationshipsStrong Customer RelationshipsAverage annualized Revenue per CustomerAverage annualized Revenue per CustomerAverage annualized Revenue per CustomerAverage annualized Revenue per Customer
Strong Financial PositionStrong Financial PositionStrong Financial PositionStrong Financial Position
Cash & Cash equivalents (Rs M)Cash & Cash equivalents (Rs M)Cash & Cash equivalents (Rs M)Cash & Cash equivalents (Rs M)
$3.6 m$3.6 m$3.6 m$3.6 m$3.6 m
$3.2 m
Based on No. of active customers
at Quarter ending Dec 05
Q3 2004Q3 2004Q3 2004Q3 2004----05050505 Q2 2005Q2 2005Q2 2005Q2 2005----06060606 Q3 2005Q3 2005Q3 2005Q3 2005----06060606Q3 2004Q3 2004Q3 2004Q3 2004----05050505 Q2 2005Q2 2005Q2 2005Q2 2005----06060606 Q3 2005Q3 2005Q3 2005Q3 2005----06060606
Energy &
Utilitie
11%
Manufacturi
ng
10%
Others
12%Product
Engg
Services
31%
Telecom
Service Providers
6% Retail
9% Finance
21%
For IT Services at the quarter end (Wipro Ltd consolidated)

© Copyright 2005 Wipro Technologies Wipro confidential 17
Building the Next Wipro- A Strategic Perspective
Presentation at Analyst Interaction Session
NYSE, New York
8, February 2006
Sanjay Joshi
Chief Executive - Consulting

18
Wipro Wipro Wipro Wipro –––– The First Sixty YearsThe First Sixty YearsThe First Sixty YearsThe First Sixty Years
Wipro - Track Record of Sustained Innovation
Wipro Limited 1945-2005
0
10,000
20,000
30,000
40,000
50,000
60,000
194
6-4
7
194
8-4
9
195
0-5
1
195
2-5
3
195
4-5
5
195
6-5
7
195
8-5
9
196
0-6
1
196
2-6
3
196
4-6
5
196
6-6
7
196
8-6
9
197
0-7
1
197
2-7
3
197
4-7
5
197
6-7
7
197
8-7
9
198
0-8
1
198
2-8
3
198
4-8
5
198
6-8
7
198
8-8
9
199
0-9
1
199
2-9
3
199
4-9
5
199
6-9
7
199
8-9
9
200
0-0
1
200
2-0
3
200
4-0
5
IT Products IT services
Revenue
Net Income
Rs
. M
Our Track Record
�Consistent growth rate - CAGR* over 60 years of:
�Revenue: 21%
�Net Income: 31%
�Market Cap: 24%
Data for fiscal years ended March 31
* - Compounded Annual Growth Rate
Our history
� Incorporated in 1945; only IPO in 1946
�Diversification into IT in 1980s
�Entered IT Services business in 1991-92
� Listed on NYSE in 2000
$1865 M
$363 M
19
512
23
35
20
45
2025
35
5.2
0.9
2001 2005 2010"Sustaining
Leadership"
AdditionalPotential
"ExtendingLeadership"
Emerging Market OpportunityEmerging Market OpportunityEmerging Market OpportunityEmerging Market Opportunity
Industry Play Projected to Continue Strong Growth Rate
India’s offshore IT and BPO exports, US $ Bn.
Offshore IT
BPO
CAGR 28%
•India’s Offshore IT and BPO industries can achieve US $ 60 Bn. in exports by 2010 if they sustain
their current leadership.
•These industries could also aspire for an even bigger prize in the next five to ten years: an additional
$ 20 Bn. in exports by extending leadership through a targeted expansion of the Offshore market.
6.2
17.2
CAGR 29%
~60
~80Projected CAGR
2005-2010
> 24%
> 37%
Source: NASSCOM McKinsey report Dec 2005

20
Our Global IT Business TodayOur Global IT Business TodayOur Global IT Business TodayOur Global IT Business Today
Partner to industry leaders Partner to industry leaders Partner to industry leaders Partner to industry leaders and challengersand challengersand challengersand challengers
�66% of revenue from Global 500/66% of revenue from Global 500/66% of revenue from Global 500/66% of revenue from Global 500/
Fortune 1000 clientsFortune 1000 clientsFortune 1000 clientsFortune 1000 clients
Global footprintGlobal footprintGlobal footprintGlobal footprint
�Listed on NYSEListed on NYSEListed on NYSEListed on NYSE
�35 countries35 countries35 countries35 countries
�>7500 employees onsite across geos >7500 employees onsite across geos >7500 employees onsite across geos >7500 employees onsite across geos
�14 near shore development centers14 near shore development centers14 near shore development centers14 near shore development centers
Diverse talent poolDiverse talent poolDiverse talent poolDiverse talent pool
�31 nationalities31 nationalities31 nationalities31 nationalities
�>2900 domain consultants>2900 domain consultants>2900 domain consultants>2900 domain consultants
Sustained growthSustained growthSustained growthSustained growth
�CAGR of 42% in last 5 yearsCAGR of 42% in last 5 yearsCAGR of 42% in last 5 yearsCAGR of 42% in last 5 years
�Part of NYSEPart of NYSEPart of NYSEPart of NYSE’’’’s TMT (Technologys TMT (Technologys TMT (Technologys TMT (Technology----MediaMediaMediaMedia----Telecom) Index, NSE Nifty Index Telecom) Index, NSE Nifty Index Telecom) Index, NSE Nifty Index Telecom) Index, NSE Nifty Index and BSE Sensexand BSE Sensexand BSE Sensexand BSE Sensex
2000200020002000----01010101 2001200120012001----02020202 2002200220022002----03030303 2003200320032003----04040404 2004200420042004----05050505 2005200520052005----06060606
22 2628
3440 40
217 226288
339421
485
10 13 19 2942
51
(thousands)
(millions USD)
384 475 625934
1354
1813*
GlobalGlobalGlobalGlobaldevelopmentdevelopmentdevelopmentdevelopmentcenterscenterscenterscenters
ClientsClientsClientsClients
EmployeesEmployeesEmployeesEmployees
RevenuesRevenuesRevenuesRevenues
*Actuals up to Q3 05-6+Q4 Guidance
Wipro Global IT Business - Track Record of Consistent Growth

21
1. Drive Higher Growth in Revenues and Profits.
2. Leverage Adjacent Growth Opportunities to Drive Incremental Growth.
3. Transform Wipro into a Truly Global Organization.
4. Create an Exciting Growth Organization for Wiproites.
Strategic Imperatives for WiproStrategic Imperatives for WiproStrategic Imperatives for WiproStrategic Imperatives for Wipro
Seize Opportunities to Build the Next Generation Wipro
22
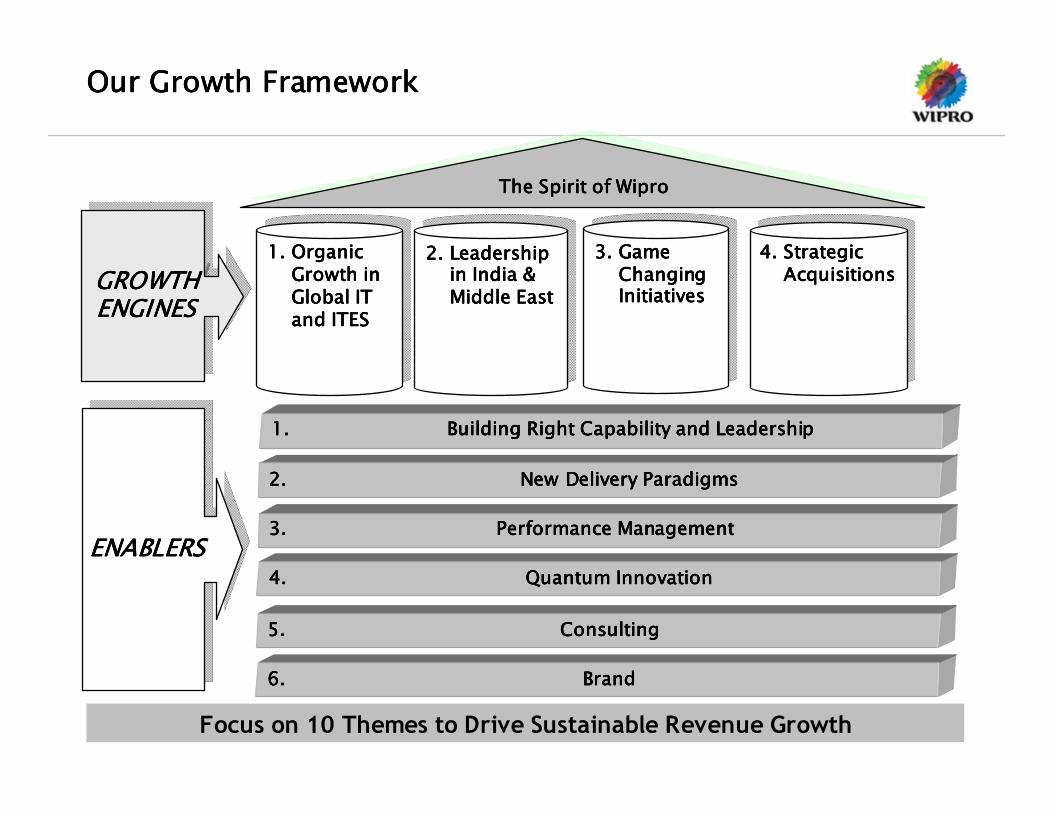
Our Growth FrameworkOur Growth FrameworkOur Growth FrameworkOur Growth Framework
1.1.1.1. Organic Organic Organic Organic Growth in Growth in Growth in Growth in Global IT Global IT Global IT Global IT and ITESand ITESand ITESand ITES
1.1.1.1.1.1.1.1. Organic Organic Organic Organic Organic Organic Organic Organic Growth in Growth in Growth in Growth in Growth in Growth in Growth in Growth in Global IT Global IT Global IT Global IT Global IT Global IT Global IT Global IT and ITESand ITESand ITESand ITESand ITESand ITESand ITESand ITES
2.2.2.2. Leadership Leadership Leadership Leadership in India & in India & in India & in India & Middle EastMiddle EastMiddle EastMiddle East
2.2.2.2.2.2.2.2. Leadership Leadership Leadership Leadership Leadership Leadership Leadership Leadership in India & in India & in India & in India & in India & in India & in India & in India & Middle EastMiddle EastMiddle EastMiddle EastMiddle EastMiddle EastMiddle EastMiddle East
3.3.3.3. Game Game Game Game Changing Changing Changing Changing InitiativesInitiativesInitiativesInitiatives
3.3.3.3.3.3.3.3. Game Game Game Game Game Game Game Game Changing Changing Changing Changing Changing Changing Changing Changing InitiativesInitiativesInitiativesInitiativesInitiativesInitiativesInitiativesInitiatives
4.4.4.4. Strategic Strategic Strategic Strategic AcquisitionsAcquisitionsAcquisitionsAcquisitions
4.4.4.4.4.4.4.4. Strategic Strategic Strategic Strategic Strategic Strategic Strategic Strategic AcquisitionsAcquisitionsAcquisitionsAcquisitionsAcquisitionsAcquisitionsAcquisitionsAcquisitions
The Spirit of WiproThe Spirit of WiproThe Spirit of WiproThe Spirit of WiproThe Spirit of WiproThe Spirit of WiproThe Spirit of WiproThe Spirit of Wipro
ENABLERSENABLERSENABLERSENABLERSENABLERSENABLERSENABLERSENABLERSENABLERSENABLERSENABLERSENABLERS
GROWTH GROWTH GROWTH GROWTH ENGINESENGINESENGINESENGINESGROWTH GROWTH GROWTH GROWTH GROWTH GROWTH GROWTH GROWTH ENGINESENGINESENGINESENGINESENGINESENGINESENGINESENGINES
1.1.1.1. Building Right Capability and LeadershipBuilding Right Capability and LeadershipBuilding Right Capability and LeadershipBuilding Right Capability and Leadership
2.2.2.2. New Delivery ParadigmsNew Delivery ParadigmsNew Delivery ParadigmsNew Delivery Paradigms
3.3.3.3. Performance ManagementPerformance ManagementPerformance ManagementPerformance Management
6.6.6.6. BrandBrandBrandBrand
4.4.4.4. Quantum InnovationQuantum InnovationQuantum InnovationQuantum Innovation
5.5.5.5. ConsultingConsultingConsultingConsulting
Focus on 10 Themes to Drive Sustainable Revenue Growth

23
Growth Engine #1 Growth Engine #1 Growth Engine #1 Growth Engine #1 ---- Organic Growth in Global IT & ITESOrganic Growth in Global IT & ITESOrganic Growth in Global IT & ITESOrganic Growth in Global IT & ITES
Improve Penetration at Global and Major AccountsImprove Penetration at Global and Major AccountsImprove Penetration at Global and Major AccountsImprove Penetration at Global and Major Accounts
1. Identify and systematically drive higher growth in our top 100 accounts.
2. Ensure appropriate resource alignment.
3. Go beyond conventional IT budgets.
Action 1
Action 2Accelerate Opening of Identified Strategic Target AccountsAccelerate Opening of Identified Strategic Target AccountsAccelerate Opening of Identified Strategic Target AccountsAccelerate Opening of Identified Strategic Target Accounts
1. Lower account mortality and achieve better utilization of available resources through better choice of accounts.
2. Qualify accounts based on IT and budget; outsourcing experience and offshoring history and competitive landscape.
Increase Focus on New Geographies and VerticalsIncrease Focus on New Geographies and VerticalsIncrease Focus on New Geographies and VerticalsIncrease Focus on New Geographies and Verticals
1. Continue focus on new Geographies and Verticals to be addressed.
2. Bring in dedicated leader, create dedicated Sales team for each Geo along with exclusive pre-sales support, create local teams and near-shore centres as necessary.
Action 4
Action 5Realize the Potential of the BPO Growth EngineRealize the Potential of the BPO Growth EngineRealize the Potential of the BPO Growth EngineRealize the Potential of the BPO Growth Engine
1. Create solutions in high potential areas.
2. Establish new Delivery Centres.
3. Define new go-to-market approach.
Drive Higher Organic Growth through Executing these Specific Action Steps
Turbo Charge High Growth BusinessesTurbo Charge High Growth BusinessesTurbo Charge High Growth BusinessesTurbo Charge High Growth Businesses1. Identify, invest-in and accelerate all high growth areas of business
2. Create a dashboard of all high growth areas. Ensure that these growth clusters get high mind-share and investment.
Action 3

24
Growth Engine #2Growth Engine #2Growth Engine #2Growth Engine #2---- Leadership in India & MiddleLeadership in India & MiddleLeadership in India & MiddleLeadership in India & Middle----East East East East
ConsultingVertical KPI based offering
SolutionsTemplates / Point Solutions
ServicesNon linear model; De-skilling resource requirement
Enterprise Products
Best of breed technologies
Wipro PC
Optimize product / customer mix
TOSBuild scale and expertise to increase wins
1.Alliance with best in class companies in tech, portfolios, tools and applications.
1.Thought Leadership
2.Leverage global case studies.
3.Relationship programs
1.BFSI
2.Enterprise
3.Govt.
4.Telecom
5. IT & ITES
1. Local Accounts
2. MNC Accounts
3. Global Accounts –collaborate with WT
1. Indirect Sales
2. Lead with Solution Templates
1. Penetrate key accounts through all service lines
Strategic Alliances
MarketingVertical Strategy
International Geographies
SMB Strategy (India)
Enterprise
Strategy
GOAL
Leadership position in Geos that we address
Integrated Multi LOB Delivery & Program Governance
Focus Areas
1.Consulting, Application & Technology Integration & Management.
2.Grow Enterprise Platforms, Networking, Services Revenues.
Maintain Leadership in India and Build Leadership Position in other Geo’s

25
Growth Engine #3 Growth Engine #3 Growth Engine #3 Growth Engine #3 –––– Game Changing InitiativesGame Changing InitiativesGame Changing InitiativesGame Changing Initiatives
Dedicated Focus on Large DealsDedicated Focus on Large DealsDedicated Focus on Large DealsDedicated Focus on Large Deals
1. Invest in stronger, focused Large Deal teams within Service lines.
2. Separate Leadership and Team to focus on Large Deals.
Action 1
Continue Incubating New ServicesContinue Incubating New ServicesContinue Incubating New ServicesContinue Incubating New Services
1. Integrated Application Management + TIS + BPO
2. Process Consulting Services through Business Solutions Group
3. Testing Point Solutions & Frameworks
Action 2
Action 3Strengthen Alliance initiative to better leverage Alliances Led Strengthen Alliance initiative to better leverage Alliances Led Strengthen Alliance initiative to better leverage Alliances Led Strengthen Alliance initiative to better leverage Alliances Led RevenueRevenueRevenueRevenue
1. Strengthen dedicated Alliance team. This Alliance team will
a. Work with a dedicated and leveraged headcount.
b. Focus on Strategic Alliances that span Verticals and Service Lines.
c. Create a federated model of Alliances management that will be followed by
Business Units and Service Lines.
d. Work to create differentiated value proposition with partner.
e. Create and review joint pipelines with each partner.
2. Alliance Initiatives in Practices
Game Changing Initiatives to Supplement Not Substitute Organic Growth
26
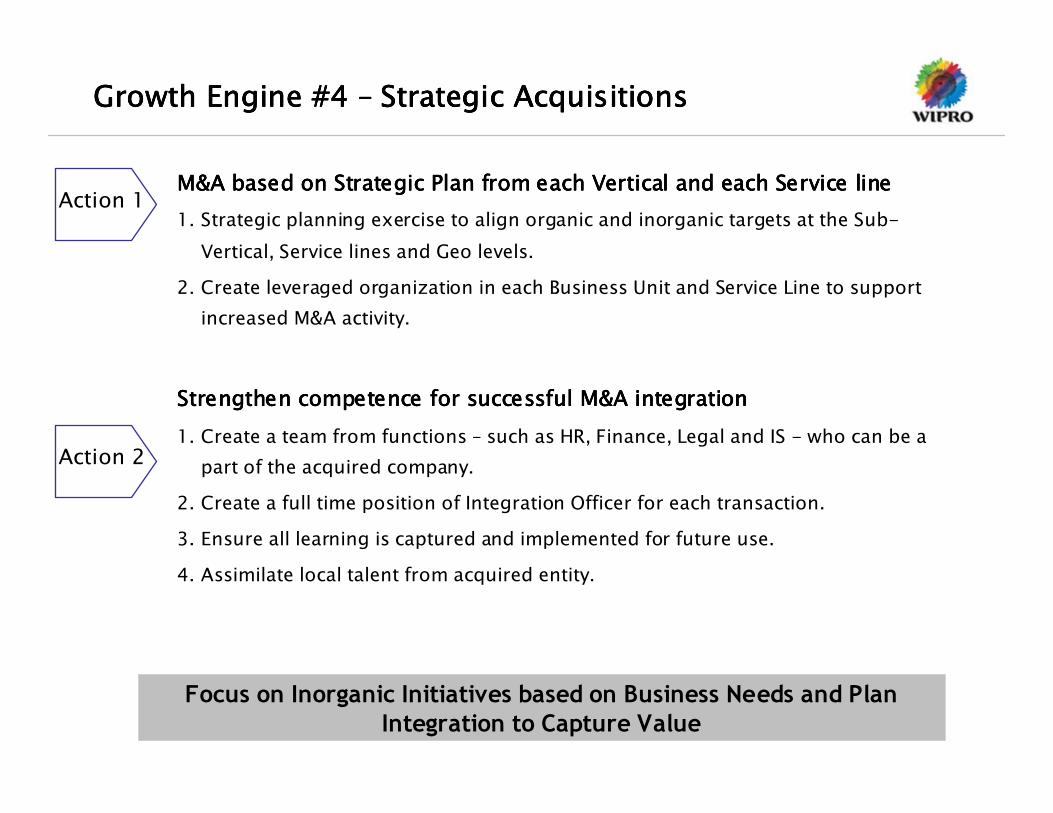
M&A based on Strategic Plan from each Vertical and each Service M&A based on Strategic Plan from each Vertical and each Service M&A based on Strategic Plan from each Vertical and each Service M&A based on Strategic Plan from each Vertical and each Service linelinelineline
1. Strategic planning exercise to align organic and inorganic targets at the Sub-
Vertical, Service lines and Geo levels.
2. Create leveraged organization in each Business Unit and Service Line to support
increased M&A activity.
Strengthen competence for successful M&A integrationStrengthen competence for successful M&A integrationStrengthen competence for successful M&A integrationStrengthen competence for successful M&A integration
1. Create a team from functions – such as HR, Finance, Legal and IS - who can be a
part of the acquired company.
2. Create a full time position of Integration Officer for each transaction.
3. Ensure all learning is captured and implemented for future use.
4. Assimilate local talent from acquired entity.
Growth Engine #4 Growth Engine #4 Growth Engine #4 Growth Engine #4 –––– Strategic AcquisitionsStrategic AcquisitionsStrategic AcquisitionsStrategic Acquisitions
Action 1
Action 2
Focus on Inorganic Initiatives based on Business Needs and Plan
Integration to Capture Value
27
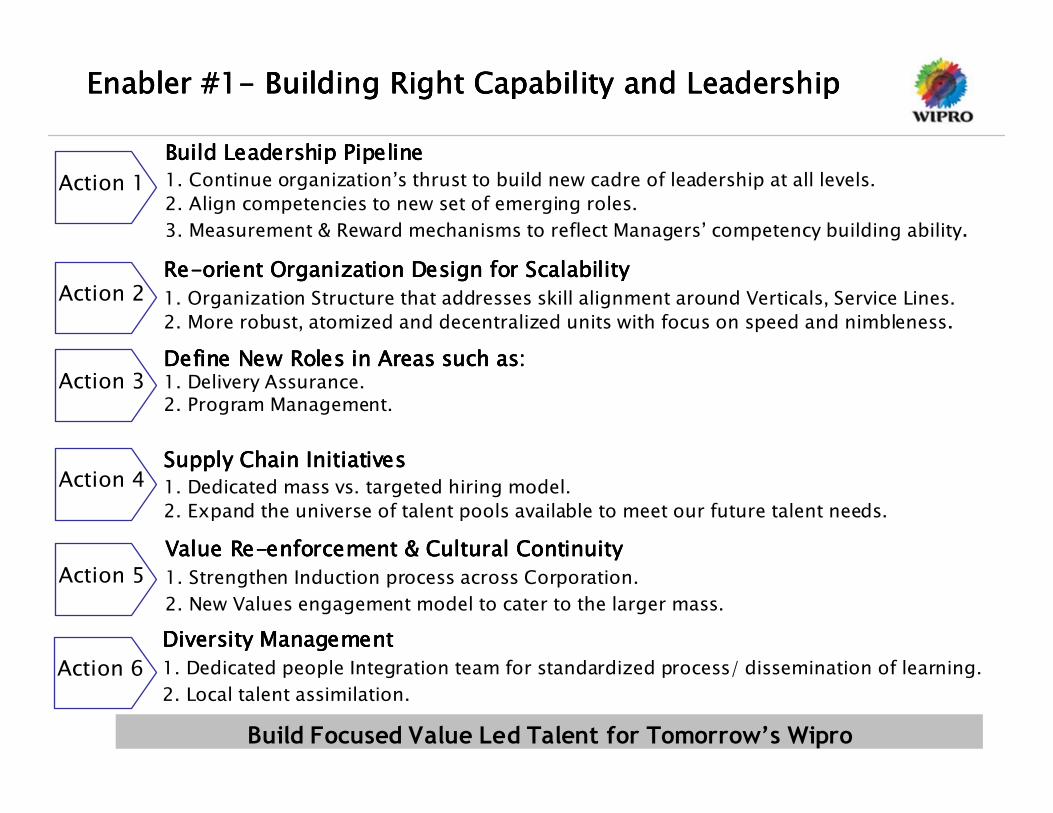
Enabler #1Enabler #1Enabler #1Enabler #1---- Building Right Capability and Leadership Building Right Capability and Leadership Building Right Capability and Leadership Building Right Capability and Leadership
ReReReRe----orient Organization Design for Scalabilityorient Organization Design for Scalabilityorient Organization Design for Scalabilityorient Organization Design for Scalability
1. Organization Structure that addresses skill alignment around Verticals, Service Lines.
2. More robust, atomized and decentralized units with focus on speed and nimbleness.
Action 2
Define New Roles in Areas such as:Define New Roles in Areas such as:Define New Roles in Areas such as:Define New Roles in Areas such as:1. Delivery Assurance.2. Program Management.
Action 3
Supply Chain InitiativesSupply Chain InitiativesSupply Chain InitiativesSupply Chain Initiatives
1. Dedicated mass vs. targeted hiring model.
2. Expand the universe of talent pools available to meet our future talent needs.
Action 4
Value ReValue ReValue ReValue Re----enforcement & Cultural Continuityenforcement & Cultural Continuityenforcement & Cultural Continuityenforcement & Cultural Continuity
1. Strengthen Induction process across Corporation.
2. New Values engagement model to cater to the larger mass.
Action 5
Diversity ManagementDiversity ManagementDiversity ManagementDiversity Management
1. Dedicated people Integration team for standardized process/ dissemination of learning.
2. Local talent assimilation.
Action 6
Build Focused Value Led Talent for Tomorrow’s Wipro
Build Leadership PipelineBuild Leadership PipelineBuild Leadership PipelineBuild Leadership Pipeline
1. Continue organization’s thrust to build new cadre of leadership at all levels.
2. Align competencies to new set of emerging roles.
3. Measurement & Reward mechanisms to reflect Managers’ competency building ability.
Action 1

28
Enabler #2 Enabler #2 Enabler #2 Enabler #2 ---- New Delivery ParadigmsNew Delivery ParadigmsNew Delivery ParadigmsNew Delivery Paradigms
Action 2
True Global DeliveryTrue Global DeliveryTrue Global DeliveryTrue Global Delivery
1. Global Delivery strategy is key for customers:
a. Global roll outs.
b. Follow the sun model.
c. Disaster Recovery.
2. Resource Diversity will be an additional advantage for customers seeking geo de-risking.
3. Enhance capabilities for multi-lingual skill based delivery.
Action 1
Challenge Established Delivery Models to Create New Models for Optimized Delivery
Standardize Delivery for ITStandardize Delivery for ITStandardize Delivery for ITStandardize Delivery for IT
1. Drive Economies of Scale in infrastructure and processes without diluting customer security issues.
2. Build a robust factory model to achieve efficiencies by standardizing IT solutions and processes.
3. Leverage LEAN principles to increase process productivity and throughput, and decrease cycle time.
4. Stay ahead on the Quality curve.
29
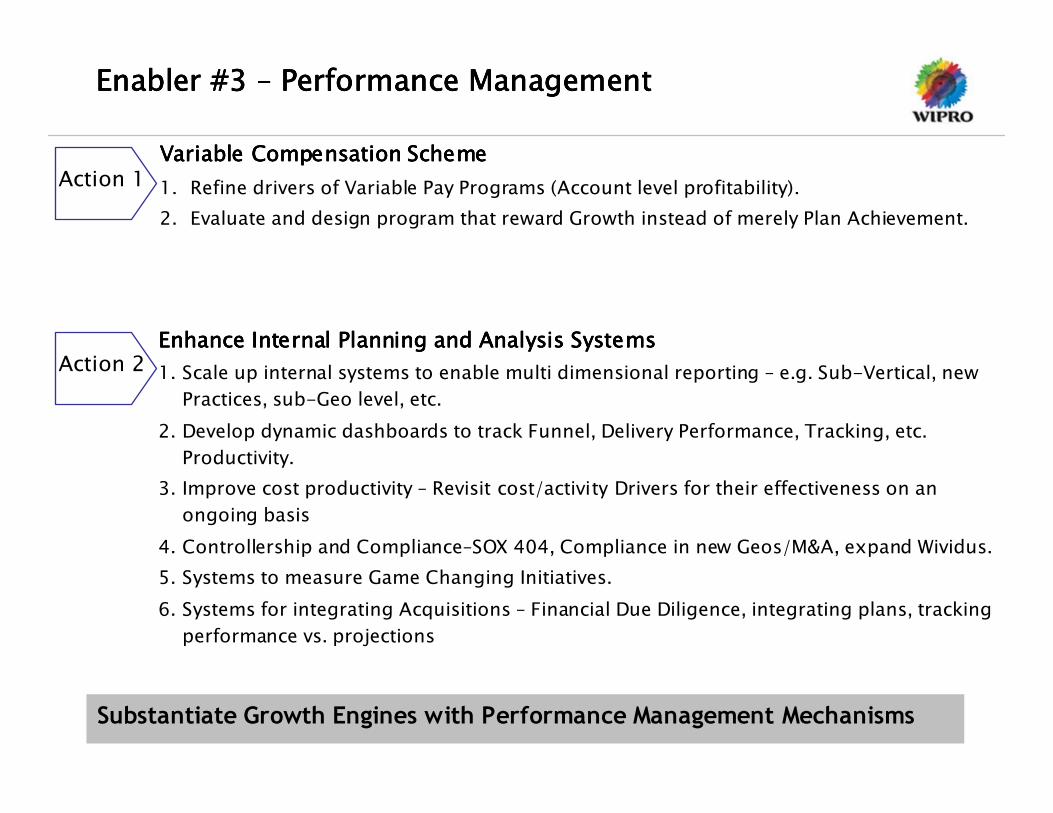
Enabler #3 Enabler #3 Enabler #3 Enabler #3 –––– Performance ManagementPerformance ManagementPerformance ManagementPerformance Management
Action 2
Action 1
Substantiate Growth Engines with Performance Management Mechanisms
Variable Compensation SchemeVariable Compensation SchemeVariable Compensation SchemeVariable Compensation Scheme
1. Refine drivers of Variable Pay Programs (Account level profitability).
2. Evaluate and design program that reward Growth instead of merely Plan Achievement.
Enhance Internal Planning and Analysis SystemsEnhance Internal Planning and Analysis SystemsEnhance Internal Planning and Analysis SystemsEnhance Internal Planning and Analysis Systems
1. Scale up internal systems to enable multi dimensional reporting – e.g. Sub-Vertical, new
Practices, sub-Geo level, etc.
2. Develop dynamic dashboards to track Funnel, Delivery Performance, Tracking, etc.
Productivity.
3. Improve cost productivity – Revisit cost/activity Drivers for their effectiveness on an
ongoing basis
4. Controllership and Compliance–SOX 404, Compliance in new Geos/M&A, expand Wividus.
5. Systems to measure Game Changing Initiatives.
6. Systems for integrating Acquisitions – Financial Due Diligence, integrating plans, tracking
performance vs. projections
30
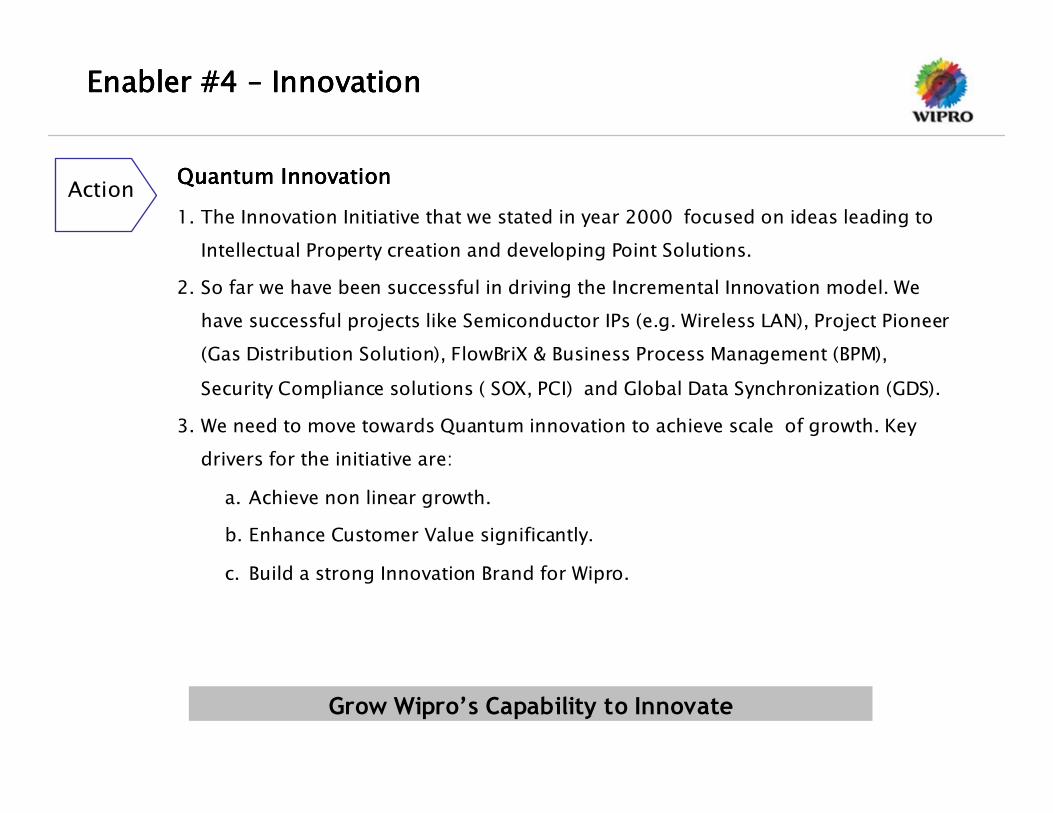
Enabler #4 Enabler #4 Enabler #4 Enabler #4 –––– InnovationInnovationInnovationInnovation
Quantum InnovationQuantum InnovationQuantum InnovationQuantum Innovation
1. The Innovation Initiative that we stated in year 2000 focused on ideas leading to
Intellectual Property creation and developing Point Solutions.
2. So far we have been successful in driving the Incremental Innovation model. We
have successful projects like Semiconductor IPs (e.g. Wireless LAN), Project Pioneer
(Gas Distribution Solution), FlowBriX & Business Process Management (BPM),
Security Compliance solutions ( SOX, PCI) and Global Data Synchronization (GDS).
3. We need to move towards Quantum innovation to achieve scale of growth. Key
drivers for the initiative are:
a. Achieve non linear growth.
b. Enhance Customer Value significantly.
c. Build a strong Innovation Brand for Wipro.
Action
Grow Wipro’s Capability to Innovate

31
Enabler #5 Enabler #5 Enabler #5 Enabler #5 –––– ConsultingConsultingConsultingConsulting
Action
Enhance Wipro from an Outsourcing Partner to a Problem Solver with
Outsourcing Capability
Consulting As A Core Enabler for WiproConsulting As A Core Enabler for WiproConsulting As A Core Enabler for WiproConsulting As A Core Enabler for Wipro----Wide Impact: Wide Impact: Wide Impact: Wide Impact:
1. Drive Consulting as a High Growth Business.
2. Leverage Consulting As A Deal Winner in Game Changing Deals.
3. Deploy Consulting as an “Account Penetrator”– For GAMA accounts, Consulting can
be a critical element in enhancing account footprint.
4. Project the powers of the consulting capabilities (“Capability Integrator”) across
Wipro more effectively by better linking diverse consultants and their content
expertise/ knowledge.
5. Orient Consulting as a home for top “specialist” talent - Consulting as a career
path and as a recruiting value prop for key client-facing talent (“Talent attractor”).

32
Enabler #6 Enabler #6 Enabler #6 Enabler #6 –––– BrandBrandBrandBrand
Strong Wipro Brand to Deliver Higher Stakeholder Benefits
Focused Initiatives to Enhance Wipro BrandFocused Initiatives to Enhance Wipro BrandFocused Initiatives to Enhance Wipro BrandFocused Initiatives to Enhance Wipro Brand
Org-wide effort to become # 1 across parameters such as:
a. Best Employer.
b. Customer Favorability.
c. Corporate Governance.
Action 1
Thought Leadership.Investors and Financial AnalystsE
Increase Understanding to Drive Positive Referrals.Industry AnalystsD
Best in Class Alliances.PartnersC
Employer of Choice Globally.EmployeesB
Comfort and Reference ability.CustomersA
Value from a Wipro BrandValue from a Wipro BrandValue from a Wipro BrandValue from a Wipro BrandStakeholdersStakeholdersStakeholdersStakeholders
Action 2
Build out the Applying Thought ThemeBuild out the Applying Thought ThemeBuild out the Applying Thought ThemeBuild out the Applying Thought Theme
a. Focus on customer relationships.
b. Strengthen relationships with analysts.
c. Thought leadership as the vehicle for differentiation.
d. Increase visibility through presence at marquee events.
e. Make the brand more accessible.

33
Transformation Transformation Transformation Transformation –––– Global IT Services LeaderGlobal IT Services LeaderGlobal IT Services LeaderGlobal IT Services Leader
FROM (Now)FROM (Now)FROM (Now)FROM (Now) TO (Future)TO (Future)TO (Future)TO (Future)
Large Indian Player
Limited Global Footprint
India Centric Competitive Set
Cost Centric Value Proposition
Large Global Services Player
Expanded Global Footprint
Truly Global Competitive Set
Domain Centric Cost Effective Solutions
Organic Growth Organic AND Inorganic Growth
Mostly Application Outsourcing Application, Infra, BPO and Total Outsourcing
Predominantly Implementation Entire Lifecycle Execution
Thank You

© Copyright 2006 Wipro Ltd Wi pro confi dential
G K Prasanna
Senior Vice President
Technology Infrastructure Services
Investor Briefing
February 2006
35
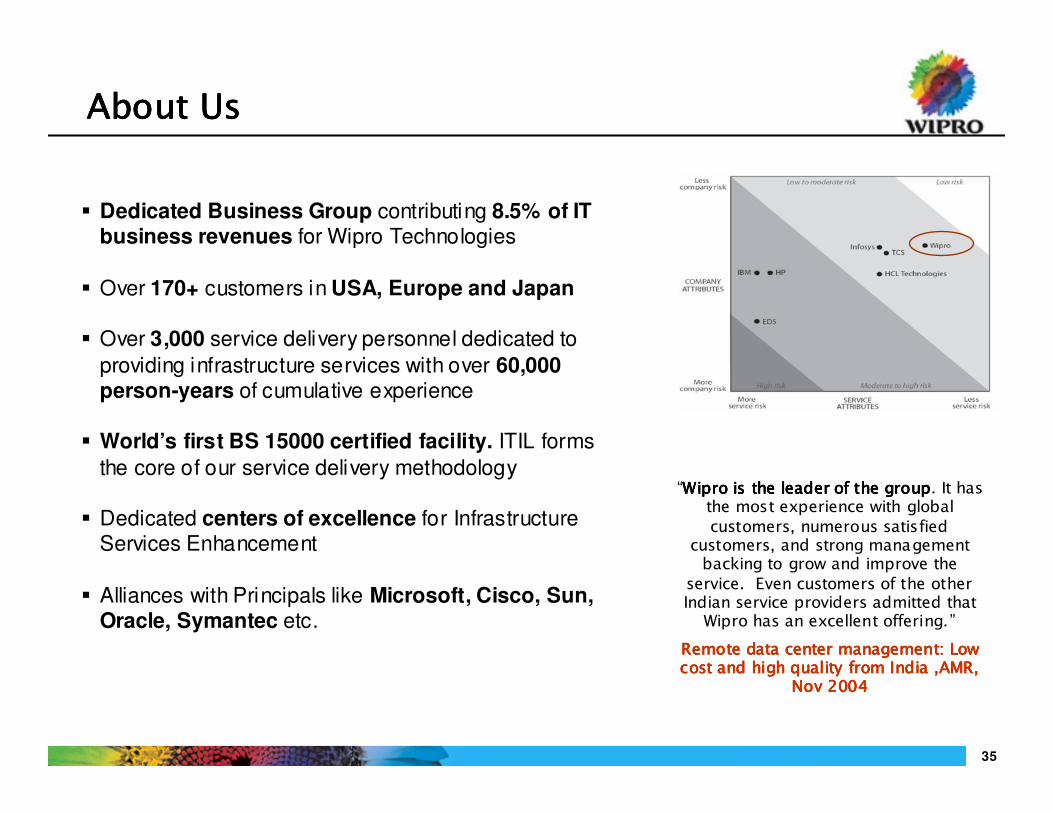
“Wipro is the leader of the groupWipro is the leader of the groupWipro is the leader of the groupWipro is the leader of the group. It has the most experience with global
customers, numerous satisfied customers, and strong management backing to grow and improve the
service. Even customers of the other Indian service providers admitted that Wipro has an excellent offering.”
Remote data center management: Low Remote data center management: Low Remote data center management: Low Remote data center management: Low cost and high quality from India ,AMR, cost and high quality from India ,AMR, cost and high quality from India ,AMR, cost and high quality from India ,AMR,
Nov 2004Nov 2004Nov 2004Nov 2004
� Dedicated Business Group contributing 8.5% of IT business revenues for Wipro Technologies
� Over 170+ customers in USA, Europe and Japan
� Over 3,000 service delivery personnel dedicated to
providing infrastructure services with over 60,000 person-years of cumulative experience
� World’s first BS 15000 certified facility. ITIL forms
the core of our service delivery methodology
� Dedicated centers of excellence for Infrastructure Services Enhancement
� Alliances with Principals like Microsoft, Cisco, Sun, Oracle, Symantec etc.
About UsAbout UsAbout UsAbout Us
36
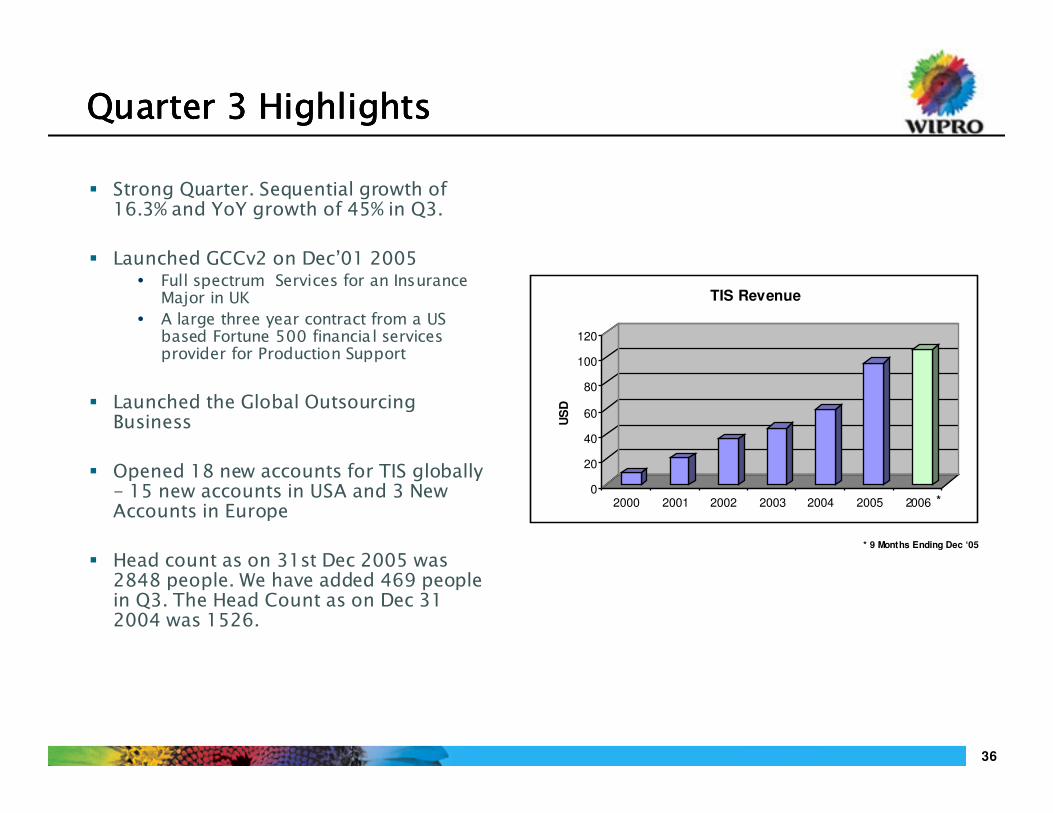
Quarter 3 HighlightsQuarter 3 HighlightsQuarter 3 HighlightsQuarter 3 Highlights
� Strong Quarter. Sequential growth of 16.3% and YoY growth of 45% in Q3.
� Launched GCCv2 on Dec’01 2005� Full spectrum Services for an Insurance Major in UK
� A large three year contract from a US based Fortune 500 financial services provider for Production Support
� Launched the Global Outsourcing Business
� Opened 18 new accounts for TIS globally - 15 new accounts in USA and 3 New Accounts in Europe
� Head count as on 31st Dec 2005 was 2848 people. We have added 469 people in Q3. The Head Count as on Dec 31 2004 was 1526.
0
20
40
60
80
100
120
US
D
2000 2001 2002 2003 2004 2005 2006
TIS Revenue
* 9 Months Ending Dec ‘05
*
37
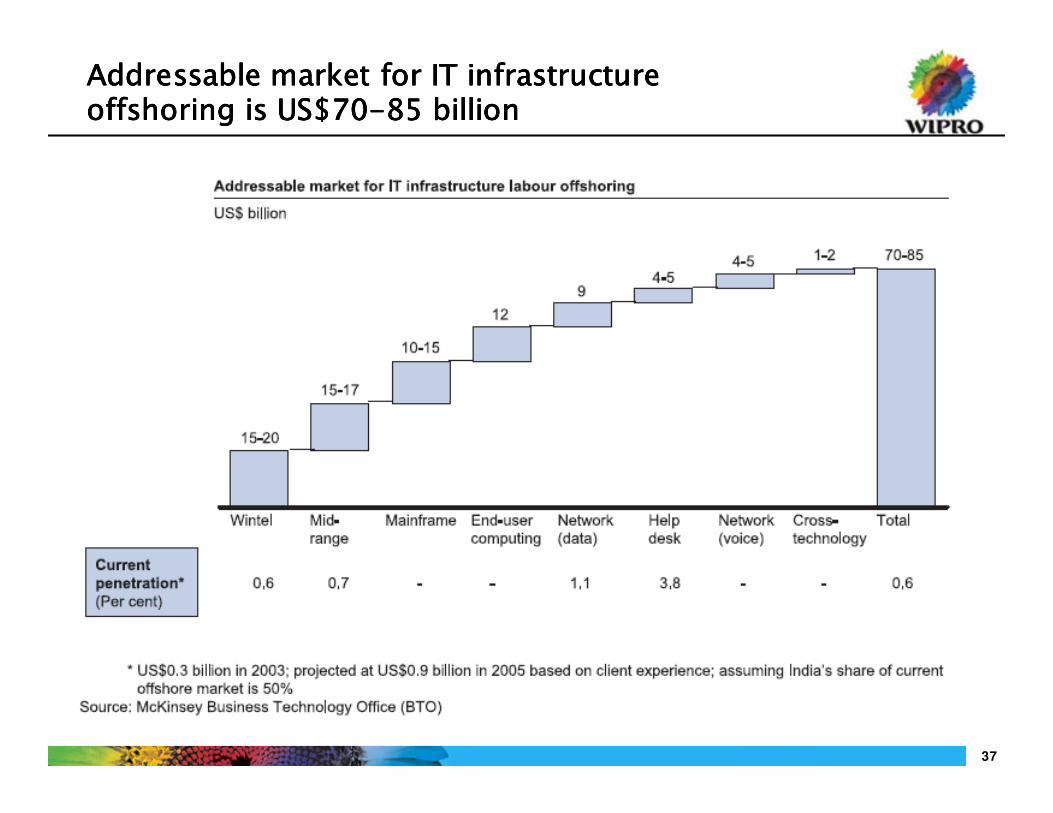
Addressable market for IT infrastructureAddressable market for IT infrastructureAddressable market for IT infrastructureAddressable market for IT infrastructureoffshoring is US$70offshoring is US$70offshoring is US$70offshoring is US$70----85 billion85 billion85 billion85 billion
© 2002 Cap Gemini Ernst & Young - All rights reserved 032104_S_CURVE_PMPOSE_V6.PPTCONFIDENTIAL© C opyright 2006 Wipro Ltd 38
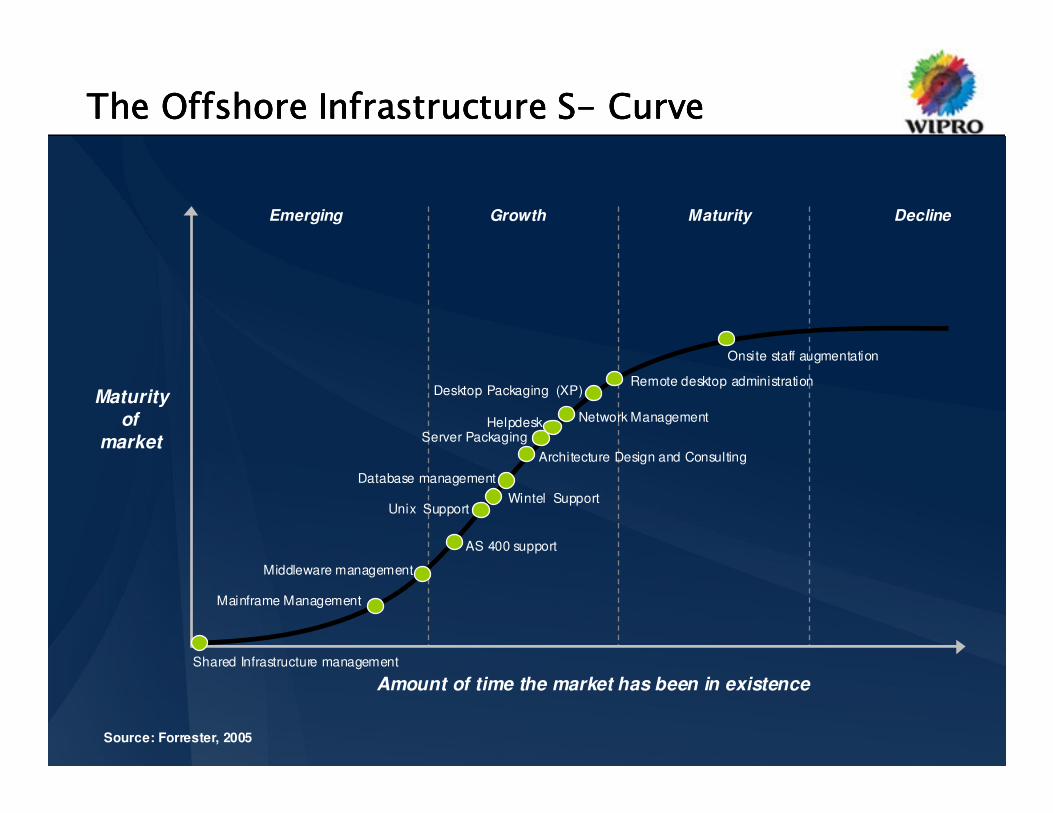
The Offshore Infrastructure SThe Offshore Infrastructure SThe Offshore Infrastructure SThe Offshore Infrastructure S---- Curve Curve Curve Curve
Emerging Growth Maturity Decline
Maturity
of
market
Amount of time the market has been in existence
Architecture Design and Consulting
Network Management
Shared Infrastructure management
Server Packaging
Desktop Packaging (XP)Remote desktop administration
Unix SupportWintel Support
Mainframe Management
AS 400 support
Database management
Middleware management
Helpdesk
Onsite staff augmentation
Source: Forrester, 2005
39
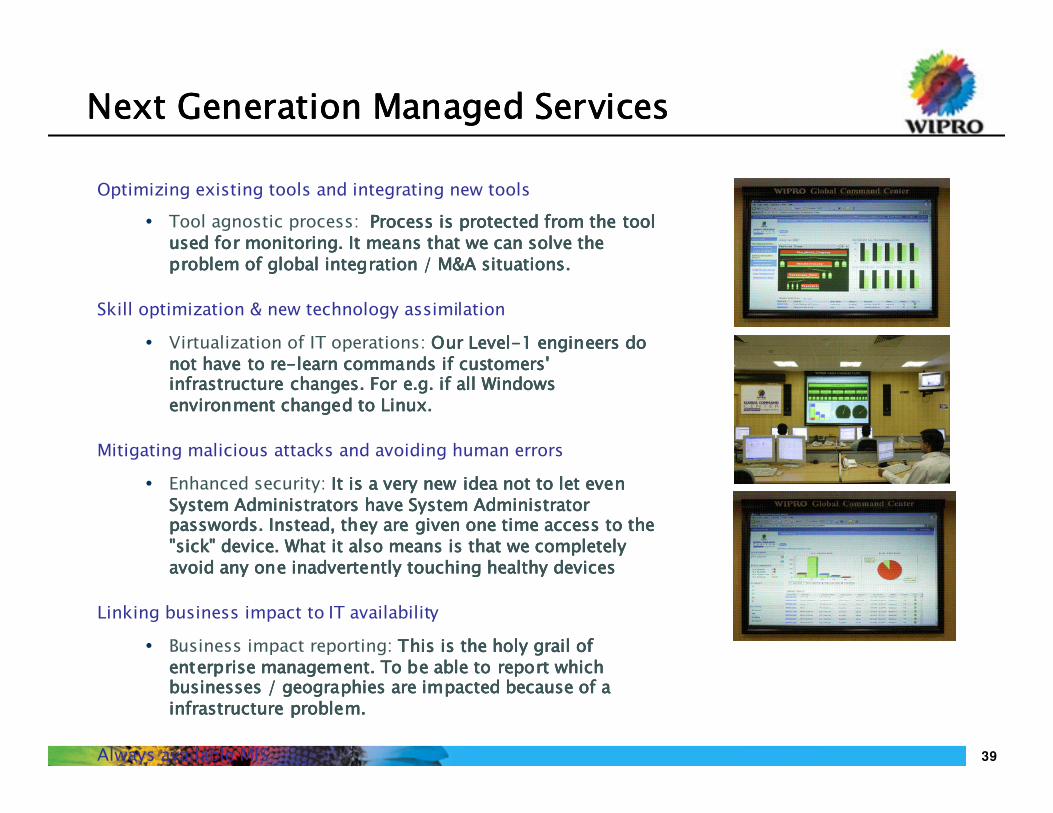
Optimizing existing tools and integrating new tools
� Tool agnostic process: Process is protected from the tool Process is protected from the tool Process is protected from the tool Process is protected from the tool used for monitoring. It means that we can solve the used for monitoring. It means that we can solve the used for monitoring. It means that we can solve the used for monitoring. It means that we can solve the problem of global integration / M&A situations. problem of global integration / M&A situations. problem of global integration / M&A situations. problem of global integration / M&A situations.
Skill optimization & new technology assimilation
� Virtualization of IT operations: Our LevelOur LevelOur LevelOur Level----1 engineers do 1 engineers do 1 engineers do 1 engineers do not have to renot have to renot have to renot have to re----learn commands if customers' learn commands if customers' learn commands if customers' learn commands if customers' infrastructure changes. For e.g. if all Windows infrastructure changes. For e.g. if all Windows infrastructure changes. For e.g. if all Windows infrastructure changes. For e.g. if all Windows environment changed to Linux. environment changed to Linux. environment changed to Linux. environment changed to Linux.
Mitigating malicious attacks and avoiding human errors
� Enhanced security: It is a very new idea not to let even It is a very new idea not to let even It is a very new idea not to let even It is a very new idea not to let even System Administrators have System Administrator System Administrators have System Administrator System Administrators have System Administrator System Administrators have System Administrator passwords. Instead, they are given one time access to the passwords. Instead, they are given one time access to the passwords. Instead, they are given one time access to the passwords. Instead, they are given one time access to the "sick" device. What it also means is that we completely "sick" device. What it also means is that we completely "sick" device. What it also means is that we completely "sick" device. What it also means is that we completely avoid any one inadvertently touching healthy devicesavoid any one inadvertently touching healthy devicesavoid any one inadvertently touching healthy devicesavoid any one inadvertently touching healthy devices
Linking business impact to IT availability
� Business impact reporting: This is the holy grail of This is the holy grail of This is the holy grail of This is the holy grail of enterprise management. To be able to report which enterprise management. To be able to report which enterprise management. To be able to report which enterprise management. To be able to report which businesses / geographies are impacted because of a businesses / geographies are impacted because of a businesses / geographies are impacted because of a businesses / geographies are impacted because of a infrastructure problem.infrastructure problem.infrastructure problem.infrastructure problem.
Always available MIS
Next Generation Managed ServicesNext Generation Managed ServicesNext Generation Managed ServicesNext Generation Managed Services

40
WiproWiproWiproWipro
Proven Global Proven Global Proven Global Proven Global
Delivery Delivery Delivery Delivery ModelModelModelModel
Flexibility & Flexibility & Flexibility & Flexibility & ScalabilityScalabilityScalabilityScalability
ServiceServiceServiceServiceExperienceExperienceExperienceExperience
People People People People
OrientedOrientedOrientedOrientedpracticespracticespracticespractices
Best in classBest in classBest in classBest in class
Industry stdIndustry stdIndustry stdIndustry stdProcessesProcessesProcessesProcesses
Flexible Flexible Flexible Flexible
PricingPricingPricingPricingmodelmodelmodelmodel
1111
6666
5555
4444
3333
2222
5555
4444
3333
2222
1111
6666
� Service delivery through proven Service delivery through proven Service delivery through proven Service delivery through proven ““““Global Global Global Global Delivery Model (GDM)Delivery Model (GDM)Delivery Model (GDM)Delivery Model (GDM)””””
� Experience of supporting demanding Experience of supporting demanding Experience of supporting demanding Experience of supporting demanding
Wall Street environmentWall Street environmentWall Street environmentWall Street environment
� Introduce best in class industry Introduce best in class industry Introduce best in class industry Introduce best in class industry processes processes processes processes
� ITIL (BS 15000)ITIL (BS 15000)ITIL (BS 15000)ITIL (BS 15000)
� ISO 9000:2000ISO 9000:2000ISO 9000:2000ISO 9000:2000
� ISO 17799ISO 17799ISO 17799ISO 17799
� Six SigmaSix SigmaSix SigmaSix Sigma
� Flexible and transparent pricing modelFlexible and transparent pricing modelFlexible and transparent pricing modelFlexible and transparent pricing model
� Governance structure to address Governance structure to address Governance structure to address Governance structure to address changing needschanging needschanging needschanging needs
� Scalable resource modelScalable resource modelScalable resource modelScalable resource model---- Over 5000 Over 5000 Over 5000 Over 5000 skilled resourcesskilled resourcesskilled resourcesskilled resources
� Alliances with multiple vendorsAlliances with multiple vendorsAlliances with multiple vendorsAlliances with multiple vendors
� Ability to hire, train and retain top Ability to hire, train and retain top Ability to hire, train and retain top Ability to hire, train and retain top talenttalenttalenttalent
� PCMM level 5PCMM level 5PCMM level 5PCMM level 5
� 24 years plus of IT support experience24 years plus of IT support experience24 years plus of IT support experience24 years plus of IT support experience� Understand the challenges of managing Understand the challenges of managing Understand the challenges of managing Understand the challenges of managing
an offshore centeran offshore centeran offshore centeran offshore center
Our value propositionOur value propositionOur value propositionOur value proposition
Thank you for your timeThank you for your timeThank you for your timeThank you for your time
41
Wipro Consulting ServicesWipro Consulting ServicesWipro Consulting ServicesWipro Consulting Services
Presenter: Tim Matlack
Date: February 8, 2006
42
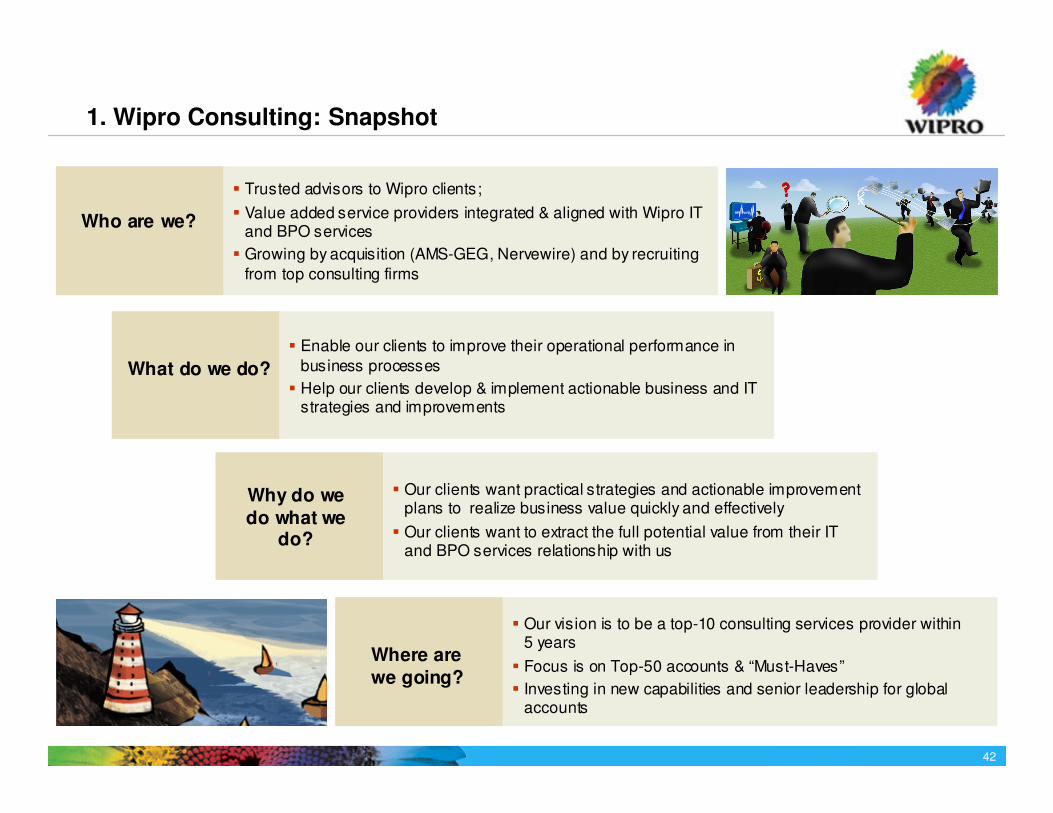
1. Wipro Consulting: Snapshot
� Trusted advisors to Wipro clients;
� Value added service providers integrated & aligned with Wipro ITand BPO services
� Growing by acquisition (AMS-GEG, Nervewire) and by recruiting
from top consulting firms
Who are we?
� Enable our clients to improve their operational performance in
business processes
� Help our clients develop & implement actionable business and IT strategies and improvements
What do we do?
� Our clients want practical strategies and actionable improvementplans to realize business value quickly and effectively
� Our clients want to extract the full potential value from their IT and BPO services relationship with us
Why do we do what we
do?
� Our vision is to be a top-10 consulting services provider within 5 years
� Focus is on Top-50 accounts & “Must-Haves”
� Investing in new capabilities and senior leadership for global accounts
Where are we going?
43
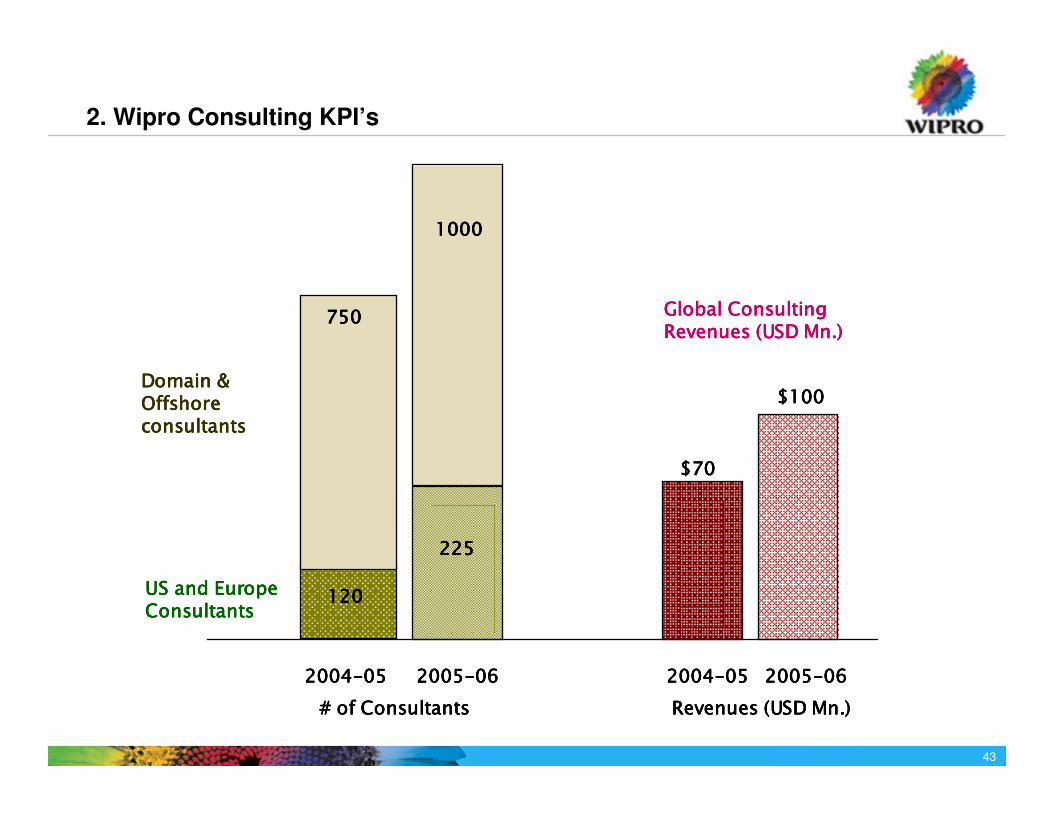
2. Wipro Consulting KPI’s
2004200420042004----05050505 2005200520052005----06060606
120120120120
225225225225
US and EuropeUS and EuropeUS and EuropeUS and EuropeConsultantsConsultantsConsultantsConsultants
Domain &Domain &Domain &Domain &OffshoreOffshoreOffshoreOffshoreconsultantsconsultantsconsultantsconsultants
1000100010001000
# of Consultants# of Consultants# of Consultants# of Consultants Revenues (USD Revenues (USD Revenues (USD Revenues (USD MnMnMnMn.).).).)
$70$70$70$70
$100$100$100$100
750750750750 Global ConsultingGlobal ConsultingGlobal ConsultingGlobal ConsultingRevenues (USD Revenues (USD Revenues (USD Revenues (USD MnMnMnMn.).).).)
2004200420042004----05050505 2005200520052005----06060606
44
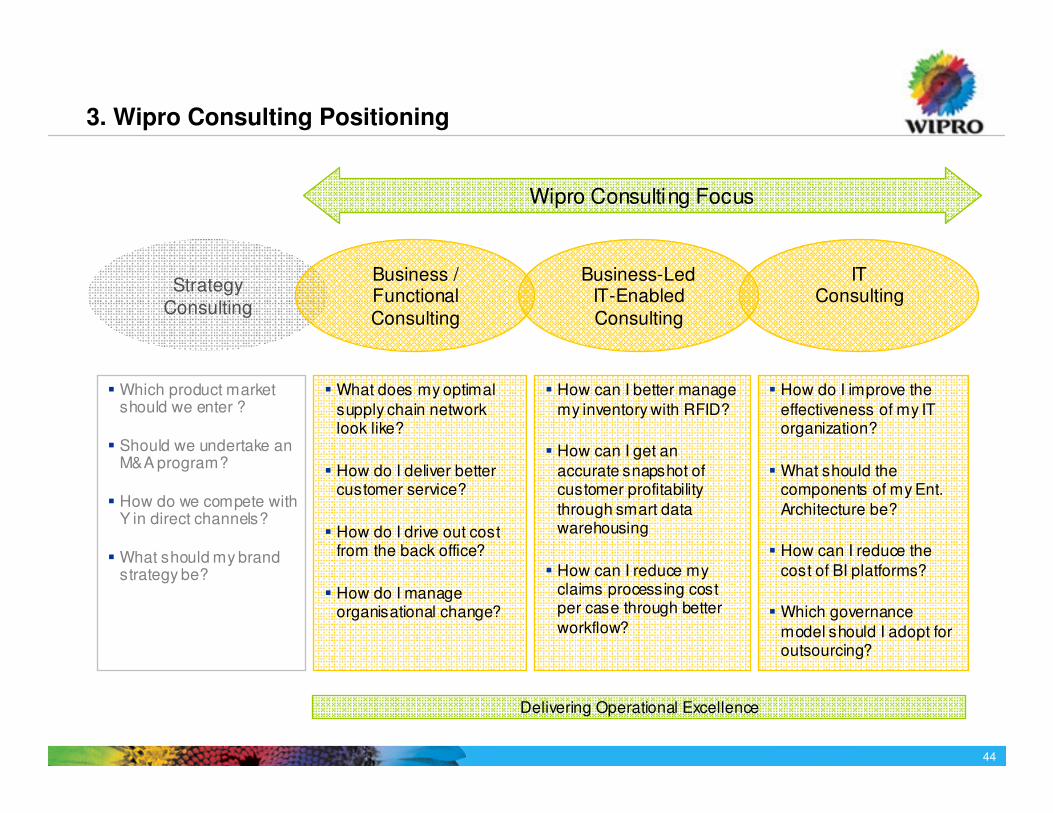
3. Wipro Consulting Positioning
StrategyConsulting
� What does my optimal
supply chain network look like?
� How do I deliver better customer service?
� How do I drive out cost from the back office?
� How do I manage organisational change?
� How can I better manage
my inventory with RFID?
� How can I get an
accurate snapshot of customer profitability
through smart data warehousing
� How can I reduce my claims processing cost per case through better
workflow?
� How do I improve the
effectiveness of my IT organization?
� What should the components of my Ent.
Architecture be?
� How can I reduce the
cost of BI platforms?
� Which governance
model should I adopt for outsourcing?
Delivering Operational Excellence
� Which product market should we enter ?
� Should we undertake an M&A program?
� How do we compete with Y in direct channels?
� What should my brand strategy be?
Business / Functional Consulting
Business-LedIT-Enabled Consulting
IT Consulting
Wipro Consulting Focus

45
4. Consulting Services Overview
Address the needs of the CIO organizationAddress the needs of the Business
Business Process ImprovementOptimizing the design and efficiency of
core business processes
Value Chain OptimisationMaximising the business value of critical
components of the value chain, specifically customer (CRM) and supply/demand (SCM)
Domain & Functional ConsultingProviding best-practice advisory services in core business areas of Energy,
Finance, Telco, etc.
Business / FunctionalConsulting
Strategy & TransformationEnabling IT-led business improvement
by advising on IT Strategy, Total Outsourcing, Strategic Sourcing and Enterprise Architectures
IT Operations & GovernanceEnsuring optimal management of IT assets and programs by advising on IT
Governance, IT Service Management, Program Management and Quality
Assurance
TechnologyConsulting
46
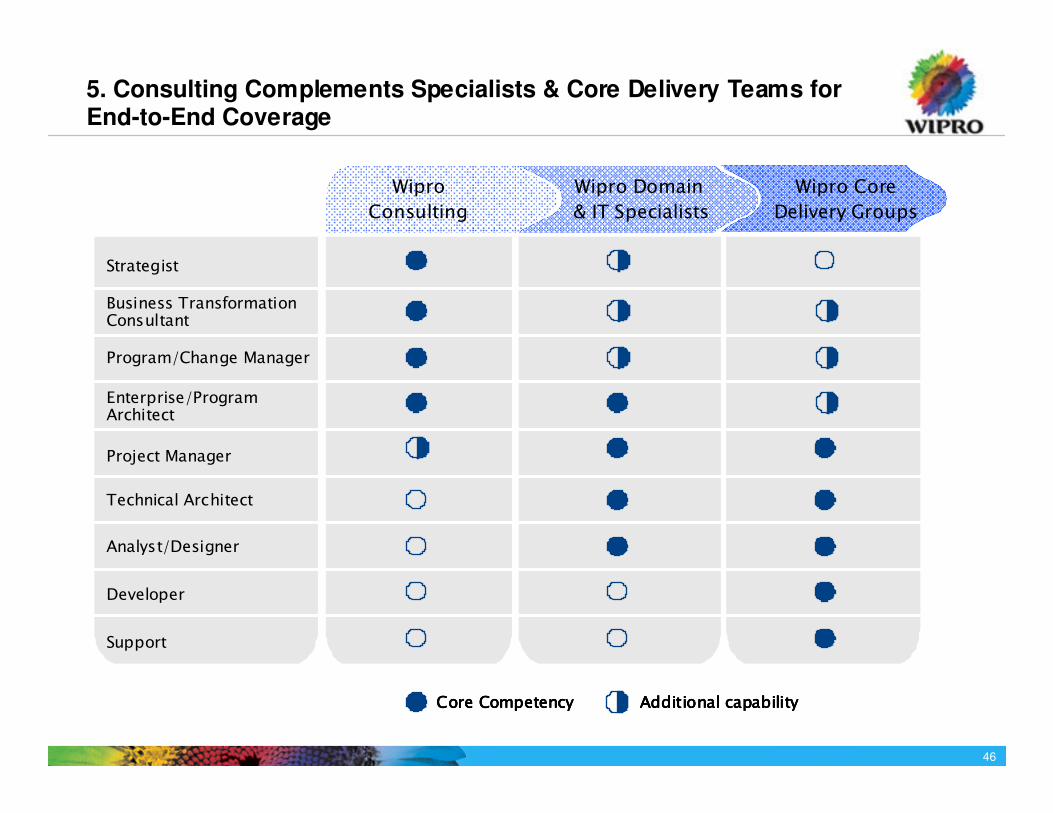
5. Consulting Complements Specialists & Core Delivery Teams for End-to-End Coverage
Wipro
Consulting
Wipro Domain
& IT Specialists
Wipro Core
Delivery Groups
Core CompetencyCore CompetencyCore CompetencyCore Competency Additional capabilityAdditional capabilityAdditional capabilityAdditional capability
Strategist
Business Transformation Consultant
Program/Change Manager
Enterprise/Program Architect
Project Manager
Technical Architect
Analyst/Designer
Developer
Support
47
6. Building the Wipro Consulting talent pool
� Attracting experienced consultants through focused recruiting from leading firms such as
� Accenture
� Deloitte
� McKinsey
� Cap Gemini
� PWC
� Transferring strong talent from within Wipro to enhance career growth and integration of Consulting with the organization
� Recruiting analysts directly from top graduate & post-graduate schools
� Maintaining a high level of competency and credibility through the implementation of robust training and certification programs, inparticular for Managing Consultants, Program Managers and Enterprise Architects
48
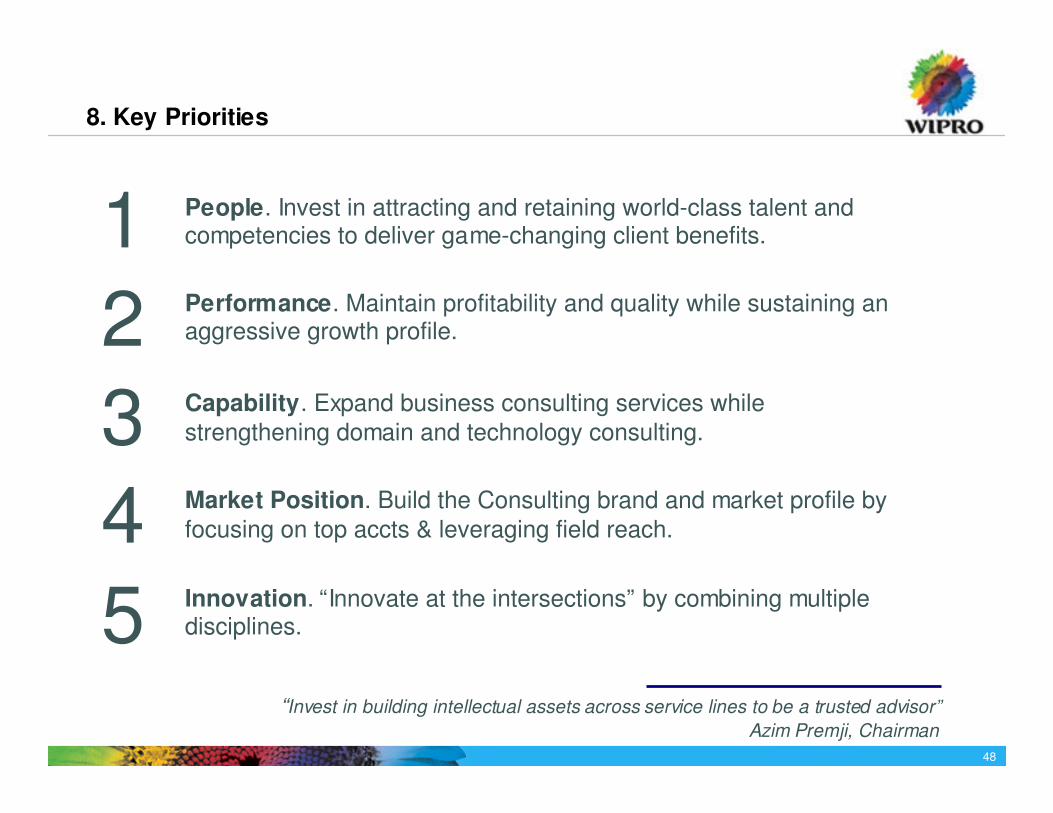
“Invest in building intellectual assets across service lines to be a trusted advisor”
Azim Premji, Chairman
8. Key Priorities
1
2
3
4
5
People. Invest in attracting and retaining world-class talent and competencies to deliver game-changing client benefits.
Performance. Maintain profitability and quality while sustaining an aggressive growth profile.
Capability. Expand business consulting services while strengthening domain and technology consulting.
Market Position. Build the Consulting brand and market profile by focusing on top accts & leveraging field reach.
Innovation. “Innovate at the intersections” by combining multiple disciplines.
49
Wipro BPO Wipro BPO Wipro BPO Wipro BPO ---- Into the FutureInto the FutureInto the FutureInto the Future
8th February 2006

50
� Phase – 3 : 2005 & Beyond
� Industry solutions – ow n the
customer problems.
� Integrated IT + BPO offerings
� Global Delivery Model – Centers
in Europe, Asia, Americas
� Phase – 2 : 2003 – 05
� Develop COE for processes
� Developed BOSS Practise
� Expand to centers across the
country – Kolkata, Chennai,
Pune, Belapur
� Phase – 1 : 2000 - 03
� Leadership in CRM
� Establish Process Maturity
� Set up centers in Delhi and
Bombay
Evolution of Wipro BPO Evolution of Wipro BPO Evolution of Wipro BPO Evolution of Wipro BPO
Clients
Employees
Revenues USD Mn
20
02
-03
20
03
-04
41
95
5000
9500
18
23
20
01
-02
11
2500
05
20
04
-05
150
15000+
33� 8 Centres across the Country
� Global Presence new centers in Bucharest (Q4’05) and Vietnam
(Q2’06)
Q3’05
Employees: 14400
Revenues: US$ 124Mn
Wipro Wipro Wipro Wipro ---- One of the largest BPO Providers and the largest private One of the largest BPO Providers and the largest private One of the largest BPO Providers and the largest private One of the largest BPO Providers and the largest private sector employer in Indiasector employer in Indiasector employer in Indiasector employer in India
Customer
Relationship
Management
Business
Optimization
Services
Industry
Services
Consistent Growth: 6 new clients added Consistent Growth: 6 new clients added Consistent Growth: 6 new clients added Consistent Growth: 6 new clients added in 2005 in back office and industry in 2005 in back office and industry in 2005 in back office and industry in 2005 in back office and industry services services services services –––– changing the business mix.changing the business mix.changing the business mix.changing the business mix.
Process over 7 MnTransactions / Months across 98 Processes
51
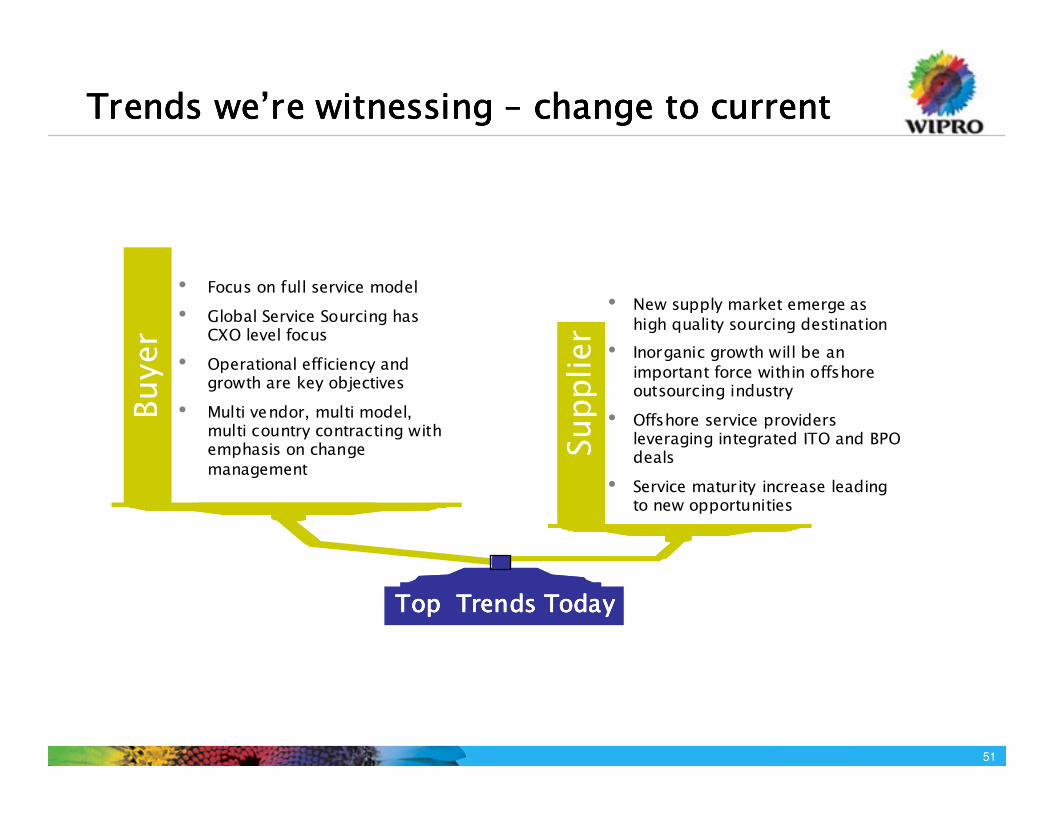
Trends weTrends weTrends weTrends we’’’’re witnessing re witnessing re witnessing re witnessing –––– change to currentchange to currentchange to currentchange to current
• New supply market emerge as
high quality sourcing destination
• Inorganic growth will be an
important force within offshore outsourcing industry
• Offshore service providers leveraging integrated ITO and BPO deals
• Service maturity increase leading to new opportunities
• Focus on full service model
• Global Service Sourcing has CXO level focus
• Operational efficiency and growth are key objectives
• Multi vendor, multi model, multi country contracting with emphasis on change
management
Supplier
Buyer
Top Trends TodayTop Trends TodayTop Trends TodayTop Trends Today

52
Wipro BPO Wipro BPO Wipro BPO Wipro BPO ---- Responding to CustomersResponding to CustomersResponding to CustomersResponding to Customers
Looking for an integrated
solution – across the process and IT
Customer’s Business Issues
Single solution provider across multiple geographies and time
zones
Process ownership and continued improvement in efficiency and process
improvement
Wipro’s Integrated front
end, integrated solutions, and integrated delivery
Creating a Global Delivery Model. Center in Romania is the start. New centers in
Asia, Americas, Europe
Focus on Value addition beyond cost savings, using Centers of Excellence, and
investments in people.
Wipro –Key Solution Themes
Delivering value through transactional pricing models

53
Bringing effectiveness the Wipro BPO WayBringing effectiveness the Wipro BPO WayBringing effectiveness the Wipro BPO WayBringing effectiveness the Wipro BPO Way
Advantage WiproAdvantage WiproAdvantage WiproAdvantage WiproAdvantage WiproAdvantage WiproAdvantage WiproAdvantage Wipro
Productivity Enhancements Productivity Enhancements Productivity Enhancements Productivity Enhancements The The The The ‘‘‘‘FactoryFactoryFactoryFactory’’’’ modelmodelmodelmodel
Productivity Enhancements Productivity Enhancements Productivity Enhancements Productivity Enhancements The The The The ‘‘‘‘FactoryFactoryFactoryFactory’’’’ modelmodelmodelmodel
�Deploy Lean Sigma for productivity breakthroughs
�Follow COPC model for SLA adherence and constant benchmarking/ reporting
�Implement Kaizen for continuous process improvements
�Deploy Lean Sigma for productivity breakthroughs
�Follow COPC model for SLA adherence and constant benchmarking/ reporting
�Implement Kaizen for continuous process improvements
�Leverage best of both models− Proven quality leadership driving productivity enhancements
− A standardised template to meet transformation and growth needs
�Capture up to 40% reduction in effort
− A robust and synchronised technology and process platform to make transformational services best-in-class
Process Improvements Process Improvements Process Improvements Process Improvements The The The The ‘‘‘‘ExpertExpertExpertExpert’’’’ modelmodelmodelmodel
Process Improvements Process Improvements Process Improvements Process Improvements The The The The ‘‘‘‘ExpertExpertExpertExpert’’’’ modelmodelmodelmodel
�Consolidate processes across LOBs and locations
�Synchronise processes derived using a ‘gold standard’ template
�Benchmark processes to Automate NVA processes and hand-offs using technology
�Consolidate processes across LOBs and locations
�Synchronise processes derived using a ‘gold standard’ template
�Benchmark processes to Automate NVA processes and hand-offs using technology

54
Case Study: Transforming back office Case Study: Transforming back office Case Study: Transforming back office Case Study: Transforming back office operationoperationoperationoperation
The ClientThe ClientThe ClientThe Client
The Client is a large European Oil and Gas Company with
Global Operations
ObjectivesObjectivesObjectivesObjectives
�Overcoming low process and systems maturity. Eliminate
processing internally
�To provide scalability of back office operations to meet
exponential growth
�Control and reduce the management overhead – eliminate
as much SG&A as possible
� Volumes to increase by 3XVolumes to increase by 3XVolumes to increase by 3XVolumes to increase by 3X
times over the next 18 months. times over the next 18 months. times over the next 18 months. times over the next 18 months.
Process Areas Process Areas Process Areas Process Areas
� Accounts PayableAccounts PayableAccounts PayableAccounts Payable
� Payroll ProcessingPayroll ProcessingPayroll ProcessingPayroll Processing
� Fixed Asset ManagementFixed Asset ManagementFixed Asset ManagementFixed Asset Management
� Travel and Expense Travel and Expense Travel and Expense Travel and Expense
ProcessingProcessingProcessingProcessing
� GL AccountingGL AccountingGL AccountingGL Accounting
� Strategic procurementStrategic procurementStrategic procurementStrategic procurement
� Transactional procurementTransactional procurementTransactional procurementTransactional procurement
Wipro SolutionWipro SolutionWipro SolutionWipro Solution
Take over the entire business problem, transforming
processes and IT, and delivering value in an environment
where volumes are going up 3x in one and half years.
The client only retains the CFO and Controller. All other
roles outsourced to Wipro. Wipro has taken over
employees.
�Deployment of ERP system across all processes. Agreed
targets on process improvements and efficiency gains.
� Phased approach with a one year complete transformation
timeline including IT and BPO.
Global Delivery, Scalability and a Single Vendor for an end to end solution
55
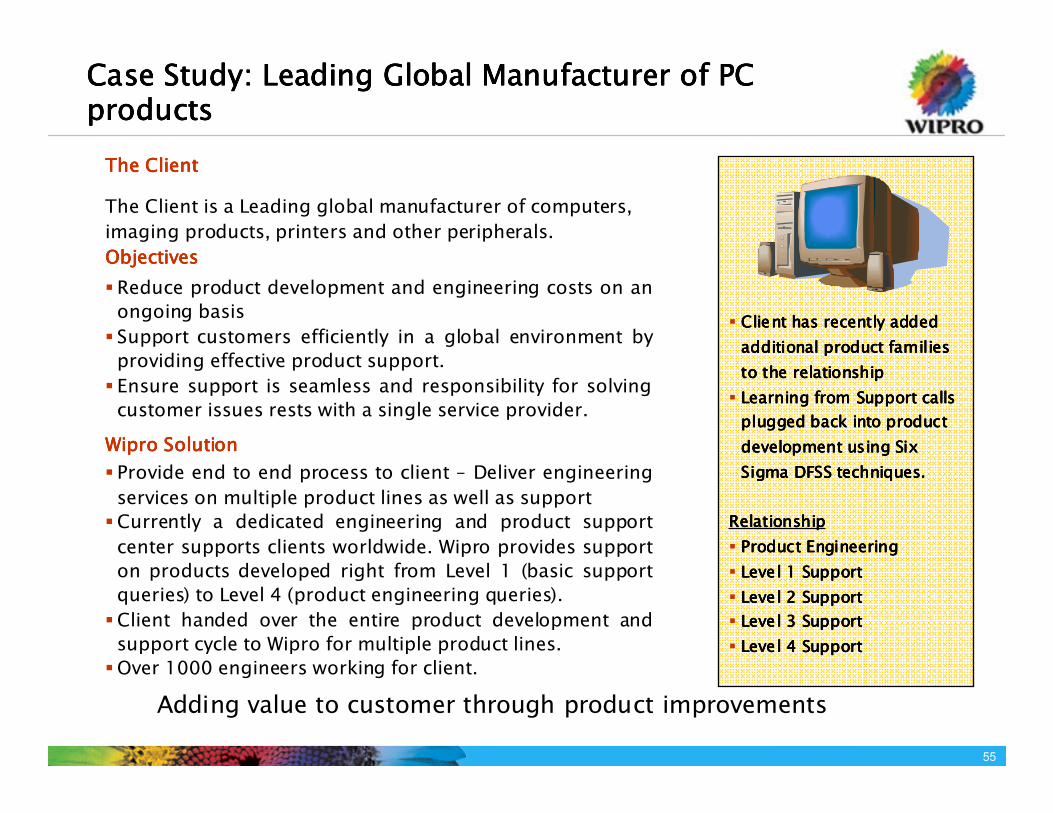
Case Study: Leading Global Manufacturer of PC Case Study: Leading Global Manufacturer of PC Case Study: Leading Global Manufacturer of PC Case Study: Leading Global Manufacturer of PC productsproductsproductsproducts
The ClientThe ClientThe ClientThe Client
The Client is a Leading global manufacturer of computers,
imaging products, printers and other peripherals.
ObjectivesObjectivesObjectivesObjectives
�Reduce product development and engineering costs on an
ongoing basis
� Support customers efficiently in a global environment by
providing effective product support.
� Ensure support is seamless and responsibility for solving
customer issues rests with a single service provider.
Wipro SolutionWipro SolutionWipro SolutionWipro Solution
� Provide end to end process to client – Deliver engineering
services on multiple product lines as well as support
�Currently a dedicated engineering and product support
center supports clients worldwide. Wipro provides support
on products developed right from Level 1 (basic support
queries) to Level 4 (product engineering queries).
�Client handed over the entire product development and
support cycle to Wipro for multiple product lines.
�Over 1000 engineers working for client.
� Client has recently added Client has recently added Client has recently added Client has recently added
additional product families additional product families additional product families additional product families
to the relationship to the relationship to the relationship to the relationship
� Learning from Support calls Learning from Support calls Learning from Support calls Learning from Support calls
plugged back into product plugged back into product plugged back into product plugged back into product
development using Six development using Six development using Six development using Six
Sigma DFSS techniques.Sigma DFSS techniques.Sigma DFSS techniques.Sigma DFSS techniques.
Relationship Relationship Relationship Relationship
� Product EngineeringProduct EngineeringProduct EngineeringProduct Engineering
� Level 1 SupportLevel 1 SupportLevel 1 SupportLevel 1 Support
� Level 2 SupportLevel 2 SupportLevel 2 SupportLevel 2 Support
� Level 3 SupportLevel 3 SupportLevel 3 SupportLevel 3 Support
� Level 4 SupportLevel 4 SupportLevel 4 SupportLevel 4 Support
Adding value to customer through product improvements

56
Case Study: Case Study: Case Study: Case Study: Semiconductor Manufacturing Semiconductor Manufacturing Semiconductor Manufacturing Semiconductor Manufacturing EnterpriseEnterpriseEnterpriseEnterprise
�Needed support globally – 30 countries, including Statutory filings
and escalation support.
� Short term support provided by parent company, would be
terminated at end of 9 months.
�Need to develop an alternative platform as there would be no access
to the current platform.
The ClientThe ClientThe ClientThe Client
Criticality of the situationCriticality of the situationCriticality of the situationCriticality of the situation
Wipro solutionWipro solutionWipro solutionWipro solution
� Working with 3Working with 3Working with 3Working with 3rdrdrdrd party vendor to party vendor to party vendor to party vendor to
define ERP solution define ERP solution define ERP solution define ERP solution
� Wipro to provide end to end F&A Wipro to provide end to end F&A Wipro to provide end to end F&A Wipro to provide end to end F&A
including local statutory including local statutory including local statutory including local statutory
requirements for clientrequirements for clientrequirements for clientrequirements for client
� Wipro has already improved Wipro has already improved Wipro has already improved Wipro has already improved
client process based on current client process based on current client process based on current client process based on current
processprocessprocessprocess
Spun off semiconductor business of leading electronics and instrumentation company. Set up with locations and plants acrossAmericas, Europe and Asia.
�Take over the end to end accounting function in a phased manner.
�Create ERP solution for roll out in conjunction with 3rd party vendor.
Wipro defined the client’s new processes
�Up and running in minimum timeframe, leveraged Wipro BPO centers
of excellence.
Single global solution for all finance and accounts requirements.

57
Thank you for your timeThank you for your timeThank you for your timeThank you for your time
Our promiseOur promiseOur promiseOur promiseWith utmost respect to Human Values, we
promise to serve our customers with
Integrity, through Innovative, Value for
Money solutions, by Applying Thought, day
after day
Information contained and transmitted by this presentation is proprietary to Wipro Limited and is intended for use only by the individual or entity to which it is addressed, and contains information that is privileged, confidential or exempt from disclosure under applicable law.