Embed Size (px)
Citation preview

Welcome to this overview on DISCOVER the way forward for
schools to analyse data held with in SIMS.
Discover

The following Slides show some examples of Discover being used in Primary schools
Venn diagram showing Children in year 2 who are receiving free school meals and are English as an Additional Language.

Venn diagram showing Children in the whole school whose attendance is below 95% and who are receiving free school meals and have English as an Additional Language. You can then view who these students are.

Venn diagram showing children in year 2 who did not achieve a level 2B or above for KS1 maths, reading and writingThe 19 children could be the target group for year 3.
It is then possible to view who these 19 children are.
The following slide show how we can analyse this information even further……

Group of 19 children dragged from the Venn diagram to create a new group and attendance details for <95% added.There are 3 children who were below level 2B for KS1 maths, reading and writing and who have an attendance record to date of <95%

Venn diagram showing children in year 5 who are not on target to achieve a level 4B or above for KS2 maths, reading and writingThe 5 children could be the target group for year 6.

The next few slides shows examples of Discover being used in High Schools/Academies

Example Behaviour Year 9 Graph

Example Gifted Students Graph

Example Triple Science Graph

Autumn 2011 – what we can do NOW
A whole school Gender Pie Chart An improvement to Graph to Graph
filtering for multiple series. The ability for Assessment graphs to be
exported and imported between SIMS databases
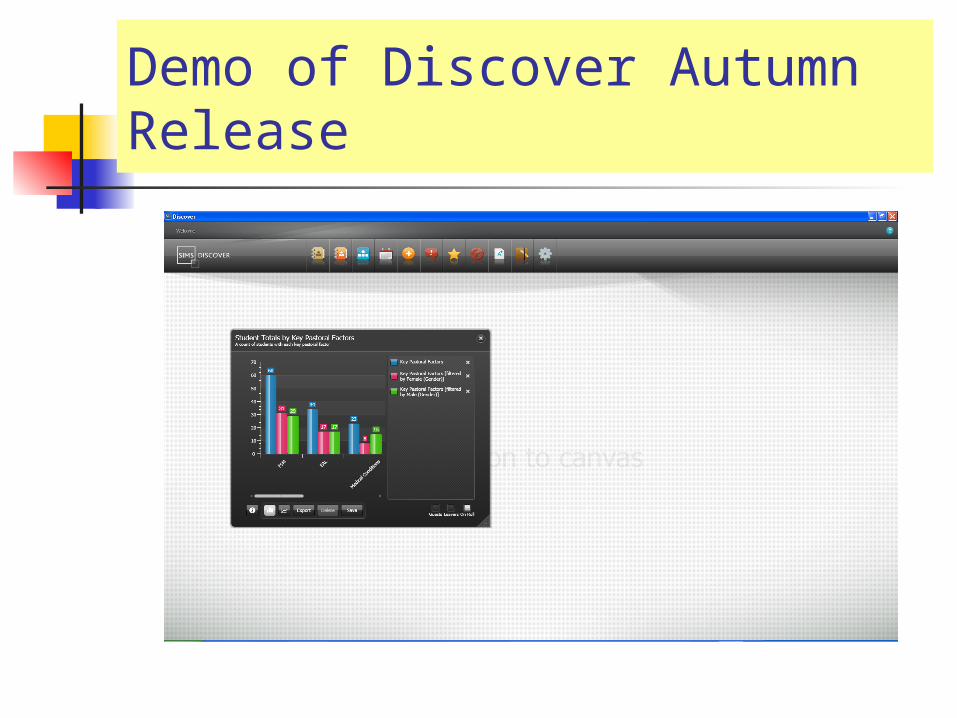
Demo of Discover Autumn Release

Whole School Gender Pie Chart

Improvement to Graph to Graph filtering

Spring 2012 – Available from the Spring upgrade
English Baccalaureate 5 circle Venn
The ability to drill down through Pastoral and
Course graphs to Classes and Pupils
The ability to multi-select Data Points
Global Filters
Global Search

English Baccalaureate 5 Circle Venn

SIMS Discover The Future Currently being developed
The ability to see previous Year's data for comparison
Date Range Filters Staff Data – Absence, Points awarded Exam Results Data Discover graphs in other parts of
SIMS, e.g. Homepage, Pupil summary, Parental Reports