Embed Size (px)
Citation preview

Interserve PlcHalf-year report 2010
Welcome to the world of Interserve
Interserve Half-Year Aug2010 TP Q6.5 :Artwork 19/8/10 12:36 Page fc1

HighlightsUnaudited half-year results for the six months ended 30 June 2010
H1 2010 H1 2009
• Revenue £944.5m £951.2m
• Headline profit1 £30.0m £39.3m
• Profit before tax £27.3m £40.0m
• Headline earnings per share2 17.5p 23.1p
• Basic earnings per share 15.9p 24.2p
• Net debt £53.1m £85.1m
• Interim dividend 5.6p 5.5p
1 Headline profit comprises profit before taxation of £27.3m (H1 2009: £40.0m) adjusted for the impact of (£2.5m) amortisation of intangible assets(H1 2009: (£2.5m)); (£0.2m) amortisation of intangible assets (associates) (H1 2009: £0.2m); and £nil exceptional items (H1 2009: £3.4m)).
2 Headline earnings per share are based on Headline profit as defined in note 1 above (see also note 6 to the unaudited condensed financial statements).
“Trading in the half year was in line with the Board’s expectations. Project Services delivered an excellentresult, Support Services is making good progress based on moving performance in several key publicsector contracts to planned levels of profitability and Equipment Services, after an exceptional 2009,performed creditably in a challenging environment.
Uncertainties persist in our markets, but we remain confident that the second half will show a significantuplift on the first half and that we have a strong international platform from which to sustain long-termgrowth at attractive margins. Consequently, the Board is continuing with its progressive dividend policy.”
Adrian RingroseChief Executive
Interserve Half-Year Aug2010 TP Q6.5 :Artwork 19/8/10 12:36 Page fc2

Interserve Plc Half-year report 2010 1
Headline profits of £30.0 million in the first half were in linewith our expectations but some 24 per cent lower than astrong performance in the same period last year. Despitedifficult market conditions, Project Services delivered anexcellent performance, with both our UK and internationaloperations posting improved results that led to a 30 percent increase in divisional profits. However, as expected,this was more than offset by reduced contributions acrossthe rest of the Group, notably from Equipment Services,which performed creditably in tougher market conditionsbut was not able to replace several large hire contracts thathelped deliver a record 2009 result for the division. SupportServices revenues increased due to the full-year impact ofprior-year contract wins, but its performance was affectedby the transition of several public sector contracts toplanned levels of profitability and weak private sectormarket conditions. We are now well advanced in takingthese public sector contracts to higher margin levelsand expect to see a significantly improving result fromSupport Services as the year progresses.
We consider our international reach to be a majorstrength. We have continued to grow our geographicfootprint, developing further opportunities incomplementary markets and services. Our strong positionin the Middle East, built up over more than 25 years, isenabling us to take advantage of ongoing opportunities inthe region. We continue to prosper in existing marketssuch as Qatar and Oman and have entered new marketssuch as Saudi Arabia. During the period we were awardedour first major support services contract in the UAE andinvested £0.4 million for a 49 per cent stake inOccupational Training Institute LLC (OTI), a servicescompany that provides training and consultancy to thepetrochemical industry in Oman. In July we committed toinvest around £5 million for a 49 per cent stake in aconstruction business operating in southern India.
Balance sheetThe Group maintains a strong financial position, with netdebt as at 30 June 2010 of £53.1 million (30 June 2009:£85.1 million). During the first half we successfullycompleted the renewal of our £250 million committeddebt facilities, which now extend until 2013.
Changes in market conditions resulted in the pensiondeficit increasing slightly to £75.8 million (31 December2009: £68.6 million), net of tax, due principally to lowerthan expected asset returns in the first half. Following therange of actions taken last year to improve significantlythe funding position and reduce future volatility webelieve that we now have a robust and affordable fundingplan to address the remaining shortfall over the nextseven years without restricting our ability to supportour growth ambitions.
DividendReflecting our confidence in the ability of the Group tosustain its record of long-term growth and cash generation,the Board has approved a further increase in the interimdividend. An interim dividend of 5.6p (H1 2009: 5.5p) willbe paid on 25 October 2010 to shareholders on the registerat close of business on 24 September 2010.
BoardAs announced in June, Group Finance Director, Tim Jones,has tendered his resignation in order to take up theposition of Group Finance Director at Mitchells & Butlersplc. Our search for his successor is progressing well andTim will be remaining at Interserve for an appropriateperiod to ensure a smooth and orderly transition. Onbehalf of the Board, I would like to thank Tim for allhis work over the last seven years. He has made a hugecontribution as Group Finance Director and we wishhim well in his future career.
Interim Management ReportChairman’s statement
Interserve Half-Year Aug2010 TP Q6.5 :Artwork 19/8/10 12:36 Page 1

2 Interserve Plc Half-year report 2010
ProspectsWe are confident that margin recovery in Support Servicesand growth from our international markets will generateimproved second-half earnings and sustain long-termgrowth, supported by a substantial future workload of£5.7 billion.
In the UK we are making progress in delivering plannedmargins in Support Services with an initial target toachieve sustainable margins across the division that arecomparable with our peer group. This margin improvementis primarily dependent on internal actions rather thanmarket conditions and can be delivered in the current,less benign, demand environment. However, the medium-term demand environment is positive; the benefits ofoutsourcing as a means of reducing cost and improvingservice delivery in an uncertain economic environment willbe essential in enabling the UK government to meet itsexpenditure objectives. With a Support Services businessfounded on long-term, value-added client relationships inthe UK public sector, we are well placed to continue to besuccessful in this market.
In recent years we have developed and increased ourexposure to international markets, generatingopportunities to expand both our service offering andgeographical footprint at attractive margins. Around50 per cent of Group profits are currently derived fromoutside the UK. We expect this overseas contribution toremain significant, as our existing international marketssuch as Qatar, Oman and Australia offer attractive growthprospects and we continue to expand into new territoriessuch as Saudi Arabia and, most recently, India. Both of thelatter countries have young, fast-growing populations buta relative lack of infrastructure to support this growth,providing a fertile environment for our business. We willcontinue to look further for opportunities to expand ourinternational reach.
With our significant international exposure, marginenhancement plan in Support Services and substantialfuture workload we are confident that we have a strongplatform to deliver long-term growth.
Lord BlackwellChairman10 August 2010
Chairman’s statementcontinued
Interserve Half-Year Aug2010 TP Q6.5 :Artwork 19/8/10 12:36 Page 2

Interserve Plc Half-year report 2010 3
Business review
Key Performance IndicatorsH1 2010 H1 2009 Change
Revenue £944.5m £951.2m (0.7)%
Headline earnings per share 17.5p 23.1p (24.2)%
Cash conversion3 (47.1)% 128.5% (175.6)% pts
Future workload £5.7bn £6.7bn (14.9)%
Annualised staff turnover4 8.7% 7.4% +1.3% pts
Annualised all-employee accident incidence rate per 100,000 workforce 379 366 +3.6%
StrategyInterserve’s vision is to be The Trusted Partner, bringingtogether all of our capabilities to create innovativesolutions that support long-term customer relationships,offering rewarding careers for our staff and underpinningsustained value creation for shareholders. Our strategicobjectives for fulfilling this vision consist of thefollowing elements:
Build strong core businesses based on long-term,value-added client relationships:Our well-established client relationships have beencultivated over a long period of time and have withstoodprevious business and economic cycles, delivering a highlevel of repeat business and conferring strong visibilityduring uncertain economic periods.
Strategic progress:
• We have a substantial future workload of £5.7 billion,due in large part to the strong existing relationships wehave with major clients such as Thames Water, UnitedUtilities, Leeds City Council, Shell and Siemens, all ofwhom extended their work with us in the first half.
• We were named Best Facilities Management Providerin the Public Private Finance Awards 2010, recognisingour ability to implement strong partnerships with thepublic sector in pursuit of improving working practicesand efficiencies.
Capture emerging opportunities for integrated solutions:The broad reach of the Group’s expertise across the assetlife cycle enables us to structure ‘one-stop-shop’ solutionsto match our clients’ support needs across markets andsectors. Our culture and organisational flexibility allows usto transfer expertise across our activities. It also gives us
the potential to grow into new markets and services wherewe can provide additional value to our existing clients.
Strategic progress:
• Since securing the HSBC integrated multi-siteoutsourcing contract last year we have grown ourrelationship with this client through the provisionof a number of extended and additional servicesboth in the UK and, latterly, in the Middle East.
Expand international growth with fuller service offering:We have extensive sectoral and geographic reach in ourexisting businesses; however, our markets are constantlyevolving and we seek to develop into related skills, sectorsand geographies as part of our growth strategy.
Strategic progress:
• Our successful and long-standing Project Servicespartnerships in the Middle East are providingopportunities for our Support Services business to winnew work in the region. Notably, this year we havewon one of the largest support services contracts inthe UAE and look forward to developing this businessstream further.
• Having successfully developed a services offering forthe petrochemical sector in Qatar via the 2007acquisition of Madina Group, we have now investedin a business offering similar services to the Omanipetrochemical sector, a sector where we already havestrong relationships via our construction operation.
• The recent entry into Saudi Arabia by our EquipmentServices business is gaining, winning its initial contractsin the Kingdom and actively pursuing an attractivepipeline of opportunities.
3 Cash conversion is calculated as the percentage of cash generated by operations of £(8.0)m (H1 2009: £37.9m) divided by the sum of: operating profit of £14.5m(H1 2009: £30.4m); plus amortisation of intangible assets of £2.5m (H1 2009: £2.5m); less profit on disposal of property and investments of £nil (H1 2009: £3.4m).
4 Staff turnover measures the proportion of managerial, technical and office-based staff leaving voluntarily over the course of the period. The figures for January-Junehave been doubled to give an annual equivalent.
Interserve Half-Year Aug2010 TP Q6.5 :Artwork 19/8/10 12:36 Page 3

4 Interserve Plc Half-year report 2010
Given that our core skills and capabilities are transferableacross sectors and geographies, we expect more examplesof such strategic developments to arise, underpinning ourconfidence in the Group’s future.
The half-year performance was in line with the Board’sexpectations, with headline earnings per share of 17.5p(H1 2009: 23.1p) on revenue of £944.5 million (H1 2009:£951.2 million). Revenue growth from the full-year impactof prior-year contract wins in our Support Services divisionwas offset by lower revenues in Project Services andEquipment Services. At the headline earnings per sharelevel the performance reflected, as expected, a returnto a more balanced hire/sale mix in Equipment Servicesfollowing an exceptionally strong 2009 performance anda Support Services result affected by the transition ofseveral key public sector contracts to planned levelsof profitability.
Net debt as at 30 June was £53.1 million (H1 2009:£85.1 million) whilst average net debt during the firsthalf was £12.0 million. Cash conversion in the period wasimpacted by an anticipated reduction in advance paymentsand increased pension contributions. On a rolling 12-monthbasis cash conversion was over 150 per cent.
Being accident free is one of our five key goals andmaintaining a safe and healthy environment is fundamentalto our success, so it is encouraging that we have been ableto maintain a historically low UK all-employee incidencerate during the first half. It is also pleasing to see that ourefforts over recent years in improving this non-financialkey performance indicator were rewarded during theperiod. We received the Safe Working Award for 2009from the Engineering Construction Industry Association andtwo further sector awards from RoSPA: the OutstandingFacilities Sector Award and Defence Sector Award.
Future workloadOur future workload comprises forward orders andpipeline. Forward orders are those for which we havesecured contracts in place. Pipeline covers contractsfor which we are in bilateral negotiations and on whichfinal terms are being agreed. We include our share ofwork won by our Middle East associates.
The future workload at the end of the period stood at£5.7 billion, comprising £4.5 billion of forward orders and£1.2 billion relating to pipeline. The reduction from theyear-end future workload level of £6.5 billion reflectsthe following movements during the first half:
• New contract wins amounting to £0.8 billion;
• Delivery of £1.0 billion of work;
• A reduction in the estimated value of pipeline in lightof recent discussions with UK public sector clients,amounting to £0.6 billion, the majority of whichrelates to 2013 onwards.
Principal risks and uncertaintiesThe principal risks and uncertainties which could have amaterial impact upon the Group’s performance over theremaining six months of the 2010 financial year, togetherwith the mitigation strategies adopted, and which couldcause the actual results to differ materially from thoseexpected, have not changed significantly from those setout on pages 24 and 25 of the Business Review included inthe Group’s 2009 annual report and financial statements.
These risks and uncertainties may be summarised as:
• Market change
• Major contracts
• Key people
• Health and safety regime
• Financial risks
• Damage to reputation
Segmental reviewInterserve’s divisions create and deliver integrated andsingle-service solutions that offer real benefits in meetingour clients’ outsourced service requirements. Our divisionsare supported by a Group Services function which providesa range of central services and encompasses our financingand PFI bidding activities. Group Services’ costs in thehalf year were £10.1 million (H1 2009: £8.0 million), theincrease reflecting non-recurring restructuring charges.
Support Services was formed in January 2010 when wecombined Facilities Management and Specialist Services,reducing costs, simplifying the management structureand reflecting the increasing amount of work deliveredby our Specialist Services division to our FacilitiesManagement clients. Facilities Management provideda broad range of integrated services to the public andprivate sectors, the vast majority of which we deliverourselves, while Specialist Services provided a varietyof single–service solutions, such as security, mechanicaland electrical design, installation and maintenance andtechnical services.
Business reviewcontinued
Interserve Half-Year Aug2010 TP Q6.5 :Artwork 19/8/10 12:36 Page 4

Interserve Plc Half-year report 2010 5
Results summary:H1 2010 H1 2009 Change
Revenue £538.2m £503.8m +6.8%Contribution toTotal operating profit £8.9m £10.7m (16.8)%
Operating margin 1.7% 2.1% (0.4)% pts
Support Services delivered a contribution to TotalOperating Profit of £8.9 million and a margin of 1.7 percent in the period. Revenues continued to grow, reflectingthe full-year impact of contracts won and mobilised during2009. The margin is still significantly below the level webelieve the business can deliver on a sustainable basis,and primarily reflects previously highlighted cost pressuresin the early stages of several major, new, public-sector,integrated outsourcing contracts, together with weaknessin the private sector and the absorption of around£1.8 million of non-recurring headcount-reduction costs.We are making good progress in moving performance ina number of public sector contracts to planned levelsof profitability.
Contract wins in the period included plant and equipmentreplacement work at the NEC in Birmingham and thesuccessful re-bid of a four-year contract with theMetropolitan Police Service (MPS) to provide special eventsservices throughout London and the home counties,continuing a relationship with the MPS that began in 1999.The division had a future workload of £4.3 billion at theend of June, of which around 85 per cent representedforward orders. Included within this workload is £0.5 billionof work scheduled for the second half of 2010 and a further£0.7 billion scheduled for delivery in 2011.
Revenues from existing public sector contracts remainedrelatively stable during the period, although early signs ofa reduction in discretionary work have emerged as clientspostpone some projects pending finalisation of theComprehensive Spending Review. However, beyond thenear term the demand drivers for this business remainattractive. Our customers, in particular central and localgovernments, are under pressure to reduce budgets, toimprove efficiencies and to maximise the effectiveness oftheir available resources given the current challengingeconomic environment. At the same time they continue toface rising demand from a growing and ageing populationto improve the delivery of existing services. We are wellpositioned to help them given our strong capabilitiesacross a broad range of markets, our proven track recordin delivering change and our ability to create innovativesolutions, as evidenced by our recent selection on a
government framework contract which pre-qualifies us forwork commissioned by public sector bodies in hard, softand managed services. We expect this business to generategood medium-term growth as a result.
In the private sector many of our clients remain subduedby the current economic climate, resulting in reduceddemand for some of our services, and this has continuedto weigh on the division’s performance. However, weremain confident that the recently-mobilised HSBCcontract will provide a boost to our private sectorintegrated outsourcing credentials as we bid for newcontracts, and we look forward to improving momentumas and when the economy recovers. The contract hasalready provided opportunities for us to grow the scopeof the services we provide to this client, notably insecurity, construction and consulting.
Within the division’s result the former Specialist Servicesbusinesses lost £2 million (H1 2009: £1.6 million loss),reflecting continued difficult trading conditions andconsequent restructuring costs. Following the creationof Support Services the new divisional leadership hasconducted a thorough review of financial performanceand business operations. This has resulted in additionalsenior management changes within the security andtechnical services businesses and we expect to makefurther reductions to the cost base.
Given the attractive medium-term demand characteristicsfor Support Services we have continued to develop ourinfrastructure to support future growth. The NationalService Centre is currently managing around 80,000 callsa month servicing five key clients. Client feedback hasbeen positive and capacity exists to expand this facilityover time, further improving our productivity.
The business also continues to expand overseas, notablyin the Middle East where it can leverage existing Grouprelationships and business infrastructure. In the UAE wewere awarded, during the period, one of the largestsupport services contracts in the country, and, with agrowing pipeline of opportunities, we are excited aboutthe business’s future in the Gulf.
Looking forward, once the above-mentioned publicsector contracts have achieved their planned levels ofprofitability, and as the private sector economy recovers,we expect Support Services to meet our initial target formargins that are comparable with our peer group. Asfuture growth leverages the investment in infrastructure
Interserve Half-Year Aug2010 TP Q6.5 :Artwork 19/8/10 12:36 Page 5

6 Interserve Plc Half-year report 2010
and our overseas development continues there is thepotential for further margin improvement.
Project Services is a leading construction businessproviding professional services to enable the creationof a broad range of buildings and infrastructure. First-half trading was strong in both the UK and Middle East,producing a contribution to Total Operating Profit of£23.5 million (H1 2009: £18.1 million).
Results summary:H1 2010 H1 2009 Change
Revenue (UK only) £380.8m £406.4m (6.3)%
Contribution toTotal operating profit £23.5m £18.1m +29.8%
- UK £10.9m £7.1m +53.5%
- Internationalassociates* £12.6m £11.0m +14.5%
Operating margin (UK) 2.9% 1.7% +1.2% pts
Operating margin(Middle East) 10.3% 8.6% +1.7% pts
* After interest and tax
In the UK over half of the business’s activity is generatedvia PFI and long-term framework contracts which delivera relatively predictable flow of work. The UK’s futureworkload has remained broadly stable compared to thestrong year-end position, at around £1.2 billion. Includedwithin this workload is £0.3 billion of work scheduledfor the second half of 2010 and a further £0.4 billionscheduled for delivery in 2011. Nevertheless, activitylevels are moderating as the government seeks to reducepublic sector spending, initial signs of which are reflectedin the slight year-on-year decline in revenues. Within thisenvironment, performance in the UK was excellent in thefirst half, generating an above-trend margin of 2.9 percent as the business benefited from final accountsettlements on a number of contracts.
We expect this strong performance to continue in thenear term, although we are more cautious on the outlookbeyond 2011 when the impact of anticipated reducedpublic spending on capital projects would be felt. We areactively targeting new sectors, including waste and retail,to offset some of the potential shortfall in work from ourtraditional segments such as education and custodial.Moreover, while the government has announced that therewill be no new Building Schools for the Future projects, webelieve that we are well placed to participate in any
replacement programme of lower cost school buildings.As ever, we remain focused on aligning our cost basewith expected workload levels.
New wins in the UK during the period included a £30million contract to design and build the new Leeds WestAcademy for Leeds City Council and a contract to extendand refurbish Siblands SLD Secondary School in Thornbury,South Gloucestershire, which was our first project underthe Construction Framework South West frameworkannounced late last year. Also in the local governmentsector we were awarded two multi-year constructionframework agreements with North Yorkshire County Counciland the East Midlands Property Alliance respectively, witha combined anticipated value to Interserve of £30 million.
In June the state-of-the-art Help for Heroes RehabilitationComplex at Headley Court, Surrey was opened. As well asbeing the main contractor for this project the Group’sconsulting business was also involved, providing project,cost and design management and technical advice – agood example of how knowledge and experience acrossthe Group can be brought to bear for the benefit ofour clients.
We had another successful period in our infrastructurebusiness. We won a major £70 million project in Preston todesign and construct new storm water tunnels for UnitedUtilities, as part of the KMI+ joint venture, and finaliseda £60 million contract to construct new facilities andupgrade existing works for Thames Water at its Riversidewastewater treatment plant. In June a desalination plantbuilt by our joint venture with Acciona for Thames Waterwas opened - the only four-stage desalination plant to bebuilt in the world.
In the Middle East, which contributes more than half ofthe division’s Total Operating Profit, our diversity acrossthe region, both sectoral and geographic, together withthe strength of our local partnerships, has enabled ourassociate companies to deliver another strong first-halfperformance and, despite tougher trading conditions inDubai, the level of dividends remitted from the regionmore than doubled. Our associate companies continuedto secure new contracts during the period, improvingthe region’s future workload to £234 million at 30 Juneas compared to the year-end position of £197 million.
In our largest market, Qatar, new contracts were securedin both services and construction activities. Our servicesworkload was bolstered by a five-year, £30 million contract
Business reviewcontinued
Interserve Half-Year Aug2010 TP Q6.5 :Artwork 19/8/10 12:36 Page 6

Interserve Plc Half-year report 2010 7
at the Shell Gas-To-Liquids facility at Ras Laffan IndustrialCity and a three-year services contract with Maersk Oil forthe supply of manpower and equipment to onshore andoffshore facilities, worth around £20 million. Our Qatariconstruction business was awarded a £40 million, two-yearcontract to design and construct two energy centres toservice the new Education City being developed near Doha,and further substation contracts with a combined value inexcess of £100 million, the majority of which is with ourlong-term client, Siemens.
The Qatari government has outlined a continuation of itsexpansionary fiscal policy, which, together with its supportof the more subdued banking and real estate sectors, isexpected to ensure that relatively attractive activity levelsare maintained going forward. With the recent rapidexpansion of Liquified Natural Gas (LNG) productioncapabilities at Ras Laffan drawing to an end thegovernment has been keen to ensure there is adequateinfrastructure to support the LNG sector and continues toseek further diversification of its economy. Developmentssuch as Education City, the Heart of Doha redevelopment,New Doha International Airport, Dohaland and Lusail Cityare all examples of such intent. We believe that ouroffering, which encompasses construction, equipmentservices and support services, positions us well to continueto win work in this buoyant environment.
In the UAE we won a multi-million pound contract at thenew Saadiyat Beach Club development in Abu Dhabi, andwhilst Dubai is experiencing significantly lower levels ofactivity than last year we nevertheless continued to securenew work, becoming the exclusive provider of highwaysmaintenance services to the Dubai Roads and TransportAuthority and winning a £50 million contract to expandand improve the Ritz Carlton Hotel on Dubai’s waterfront.
In Oman notable wins included two contracts for thedesign and construction of buildings for Al HosnInvestments, with a combined value of around £20 million.Building on the success of our services operations feedingthe petrochemical sector in Qatar, we have recentlyentered the Omani industrial services market, where wehave long-term relationships in the same sector, via aninvestment of £0.4 million for a 49 per cent stake in OTI,a leading health and safety training and consultancyservices provider. Prospects for Oman remain promisingas the government continues its strategy of diversifyingthe economy away from a reliance on oil production byboosting its industrial and services sectors.
Equipment Services is a global leader in the supply ofspecialised equipment (formwork and falsework) usedin creating major concrete structures, often requiringcomplex specification and design work.
Results summary:H1 2010 H1 2009 Change
Revenue £68.4m £80.4m (14.9)%
Contribution toTotal operating profit £7.7m £20.4m (62.3)%
Operating margin 11.3% 25.4% (14.1)% pts
The division performed creditably in challenging marketconditions, posting a first-half contribution to TotalOperating Profit of £7.7 million. As previously indicated,the record prior-year margin benefited from a number ofmajor hire projects in the UAE which were not replicatedduring this period.
Cash conversion remained well over 100 per cent in theperiod resulting from the continued focus on limiting netcapital expenditure and transferring under-utilised assetsfrom areas of low utilisation to locations with higherdemand or new markets such as Saudi Arabia.
It is pleasing and noteworthy that the division’s geographicreach and success in increasing its overseas business(by 185 per cent over the last six years across over 30countries) has been recognised with the award of theprestigious Queen’s Award for Enterprise: InternationalTrade 2010 in June.
The Middle East region remains the largest market forthe division, with the business operating in the UAE,Qatar, Bahrain, Oman and, more recently, Saudi Arabia,and exporting to the majority of neighbouring countries.During the first half of 2010 our equipment was used onwhat is currently the largest building project in Abu Dhabi,the Nation Towers, whilst in Oman we are providingformwork and propping solutions to the Group’s constructionoperation, Douglas OHI, on the Oman Residence project.We continued to grow in Qatar, working on projects suchas the construction of utility tunnels to supply waterand electricity to the new Lusail City, and are involvedon major bridge structures in Bahrain (Sitra Bridges) andSaudi Arabia (Abha Bridge). However the aggregate ofwork in these countries was insufficient to replace theslowdown in the UAE during the period.
We traded well in Australasia, producing another strongresult, largely due to healthy demand in the mining and
Interserve Half-Year Aug2010 TP Q6.5 :Artwork 19/8/10 12:36 Page 7

8 Interserve Plc Half-year report 2010
infrastructure sectors which helped offset a weakercommercial market. Major projects included theimpressive Rectangular Soccer Stadium and the M80 RingRoad Upgrade in Melbourne where our formwork andshoring solutions are supporting bridge widening. OurFar East businesses recorded an improved, albeit small,contribution to Total Operating Profit on strongeractivity levels.
Trading conditions in Europe continued, as expected, to bechallenging during the period. Our UK operation deliveredmodest growth despite a tough environment, benefitingfrom Olympics-related work, infrastructure projects suchas the Tyne Tunnel and cost-reduction programmes, allof which helped offset a weak commercial sector. Themarkets in Spain and Ireland remained very quiet. Wehave taken action to lower the cost base in both andto move under-utilised equipment to more attractivemarkets, but the near-term prospects in these countriesremain challenging.
Our business in Chile is playing an important role inhelping restore the nation’s infrastructure after theFebruary earthquake and we are involved in theconstruction of the new Hydro Electric plant in Lajain the south of the country.
Looking forward, after the exceptionally strongperformance in 2009 the Middle East operations areexpected to continue to experience quieter marketconditions this year, with the anticipated growth inconstruction activity in Abu Dhabi taking longer tomaterialise than previously expected. However, theestablishment of trading operations in Saudi Arabia isprogressing, with initial contracts having been secured,and we are pursuing an attractive pipeline ofopportunities. The Saudi Arabian construction marketis the largest in the Gulf region and the governmenthas plans for new investment in housing and retail,water and power, railways, airports, seaports andeducation, all of which we expect will providesignificant opportunities for growth in the coming years.
Our businesses in Australasia, the Far East and SouthAmerica are expected to perform well; in particular, ourAustralian operation should benefit from the continuedstrength of the mining industry and associated civilengineering. The rest of our international operations,which operate in Europe and South Africa, are likely tocontinue to face more challenging near-term marketconditions as they are dependent on the strength of local
construction markets. We have taken action to mitigatethe anticipated lower demand levels by reducing costs andcapital expenditure where necessary, and will continue toreview the situation in each territory going forward.
PFI InvestmentsH1 2010 H1 2009 Change
Contribution toTotal operating profit £1.8m £1.8m -
Interest received onsubordinated debtinvestments £1.0m £2.4m (58.3)%
Total contributionto Group results £2.8m £4.2m (33.3)%
After an extremely active period in 2009 the year to datehas been a period of consolidation with respect to ourPFI portfolio. The portfolio continues to make a healthycontribution to Group earnings, with a total contributionto pre-tax profit of £2.8 million. This reduction on the firsthalf of 2009 principally reflects the transfer of the Group’sinterest in 13 investments, valued at £61.5 million, intothe Interserve Pension Scheme in November 2009.
The New Leaf Leisure Centres in Armley and Morley, builtas part of phase three of our successful Leeds BuildingSchools for the Future (BSF) programme, reachedoperational stage in May and June respectively, and wehave now begun the provision of ongoing facilities supportfor the next 25 years.
As at 30 June 2010 we had 20 signed contracts (30 June2009: 33), of which 12 are now operational and eightunder construction, with one more at preferred bidderstage. The reduction in number of contracts since June2009 reflects the above-mentioned transfer of the Group’sinterest in 13 investments into the Interserve PensionScheme. Our total investment commitment on the 20signed contracts was £54.3 million at 30 June 2010 (30June 2009: £75.6 million), of which £25.8 million (30 June2009: £39.1 million) had already been paid. The preferredbidder project will, consequent on financial close, involveinvestment of around £12 million.
PFI is an efficient, proven and transparent means ofdelivering social infrastructure. With our considerableexpertise and track record in delivering, operating andfinancing using PFI structures we believe we are wellplaced to benefit from the further evolution of similarcontracting and funding arrangements for public sector
Business reviewcontinued
Interserve Half-Year Aug2010 TP Q6.5 :Artwork 19/8/10 12:36 Page 8

investments. We are shortlisted on a number of projectsin the health, waste, police and custodial sectors, andwe expect to make further progress in developing andgenerating value from our portfolio.
OutlookDespite UK public sector uncertainties we are confidentof a strong second-half performance, driven by marginimprovement in Support Services and continuedinternational growth.
With our significant international exposure, marginenhancement plan in Support Services and substantialfuture workload we are confident that we have a strongplatform to deliver long-term growth at attractive margins.
Responsibility statement
The names and functions of the directors of Interserve Plcare as listed in the Group’s Annual Report for 2009. A listof current directors is maintained on the Group website:www.interserve.com.
The directors confirm to the best of their knowledge:
a) the condensed set of financial statements has beenprepared in accordance with IAS 34 as adopted by theEuropean Union; and
b) the interim management report includes a fair reviewof the important events during the first six months anddescription of the principal risks and uncertainties forthe remaining six months of the year, as required byDTR 4.2.7R of the Disclosure and Transparency Rules ofthe Financial Services Authority (DTR); and
c) the interim management report includes a fair reviewof the information required by DTR 4.2.8R.
By order of the Board
Adrian Ringrose Tim JonesChief Executive Group Finance Director
10 August 2010
Interserve Plc Half-year report 2010 9
Directors and advisers
ChairmanNorman Blackwell (Lord Blackwell) 1 3
Executive directorsAdrian Ringrose 1 Chief ExecutiveTim Jones Group Finance DirectorSteven DanceBruce Melizan
Non-executive directorsG Patrick Balfour 1 2 3 4
Les Cullen 1 2 3
David Thorpe 1 2 3
David Trapnell 1 2 3
1 Member of the Nomination Committee
2 Member of the Audit Committee
3 Member of the Remuneration Committee
4 Senior Independent Director
Group Company SecretaryTrevor Bradbury
Registered officeInterserve HouseRuscombe ParkTwyfordReadingBerkshire RG10 9JUT +44 (0)118 932 0123F +44 (0)118 932 [email protected]
Registered number88456
Registrar and share transfer officeCapita RegistrarsNorthern HouseWoodsome ParkFenay BridgeHuddersfield HD8 0GAT +44 (0)20 8639 3399F +44 (0)1484 [email protected]
AuditorsDeloitte LLP
BankersRoyal Bank of Scotland plcHSBC Bank plc
StockbrokersJPMorgan Cazenove LimitedOriel Securities Limited
LawyersAshurst LLP
Interserve Half-Year Aug2010 TP Q6.5 :Artwork 19/8/10 12:36 Page 9

10 Interserve Plc Half-year report 2010
We have been engaged by the Company to review thecondensed set of financial statements in the half-yearlyfinancial report for the six months ended 30 June 2010which comprises the consolidated income statement, theconsolidated statement of comprehensive income, theconsolidated balance sheet, the consolidated statementof changes in equity, the consolidated statement of cashflows and related notes 1 to 11. We have read the otherinformation contained in the half-yearly financial reportand considered whether it contains any apparentmisstatements or material inconsistencies with theinformation in the condensed set of financial statements.
This report is made solely to the Company in accordancewith International Standard on Review Engagements (UKand Ireland) 2410 “Review of Interim Financial InformationPerformed by the Independent Auditor of the Entity”issued by the Auditing Practices Board. Our work hasbeen undertaken so that we might state to the Companythose matters we are required to state to them in anindependent review report and for no other purpose.To the fullest extent permitted by law, we do notaccept or assume responsibility to anyone other thanthe Company, for our review work, for this report, orfor the conclusions we have formed.
Directors’ responsibilitiesThe half-yearly financial report is the responsibility of,and has been approved by, the directors. The directorsare responsible for preparing the half-yearly financialreport in accordance with the Disclosure and TransparencyRules of the United Kingdom’s Financial Services Authority.
As disclosed in note 2, the annual financial statementsof the Group are prepared in accordance with IFRSs asadopted by the European Union. The condensed set offinancial statements included in this half-yearly financialreport has been prepared in accordance with InternationalAccounting Standard 34, “Interim Financial Reporting,”as adopted by the European Union.
Our responsibilityOur responsibility is to express to the Company aconclusion on the condensed set of financial statementsin the half-yearly financial report based on our review.
Scope of ReviewWe conducted our review in accordance with InternationalStandard on Review Engagements (UK and Ireland) 2410“Review of Interim Financial Information Performed by theIndependent Auditor of the Entity” issued by the AuditingPractices Board for use in the United Kingdom. A review ofinterim financial information consists of making inquiries,primarily of persons responsible for financial andaccounting matters, and applying analytical and otherreview procedures. A review is substantially less in scopethan an audit conducted in accordance with InternationalStandards on Auditing (UK and Ireland) and consequentlydoes not enable us to obtain assurance that we wouldbecome aware of all significant matters that might beidentified in an audit. Accordingly, we do not expressan audit opinion.
ConclusionBased on our review, nothing has come to our attentionthat causes us to believe that the condensed set offinancial statements in the half-yearly financial reportfor the six months ended 30 June 2010 is not prepared,in all material respects, in accordance with InternationalAccounting Standard 34 as adopted by the European Unionand the Disclosure and Transparency Rules of the UnitedKingdom’s Financial Services Authority.
Deloitte LLPChartered Accountants and Statutory AuditorsLondon, United Kingdom10 August 2010
Independent review report to Interserve Plc
Interserve Half-Year Aug2010 TP Q6.5 :Artwork 19/8/10 12:36 Page 10
Interserve Plc Half-year report 2010 11
Six months ended 30 June 2010 Six months ended 30 June 2009 Year ended 31 December 2009
Before Before Beforeexceptional Exceptional exceptional Exceptional exceptional Exceptionalitems and items and items and items and items and items and
amortisation amortisation amortisation amortisation amortisation amortisationof acquired of acquired of acquired of acquired of acquired of acquiredintangible intangible intangible intangible intangible intangible
assets assets Total assets assets Total assets assets Total£million £million £million £million £million £million £million £million £million
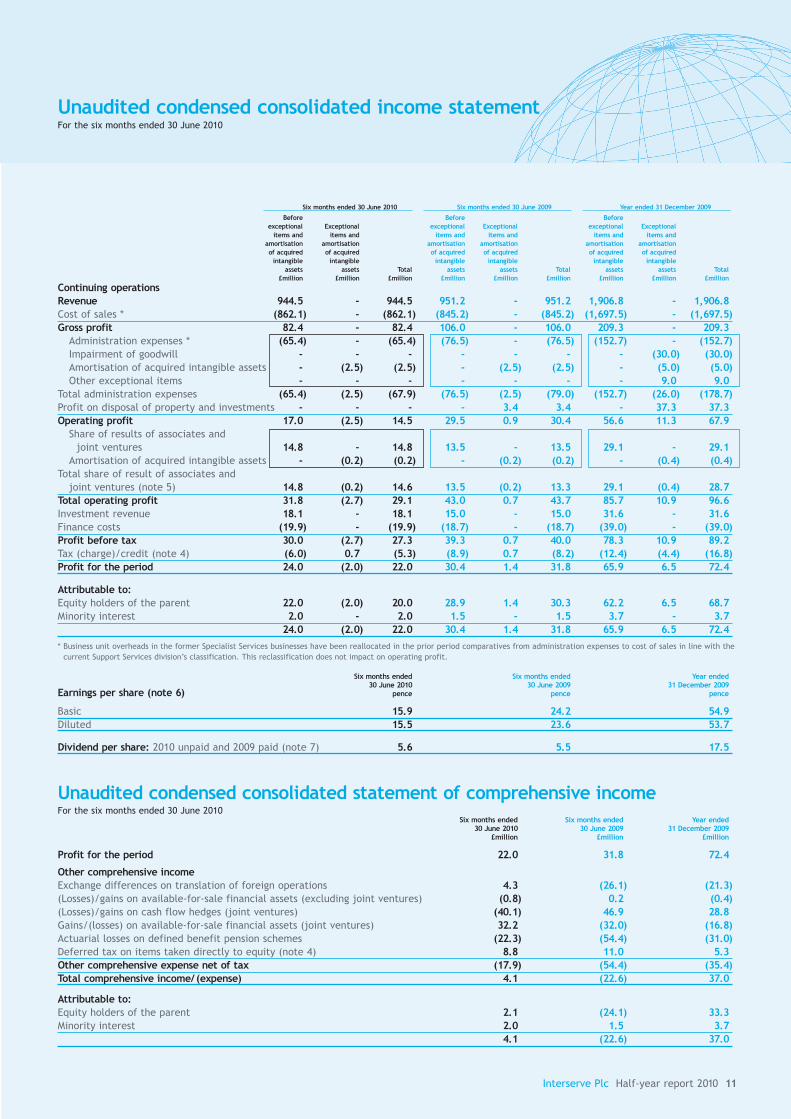
Continuing operationsRevenue 944.5 - 944.5 951.2 - 951.2 1,906.8 - 1,906.8Cost of sales * (862.1) - (862.1) (845.2) - (845.2) (1,697.5) - (1,697.5)Gross profit 82.4 - 82.4 106.0 - 106.0 209.3 - 209.3
Administration expenses * (65.4) - (65.4) (76.5) - (76.5) (152.7) - (152.7)Impairment of goodwill - - - - - - - (30.0) (30.0)Amortisation of acquired intangible assets - (2.5) (2.5) - (2.5) (2.5) - (5.0) (5.0)Other exceptional items - - - - - - - 9.0 9.0
Total administration expenses (65.4) (2.5) (67.9) (76.5) (2.5) (79.0) (152.7) (26.0) (178.7)Profit on disposal of property and investments - - - - 3.4 3.4 - 37.3 37.3Operating profit 17.0 (2.5) 14.5 29.5 0.9 30.4 56.6 11.3 67.9
Share of results of associates andjoint ventures 14.8 - 14.8 13.5 - 13.5 29.1 - 29.1
Amortisation of acquired intangible assets - (0.2) (0.2) - (0.2) (0.2) - (0.4) (0.4)Total share of result of associates and
joint ventures (note 5) 14.8 (0.2) 14.6 13.5 (0.2) 13.3 29.1 (0.4) 28.7Total operating profit 31.8 (2.7) 29.1 43.0 0.7 43.7 85.7 10.9 96.6Investment revenue 18.1 - 18.1 15.0 - 15.0 31.6 - 31.6Finance costs (19.9) - (19.9) (18.7) - (18.7) (39.0) - (39.0)Profit before tax 30.0 (2.7) 27.3 39.3 0.7 40.0 78.3 10.9 89.2Tax (charge)/credit (note 4) (6.0) 0.7 (5.3) (8.9) 0.7 (8.2) (12.4) (4.4) (16.8)Profit for the period 24.0 (2.0) 22.0 30.4 1.4 31.8 65.9 6.5 72.4
Attributable to:Equity holders of the parent 22.0 (2.0) 20.0 28.9 1.4 30.3 62.2 6.5 68.7Minority interest 2.0 - 2.0 1.5 - 1.5 3.7 - 3.7
24.0 (2.0) 22.0 30.4 1.4 31.8 65.9 6.5 72.4* Business unit overheads in the former Specialist Services businesses have been reallocated in the prior period comparatives from administration expenses to cost of sales in line with the
current Support Services division’s classification. This reclassification does not impact on operating profit.
Six months ended Six months ended Year ended30 June 2010 30 June 2009 31 December 2009
Earnings per share (note 6) pence pence pence
Basic 15.9 24.2 54.9Diluted 15.5 23.6 53.7
Dividend per share: 2010 unpaid and 2009 paid (note 7) 5.6 5.5 17.5
Unaudited condensed consolidated statement of comprehensive incomeFor the six months ended 30 June 2010
Six months ended Six months ended Year ended30 June 2010 30 June 2009 31 December 2009
£million £million £million
Profit for the period 22.0 31.8 72.4
Other comprehensive incomeExchange differences on translation of foreign operations 4.3 (26.1) (21.3)(Losses)/gains on available-for-sale financial assets (excluding joint ventures) (0.8) 0.2 (0.4)(Losses)/gains on cash flow hedges (joint ventures) (40.1) 46.9 28.8Gains/(losses) on available-for-sale financial assets (joint ventures) 32.2 (32.0) (16.8)Actuarial losses on defined benefit pension schemes (22.3) (54.4) (31.0)Deferred tax on items taken directly to equity (note 4) 8.8 11.0 5.3Other comprehensive expense net of tax (17.9) (54.4) (35.4)Total comprehensive income/ (expense) 4.1 (22.6) 37.0
Attributable to:Equity holders of the parent 2.1 (24.1) 33.3Minority interest 2.0 1.5 3.7
4.1 (22.6) 37.0
Unaudited condensed consolidated income statementFor the six months ended 30 June 2010
Interserve Half-Year Aug2010 TP Q6.5 :Artwork 19/8/10 12:36 Page 11

12 Interserve Plc Half-year report 2010
30 June 2010 30 June 2009 31 December 2009£million £million £million
Non-current assetsGoodwill 198.9 228.9 198.9Other intangible assets 30.5 33.5 31.9Property, plant and equipment 138.6 143.6 148.8Interests in joint ventures 67.2 117.7 67.4Interests in associated undertakings 62.2 69.0 57.0Deferred tax asset 32.4 35.5 31.4
529.8 628.2 535.4
Current assetsInventories 18.1 21.6 20.1Trade and other receivables 387.8 395.3 355.3Cash and deposits 49.6 70.4 60.9
455.5 487.3 436.3Total assets 985.3 1,115.5 971.7
Current liabilitiesBank overdrafts (11.4) (13.7) (11.6)Trade and other payables (494.2) (492.7) (482.7)Current tax liabilities (7.1) (16.4) (8.5)Short-term provisions (23.2) (15.5) (23.1)
(535.9) (538.3) (525.9)Net current liabilities (80.4) (51.0) (89.6)
Non-current liabilitiesBank loans (90.0) (140.0) (85.0)Trade and other payables (9.2) (4.8) (9.0)Non-current tax liabilities (9.1) (9.1) (9.1)Long-term provisions (25.5) (22.6) (25.7)Retirement benefit obligation (105.3) (205.1) (95.3)
(239.1) (381.6) (224.1)Total liabilities (775.0) (919.9) (750.0)Net assets 210.3 195.6 221.7
EquityShare capital 12.6 12.5 12.5Share premium account 112.7 112.7 112.7Capital redemption reserve 0.1 0.1 0.1Merger reserve 49.0 49.0 49.0Hedging and translation reserves 67.5 92.9 69.3Investment in own shares (0.5) (0.5) (0.5)Retained earnings (34.7) (73.2) (24.1)Equity attributable to equity holders of the parent 206.7 193.5 219.0Minority interest 3.6 2.1 2.7Total equity 210.3 195.6 221.7
Unaudited condensed consolidated balance sheetAt 30 June 2010
Interserve Half-Year Aug2010 TP Q7:Artwork 24/8/10 11:03 Page 12

Interserve Plc Half-year report 2010 13
Hedging AttributableCapital and Investment to equity
Share Share redemption Merger translation in own Retained holders of Minoritycapital premium reserve reserve reserves shares earnings the parent interest Total£million £million £million £million £million £million £million £million £million £million
Balance at 31 December 2008 12.5 112.7 0.1 49.0 108.3 (0.5) (51.8) 230.3 2.0 232.3Total comprehensive income - - - - (15.2) - (8.9) (24.1) 1.5 (22.6)Dividends paid - - - - - - (14.6) (14.6) (1.4) (16.0)Disposal of available-for-sale
financial asset and relatedcash flow hedges recycledthrough the income statement - - - - (0.2) - - (0.2) - (0.2)
Share-based payments - - - - - - 2.1 2.1 - 2.1Balance at 30 June 2009 12.5 112.7 0.1 49.0 92.9 (0.5) (73.2) 193.5 2.1 195.6Total comprehensive income - - - - 2.1 - 55.3 57.4 2.2 59.6Dividends paid - - - - - - (6.9) (6.9) (1.6) (8.5)Disposal of available-for-sale
financial asset and relatedcash flow hedges recycledthrough the income statement - - - - (25.7) - - (25.7) - (25.7)
Share-based payments - - - - - - 0.7 0.7 - 0.7Balance at 31 December 2009 12.5 112.7 0.1 49.0 69.3 (0.5) (24.1) 219.0 2.7 221.7Total comprehensive income - - - - (1.8) - 3.9 2.1 2.0 4.1Dividends paid - - - - - - (15.1) (15.1) (1.1) (16.2)Shares issued 0.1 - - - - - - 0.1 - 0.1Share-based payments - - - - - - 0.6 0.6 - 0.6Balance at 30 June 2010 12.6 112.7 0.1 49.0 67.5 (0.5) (34.7) 206.7 3.6 210.3
Unaudited condensed consolidated statement of changes in equityFor the six months ended 30 June 2010
Interserve Half-Year Aug2010 TP Q6.5 :Artwork 19/8/10 12:36 Page 13

14 Interserve Plc Half-year report 2010
Six months ended Six months ended Year ended30 June 2010 30 June 2009 31 December 2009
£million £million £million
Operating activitiesTotal operating profit 29.1 43.7 96.6Adjustments for:Amortisation of acquired intangible assets 2.5 2.5 5.0Impairment of goodwill - - 30.0Amortisation of capitalised software development 0.4 - 0.1Depreciation of property, plant and equipment 12.2 12.4 24.4Profit on disposal of property and investments - (3.4) (37.3)Pension payments in excess of current service cost (13.5) (6.8) (15.5)Special pension contribution - - (61.5)Pension curtailment - - (20.6)Share of results of associates and joint ventures (14.6) (13.3) (28.7)Charge relating to share-based payments 0.6 2.1 3.1Gain on disposal of property, plant and equipment (5.9) (3.3) (7.2)Operating cash flows before movements in working capital 10.8 33.9 (11.6)Decrease in inventories 2.4 4.4 6.9(Increase)/decrease in receivables (32.2) (28.4) 13.8Increase in payables 11.0 28.0 31.9Cash generated by operations (8.0) 37.9 41.0Taxes paid (1.5) (6.5) (15.7)Net cash from operating activities (9.5) 31.4 25.3
Investing activitiesInterest received 1.9 2.8 7.2Dividends received from associates and joint ventures 13.4 5.2 17.6Proceeds on disposal of property, plant and equipment 10.6 6.6 15.1Capital expenditure (7.4) (14.5) (31.0)Investment in joint ventures - PFI investments (6.3) (3.0) (7.9)Disposal of investments - 7.2 68.0Receipt of loan repayment - PFI investments - 7.6 8.2Receipt of loan repayment - associated undertakings - 0.1 0.3Net cash generated in investing activities 12.2 12.0 77.5
Financing activitiesInterest paid (2.4) (2.0) (5.8)Dividends paid to equity shareholders (15.1) (14.6) (21.5)Dividends paid to minority shareholders (1.1) (1.5) (3.0)Increase in/(repayment of) bank loans 5.0 (25.5) (80.5)Movement in obligations under finance leases (0.3) (0.1) (0.3)Net cash used in financing activities (13.9) (43.7) (111.1)
Net decrease in cash and cash equivalents (11.2) (0.3) (8.3)Cash and cash equivalents at beginning of period 49.3 58.2 58.2Effect of foreign exchange rate changes 0.1 (1.2) (0.6)Cash and cash equivalents at end of period 38.2 56.7 49.3
Cash and cash equivalents compriseCash and deposits 49.6 70.4 60.9Bank overdrafts (11.4) (13.7) (11.6)
38.2 56.7 49.3
Reconciliation of net cash flow to movement in net debtNet decrease in cash and cash equivalents (11.2) (0.3) (8.3)(Increase in)/repayment of bank loans (5.0) 25.5 80.5Movement in obligations under finance leases 0.3 0.1 0.3Change in net debt resulting from cash flows (15.9) 25.3 72.5Effect of foreign exchange rate changes 0.1 (1.2) (0.6)Change in net debt during the period (15.8) 24.1 71.9Net debt - opening (37.3) (109.2) (109.2)Net debt - closing (53.1) (85.1) (37.3)
Unaudited condensed consolidated statement of cash flowsFor the six months ended 30 June 2010
Interserve Half-Year Aug2010 TP Q6.5 :Artwork 19/8/10 12:36 Page 14

Interserve Plc Half-year report 2010 15
Notes to the unaudited interim financial statementsFor the six months ended 30 June 2010
1 General informationInterserve Plc (the Company) is a company incorporated in the United Kingdom. The half-year results and condensed consolidated financialstatements for the six months ended 30 June 2010 (the interim financial statements) comprise the results of the Company and itssubsidiaries (together referred to as the Group) and the Group’s interest in joint ventures and associates.
The directors have considered the Group’s financial position with reference to latest forecasts and the actual performance for the half-yearperiod. Whilst the current economic environment continues to be uncertain, the directors believe that the Group has adequate resources tocontinue in operational existence for the foreseeable future, being a period of at least 12 months, noting in particular that: the majority ofthe Group’s revenue is derived from long-term contracts; the Group had visibility of £1.1 billion of work scheduled for 2011 at the balancesheet date; and the Group has access to committed debt facilities totalling £250 million until at least October 2013. Accordingly, the Groupcontinues to adopt the going concern basis in preparing the interim financial statements.
A copy of the statutory accounts for the year ended 31 December 2009 has been delivered to the Registrar of Companies. The auditors’report on those accounts was unqualified and did not contain statements made under sections 498(2) or (3) of the Companies Act 2006.
The interim financial statements for the six months ended 30 June 2010 have been reviewed but have not been audited (see page 10).
2 Accounting policies and principal risksThe interim financial statements have been prepared in accordance with IAS 34 Interim financial reporting, the recognition andmeasurement criteria of International Financial Reporting Standards (IFRSs) as adopted by the European Union and the disclosurerequirements of the Listing Rules. The financial information set out in this interim report does not constitute statutory accounts as definedin section 434 of the Companies Act 2006. The interim financial statements do not include all information required for full annual financialstatements and should be read in conjunction with the Annual Report and Financial Statements for the year ended 31 December 2009.
The accounting policies and methods of computation followed in the interim financial statements are consistent with those published in theGroup’s Annual Report and Financial Statements for the year ended 31 December 2009 and which are available on the Group’s website atwww.interserve.com.
In addition, these accounting policies used are consistent with those that the directors intend to use in the Annual Report and FinancialStatements for the year ending 31 December 2010. Taxes on income in the interim period are accrued using the tax rate that would beapplicable to expected total annual earnings.
Significant standards and interpretations introduced during the period:
IFRIC 12 Service concession arrangementsThe standard requires that where income received on the asset is not on a “per use” basis then the asset should be classified as available-for-sale. In addition revenue generated from the concession should be treated in accordance with IAS 11 and 18 and that interest should notbe capitalised. The introduction of this IFRIC did not have a material impact on the Group’s results or disclosures.
IFRIC 17 Distributions of non-cash assets to ownersDoes not impact the Group.
IFRS 3 (revised 2008) Business combinationsThe standard introduces the requirement to fair value when there is a change of control and impacts what is included as consideration to avendor. These changes impact prospective changes to acquired undertakings and have no material impact on the Group’s results or disclosures.
IAS 27 (revised 2008) Consolidated separate financial statementsThe standard deals with changes in control or significant influence in Group undertakings and has no impact on the Group’s results.
IAS 28 (revised 2008) Investment in associatesThe standard deals with the treatment of an associate and the equity method of accounting for associates. The Group already complies withthe requirements.
At the date of authorisation of these interim financial statements the following standards and interpretations were in issue but not yeteffective and therefore have not been applied in these interim financial statements:
IFRS 1 (amended) First-time adoption of IFRS - limited exemptions from comparative IFRS 7 disclosures
IFRIC 14 Prepayments of a minimum funding requirement
IFRIC 19 Extinguishing financial liabilities with equity instruments
IFRS 9 Financial instruments
IAS 24 Related party disclosures (amended Nov 2009)
The directors anticipate that the adoption of these standards and interpretations in future periods will have no material impact on thefinancial statements of the Group.
The principal risks and uncertainties facing the Group are those described on pages 24 to 25 of the Group’s Annual Report and FinancialStatements for the year ended 31 December 2009. The directors expect that the Group’s profits will continue to be weighted to the second-half.
Interserve Half-Year Aug2010 TP Q6.5 :Artwork 19/8/10 12:36 Page 15

16 Interserve Plc Half-year report 2010
Notes to the unaudited interim financial statementscontinued
3 Business and geographical segments(a) Business segmentsDuring the previous 12 months, the Specialist Services division had become progressively integrated into services offered by the FacilitiesManagement division to its third party customers. As a result on 14 January 2010 the Group merged the Facilities Management andsubstantially all of the Specialist Services divisions into a single reporting segment, forming the Support Services division. Prior periodcomparatives have been adjusted accordingly. The Group is now organised into four operating divisions, as set out below. The Groupinternally reviews and allocates resources to each of these operating divisions and each has a divisional managing director who reportsinto and forms part of the executive board.
• Support Services: provision of outsourced support services to public- and private-sector clients.
• Project Services: design, construction and maintenance of buildings and infrastructure.
• Equipment Services: design, hire and sale of formwork, falsework and associated access equipment.
• PFI Investments: transaction structuring and management of the Group’s PFI activities. The Joint ventures - PFI Investmentssegmental figures represent the Group’s share of its PFI special purpose companies.
Segment information about these operating divisions is presented below.
Revenue ResultSix months Six months Year Six months Six months Year
ended ended ended ended ended ended30 June 30 June 31 December 30 June 30 June 31 December
2010 2009 2009 2010 2009 2009£million £million £million £million £million £million
Support Services 538.2 503.8 1,010.2 8.9 10.7 22.1Project Services 380.8 406.4 820.5 23.5 18.1 40.7Equipment Services 68.4 80.4 157.1 7.7 20.4 35.9Joint ventures - PFI Investments - - - 1.8 1.8 4.7Group Services - - - (10.1) (8.0) (17.7)Inter-segment elimination (42.9) (39.4) (81.0) - - -
944.5 951.2 1,906.8 31.8 43.0 85.7Exceptional items - 3.4 16.3Amortisation of acquired intangible assets (2.7) (2.7) (5.4)Total operating profit 29.1 43.7 96.6Investment revenue 18.1 15.0 31.6Finance costs (19.9) (18.7) (39.0)Profit before tax 27.3 40.0 89.2Taxation (5.3) (8.2) (16.8)Profit after tax 22.0 31.8 72.4
Net assets/ (liabilities)30 June 30 June 31 December
2010 2009 2009£million £million £million
Support Services (21.9) (62.7) (21.8)Project Services (97.3) (111.2) (105.1)Equipment Services 132.6 137.6 138.4Joint ventures - PFI Investments 67.2 117.7 67.4
80.6 81.4 78.9Group Services, goodwill and acquired intangible assets 179.2 197.2 177.4
259.8 278.6 256.3Net debt (53.1) (85.1) (37.3)Net assets (excluding minority interest) 206.7 193.5 219.0
Interserve Half-Year Aug2010 TP Q6.5 :Artwork 19/8/10 12:36 Page 16

Interserve Plc Half-year report 2010 17
(b) Geographical segmentsSupport Services is predominantly based in the United Kingdom. Project Services is located in the United Kingdom and operates throughassociates in the Middle East. Equipment Services has operations in all of the geographic segments listed below.
The table below provides an analysis of the Group’s sales by geographical market, irrespective of the origin of the goods/services.
Revenue by geographical market Total operating profitSix months Six months Year Six months Six months Year
ended ended ended ended ended ended30 June 30 June 31 December 30 June 30 June 31 December
2010 2009 2009 2010 2009 2009£million £million £million £million £million £million
United Kingdom 925.6 914.9 1,840.4 23.8 19.2 44.3Rest of Europe 10.6 14.0 27.1 (0.7) 0.4 0.3Middle East & Africa 29.6 40.4 79.8 14.8 27.2 52.0Australasia 16.6 15.8 31.7 4.1 4.8 9.1Far East 3.1 2.9 5.5 0.1 (0.4) (1.2)Americas 1.9 2.6 3.3 (0.2) (0.2) (1.1)Group Services - - - (10.1) (8.0) (17.7)Inter-segment elimination (42.9) (39.4) (81.0) - - -
944.5 951.2 1,906.8 31.8 43.0 85.7Exceptional items - 3.4 16.3Amortisation of acquired intangible assets (2.7) (2.7) (5.4)
29.1 43.7 96.6
Non-current assets30 June 30 June 31 December
2010 2009 2009£million £million £million
United Kingdom 112.3 165.8 117.5Rest of Europe 16.3 18.7 19.8Middle East & Africa 127.0 115.2 108.7Australasia 17.0 15.2 16.0Far East 5.5 5.8 4.8Americas 4.4 4.2 4.2Group Services, goodwill and acquired intangible assets 214.9 267.8 233.0
497.4 592.7 504.0Deferred tax asset 32.4 35.5 31.4Total non-current assets 529.8 628.2 535.4
4 Income tax expenseSix months Six months Year
ended ended ended30 June 30 June 31 December
2010 2009 2009£million £million £million
UK taxation (1.4) 7.4 6.6Overseas taxation 1.5 1.8 3.2Deferred taxation 5.2 (1.0) 7.0
5.3 8.2 16.8Effective tax rate 19.4% 20.5% 18.8%
The effective corporation tax charged represents the best estimate of the weighted average annual corporation tax rate expected for thefull financial year. No account has been taken in these interim financial statements of the 2010 Finance Bill that was substantially enacted inJuly 2010, after the balance sheet date. It is estimated that the reduction in the corporation tax rate from 28% to 27% from April 2011 wouldhave resulted in a £1.2 million reduction in the deferred tax asset held on the balance sheet at 30 June 2010 if the change had been appliedin the interim financial statements.
Interserve Half-Year Aug2010 TP Q6.5 :Artwork 19/8/10 12:36 Page 17

18 Interserve Plc Half-year report 2010
4 Income tax expense (continued)In addition to the income tax charged to the income statement, the following deferred tax charges/(credits) have been recorded directly inequity in the period:
Six months Six months Yearended ended ended
30 June 30 June 31 December2010 2009 2009
£million £million £million
Tax on actuarial loss on pension liability (6.2) (15.2) (8.7)Tax on fair value adjustments on available-for-sale financial assets (0.2) 0.1 (0.1)Tax on fair value adjustments on cash flow hedges (11.3) 13.1 8.1Tax on the fair value adjustments on available-for-sale financial
assets within the PFI special purpose companies 8.9 (9.0) (4.6)(8.8) (11.0) (5.3)
5 Share of results of joint venture and associated undertakings
Six months ended 30 June 2010 Six months ended 30 June 2009 Year ended 31 December 2009Joint Joint Joint
ventures ventures venturesProject Support - PFI Project Support - PFI Project Support - PFIServices Services Investments Total Services Services Investments Total Services Services Investments Total£million £million £million £million £million £million £million £million £million £million £million £million
Revenue 131.6 45.4 43.8 220.8 164.3 47.7 73.1 285.1 319.1 88.1 156.7 563.9
Operating profit 13.5 0.5 0.3 14.3 14.2 1.0 1.7 16.9 28.9 1.8 4.8 35.5Net interest receivable 0.5 - 3.6 4.1 0.4 - 1.1 1.5 0.7 - 3.0 3.7Taxation (1.4) (0.1) (2.1) (3.6) (3.6) (0.3) (1.0) (4.9) (6.5) (0.5) (3.1) (10.1)Group share of profit
after tax 12.6 0.4 1.8 14.8 11.0 0.7 1.8 13.5 23.1 1.3 4.7 29.1Amortisation of acquired
intangible assets (0.2) - - (0.2) (0.2) - - (0.2) (0.4) - - (0.4)Total operating profit 12.4 0.4 1.8 14.6 10.8 0.7 1.8 13.3 22.7 1.3 4.7 28.7Dividends (10.2) (1.0) (2.2) (13.4) (3.8) (1.0) (0.4) (5.2) (13.9) (1.0) (2.7) (17.6)Retained profits 2.2 (0.6) (0.4) 1.2 7.0 (0.3) 1.4 8.1 8.8 0.3 2.0 11.1
The joint venture and associated undertakings are located in the United Kingdom except for the Project Services associates, which arelocated in the Middle East.
6 Earnings per shareThe calculation of earnings per share is based on the following data:
Six months Six months Yearended ended ended
30 June 30 June 31 December2010 2009 2009
Earnings £million £million £million
Earnings for the purposes of basic earnings per share,being net profit attributable to equity holders of the parent 20.0 30.3 68.7
Adjustments:Exceptional items - (3.4) (16.3)Amortisation of acquired intangibles 2.7 2.7 5.4Tax effect of above adjustments (0.7) (0.7) 4.4
Headline earnings 22.0 28.9 62.2
Earnings for the purposes of diluted earnings per share 20.0 30.3 68.7
Six months Six months Yearended ended ended
30 June 30 June 31 December2010 2009 2009
Number Number NumberWeighted average number of shares thousand thousand thousand
Weighted average number of ordinary shares for the purposes of basic and headline earnings per share 125,626 125,057 125,214Effect of dilutive potential ordinary shares:
Share-based payments 3,186 3,566 2,817Weighted average number of ordinary shares for the purposes of diluted earnings per share 128,812 128,623 128,031
Notes to the unaudited interim financial statementscontinued
Interserve Half-Year Aug2010 TP Q6.5 :Artwork 19/8/10 12:37 Page 18

Interserve Plc Half-year report 2010 19
Six months Six months Yearended ended ended
30 June 30 June 31 December2010 2009 2009
Earnings per share pence pence pence
Headline earnings per share 17.5 23.1 49.7Basic earnings per share 15.9 24.2 54.9Diluted earnings per share 15.5 23.6 53.7
7 DividendsSix months Six months Year
ended ended endedDividend 30 June 30 June 31 Decemberper share 2010 2009 2009
pence £million £million £million
Final dividend for the year ended 31 December 2008 11.7 - 14.6 14.6Interim dividend for the year ended 31 December 2009 5.5 - - 6.9Final dividend for the year ended 31 December 2009 12.0 15.1 - -Amount recognised as distribution to equity holders in the period 15.1 14.6 21.5
The 2010 interim dividend of 5.6p per share, amounting to £7.0m, was approved by the directors on 10 August 2010 and has therefore notbeen included as a liability as at 30 June 2010.
8 Defined benefit retirement schemesThe following table sets out the key IAS 19 assumptions used to assess the present value of the defined benefit obligation.
Six months Six months Yearended ended ended
30 June 30 June 31 December2010 2009 2009
Retail price inflation 3.30% pa 3.50% pa 3.50% paDiscount rate 5.40% pa 6.20% pa 5.60% paPension increases in payment:
LPI/RPI 3.20%/3.30% 3.40%/3.50% 3.40%/3.50%Fixed 5% 5.00% 5.00% 5.00%3% or RPI if higher (capped at 5%) 3.60% 3.70% 3.70%
General salary increases 4.05 - 4.80% pa 4.25 - 5.00% pa 4.25 - 5.00% pa
The amount included in the balance sheet arising from the Group’s obligations in respect of the various pension schemes is as follows:
30 June 30 June 31 December2010 2009 2009
£million £million £million
Present value of defined benefit obligation 640.2 597.5 627.4Fair value of schemes’ assets (534.9) (392.4) (532.1)Liability recognised in the balance sheet 105.3 205.1 95.3
The amounts recognised in the income statement are as follows:
Six months Six months Yearended ended ended
30 June 30 June 31 December2010 2009 2009
£million £million £million
Employer’s part of current service cost 3.3 6.0 11.0Interest cost 17.4 16.7 33.2Expected return on schemes’ assets (16.1) (12.2) (24.4)Gains on curtailments and settlements - - (20.6)Total expense/(income) recognised in the income statement 4.6 10.5 (0.8)
Actuarial gains and losses are recognised in full in the period in which they occur. They are recognised directly in equity and presented inthe statement of comprehensive income. In December 2009, the non passport section of the Interserve Pension Scheme was closed to futureaccrual of benefit. As a result a £20.6 million curtailment gain was recognised in the year ending 31 December 2009.
Interserve Half-Year Aug2010 TP Q6.5 :Artwork 19/8/10 12:37 Page 19

20 Interserve Plc Half-year report 2010
9 Share capitalSix months ended Six months ended Year ended
30 June 30 June 31 December2010 2009 2009
Shares thousand Shares thousand Shares thousand
At 1 January 125,368 125,016 125,016Exercised share-based payments 436 352 352At the end of the period 125,804 125,368 125,368
10 Related partiesTransactions between the Company and its subsidiaries, which are related parties, have been eliminated on consolidation and arenot disclosed in this note.
Key management compensation is disclosed on pages 50 to 61 in the Annual Report and Financial Statements for the year ended31 December 2009.
During the period, Group companies entered into the following transactions with related parties who are not members of the Group:
Six months ended Six months ended Year ended30 June 30 June 31 December
2010 2009 2009£million £million £million
Sales of goods and services Joint ventures - PFI Investments 105.1 109.1 195.5Associates 64.3 76.4 135.4
Purchases of goods and services Joint ventures - PFI Investments - - -Associates 1.6 1.3 3.0
Amounts owed by related parties Joint ventures - PFI Investments 0.9 - -Associates 2.6 3.1 1.6
Amounts owed to related parties Joint ventures - PFI Investments - - -Associates - 0.2 -
Sales and purchases of goods and services to related parties were made on normal trading terms.
The amounts outstanding per the above table are unsecured and will be settled in cash. No guarantees have been given or received onthese amounts. No provisions have been made for doubtful debts in respect of the amounts owed by related parties.
11 Contingent liabilitiesOther contingent liabilities of the Group have not materially changed from those published in the Annual Report and Financial Statementsfor the year ended 31 December 2009.
Notes to the unaudited interim financial statementscontinued
Interserve Half-Year Aug2010 TP Q6.5 :Artwork 19/8/10 12:37 Page 20

Interserve Plc Half-year report 2010 21
Principal Group undertakingsAs at 30 June 2010
Support Services
Interservefm Ltd
First Security (Guards) Ltd
Interserve (Defence) Ltd
Interserve Engineering Services Ltd
Interserve Environmental Services Ltd
Interserve (Facilities Management) Ltd
Interserve (Facilities Services-Slough) Ltd1
Interserve Industrial Services Ltd
Interserve Security Ltd
Interserve Security (Fire & Electronics) Ltd
(formerly R & D Security Manufacturing Ltd)
Interserve Specialist Services (Holdings) Ltd
Interserve Technical Services Ltd
Landmarc Support Services Ltd (51%)1
MacLellan International Ltd
MacLellan International Airport Services Ltd
MacLellan Management Services Ltd
PriDE (SERP) Ltd (50%)1
SSD UK Ltd
TASS (Europe) Ltd
Project Services
Interserve Project Services Ltd
Acciona Agua SAU Joint Venture (47%)
Douglas OHI LLC (49%)
Gulf Contracting Co WLL (49%)
How United Services WLL (49%)
Khansaheb Civil Engineering LLC (45%)
Khansaheb Group LLC (49%)
Khansaheb Hussain LLC (49%)
KMI Water Joint Venture (33.33%)
KMI Plus Water Joint Venture (30.83%)
Madina Group WLL (49%)
Occupational Training Institute LLC (49%)
Qatar Inspection Services WLL (49%)
Qatar International Safety Centre WLL (49%)
Severn Glocon (Qatar) WLL (49%)
Equipment Services
RMD Kwikform Ltd
Rapid Metal Developments (Australia) Pty Ltd
Rapid Metal Developments (NZ) Ltd
RMD Kwikform (Al Maha) Qatar WLL (49%)
RMD Kwikform Almoayed Bahrain WLL (49%)
RMD Kwikform Chile SA
RMD Kwikform Holdings Ltd
RMD Kwikform Hong Kong Ltd*
RMD Kwikform Ibérica, SA (95%)
RMD Kwikform Ibérica – Cofragens e Construçôes Metalicas,
Unipessoal, Lda (95%)
RMD Kwikform Ireland Ltd
RMD Kwikform Korea Co, Ltd
RMD Kwikform Middle East LLC (49%)
RMD Kwikform Philippines, Inc*
RMD Kwikform Saudi Arabia LLC
RMD Kwikform (South Africa) (Proprietary) Ltd
PFI Investments
Addiewell Prison (Holdings) Ltd (33.33%)1
Ashford Prison Services Holdings Ltd (33.33%)1
Belfast Educational Services (Derry) Holdings Ltd (50%)1
Belfast Educational Services (Down & Connor) Holdings Ltd (50%)1
Belfast Educational Services (Downpatrick) Holdings Ltd (50%)1
Belfast Educational Services (Strabane) Holdings Ltd (50%)2
Environments for Learning Ltd (50%)2
Harmondsworth Detention Services Ltd (49%)3
Healthcare Support (Newcastle) Holdings Ltd (20%)
Health Management (Carlisle) Holdings Ltd (50%)
Health Management (UCLH) Holdings Ltd (33.33%)
Inteq Services (Holdings) Ltd (50%)1
Kent and East Sussex Weald Hospital Holdings Ltd (25%)
Newcastle Estate Partnership Holdings Ltd (20%)1
NIHG Ltd (31.5%)
Peterborough Prison Management Holdings Ltd (33.33%)1
Pyramid Schools (Plymouth) Design & Build Ltd (50%)2
Pyramid Schools (Plymouth) Holdings Ltd (50%)2
Group Services
Bandt Ltd
Bandt Holdings Ltd
Bandt Properties Ltd
How Group Ltd
How Investments Ltd
Interserve Deutschland GmbH*
Interserve Group Holdings Ltd*
Interserve Holdings Ltd
Interserve Insurance Company Ltd
Interserve Investments Ltd
Interserve PFI 2005 Ltd
MacLellan Group Ltd
The Indium Division Company, S.L.
Tilbury Douglas Projects Ltd
Tilbury Ibérica, SA*
* Shareholding held directly by Interserve Plc (shareholdings in all other companies
are held by subsidiary companies)
The accounting reference date is 31 December unless otherwise stated:
1 31 March
2 30 September
3 31 August
Interserve Half-Year Aug2010 TP Q6.5 :Artwork 19/8/10 12:37 Page 21

This half-year report was printed in the UK byRoyle Print, using vegetable-based inks. The printerand paper mill are accredited both with ISO 14001Environmental Management Systems and with theForest Stewardship Council.
Designed by FONDA.co.uk
TT-COC-002228
Registered OfficeInterserve PlcInterserve HouseRuscombe ParkTwyfordReadingBerkshire RG10 9JU
T +44 (0)118 932 0123F +44 (0)118 932 [email protected]
www.interserve.com
Interserve Half-Year Aug2010 TP Q6.5 :Artwork 19/8/10 12:37 Page bc2