Embed Size (px)
Citation preview

Welcome to the Nine-Month
Sales Conference
Disclaimer
This presentation contains forward looking statements
which reflect Management’s current views and estimates.
The forward looking statements involve certain risks and
uncertainties that could cause actual results to differ materially
from those contained in the forward looking statements.
Potential risks and uncertainties include such factors as general
economic conditions, foreign exchange fluctuations, competitive
product and pricing pressures and regulatory developments
October 20, 2016 Nine-Month Sales 20161

Nine-MonthSales
Conference
Paul Bulcke
Nestlé CEO
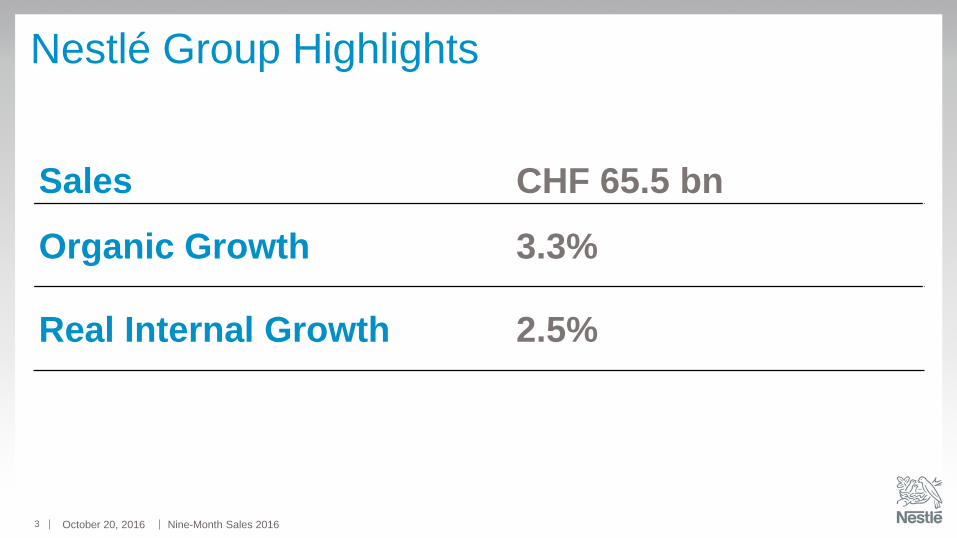
Nestlé Group Highlights
Sales CHF 65.5 bn
Organic Growth 3.3%
Real Internal Growth 2.5%
October 20, 2016 Nine-Month Sales 20163

François-Xavier Roger
Chief Financial Officer
Nine-Month Sales2016
October 20, 2016 Nine-Month Sales 20165
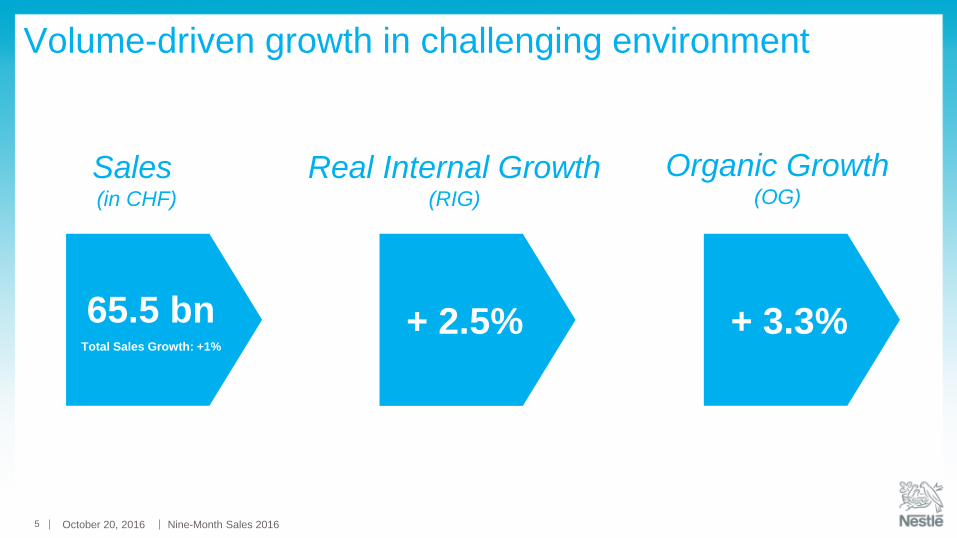
Volume-driven growth in challenging environment
+ 2.5%
Real Internal Growth(RIG)
Sales (in CHF)
65.5 bnTotal Sales Growth: +1%
+ 3.3%
Organic Growth(OG)
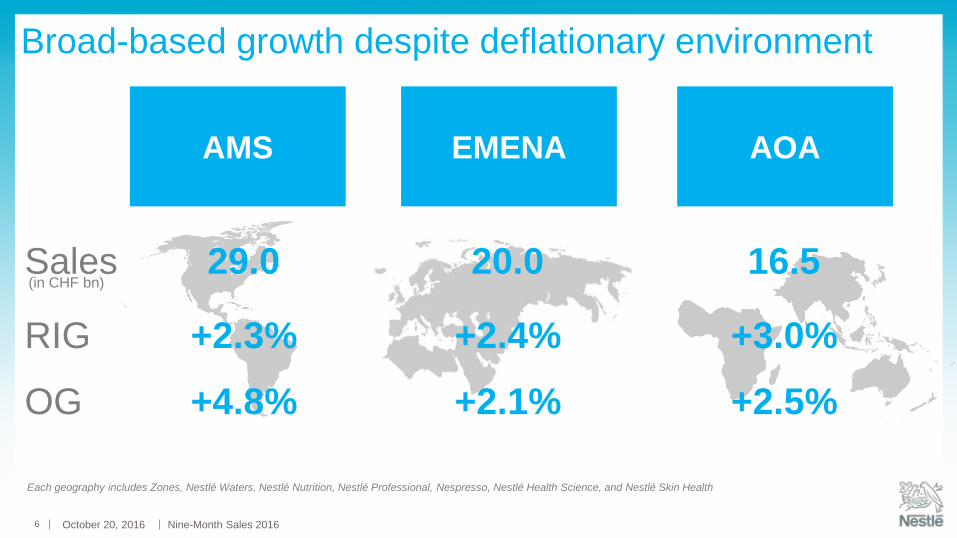
Each geography includes Zones, Nestlé Waters, Nestlé Nutrition, Nestlé Professional, Nespresso, Nestlé Health Science, and Nestlé Skin Health
Sales
RIG
OG
(in CHF bn)
Broad-based growth despite deflationary environment
AOA
16.5
+3.0%
+2.5%
AMS
29.0
+2.3%
+4.8%
EMENA
20.0
+2.4%
+2.1%
October 20, 2016 Nine-Month Sales 20166
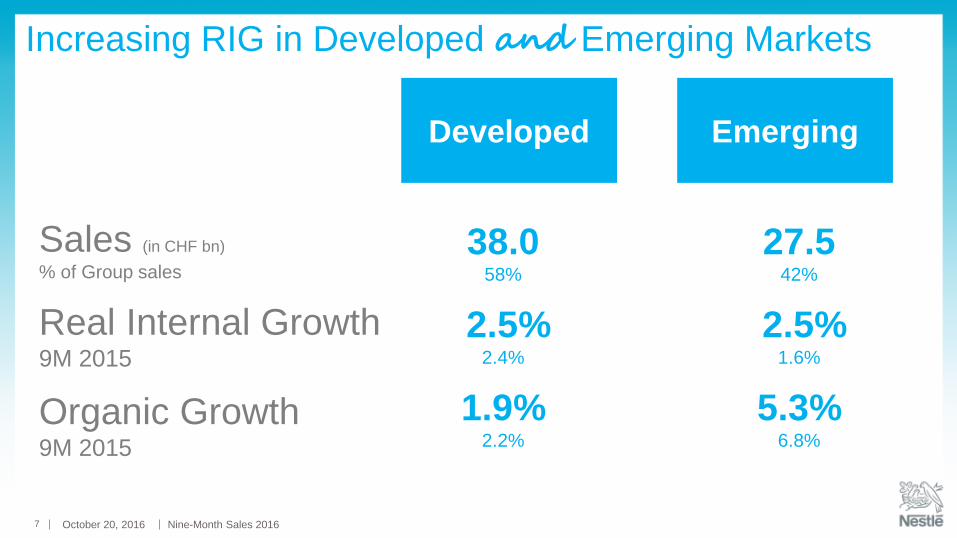
38.058%
2.5%2.4%
1.9%2.2%
October 20, 2016 Nine-Month Sales 20167
Increasing RIG in Developed and Emerging Markets
EmergingDeveloped
Sales (in CHF bn)
% of Group sales
Real Internal Growth9M 2015
Organic Growth9M 2015
27.542%
2.5%1.6%
5.3%6.8%
October 20, 2016 Nine-Month Sales 20168
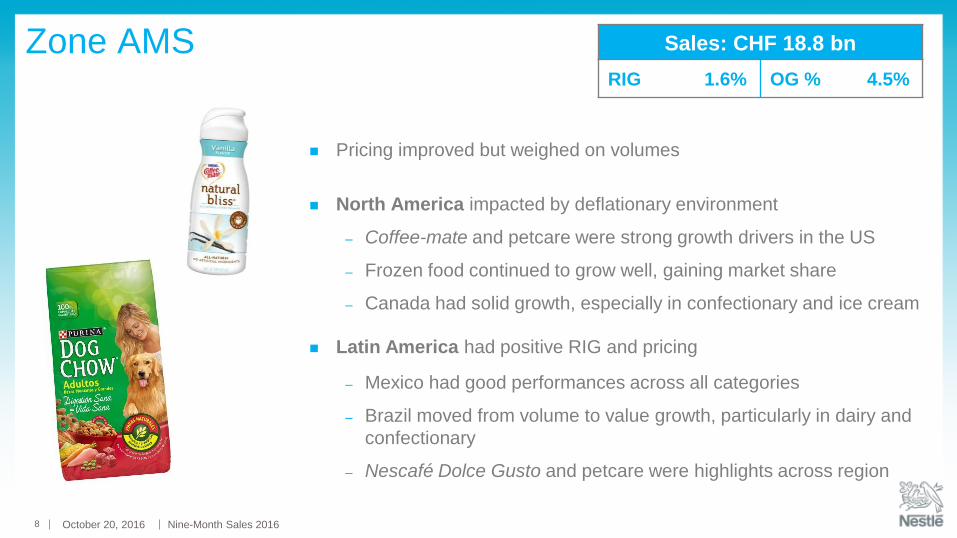
Zone AMS
Pricing improved but weighed on volumes
North America impacted by deflationary environment
– Coffee-mate and petcare were strong growth drivers in the US
– Frozen food continued to grow well, gaining market share
– Canada had solid growth, especially in confectionary and ice cream
Latin America had positive RIG and pricing
– Mexico had good performances across all categories
– Brazil moved from volume to value growth, particularly in dairy and
confectionary
– Nescafé Dolce Gusto and petcare were highlights across region
Sales: CHF 18.8 bn
RIG 1.6% OG % 4.5%
October 20, 2016 Nine-Month Sales 20169
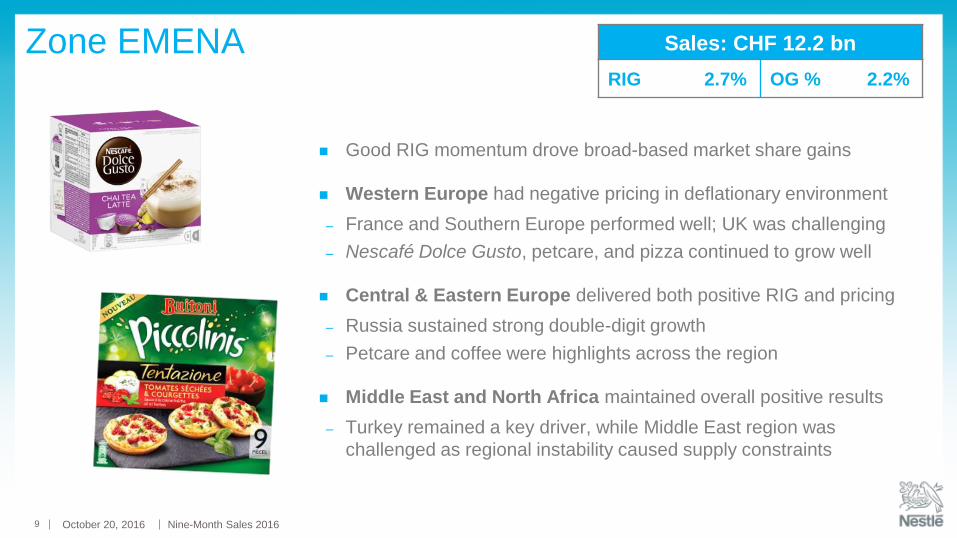
Zone EMENA
Good RIG momentum drove broad-based market share gains
Western Europe had negative pricing in deflationary environment
– France and Southern Europe performed well; UK was challenging
– Nescafé Dolce Gusto, petcare, and pizza continued to grow well
Central & Eastern Europe delivered both positive RIG and pricing
– Russia sustained strong double-digit growth
– Petcare and coffee were highlights across the region
Middle East and North Africa maintained overall positive results
– Turkey remained a key driver, while Middle East region was
challenged as regional instability caused supply constraints
Sales: CHF 12.2 bn
RIG 2.7% OG % 2.2%
October 20, 2016 Nine-Month Sales 201610
Zone AOA
Good growth across most markets in the Zone, but momentum was
diluted mainly by Yinlu in China
China was still impacted by limited category growth and Yinlu’s
performance; however Nescafé and confectionery continued to grow well
India grew well, with Maggi noodles reaching 79% of the pre-crisis sales
level
South-East Asia maintained high single-digit growth, led by Milo and
dairy
Sub-Saharan Africa grew well across most categories, especially with
Maggi and the focus on affordability
In developed markets, Japan performed well through innovation
Sales: CHF 10.6 bn
RIG 2.7% OG % 2.8%
October 20, 2016 Nine-Month Sales 201611
Nestlé Waters
Good growth momentum, driven by volume
– Developed markets sustained positive organic growth contribution
despite negative pricing
– Emerging markets delivered high single-digit organic growth
Premium international brands Perrier and S.Pellegrino continued to
grow well
Good contribution from local brands such as Poland Spring in US,
Buxton in UK, and Santa Maria in Mexico
Sales: CHF 6.1 bn
RIG 4.4% OG % 4.2%
October 20, 2016 Nine-Month Sales 201612
Nestlé Nutrition
Soft category dynamics resulting in growth slowdown
China: category was affected by negative pricing and inventory de-
stocking, however Nestlé and Wyeth brands gained market share
US: back to growth as supply constraints during packaging transition
have been largely resolved
Other emerging markets:
– Brazil, Mexico, Philippines, and Indonesia grew well
– Middle East was challenged due to difficult environment, limiting
product supply
Sales: CHF 7.7 bn
RIG 0.8% OG % 1.3%
October 20, 2016 Nine-Month Sales 201613
Other Businesses
Nestlé Professional
– Emerging markets drove growth, particularly Mexico and Russia
– US was resilient despite pricing pressures; Europe was challenged
Nespresso
– Maintained good broad-based growth across geographies
– VertuoLine grew well in US and now launched in France
Nestlé Health Science
– Consumer Care maintained its double-digit growth, led by Boost
– Medical Nutrition had good performance, led by allergy portfolio
Nestlé Skin Health
– Growth momentum accelerated, driven by consumer products in US
and A&C business
Sales: CHF 10.1 bn
RIG 4.0% OG % 4.6%
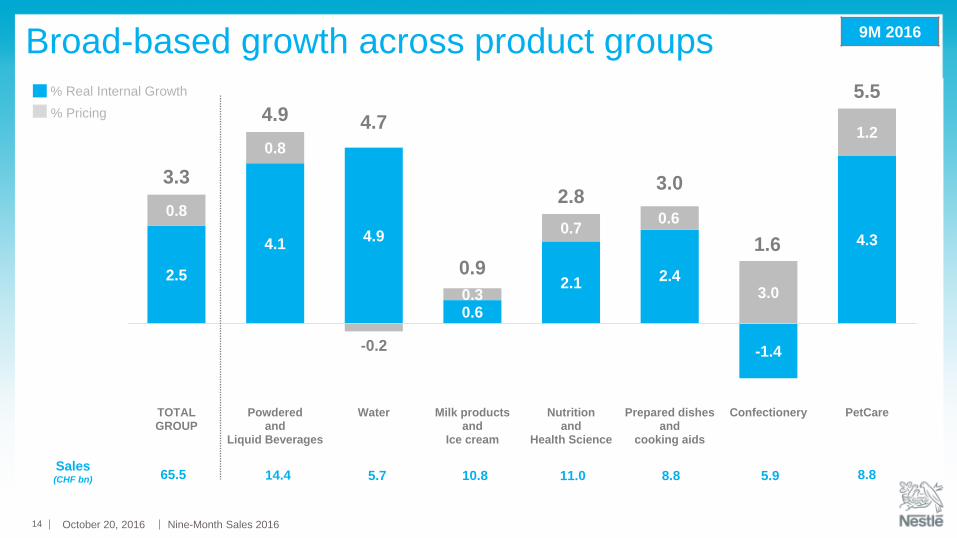
2.5
4.14.9
0.6
2.1 2.4
-1.4
4.3
0.8
0.8
-0.2
0.3
0.70.6
3.0
1.2
3.3
4.9 4.7
0.9
2.83.0
1.6
5.5
-2.0
-1.0
0.0
1.0
2.0
3.0
4.0
5.0
6.0
TOTALGROUP
Powderedand
Liquid Beverages
Water Milk productsand
Ice cream
Nutritionand
Health Science
Prepared dishesand
cooking aids
Confectionery PetCare
October 20, 2016 Nine-Month Sales 201614
Broad-based growth across product groups
Sales (CHF bn) 65.5
% Pricing
% Real Internal Growth
14.4 5.7 10.8 11.0 8.8 5.9 8.8
9M 2016
October 20, 2016 Nine-Month Sales 201615
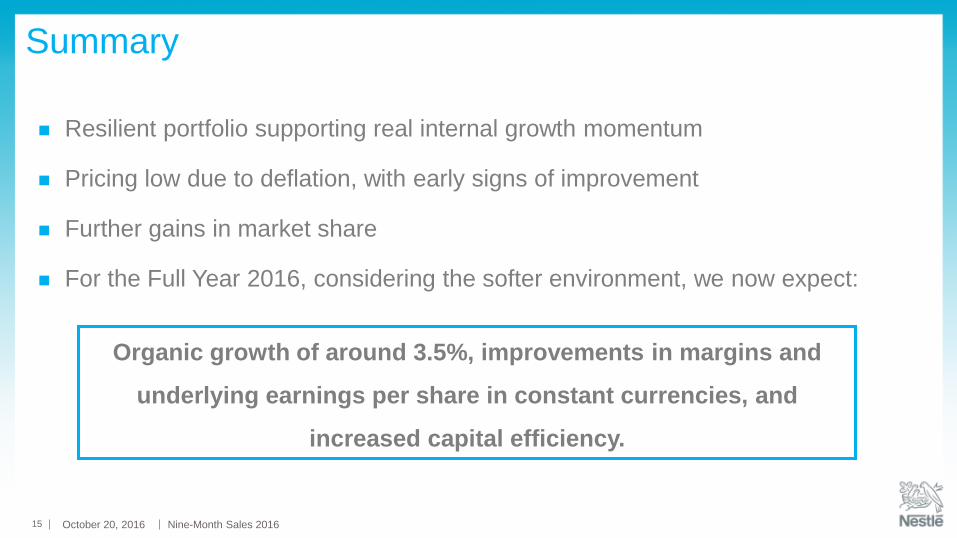
Summary
Resilient portfolio supporting real internal growth momentum
Pricing low due to deflation, with early signs of improvement
Further gains in market share
For the Full Year 2016, considering the softer environment, we now expect:
Organic growth of around 3.5%, improvements in margins and
underlying earnings per share in constant currencies, and
increased capital efficiency.

Nine-MonthSales
Conference
Paul Bulcke
Nestlé CEO

October 20, 2016 Nine-Month Sales 201619
Nine-Month Sales2016
Supporting Slides
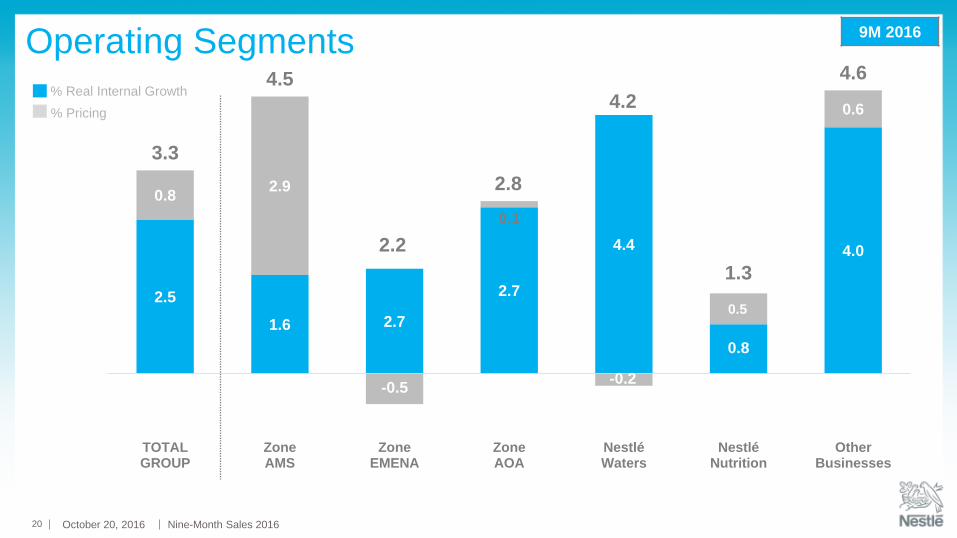
2.5
1.6 2.7
2.7
4.4
0.8
4.0
0.82.9
-0.5
0.1
-0.2
0.5
0.6
3.3
4.5
2.2
2.8
4.2
1.3
4.6
-1.0
0.0
1.0
2.0
3.0
4.0
5.0
TOTALGROUP
ZoneAMS
ZoneEMENA
ZoneAOA
NestléWaters
NestléNutrition
OtherBusinesses
October 20, 2016 Nine-Month Sales 201620
Operating Segments
% Pricing
% Real Internal Growth
9M 2016
October 20, 2016 Nine-Month Sales 201621
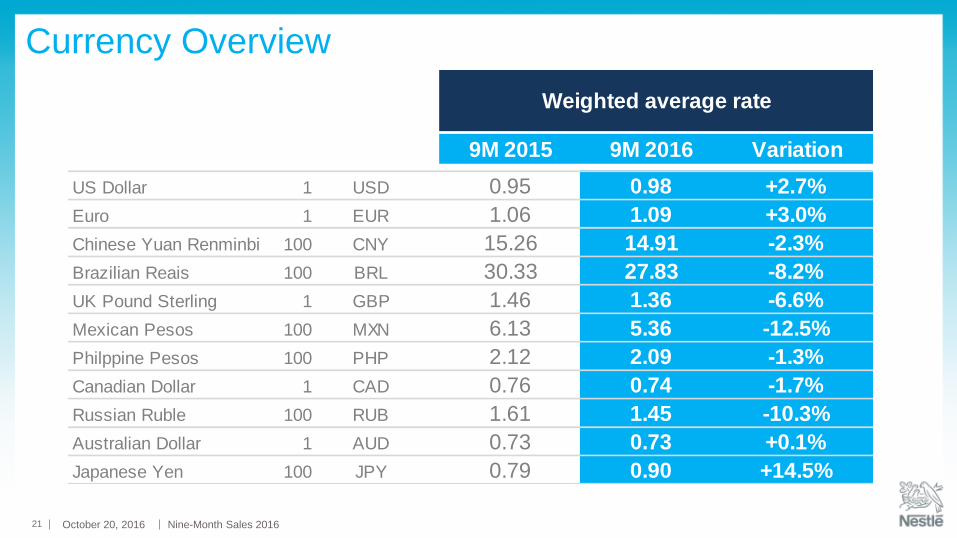
Currency Overview
Weighted average rate
9M 2015 9M 2016 Variation
US Dollar 1 USD 0.95 0.98 +2.7%
Euro 1 EUR 1.06 1.09 +3.0%
Chinese Yuan Renminbi 100 CNY 15.26 14.91 -2.3%
Brazilian Reais 100 BRL 30.33 27.83 -8.2%
UK Pound Sterling 1 GBP 1.46 1.36 -6.6%
Mexican Pesos 100 MXN 6.13 5.36 -12.5%
Philppine Pesos 100 PHP 2.12 2.09 -1.3%
Canadian Dollar 1 CAD 0.76 0.74 -1.7%
Russian Ruble 100 RUB 1.61 1.45 -10.3%
Australian Dollar 1 AUD 0.73 0.73 +0.1%
Japanese Yen 100 JPY 0.79 0.90 +14.5%
October 20, 2016 Nine-Month Sales 201622
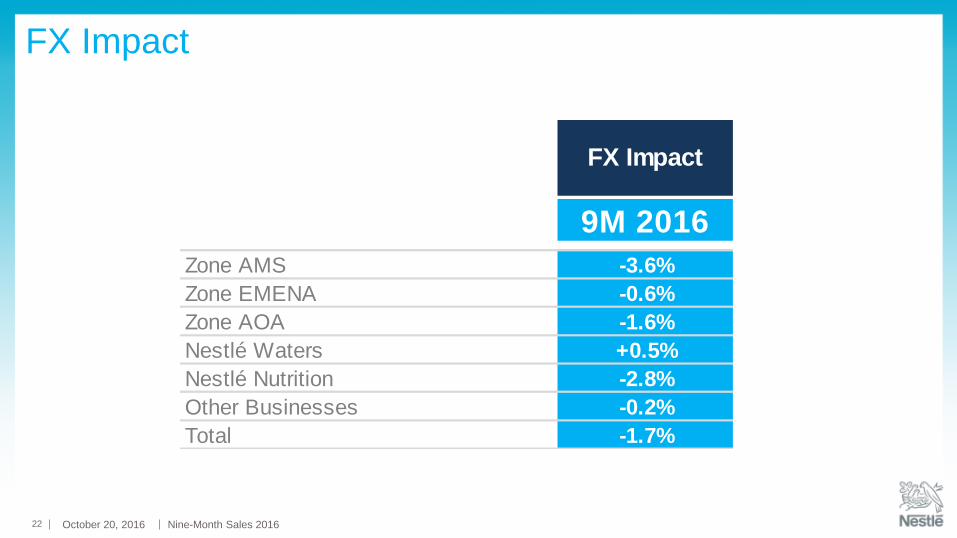
FX Impact
FX Impact
9M 2016
Zone AMS -3.6%
Zone EMENA -0.6%
Zone AOA -1.6%
Nestlé Waters +0.5%
Nestlé Nutrition -2.8%
Other Businesses -0.2%
Total -1.7%
October 20, 2016 Nine-Month Sales 201623
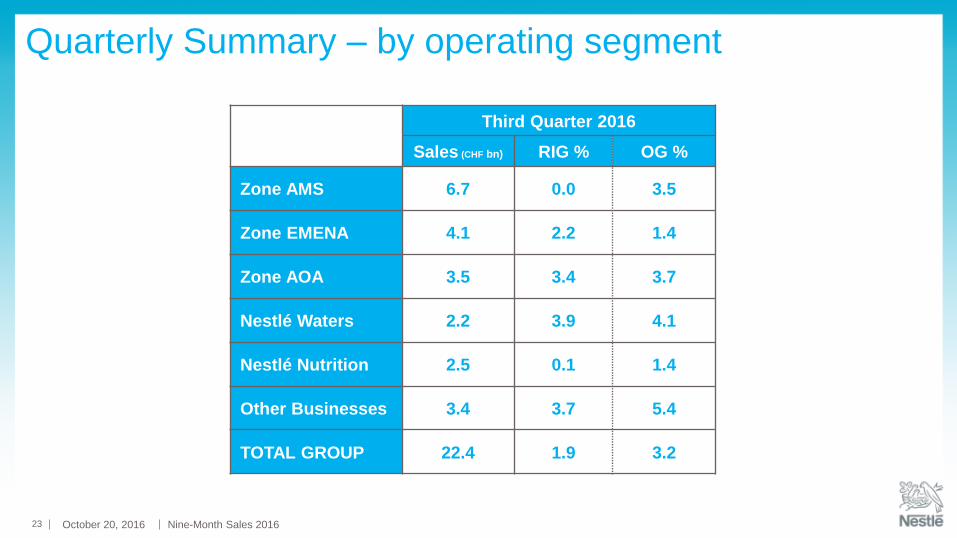
Quarterly Summary – by operating segment
Third Quarter 2016
Sales (CHF bn) RIG % OG %
Zone AMS 6.7 0.0 3.5
Zone EMENA 4.1 2.2 1.4
Zone AOA 3.5 3.4 3.7
Nestlé Waters 2.2 3.9 4.1
Nestlé Nutrition 2.5 0.1 1.4
Other Businesses 3.4 3.7 5.4
TOTAL GROUP 22.4 1.9 3.2
October 20, 2016 Nine-Month Sales 201624
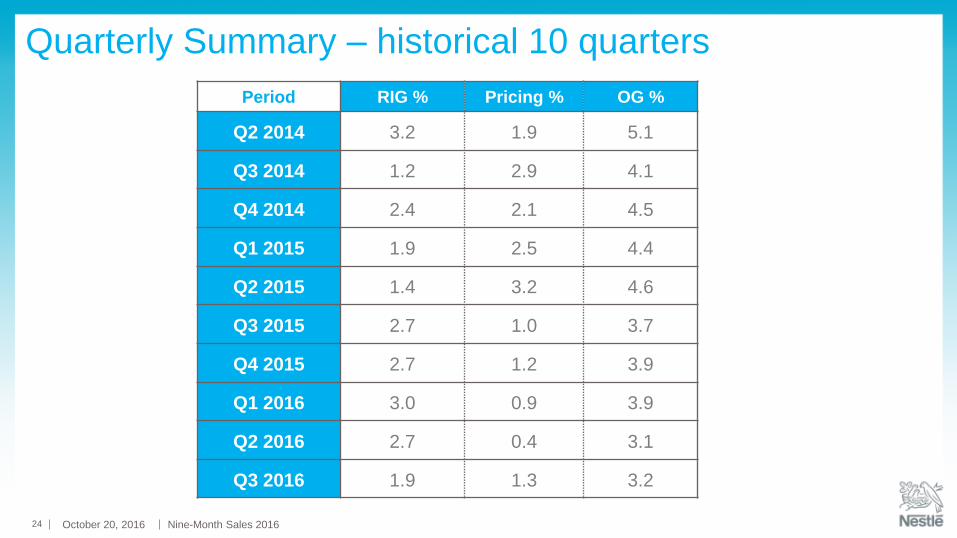
Quarterly Summary – historical 10 quarters
Period RIG % Pricing % OG %
Q2 2014 3.2 1.9 5.1
Q3 2014 1.2 2.9 4.1
Q4 2014 2.4 2.1 4.5
Q1 2015 1.9 2.5 4.4
Q2 2015 1.4 3.2 4.6
Q3 2015 2.7 1.0 3.7
Q4 2015 2.7 1.2 3.9
Q1 2016 3.0 0.9 3.9
Q2 2016 2.7 0.4 3.1
Q3 2016 1.9 1.3 3.2