Embed Size (px)
Citation preview
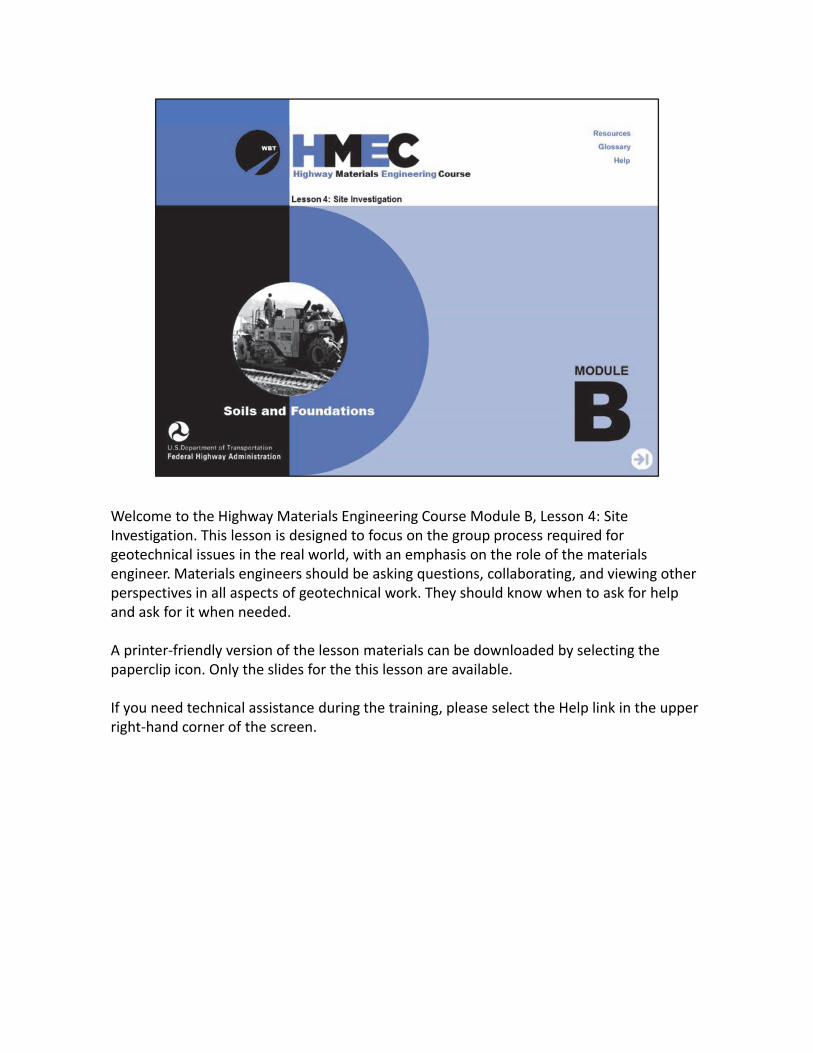
Welcome to the Highway Materials Engineering Course Module B, Lesson 4: Site Investigation. This lesson is designed to focus on the group process required for geotechnical issues in the real world, with an emphasis on the role of the materials engineer. Materials engineers should be asking questions, collaborating, and viewing other perspectives in all aspects of geotechnical work. They should know when to ask for help and ask for it when needed.
A printer‐friendly version of the lesson materials can be downloaded by selecting the paperclip icon. Only the slides for the this lesson are available.
If you need technical assistance during the training, please select the Help link in the upper right‐hand corner of the screen.
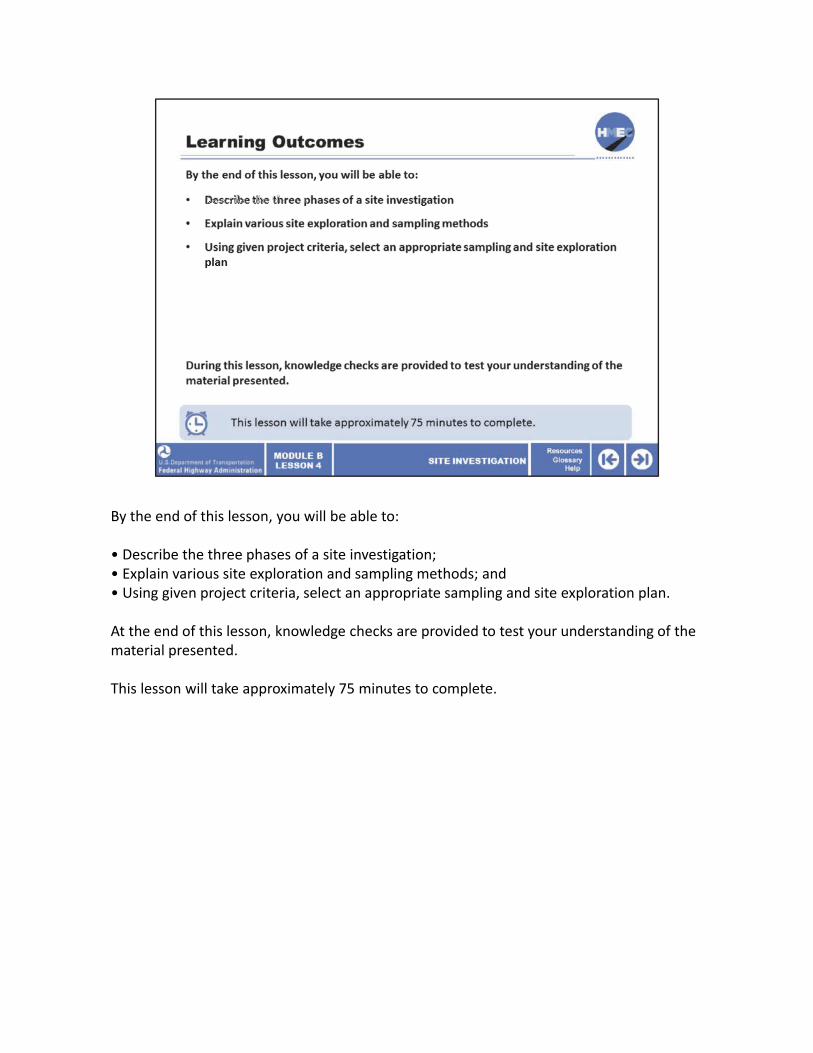
By the end of this lesson, you will be able to:
• Describe the three phases of a site investigation;• Explain various site exploration and sampling methods; and• Using given project criteria, select an appropriate sampling and site exploration plan.
At the end of this lesson, knowledge checks are provided to test your understanding of the material presented.
This lesson will take approximately 75 minutes to complete.
In addition to this course material, there are excellent resources available. You are being provided three PDFs for this lesson: the Soils and Foundations Reference Manual Volume I (FHWA_NHI‐06‐088), Developing a Subsurface Model Flowchart, and Subsurface Investigation Manual.
These documents are referenced during this lesson and are provided through the URLs. Please take a moment to download and open the documents. Note that these documents are quite large and depending on your Internet speed this may take several minutes to download.
At the end of this lesson, you will also be prompted to reference the lesson exercise document. The document referenced during this lesson is attached to the lesson in the paperclip icon. Please take a moment to open and print the document.
Soils and Foundations Reference Manual Volume I http://harpersenterprise.adobeconnect.com/soils_and_foundations_volume1/Developing a Subsurface Model Flowchart http://harpersenterprise.adobeconnect.com/hmecb04subsurfacemodel/Subsurface Investigation Manual https://transportationi.adobeconnect.com/subsurfaceim/

An important outcome of a quality site investigation is that it will minimize uncertainties, and therefore risk, for the design and construction of the project. Site investigation consists of three phases:
1. Site reconnaissance;2. Detailed investigation; and 3. Construction observation and post‐construction monitoring.
Site reconnaissance must include a review of historical data and a thorough site inspection. Detailed investigation includes the on‐site investigation of subsurface conditions.
We will discuss the means and methods of that later in the lesson. Construction observation and post‐construction monitoring are required to verify subsurface conditions are consistent with characterization from the detailed investigation. Observation and monitoring are also critical to ensuring that the project is constructed in accordance with the design intent and the plans and specifications. We will discuss construction observation and monitoring in detail during lessons on individual geotechnical features.
The cost of a thorough, well‐planned site reconnaissance and a detailed site investigation is 1%–2% of the project cost. Think of that when you consider that 50% of claims are based on geotechnical issues.
Please take a moment and go to page 3‐10 (114) table 3‐2 from the Soils and Foundations

Reference Manual Volume I to read about common landforms of transported soils and their engineering significance.
Image description: Photo of Highway system.
Image description: Photo of Soil borings.
Image description: Photo of worker monitoring ground water.
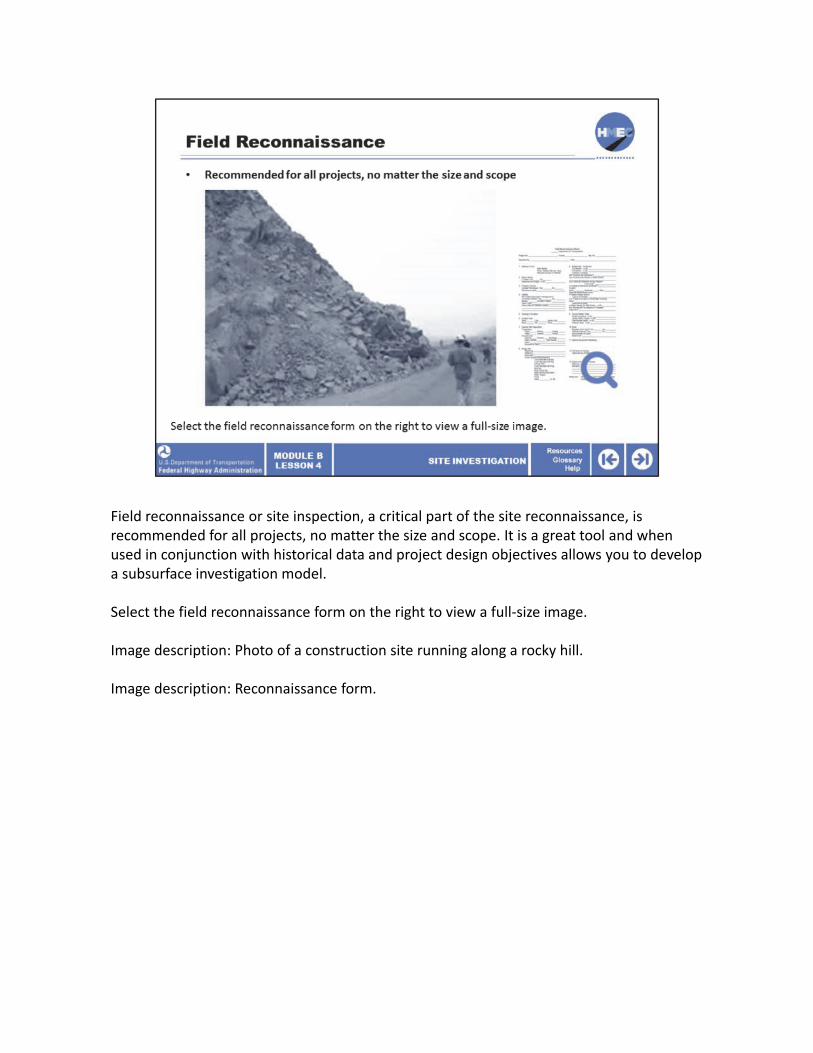
Field reconnaissance or site inspection, a critical part of the site reconnaissance, is recommended for all projects, no matter the size and scope. It is a great tool and when used in conjunction with historical data and project design objectives allows you to develop a subsurface investigation model.
Select the field reconnaissance form on the right to view a full‐size image.
Image description: Photo of a construction site running along a rocky hill.
Image description: Reconnaissance form.
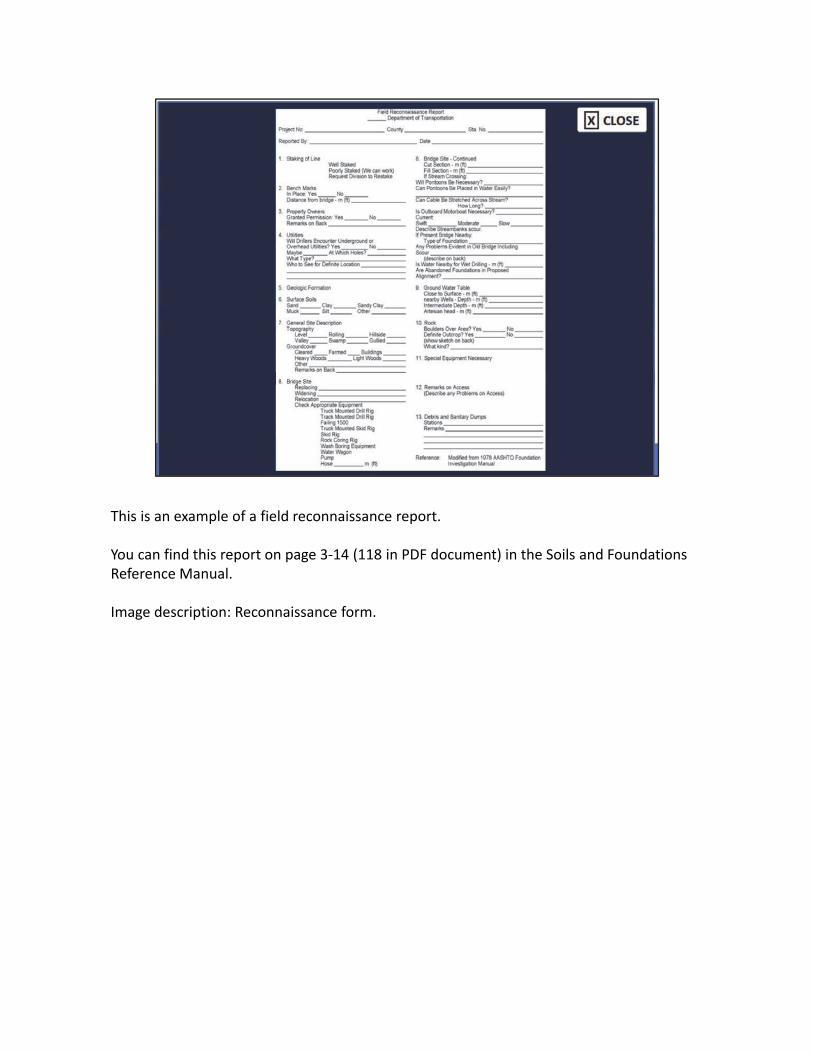
This is an example of a field reconnaissance report.
You can find this report on page 3‐14 (118 in PDF document) in the Soils and Foundations Reference Manual.
Image description: Reconnaissance form.

This photo represents what might be seen during a site inspection. Select the box to answer the question, what do you see in this photo that might indicate a problem site?
Image description: Photo of a construction site.
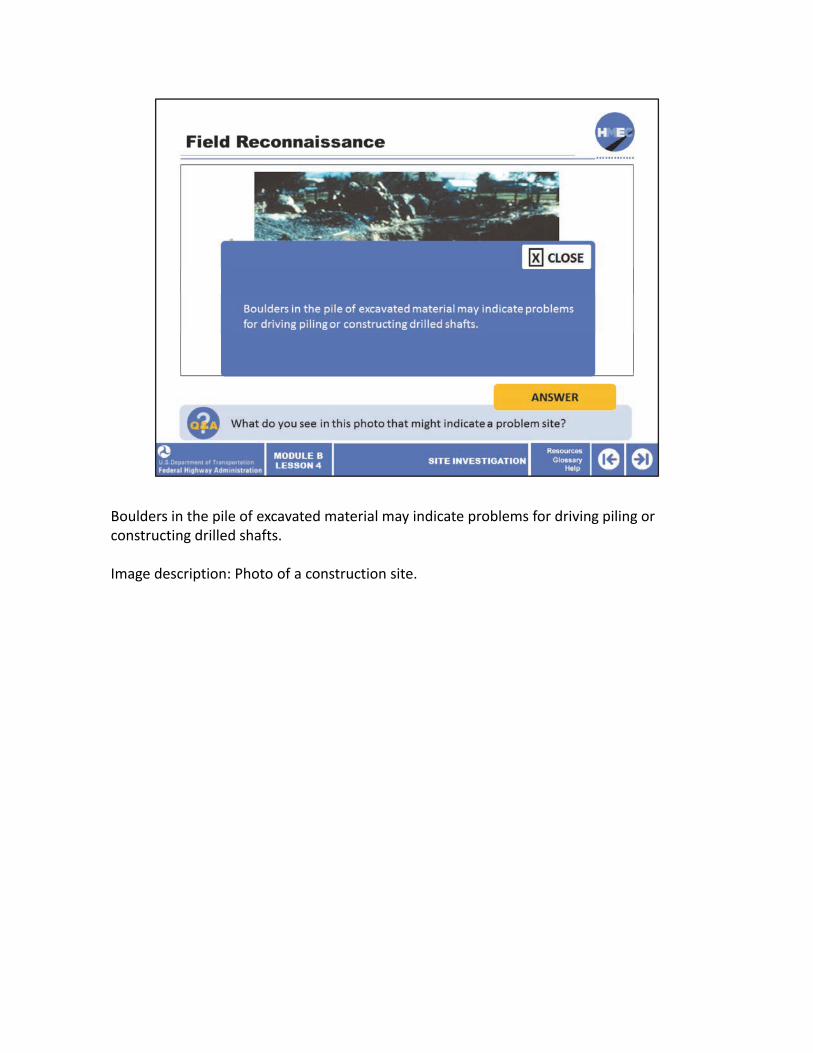
Boulders in the pile of excavated material may indicate problems for driving piling or constructing drilled shafts.
Image description: Photo of a construction site.

“If you do not know what you should be looking for in a site investigation, you are not likely to find much of value.” This is a quote from almost 50 years ago that still holds true today, especially in geotechnical engineering. Keep this in mind as we discuss the importance of considering design objectives and the subsurface investigation model over the next few slides.
Image description: Illustration of a construction worker looking at a rock in his hand.
Image description: Illustration of a site map.
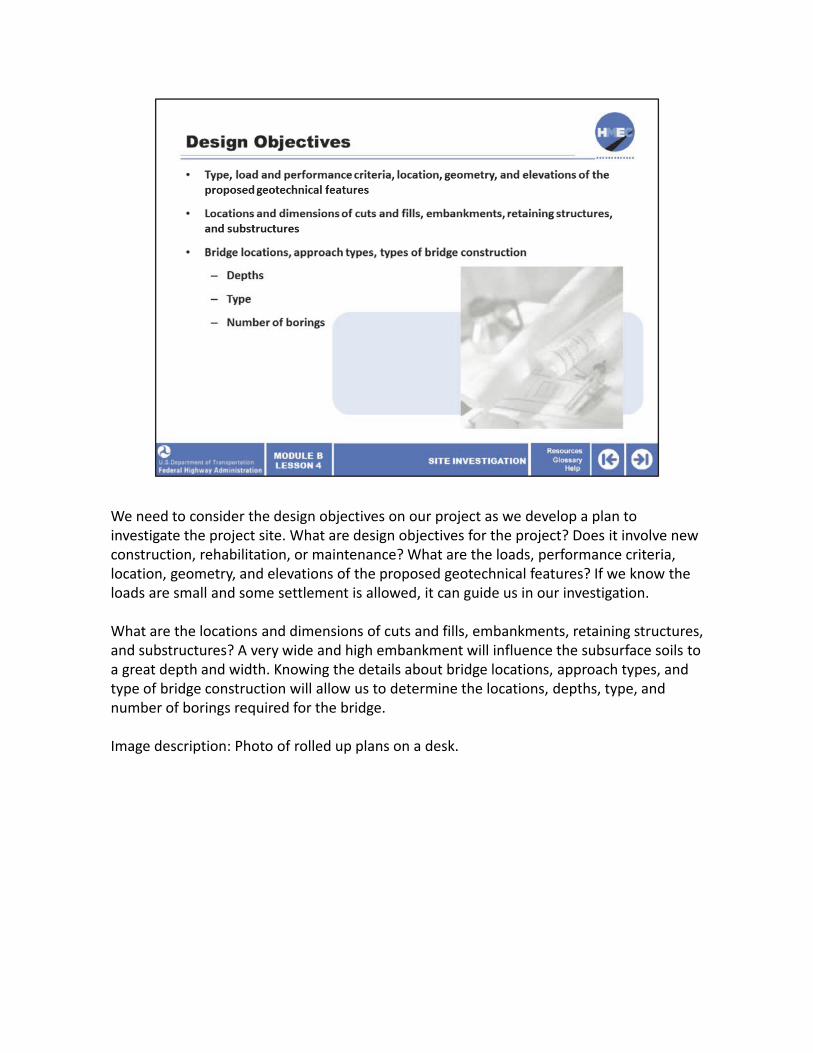
We need to consider the design objectives on our project as we develop a plan to investigate the project site. What are design objectives for the project? Does it involve new construction, rehabilitation, or maintenance? What are the loads, performance criteria, location, geometry, and elevations of the proposed geotechnical features? If we know the loads are small and some settlement is allowed, it can guide us in our investigation.
What are the locations and dimensions of cuts and fills, embankments, retaining structures, and substructures? A very wide and high embankment will influence the subsurface soils to a great depth and width. Knowing the details about bridge locations, approach types, and type of bridge construction will allow us to determine the locations, depths, type, and number of borings required for the bridge.
Image description: Photo of rolled up plans on a desk.
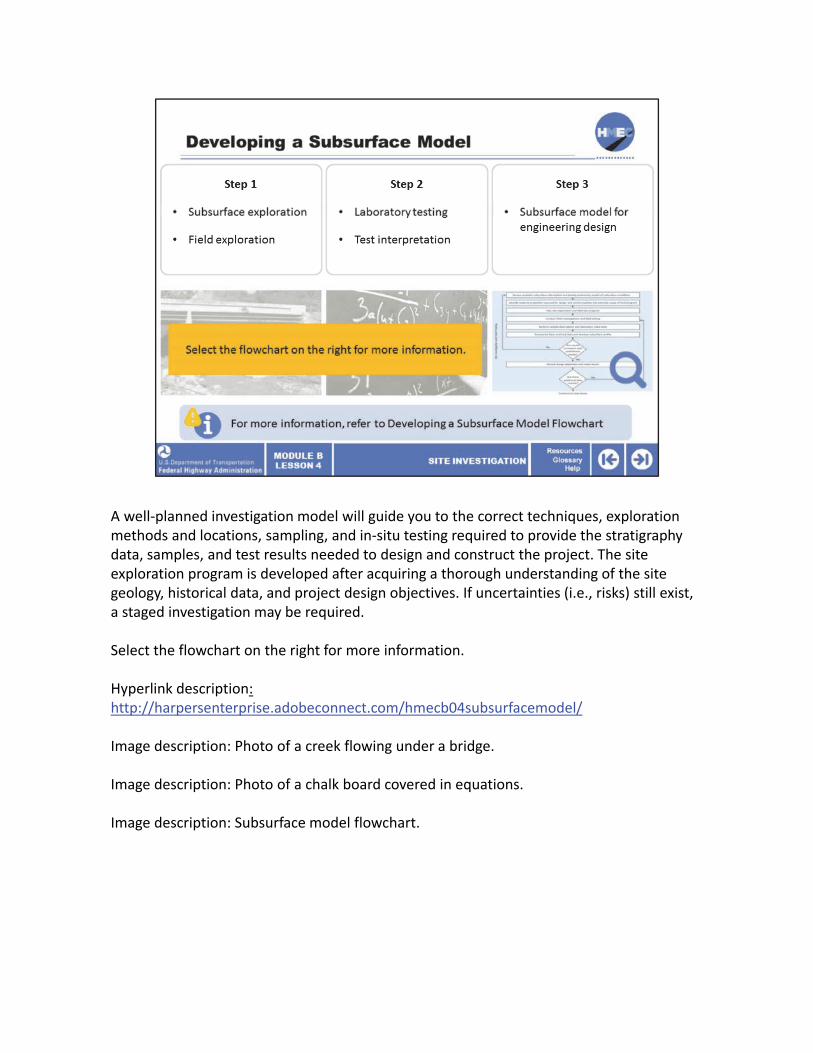
A well‐planned investigation model will guide you to the correct techniques, exploration methods and locations, sampling, and in‐situ testing required to provide the stratigraphy data, samples, and test results needed to design and construct the project. The site exploration program is developed after acquiring a thorough understanding of the site geology, historical data, and project design objectives. If uncertainties (i.e., risks) still exist, a staged investigation may be required.
Select the flowchart on the right for more information.
Hyperlink description: http://harpersenterprise.adobeconnect.com/hmecb04subsurfacemodel/
Image description: Photo of a creek flowing under a bridge.
Image description: Photo of a chalk board covered in equations.
Image description: Subsurface model flowchart.
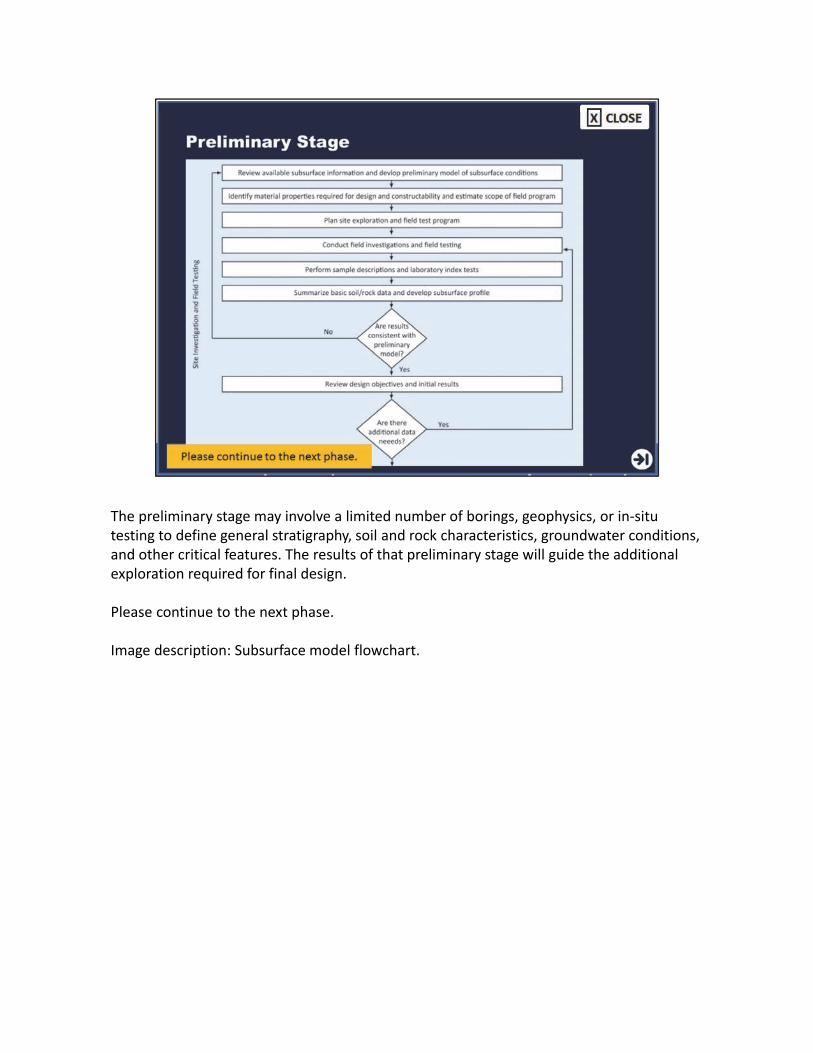
The preliminary stage may involve a limited number of borings, geophysics, or in‐situ testing to define general stratigraphy, soil and rock characteristics, groundwater conditions, and other critical features. The results of that preliminary stage will guide the additional exploration required for final design.
Please continue to the next phase.
Image description: Subsurface model flowchart.
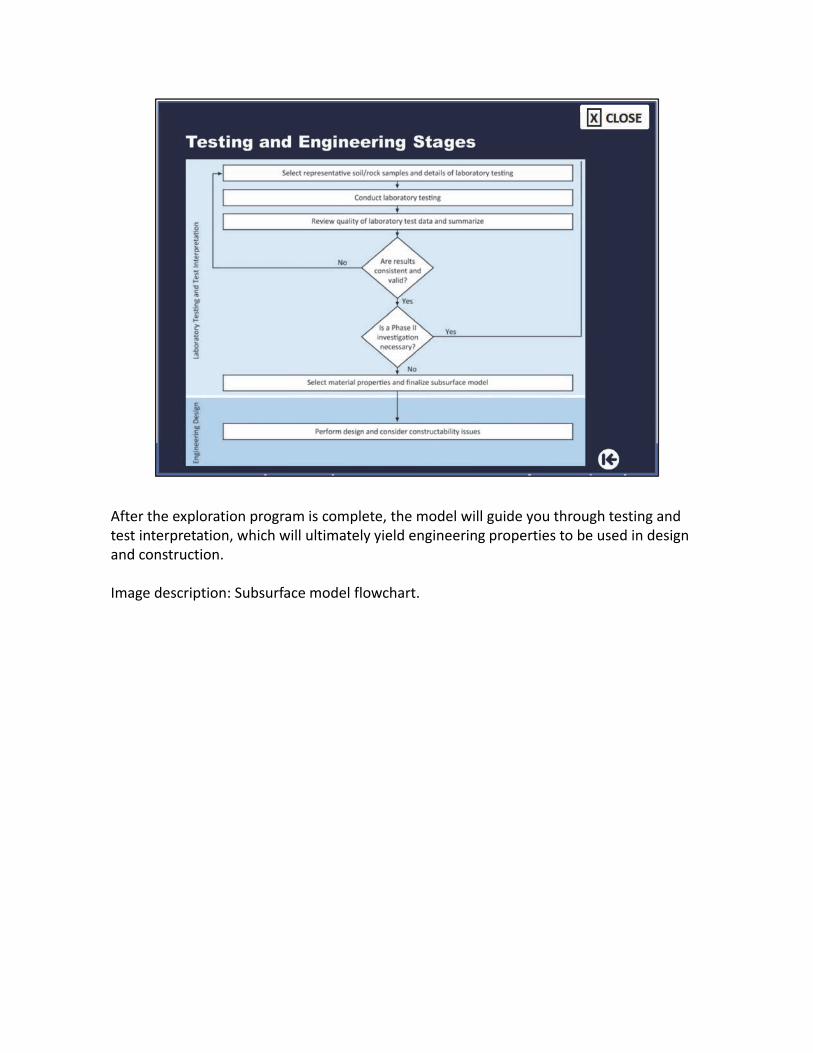
After the exploration program is complete, the model will guide you through testing and test interpretation, which will ultimately yield engineering properties to be used in designand construction.
Image description: Subsurface model flowchart.
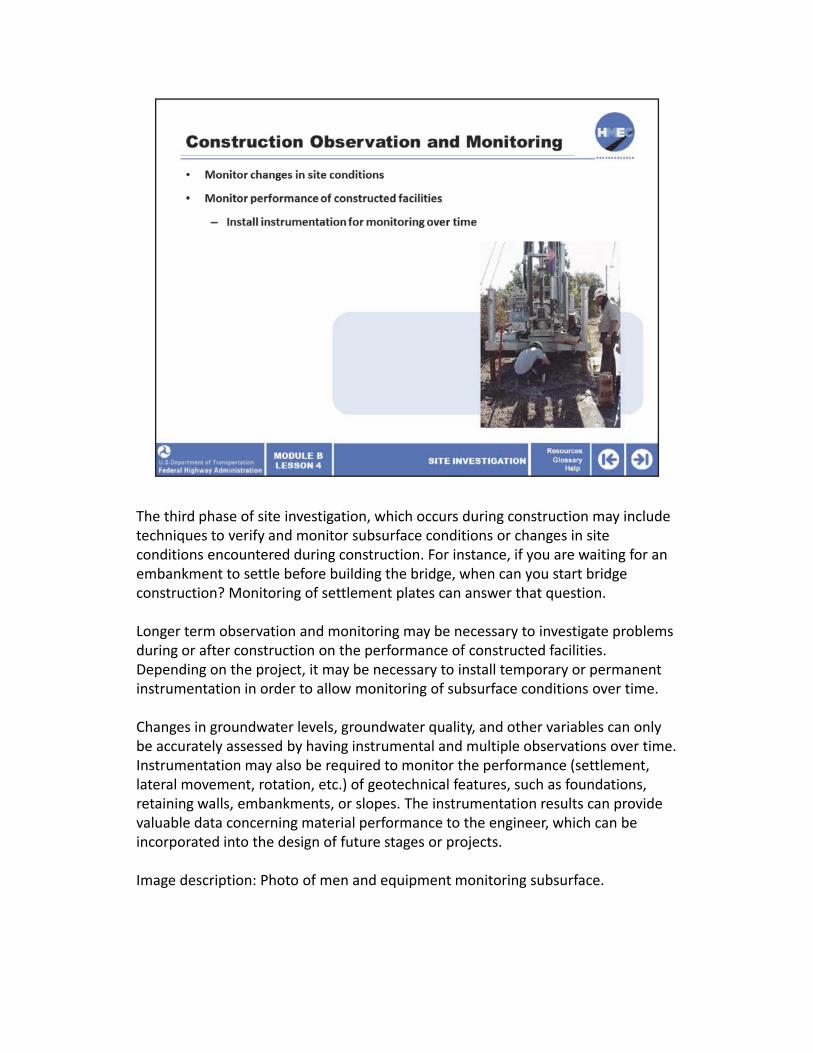
The third phase of site investigation, which occurs during construction may include techniques to verify and monitor subsurface conditions or changes in site conditions encountered during construction. For instance, if you are waiting for an embankment to settle before building the bridge, when can you start bridge construction? Monitoring of settlement plates can answer that question.
Longer term observation and monitoring may be necessary to investigate problems during or after construction on the performance of constructed facilities. Depending on the project, it may be necessary to install temporary or permanent instrumentation in order to allow monitoring of subsurface conditions over time.
Changes in groundwater levels, groundwater quality, and other variables can only be accurately assessed by having instrumental and multiple observations over time. Instrumentation may also be required to monitor the performance (settlement, lateral movement, rotation, etc.) of geotechnical features, such as foundations, retaining walls, embankments, or slopes. The instrumentation results can provide valuable data concerning material performance to the engineer, which can be incorporated into the design of future stages or projects.
Image description: Photo of men and equipment monitoring subsurface.
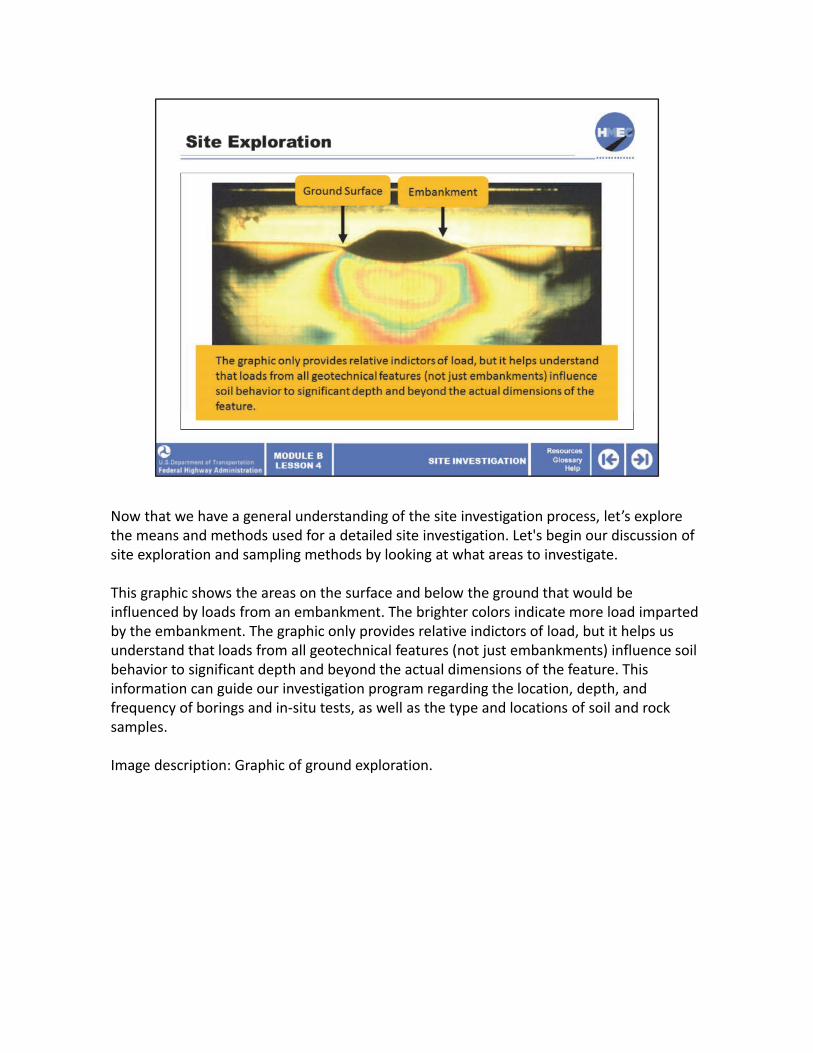
Now that we have a general understanding of the site investigation process, let’s explore the means and methods used for a detailed site investigation. Let's begin our discussion of site exploration and sampling methods by looking at what areas to investigate.
This graphic shows the areas on the surface and below the ground that would be influenced by loads from an embankment. The brighter colors indicate more load imparted by the embankment. The graphic only provides relative indictors of load, but it helps us understand that loads from all geotechnical features (not just embankments) influence soil behavior to significant depth and beyond the actual dimensions of the feature. This information can guide our investigation program regarding the location, depth, and frequency of borings and in‐situ tests, as well as the type and locations of soil and rock samples.
Image description: Graphic of ground exploration.
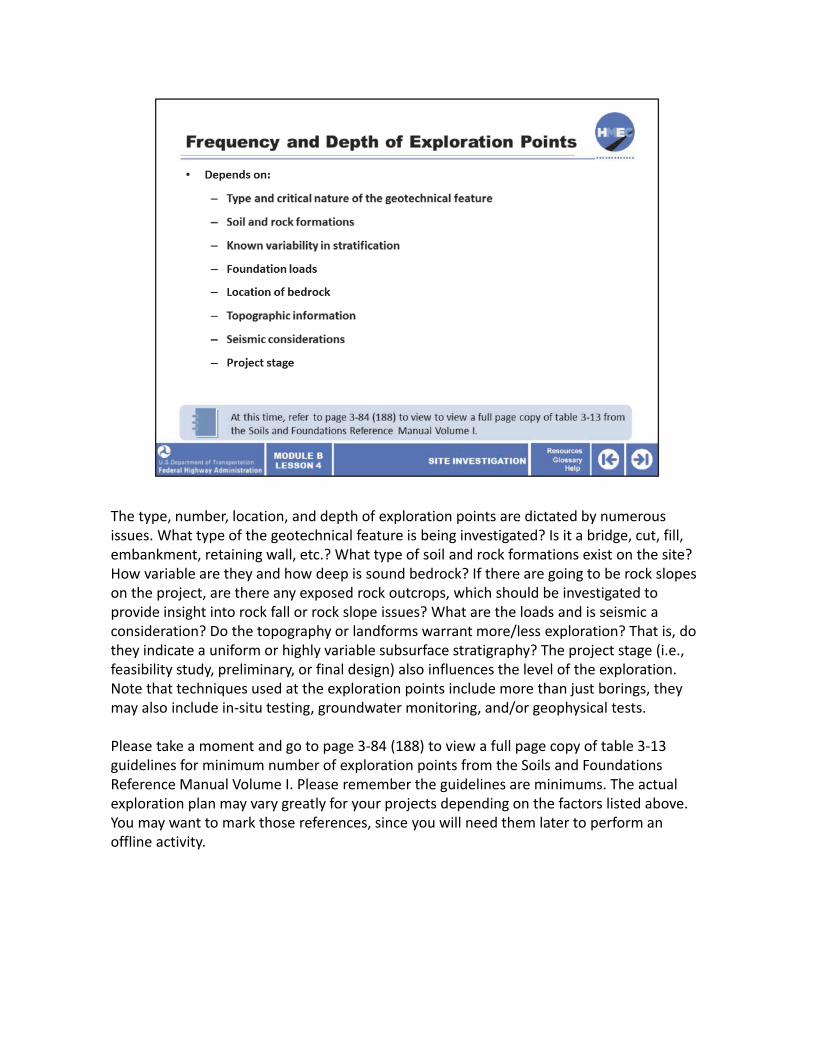
The type, number, location, and depth of exploration points are dictated by numerous issues. What type of the geotechnical feature is being investigated? Is it a bridge, cut, fill, embankment, retaining wall, etc.? What type of soil and rock formations exist on the site? How variable are they and how deep is sound bedrock? If there are going to be rock slopes on the project, are there any exposed rock outcrops, which should be investigated to provide insight into rock fall or rock slope issues? What are the loads and is seismic a consideration? Do the topography or landforms warrant more/less exploration? That is, do they indicate a uniform or highly variable subsurface stratigraphy? The project stage (i.e., feasibility study, preliminary, or final design) also influences the level of the exploration. Note that techniques used at the exploration points include more than just borings, they may also include in‐situ testing, groundwater monitoring, and/or geophysical tests.
Please take a moment and go to page 3‐84 (188) to view a full page copy of table 3‐13 guidelines for minimum number of exploration points from the Soils and Foundations Reference Manual Volume I. Please remember the guidelines are minimums. The actual exploration plan may vary greatly for your projects depending on the factors listed above. You may want to mark those references, since you will need them later to perform an offline activity.
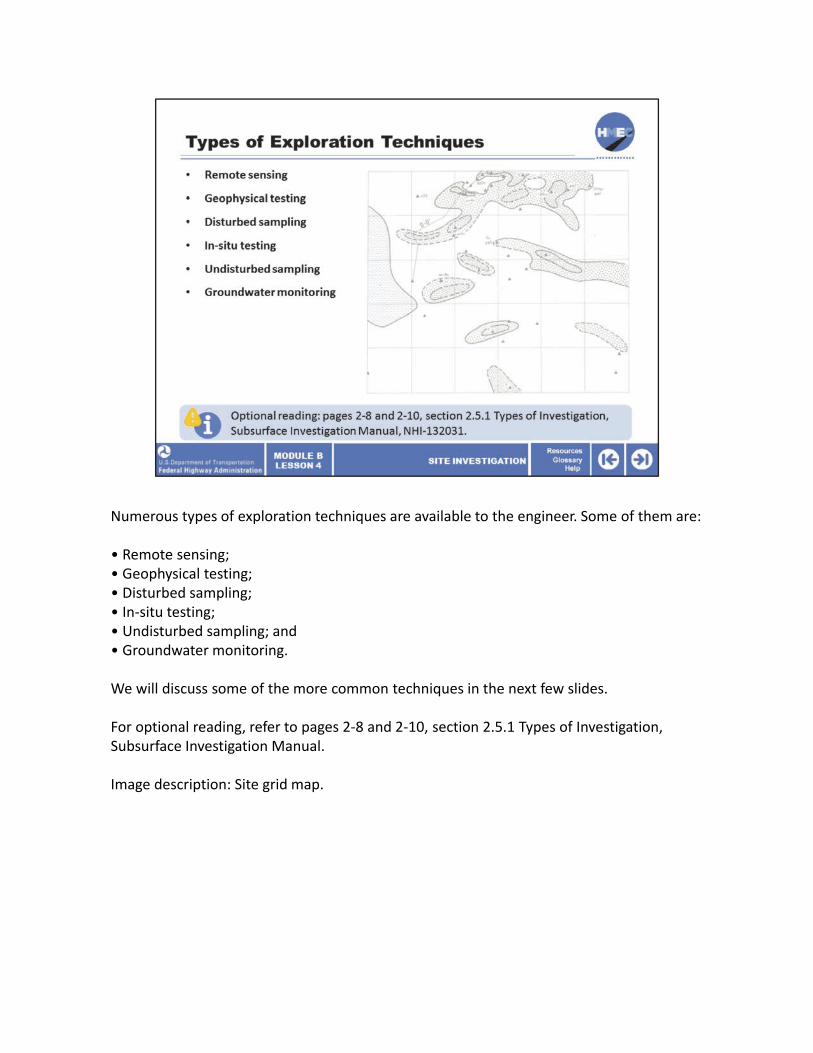
Numerous types of exploration techniques are available to the engineer. Some of them are:
• Remote sensing;• Geophysical testing;• Disturbed sampling;• In‐situ testing;• Undisturbed sampling; and• Groundwater monitoring.
We will discuss some of the more common techniques in the next few slides.
For optional reading, refer to pages 2‐8 and 2‐10, section 2.5.1 Types of Investigation, Subsurface Investigation Manual.
Image description: Site grid map.
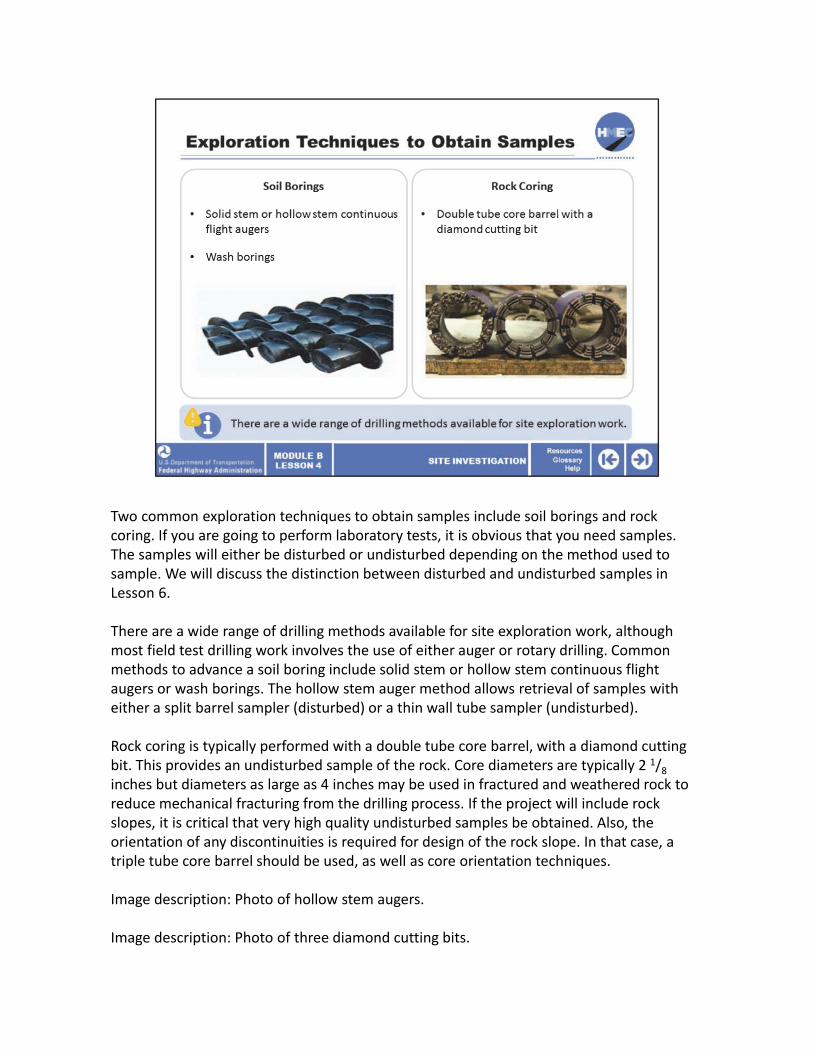
Two common exploration techniques to obtain samples include soil borings and rockcoring. If you are going to perform laboratory tests, it is obvious that you need samples. The samples will either be disturbed or undisturbed depending on the method used to sample. We will discuss the distinction between disturbed and undisturbed samples in Lesson 6.
There are a wide range of drilling methods available for site exploration work, although most field test drilling work involves the use of either auger or rotary drilling. Common methods to advance a soil boring include solid stem or hollow stem continuous flight augers or wash borings. The hollow stem auger method allows retrieval of samples with either a split barrel sampler (disturbed) or a thin wall tube sampler (undisturbed).
Rock coring is typically performed with a double tube core barrel, with a diamond cutting bit. This provides an undisturbed sample of the rock. Core diameters are typically 2 1/8inches but diameters as large as 4 inches may be used in fractured and weathered rock to reduce mechanical fracturing from the drilling process. If the project will include rock slopes, it is critical that very high quality undisturbed samples be obtained. Also, the orientation of any discontinuities is required for design of the rock slope. In that case, a triple tube core barrel should be used, as well as core orientation techniques.
Image description: Photo of hollow stem augers.
Image description: Photo of three diamond cutting bits.
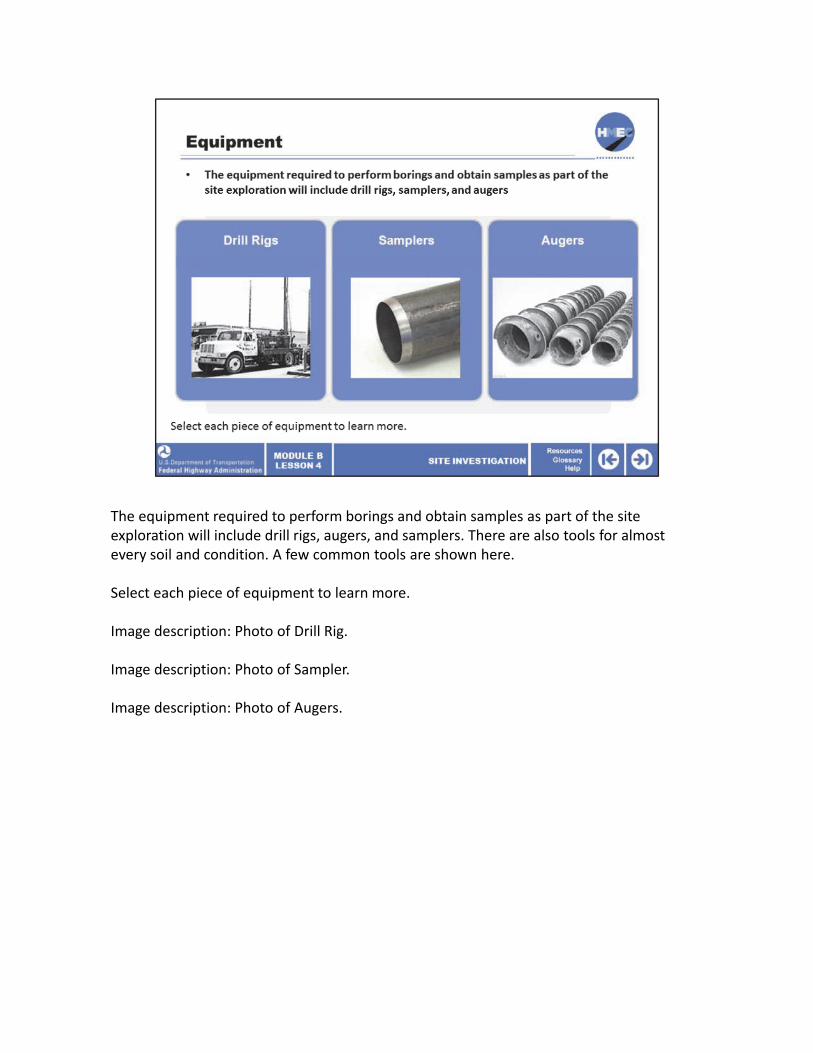
The equipment required to perform borings and obtain samples as part of the site exploration will include drill rigs, augers, and samplers. There are also tools for almost every soil and condition. A few common tools are shown here.
Select each piece of equipment to learn more.
Image description: Photo of Drill Rig.
Image description: Photo of Sampler.
Image description: Photo of Augers.
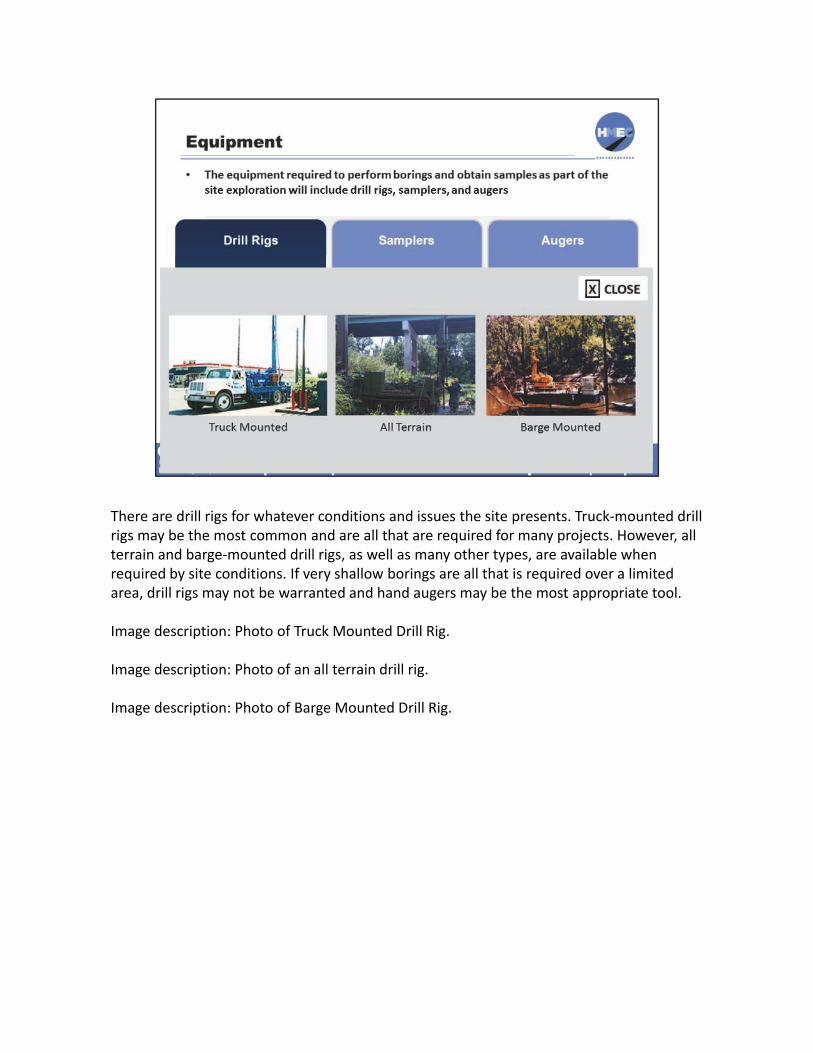
There are drill rigs for whatever conditions and issues the site presents. Truck‐mounted drill rigs may be the most common and are all that are required for many projects. However, all terrain and barge‐mounted drill rigs, as well as many other types, are available when required by site conditions. If very shallow borings are all that is required over a limited area, drill rigs may not be warranted and hand augers may be the most appropriate tool.
Image description: Photo of Truck Mounted Drill Rig.
Image description: Photo of an all terrain drill rig.
Image description: Photo of Barge Mounted Drill Rig.
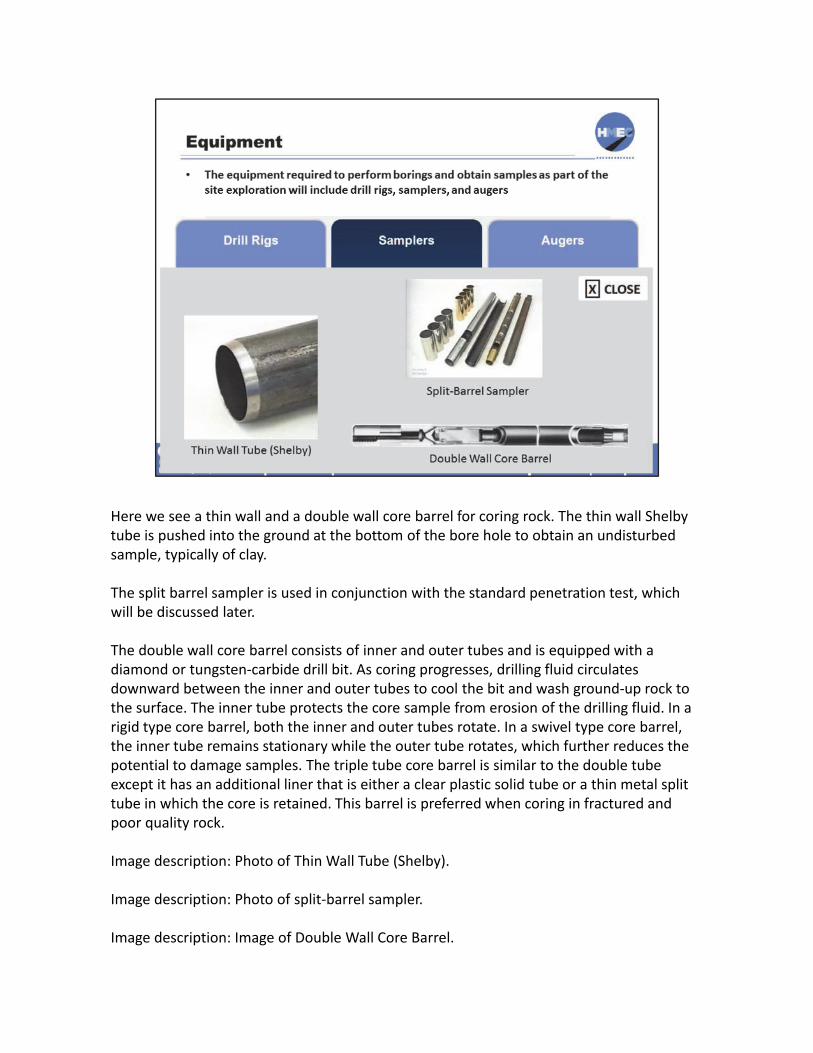
Here we see a thin wall and a double wall core barrel for coring rock. The thin wall Shelby tube is pushed into the ground at the bottom of the bore hole to obtain an undisturbed sample, typically of clay.
The split barrel sampler is used in conjunction with the standard penetration test, which will be discussed later.
The double wall core barrel consists of inner and outer tubes and is equipped with a diamond or tungsten‐carbide drill bit. As coring progresses, drilling fluid circulates downward between the inner and outer tubes to cool the bit and wash ground‐up rock to the surface. The inner tube protects the core sample from erosion of the drilling fluid. In a rigid type core barrel, both the inner and outer tubes rotate. In a swivel type core barrel, the inner tube remains stationary while the outer tube rotates, which further reduces the potential to damage samples. The triple tube core barrel is similar to the double tube except it has an additional liner that is either a clear plastic solid tube or a thin metal split tube in which the core is retained. This barrel is preferred when coring in fractured and poor quality rock.
Image description: Photo of Thin Wall Tube (Shelby).
Image description: Photo of split‐barrel sampler.
Image description: Image of Double Wall Core Barrel.
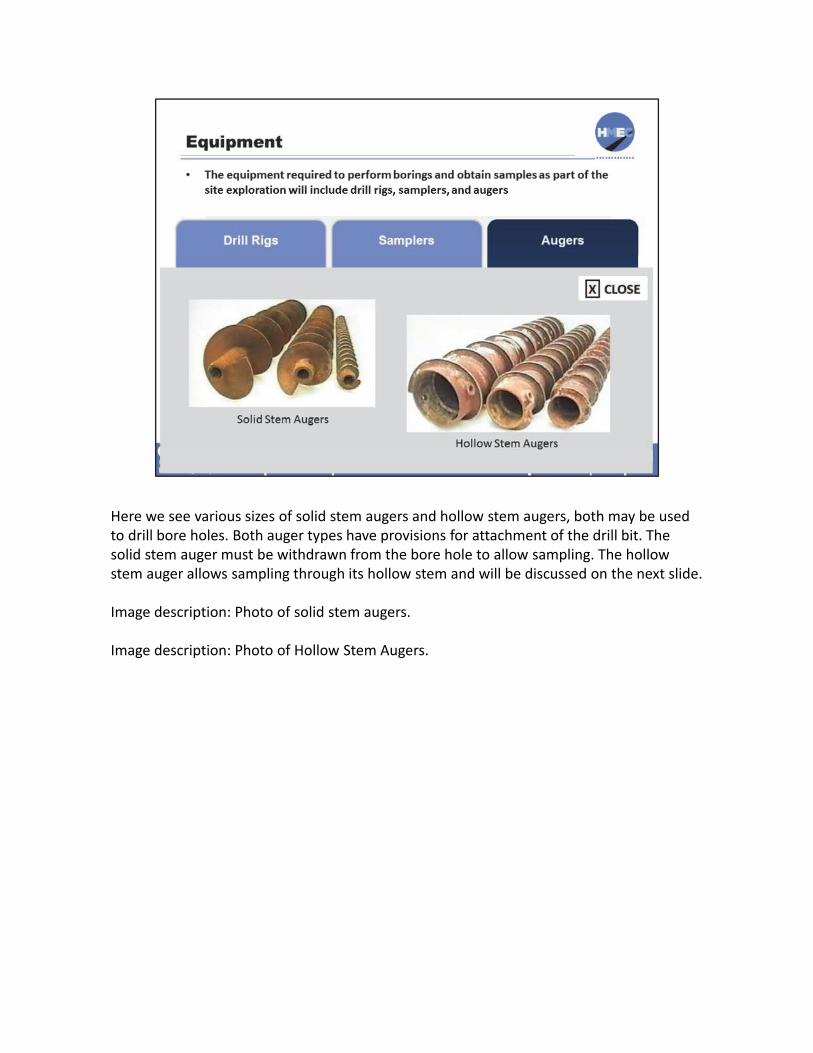
Here we see various sizes of solid stem augers and hollow stem augers, both may be used to drill bore holes. Both auger types have provisions for attachment of the drill bit. The solid stem auger must be withdrawn from the bore hole to allow sampling. The hollow stem auger allows sampling through its hollow stem and will be discussed on the next slide.
Image description: Photo of solid stem augers.
Image description: Photo of Hollow Stem Augers.
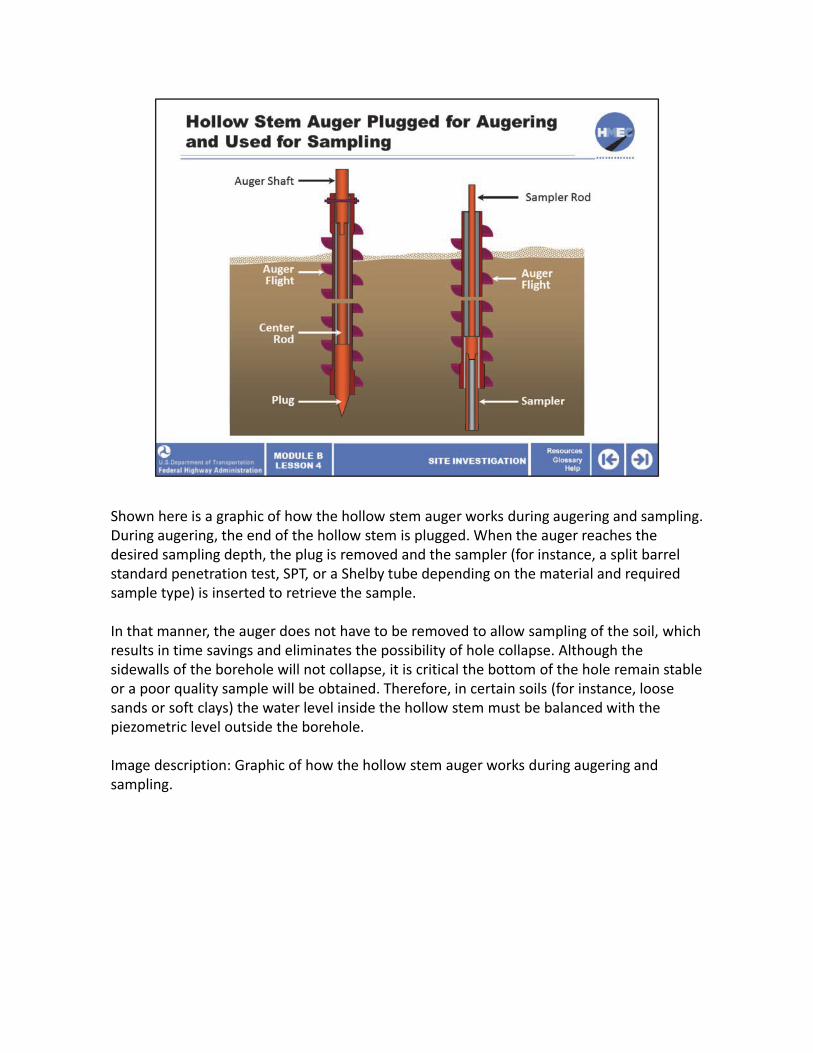
Shown here is a graphic of how the hollow stem auger works during augering and sampling. During augering, the end of the hollow stem is plugged. When the auger reaches the desired sampling depth, the plug is removed and the sampler (for instance, a split barrel standard penetration test, SPT, or a Shelby tube depending on the material and required sample type) is inserted to retrieve the sample.
In that manner, the auger does not have to be removed to allow sampling of the soil, which results in time savings and eliminates the possibility of hole collapse. Although the sidewalls of the borehole will not collapse, it is critical the bottom of the hole remain stable or a poor quality sample will be obtained. Therefore, in certain soils (for instance, loose sands or soft clays) the water level inside the hollow stem must be balanced with the piezometric level outside the borehole.
Image description: Graphic of how the hollow stem auger works during augering and sampling.
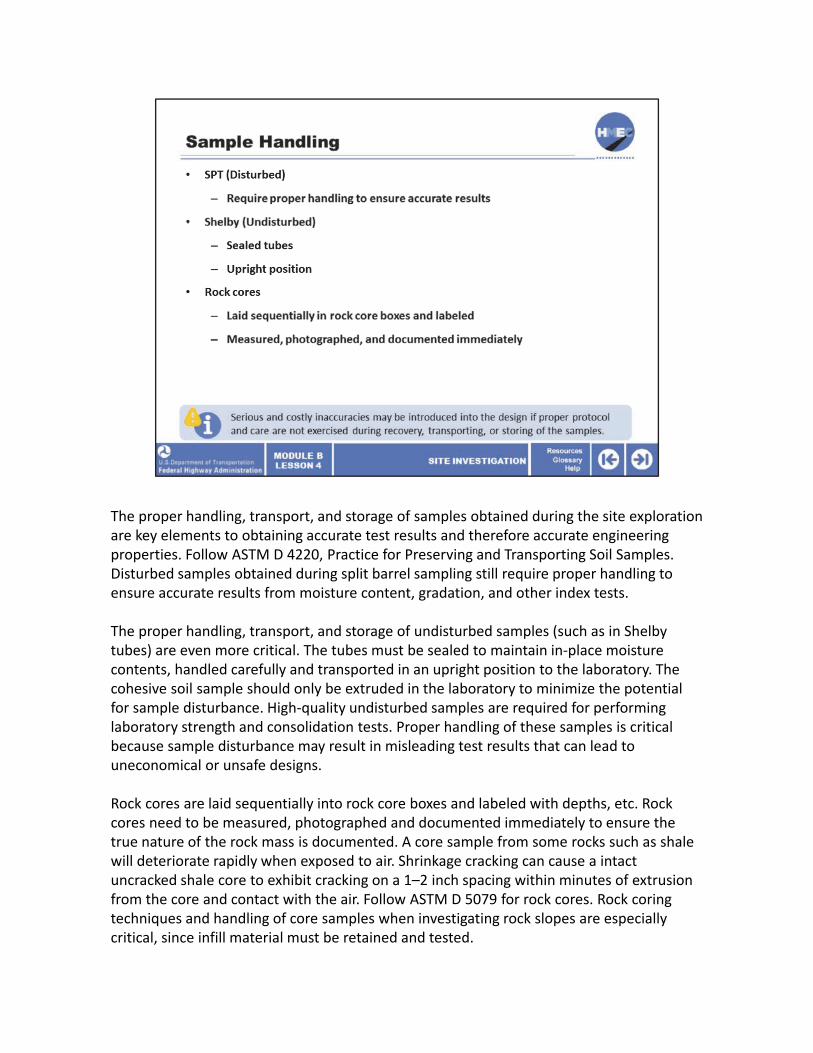
The proper handling, transport, and storage of samples obtained during the site exploration are key elements to obtaining accurate test results and therefore accurate engineering properties. Follow ASTM D 4220, Practice for Preserving and Transporting Soil Samples. Disturbed samples obtained during split barrel sampling still require proper handling to ensure accurate results from moisture content, gradation, and other index tests.
The proper handling, transport, and storage of undisturbed samples (such as in Shelby tubes) are even more critical. The tubes must be sealed to maintain in‐place moisture contents, handled carefully and transported in an upright position to the laboratory. The cohesive soil sample should only be extruded in the laboratory to minimize the potential for sample disturbance. High‐quality undisturbed samples are required for performing laboratory strength and consolidation tests. Proper handling of these samples is critical because sample disturbance may result in misleading test results that can lead to uneconomical or unsafe designs.
Rock cores are laid sequentially into rock core boxes and labeled with depths, etc. Rock cores need to be measured, photographed and documented immediately to ensure the true nature of the rock mass is documented. A core sample from some rocks such as shale will deteriorate rapidly when exposed to air. Shrinkage cracking can cause a intact uncracked shale core to exhibit cracking on a 1–2 inch spacing within minutes of extrusion from the core and contact with the air. Follow ASTM D 5079 for rock cores. Rock coring techniques and handling of core samples when investigating rock slopes are especially critical, since infill material must be retained and tested.

Serious and costly inaccuracies may be introduced into the design if proper protocol and care are not exercised during recovery, transporting, or storing of the samples. Therefore, it is important to follow the established ASTM and AASHTO procedures in the field and in the laboratory.
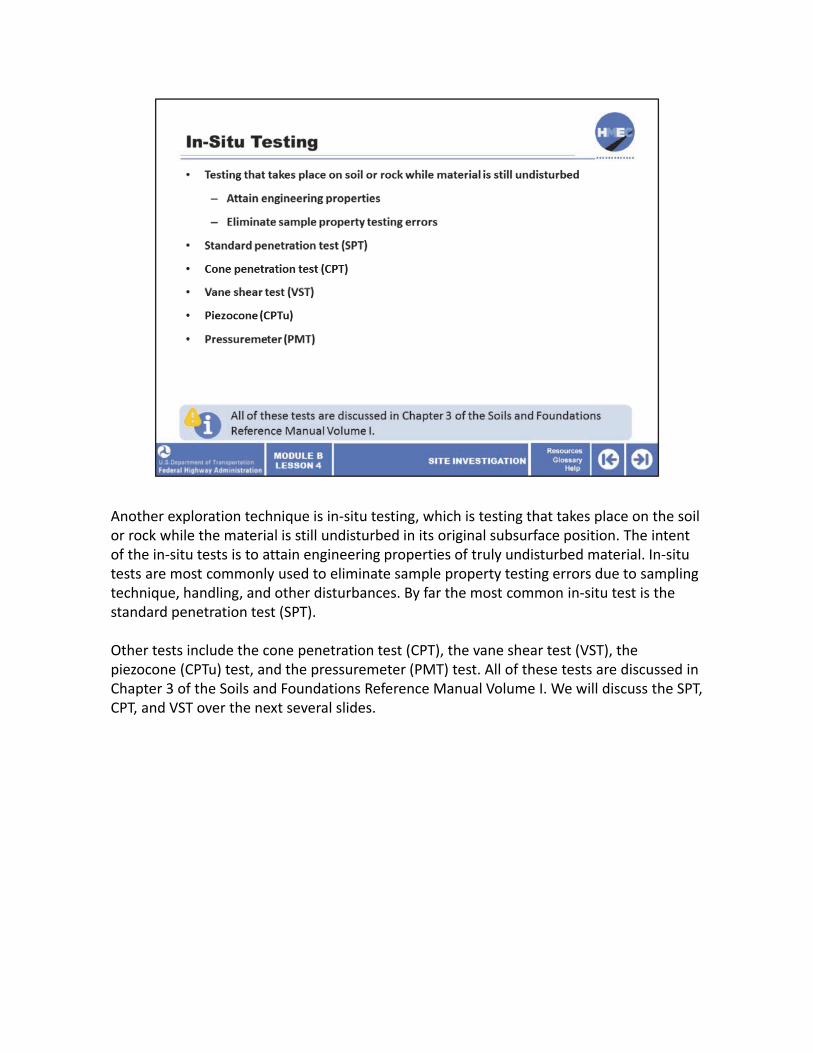
Another exploration technique is in‐situ testing, which is testing that takes place on the soil or rock while the material is still undisturbed in its original subsurface position. The intent of the in‐situ tests is to attain engineering properties of truly undisturbed material. In‐situ tests are most commonly used to eliminate sample property testing errors due to sampling technique, handling, and other disturbances. By far the most common in‐situ test is the standard penetration test (SPT).
Other tests include the cone penetration test (CPT), the vane shear test (VST), the piezocone (CPTu) test, and the pressuremeter (PMT) test. All of these tests are discussed in Chapter 3 of the Soils and Foundations Reference Manual Volume I. We will discuss the SPT, CPT, and VST over the next several slides.
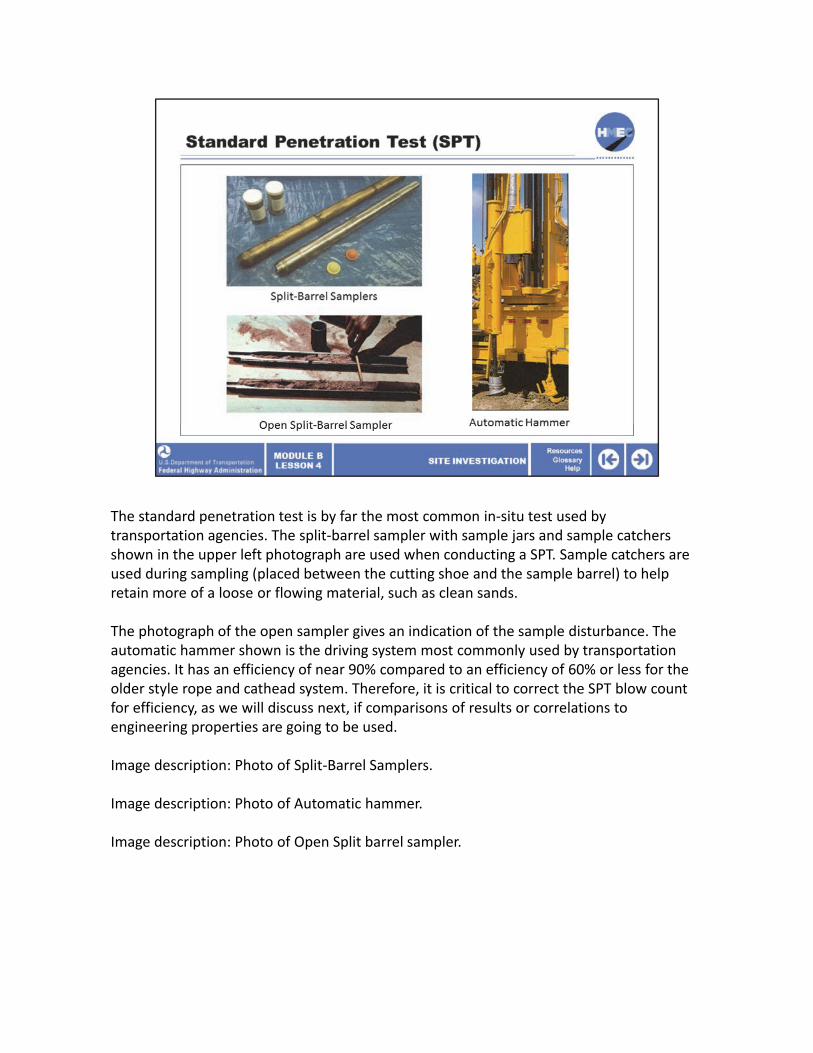
The standard penetration test is by far the most common in‐situ test used by transportation agencies. The split‐barrel sampler with sample jars and sample catchers shown in the upper left photograph are used when conducting a SPT. Sample catchers are used during sampling (placed between the cutting shoe and the sample barrel) to help retain more of a loose or flowing material, such as clean sands.
The photograph of the open sampler gives an indication of the sample disturbance. The automatic hammer shown is the driving system most commonly used by transportation agencies. It has an efficiency of near 90% compared to an efficiency of 60% or less for the older style rope and cathead system. Therefore, it is critical to correct the SPT blow countfor efficiency, as we will discuss next, if comparisons of results or correlations to engineering properties are going to be used.
Image description: Photo of Split‐Barrel Samplers.
Image description: Photo of Automatic hammer.
Image description: Photo of Open Split barrel sampler.
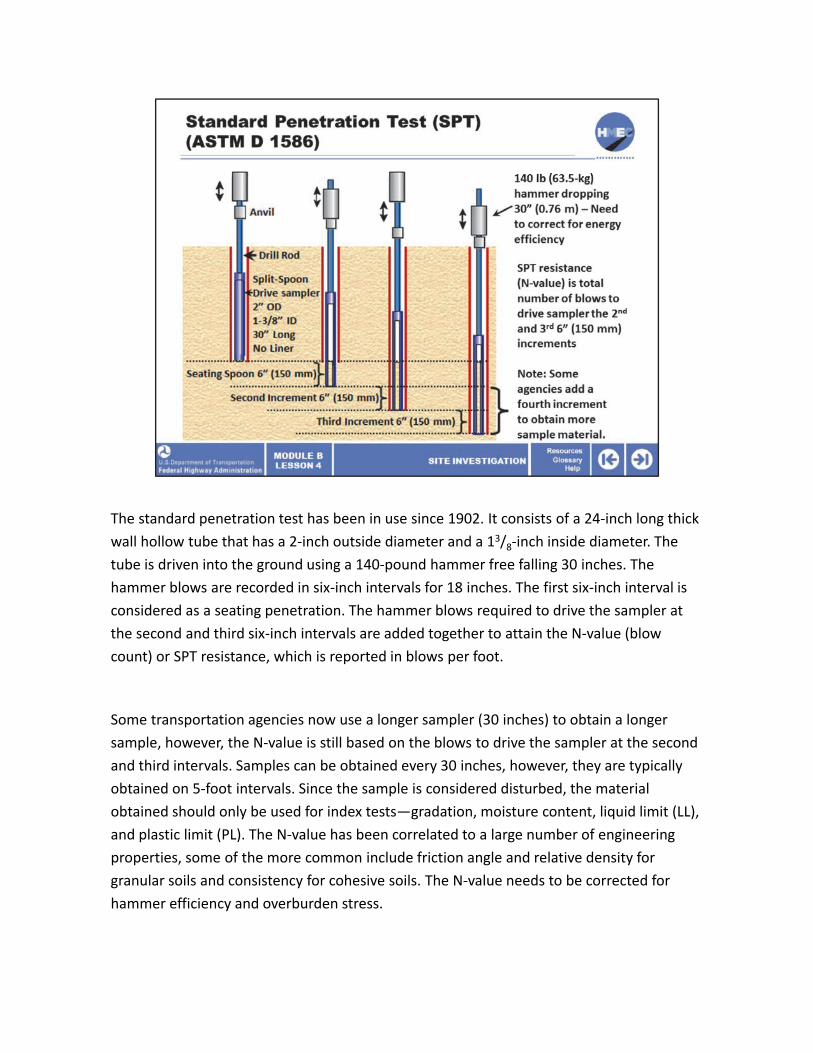
The standard penetration test has been in use since 1902. It consists of a 24‐inch long thick
wall hollow tube that has a 2‐inch outside diameter and a 13/8‐inch inside diameter. The
tube is driven into the ground using a 140‐pound hammer free falling 30 inches. The
hammer blows are recorded in six‐inch intervals for 18 inches. The first six‐inch interval is
considered as a seating penetration. The hammer blows required to drive the sampler at
the second and third six‐inch intervals are added together to attain the N‐value (blow
count) or SPT resistance, which is reported in blows per foot.
Some transportation agencies now use a longer sampler (30 inches) to obtain a longer
sample, however, the N‐value is still based on the blows to drive the sampler at the second
and third intervals. Samples can be obtained every 30 inches, however, they are typically
obtained on 5‐foot intervals. Since the sample is considered disturbed, the material
obtained should only be used for index tests—gradation, moisture content, liquid limit (LL),
and plastic limit (PL). The N‐value has been correlated to a large number of engineering
properties, some of the more common include friction angle and relative density for
granular soils and consistency for cohesive soils. The N‐value needs to be corrected for
hammer efficiency and overburden stress.

To learn more about corrected N‐values, refer to sections 3.7.1 and 3.7.2 (pages 3‐54 thru 3‐
57) in the Soils and Foundations Reference Manual Volume I.
Image description: Graphic showing the standard penetration test.
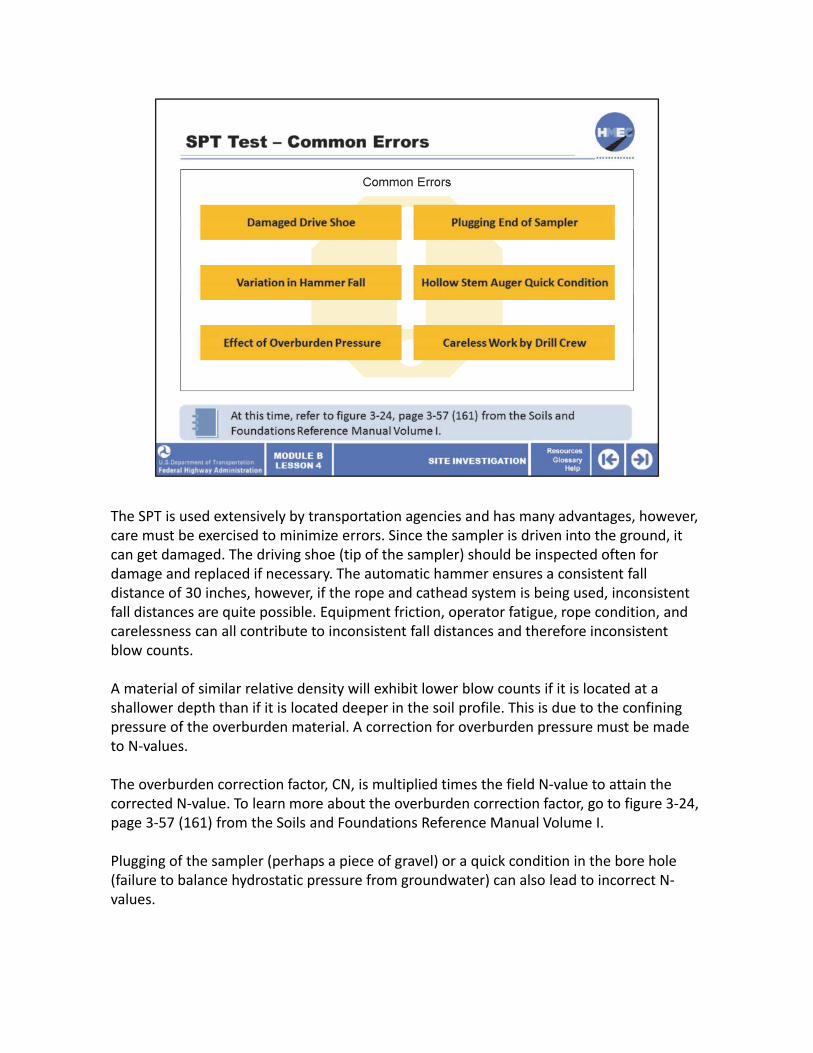
The SPT is used extensively by transportation agencies and has many advantages, however, care must be exercised to minimize errors. Since the sampler is driven into the ground, it can get damaged. The driving shoe (tip of the sampler) should be inspected often for damage and replaced if necessary. The automatic hammer ensures a consistent fall distance of 30 inches, however, if the rope and cathead system is being used, inconsistent fall distances are quite possible. Equipment friction, operator fatigue, rope condition, and carelessness can all contribute to inconsistent fall distances and therefore inconsistent blow counts.
A material of similar relative density will exhibit lower blow counts if it is located at a shallower depth than if it is located deeper in the soil profile. This is due to the confining pressure of the overburden material. A correction for overburden pressure must be made to N‐values.
The overburden correction factor, CN, is multiplied times the field N‐value to attain the corrected N‐value. To learn more about the overburden correction factor, go to figure 3‐24, page 3‐57 (161) from the Soils and Foundations Reference Manual Volume I.
Plugging of the sampler (perhaps a piece of gravel) or a quick condition in the bore hole (failure to balance hydrostatic pressure from groundwater) can also lead to incorrect N‐values.
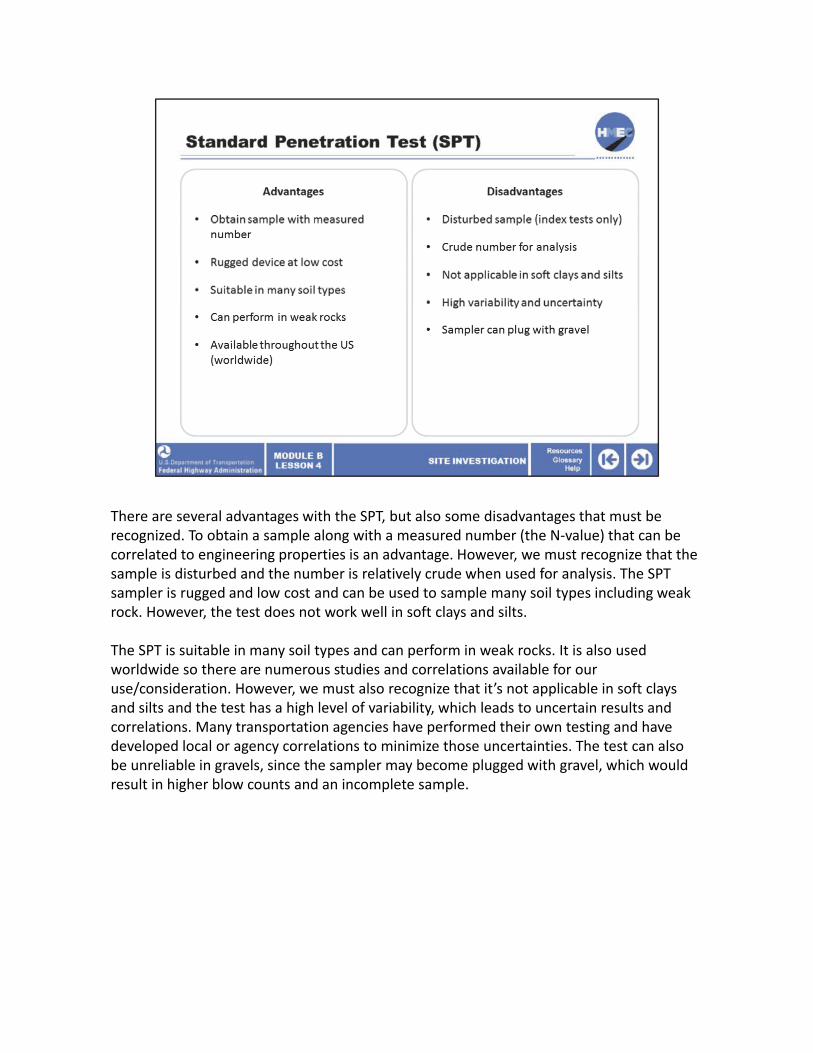
There are several advantages with the SPT, but also some disadvantages that must be recognized. To obtain a sample along with a measured number (the N‐value) that can be correlated to engineering properties is an advantage. However, we must recognize that the sample is disturbed and the number is relatively crude when used for analysis. The SPT sampler is rugged and low cost and can be used to sample many soil types including weak rock. However, the test does not work well in soft clays and silts.
The SPT is suitable in many soil types and can perform in weak rocks. It is also used worldwide so there are numerous studies and correlations available for our use/consideration. However, we must also recognize that it’s not applicable in soft clays and silts and the test has a high level of variability, which leads to uncertain results and correlations. Many transportation agencies have performed their own testing and have developed local or agency correlations to minimize those uncertainties. The test can also be unreliable in gravels, since the sampler may become plugged with gravel, which would result in higher blow counts and an incomplete sample.
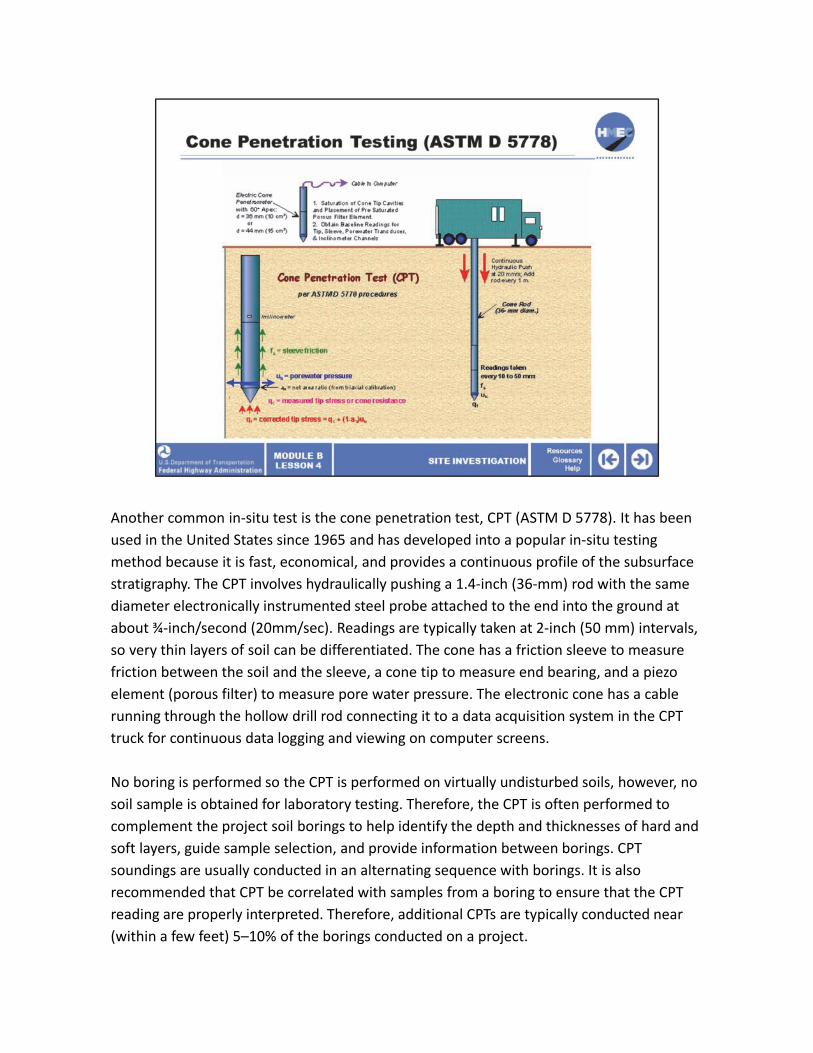
Another common in‐situ test is the cone penetration test, CPT (ASTM D 5778). It has been
used in the United States since 1965 and has developed into a popular in‐situ testing
method because it is fast, economical, and provides a continuous profile of the subsurface
stratigraphy. The CPT involves hydraulically pushing a 1.4‐inch (36‐mm) rod with the same
diameter electronically instrumented steel probe attached to the end into the ground at
about ¾‐inch/second (20mm/sec). Readings are typically taken at 2‐inch (50 mm) intervals,
so very thin layers of soil can be differentiated. The cone has a friction sleeve to measure
friction between the soil and the sleeve, a cone tip to measure end bearing, and a piezo
element (porous filter) to measure pore water pressure. The electronic cone has a cable
running through the hollow drill rod connecting it to a data acquisition system in the CPT
truck for continuous data logging and viewing on computer screens.
No boring is performed so the CPT is performed on virtually undisturbed soils, however, no
soil sample is obtained for laboratory testing. Therefore, the CPT is often performed to
complement the project soil borings to help identify the depth and thicknesses of hard and
soft layers, guide sample selection, and provide information between borings. CPT
soundings are usually conducted in an alternating sequence with borings. It is also
recommended that CPT be correlated with samples from a boring to ensure that the CPT
reading are properly interpreted. Therefore, additional CPTs are typically conducted near
(within a few feet) 5–10% of the borings conducted on a project.

It should be noted that several transportation agencies have begun using CPT extensively as
a soil investigation tool and in those agencies soil borings are taken to complement the in‐
situ CPT.
Image description: Graphic showing the cone penetration test.
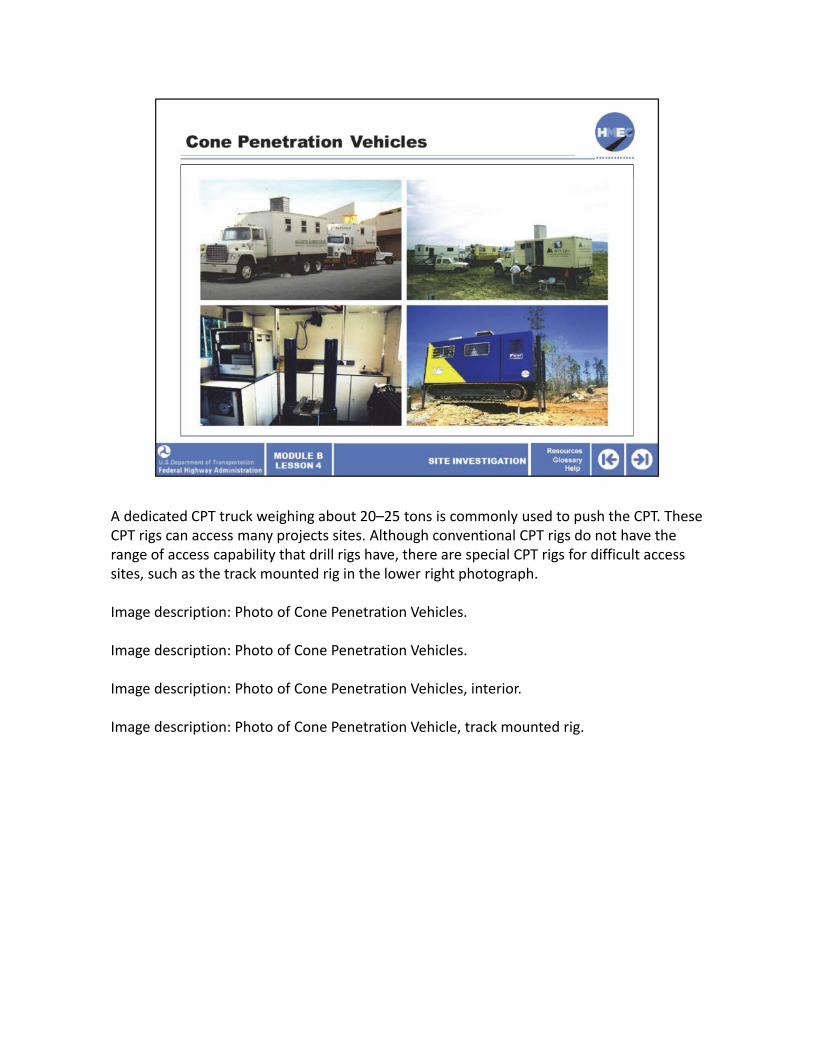
A dedicated CPT truck weighing about 20–25 tons is commonly used to push the CPT. These CPT rigs can access many projects sites. Although conventional CPT rigs do not have the range of access capability that drill rigs have, there are special CPT rigs for difficult access sites, such as the track mounted rig in the lower right photograph.
Image description: Photo of Cone Penetration Vehicles.
Image description: Photo of Cone Penetration Vehicles.
Image description: Photo of Cone Penetration Vehicles, interior.
Image description: Photo of Cone Penetration Vehicle, track mounted rig.
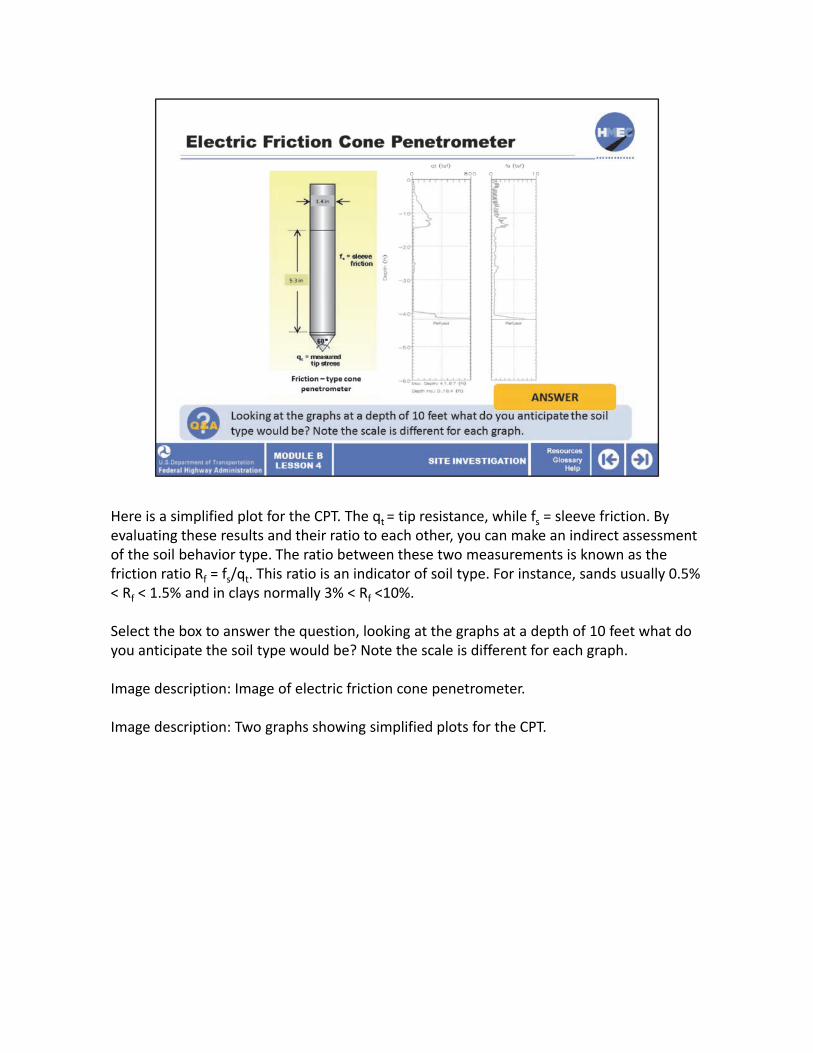
Here is a simplified plot for the CPT. The qt = tip resistance, while fs = sleeve friction. By evaluating these results and their ratio to each other, you can make an indirect assessment of the soil behavior type. The ratio between these two measurements is known as the friction ratio Rf = fs/qt. This ratio is an indicator of soil type. For instance, sands usually 0.5% < Rf < 1.5% and in clays normally 3% < Rf <10%.
Select the box to answer the question, looking at the graphs at a depth of 10 feet what do you anticipate the soil type would be? Note the scale is different for each graph.
Image description: Image of electric friction cone penetrometer.
Image description: Two graphs showing simplified plots for the CPT.

fs at 10 feet equals 1.50 tsf qt at 10 feet equals 200 tsf, therefore, Rf = fs/qt = 1.5 tsf/200 tsf = .75%. Based on the ranges given earlier, this would indicate a sand, since it is between .5% and 1.5%.
We will discuss the CPT plots and their interpretation in more detail during the example project for this course.
Image description: Image of electric friction cone penetrometer.
Image description: Two graphs showing simplified plots for the CPT.
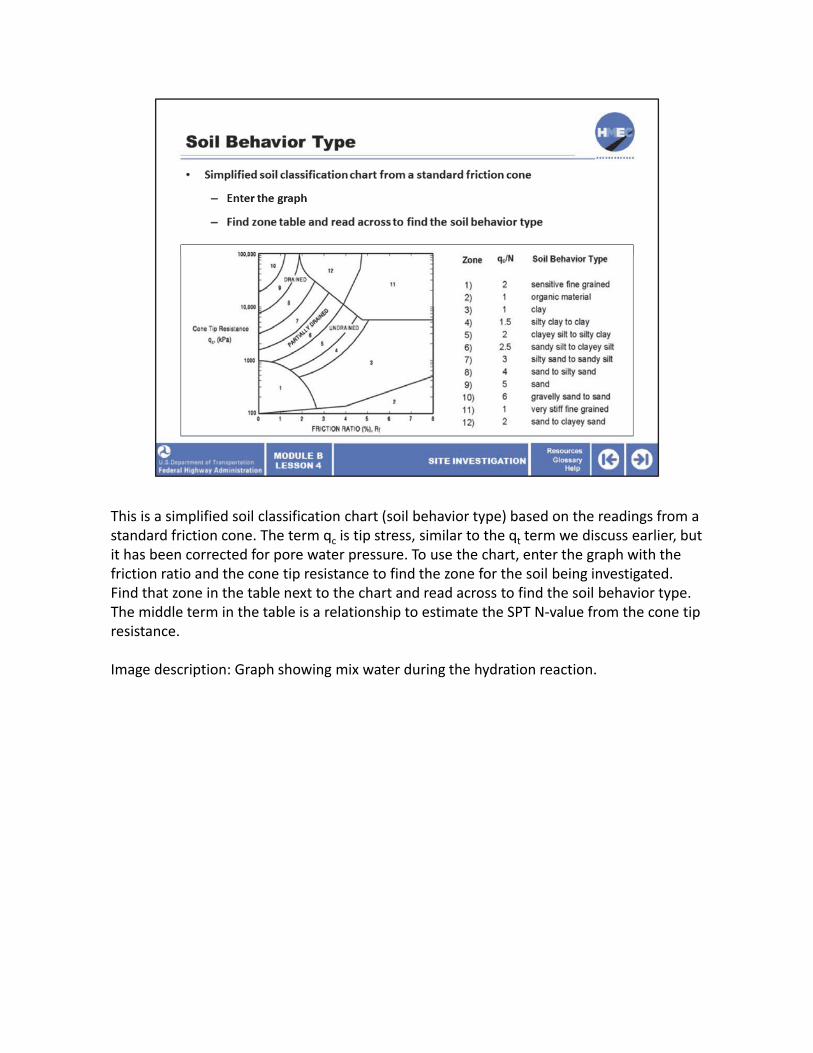
This is a simplified soil classification chart (soil behavior type) based on the readings from a standard friction cone. The term qc is tip stress, similar to the qt term we discuss earlier, but it has been corrected for pore water pressure. To use the chart, enter the graph with the friction ratio and the cone tip resistance to find the zone for the soil being investigated. Find that zone in the table next to the chart and read across to find the soil behavior type. The middle term in the table is a relationship to estimate the SPT N‐value from the cone tip resistance.
Image description: Graph showing mix water during the hydration reaction.
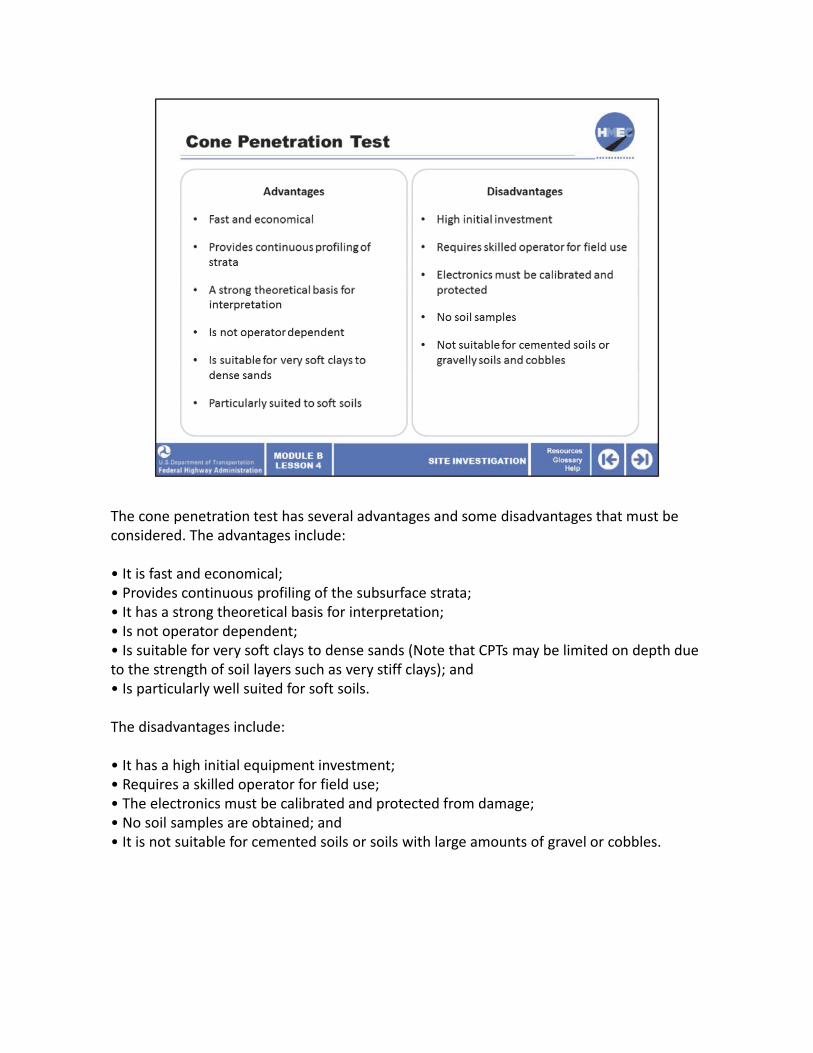
The cone penetration test has several advantages and some disadvantages that must be considered. The advantages include:
• It is fast and economical;• Provides continuous profiling of the subsurface strata;• It has a strong theoretical basis for interpretation;• Is not operator dependent;• Is suitable for very soft clays to dense sands (Note that CPTs may be limited on depth due to the strength of soil layers such as very stiff clays); and• Is particularly well suited for soft soils.
The disadvantages include:
• It has a high initial equipment investment;• Requires a skilled operator for field use;• The electronics must be calibrated and protected from damage;• No soil samples are obtained; and• It is not suitable for cemented soils or soils with large amounts of gravel or cobbles.
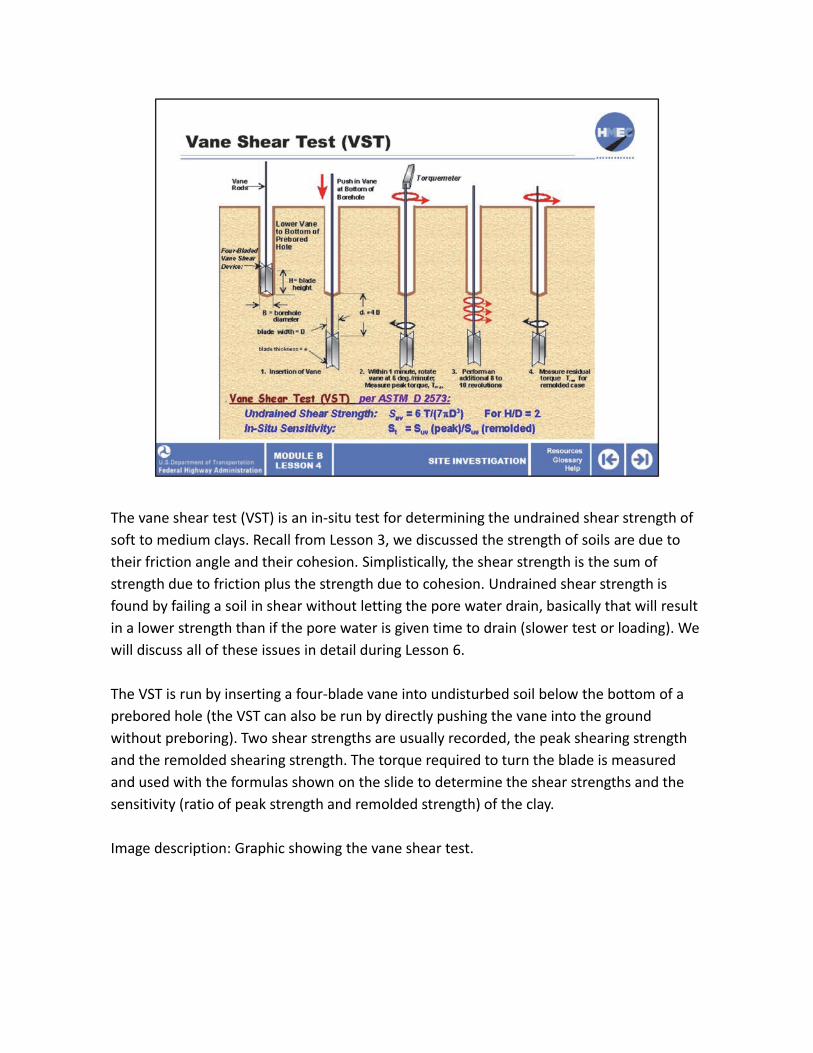
The vane shear test (VST) is an in‐situ test for determining the undrained shear strength of
soft to medium clays. Recall from Lesson 3, we discussed the strength of soils are due to
their friction angle and their cohesion. Simplistically, the shear strength is the sum of
strength due to friction plus the strength due to cohesion. Undrained shear strength is
found by failing a soil in shear without letting the pore water drain, basically that will result
in a lower strength than if the pore water is given time to drain (slower test or loading). We
will discuss all of these issues in detail during Lesson 6.
The VST is run by inserting a four‐blade vane into undisturbed soil below the bottom of a
prebored hole (the VST can also be run by directly pushing the vane into the ground
without preboring). Two shear strengths are usually recorded, the peak shearing strength
and the remolded shearing strength. The torque required to turn the blade is measured
and used with the formulas shown on the slide to determine the shear strengths and the
sensitivity (ratio of peak strength and remolded strength) of the clay.
Image description: Graphic showing the vane shear test.
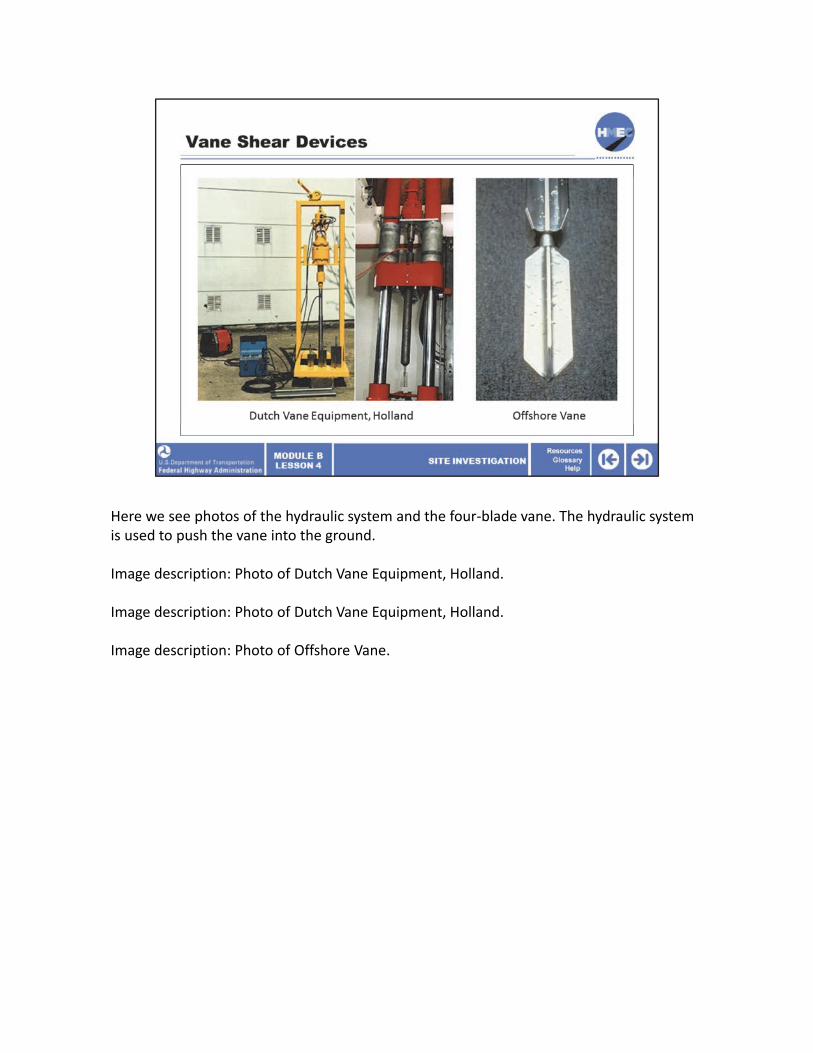
Here we see photos of the hydraulic system and the four‐blade vane. The hydraulic systeis used to push the vane into the ground.
Image description: Photo of Dutch Vane Equipment, Holland.
Image description: Photo of Dutch Vane Equipment, Holland.
Image description: Photo of Offshore Vane.
m
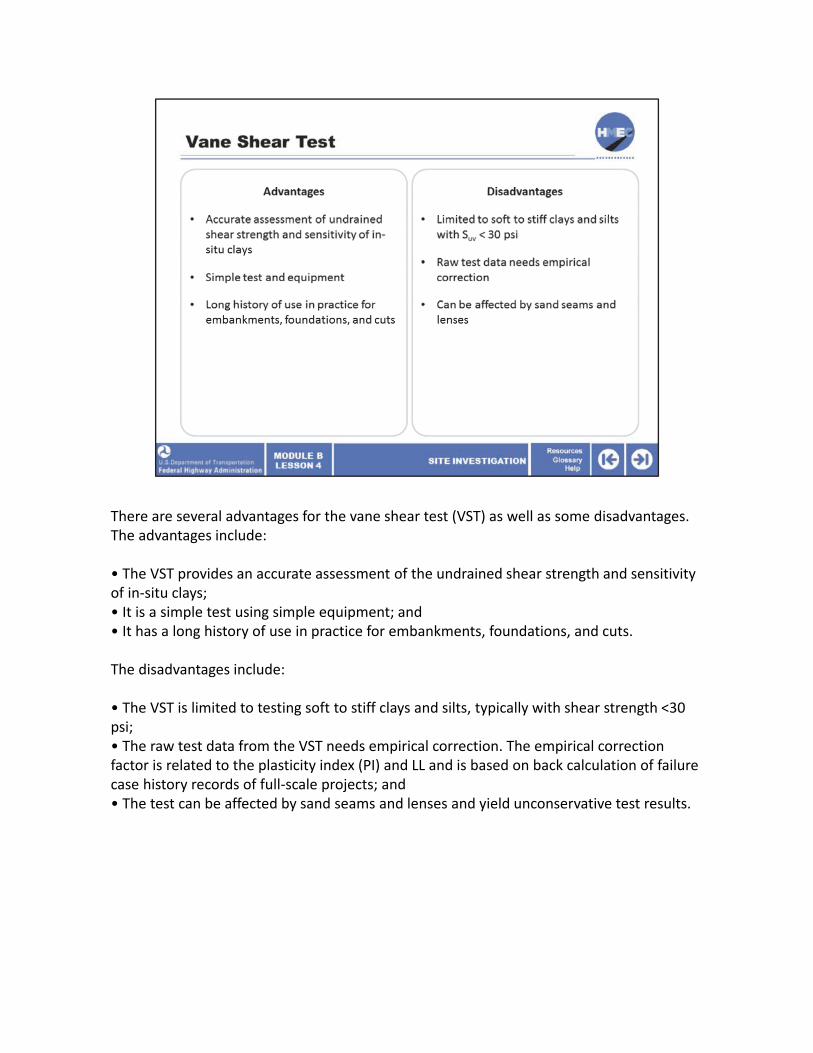
There are several advantages for the vane shear test (VST) as well as some disadvantages. The advantages include:
• The VST provides an accurate assessment of the undrained shear strength and sensitivity of in‐situ clays; • It is a simple test using simple equipment; and• It has a long history of use in practice for embankments, foundations, and cuts.
The disadvantages include:
• The VST is limited to testing soft to stiff clays and silts, typically with shear strength <30 psi;• The raw test data from the VST needs empirical correction. The empirical correction factor is related to the plasticity index (PI) and LL and is based on back calculation of failure case history records of full‐scale projects; and• The test can be affected by sand seams and lenses and yield unconservative test results.
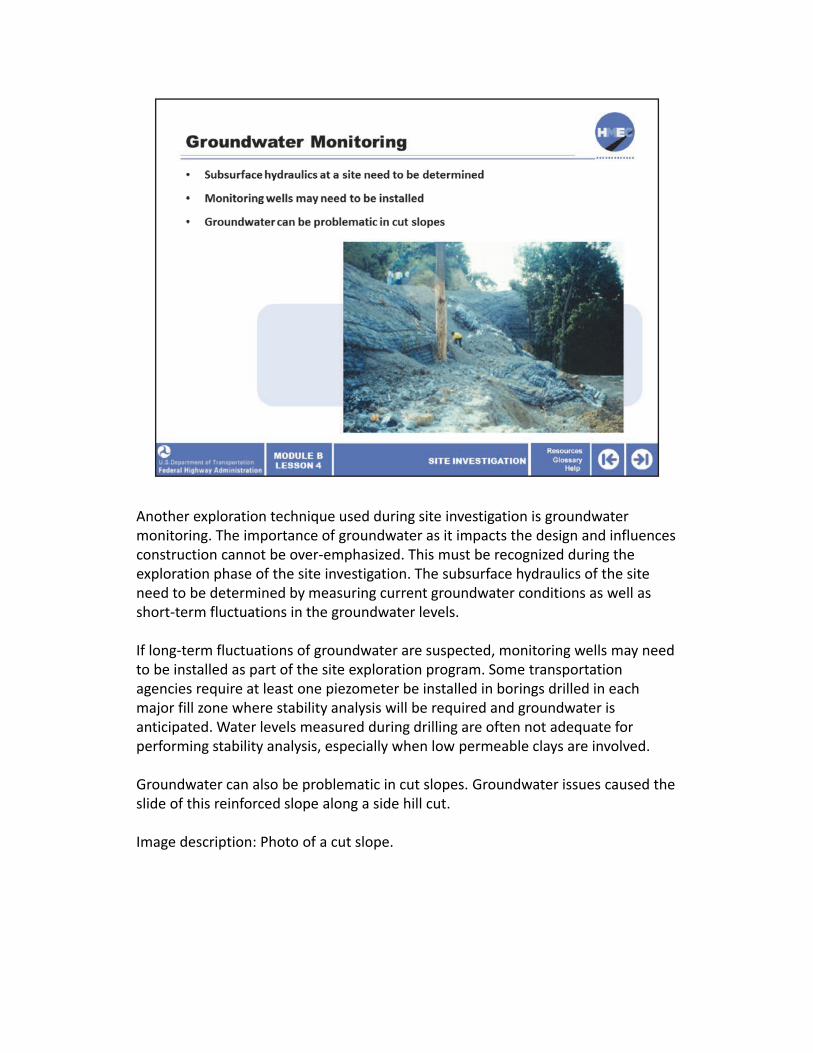
Another exploration technique used during site investigation is groundwatermonitoring. The importance of groundwater as it impacts the design and influences construction cannot be over‐emphasized. This must be recognized during the exploration phase of the site investigation. The subsurface hydraulics of the site need to be determined by measuring current groundwater conditions as well as short‐term fluctuations in the groundwater levels.
If long‐term fluctuations of groundwater are suspected, monitoring wells may need to be installed as part of the site exploration program. Some transportation agencies require at least one piezometer be installed in borings drilled in each major fill zone where stability analysis will be required and groundwater is anticipated. Water levels measured during drilling are often not adequate for performing stability analysis, especially when low permeable clays are involved.
Groundwater can also be problematic in cut slopes. Groundwater issues caused the slide of this reinforced slope along a side hill cut.
Image description: Photo of a cut slope.
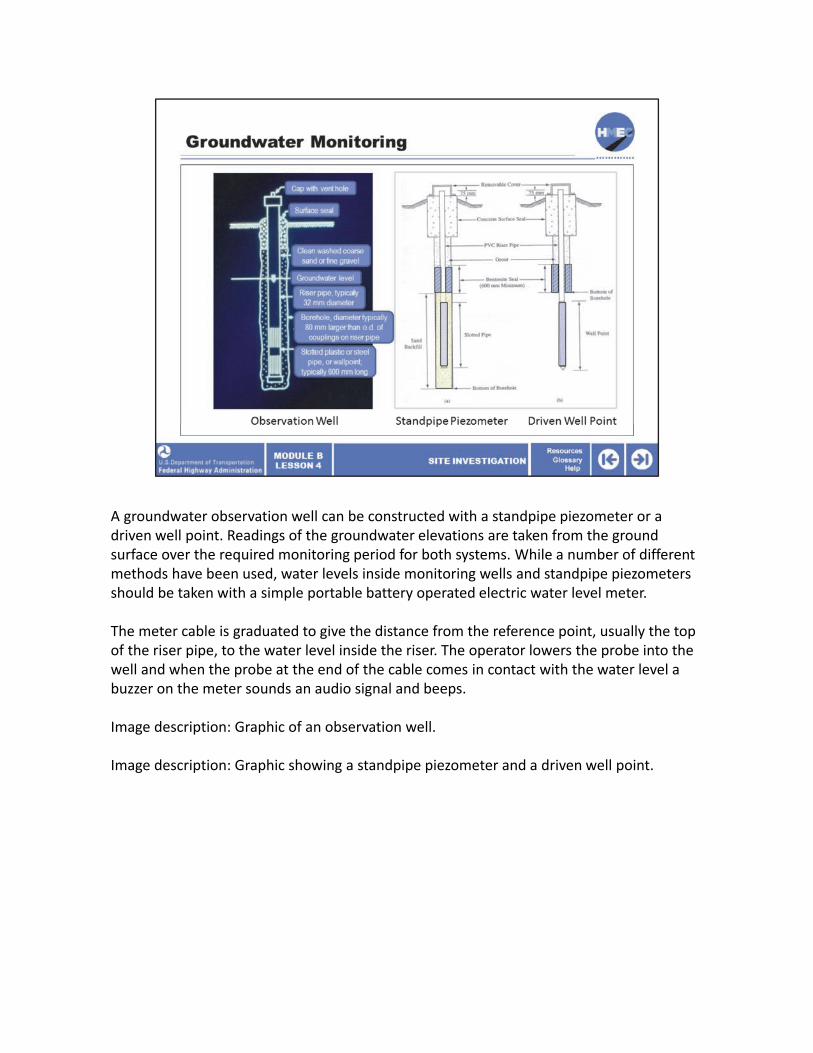
A groundwater observation well can be constructed with a standpipe piezometer or a driven well point. Readings of the groundwater elevations are taken from the ground surface over the required monitoring period for both systems. While a number of different methods have been used, water levels inside monitoring wells and standpipe piezometers should be taken with a simple portable battery operated electric water level meter.
The meter cable is graduated to give the distance from the reference point, usually the top of the riser pipe, to the water level inside the riser. The operator lowers the probe into the well and when the probe at the end of the cable comes in contact with the water level a buzzer on the meter sounds an audio signal and beeps.
Image description: Graphic of an observation well.
Image description: Graphic showing a standpipe piezometer and a driven well point.
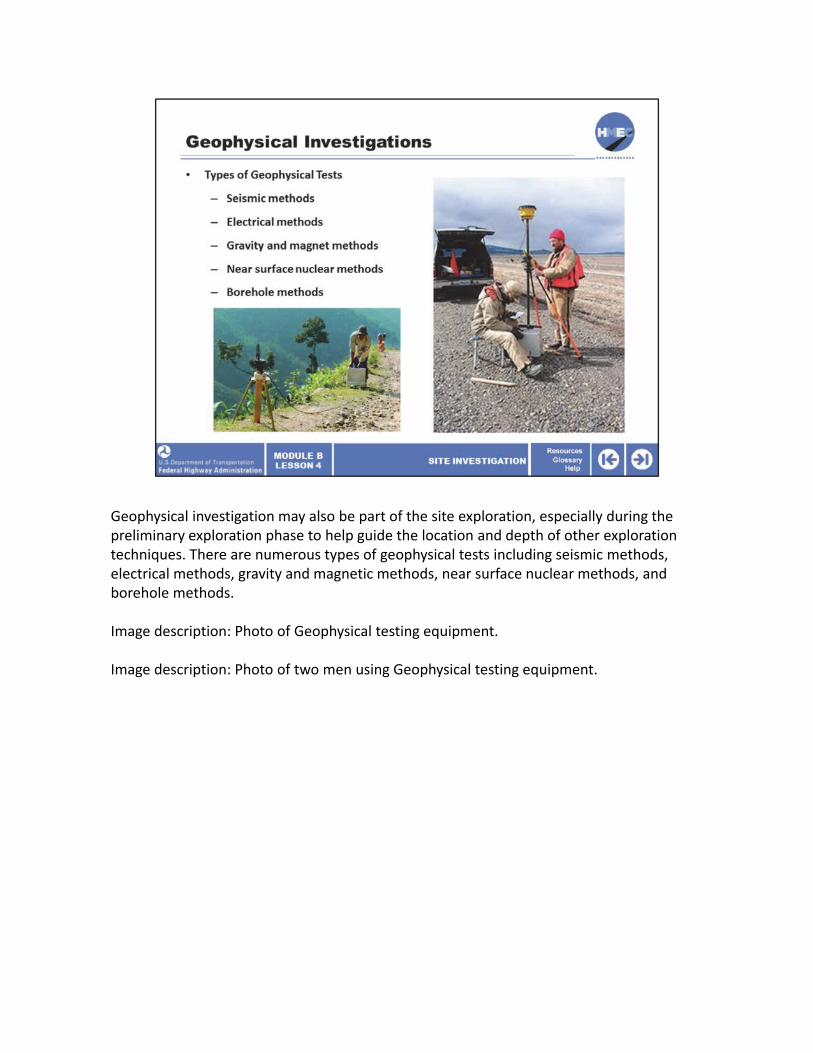
Geophysical investigation may also be part of the site exploration, especially during the preliminary exploration phase to help guide the location and depth of other exploration techniques. There are numerous types of geophysical tests including seismic methods, electrical methods, gravity and magnetic methods, near surface nuclear methods, and borehole methods.
Image description: Photo of Geophysical testing equipment.
Image description: Photo of two men using Geophysical testing equipment.

The advantages of geophysical tests include:
• They are nondestructive and/or noninvasive;• They are fast and economical; and• There is a theoretical basis for interpretation of results and they are applicable to both soils and rocks.
The limitations of geophysical tests include:
• There are no samples obtained or direct physical penetration into the ground;• Models are assumed for interpretation of results;• The readings are affected by cemented layers or inclusions; and• Results are influenced by water, clay, and depth.
The use of geophysical testing methods are beneficial when highly variable subsurface site conditions are suspected, a regional study is required for a transportation corridor, or to evaluate settlement potential for sensitive structures. If you would like to read more about geophysical testing, Section 3.15, Chapter 3, Soils and Foundations Reference Manual Volume I, is an excellent source and is included with your reference materials.
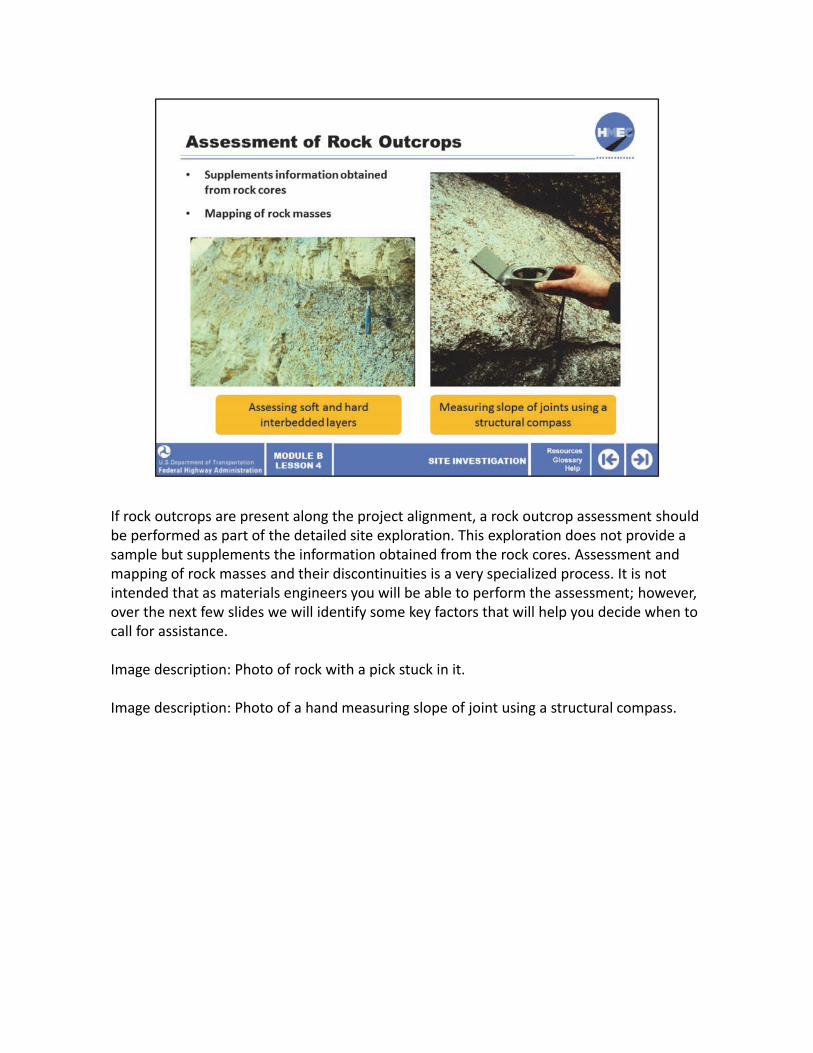
If rock outcrops are present along the project alignment, a rock outcrop assessment should be performed as part of the detailed site exploration. This exploration does not provide a sample but supplements the information obtained from the rock cores. Assessment and mapping of rock masses and their discontinuities is a very specialized process. It is not intended that as materials engineers you will be able to perform the assessment; however, over the next few slides we will identify some key factors that will help you decide when to call for assistance.
Image description: Photo of rock with a pick stuck in it.
Image description: Photo of a hand measuring slope of joint using a structural compass.
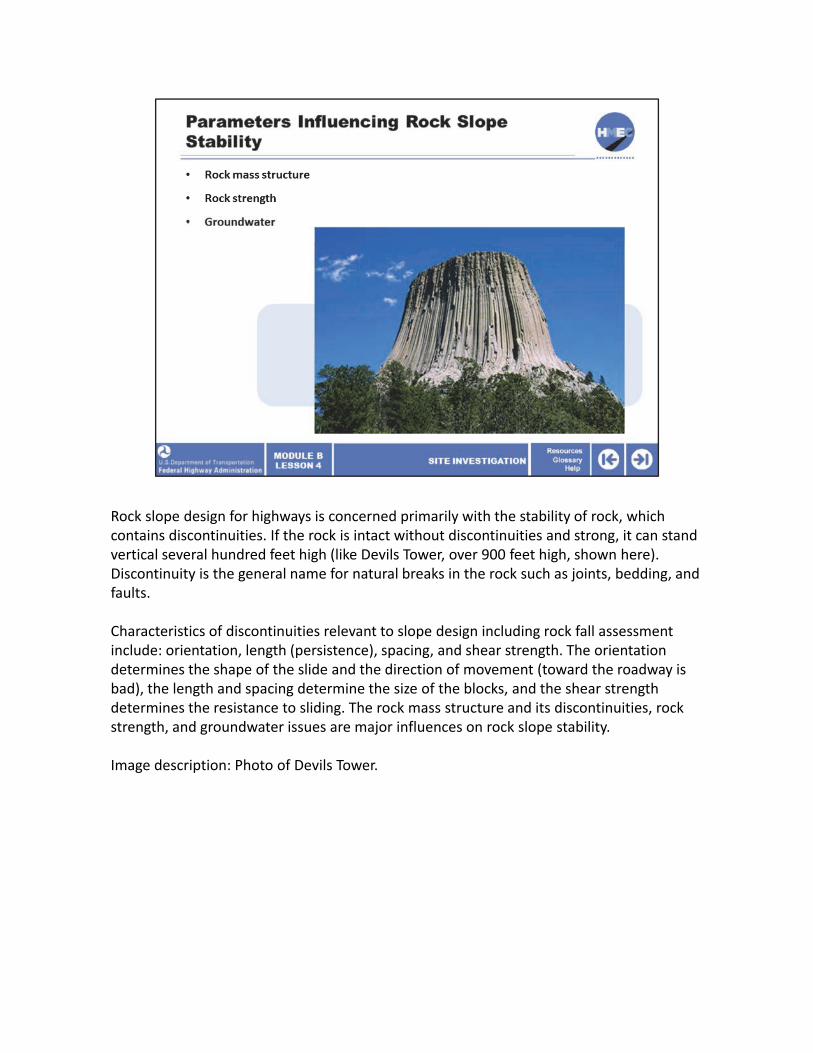
Rock slope design for highways is concerned primarily with the stability of rock, which contains discontinuities. If the rock is intact without discontinuities and strong, it can stand vertical several hundred feet high (like Devils Tower, over 900 feet high, shown here). Discontinuity is the general name for natural breaks in the rock such as joints, bedding, and faults.
Characteristics of discontinuities relevant to slope design including rock fall assessment include: orientation, length (persistence), spacing, and shear strength. The orientation determines the shape of the slide and the direction of movement (toward the roadway is bad), the length and spacing determine the size of the blocks, and the shear strength determines the resistance to sliding. The rock mass structure and its discontinuities, rock strength, and groundwater issues are major influences on rock slope stability.
Image description: Photo of Devils Tower.
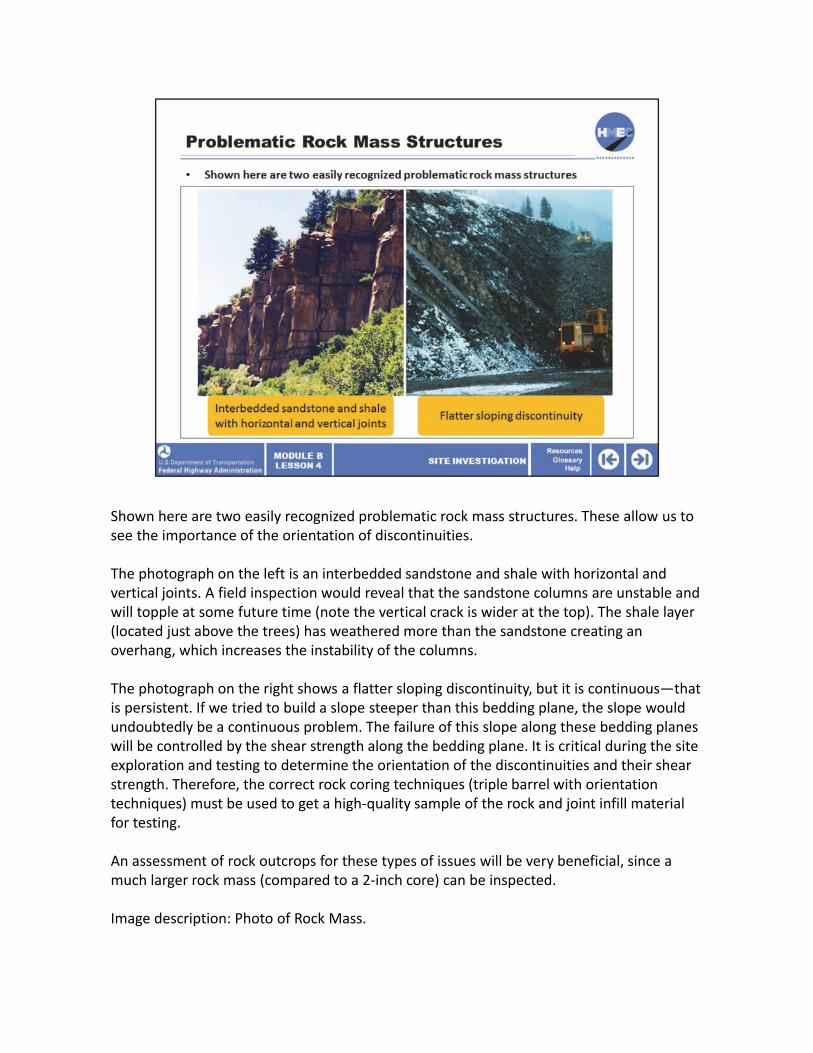
Shown here are two easily recognized problematic rock mass structures. These allow us to see the importance of the orientation of discontinuities.
The photograph on the left is an interbedded sandstone and shale with horizontal and vertical joints. A field inspection would reveal that the sandstone columns are unstable and will topple at some future time (note the vertical crack is wider at the top). The shale layer (located just above the trees) has weathered more than the sandstone creating an overhang, which increases the instability of the columns.
The photograph on the right shows a flatter sloping discontinuity, but it is continuous—that is persistent. If we tried to build a slope steeper than this bedding plane, the slope would undoubtedly be a continuous problem. The failure of this slope along these bedding planes will be controlled by the shear strength along the bedding plane. It is critical during the site exploration and testing to determine the orientation of the discontinuities and their shear strength. Therefore, the correct rock coring techniques (triple barrel with orientation techniques) must be used to get a high‐quality sample of the rock and joint infill material for testing.
An assessment of rock outcrops for these types of issues will be very beneficial, since a much larger rock mass (compared to a 2‐inch core) can be inspected.
Image description: Photo of Rock Mass.

Image description: Photo of sloping Rock Mass.
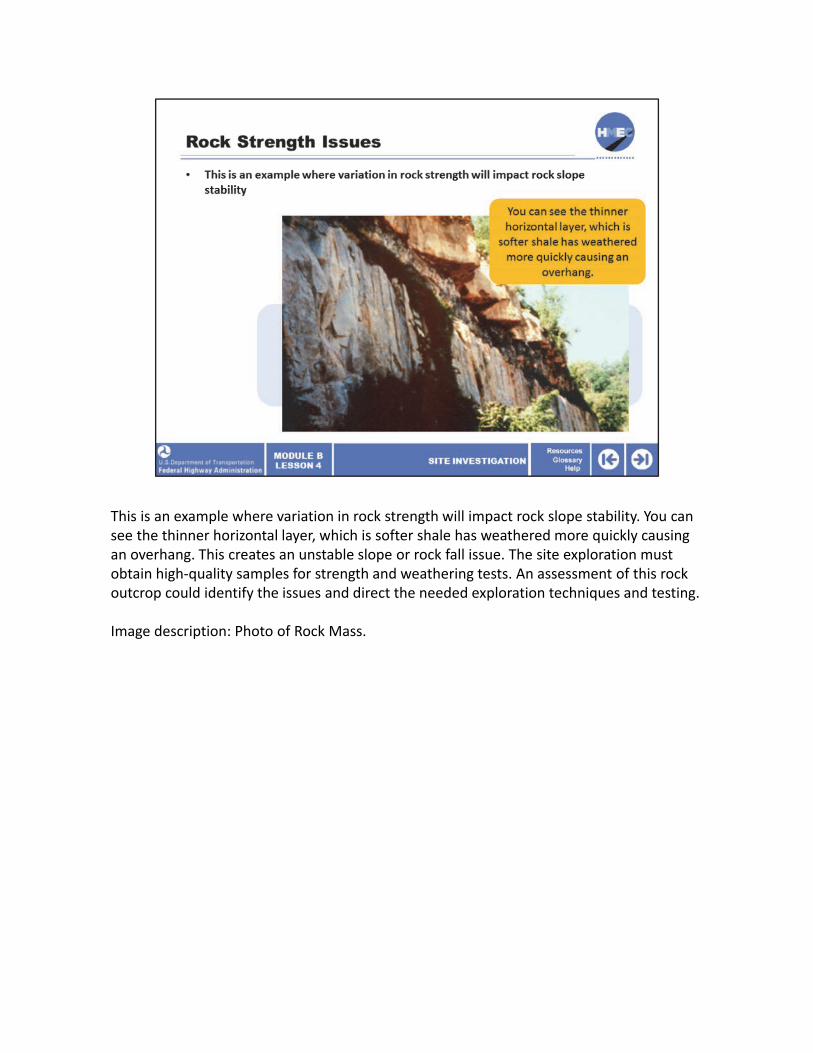
This is an example where variation in rock strength will impact rock slope stability. You can see the thinner horizontal layer, which is softer shale has weathered more quickly causing an overhang. This creates an unstable slope or rock fall issue. The site exploration must obtain high‐quality samples for strength and weathering tests. An assessment of this rock outcrop could identify the issues and direct the needed exploration techniques and testing.
Image description: Photo of Rock Mass.
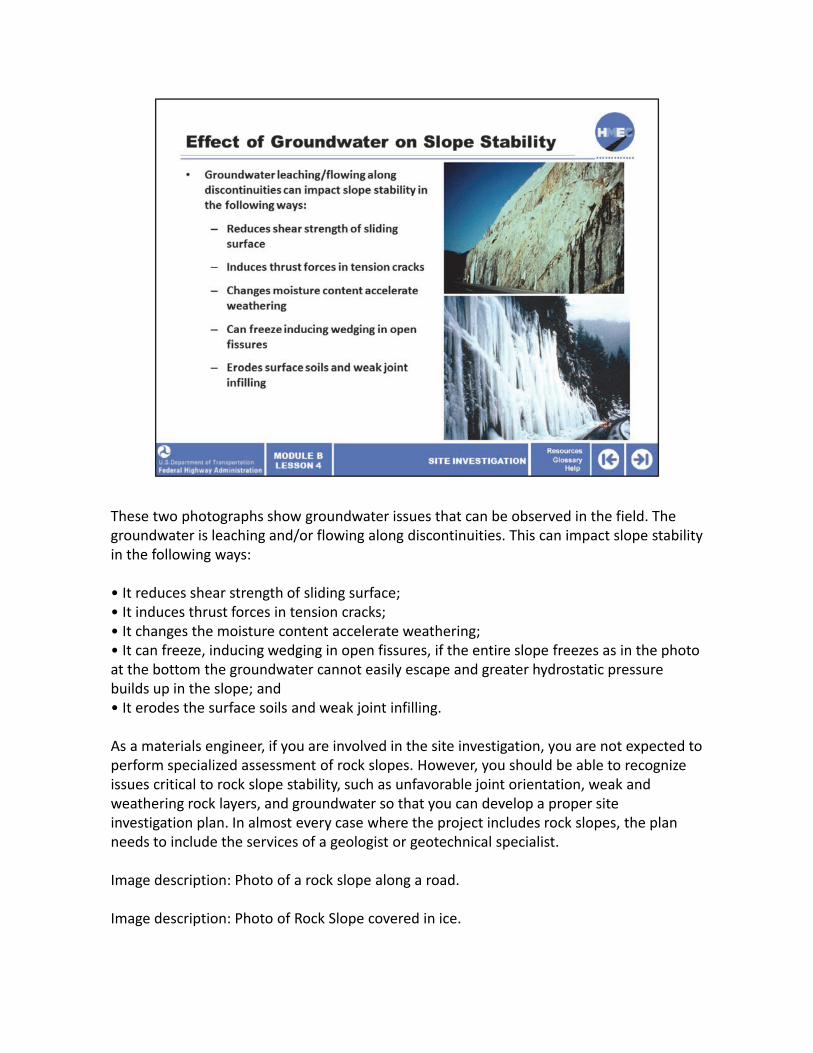
These two photographs show groundwater issues that can be observed in the field. The groundwater is leaching and/or flowing along discontinuities. This can impact slope stability in the following ways:
• It reduces shear strength of sliding surface;• It induces thrust forces in tension cracks;• It changes the moisture content accelerate weathering;• It can freeze, inducing wedging in open fissures, if the entire slope freezes as in the photo at the bottom the groundwater cannot easily escape and greater hydrostatic pressure builds up in the slope; and• It erodes the surface soils and weak joint infilling.
As a materials engineer, if you are involved in the site investigation, you are not expected to perform specialized assessment of rock slopes. However, you should be able to recognize issues critical to rock slope stability, such as unfavorable joint orientation, weak and weathering rock layers, and groundwater so that you can develop a proper site investigation plan. In almost every case where the project includes rock slopes, the plan needs to include the services of a geologist or geotechnical specialist.
Image description: Photo of a rock slope along a road.
Image description: Photo of Rock Slope covered in ice.
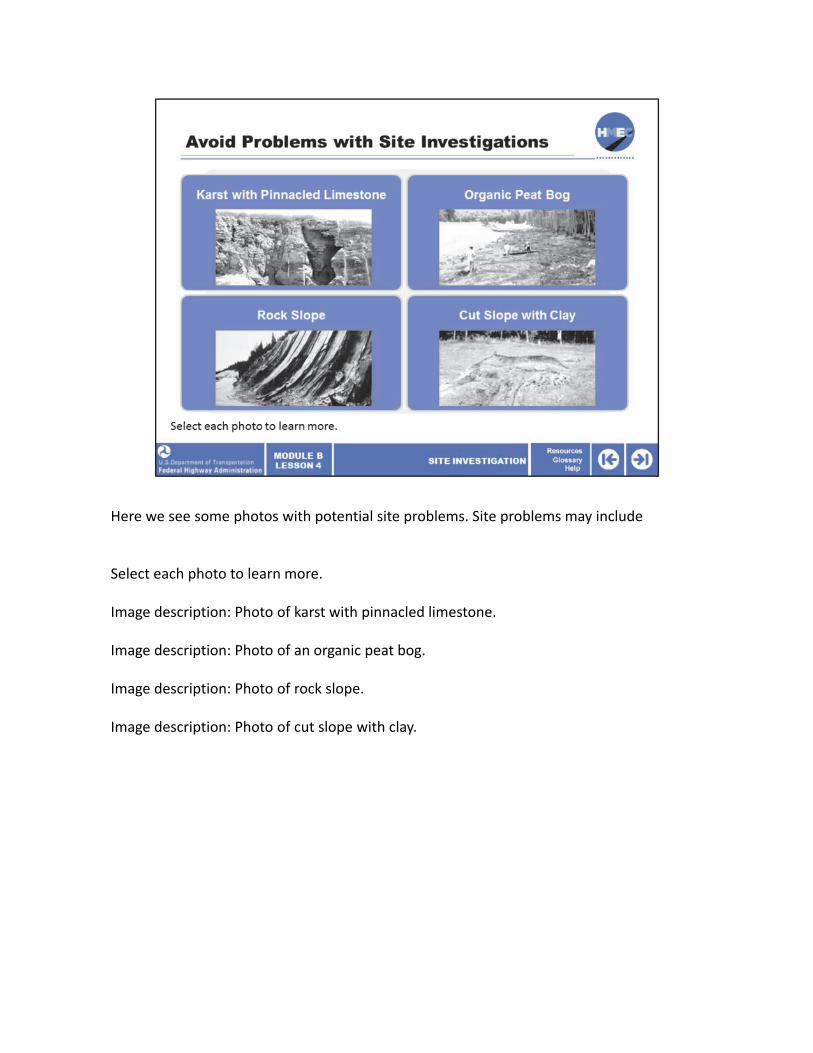
Here we see some photos with potential site problems. Site problems may include kawith pinnacled limestone, organic peat bog, rock slope and cut slope with clay.
Select each photo to learn more.
Image description: Photo of karst with pinnacled limestone.
Image description: Photo of an organic peat bog.
Image description: Photo of rock slope.
Image description: Photo of cut slope with clay.
rst
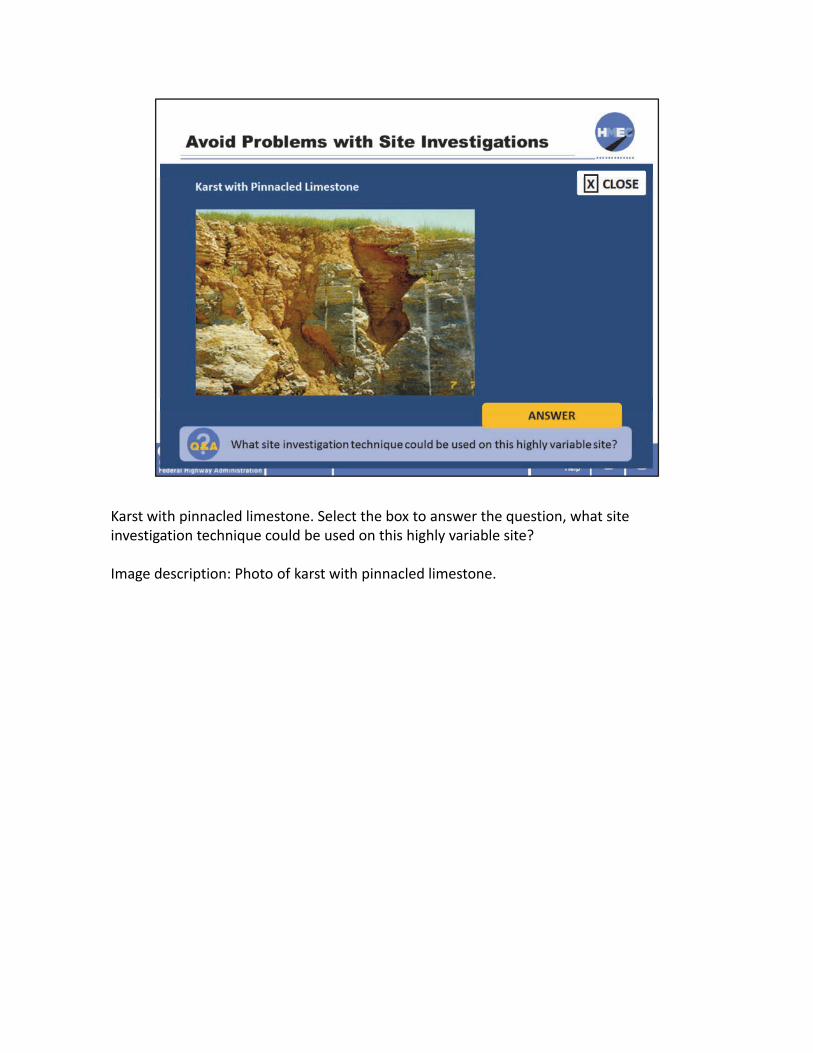
Karst with pinnacled limestone. Select the box to answer the question, what site investigation technique could be used on this highly variable site?
Image description: Photo of karst with pinnacled limestone.
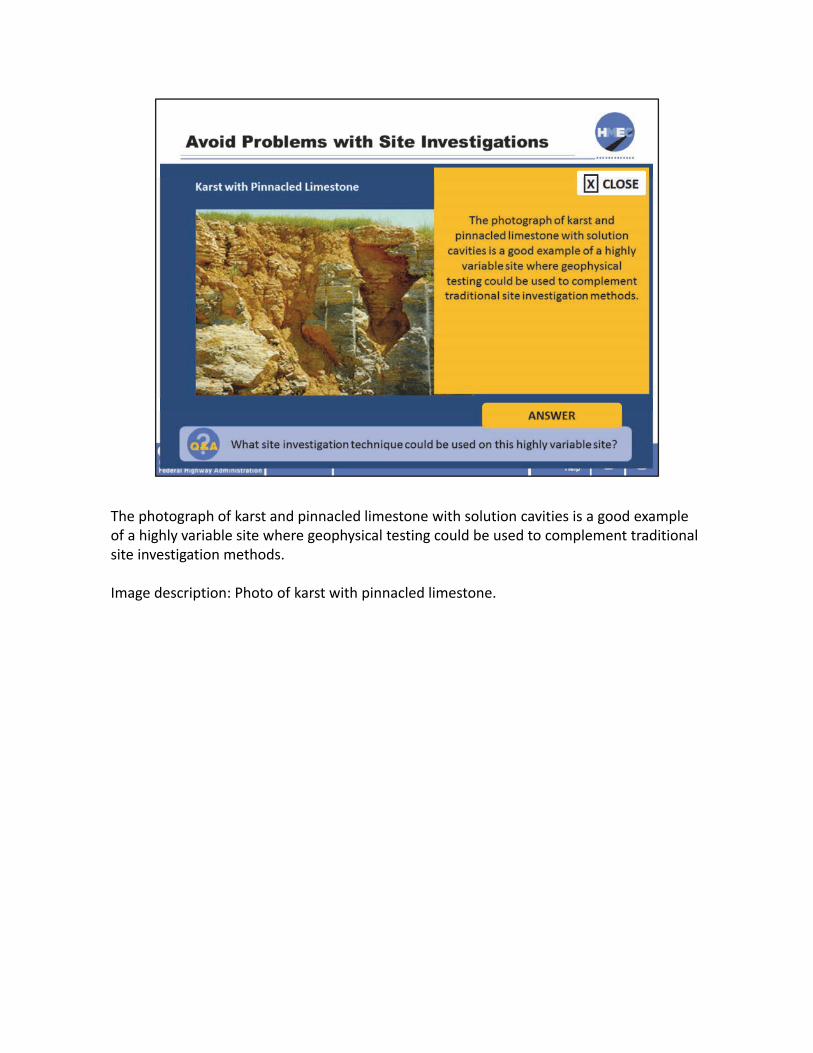
The photograph of karst and pinnacled limestone with solution cavities is a good example of a highly variable site where geophysical testing could be used to complement traditional site investigation methods.
Image description: Photo of karst with pinnacled limestone.
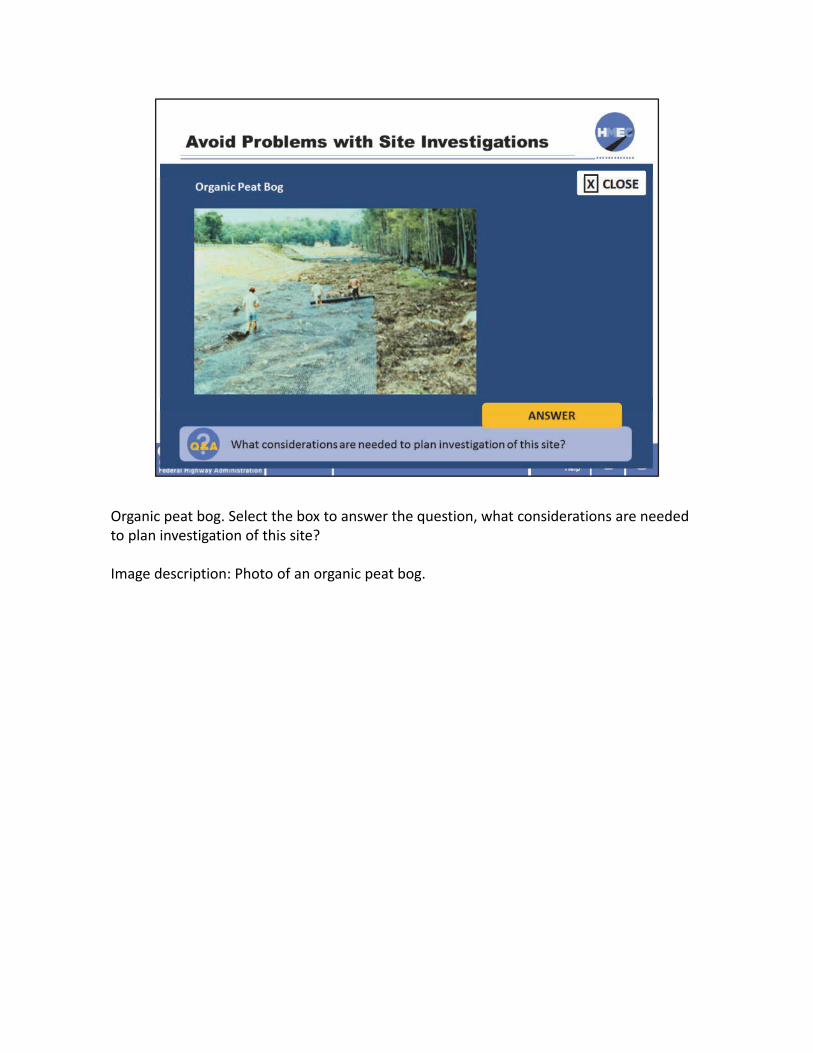
Organic peat bog. Select the box to answer the question, what considerations are needed to plan investigation of this site?
Image description: Photo of an organic peat bog.
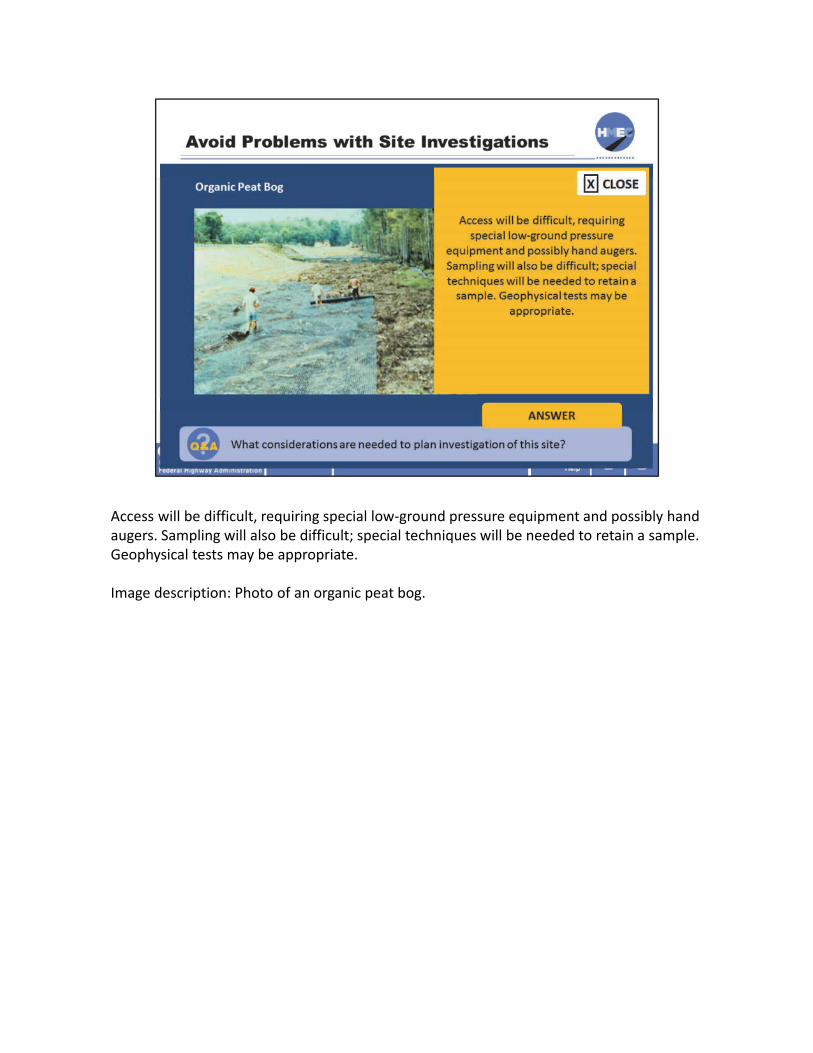
Access will be difficult, requiring special low‐ground pressure equipment and possibly hand augers. Sampling will also be difficult; special techniques will be needed to retain a sample. Geophysical tests may be appropriate.
Image description: Photo of an organic peat bog.
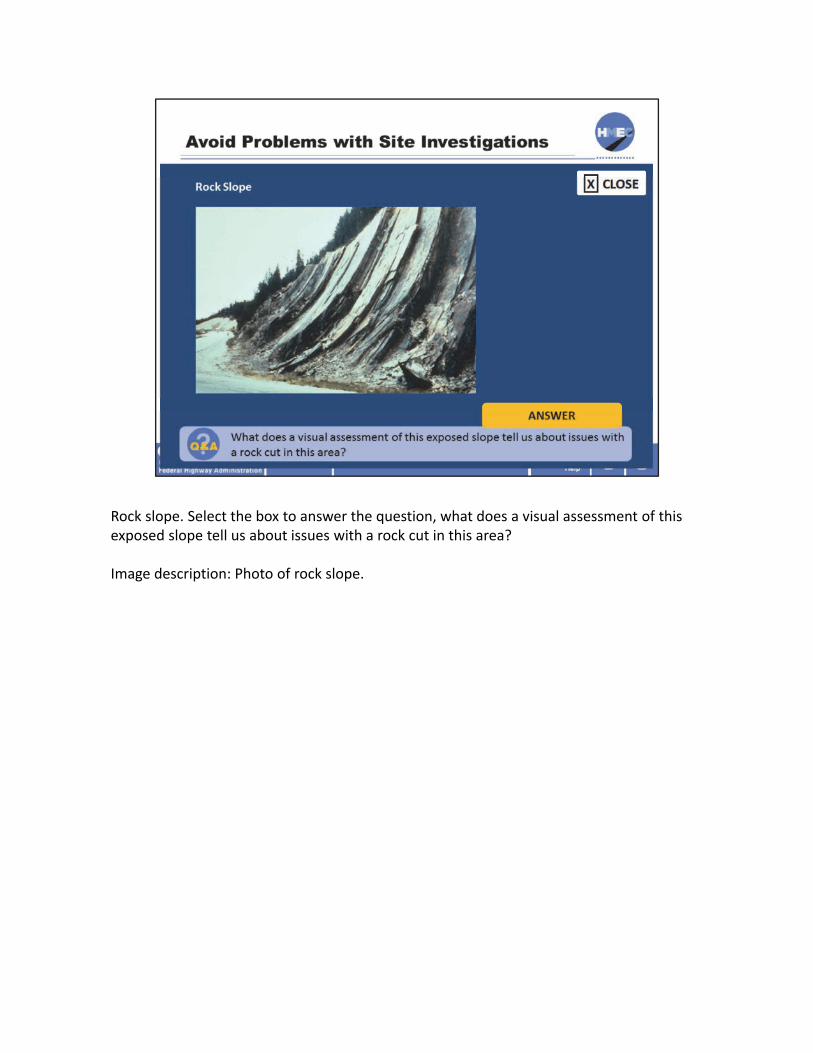
Rock slope. Select the box to answer the question, what does a visual assessment of this exposed slope tell us about issues with a rock cut in this area?
Image description: Photo of rock slope.
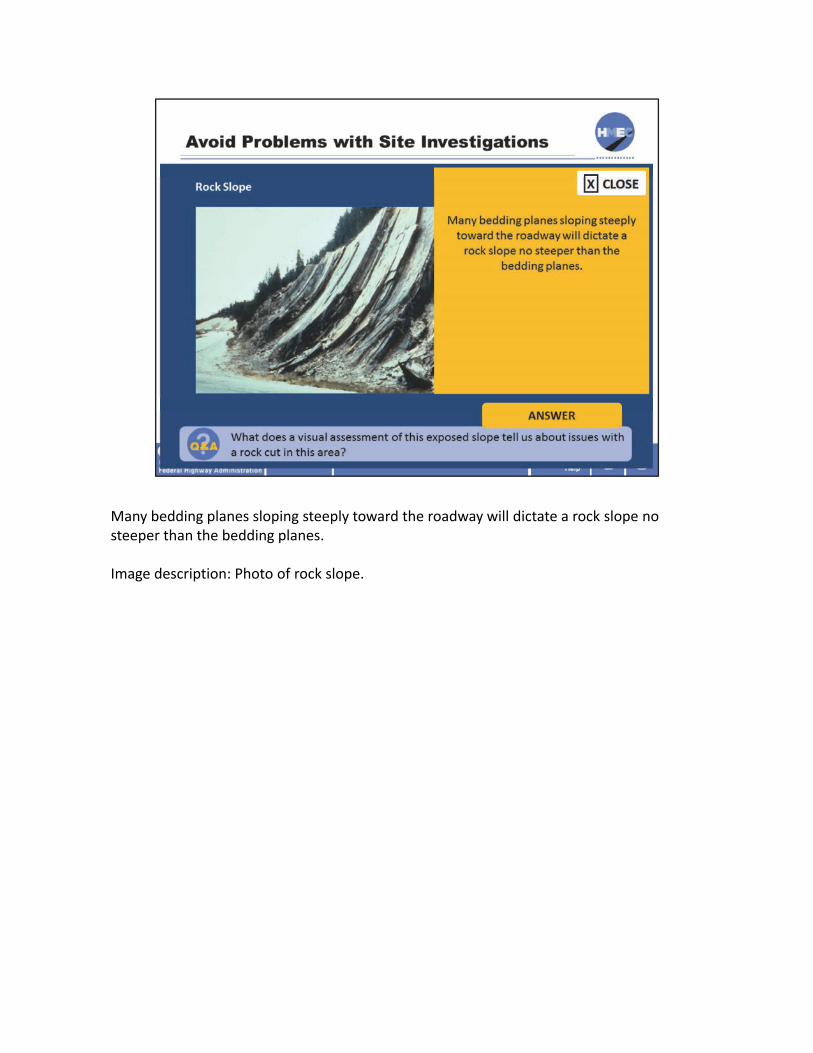
Many bedding planes sloping steeply toward the roadway will dictate a rock slope no steeper than the bedding planes.
Image description: Photo of rock slope.
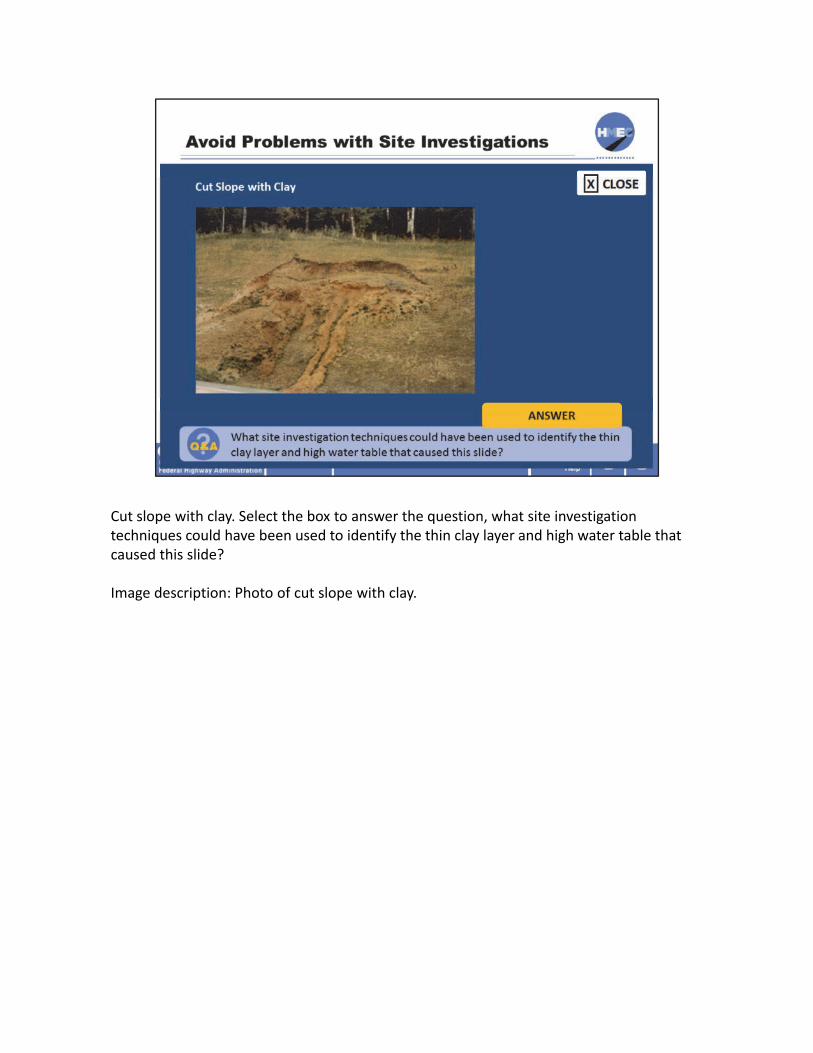
Cut slope with clay. Select the box to answer the question, what site investigation techniques could have been used to identify the thin clay layer and high water table that caused this slide?
Image description: Photo of cut slope with clay.
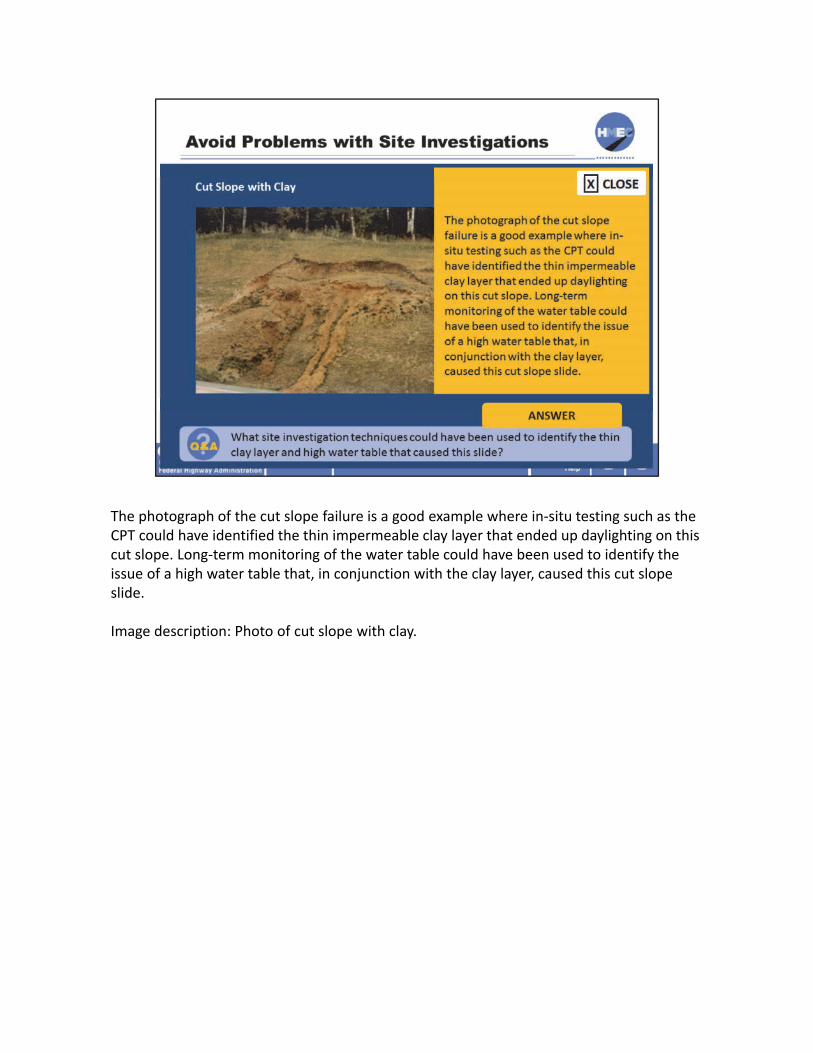
The photograph of the cut slope failure is a good example where in‐situ testing such as the CPT could have identified the thin impermeable clay layer that ended up daylighting on this cut slope. Long‐term monitoring of the water table could have been used to identify the issue of a high water table that, in conjunction with the clay layer, caused this cut slope slide.
Image description: Photo of cut slope with clay.
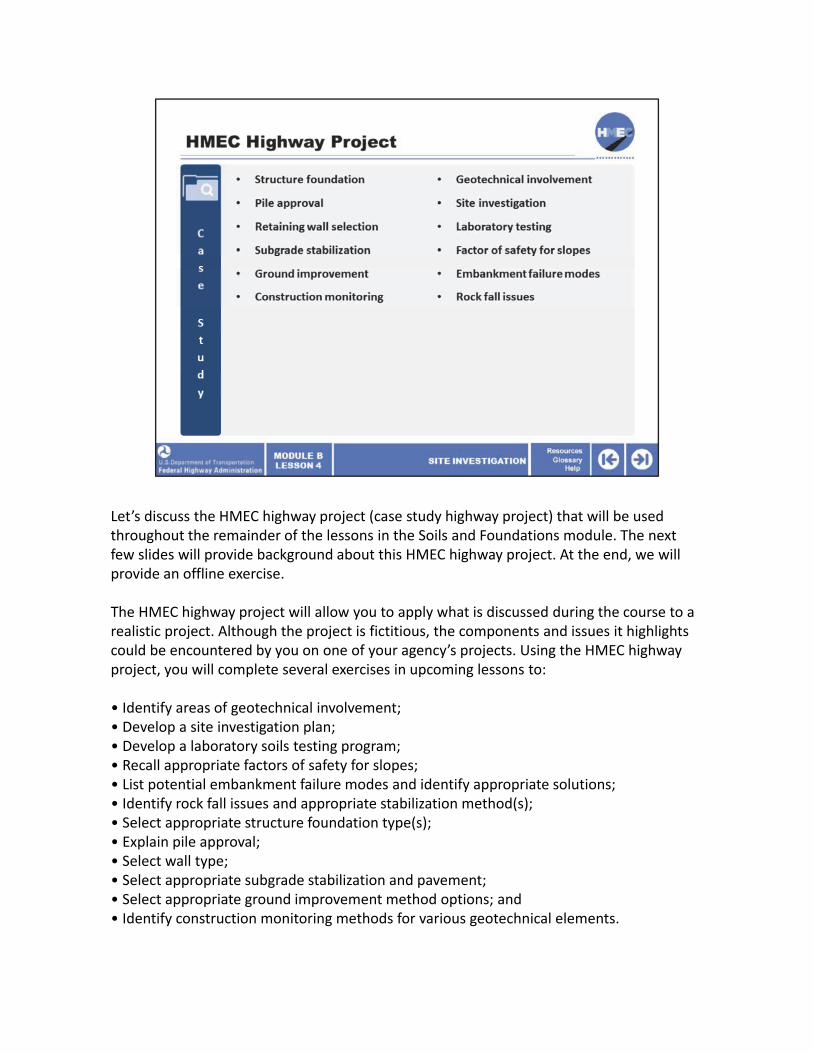
Let’s discuss the HMEC highway project (case study highway project) that will be used throughout the remainder of the lessons in the Soils and Foundations module. The next few slides will provide background about this HMEC highway project. At the end, we will provide an offline exercise.
The HMEC highway project will allow you to apply what is discussed during the course to a realistic project. Although the project is fictitious, the components and issues it highlights could be encountered by you on one of your agency’s projects. Using the HMEC highway project, you will complete several exercises in upcoming lessons to:
• Identify areas of geotechnical involvement;• Develop a site investigation plan;• Develop a laboratory soils testing program;• Recall appropriate factors of safety for slopes;• List potential embankment failure modes and identify appropriate solutions;• Identify rock fall issues and appropriate stabilization method(s);• Select appropriate structure foundation type(s);• Explain pile approval;• Select wall type;• Select appropriate subgrade stabilization and pavement;• Select appropriate ground improvement method options; and• Identify construction monitoring methods for various geotechnical elements.

For this first exercise, you will be identifying areas of geotechnical involvement for the project and developing a site investigation plan for the project. This will be your offline assignment to complete before participating in the instructor‐led training on Lesson 5 in a couple of weeks. Don’t worry, we have discussed everything you need to accomplish the work.
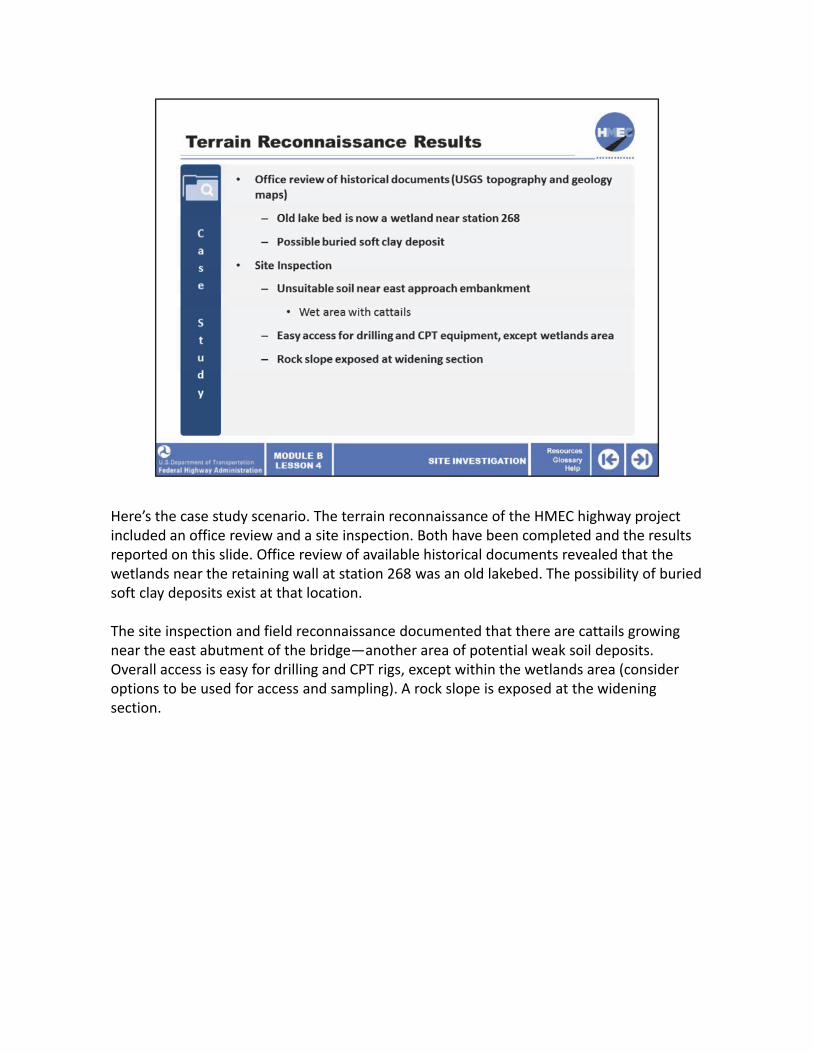
Here’s the case study scenario. The terrain reconnaissance of the HMEC highway project included an office review and a site inspection. Both have been completed and the results reported on this slide. Office review of available historical documents revealed that the wetlands near the retaining wall at station 268 was an old lakebed. The possibility of buried soft clay deposits exist at that location.
The site inspection and field reconnaissance documented that there are cattails growing near the east abutment of the bridge—another area of potential weak soil deposits. Overall access is easy for drilling and CPT rigs, except within the wetlands area (consider options to be used for access and sampling). A rock slope is exposed at the widening section.
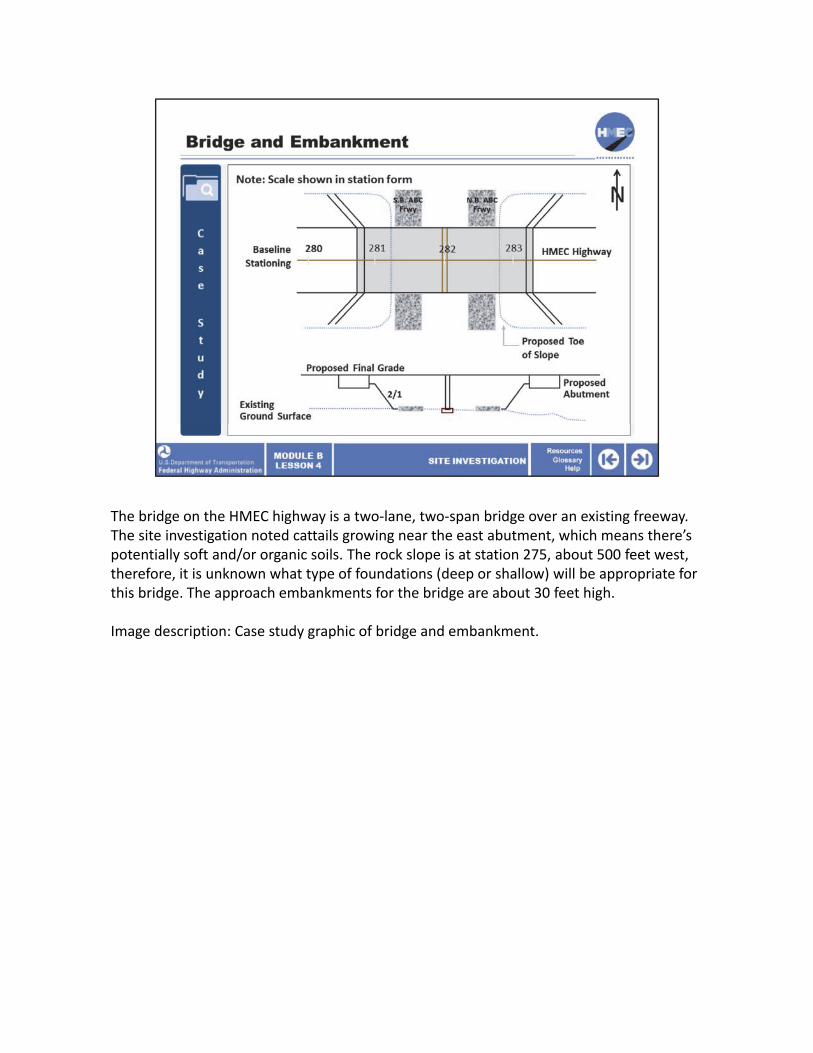
The bridge on the HMEC highway is a two‐lane, two‐span bridge over an existing freeway. The site investigation noted cattails growing near the east abutment, which means there’s potentially soft and/or organic soils. The rock slope is at station 275, about 500 feet west, therefore, it is unknown what type of foundations (deep or shallow) will be appropriate for this bridge. The approach embankments for the bridge are about 30 feet high.
Image description: Case study graphic of bridge and embankment.
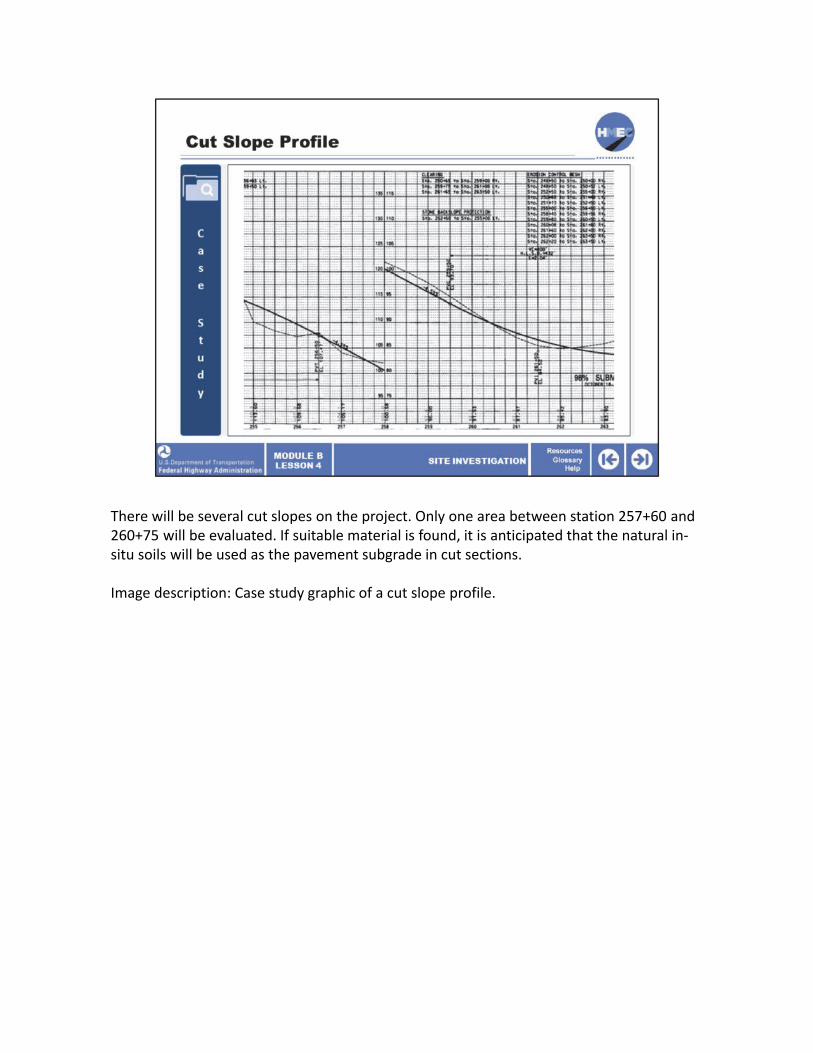
There will be several cut slopes on the project. Only one area between station 257+60 and 260+75 will be evaluated. If suitable material is found, it is anticipated that the natural in‐situ soils will be used as the pavement subgrade in cut sections.
Image description: Case study graphic of a cut slope profile.
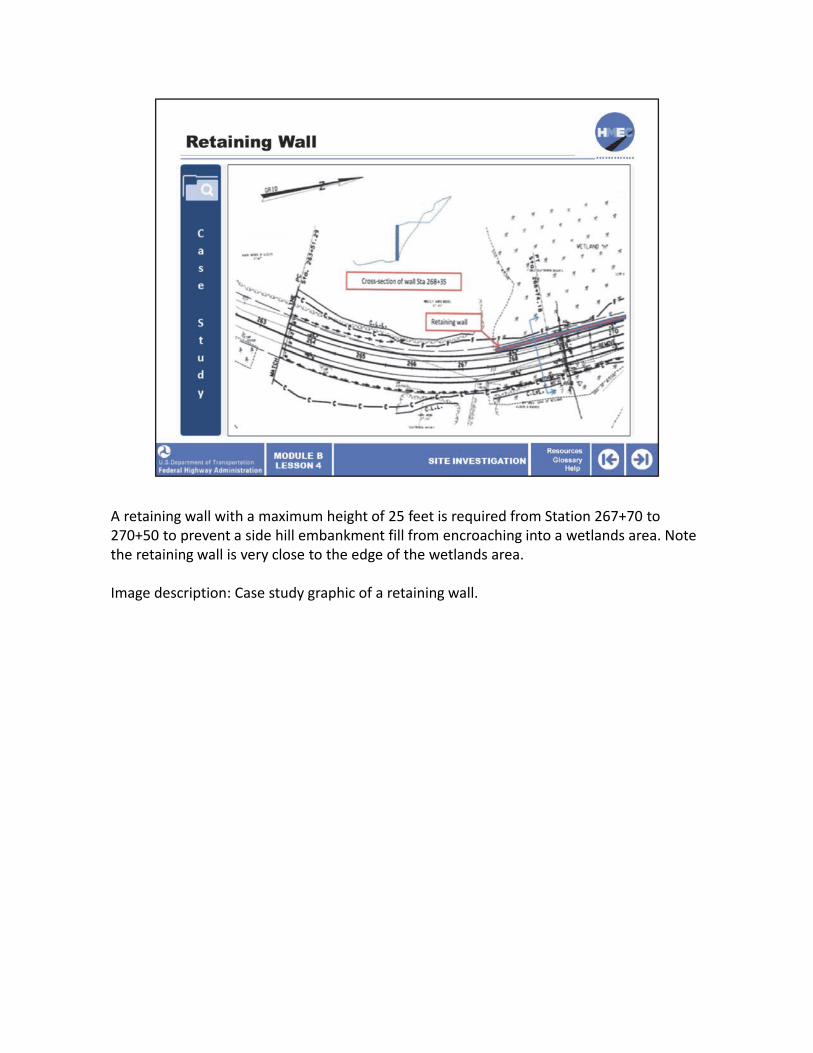
A retaining wall with a maximum height of 25 feet is required from Station 267+70 to 270+50 to prevent a side hill embankment fill from encroaching into a wetlands area. Note the retaining wall is very close to the edge of the wetlands area.
Image description: Case study graphic of a retaining wall.
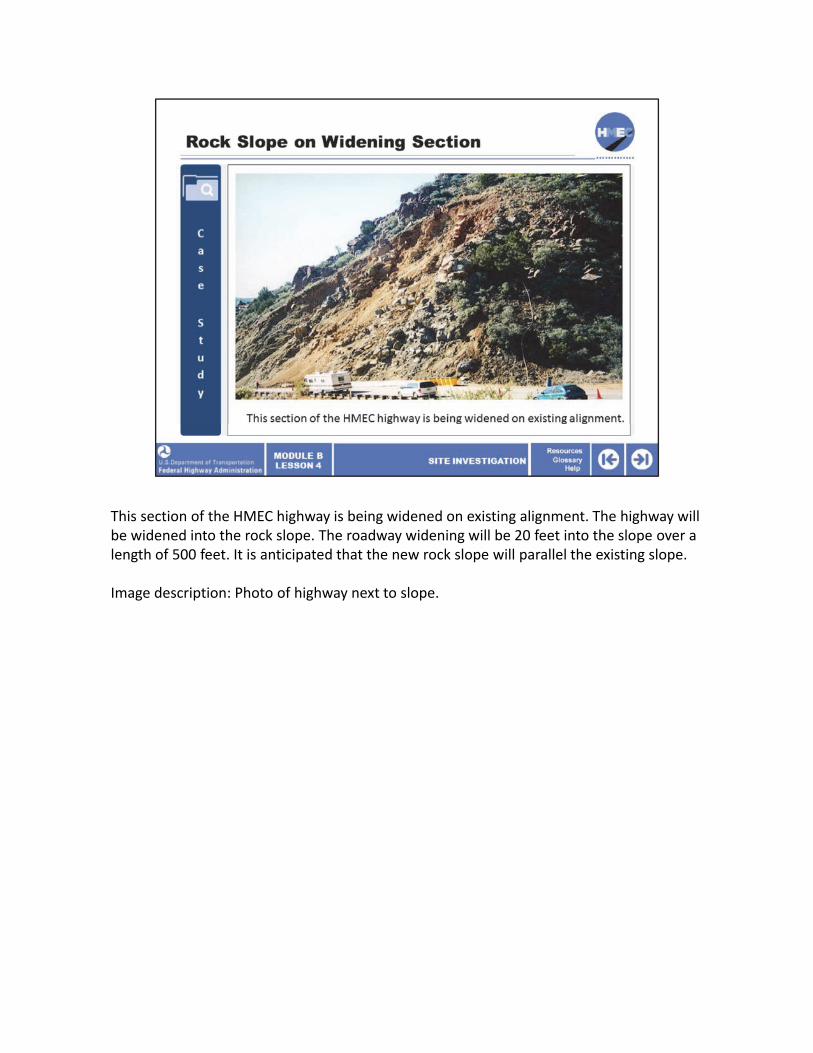
This section of the HMEC highway is being widened on existing alignment. The highway will be widened into the rock slope. The roadway widening will be 20 feet into the slope over a length of 500 feet. It is anticipated that the new rock slope will parallel the existing slope.
Image description: Photo of highway next to slope.
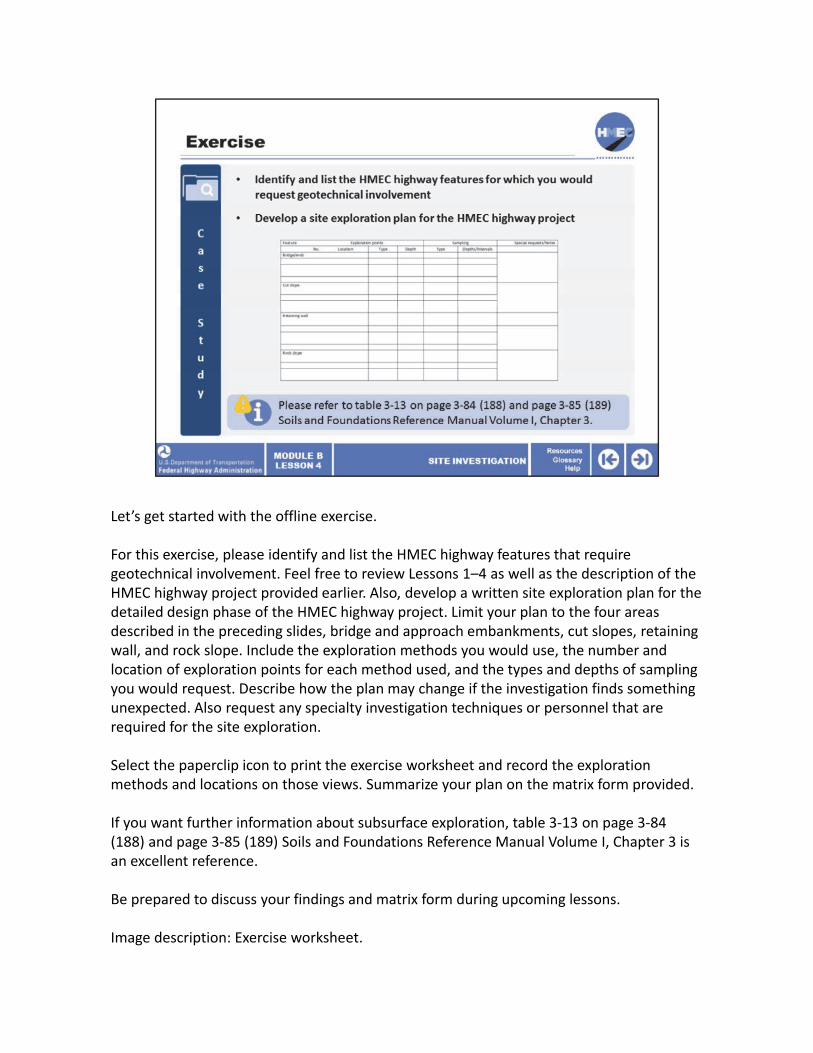
Let’s get started with the offline exercise.
For this exercise, please identify and list the HMEC highway features that require geotechnical involvement. Feel free to review Lessons 1–4 as well as the description of the HMEC highway project provided earlier. Also, develop a written site exploration plan for the detailed design phase of the HMEC highway project. Limit your plan to the four areas described in the preceding slides, bridge and approach embankments, cut slopes, retaining wall, and rock slope. Include the exploration methods you would use, the number and location of exploration points for each method used, and the types and depths of sampling you would request. Describe how the plan may change if the investigation finds something unexpected. Also request any specialty investigation techniques or personnel that are required for the site exploration.
Select the paperclip icon to print the exercise worksheet and record the exploration methods and locations on those views. Summarize your plan on the matrix form provided.
If you want further information about subsurface exploration, table 3‐13 on page 3‐84 (188) and page 3‐85 (189) Soils and Foundations Reference Manual Volume I, Chapter 3 is an excellent reference.
Be prepared to discuss your findings and matrix form during upcoming lessons.
Image description: Exercise worksheet.
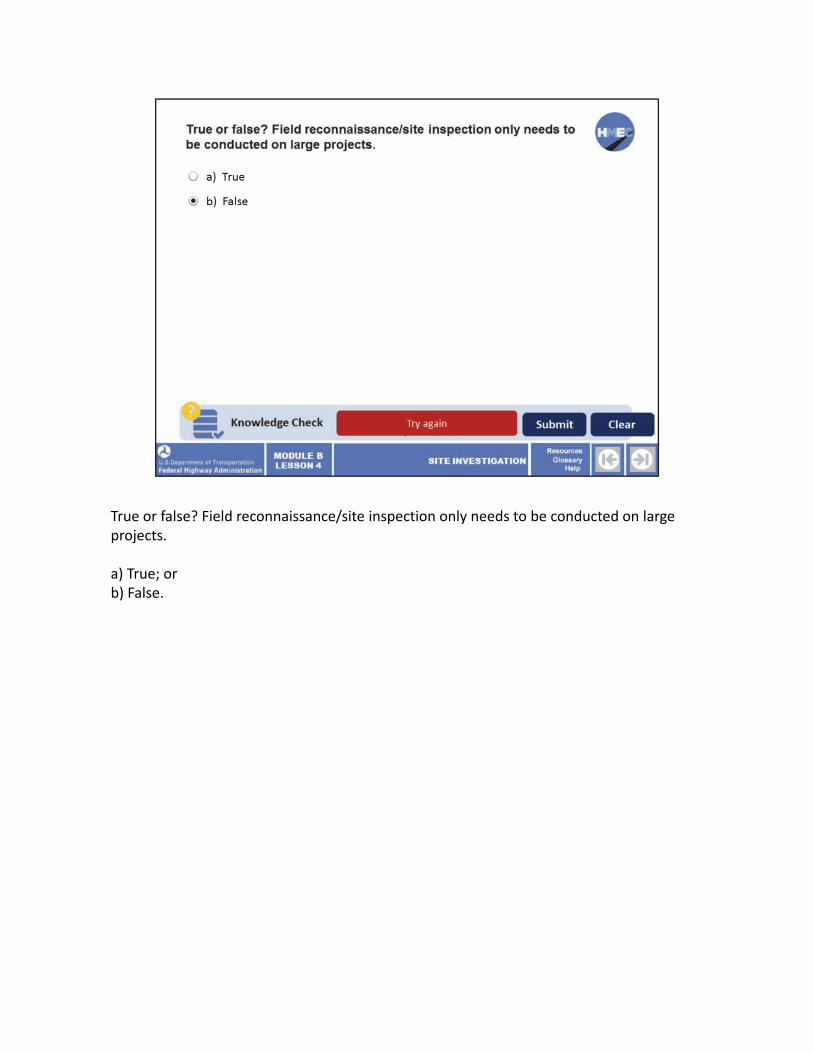
True or false? Field reconnaissance/site inspection only needs to be conducted on large projects.
a) True; orb) False.
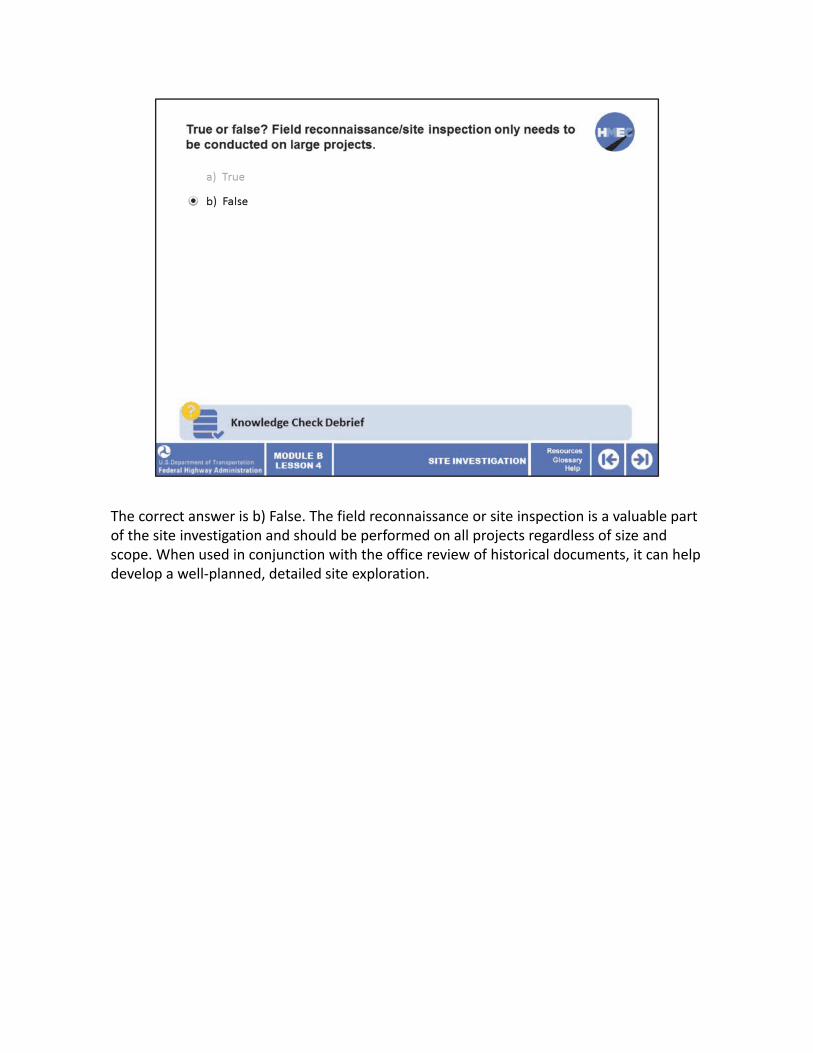
The correct answer is b) False. The field reconnaissance or site inspection is a valuable part of the site investigation and should be performed on all projects regardless of size and scope. When used in conjunction with the office review of historical documents, it can help develop a well‐planned, detailed site exploration.
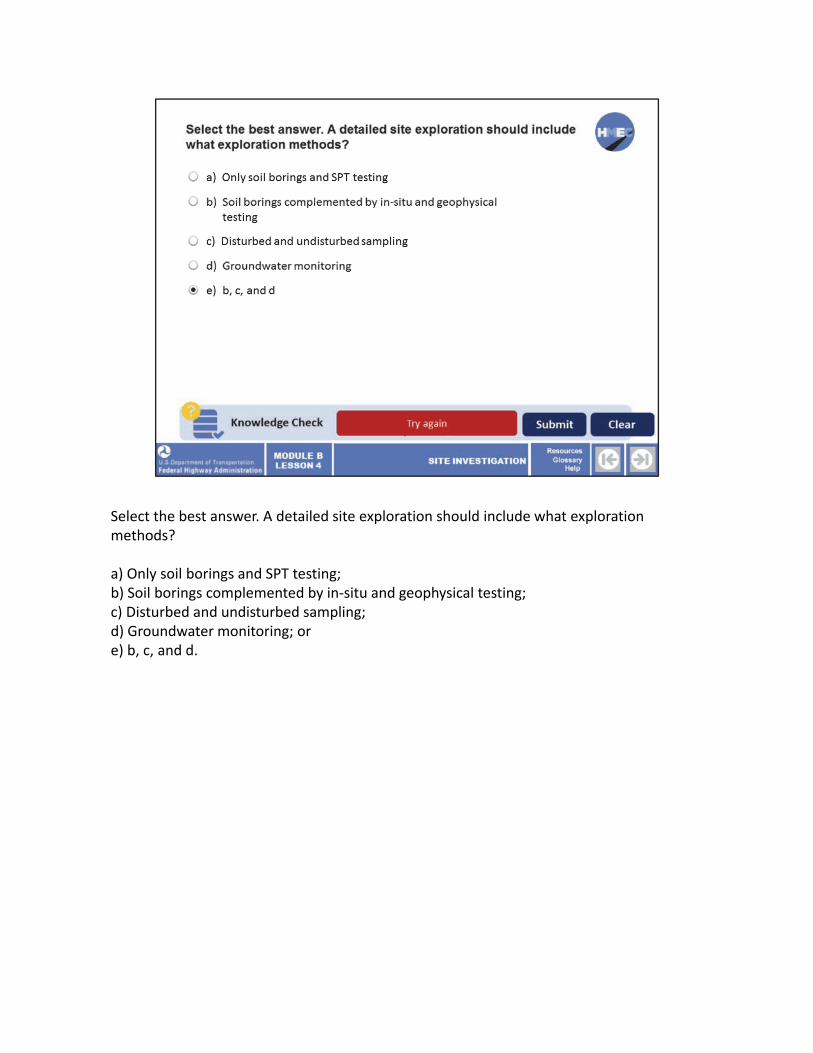
Select the best answer. A detailed site exploration should include what exploration methods?
a) Only soil borings and SPT testing;b) Soil borings complemented by in‐situ and geophysical testing;c) Disturbed and undisturbed sampling; d) Groundwater monitoring; or e) b, c, and d.
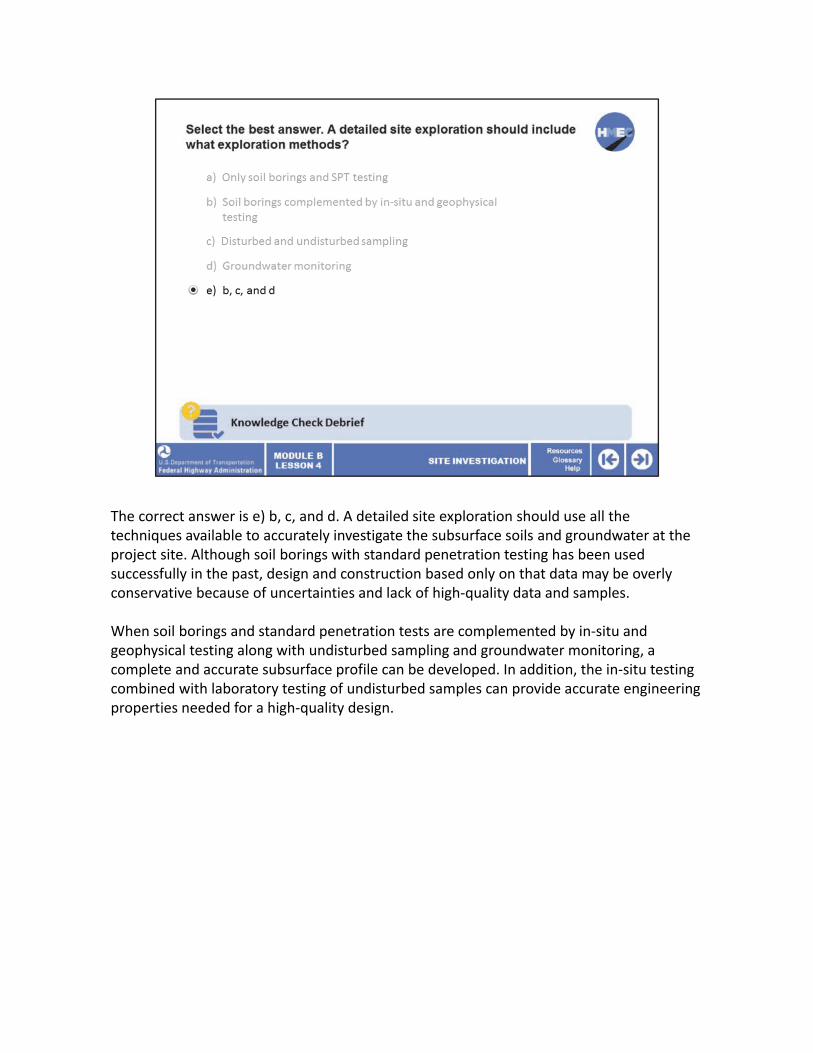
The correct answer is e) b, c, and d. A detailed site exploration should use all the techniques available to accurately investigate the subsurface soils and groundwater at the project site. Although soil borings with standard penetration testing has been used successfully in the past, design and construction based only on that data may be overly conservative because of uncertainties and lack of high‐quality data and samples.
When soil borings and standard penetration tests are complemented by in‐situ and geophysical testing along with undisturbed sampling and groundwater monitoring, a complete and accurate subsurface profile can be developed. In addition, the in‐situ testing combined with laboratory testing of undisturbed samples can provide accurate engineering properties needed for a high‐quality design.
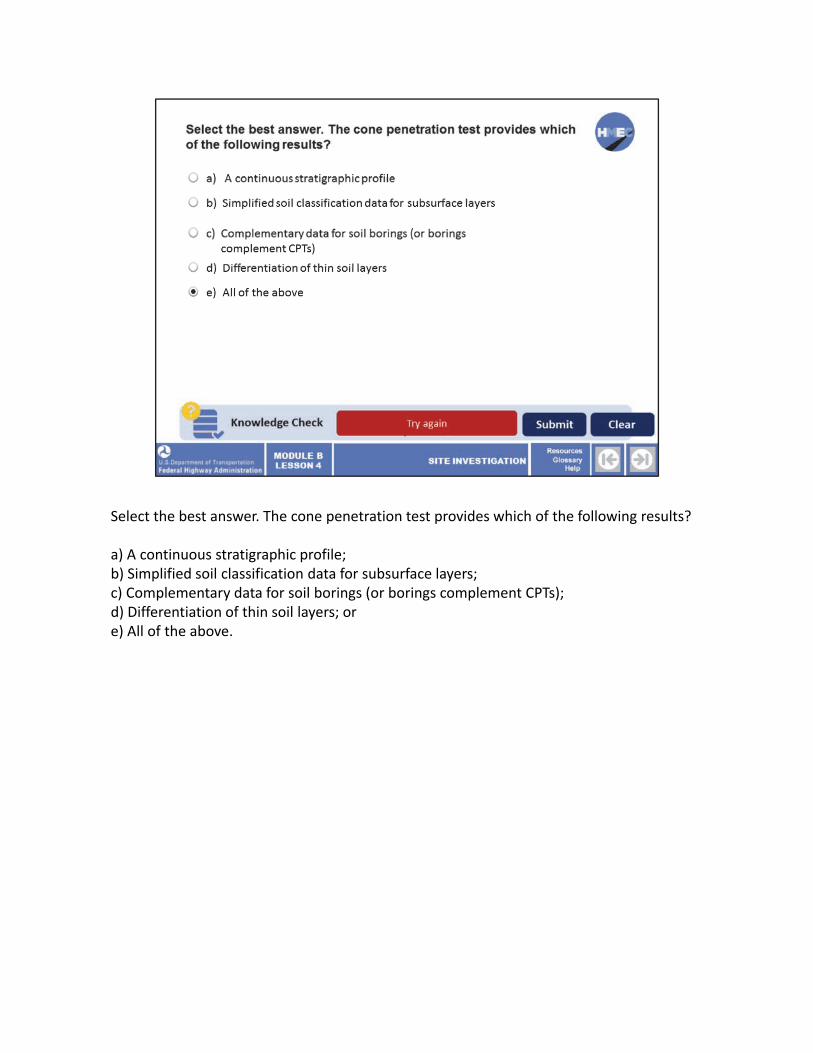
Select the best answer. The cone penetration test provides which of the following results?
a) A continuous stratigraphic profile;b) Simplified soil classification data for subsurface layers;c) Complementary data for soil borings (or borings complement CPTs);d) Differentiation of thin soil layers; or e) All of the above.
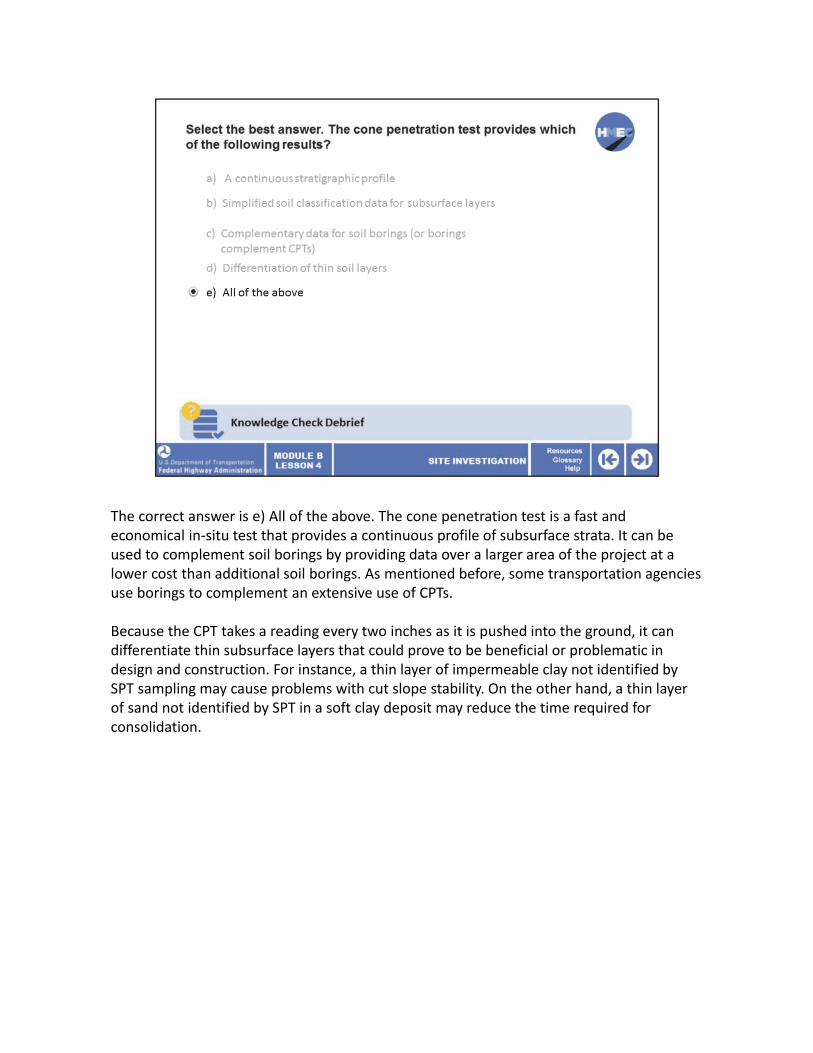
The correct answer is e) All of the above. The cone penetration test is a fast and economical in‐situ test that provides a continuous profile of subsurface strata. It can be used to complement soil borings by providing data over a larger area of the project at a lower cost than additional soil borings. As mentioned before, some transportation agencies use borings to complement an extensive use of CPTs.
Because the CPT takes a reading every two inches as it is pushed into the ground, it can differentiate thin subsurface layers that could prove to be beneficial or problematic in design and construction. For instance, a thin layer of impermeable clay not identified by SPT sampling may cause problems with cut slope stability. On the other hand, a thin layer of sand not identified by SPT in a soft clay deposit may reduce the time required for consolidation.
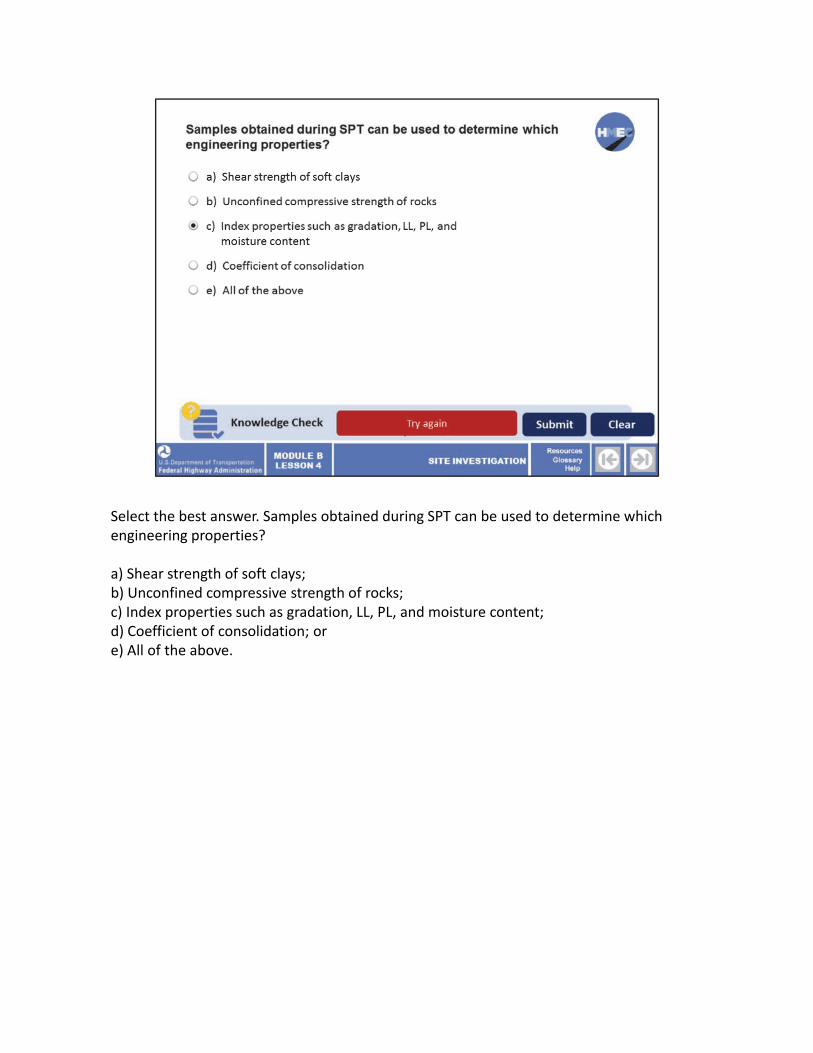
Select the best answer. Samples obtained during SPT can be used to determine which engineering properties?
a) Shear strength of soft clays;b) Unconfined compressive strength of rocks;c) Index properties such as gradation, LL, PL, and moisture content;d) Coefficient of consolidation; ore) All of the above.
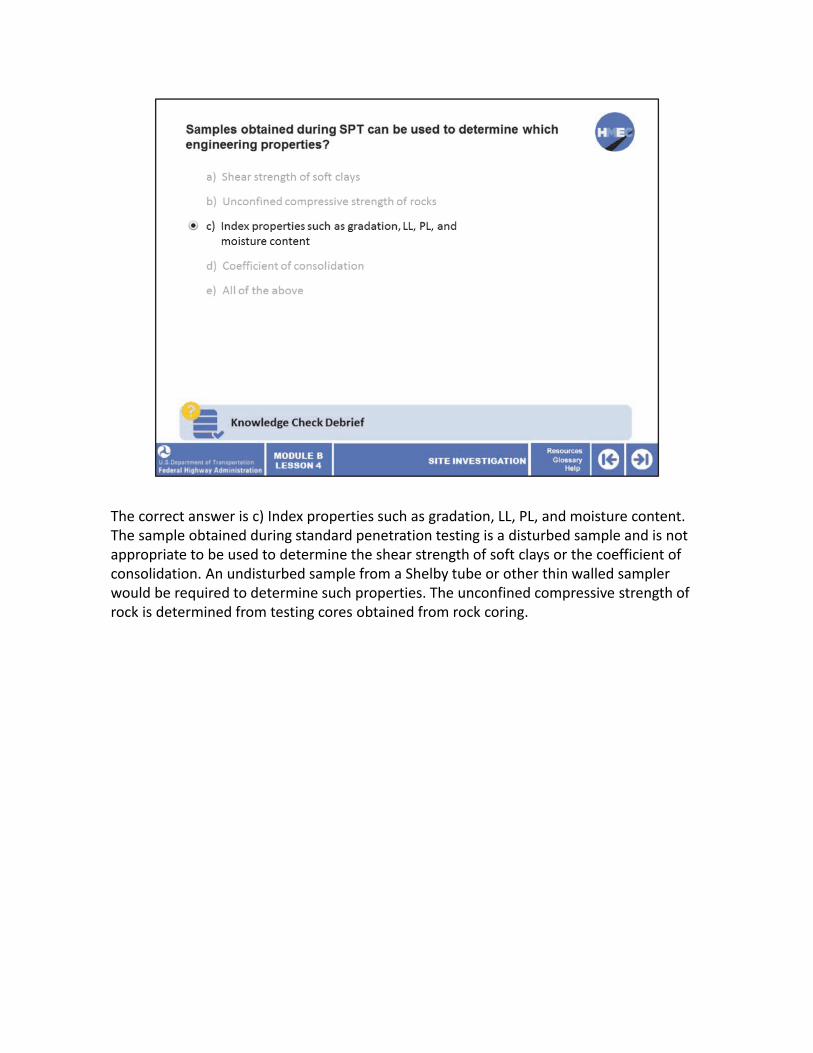
The correct answer is c) Index properties such as gradation, LL, PL, and moisture content. The sample obtained during standard penetration testing is a disturbed sample and is not appropriate to be used to determine the shear strength of soft clays or the coefficient of consolidation. An undisturbed sample from a Shelby tube or other thin walled sampler would be required to determine such properties. The unconfined compressive strength of rock is determined from testing cores obtained from rock coring.
You have completed Module B, Lesson 4: Site Investigation. You are now able to:
• Describe the three phases of a site investigation;• Explain various site exploration and sampling methods; and• Using given project criteria, select an appropriate sampling and site exploration plan.
Please bring any questions you may have about the web based training, to the instructor led training.
Close this lesson, and return to the module curriculum to select the next lesson. To close this window, select the “X” in the upper right‐hand corner of your screen.