Embed Size (px)
Citation preview

© ika 2016 · All rights reserved 2016/10/19 Slide No. 2 #150 · 16nm0042.pptx
Brussels, October 19th 2016
Dipl.-Wirt.-Ing. Nils Robert Neumann
Winning the CO2 Challenge Optimisation of OEM Product Portfolios by Market Modelling
EARPA FORMForum 2016
Institute for Automotive Engineering

© ika 2016 · All rights reserved 2016/10/19 Slide No. 3 #150 · 16nm0042.pptx
The European CO2 legislation bears high economical risks for OEMs and suppliers due to necessary investments with unknown customer acceptance at the same time.
A reliable picture of future customer demands is the key for market success of OEMs and suppliers in Europe.
Holistic market modelling is able to provide this information and helps OEMs and suppliers to meet the challenges
arising from the European CO2 legislation.
Status-quo
Market modelling as a solution
The framework for the EU automotive industry is changing drastically.
Introduction of stringent CO2 reduction legislation
Highly volatile and increasing fuel prices (in the long term)
OEMs and suppliers react by establishing technologies for higher efficiency and
introduction of electrified vehicle concepts.
Very high investments are necessary for each technology.
Future consumer demand for respective technologies is highly uncertain.
The framework conditions bear high economical risks for OEM and suppliers.
Cost-driven approaches are insufficient since customers determine fleet composition.
3 1 2 4
© ika 2016 · All rights reserved 2016/10/19 Slide No. 4 #150 · 16nm0042.pptx
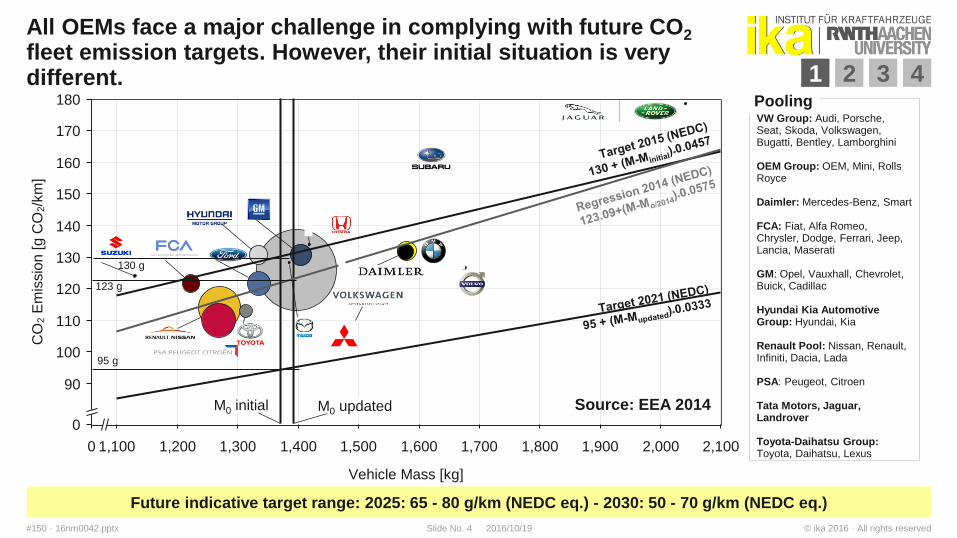
All OEMs face a major challenge in complying with future CO2 fleet emission targets. However, their initial situation is very different.
120
110
180
170
1,900 1,800 1,700 0 1,600
160
150
140
1,300 1,200 1,100 1,500 1,400 2,100 2,000
100
90
0
130
M0 updated
CO
2 E
mis
sio
n [
g C
O2/k
m]
M0 initial
Vehicle Mass [kg]
VW Group: Audi, Porsche, Seat, Skoda, Volkswagen, Bugatti, Bentley, Lamborghini OEM Group: OEM, Mini, Rolls Royce Daimler: Mercedes-Benz, Smart FCA: Fiat, Alfa Romeo, Chrysler, Dodge, Ferrari, Jeep, Lancia, Maserati GM: Opel, Vauxhall, Chevrolet, Buick, Cadillac Hyundai Kia Automotive Group: Hyundai, Kia Renault Pool: Nissan, Renault, Infiniti, Dacia, Lada PSA: Peugeot, Citroen Tata Motors, Jaguar, Landrover Toyota-Daihatsu Group: Toyota, Daihatsu, Lexus
Pooling
Source: EEA 2014
95 g
123 g
130 g
Future indicative target range: 2025: 65 - 80 g/km (NEDC eq.) - 2030: 50 - 70 g/km (NEDC eq.)
3 1 2 4
© ika 2016 · All rights reserved 2016/10/19 Slide No. 5 #150 · 16nm0042.pptx
Agenda
1. Motivation
2. Methodological Approach
3. Exemplary Results
4. Summary

© ika 2016 · All rights reserved 2016/10/19 Slide No. 6 #150 · 16nm0042.pptx
The complete model structure represents the complex
interactions in the market
All relevant actors and interdependencies have been integrated
in the model
Complete Model Structure
The methodological approach is a holistic market model that is capable of simulating OEM performance and hence improving product strategies in different environmental conditions.
Market environment
EU
vehicle
market
Vehicle
manufacturers
Vehicle
customers
Competition Social
interaction
National
legislation
EU
legislation
Energy
sector
Supplying
industry
Vehicle
homologation/
testing
Vehicle
taxation/
incentives
Customer
incentives
Market
information
Market
information Market
information
Vehicle
demand
Assets Information Regulation
Three types of actors with direct or indirect connections
Actors exchange different assets
OEM, customers and the market are regulated by the EU and
national governments
Main effects are CO2 regulation, taxation and
incentives
Various information is exchanged by market actors internally
and externally
Model represents a complete description of the relevant
interactions within the EU new vehicle market
Full integration of interaction requires high effort towards model
setup and parameterization, e.g.
Socio-demographics of customers
National (vehicle) taxation schemes of EU member
countries
Vehicles
(product
portfolio) Vehicle
usage All interactions except the product portfolio variable are
transferred in model algorithms and scenario-based assumptions
The product portfolio remains as the single model command
variable
Various performance indicators can be defined e.g.
Compliance with CO2 legislation
Operating profit / margins
3 1 2 4
© ika 2016 · All rights reserved 2016/10/19 Slide No. 7 #150 · 16nm0042.pptx
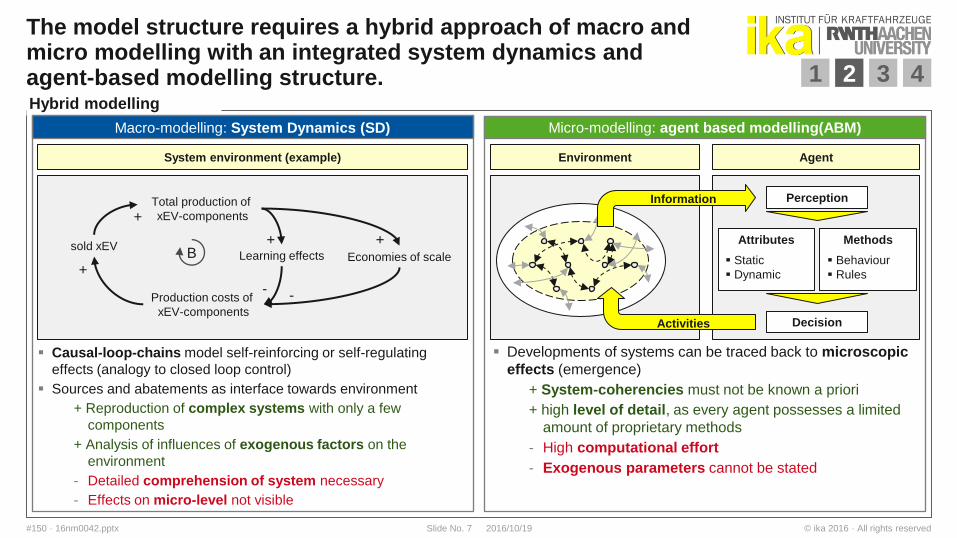
The model structure requires a hybrid approach of macro and micro modelling with an integrated system dynamics and agent-based modelling structure.
Hybrid modelling
Causal-loop-chains model self-reinforcing or self-regulating
effects (analogy to closed loop control)
Sources and abatements as interface towards environment
+ Reproduction of complex systems with only a few
components
+ Analysis of influences of exogenous factors on the
environment
- Detailed comprehension of system necessary
- Effects on micro-level not visible
Macro-modelling: System Dynamics (SD)
sold xEV
Production costs of
xEV-components
B +
-
Developments of systems can be traced back to microscopic
effects (emergence)
+ System-coherencies must not be known a priori
+ high level of detail, as every agent possesses a limited
amount of proprietary methods
- High computational effort
- Exogenous parameters cannot be stated
Static
Dynamic
Behaviour
Rules
Decision
Perception
Attributes Methods
Information
Activities
Environment Agent
Micro-modelling: agent based modelling(ABM)
System environment (example)
Total production of
xEV-components +
Learning effects Economies of scale
-
+ +
3 1 2 4

© ika 2016 · All rights reserved 2016/10/19 Slide No. 8 #150 · 16nm0042.pptx
Agenda
1. Motivation
2. Methodological Approach
3. Exemplary Results
4. Summary
© ika 2016 · All rights reserved 2016/10/19 Slide No. 9 #150 · 16nm0042.pptx
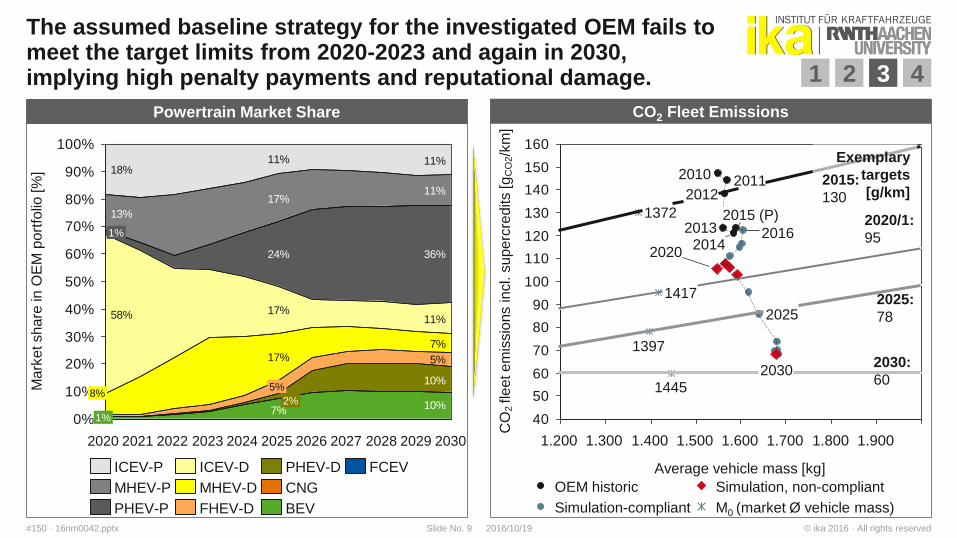
The assumed baseline strategy for the investigated OEM fails to meet the target limits from 2020-2023 and again in 2030, implying high penalty payments and reputational damage.
24%
11%
10%7%
10%
5%
7%
17%
11%17%58%
36%
11%17%
13%
11%18%
0%
10%
20%
30%
40%
50%
60%
70%
80%
90%
100%
Ma
rke
t sh
are
in
OE
M p
ort
folio
[%
]
2030 2029 2028 2027 2026 2025
2%
5%
2024 2023 2022 2021 2020
1%
8%
1%
FCEV
BEV
CNG
PHEV-D
FHEV-D
MHEV-D
ICEV-D
PHEV-P
MHEV-P
ICEV-P
40
50
60
70
80
90
100
110
120
130
140
150
160
1.900 1.800 1.700 1.600 1.500 1.400 1.300 1.200
2020
2016
2015 (P)
2014 2013
2012 2011 2010
CO
2 fle
et e
mis
sio
ns in
cl. s
upe
rcre
dits [g
CO
2/k
m]
Average vehicle mass [kg]
1445
1397
1417
1372
2030
2025
2020/1:
95
2025:
78
2030:
60
Simulation, non-compliant
Simulation-compliant M0 (market Ø vehicle mass)
OEM historic
3 1 2 4
Exemplary
targets
[g/km] 2015:
130
Powertrain Market Share CO2 Fleet Emissions

© ika 2016 · All rights reserved 2016/10/19 Slide No. 10 #150 · 16nm0042.pptx
Powertrain Market Share
PHEV-focused strategy leads to full target compliance even with significantly decreasing diesel shares. The fleet emissions curve has a safety reserve in 2025 and 2030.
8%
14%
16%
41%
11%
16%
65%
44%
22%
9% 8%
7%
0%
10%
20%
30%
40%
50%
60%
70%
80%
90%
100%
3%
2030
2%
1%
2029 2028 2027 2026 2025
3%
1%
2024
Ma
rke
t sh
are
in
OE
M p
ort
folio
[%
]
2023 2022 2021 2020
1%
10%
3%
13%
FCEV
BEV
PHEV-D
MHEV-D
ICEV-D
PHEV-P
MHEV-P
ICEV-P
CO2 Fleet Emissions
40
50
60
70
80
90
100
110
120
130
140
150
160
1.900 1.800 1.700 1.600 1.500 1.400 1.300 1.200
CO
2 fle
et e
mis
sio
ns in
cl. s
upe
rcre
dits [g
CO
2/k
m]
Average vehicle mass [kg]
2030
2025
2020
2016
2015 (P)
2014 2013
2012 2011 2010
1445
1397
1417
1372 2020/1:
95
2025:
78
2030:
60
OEM historic M0 (market Ø vehicle mass)
Simulation-compliant
Exemplary
targets
[g/km] 2015:
130
3 1 2 4

© ika 2016 · All rights reserved 2016/10/19 Slide No. 11 #150 · 16nm0042.pptx
2016 2018 2020 2022 2024 2026 2028 2030
0.0
10.5
11.0
9.5
11.5
12.0
9.0
12.5
8.5
0.5
10.0
Pro
fit M
arg
in [%
]
Profit Margin
Penalty payments are completely avoided while sales and turnover are even slightly increased with significantly improved profit margins compared to baseline strategy.
-3-1-3-1-2-10
1
-2
0102
0
24
-4
-2
02
21
31
4110
-7
90
30
20
120
110
100
0
10
-10
-20 2028 2016
-7
2026
-2
2018 2024
14
2020 2022
+11%
2030
No
rma
lise
d V
alu
e [
%]
6
∆ net profit (rel. to baseline)
Net profit (base: 2016)
Penalties [% of op. profit]
Op. profit (base: 2016)
∆ sales (rel. to baseline)
Vehicle sales (base: 2016)
Profit margin (baseline)
Profit margin (actual) Increase of margin
Loss of margin
3 1 2 4
Sales and Profit

© ika 2016 · All rights reserved 2016/10/19 Slide No. 12 #150 · 16nm0042.pptx
Agenda
1. Motivation
2. Methodological Approach
3. Exemplary Results
4. Summary
© ika 2016 · All rights reserved 2016/10/19 Slide No. 13 #150 · 16nm0042.pptx
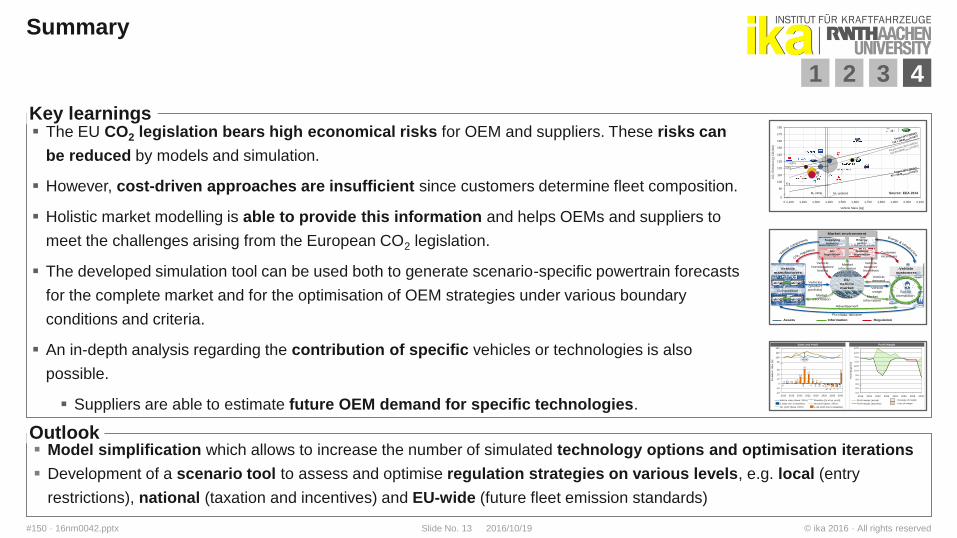
Summary
3 1 2 4
Model simplification which allows to increase the number of simulated technology options and optimisation iterations
Development of a scenario tool to assess and optimise regulation strategies on various levels, e.g. local (entry
restrictions), national (taxation and incentives) and EU-wide (future fleet emission standards)
Key learnings
Outlook
The EU CO2 legislation bears high economical risks for OEM and suppliers. These risks can
be reduced by models and simulation.
However, cost-driven approaches are insufficient since customers determine fleet composition.
Holistic market modelling is able to provide this information and helps OEMs and suppliers to
meet the challenges arising from the European CO2 legislation.
The developed simulation tool can be used both to generate scenario-specific powertrain forecasts
for the complete market and for the optimisation of OEM strategies under various boundary
conditions and criteria.
An in-depth analysis regarding the contribution of specific vehicles or technologies is also
possible.
Suppliers are able to estimate future OEM demand for specific technologies.
120
110
180
170
1,9001,8001,7000 1,600
160
150
140
1,3001,2001,100 1,5001,400 2,1002,000
100
90
0
130
M0 updated
CO
2E
mis
sio
n [
g C
O2/k
m]
M0 initial
Vehicle Mass [kg]
Source: EEA 2014
95 g
123 g
130 g
Market environment
EU
vehicle
market
Vehicle
manufacturers
Vehicle
customers
Competition Social
interaction
National
legislation
EU
legislation
Energy
sector
Supplying
industry
Vehicle
homologation/
testing
Vehicle
taxation/
incentives
Customer
incentives
Market
information
Market
informationMarket
information
Vehicle
demand
Assets Information Regulation
Vehicles
(product
portfolio)Vehicle
usage
2016 2018 2020 2022 2024 2026 2028 2030
0.0
10.5
11.0
9.5
11.5
12.0
9.0
12.5
8.5
0.5
10.0
Pro
fit
Ma
rgin
[%
]
Profit Margin
-3-1-3-1-2-10
1
-2
0102
0
24
-4
-2
02
21
31
4110
-7
90
30
20
120
110
100
0
10
-10
-20
20282016
-7
2026
-2
2018 2024
14
2020 2022
+11%
2030
No
rma
lise
d V
alu
e [
%]
6
∆ net profit (rel. to baseline)
Net profit (base: 2016)
Penalties [% of op. profit]
Op. profit (base: 2016)
∆ sales (rel. to baseline)
Vehicle sales (base: 2016)
Profit margin (baseline)
Profit margin (actual) Increase of margin
Loss of margin
Sales and Profit
© ika 2016 · All rights reserved 2016/10/19 Slide No. 14 #150 · 16nm0042.pptx
Phone
Fax
Internet www.ika.rwth-aachen.de
Institute for Automotive Engineering (ika)
RWTH Aachen University
Steinbachstr. 7
52074 Aachen
Germany
Contact
Dipl.-Wirt.-Ing. Nils Robert Neumann
Strategy & Consulting
+49 241 80 25686
+49 241 80 22147