Embed Size (px)
Citation preview

1 Company Presentation – December 2013
Company Presentation
SRI Roadshow
London - December 9th, 2013

2 Company Presentation – December 2013
AGENDA
Group Overview & 2013 Outlook
Corporate Social Responsibility
Draka integration
Financial Results
Appendix

3 Company Presentation – December 2013
Prysmian Group at a glance 9M 2013 Results
Sales breakdown by geography Sales breakdown by business
Adj. EBITDA by business Adj. EBITDA margin by business
11.7%
4.1%
7.2%
9.7%
8.1%
Utilities T&I Industrial Telecom Total
N. America 14%
EMEA 63%
Latin America
9%
APAC 14%
€ 5.5 bn
T&I 14%
Utilities 43%
Industrial 22%
€ 444 mln
Telecom 20%
T&I 27%
Utilities 30%
Industrial 24%
Other 2%
€ 5.5 bn
Telecom 17%
Other 1%

4 Company Presentation – December 2013
Long Cycle Businesses Vs. Short Cycle Businesses Adj. EBITDA breakdown
LTM 9M’13 ADJ. EBITDA
€ 623 mln
Industrial (Specialties & OEM, Automotive, Other)
13%
T&I 12%
Utilities (Power
Distribution)
8%
Telecom (Copper)
1%
Long Cycle
Short Cycle
Industrial (OGP & SURF,
Renewables, Elevator)
9%
Utilities (Submarine, HV,
Net. Components)
37%
Telecom (Optical and Fiber, JVs, Multimedia & Specials)
20% 0
100
200
300
400
500
2007 2008 2009 2010 2011 2012 LTM9M'13
PD T&I Industrial*
€ mln
* Industrial includes Specialties & OEM, Automotive and Other segments
~(€ 250mln)
• Profitability: stable at bottom level (excl. synergies contribution)
• Over 50% profitability decrease from the peak
Short Cycle Businesses 34%
Long Cycle Businesses 66%
Short Cycle Businesses Adj. EBITDA (Combined Prysmian + Draka)

5 Company Presentation – December 2013
7,973 7,848
5,930 5,488
2011 2012 9M'12 9M'13
9M 2013 Key Financials Euro Millions, % on Sales
(1) Includes Draka Group’s results for the period 1 January – 31 December; (2) Includes Draka Group’s results for the period 1 March – 31 December (3) Adjusted excluding non-recurring income/expenses; (4) Adjusted excluding non-recurring income/(expenses) and the fair value change in metal derivatives and in other fair value items; (5) Adjusted excluding non-recurring income/(expenses), the fair value change in metal derivatives and in other fair value items, exchange rate differences and the related tax effects; (6) Operative NWC defined as NWC excluding the effect of derivatives; % of sales is defined as Operative NWC on annualized last quarter sales; (7) Restated to include effects of IAS 19 rev.(negative effect of €2mln in FY’12, € 1mln in 9M’12)
* Org. Growth 7.3% 8.2% 7.9% 8.1% 5.5% 6.2% 5.9% 6.0%
586 647
468 444
2011 2012 9M'12 9M'13
435 483
349 329
2011 2012 9M'12 9M'13
7.3% 6.3% 12.7% 11.6%
579 486
1,021
868
2011 2012 9M'12 9M'13
1,064 918
1,446
1,246
2011 2012 9M'12 9M'13
3.0% 3.6% 3.3% 3.3%
231
280
193 180
2011 2012 9M'12 9M'13
Sales Adjusted EBITDA (3) Adjusted EBIT (4)
Operative Net Working Capital (6) Net Financial Position Adjusted Net Income (5)
-1.8%*
-3.9%*
(1) (1) (1)
(2) (7) (7)

6 Company Presentation – December 2013
Organic Growth and adj. EBITDA evolution Sales stabilizing at bottom level in Europe. Profitability sustained by synergies and Transmission
Euro million
Adj. EBITDA evolution
% change on previous year period
Organic Growth evolution
0.7%
-3.4%
-8.5%
1.8%
0.6%
7.8%
-16.2%
-11.4%
-5.3%
-1.1%
H1'1
3
Q3'1
3
H1'1
3
Q3'1
3
H1'1
3
Q3'1
3
H1'1
3
Q3'1
3
H1'1
3
Q3'1
3
Utilities T&I Industrial Telecom Total 2012 2013
130
178
160
468
115
167 162
444
Q1 Q2 Q3 9M∆ Q1 ∆ Q2 ∆ Q3 ∆ 9M
Utilities +3 +1 +3 +7
T&I (4) (1) +4 (1)
Industrial (4) (3) +3 (4)
Tot.Energy* (4) - +9 +5
Telecom (11) (11) (7) (29)
Total (15) (11) +2 (24) * Total Energy include Other Energy business: ∆Q1 +€1m, ∆Q2 +€3m, ∆Q3 -€1m, ∆9M +€3m

7 Company Presentation – December 2013
Utilities Euro Millions, % on Sales
* Organic Growth Note: FY2011 combined including Draka for 12 months
Sales to Third Parties
Note: FY2011 combined including Draka for 12 months
Adjusted EBITDA
2,318 2,287
1,678 1,650
2011 2012 9M'12 9M'13
264 270
185 192
2011 2012 9M'12 9M'13
11.4% 11.8% 11.0% 11.7%
Highlights
+1.1%*
-0.8%*
TRANSMISSION – Submarine
• Strong increase in profitability in 9M expected to continue in next quarters
• Growing tendering activity mainly driven by Europe; still limited demand in US and Asia
• First positive contribution from Global Marine acquisition. New Cable Enterprise vessel to be refurbish in 2014 to achieve Prysmian standards
• Production capacity increase in Arco Felice (Italy) to be completed by Q1’14
TRANSMISSION – HV
• Stable profitability in 9M’13 (Vs 9M’12) with higher contribution expected in Q4
• Stable order book with approx. 12 months sales visibility
• Increasing leadership in high margin projects and growing contribution from land portion submarine projects
• Increasing activity in Asean (e.g. Indonesia, Singapore, Australia) through Chinese production capacity
DISTRIBUTION
• As expected no signs of recovery in H2’13. Further deterioration in demand due to lower power consumption and weak European construction. Limited margin decrease thanks to on-going cost rationalization
• Europe: further decrease in central/south Europe (particularly in Italy); stable eastern Europe; signs of recovery in UK/Nordics
• North America: continuous positive volume trend sustaining profitability improvement
• South America: selective volume strategy to preserve profitability. Utilities reviewing capex plan
• APAC: lower sales due to weak Australian market. Expanding business in other Asean regions
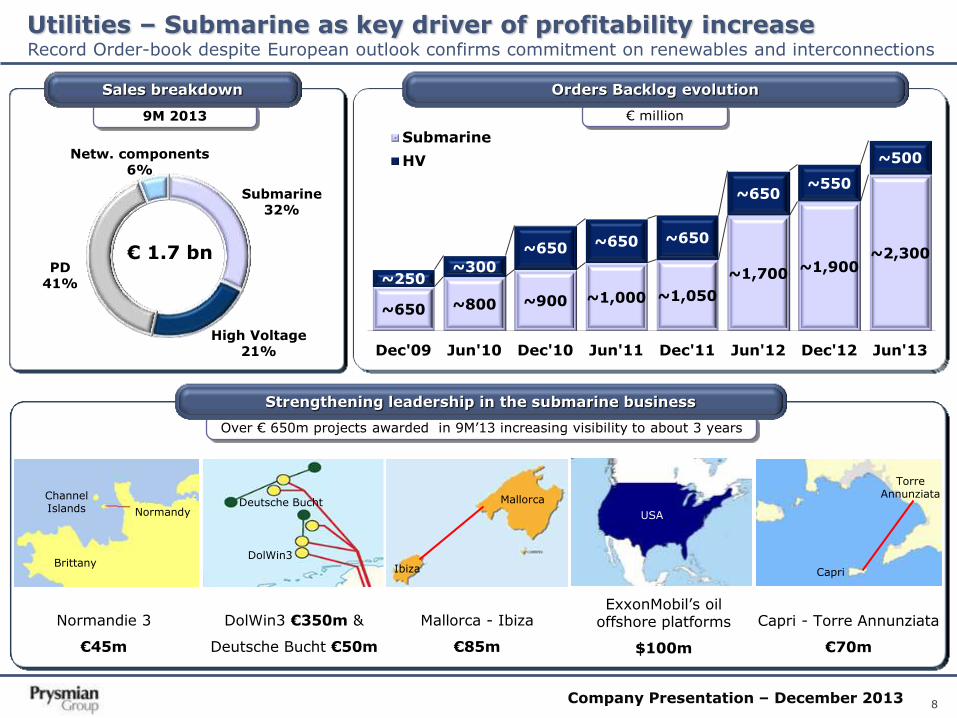
8 Company Presentation – December 2013
Utilities – Submarine as key driver of profitability increase
Submarine 32%
High Voltage 21%
PD 41%
Netw. components 6%
€ 1.7 bn
9M 2013
Sales breakdown
Record Order-book despite European outlook confirms commitment on renewables and interconnections
~650 ~800 ~900 ~1,000 ~1,050
~1,700 ~1,900 ~2,300
~250 ~300
~650 ~650 ~650
~650 ~550
~500
Dec'09 Jun'10 Dec'10 Jun'11 Dec'11 Jun'12 Dec'12 Jun'13
Submarine
HV
€ million
Orders Backlog evolution
Normandie 3
€45m
DolWin3 €350m &
Deutsche Bucht €50m
Mallorca - Ibiza
€85m
ExxonMobil’s oil offshore platforms
$100m
Over € 650m projects awarded in 9M’13 increasing visibility to about 3 years
Strengthening leadership in the submarine business
Mallorca
Ibiza
USA Deutsche Bucht
DolWin3 Brittany
Channel Islands Normandy
Capri - Torre Annunziata
€70m
Capri
Torre Annunziata

9 Company Presentation – December 2013
Utilities – Transmission
0
50
100
150
200
250
FY 2011 FY 2012 FY 2013E
High Voltage Submarine
Euro million
Adj. EBITDA evolution
~ 10% Adj.EBITDA margin
~ 20% Adj.EBITDA margin 0.7
2.2
Sales
Orders backlog
0.5 0.5
Sales
Orders backlog
LTM 9M’13 Sept ‘13
LTM 9M’13 Sept ‘13
Euro billion
Sales and Orders Backlog
Su
bm
arin
e
Hig
h V
olt
ag
e
Best-in-class technology and reliability as key asset to enhance leadership in high margin projects
• Submarine: steady growth in profitability driven by sales
organic growth and margin stability
• High Voltage: stable profitability in a challenging
environment thanks to better projects mix and industrial
efficiencies
• Over 3y sales visibility
• Sound order intake expected
in the next 12/18 months
• Stable margins in the
current orders backlog
• In medium term higher
margins expected in
installation activities thanks
to Global Marine acquisition
• Keeping high sales visibility
• Focus on high technology
projects (over 220kV) to
sustain margins
• Growing production capacity
in low cost countries (Russia
and China)

10 Company Presentation – December 2013
Trade & Installers Euro Millions, % on Sales
Highlights
* Organic Growth Note: FY2011 combined including Draka for 12 months
Sales to Third Parties
Note: FY2011 combined including Draka for 12 months
Adjusted EBITDA
2,233 2,159
1,653 1,471
2011 2012 9M'12 9M'13
73 77
62 61
2011 2012 9M'12 9M'13
3.3% 3.6% 3.7% 4.1%
-2.6%*
-5.1%*
-12%
-8%
-4%
0%
4%
Q1'12 Q2'12 Q3'12 Q4'12 Q1'13 Q2'13 Q3'13
% change on previous year period
Organic Growth
• Q3 organic growth and profitability substantially in line with previous year
level. Demand and pricing stabilizing at H2’12 level. Slight improvement in
profitability thanks to cost reduction
• Europe: no signs of volume improvement across all major markets
except Turkey. Price recovery from current bottom level as key driver
for profitability increase
• North America: growing contribution in profitability thanks to positive
construction demand in Canada and renewed wind incentives in US
• South America: strengthening leadership position in the key Brazilian
market and significant increase in profitability
• APAC: negative organic growth due to lower construction activity and
higher import competition in Australia
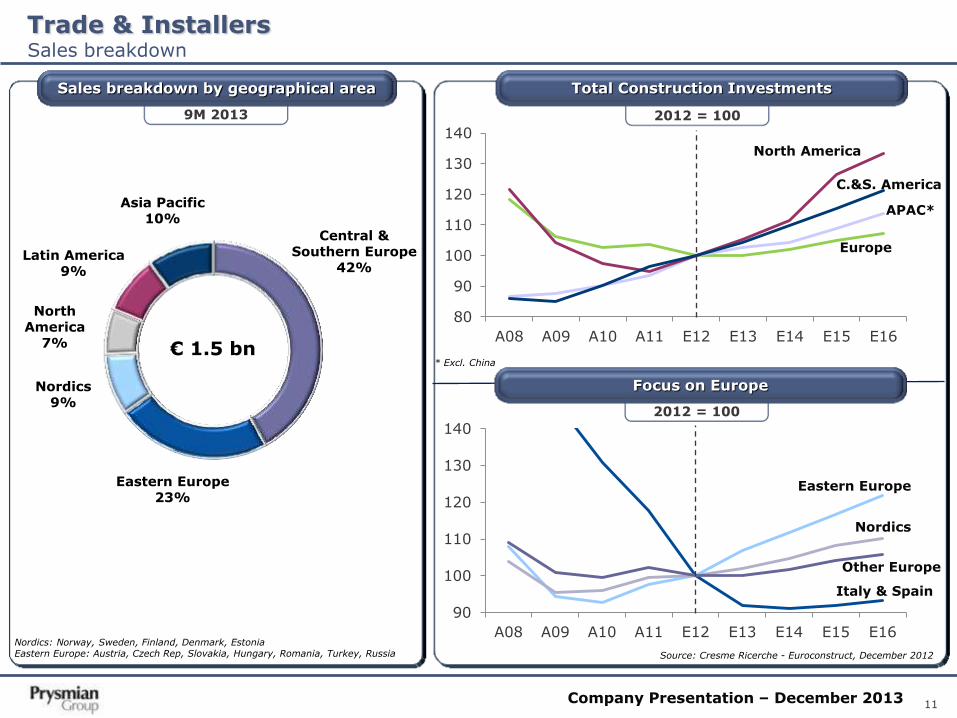
11 Company Presentation – December 2013
Trade & Installers
Sales breakdown by geographical area Total Construction Investments
Focus on Europe
Source: Cresme Ricerche - Euroconstruct, December 2012
2012 = 100
2012 = 100
* Excl. China
9M 2013
Nordics: Norway, Sweden, Finland, Denmark, Estonia Eastern Europe: Austria, Czech Rep, Slovakia, Hungary, Romania, Turkey, Russia
80
90
100
110
120
130
140
A08 A09 A10 A11 E12 E13 E14 E15 E16
APAC*
C.&S. America
Europe
North America
90
100
110
120
130
140
A08 A09 A10 A11 E12 E13 E14 E15 E16
Eastern Europe
Nordics
Other Europe
Italy & Spain
Sales breakdown
€ 1.5 bn
Central & Southern Europe
42%
Eastern Europe 23%
Nordics 9%
North America
7%
Latin America 9%
Asia Pacific 10%

12 Company Presentation – December 2013
Industrial Euro Millions, % on Sales
Highlights
* Organic Growth Note: FY2011 combined including Draka for 12 months
Sales to Third Parties
Note: FY2011 combined including Draka for 12 months
Adjusted EBITDA
1,824 1,801
1,371 1,340
2011 2012 9M'12 9M'13
116 139
101 97
2011 2012 9M'12 9M'13
6.4% 7.7% 7.3% 7.2%
-1.5%*
+3.0%*
OGP
• Positive trend in offshore expected to continue next quarters thanks to North
Sea, Asean and South America. Declining demand in onshore limiting
Oil&gas profitability improvement in 2013
SURF
• Strong Q3 in Umbilicals thanks to new commercial initiatives out of Brazil;
first deliveries in Indonesia and Angola. Flexible pipes development limited
by Petrobras focus on pre-salt explorations
• DHT: sound increase driven by successful business development in Europe
and Apac. Ongoing capacity increase in North America
Elevator
• Positive organic growth mainly supported by China. Higher volumes also in
the domestic US market and Europe
Renewable
• Still very weak demand in China and North America. Gradual improvement in
H2’13 Vs bottom level achieved in H1 thanks to Europe and S.America
Automotive
• Continuous increase driven by North and South America
Specialties & OEM
• Keeping a positive trend in a tough economic environment thanks to new
commercial initiatives mainly in Railway/Rolling Stock (Europe, North and
South America); Crane (Apac) and Marine (Russia)

13 Company Presentation – December 2013
Industrial Sales breakdown
€ 1.3 bn € 1.3 bn
Specialties & OEM 34%
Renewables 8%
Automotive 23%
OGP & SURF 23%
Elevator 8%
Other 4% Asia Pacific
18%
North America 26%
Latin America 10%
EMEA 46%
9M 2013
Sales breakdown by geographical area
9M 2013
Sales breakdown by business segment

14 Company Presentation – December 2013
SURF – First steps to build up a global business South America remains a key priority. Large off-shore explorations in West Africa and Apac
Source: Baker Hughes New frame agreement with Petrobras
• New frame agreement signed with Petrobras in Oct’13:
• Umbilicals: 360km worth approx. $260m (50%
minimum purchasing commitment, orders to be
received within 2 years for deliveries within 3/4 y)
• Flexible: extension to 2016 of the existing frame
agreement worth $95m (no minimum purchasing
commitment)
International business development
• First umbilicals orders delivered in 2012-13:
• Egypt: hydraulic umbilical & accessories (Saipem)
• Nigeria: electro-optical umbilical (Shell)
• Indonesia: electro-hydraulic umbilical & accessories
(ConocoPhillips)
• Angola: dynamic optical umbilical (Total)
Proven reserves
Unproven reserves
Deep
Water
80%
Shallow
Water
10%
Onshore
10%
Source: IHS, 2013
2012 Global oil & gas new discovery volumes by terrain
Proven reserves are those reserves claimed to have a reasonable certainty (normally at least 90% confidence) of being recoverable under existing economic and political conditions, with existing technology Unproven reserves are based on geological and/or engineering data similar to that used in estimates of proven reserves, but technical, contractual, or regulatory uncertainties preclude such reserves being classified as proven
Umbilical projects out of Brazil

15 Company Presentation – December 2013
Telecom Euro Millions, % on Sales
Highlights
* Organic Growth Note: FY2011 combined including Draka for 12 months
Sales to Third Parties
Note: FY2011 combined including Draka for 12 months
Adjusted EBITDA
1,431 1,466
1,129
945
2011 2012 9M'12 9M'13
128 160
120
91
2011 2012 9M'12 9M'13
8.8% 10.9% 10.6% 9.7%
-3.5%*
-14.6%*
• Double digit sales decrease due to strong volume downturn in North and
South America for optical and continuous decrease in Europe for MMS and
Copper. Profitability strongly penalized by lower volumes despite cost
rationalization during 2012
Optical / Fiber
• Europe: increasing exposure to Eastern Europe and Russia to benefit from high growing demand. Still low volumes in the rest of Europe; France and Spain expected to increase investments in next quarters
• North America: 50% lower demand in H1 expected to gradually recover pre-stimulus level in the next quarters (excluding incentives renewal)
• South America: large number of projects submitted for stimulus packages approval in Brazil expected to drive demand recovery during 2014
• APAC: China and Australia maintaining high growth rate. Developing presence in other fast growing Asean countries (e.g. Singapore, Malaysia, Indonesia)
Multimedia & Specials
• Decreasing demand in data centers in Europe (e.g. France, UK, Germany). Successful commercial initiatives in South America and APAC (Indonesia, China and Singapore) expected to support profitability in next quarters
Copper
• Lower profitability due to volume reduction in Europe and South America

16 Company Presentation – December 2013
Telecom Sales breakdown
€ 0.9 bn € 0.9 bn
Asia Pacific 30%
North America 11%
Latin America 13%
EMEA 46%
9M 2013
Sales breakdown by geographical area
9M 2013
Sales breakdown by business segment
Optical, Connectivity
and Fiber 46%
JVs and other 24%
Copper 12%
Multimedia & Specials
18%

17 Company Presentation – December 2013
Telecom – Tough 2013 due to demand contraction in Optical N.&S. America and Copper/Multimedia in Europe
Euro million
Adj. EBITDA evolution
35
24
(10)
44
33
(1)
(15)
+4
41
34
(5)
(2)
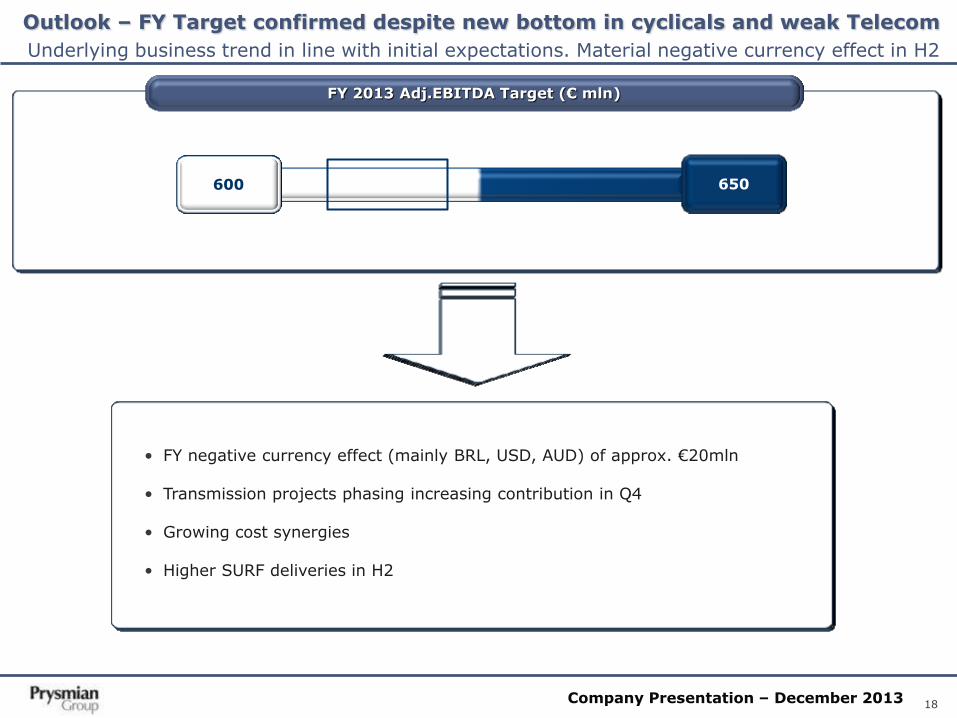
18 Company Presentation – December 2013
Outlook – FY Target confirmed despite new bottom in cyclicals and weak Telecom
Underlying business trend in line with initial expectations. Material negative currency effect in H2
FY 2013 Adj.EBITDA Target (€ mln)
600 650
• FY negative currency effect (mainly BRL, USD, AUD) of approx. €20mln
• Transmission projects phasing increasing contribution in Q4
• Growing cost synergies
• Higher SURF deliveries in H2

19 Company Presentation – December 2013
AGENDA
Group Overview & 2013 Outlook
Corporate Social Responsibility
Draka integration
Financial Results
Appendix

20 Company Presentation – December 2013
Corporate Social Responsibility Sustainable development based on three dimensions: Economic, Environmental, Social
Economic Responsibility
- Reliability, accuracy and transparency of information. Focus on shareholders’ return
- Corporate Governance (competences and independency of BoD and internal committees; gender balance; transparency of remuneration policy)
- Risk Management (ERM process)
- Code of Ethics, Compliance, Corruption & Bribery, Whistleblowing
- Customer Satisfaction
- Emerging markets strategy
- Innovation and R&D activities (17 R&D centers, over 500 qualified professionals)
Environmental Responsibility
- Wider range of reporting indicators thanks to a unique HSE reporting system
- 2012 Sust. Report achieved C+ level based on GRI/G3.1
- 82% sites certified ISO14001; 42% sites certified OHSAS 18001
- Continuous improvement in energy consumptions, waste generation, water consumptions
- First participation to CDP assessment, awarded as “The Best Newcomer” in the Italy 100 sample
- LCA approach used for P-Laser cable (-30% CO2 equivalent, -40% consumptions of fossil resources, -
70% water utilization Vs. traditional XLPE cable used for the same purpose)
Social Responsibility
- Increased number of social indicators reported in the SR (unique HR Evolution reporting system from mid-12)
- Performance management system launched at the end of 2012: coverage of approx. 50% of white collars in 2013, up to 100% in 2014E
- New Training programs for managers and employees: Prysmian Group Academy launched in 2012 (in partnership with SDA Bocconi), 150 participants in 2012, 500 in 2013 , approx. 700 in 2014E
- Talent attraction: Graduate Program (international program for recruitment and induction of new graduates) launched in 2012: 50 graduates hired in 2012-13, 50 in 2014E
- Retention plans: LTI plan launched in 2011 for approx. 300 managers
- Launch of the Employee Share Ownership Plan in H2 2013
- Launch of several initiatives to support local communities (e.g. donation of power cables to local social entities, Milan Niguarda Hospital; donations and other initiatives to assist local community in Vila Velha Brazil)

21 Company Presentation – December 2013
GS final placement (March 2010)
IPO May 2007
Golman Sachs buys 100% (July 2005)
100% 54% 100%
46%
Free Float
Free Float
1 2 3
The evolution to Public Company From Pirelli to Goldman Sachs (2005), IPO (2007) and Public Company (2010)
Shareholders’ Structure by main investors Institutional Investors by geography
76.9%
Clubtre Srl 6.2%
Schroder Inv. 2.0%
FMR LLC 3.1%
JPM Chase & Co 2.2%
Norges Bank 3.3%
Source: CONSOB (31 December 2012)
Oppenheimer Funds 2.0%
State Street Global Adv. 2.1%
Franklin Templeton Inst. 2.2% 26%
25%14%
8%
5%
4%
4%3%
7%US
UK
Italy
France
Norway
Ireland
Netherlands
Source: Thomson Reuters (31 December 2012)
Germany
Rest of Europe
Hong Kong 2% Rest of World 2%

22 Company Presentation – December 2013
INDEPENDENT AUDITOR
PricewaterhouseCoopers SpA
BOARD OF DIRECTORS
CHAIRMAN M. Tononi
DIRECTORS EXECUTIVES INDEPENDENTS
V. Battista, CEO and GM M.E. Cappello
P. F. Facchini, CFO C. d’Amico
F. I. Romeo, V.P.Energy C. De Conto
F. Dorjee, CSO G. Del Ninno
F. Fröhlich
G. Tamburi
SHAREHOLDERS’
MEETING
STATUTORY AUDITORS P. Libroia (C.)
P.F. Lazzati
M.L. Mosconi
MANAGERS IN
CHARGE FOR
PREPARING
CORPORATE
ACCOUNTING
DOCUMENTS
(A. Bott, C. Soprano)
MANAGER IN CHARGE
FOR INTERNAL
CONTROL
(M.Gough)
MONITORING
BOARD ex D.Lgs 231/01
P. F. Lazzati (C.)
M. Milano
M.Gough
REMUNERATION
AND
NOMINATION
COMMITTEE
G. Del Ninno (C.)
C. De Conto
M. Tononi
CONTROL AND
RISKS
COMMITTEE
C. De Conto (C.)
M.E. Cappello
F. Fröhlich
Main goals:
1. Effective strategy and operations’ management
2. Reliability, accuracy and transparency of information
3. Enterprise risk management
4. Remuneration policy
1
1
2 2
2
3
3
3
4
Corporate Governance structure Competences, independency of the BoD and internal committees

23 Company Presentation – December 2013
Share Capital represented at AGMs Number of Shareholders attending at AGMs
0%
10%
20%
30%
40%
50%
60%
2008 2009 2010 2011 J 2011 A 2012 2013
Share Capital represented at AGM
Participation of main shareholder in AGM
Public Company
0
200
400
600
800
1,000
1,200
1,400
2008 2009 2010 2011 J 2011 A 2012 2013
Number of Shareholders attending at AGM
Public Company
Growing Shareholders involvement in Company Governance Attendance at AGMs

24 Company Presentation – December 2013
FIX
ED
REM
UN
ER
ATIO
N ANNUAL PAY
- defined in line with the complexity of the role
- benchmarked vs key European market in order to guarantee competitiveness and
internal fairness.
MBO
- pay is connected to the achievement of the preset annual economic and financial
targets at Group/Business Unit level
- net financial position and EBITDA are the common indicators and the minimum
condition necessary to accrue the bonus
- the pay opportunities linked to the annual incentive system are defined as a % of
annual pay; a maximum payment level is envisaged.
CO-INVESTMENT
the co-investment system was launched in 2011 and is valid for the period 2011-2013:
- the mechanism envisages that part of the accrued annual bonus is deferred for a
maximum period of three years
- the payment of this portion is subordinate to achieving a Group three-year economic
and financial target (Adjusted Cumulative EBITDA 2011-2013)
- should the performance objective be achieved, the payment of a multiple of the co-
invested bonus is envisaged.
Should it not be achieved, the payment of a reduced portion of the deferred bonus is
envisaged.
PERFORMANCE SHARE
- This is a share-based plan with a three-year vesting period which is linked to
achievement of three-year performance conditions: in 2014 directors will receive a
preset number of Prysmian shares if the Adjusted Cumulative EBITDA objective for 2011-
2013 has been achieved.
SH
OR
T A
ND
MED
IUM
/LO
NG
-TER
M R
EM
UN
ER
ATIO
N
Prysmian Group's remuneration policies Remuneration of executive Directors and Managers with strategic responsibilities: elements of pay

25 Company Presentation – December 2013
Prysmian Group's remuneration policies Pay mix

26 Company Presentation – December 2013
EMPLOYEES (98% of population)
25% discount on market share price
All e
mp
loyees a
nd
man
ag
ers w
ill
ben
efi
t fr
om
dis
co
un
t
MANAGERS (2% of population) 15% discount on market share price
SENIOR TOP EXECUTIVES 1% discount on market share price
MAIN FEATURES
The annual maximum discount that each employee could benefit from is capped
Overall discount cap of 500,000 treasury shares that
Prysmian will use to pay for the discount made on share price
Three periods of purchase: 2014, 2015 and 2016
Lock-up clause: 36 months from date of purchase MAIN GOALS
Improve employees’ loyalty, engagement, business awareness
strengthening sense of belonging to the Group
Align interests of stakeholders (the Group, employees and shareholders) by identifying a common goal of creating long-term value
Contribute to the integration process
YES – Your Employee Shares plan The programme for employees to become shareholders launched in H2 2013

27 Company Presentation – December 2013
ERM system An integral part of the system of internal control and risk management
HEAT MAP
RISK SCORING SCALES
• Top Risks related to 4 macro-categories (strategic, operational, legal & compliance, financial) analyzed in details, over
30 key managers involved in the assessment phase
• For the selected Top Risks, the following information has been gathered and analyzed:
» Likelihood of risk event occurrence over the 3Y Plan (2013-15)
» Economic impacts on the 3Y Plan EBITDA / Cash Flow (2013-
2015 unless otherwise disclosed) net of any existing
insurance/hedging coverage
» Any additional qualitative considerations on reputational and
operational effects on the Group, where financial calculation was
difficult
» Assumptions forming the basis of the above estimates
» Risk Management Capabilities in place in terms of existing
insurance coverage or hedging instruments, specific procedures
/ control activities, specific organizational or governance
protections, etc.
» Final risk ranking resulting from combination of Likelihood,
Impact and RM Capabilities
• Detailed Risk Mitigation Strategies and Action Plan
RM CAPABILITIES
IMPACT
LIKELIHOOD

28 Company Presentation – December 2013
R&D activities Carrying out ideas for leading R&D and Quality activities
• 17 R&D centres
• Over 500 professionals
• € 69 million R&D expenses in 2012
• 5,644 patents at Dec 2012
• More than 3,000 trademarks at Dec 2012
• -35% customer claims in 2009-2012
R&D headquarters
R&D headquarters
R&D centers

29 Company Presentation – December 2013
Personnel and HR KPIs
0%
1%
2%
3%
4%
5%
6%
7%
2010 2011 2012
Voluntary Turnover
(*) December 2011 including acquisition of Draka. (#) December 2012 including acquisition of GME Restatements 2011 and 2012: 1) Methodological note - the figures include 100% of the workforce of: • Companies in which Prysmian Group has a majority interest; • Companies managed by Prysmian Group but in which it does not have a majority interest. 2) YOFC (China): based on the rationale in point 1, this company is no longer included in the headcount figures.
Voluntary Turnover
Employment Employees breakdowns
31%
69%
Women
Men
Managers/White-collar staff
95%
Permanent
Fixed-term
Total population
Temporary
Due to the gradual implementation of the new HR Evolution reporting system as from mid-12, the coverage at December 2012 was approx. 70% of total Group employees

30 Company Presentation – December 2013
Corporate Social Responsibility
0
10
20
30
40
50
60
0%
2%
4%
6%
8%
10%
12%
14%
16%
2010 2011 2012
% of share capital owned by SRIon Total Institutional (L axis)
N° of SRI Investors (R axis)
Source: Thomson Reuters
SRI investors in Prysmian
Dow Jones Sustainability Assessment – Electrical Components & Equipment
0
10
20
30
40
50
60
70
80
2012 Assessment 2013 Assessment
Prysmian score
Sector Average score*
Lowest Score in the DJ World
index*
* Electrical Components & Equipment sector
Developing a CSR strategy to increase involvement of Social Responsible Investors

31 Company Presentation – December 2013
3.23 3.09
2.0
2.4
2.8
3.2
3.6
2011 2012
Energy consumed per tonne of product
Power Cables – GJ/T
Energy Consumptions
0.0246
0.0237
0.01
0.02
0.03
2011 2012
Energy consumed per km of product
Optical Fiber – GJ/km
Energy Consumptions
% on total drums
Wooden Drums re-used
3.78 3.60
2.0
2.4
2.8
3.2
3.6
4.0
2011 2012
Hazardous waste disposed per tonne ofproduct
Power Cables – kg/T
Hazardous Waste
6.09
5.25
3.0
4.0
5.0
6.0
7.0
2011 2012
Water consumption per tonne of product
Power Cables – m3/T
Water
51.4
45.6
20
30
40
50
60
2011 2012
Non-Hazardous waste disposed per tonneof product
Power Cables – kg/T
Non-Hazardous Waste
23%
25%
15%
20%
25%
30%
2011 2012
% of wooden drums reused
Main Environmental KPIs Improving trend from Draka acquisition

32 Company Presentation – December 2013
AGENDA
Group Overview & 2013 Outlook
Corporate Social Responsibility
Draka integration
Financial Results
Appendix

33 Company Presentation – December 2013
The new organization model To strengthen leadership in all business segments leveraging on a global platform
Country X
Country Y
Country Z
...
New organization: a matrix linking country and group functions
Group Functions
Global Local Intermediate
Bu
sin
ess
T&
I /
PD
HV
Netw
ork
co
mp
on
en
ts
Sp
ecia
ltie
s
& O
EM
Ren
ew
ab
le
Oil &
Gas
Tele
co
m
(O
pti
cal+
Co
pp
er)
Su
bm
arin
e
SU
RF
Au
tom
oti
ve
Ele
vato
r
Op
tical Fib
er
Mu
ltim
ed
ia &
S
pecia
ls
Utilities
T&I
Industrial
Telecom

34 Company Presentation – December 2013
Integration process update In 2011-12 executed over 50% of actions planned in the full integration process
Q2 2011 H2 2011
• New Group Organization and Key People Appointment
• Base Business Protection
• Corporate Brand
• Mission & Vision
• Kick-off of main integration workstreams
Design
• Start deployment of new organization and processes
• Synergies plan completed, start delivering first costs reduction in:
o Procurement
o Overheads rationalization
done
done
done
done
done
done
done
done
FY 2012
• Consolidate “One-company” identity with common targets:
o Key management aligned with shareholders’ value through the 2011-13 incentive plan
• Synergies Plan:
o Fixed costs reduction as major contributor to FY’12 Target. Approx. 8% management and staff rationalization completed by Q1’2012
o Finalizing detailed review of suppliers agreements during the year
o First production facilities rationalization from H2’12. Closing down 6 plants by Q1’13
FY 2013
done
done
done
done
Execution
• Actions completed to achieve the €100m cumulated synergies target by 2013
• Enhance Public company model: all Group employees (including blue/white collar) involved in a new Employee Stock Purchasing and Ownership Plan
• Synergies Plan:
o Additional 4% management and staff rationalization completed by Q1’13 (cumulated 12%)
o Procurement synergies run-rate from 2013 (suppliers agreements review completed)
o Cost reduction from operations as major contributor to FY’13 Target. 7 plants closed since the acquisition to Dec ’12. Additional plants rationalization to be executed in 2013-14; total number depending on demand evolution

35 Company Presentation – December 2013
First step of production footprint optimization completed 7 plants closed and 1 plant restructured since Draka acquisition
Hickory (US) Semi-finished products/wires Derby (UK)
T&I cables
Wuppertal (GER) Industrial cables - partial closure Eschweiler (GER)
T&I/Industrial cables Angel (CHI) Industrial/control cables
Livorno Ferraris (ITA) Telecom cables
Sant Vicenç (SPA) Industrial cables
Singapore T&I cables
7 Plants closed since Draka acquisition

36 Company Presentation – December 2013
Synergies target increased – Increasing efforts on production rationalization
New upgrade in synergies plan with additional actions to face the continuous downturn
7 6
FY11
Target
FY11
Achieved
FY13Target
100
10 13
Overheads (Fixed costs) Procurement Operations
5
30
30
FY12
Target
FY12
Achieved
45
65
FY14Target
125-150
Euro million
Update on Synergies Plan 2011-15
FY15 OldTarget
~150
40-60
30-40
60-70
FY15 NewTarget
~175
70-80
30-40
60-70
• Strong decrease in cyclical demand require new actions to limit overcapacity in Europe
• Selective production rationalization to improve ROCE in cyclical segments
• Additional synergies mainly generated in Operations
Note: Cumulated synergies figures are not audited. Calculation is based on internal reporting
46
Restructuring costs
120
200
~250

37 Company Presentation – December 2013
Key commercial initiatives in Industrial and Telecom Leverage on global product portfolio to increase sales and profitability
•Crane
•Mining
•Railway
OEMs
•Drilling
•Refinery
OGP
•Hybrid 4G cables
•Access networks
•OPGW
Telecom
•Rolling stock
•Mining
•Marine
OEMs
•Upstream offshore
OGP
•Optical cables
•Multimedia datacom
Telecom
•Rolling stock
•Mining
•Marine
OEMs
•Downstream Iraq and ME
OGP
•Market penetration
Elevator
•Hybrid 4G cables
•Access networks/ connectivity
•MMS
Telecom
•Crane
•Mining
•Nuclear
OEMs
•Upstream offshore
•LNG (Liquefied Natural Gas)
OGP
•Business expansion
Elevator
•Hybrid 4G cables
•Access networks/ connectivity
•MMS
Telecom
Lati
n A
meric
a
AP
AC
No
rth
Am
eric
a
EM
EA
CAGR ’12-’15 driven by new initiatives: ~ +4%*
Industrial: ~ +€240m sales by 2015
CAGR ’12-’15 driven by new initiatives: ~ +4%*
Telecom: ~ +€190m sales by 2015
* CAGR calculated on FY2012 Sales considering only additional contribution from new initiatives and assuming stable sales for the rest of the business

38 Company Presentation – December 2013
AGENDA
Group Overview & 2013 Outlook
Corporate Social Responsibility
Draka integration
Financial Results
Appendix

39 Company Presentation – December 2013
Sales 5,488 5,930 7,848YoY total growth (7.5%)
YoY organic growth (3.9%)
Adj.EBITDA 444 468 647% on sales 8.1% 7.9% 8.2%
Non recurring items (34) (66) (101)
EBITDA 410 402 546% on sales 7.5% 6.8% 7.0%
Adj.EBIT 329 349 483% on sales 6.0% 5.9% 6.2%
Non recurring items (34) (66) (101)
Special items (30) 12 (20)
EBIT 265 295 362% on sales 4.8% 5.0% 4.6%
Financial charges (106) (86) (120)
EBT 159 209 242% on sales 2.9% 3.5% 3.1%
Taxes (49) (61) (73)
% on EBT 30.7% 29.2% 30.2%
Net income 110 148 169
Extraordinary items (after tax) (70) (45) (111)
Adj.Net income 180 193 280
Profit and Loss Statement Euro Millions
9M 2013 9M 2012 FY 2012
a) Restated to include effects of IAS 19 revised; negative effect of €2mln in FY 2012, €1mln in 9M 2012
a) a)

40 Company Presentation – December 2013
Antitrust investigation 3 (3) (1)
Restructuring (32) (51) (74)
Draka integration costs - (5) (9)
Other (5) (7) (17)
EBITDA adjustments (34) (66) (101)
Special items (30) 12 (20)Gain/(loss) on metal derivatives (12) 30 14
Assets impairment (9) (4) (24)
Other (9) (14) (10)
EBIT adjustments (64) (54) (121)
Gain/(Loss) on ex.rates/derivat.(1) (26) (7) (11)
Other extr. financial Income/exp. (9) (2) (5)
EBT adjustments (99) (63) (137)
Tax 29 18 26
Net Income adjustments (70) (45) (111)
Extraordinary Effects Euro Millions
(1) Includes currency and interest rate derivatives
Notes
9M 2013 9M 2012 FY 2012

41 Company Presentation – December 2013
Net interest expenses (77) (82) (111)
of which non cash Conv.Bond interest exp. (4) - -
Bank fees amortization (6) (7) (10)
Gain/(loss) on exchange rates (12) (25) (29)
Gain/(loss) on derivatives (1) (14) 18 18
Non recurring effects (5) (2) (5)
Net financial charges (114) (98) (137)
Share in net income of associates 8 12 17
Total financial charges (106) (86) (120)
Financial Charges Euro Millions
(1) Includes currency and interest rate derivatives
Notes
a) a)
a) Restated to include effects of IAS 19 revised; negative effect of €2mln in FY 2012, €1mln in 9M 2012
9M 2013 9M 2012 FY 2012

42 Company Presentation – December 2013
Net fixed assets 2,215 2,248 2,311
of which: intangible assets 639 615 655
of which: property, plants & equipment 1,464 1,533 1,543
Net working capital 855 1,033 479
of which: derivatives assets/(liabilities) (13) 12 (7)
of which: Operative Net working capital 868 1,021 486
Provisions & deferred taxes (300) (351) (369)
Net Capital Employed 2,770 2,930 2,421
Employee provisions 335 310 344
Shareholders' equity 1,189 1,174 1,159
of which: attributable to minority interest 44 55 47
Net financial position 1,246 1,446 918
Total Financing and Equity 2,770 2,930 2,421
Statement of financial position (Balance Sheet) Euro Millions
30 Sept 2013 30 Sept 2012 31 Dec 2012
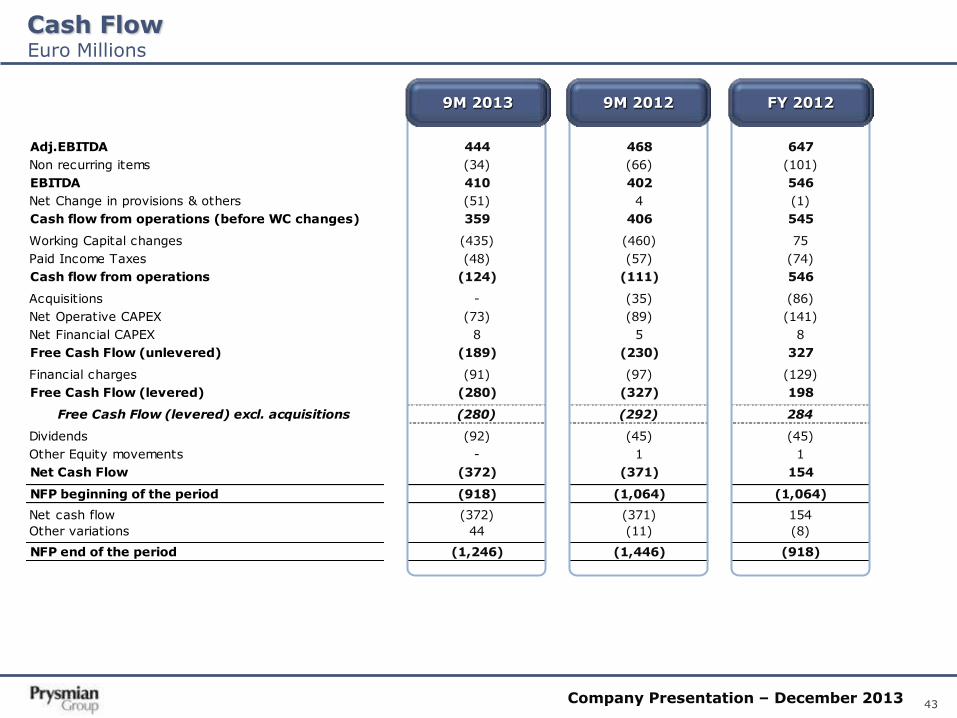
43 Company Presentation – December 2013
Adj.EBITDA 444 468 647
Non recurring items (34) (66) (101)
EBITDA 410 402 546
Net Change in provisions & others (51) 4 (1)
Cash flow from operations (before WC changes) 359 406 545
Working Capital changes (435) (460) 75
Paid Income Taxes (48) (57) (74)
Cash flow from operations (124) (111) 546
Acquisitions - (35) (86)
Net Operative CAPEX (73) (89) (141)
Net Financial CAPEX 8 5 8
Free Cash Flow (unlevered) (189) (230) 327
Financial charges (91) (97) (129)
Free Cash Flow (levered) (280) (327) 198
Free Cash Flow (levered) excl. acquisitions (280) (292) 284
Dividends (92) (45) (45)
Other Equity movements - 1 1
Net Cash Flow (372) (371) 154
NFP beginning of the period (918) (1,064) (1,064)
Net cash flow (372) (371) 154
Other variations 44 (11) (8)
NFP end of the period (1,246) (1,446) (918)
(2)
Cash Flow Euro Millions
9M 2013 9M 2012 FY 2012

44 Company Presentation – December 2013
AGENDA
Group Overview & 2013 Outlook
Corporate Social Responsibility
Draka integration
Financial Results
Appendix – Prysmian at a Glance

45 Company Presentation – December 2013
Key Milestones
Source: 1998-2003 Pirelli Group Annual Reports, data reported under Italian GAAP; 2004-2012 Prysmian accounts, data reported under IFRS. Draka consolidated since 1 March 2011
9.2%
4.7%
6.3%
3.8%
-0.8%
1.4%
3.2%
4.6%
6.6%
9.1% 9.3%
9.0%
6.8% 5.6%
6.2%
-5%
0%
5%
10%
15%
20%
25%
0
1
2
3
4
5
6
7
8
9
1998 1999 2000 2001 2002 2003 2004 2005 2006 2007 2008 2009 2010 2011 2012
Energy
Telecom
Adj.EBIT %
Sale
s -
€ b
n
2.8
3.9
4.6 4.7
3.5
3.1 3.4
3.7
5.0 5.1 5.1
3.7
4.6
7.6 7.8
2005 2001
Growth by acquisition
Restructuring process
Profitable growth
Acquisitions (Siemens,
NKF, MM, BICC)
Closure of 11 plants
Disposal of non core activities
July 28, ‘05: GS
acquisition and birth
of Prysmian Group
May 3, ‘07: Listing on the
Milan Stock Exchange
(IPO)
Listing
2011 2008
Managing the downturn
Strategic investments preparing
for the economic recovery
March ‘10: Prysmian became
a full Public
Company
Public Company
February
‘11: Draka
acquisition
#1 Cable Maker
Growth by acquisition
1998 1879
Establishment
Company founded as “Pirelli Cavi”
Establishment
of first operations
in Italy
Organic growth
Product range
enlargement
International-ization
1902

46 Company Presentation – December 2013
7.8
6.3
5.5
4.5 4.1
3.9 3.8
3.0 2.8
1.1
PrysmianGroup
Nexans LS Cable &System
General Cable Southwire Furukawa Leoni Fujikura Hitachi Cable NKT Cables
Source: Companies' public documents. Note: Nexans excluding Other segment (mainly Electrical Wire); General Cable excluding Rod Mill Products; Furukawa considering only Telecommunications and Energy & Industrial Products segments, LTM figures as of 31-Dec-2012; Southwire FY2011; Furjikura considering only Telecom and Metal Cable & Systems segments, LTM figures as of 31-Dec-2012; Hitachi Cable considering Sales to Customers only for Industrial Infrastructure Products, Electronic & Automotive Products and Information Systems Devices & Materials segments, LTM figures as of 31-Dec-2012. All figures are expressed in € based on the average exchange rate of the reference period
€b
n,
20
12
Sale
s
The World’s Leading Cables & Systems Company N°1 in cable solutions for the energy and telecommunication business

47 Company Presentation – December 2013
Power Distribution
Optical Cables & Fibre
Trade & Installers
Submarine
Copper Telecom Cables
PROFITABILITY
High Voltage
Industrial
High
Medium
Low
Medium Low High
SURF (Flexible Pipes +
Umbilicals)
Extended business perimeter
LONG TERM GROWTH
~ 75% of FY’12
Adj.EBITDA
Prysmian Group business portfolio
Look for Profitable Growth
• Focus on solutions
• Diversification and innovation
• Competition on a global basis
• Take selective M&A opportunities
• Focus on products and service
• Limited product diversification within regions • Regional competition
Manage for Cash
~ 25% of FY’12
Adj.EBITDA
Focus on high value added segments
Network Components
Extra HV

48 Company Presentation – December 2013
Cash Flow generation as key priority to create value for shareholders Growing capabilities to invest organically/acquisitions and remunerate shareholders
Cash Flow generation
0.8x
1.2x
1.6x
2.0x
2.4x
0
80
160
240
320
2006 2007 2008 2009 2010 2011 comb. 2012 2013E
Free Cash Flow (levered) excl. Acquisitions (L axis) NFP / Adj. EBITDA (R axis)
€ mln
75 74 75 Dividends paid* 35 44 89
Almost €400m distributed to shareholders
since IPO
Approx. €170m cumulated restructuring costs related to Draka
integration in ‘11-13E
Over € 200m average free cash flow per year
generated in 2006-13E
2012 benefited from approx. €100m cash-in (submarine business) expected in 2013
* By Prysmian SpA

49 Company Presentation – December 2013
Improving operating leverage during the downturn
0
100
200
300
400
2007 2008 2009 2010 2011 2012 2013E
PD - Adj.EBITDA T&I - Adj.EBITDA PD + T&I Fixed Costs
2007-11: Combined data Prysmian + Draka
Over €35m fixed costs reduction
from overheads and operations in
FY13E vs. FY11
Adj. EBITDA and Fixed Costs – Euro million
Power Distribution + T&I
Approx. €240m adj.EBITDA reduction from 2007 despite cost rationalization
50 Company Presentation – December 2013
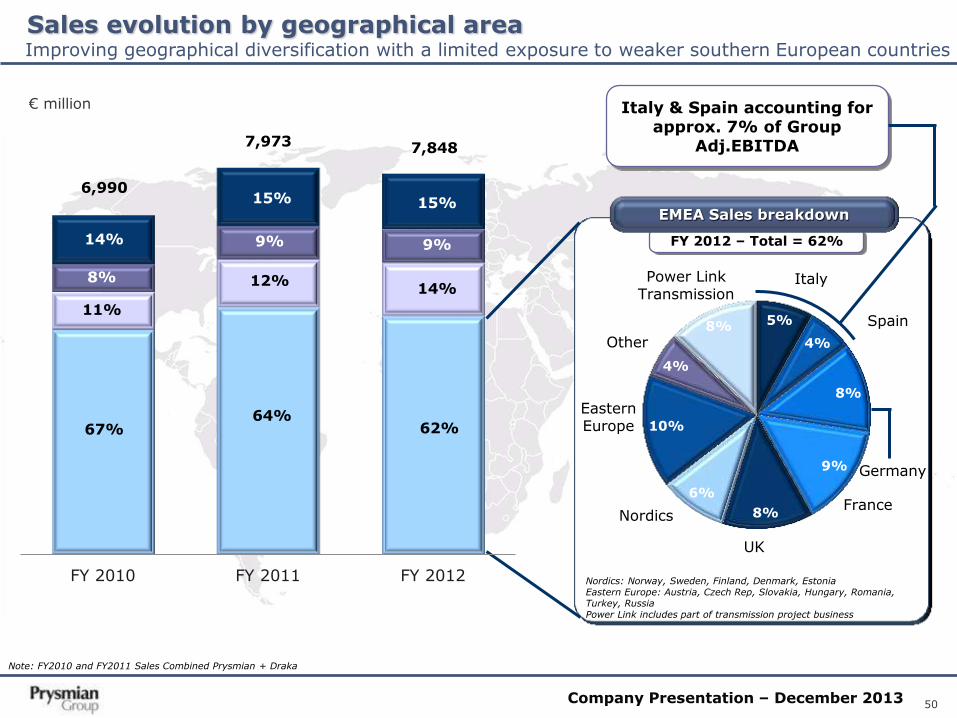
Sales evolution by geographical area
5%
4%
8%
9%
8%
6%
10%
4%
8%
Italy
Spain
Germany
France
UK
Nordics
Eastern Europe
Other
Note: FY2010 and FY2011 Sales Combined Prysmian + Draka
Nordics: Norway, Sweden, Finland, Denmark, Estonia Eastern Europe: Austria, Czech Rep, Slovakia, Hungary, Romania, Turkey, Russia Power Link includes part of transmission project business
€ million
Improving geographical diversification with a limited exposure to weaker southern European countries
FY 2012 – Total = 62%
EMEA Sales breakdown
Italy & Spain accounting for approx. 7% of Group
Adj.EBITDA
Power Link Transmission
FY 2010 FY 2011 FY 2012
6,990
7,973 7,848
67%
11%
8%
14%
64%
12%
9%
15%
62%
14%
9%
15%

51 Company Presentation – December 2013
(1) % of Capacity Increase & Product mix Note: Draka consolidated since 1 March 2011
Capacity Increase & Product mix (€m)
37 49 57 63 54
90 88
85 89
116 107 102
159 152
2006 2007 2008 2009 2010 2011 2012
Maintenance, Efficiency, IT and R&D
Capacity Increase & Product mix
2012 Capex by destination
73%
14%
-
10%
3%
100%
72%
9%
4%
2%
13%
100%
43%
6%
43%
-
8%
100%
22%
2%
65%
-
11%
100%
60%
7%
21%
1%
11%
100%
Utilities
Industrial
Surf
T&I
Telecom
Total (1)
CAPEX evolution Investments focused on high value added businesses
28%
6%
7%
16%
14%
16%
12%
35%
3%
57%
-
5%
100%
€ 152 mln
Capacity Increase & Product Mix
Maintenance, Efficiency, IT and R&D
Utilities
Industrial
SURF
T&I (1%)
Telecom
Maintenance
Efficiency
IT and R&D
49%
10%
12%
1%
28%
100%

52 Company Presentation – December 2013
Metal Price Impact on Profitability
• Metal price fluctuations are normally passed through to customers under supply contracts
• Hedging strategy is performed in order to systematically minimize profitability risks
High
Low
• Projects (Energy transmission)
• Cables for industrial applications (eg. OGP)
Predetermined delivery date
Metal Influence on Cable Price Metal Fluctuation Management Main
Application Supply
Contract
Impact Impact
Frame contracts
• Technology and design content are the main elements of the “solution” offered
• Pricing little affected by metals
Spot orders
• Cables for energy utilities (e.g. power distribution cables)
• Cables for construction and civil engineering
• Pricing defined as hollow, thus mechanical price adjustment through formulas linked to metal publicly available quotation
• Standard products, high copper content, limited value added
• Price adjusted through formulas linked to metal publicly available quotation (average last month, …)
• Profitability protection through systematic hedging (short order-to-delivery cycle)
• Pricing locked-in at order intake • Profitability protection through
systematic hedging (long order-to-delivery cycle)
• Pricing managed through price lists, thus leading to some delay
• Competitive pressure may impact on delay of price adjustment
• Hedging based on forecasted volumes rather than orders

53 Company Presentation – December 2013
AGENDA
Group Overview & 2013 Outlook
Corporate Social Responsibility
Draka integration
Financial Results
Appendix – Energy

54 Company Presentation – December 2013
Clusters of Cable Manufacturers in the Industry Competitive scenario – Energy Cables

55 Company Presentation – December 2013
Utilities Trade & Installers Industrial
• Power Transmission
– Underground EHV, HV-DC/AC
– Submarine (turn-key) EHV-
DC/AC (extruded, mass
impregnated and SCFF) and
MV
• Power Distribution
– LV, MV (P-Laser)
• Network components
– joints, connectors and
terminations from LV to EHV
• LV cables for construction
– Fire performing
– Environmental friendly
– Low smoke-zero halogen
(LSOH)
– Application specific
products
• Specialties & OEM (rolling
stock, nuclear, defence, crane,
mining, marine, electro medical,
railway, other infrastructure)
• Automotive
• OGP & SURF
• Renewables
• Elevator
• Other industrial (aviation,
branchment, other)
Full package of solutions for Energy Business

56 Company Presentation – December 2013
• Underground High Voltage Cabling solutions for power plant sites and primary distribution networks
• Submarine High Voltage
Turnkey cabling solutions for submarine power transmission systems at depths of up to 2,000 meters
• Network components Joints, connectors and terminations for low to extreme high voltage cables suitable for industrial, building or infrastructure applications and for power transmission and distribution
High/extra high voltage power transmission solutions for the utilities sector
Customer base drawn from all major national transmission networks operators
Utilities – Power Transmission
Business description Key customers

57 Company Presentation – December 2013
Giulio Verne
- Length overall: 115m
- Depth moulded: 6.8m
- Gross tonnage: 8,328t
- Length overall: 133.2m
- Depth moulded: 7.6m
- Gross tonnage: 10,617 t
1 2
3 4
5
6
Pikkala (Finland) Drammen (Norway) Arco Felice (Italy)
Utilities – Investing in submarine to increase ROCE Strengthening production and installation (GME acquisition) capabilities
Cable Enterprise
7
Main projects in execution/order backlog:
1. Western Link
2. HelWin 1-2/ SylWin 1/ BorWin 2/ DolWin 3
/ Deutsche Bucht
3. Hudson
4. Messina
5. Dardanelles
6. Phu Quoc
7. Mon.Ita
8. Normandie 3
9. Balearic Islands
10. Capri
US Offshore platforms
8
9 10

58 Company Presentation – December 2013
High visibility on new projects to be awarded next quarters
Utilities – Off-shore wind development in Europe still at early stage
5.0 GW UK 2.9 GW Belgium 0.4 GW
Germany 0.3 GW
Denmark 0.9 GW
Netherlands 0.3 GW
Others 0.2 GW
1.5 2.1 3.0 3.8 5.0
4.5 1
8.4
0
0.2
0.4
0.6
0.8
1
1.2
1.4
0
2
4
6
8
10
12
14
16
18
20
Th
ou
san
ds
Cumulated Offshore Wind capacity (L axis)
Annual Additional capacity (R axis)
Source: EWEA (January 2013)
26
28
24
• Capacity Increase: 1.2 GW in 2012
• Total capacity: 5.0 GW at end 2012 (+30% vs. 2011)
• Under construction: 4.5 GW at end 2012
• Consented: 18.4 GW
18.4 GW
Germany 38%
Ireland 9%
UK 10%
Netherlands 15%
Others*
18%
Europe 2012 Cumulated Capacity by Country
Consented Offshore Capacity by Country
Europe Offshore Wind capacity (GW)
Estonia 5%
Sweden 5%
* Include Finland, Belgium, Greece, Italy, Latvia, France

59 Company Presentation – December 2013
Utilities – Transmission
Source: ENTSO-E TYNDP 2012 (July 2012). RES stands for Renewable Energy Sources
320
53
126
458
2012 a)
536
82 132
456
Renewable Energy Sources
Hydro (non RES)
Nuclear
Fossil fuels
2020 a)
Scenario EU2020
Evolution of the generation mix
Main primary drivers for grid development in Europe toward 2020
963 GW
1,214 GW
a) Total 2012-2020 include Other sources for respectively 6 and 8GW. Source: ENTSO-E
250GW total capacity increase in 2012-20
Over 200GW come from wind and solar development
Changing Energy generation mix implies a re-engineering of transmission grids

60 Company Presentation – December 2013
Utilities – Transmission
2. Italy – France
3. Germany (Borwin III & IV, Sylwin II)
4. Germany (Baltic Sea East & West)
5. Cobra (NL-DK)
6. France – UK (Eurotunnel)
7. UK Caithness
8. Western Isles Link
1
2
3
4
5
6
7
8
9
Source: ENTSO-E Update of TYNDP 2012 (July 2013)
Main power flow trends
Main subsea & underground projects in design & permitting
Main planned subsea & underground projects
11
12
13
14
15 16
Main subsea and underground projects of pan-European significance
10
Update on transmission projects of pan-European significance
List of main projects
18
17
9. Schwanden-Limmern (CH)
10. Västervik – Gotland
11. Tunisia – Italy
12. Marseille – Languedoc
13. Calan – Plaine-Haute
14. Belgium – Germany
15. Norway – Germany
16. Norway – UK
17. Nemo (UK-BE)
18. Denmark – Germany
Already awarded:
1. Italy – Montenegro
3. Germany (Dolwin III)

61 Company Presentation – December 2013
Utilities – Submarine Systems
(1) Prysmian portion of the project
• Track record and reliability • Ability to design/execute turnkey
solution • Quality of network services • Product innovation • State-of-the-art cable laying ship
Increased installation capacity thanks to GME acquisition. Capacity expansion completed in Pikkala. Ongoing capacity increase in Arco Felice and Drammen to support growth next years through:
• Leverage on strong off-shore wind-farms trend
• Secure orders to protect long-term growth
• Focus on flawless execution
Key success factors
Action plan
Capri Terna 2014-15 70
US Offshore platforms ExxonMobil's 2014-15 $100m
Balearic Islands Red Eléctrica de España 2014-15 85
Deutsche Bucht TenneT 2014-15 50
DolWin3 TenneT 2014-16 350
Normandie 3 Jersey Electricity plc 2013-14 45
Mon.Ita Terna 2013-16 400
Dardanelles TEIAS 2012-14 67
Phu Quoc EVNSPC 2012-14 67
Western Link NGET/SPT Upgrades 2012-15 800
HelWin2 TenneT 2012-15 200
Hudson Project Hudson Transm. Partners LLC 2012-13 $175m
SylWin1 TenneT 2012-14 280
HelWin1 TenneT 2011-13 150
BorWin2 TenneT 2010-13 250
Messina Terna 2010-13 300
Kahramaa Qatar General Elect. 2009-10 140
Greater Gabbard Fluor Ltd 2009-10 93
Cometa Red Eléctrica de España 2008-11 119
Trans Bay Trans Bay Cable LLC 2008-10 $125m
Sa.Pe.I Terna 2006-10 418
Neptune Neptune RTS 2005-07 159
GCC Saudi - Bahrain Gulf Coop. Council Inter. Aut. 2006-10 132
Angel development Woodside
Rathlin Island N.Ireland Electricity
Ras Gas WH10-11 J. Ray Mc Dermott
Latest Key projects Customers Period €m (1)

62 Company Presentation – December 2013
Utilities – Western Link a milestone in the submarine sector Confirmed leadership in terms of know-how and innovation capabilities
Western Link route
Source: www.offshorewindscotland.org, www.westernhvdclink.co.uk
Large Off-shore Wind investments planned in Scotland
Western Link milestones
• The highest value cable project ever awarded, worth €800 mln
• The highest voltage level (600kV) ever reached by an insulated cable
• Currently unmatched transmission capacity for long-haul systems of 2,200MW
• Over 400km of HVDC cable, bi-directional allowing electricity to flow north or south according to future supply and demand
• First time HVDC technology has been used as an integral part of the GB Transmission System
• Commissioning scheduled by late 2015

63 Company Presentation – December 2013
Utilities – Power Distribution
Key customers are all major national distribution network operators
• Improve service level and time to market
• Reduce product cost • Cable design optimization • Alternative materials / compounds
introduction • Process technologies improvement
• Innovate
• New insulation materials • P-LASER launch in Europe
• Long term growth in electricity consumption
• Mandated improvements in service quality
• Investment incentives to utilities
• Urbanization
• Time to market
• Quality of service
• Technical support
• Cost leadership
• Customer relationship
Market drivers Key customers
Key success factors Action plan

64 Company Presentation – December 2013
Trade & Installers
• Key customers include major: • Specialized distributors
• General distributors
• Wholesalers
• Installers
Key customers Business description
• Low voltage cables for residential and non residential construction
• Channel differentiation with both:
• Direct sales to end customers (Installers)
• Indirect sales through
• Specialized distributors
• General distributors
• Wholesalers
• Do-it-yourself/modern distribution
• Wide range of products including
• Value added fire retardant
• Environmental friendly
• Specialized products

65 Company Presentation – December 2013
Building Wires rigid
Low Voltage
Building Wires flex
Medium Voltage
Low Smoke Zero Halogen
Specials
Fire Performance/ Accessories
High-End
Low-End
Tech
nolo
gy c
on
ten
t
Middle-Range
• Product range
• On-time delivery / Product availability
• Inventory/WC management
• Cost leadership
• Channel management
• Customers’ relationship
• Continuously redefine product portfolio • Focus on high-end products (e.g. Fire
Performance)
• Exploit channel/market specificity • Focus on wholesalers and installers • Protect positioning in high margin
countries • Grow global accounts
• Continuously improve service level
• Benefit from changes in regulatory regime
Key success factors
+
-
Trade & Installers
Action plan
Product overview

66 Company Presentation – December 2013
Oil & Gas Addressing the cable needs of research and refining, exploration and production. Products range from low & medium voltage power and control cables to dynamic multi-purpose umbilicals for transporting energy, telecommunications, fluids and chemical products
Renewable Advanced cabling solutions for wind and solar energy generation contribute to our clients increased efficiency, reliability and safely
Elevator Meeting the global demand for high-performing, durable and safe elevator cable and components we design manufacture and distribute packaged solutions for the elevator industry
Auto & Transport Products for trains, automobiles, ships and planes including the Royal Caribbean’s Genesis fleet (world’s biggest ship) & Alstom designed TGV (world’s fastest train)
Specialties & OEM Products for mining, crane , marine, rolling stock, nuclear and other niches
Integrated cable solutions highly customized to our industrial customers worldwide
Large and differentiated customer base generally served through direct sales
Surf (Subsea umbilical, riser and flowline) SURF provides the flexible pipes and umbilicals required by the petro-chemicals industry for the transfer of fluids from the seabed to the surface and vice versa
Industrial
Business description Key customers

67 Company Presentation – December 2013
Oilfield structure
Manifold
Umbilical Injection control
Umbilical For control
Umbilical (Power)
Floating Platform (SEMI-SUBMERSIBLE)
Flexible
Pipes
Floating Platform (FPSO)
Fixed Platform
Christmas Tree
Petrol Well
Flexible Pipes
Industrial – Off-shore oil exploration

68 Company Presentation – December 2013
Industrial – Off-shore oil exploration
HYBRID ELECTRO-OPTIC
FIBER OPTIC
ELECTRICAL
GAS & FLUID TUBING
PACKAGED GAS & FLUID TUBING
Downhole Technology (DHT)
Cross selling opportunities driven by the new Downhole technology business contributed by Draka

69 Company Presentation – December 2013
Product macro structure Production process
Conductor (Cu, Al)
Internal Semiconductive
Insulation (XLPE, EPDM)
External Semiconductive
WB yarns
Cu tape
Outer jacket (Polyolefine, PVC, …)
Conductor
production
(drawing,
stranding)
Insulation Screening Sheathing Lay up Armouring
Final
quality
inspection
Building
Wire
(T&I)
Low Voltage
(T&I+PD)
Medium
Voltage
High voltage
(PD+HV)
Industrial
Cables
(Industrial)
Macro-structure of Energy Cables

70 Company Presentation – December 2013
AGENDA
Group Overview & 2013 Outlook
Corporate Social Responsibility
Draka integration
Financial Results
Appendix – Telecom

71 Company Presentation – December 2013
Market
Presen
ce
Product Portfolio Range
Niche Focused Wide
YOFC
Co
nti
nen
tal
Glo
bal
Lo
cal
Major Players within the Telecom Industry Competitive scenario

72 Company Presentation – December 2013
Telecom solutions Optical cables: tailored for all today’s challenging environments from underground ducts to overhead lines, rail tunnels and sewerage pipes Copper cables: broad portfolio for underground and overhead solutions, residential and commercial buildings Connectivity: FTTH systems based upon existing technologies and specially developed proprietary optical fibres
Optical Fiber Optical fiber products: single-mode optical fiber, multimode optical fibers and specialty fibers (DrakaElite) Manufacturing: our proprietary manufacturing process for Plasma-activated Chemical Vapor Deposition and Licensed OVD Technology (600 unique inventions corresponding to > 1.4K patents) positions us at the forefront of today’s technology
Integrated cable solutions focused on high -end Telecom Key customers include key operators in the telecom sector
MMS Multimedia specials: solutions for radio, TV and film, harsh industrial environments, radio frequency, central office switching and datacom Mobile networks: Antenna line products for mobile operators Railway infrastructure: Buried distribution & railfoot cables for long distance telecommunication and advanced signalling cables for such applications as light signalling and track switching
Our Telecom Business
Business description Key customers

73 Company Presentation – December 2013
Optical cables Global overview
• Fibre optic represents the major single
component cost of optical cables
• Fibre optic production has high entry barriers:
• Proprietary technology or licenses difficult
to obtain
• Long time to develop know-how
• Capital intensity
• When fibre optic is short, vertically integrated
cable manufacturers leverage on a strong
competitive advantage
• Maintain & reinforce position with key
established clients
• Further penetration of large incumbents in
emerging regions
• Optimize utilization of low cost manufacturing
units
• Expand distribution model in Domestic & Export
• Streamline the inter-company process
• Fully integrated products sales
• Refocus on export activities
• Increase level and effectiveness of agents
• Demand function of level of capital expenditures
budgeted by large telecom companies
(PTT/incumbents as well as alternative
operators) for network infrastructures, mainly
as a consequence of:
• Growing number of internet users data
traffic
• Diffusion of broadband services / other high-
tech services (i.e. IPTV)
• Continuous innovation and development of new
cable & fibre products
• Cable design innovation with special focus on
installation cost reduction
• Relentless activity to maintain the highest quality
and service level
• Focus on costs to remain competitive in a highly
price sensitive environment
Key success factors Market trends
Action plan Strategic value of fibre

74 Company Presentation – December 2013
BACKBONE METROPOLITAN RING ACCESS NETWORK
Telecom Cables Main Applications

75 Company Presentation – December 2013
Telecom – Solid drivers in optical confirmed despite weak 2013
Global optical cables demand
Source: CRU, October 2013
2015 vs. 2012 Market Growth
APAC
Prysmian Sales*
+25%
* % calculated on LTM 9M’13 Sales of Optical, Connectivity & Fiber + JVs (LTM 9M’13 total sales approx. € 0.8bn)
2015 vs. 2012 Market Growth
EMEA
Prysmian Sales*
+18% 2015 vs. 2012 Market Growth
North America
Prysmian Sales*
-12%
2015 vs. 2012 Market Growth
South America
Prysmian Sales*
+37%
17%
8%
33%
42%
Growing investments expected in South America, EMEA and APAC

76 Company Presentation – December 2013
Antenna towers used by 4G and LTE
networks
Roof top antenna towers for urban
applications
Distributed antenna systems for dense mobile
populations areas
Telecom – FTTA as key driver of optical demand 4G and Long Term Evolution (LTE) deployments require Fiber-to-the-Antenna (FTTA)
Millions of users
Number of Global LTE Subscribers Forecast
Source: IHS iSuppli Research, January 2013

77 Company Presentation – December 2013
• Government initiative to provide direct fibre connection to 93% of Australian subscribers (residential and business)
• AUD 43 bn capex planned during the period (2011-2019); construction started in 2011
• Telstra and NBN agreed to jointly develop the new network
• Prysmian signed a 5-year agreement with NBN as major supplier of optical cables for the network (AUD 300m)
• Prysmian signed new 4-year frame agreement with Telstra to supply optical and copper cables
• Large part of existing and new Telstra cable infrastructure being used within the NBN network
• Prysmian doubling optical cable capacity in Australian Dee Why site
Second release sites
First release sites
Priority locations
Cities/Towns
Consolidated leadership in Australia to benefit from new NBN project Start-up of National broadband network in 2011
Rollout plan for National Broadband Network

78 Company Presentation – December 2013
Product macro structure Production process
Main Technologies:
OVD - VAD - MCVD
Core (10 Micron)
Cladding (125 Micron)
Primary Coating (250 Micron)
Pre form deposition Consolidation Drawing
Conductor
production Insulation Twinning Sheathing Lay up Armouring
Colouring Lay up
Armouring
(yarn or
metal)
Sheathing
Sheath
Ripcords
Fillers
Central
strength
member (Tracking resistant)
Sheathing Compound
Optical
fibres Loose tubes
Aramid Yarns
Stranded pairs core Screen/Armour
Outer sheath Insulated Conductors
Fibre
optic
Optical
cables
Copper
cables
Final quality
inspection
Final
quality
inspection
Final
quality
inspection
Buffering
Macro-structure of Telecom Cables

79 Company Presentation – December 2013
AGENDA
Group Overview & 2013 Outlook
Corporate Social Responsibility
Draka integration
Financial Results
Appendix – Financials

80 Company Presentation – December 2013
Bridge Consolidated Sales Euro Millions
Total Consolidated
5,930 5,440 5,488
228 99
163 48
9M 2012 Org.Growth Metal Effect Exchange Rate 9M 2013 L-f-L Perimeter effect 9M 2013
Energy Cables & Systems Division
Telecom Cables & Systems Division
( )
(3.9%)
(1.3%)
(14.6%)
( )
( )
4,801 4,510 4,543
64 92
135 33
9M 2012 Org.Growth Metal Effect Exchange Rate 9M 2013 L-f-L Perimeter effect 9M 2013
( ) ( )
( )
1,129 930 945
164
7 28 15
9M2012 Org.Growth Metal Effect Exchange Rate 9M 2013 L-f-L Perimeter effect 9M 2013
( )
( )
( )

81 Company Presentation – December 2013
Sales to Third Parties 4,543 4,801 6,382
YoY total growth (5.4%)
YoY organic growth (1.3%)
Adj. EBITDA 353 348 487
% on sales 7.8% 7.3% 7.6%
Adj. EBIT 275 268 379
% on sales 6.0% 5.6% 5.9%
Energy Segment – Profit and Loss Statement Euro Millions
9M 2013 9M 2012 FY 2012

82 Company Presentation – December 2013
Utilities 162 159 9.8% 9.3%
Trade & Installers 41 41 2.8% 2.5%
Industrial 71 70 5.3% 5.1%
Others 1 (2) n.m. n.m.
Total Energy 275 268 6.0% 5.6%
Utilities 192 185 11.7% 11.0%
Trade & Installers 61 62 4.1% 3.7%
Industrial 97 101 7.2% 7.3%
Others 3 - n.m. n.m.
Total Energy 353 348 7.8% 7.3%
Utilities 1,650 1,678 (1.7%) (0.8%)
Trade & Installers 1,471 1,653 (11.0%) (5.1%)
Industrial 1,340 1,371 (2.3%) 3.0%
Others 82 99 n.m. n.m.
Total Energy 4,543 4,801 (5.4%) (1.3%)
Energy Segment – Sales and Profitability by business area Euro Millions, % on Sales
Ad
j. E
BITD
A
Ad
j. E
BIT
Sale
s t
o T
hir
d P
arti
es
9M 2013 9M 2012 Total
growth
Organic growth
9M’13 % on Sales
9M’12 % on Sales

83 Company Presentation – December 2013
Sales to Third Parties 945 1,129 1,466
YoY total growth (16.3%)
YoY organic growth (14.6%)
Adj. EBITDA 91 120 160
% on sales 9.7% 10.6% 10.9%
Adj. EBIT 54 81 104
% on sales 5.7% 7.3% 7.1%
Telecom Segment – Profit and Loss Statement Euro Millions
9M 2013 9M 2012 FY 2012

84 Company Presentation – December 2013
Financial Structure Euro Millions
Term Loan
Revolving Credit Facility
Eurobond 5.25%
Convertible bond 1.25%
Securitization
Term Loan 2011
Revolving 2011
Other Debt
Total Gross Debt
Cash & Cash equivalents
Other Financial Assets
NFP Vs third parties
Bank Fees
NFP
Debt structure (€m)
31.12.12
30.09.2013 (€m)
184
75
408
261
-
400
75
279
1,682
(321)
(104)
1,257
Used
-
321
-
-
-
-
325
-
646
321
80
1,047
Available Funds (2)
12/2014
12/2014
04/2015
03/2018
-
03/2016
03/2016
-
2.2 y (1)
Maturity 30.06.13
184
-
403
260
116
400
-
382
1,745
(386)
(99)
1,260
(12)
1,248
670
-
413
-
75
400
-
290
1,848
(812)
(97)
939
(21)
918
30.09.13
184
75
408
261
-
400
75
279
1,682
(321)
(104)
1,257
(11)
1,246
(1) Average maturity as of 30 September 2013 excluding other debt
(2) Defined as Cash and Unused committed credit lines
Note: Compound average spread on used committed credit lines equal to 2.1%

85 Company Presentation – December 2013
Prysmian Historical Key Financials Euro Millions, % of Sales – Pre Draka acquisition
Sales Adjusted EBIT1
* Organic Growth
Sales Adjusted EBITDA (1) Adjusted EBIT (2)
Net Financial Position Adjusted EBIT1 Adjusted Net Income (3) Operative NWC (4)
(1) Adjusted excluding non-recurring income/expenses; (2) Adjusted excluding non-recurring income/(expenses) and the fair value change in metal derivatives and in other fair value items; (3) Adjusted excluding non-recurring income/(expenses), the fair value change in metal derivatives and in other fair value items, exchange rate differences and the related tax effects; (4) Operative Net Working capital defined as Net Working Capital excluding the effect of derivatives; % of sales is defined as Operative Net Working Capital on annualized last quarter sales. Note: 2005 Adj. Net Income and 2005 Operative NWC figures are not available
3,742
5,007 5,118 5,144
3,731
4,571
2005 2006 2007 2008 2009 2010
+9.3
% *
+8.2
% *
+4.2
% *
-17.4
% *
+3.2
% *
265
407
529 542
403 387
2005 2006 2007 2008 2009 2010
7.1% 8.1% 10.3% 10.5% 10.8% 8.5%
171
330
464 477
334 309
2005 2006 2007 2008 2009 2010
4.6% 6.6% 9.1% 9.3% 9.0% 6.8%
175
299 332
206 173
2006 2007 2008 2009 2010
3.5% 5.8% 6.5% 5.5% 3.8%
440
525
451 465
457
2006 2007 2008 2009 2010
8.6% 10.6% 9.5% 12.2% 9.2%
892 879
716
577 474 459
2005 2006 2007 2008 2009 2010

86 Company Presentation – December 2013
Historical Key Financials by Business Area – Utilities and T&I Euro Millions, % of Sales – Pre Draka acquisition
(1) Adjusted excluding non-recurring income/expenses; (2) Adjusted excluding non-recurring income/expenses, the fair value change in metal derivatives and in other fair-value items
Uti
liti
es
T&
I
Sales Vs Third Parties Adjusted EBITDA (1) Adjusted EBIT (2)
Sales Vs Third Parties Adjusted EBITDA (1) Adjusted EBIT (2)
* Organic Growth
1,445
1,853 1,894 2,028
1,598 1,790
2005 2006 2007 2008 2009 2010
+3.3
% *
+12.1
% *
-13.9
% *
+1.5
% *
143
197
237
287 266
250
2005 2006 2007 2008 2009 2010
9.9% 10.6% 12.5% 14.2% 16.7% 14.0%
107
157
208
256 237
215
2005 2006 2007 2008 2009 2010
7.4% 8.4% 11.0% 12.6% 14.7% 12.0%
* Organic Growth
1,189
1,645 1,802
1,629
1,020
1,465
2005 2006 2007 2008 2009 2010
+7.1
% *
-5.0
% *
-21.5
% *
+6.6
% *
62
119
155
113
41 36
2005 2006 2007 2008 2009 2010
5.2% 7.2% 8.6% 6.9% 4.0% 2.4%
38
101
137
100
26 20
2005 2006 2007 2008 2009 2010
3.2% 6.1% 7.6% 6.1% 2.5% 1.4%

87 Company Presentation – December 2013
(1) Adjusted excluding non-recurring income/expenses; (2) Adjusted excluding non-recurring income/expenses, the fair value change in metal derivatives and in other fair-value items
Historical Key Financials by Business Area – Industrial and Telecom Euro Millions, % of Sales – Pre Draka acquisition
In
du
str
ial
Tele
com
Sales Vs Third Parties Adjusted EBITDA (1) Adjusted EBIT (2)
Sales Vs Third Parties Adjusted EBITDA (1) Adjusted EBIT (2)
* Organic Growth
489
629
795 850
628
742
2005 2006 2007 2008 2009 2010
+21.1
% *
+5.0
% *
-16.1
% *
-1.1
% *
39 46
84 93
62 61
2005 2006 2007 2008 2009 2010
8.0% 7.2% 10.6% 10.9% 9.8% 8.3%
25 34
71 80
46 42
2005 2006 2007 2008 2009 2010
5.1% 5.3% 9.0% 9.4% 7.3% 5.7%
* Organic Growth
424
506 535 536
403 450
2005 2006 2007 2008 2009 2010
+6.3
% *
+5.2
% *
-20.7
% *
+1.2
% *
19
39
48 49
31 36
2005 2006 2007 2008 2009 2010
4.4% 7.2% 8.6% 9.0% 7.6% 7.9%
1
35
44 45
25 29
2005 2006 2007 2008 2009 2010
0.3% 6.6% 7.9% 8.4% 6.1% 6.3%

88 Company Presentation – December 2013
AGENDA
Group Overview & 2013 Outlook
Corporate Social Responsibility
Draka integration
Financial Results
Appendix – Cable Industry Reference Market

89 Company Presentation – December 2013
North
America
16%
EMEA
30% APAC
50%
Latin
America
4%
Telecom Cables Reference Market (~€24bn )
Energy Cables Reference Market
~€94bn
Telecom Cables Reference Market
~€24bn
Energy Cables Reference Market (~€94bn)
Source: Company analysis based on CRU data – October 2013. Prysmian reference markets are obtained by excluding from the global cable market the segments where the company does not compete (winding wire for energy business). Energy = Low Voltage and Power Cable; TLC = External Copper Tlc Cable, Fibre Optic, Internal Telecom/Data
North
America
13%
EMEA
30% APAC
53%
Latin
America
4%
• Trade and Installers
• Utilities • Industrial
• Optical cables and fiber
• Copper Cables • MMS
The Global Cables Reference Market World-Wide Cable Reference Market Size, 2012
2012 Global Cables Reference Market
€ 118 bn
North
America
26%
EMEA 30%
APAC
39%
Latin
America
5%

90 Company Presentation – December 2013
45 66
91 95
55 54 57 70
92 116
142 172
187 215
242 257
282 287 284
'98 '00 '02 '04 '06 '08 '10 12 '14E 16E
Source: Company analysis based on October 2013 CRU data. Energy = Low Voltage and Power Cable; TLC = External Copper Tlc Cable, Fibre Optic, Internal Telecom/Data
253 259 275 268
205 211 207 196 172
157 136
106 102 93 85 76 71 66 62
'98 '00 '02 '04 '06 '08 '10 12 '14E 16E
6.5 6.7 6.9 7.1 7.4 7.8 8.5 9.0 9.5
10.3 10.7 10.0 10.7 11.2 11.6 11.9 12.5
13.1 13.7
'98 '99 '00 '01 '02 '03 '04 '05 '06 '07 '08 '09 '10 '11 12 '13E '14E '15E 16E
Million Km Fibre Million Km Pair
Million Tons Conductor
Optical Fiber Cables Copper Cables
Energy Cables Reference Market
Telecom Cables Reference Market
CAGR: 4.2%
• Long term growth driven by:
• Energy consumption • Investments in power grid
interconnections
• Investments in power transmission and distribution
• Infrastructure investments • Renewable energy
Market growth driven by increased investment in fibre access networks (FTTx) and LTE
Steady decline of copper cables expected to continue
CAGR: 4.2%
Market Volumes Trend
CAGR: 4.1%
CAGR: 12.8% CAGR: -7.5%
CAGR: -7.7%

91 Company Presentation – December 2013
Reference Scenario Commodities & Forex
Based on monthly average data Source: Thomson Reuters
Brent Copper Aluminium
500
1,000
1,500
2,000
2,500
3,000
3,500
Jan-08 Jan-09 Jan-10 Jan-11 Jan-12 Jan-13
Aluminium $/ton
Aluminium €/ton
EUR / USD EUR / GBP EUR / BRL
2,000
4,000
6,000
8,000
10,000
12,000
Jan-08Jan-09Jan-10Jan-11Jan-12Jan-13
Copper $/ton
Copper €/ton
25
50
75
100
125
150
Jan-08 Jan-09 Jan-10 Jan-11 Jan-12 Jan-13
Brent $/bbl
Brent €/bbl
2.00
2.40
2.80
3.20
3.60
Jan-08 Jan-09 Jan-10 Jan-11 Jan-12 Jan-13
0.70
0.75
0.80
0.85
0.90
0.95
Jan-08 Jan-09 Jan-10 Jan-11 Jan-12 Jan-13
1.20
1.30
1.40
1.50
1.60
Jan-08 Jan-09 Jan-10 Jan-11 Jan-12 Jan-13

92 Company Presentation – December 2013
Disclaimer
• The managers responsible for preparing the company's financial reports, A.Bott and C.Soprano, declare, pursuant
to paragraph 2 of Article 154-bis of the Consolidated Financial Act, that the accounting information contained in
this presentation corresponds to the results documented in the books, accounting and other records of the
company.
• Certain information included in this document is forward looking and is subject to important risks and
uncertainties that could cause actual results to differ materially. The Company's businesses include its Energy and
Telecom cables and systems sectors, and its outlook is predominantly based on its interpretation of what it
considers to be the key economic factors affecting these businesses.
• Any estimates or forward-looking statements contained in this document are referred to the current date and,
therefore, any of the assumptions underlying this document or any of the circumstances or data mentioned in this
document may change. Prysmian S.p.A. expressly disclaims and does not assume any liability in connection with
any inaccuracies in any of these estimates or forward-looking statements or in connection with any use by any
third party of such estimates or forward-looking statements. This document does not represent investment advice
or a recommendation for the purchase or sale of financial products and/or of any kind of financial services. Finally,
this document does not represent an investment solicitation in Italy, pursuant to Section 1, letter (t) of Legislative
Decree no. 58 of February 24, 1998, or in any other country or state.
• In addition to the standard financial reporting formats and indicators required under IFRS, this document contains
a number of reclassified tables and alternative performance indicators. The purpose is to help users better
evaluate the Group's economic and financial performance. However, these tables and indicators should not be
treated as a substitute for the standard ones required by IFRS.