Embed Size (px)
Citation preview

Welcome to Math 15
Introduction to Scientific Data Analysis
January 25, 2008
University of California, Merced

Math 15 Course Components
Instructor: Dr. Masa Watanabe Course:
One one-hour lecture per week One two-hours computer lab per week
Office Hours: Wednesdays 1-2:30pm Office: Room 302 – Science & Engineering Building I E-mail: [email protected]

Textbooks:
There is no required book for this class. However, here are some supplemental textbooks that you can use: Excel for Scientists and Engineers, by Verschuur
en, Holy Macro Books You can also find many helpful introductory
materials through internet.
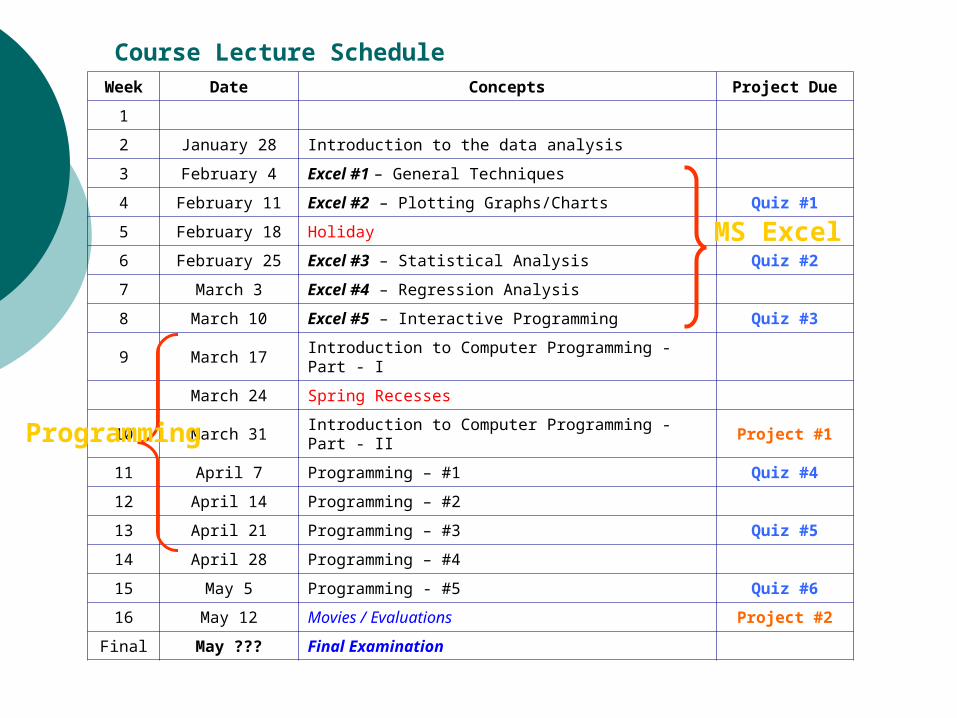
Course Lecture ScheduleWeek Date Concepts Project Due
1
2 January 28 Introduction to the data analysis
3 February 4 Excel #1 – General Techniques
4 February 11 Excel #2 – Plotting Graphs/Charts Quiz #1
5 February 18 Holiday
6 February 25 Excel #3 – Statistical Analysis Quiz #2
7 March 3 Excel #4 – Regression Analysis
8 March 10 Excel #5 – Interactive Programming Quiz #3
9 March 17 Introduction to Computer Programming - Part - I
March 24 Spring Recesses
10 March 31 Introduction to Computer Programming - Part - II Project #1
11 April 7 Programming – #1 Quiz #4
12 April 14 Programming – #2
13 April 21 Programming – #3 Quiz #5
14 April 28 Programming – #4
15 May 5 Programming - #5 Quiz #6
16 May 12 Movies / Evaluations Project #2
Final May ??? Final Examination
MS Excel
Programming

Homework:
There is no shortcut. To learn any subject, you must practice problem solving. Homework problems will be assigned each week. Each homework assignment will be worth 10 points.
One thing is absolutely certain; your performance will reflect your knowledge of the subject and therefore will be closely related to the effort and time you invest in problem solving.

In-Class Quizzes
There will be in-class quizzes every other week.
Each quiz will be worth 20 points.
First quiz will be given on February 11th
Open book and Open notebook Quizzes.
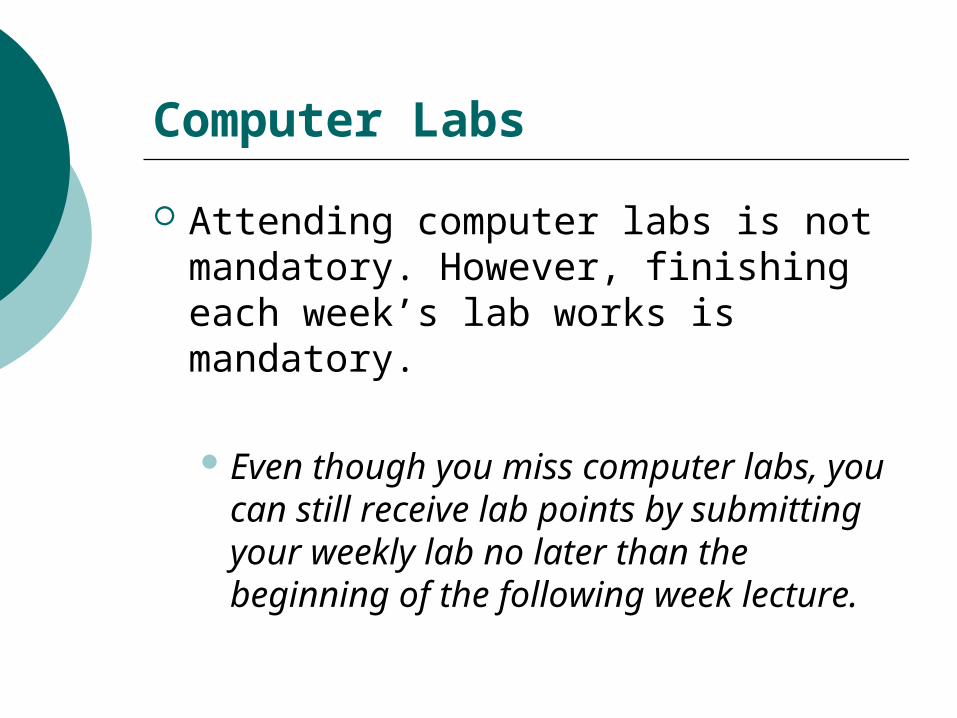
Computer Labs
Attending computer labs is not mandatory. However, finishing each week’s lab works is mandatory.
Even though you miss computer labs, you can still receive lab points by submitting your weekly lab no later than the beginning of the following week lecture.
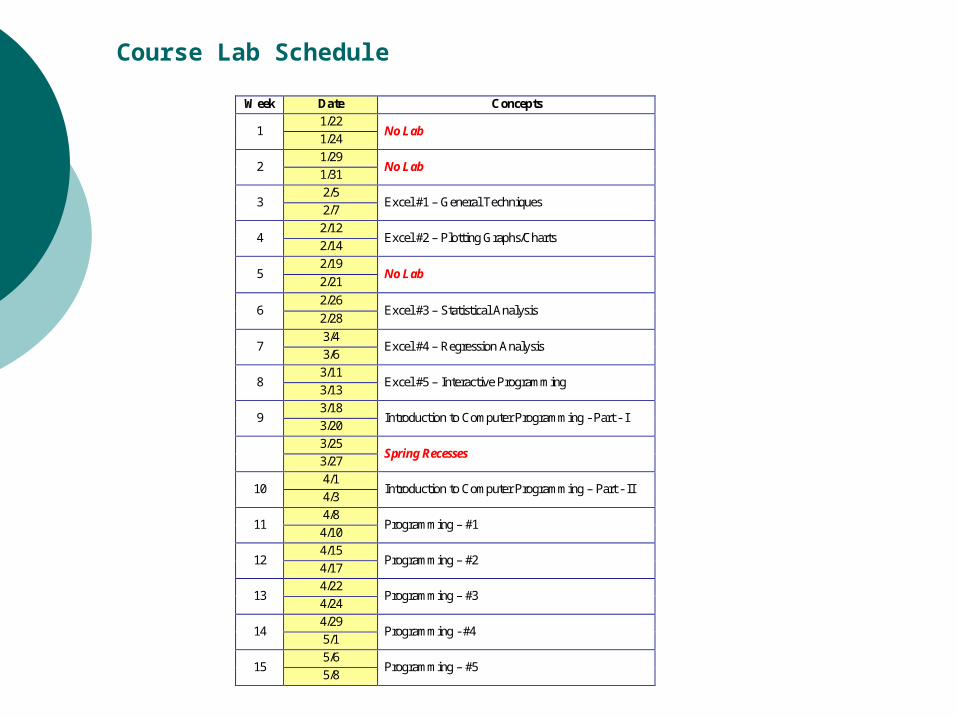
Course Lab Schedule
Week Date Concepts
1/22 1
1/24 No Lab
1/29 2
1/31 No Lab
2/5 3
2/7 Excel #1 – General Techniques
2/12 4
2/14 Excel #2 – Plotting Graphs/Charts
2/19 5
2/21 No Lab
2/26 6
2/28 Excel #3 – Statistical Analysis
3/4 7
3/6 Excel #4 – Regression Analysis
3/11 8
3/13 Excel #5 – Interactive Programming
3/18 9
3/20 Introduction to Computer Programming - Part - I
3/25
3/27 Spring Recesses
4/1 10
4/3 Introduction to Computer Programming – Part - II
4/8 11
4/10 Programming – #1
4/15 12
4/17 Programming – #2
4/22 13
4/24 Programming – #3
4/29 14
5/1 Programming - #4
5/6 15
5/8 Programming – #5
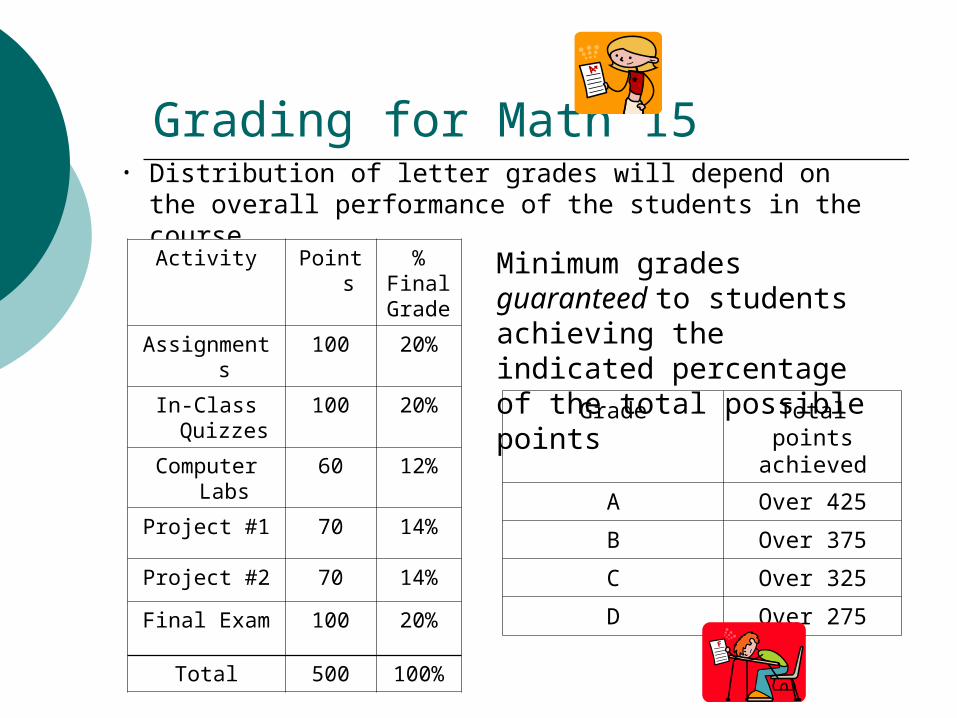
Grading for Math 15• Distribution of letter grades will depend on the
overall performance of the students in the course
Grade Total points achieved
A Over 425
B Over 375
C Over 325
D Over 275
Minimum grades guaranteed to students achieving the indicated percentage of the total possible points
Activity Points % Final Grade
Assignments 100 20%
In-Class Quizzes
100 20%
Computer Labs 60 12%
Project #1 70 14%
Project #2 70 14%
Final Exam 100 20%
Total 500 100%

Academic Integrity Academic honesty is a core value of the University of
California and the central rule of academic honesty is that you must do your own work.
Summary No cheating on projects or homework (i.e. copying
from other person’s projects and homework, etc.) Action will be taken in all examples of cheating
At the first instance of cheating, no credit will be given to all students at fault in the incident and the issue will be forwarded to the Vice-Chancellor for Undergraduate Affairs
Subsequent cheating could lead to dismissal from course or university misconduct are subject to disciplinary sanctions, including suspension and dismissal.
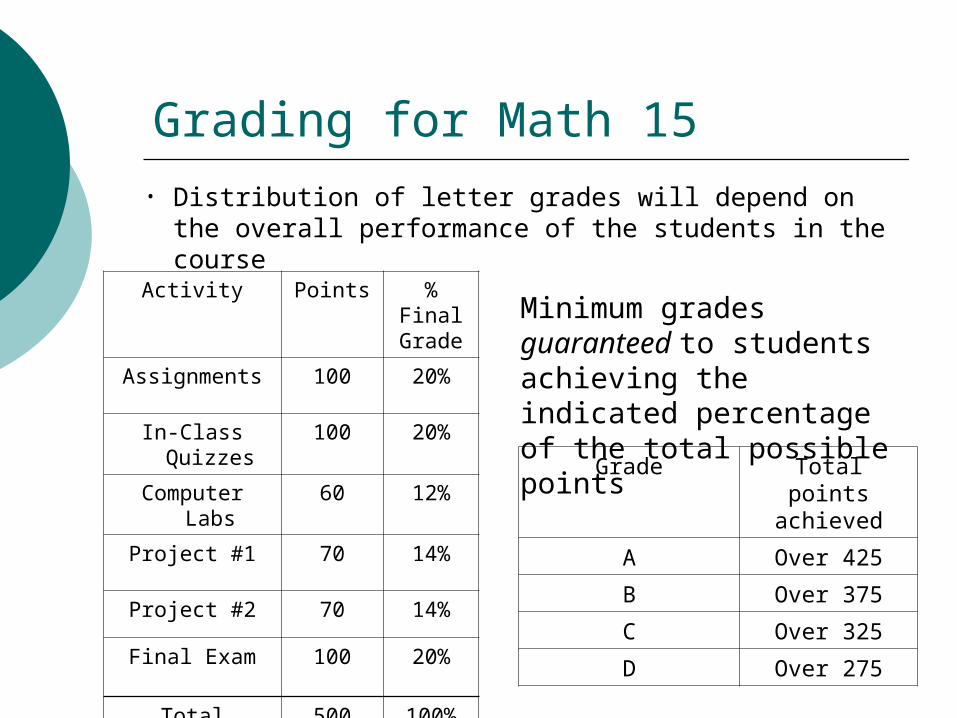
Grading for Math 15
• Distribution of letter grades will depend on the overall performance of the students in the course
Grade Total points achieved
A Over 425
B Over 375
C Over 325
D Over 275
Minimum grades guaranteed to students achieving the indicated percentage of the total possible points
Activity Points % Final Grade
Assignments 100 20%
In-Class Quizzes 100 20%
Computer Labs 60 12%
Project #1 70 14%
Project #2 70 14%
Final Exam 100 20%
Total 500 100%
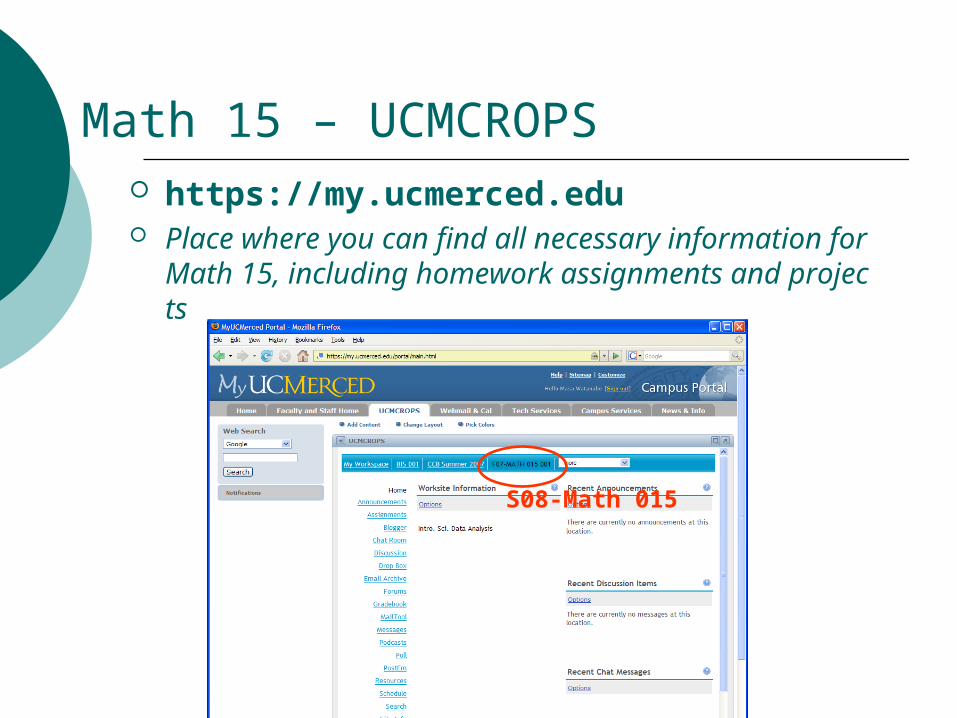
Math 15 – UCMCROPS https://my.ucmerced.edu Place where you can find all necessary information for Mat
h 15, including homework assignments and projects
S08-Math 015
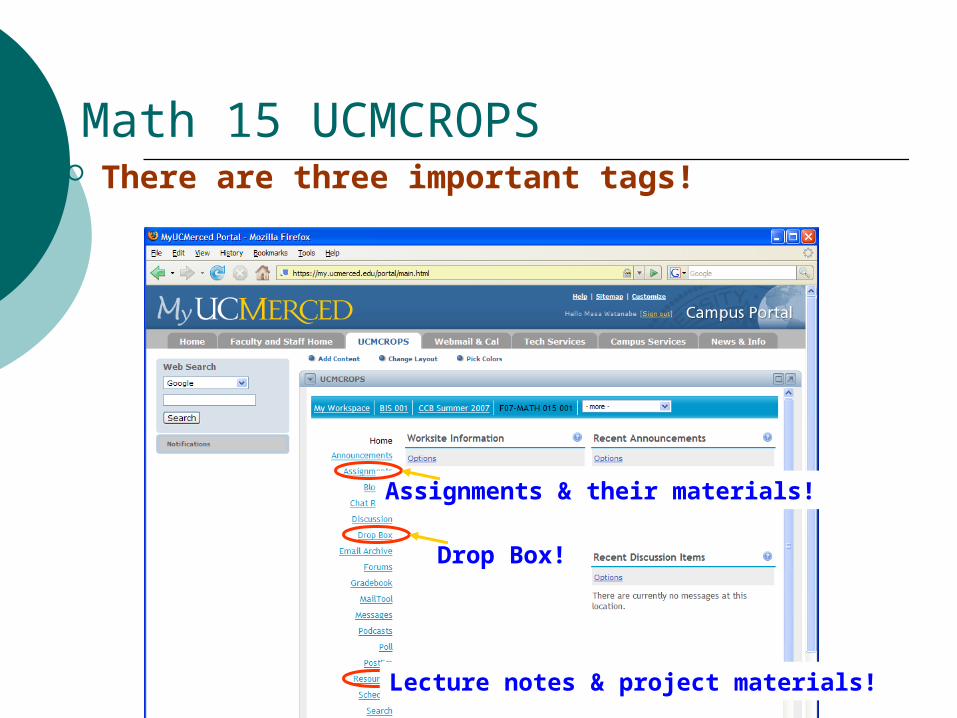
Math 15 UCMCROPS There are three important tags!
Assignments & their materials!
Lecture notes & project materials!
Drop Box!

Any question?
Today’s Lecture
Topics Why is Math 15?
Do I really need this? What will be covered this semester? What is Data Analysis?
Qualitative analysis Quantitative analysis
First Homework (due Next Week)

Why Math 15?
Math 15 is a course for data analysis!
What is Data analysis? Data and information are all over the place. We
need to organize and comprehend data and information, so that we can draw our conclusions.
Why do we need a good knowledge of Data analysis? Processing the information or data that has been
gathered in order to be able to interpret data and draw right or correct conclusions.
This class will help you to acquire knowledge and techniques to draw conclusions from data and information that you have obtained.

Course Goals for Math 15
This course provides a foundation for data analysis through spreadsheet use and computer programming.
Key objectives:1. To enhance students’ critical and quantitative
thinking skills through applications of computer tools and data analysis.
2. To acquire logical thinking and problem-solving skills: to learn how to communicate complex ideas simply and to decompose problems logically.
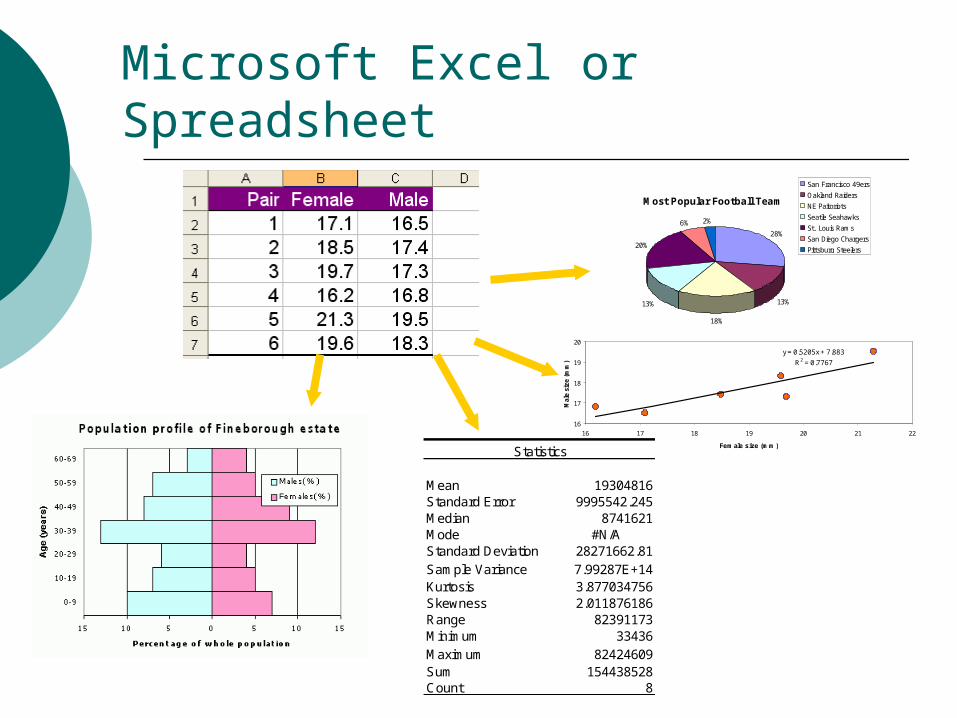
Microsoft Excel or SpreadsheetMost Popular Football Team
28%
13%
18%
13%
20%
6% 2%
San Francisco 49ers
Oakland Raiders
NE Paitoriots
Seatle Seahawks
St. Louis Rams
San Diego Chargers
Pittsburg Steelers
y = 0.5205x + 7.883
R2 = 0.7767
16
17
18
19
20
16 17 18 19 20 21 22
Female size (mm)
Mal
e si
ze (
mm
)
Statistics
Mean 19304816Standard Error 9995542.245Median 8741621Mode #N/AStandard Deviation 28271662.81Sample Variance 7.99287E+14Kurtosis 3.877034756Skewness 2.011876186Range 82391173Minimum 33436Maximum 82424609Sum 154438528Count 8
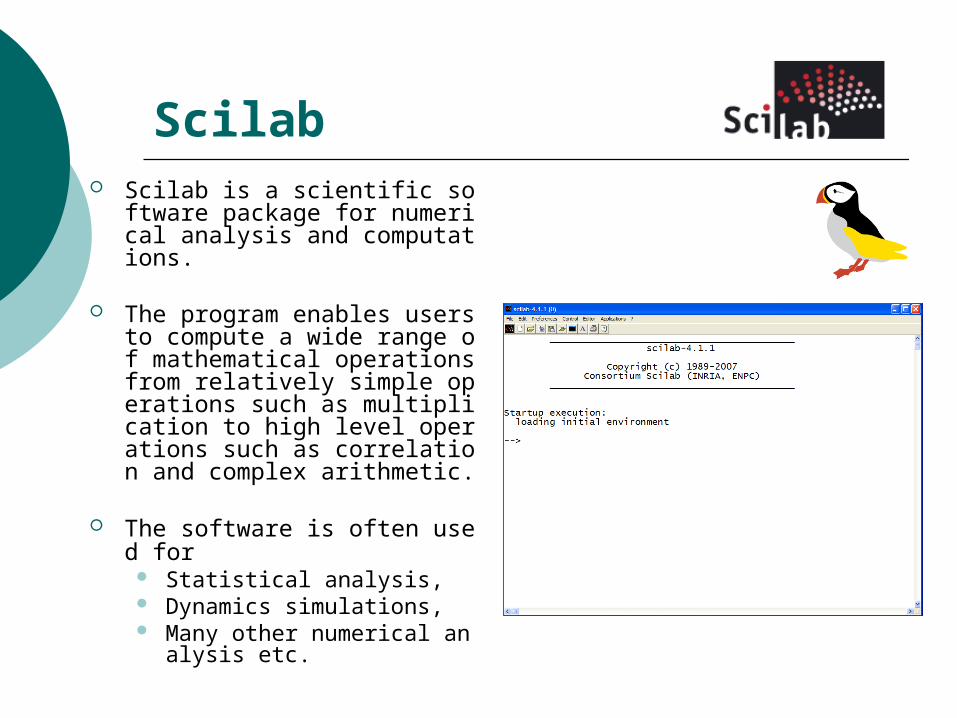
Scilab Scilab is a scientific software pac
kage for numerical analysis and computations.
The program enables users to compute a wide range of mathematical operations from relatively simple operations such as multiplication to high level operations such as correlation and complex arithmetic.
The software is often used for Statistical analysis, Dynamics simulations, Many other numerical analysis
etc.
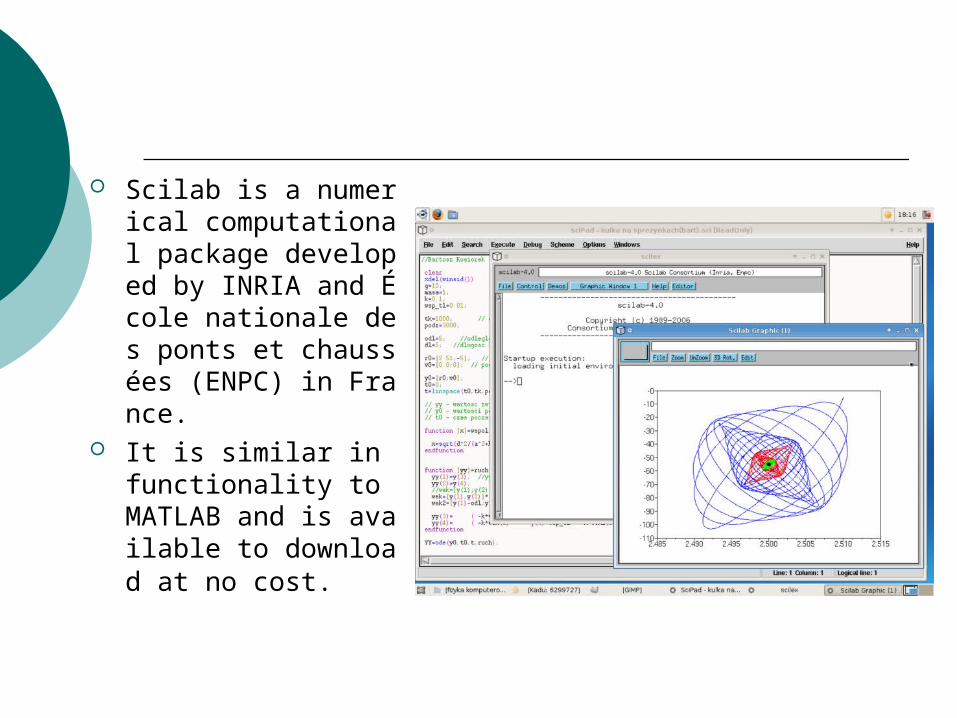
Scilab is a numerical computational package developed by INRIA and École nationale des ponts et chaussées (ENPC) in France.
It is similar in functionality to MATLAB and is available to download at no cost.
Any question?

Teaching Philosophy
“I hear and I forget.I see and I remember.I do and I understand.”
Confucius 500 B.C.
No Pain! No Gain!
Data and information are all over the place. We need to organize and comprehend data and information, so that we can draw our conclusions.
So, what do we do for Data Analysis? The process of systematically applying statistical and logical
techniques to describe, summarize, and compare data.
Organizing and examining the collected data using narratives, charts, graphs or tables
Useful tool to analyze data in order to understand and extract information, so that we can draw our conclusions.
What is Data Analysis?
Data Analysis Well… Actually you are doing all times
without knowing it.
Qualitative Data Analysis Interpretation of textual data and visual
data. If you are a medical doctor, you’re doing this
all times.
Quantitative Data Analysis Interpretation of numerical data

Data Analysis
Qualitative Data Analysis
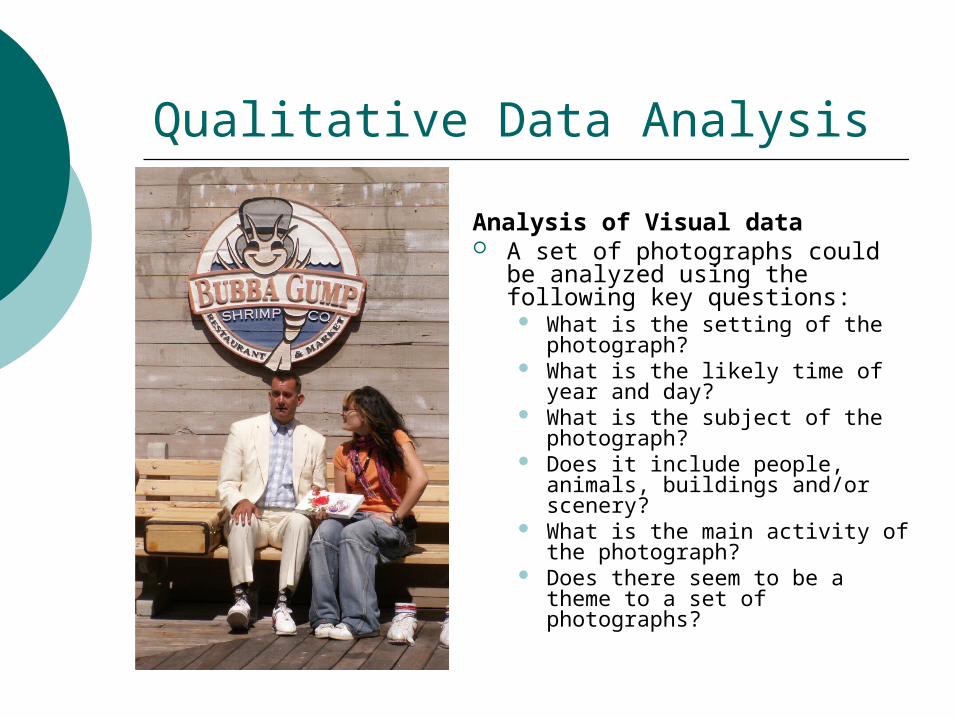
Analysis of Visual data A set of photographs could be
analyzed using the following key questions:
What is the setting of the photograph?
What is the likely time of year and day?
What is the subject of the photograph?
Does it include people, animals, buildings and/or scenery?
What is the main activity of the photograph?
Does there seem to be a theme to a set of photographs?
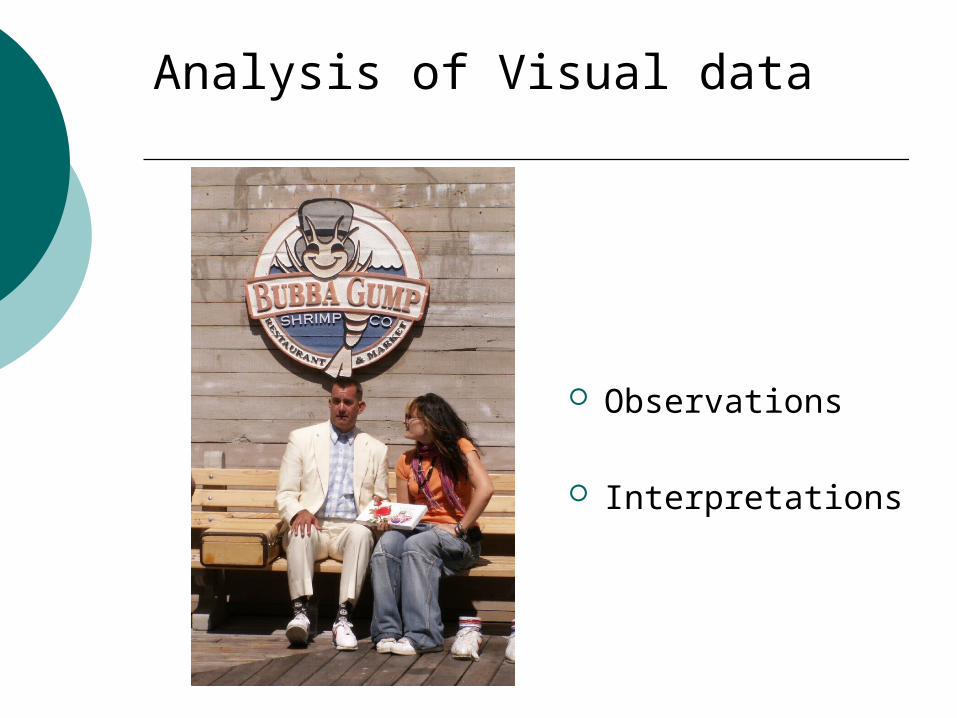
Analysis of Visual data
Observations
Interpretations

Data Analysis
We found Nemo!
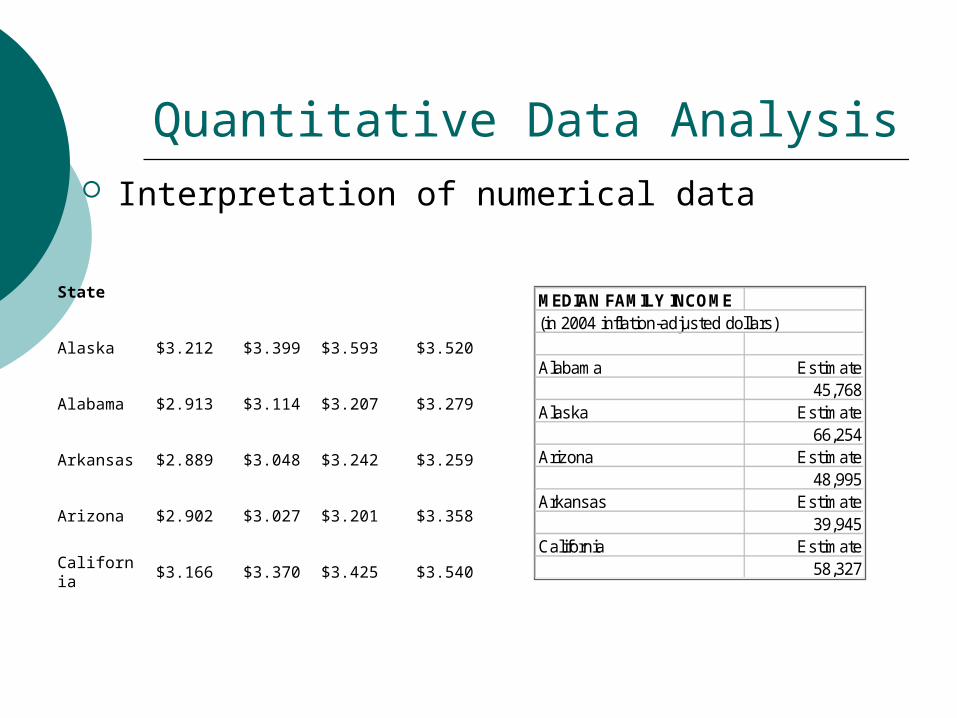
Quantitative Data Analysis Interpretation of numerical data
MEDIAN FAMILY INCOME(in 2004 inflation-adjusted dollars)
Alabama Estimate45,768
Alaska Estimate66,254
Arizona Estimate48,995
Arkansas Estimate39,945
California Estimate58,327
State Regular Mid Premium Diesel
Alaska $3.212 $3.399 $3.593 $3.520
Alabama $2.913 $3.114 $3.207 $3.279
Arkansas $2.889 $3.048 $3.242 $3.259
Arizona $2.902 $3.027 $3.201 $3.358
California $3.166 $3.370 $3.425 $3.540
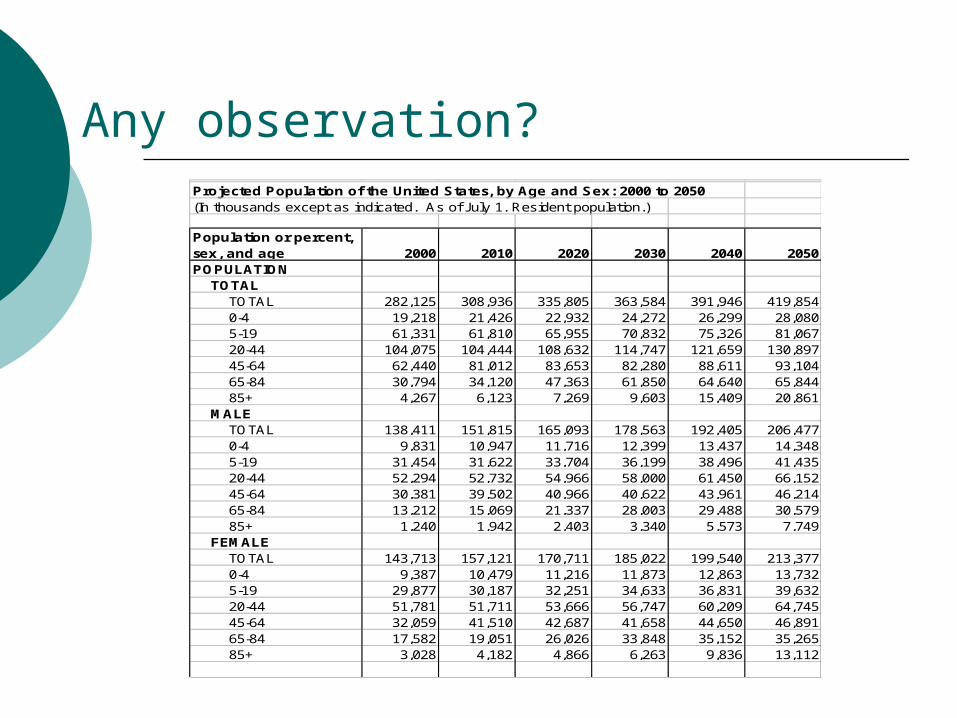
Any observation?Projected Population of the United States, by Age and Sex: 2000 to 2050(In thousands except as indicated. As of July 1. Resident population.)(leading dots indicate sub-parts)
Population or percent,sex, and age 2000 2010 2020 2030 2040 2050POPULATION
.TOTAL..TOTAL 282,125 308,936 335,805 363,584 391,946 419,854..0-4 19,218 21,426 22,932 24,272 26,299 28,080..5-19 61,331 61,810 65,955 70,832 75,326 81,067..20-44 104,075 104,444 108,632 114,747 121,659 130,897..45-64 62,440 81,012 83,653 82,280 88,611 93,104..65-84 30,794 34,120 47,363 61,850 64,640 65,844..85+ 4,267 6,123 7,269 9,603 15,409 20,861
.MALE..TOTAL 138,411 151,815 165,093 178,563 192,405 206,477..0-4 9,831 10,947 11,716 12,399 13,437 14,348..5-19 31,454 31,622 33,704 36,199 38,496 41,435..20-44 52,294 52,732 54,966 58,000 61,450 66,152..45-64 30,381 39,502 40,966 40,622 43,961 46,214..65-84 13,212 15,069 21,337 28,003 29,488 30,579..85+ 1,240 1,942 2,403 3,340 5,573 7,749
.FEMALE..TOTAL 143,713 157,121 170,711 185,022 199,540 213,377..0-4 9,387 10,479 11,216 11,873 12,863 13,732..5-19 29,877 30,187 32,251 34,633 36,831 39,632..20-44 51,781 51,711 53,666 56,747 60,209 64,745..45-64 32,059 41,510 42,687 41,658 44,650 46,891..65-84 17,582 19,051 26,026 33,848 35,152 35,265..85+ 3,028 4,182 4,866 6,263 9,836 13,112
Table with row headers in column A and column headers in row 5. Population numbers start in row 6, percent of total population starts in row 32.
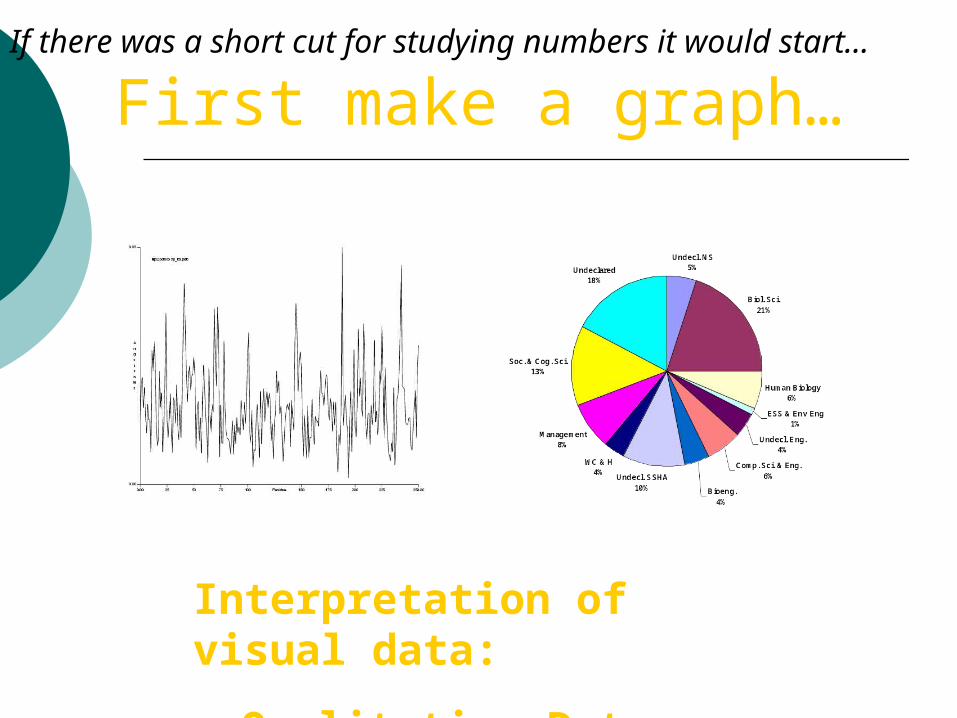
First make a graph…If there was a short cut for studying numbers it would start…
Interpretation of visual data:
Qualitative Data Analysis
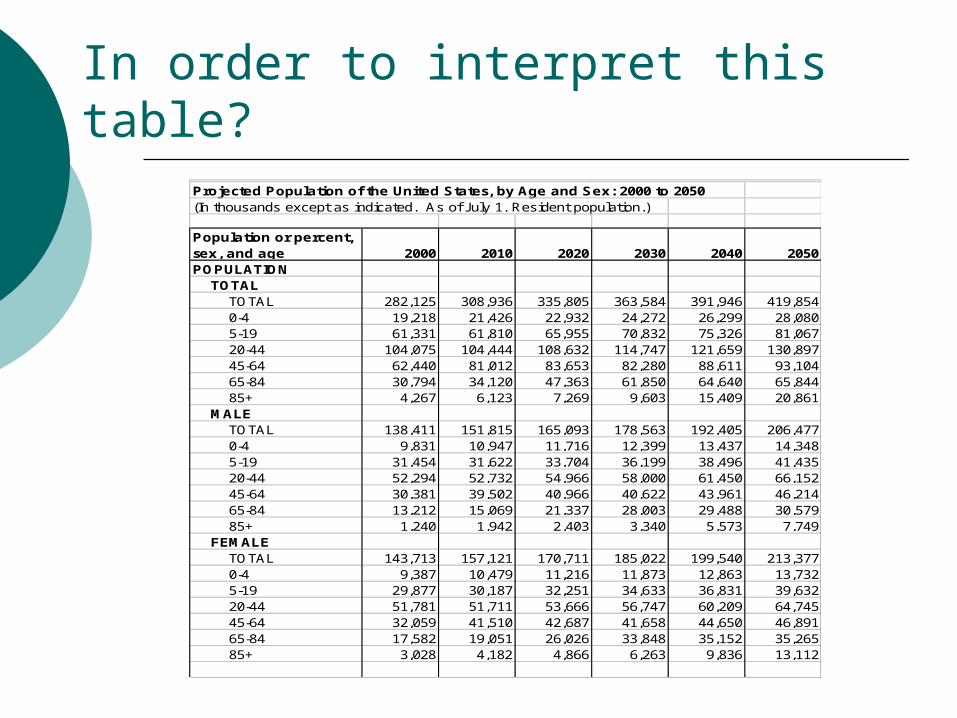
In order to interpret this table?Projected Population of the United States, by Age and Sex: 2000 to 2050(In thousands except as indicated. As of July 1. Resident population.)(leading dots indicate sub-parts)
Population or percent,sex, and age 2000 2010 2020 2030 2040 2050POPULATION
.TOTAL..TOTAL 282,125 308,936 335,805 363,584 391,946 419,854..0-4 19,218 21,426 22,932 24,272 26,299 28,080..5-19 61,331 61,810 65,955 70,832 75,326 81,067..20-44 104,075 104,444 108,632 114,747 121,659 130,897..45-64 62,440 81,012 83,653 82,280 88,611 93,104..65-84 30,794 34,120 47,363 61,850 64,640 65,844..85+ 4,267 6,123 7,269 9,603 15,409 20,861
.MALE..TOTAL 138,411 151,815 165,093 178,563 192,405 206,477..0-4 9,831 10,947 11,716 12,399 13,437 14,348..5-19 31,454 31,622 33,704 36,199 38,496 41,435..20-44 52,294 52,732 54,966 58,000 61,450 66,152..45-64 30,381 39,502 40,966 40,622 43,961 46,214..65-84 13,212 15,069 21,337 28,003 29,488 30,579..85+ 1,240 1,942 2,403 3,340 5,573 7,749
.FEMALE..TOTAL 143,713 157,121 170,711 185,022 199,540 213,377..0-4 9,387 10,479 11,216 11,873 12,863 13,732..5-19 29,877 30,187 32,251 34,633 36,831 39,632..20-44 51,781 51,711 53,666 56,747 60,209 64,745..45-64 32,059 41,510 42,687 41,658 44,650 46,891..65-84 17,582 19,051 26,026 33,848 35,152 35,265..85+ 3,028 4,182 4,866 6,263 9,836 13,112
Table with row headers in column A and column headers in row 5. Population numbers start in row 6, percent of total population starts in row 32.
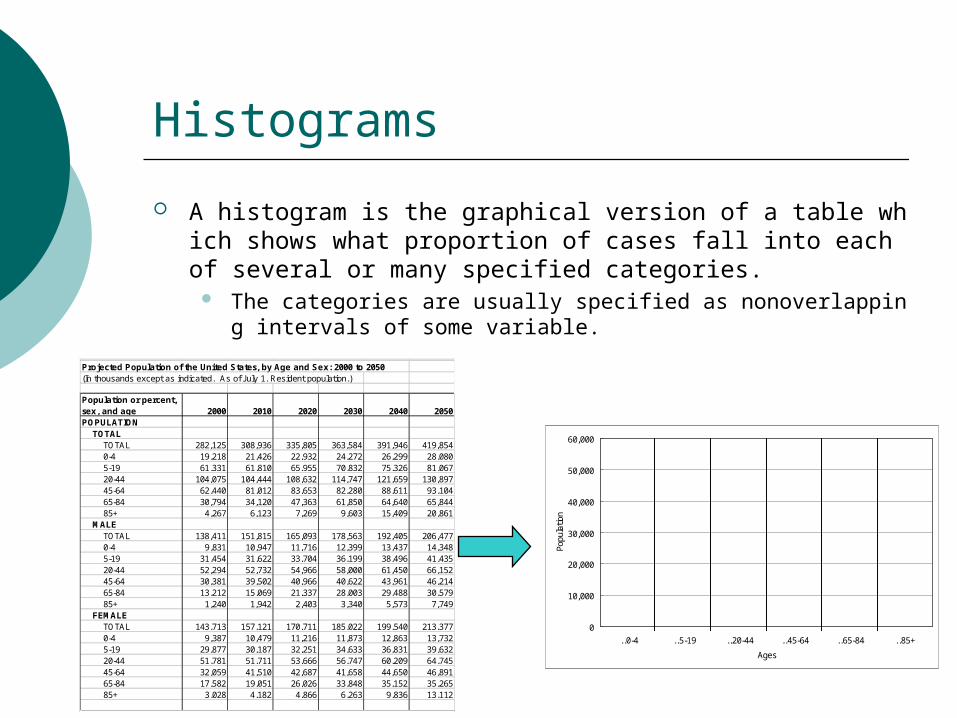
Histograms
A histogram is the graphical version of a table which shows what proportion of cases fall into each of several or many specified categories.
The categories are usually specified as nonoverlapping intervals of some variable.
Projected Population of the United States, by Age and Sex: 2000 to 2050(In thousands except as indicated. As of July 1. Resident population.)(leading dots indicate sub-parts)
Population or percent,sex, and age 2000 2010 2020 2030 2040 2050POPULATION
.TOTAL..TOTAL 282,125 308,936 335,805 363,584 391,946 419,854..0-4 19,218 21,426 22,932 24,272 26,299 28,080..5-19 61,331 61,810 65,955 70,832 75,326 81,067..20-44 104,075 104,444 108,632 114,747 121,659 130,897..45-64 62,440 81,012 83,653 82,280 88,611 93,104..65-84 30,794 34,120 47,363 61,850 64,640 65,844..85+ 4,267 6,123 7,269 9,603 15,409 20,861
.MALE..TOTAL 138,411 151,815 165,093 178,563 192,405 206,477..0-4 9,831 10,947 11,716 12,399 13,437 14,348..5-19 31,454 31,622 33,704 36,199 38,496 41,435..20-44 52,294 52,732 54,966 58,000 61,450 66,152..45-64 30,381 39,502 40,966 40,622 43,961 46,214..65-84 13,212 15,069 21,337 28,003 29,488 30,579..85+ 1,240 1,942 2,403 3,340 5,573 7,749
.FEMALE..TOTAL 143,713 157,121 170,711 185,022 199,540 213,377..0-4 9,387 10,479 11,216 11,873 12,863 13,732..5-19 29,877 30,187 32,251 34,633 36,831 39,632..20-44 51,781 51,711 53,666 56,747 60,209 64,745..45-64 32,059 41,510 42,687 41,658 44,650 46,891..65-84 17,582 19,051 26,026 33,848 35,152 35,265..85+ 3,028 4,182 4,866 6,263 9,836 13,112
Table with row headers in column A and column headers in row 5. Population numbers start in row 6, percent of total population starts in row 32.
0
10,000
20,000
30,000
40,000
50,000
60,000
..0-4 ..5-19 ..20-44 ..45-64 ..65-84 ..85+
Ages
Popu
latio
n
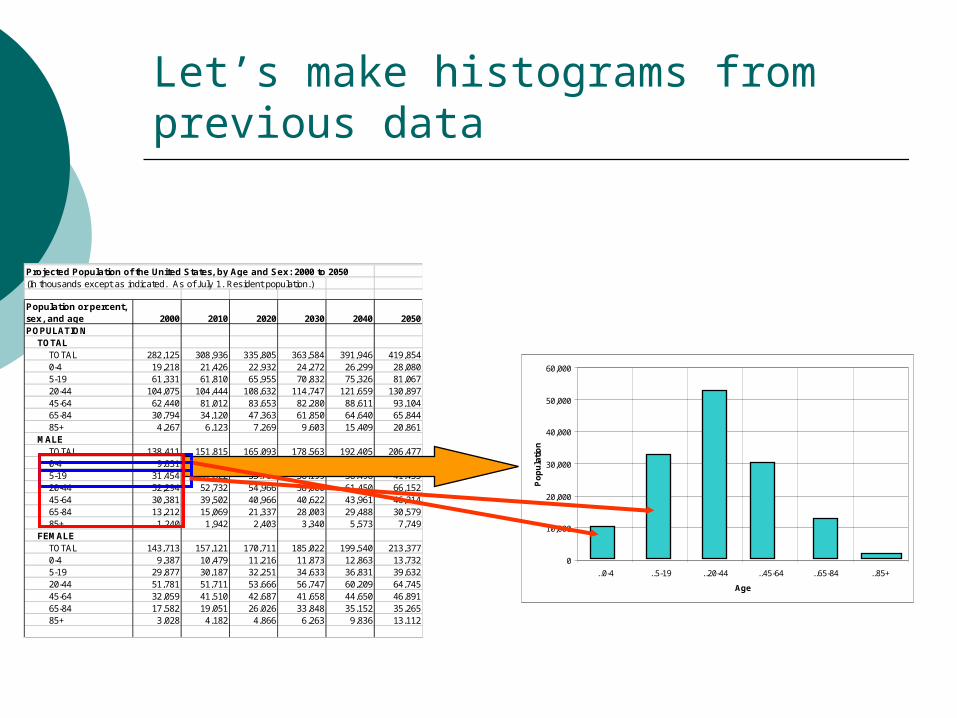
Let’s make histograms from previous data
Projected Population of the United States, by Age and Sex: 2000 to 2050(In thousands except as indicated. As of July 1. Resident population.)(leading dots indicate sub-parts)
Population or percent,sex, and age 2000 2010 2020 2030 2040 2050POPULATION
.TOTAL..TOTAL 282,125 308,936 335,805 363,584 391,946 419,854..0-4 19,218 21,426 22,932 24,272 26,299 28,080..5-19 61,331 61,810 65,955 70,832 75,326 81,067..20-44 104,075 104,444 108,632 114,747 121,659 130,897..45-64 62,440 81,012 83,653 82,280 88,611 93,104..65-84 30,794 34,120 47,363 61,850 64,640 65,844..85+ 4,267 6,123 7,269 9,603 15,409 20,861
.MALE..TOTAL 138,411 151,815 165,093 178,563 192,405 206,477..0-4 9,831 10,947 11,716 12,399 13,437 14,348..5-19 31,454 31,622 33,704 36,199 38,496 41,435..20-44 52,294 52,732 54,966 58,000 61,450 66,152..45-64 30,381 39,502 40,966 40,622 43,961 46,214..65-84 13,212 15,069 21,337 28,003 29,488 30,579..85+ 1,240 1,942 2,403 3,340 5,573 7,749
.FEMALE..TOTAL 143,713 157,121 170,711 185,022 199,540 213,377..0-4 9,387 10,479 11,216 11,873 12,863 13,732..5-19 29,877 30,187 32,251 34,633 36,831 39,632..20-44 51,781 51,711 53,666 56,747 60,209 64,745..45-64 32,059 41,510 42,687 41,658 44,650 46,891..65-84 17,582 19,051 26,026 33,848 35,152 35,265..85+ 3,028 4,182 4,866 6,263 9,836 13,112
Table with row headers in column A and column headers in row 5. Population numbers start in row 6, percent of total population starts in row 32.
0
10,000
20,000
30,000
40,000
50,000
60,000
..0-4 ..5-19 ..20-44 ..45-64 ..65-84 ..85+
Age
Po
pu
lati
on
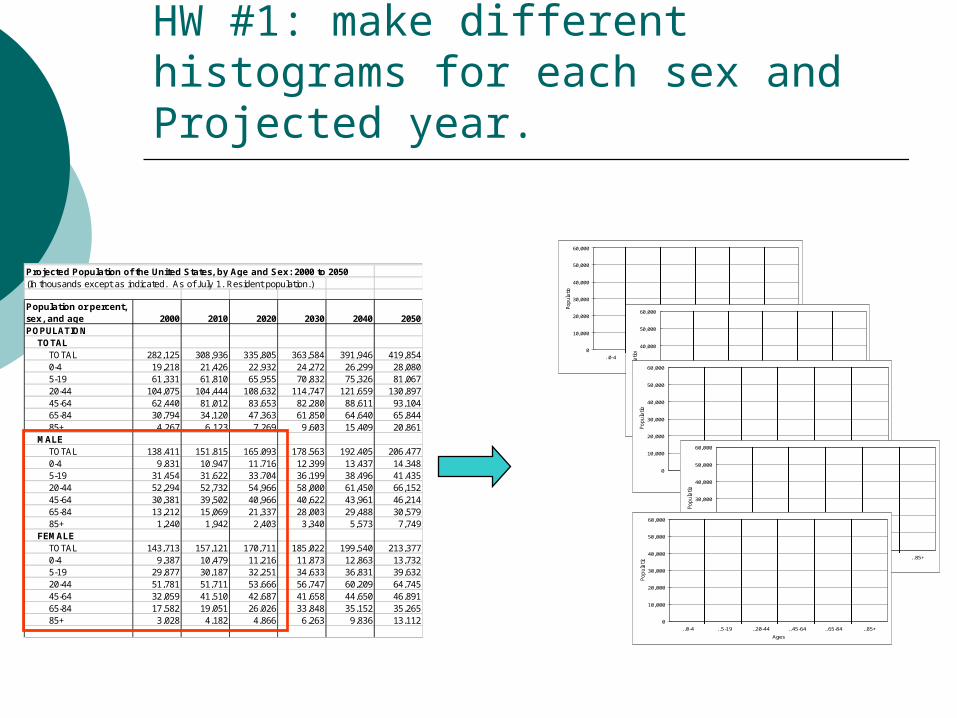
HW #1: make different histograms for each sex and Projected year.
Projected Population of the United States, by Age and Sex: 2000 to 2050(In thousands except as indicated. As of July 1. Resident population.)(leading dots indicate sub-parts)
Population or percent,sex, and age 2000 2010 2020 2030 2040 2050POPULATION
.TOTAL..TOTAL 282,125 308,936 335,805 363,584 391,946 419,854..0-4 19,218 21,426 22,932 24,272 26,299 28,080..5-19 61,331 61,810 65,955 70,832 75,326 81,067..20-44 104,075 104,444 108,632 114,747 121,659 130,897..45-64 62,440 81,012 83,653 82,280 88,611 93,104..65-84 30,794 34,120 47,363 61,850 64,640 65,844..85+ 4,267 6,123 7,269 9,603 15,409 20,861
.MALE..TOTAL 138,411 151,815 165,093 178,563 192,405 206,477..0-4 9,831 10,947 11,716 12,399 13,437 14,348..5-19 31,454 31,622 33,704 36,199 38,496 41,435..20-44 52,294 52,732 54,966 58,000 61,450 66,152..45-64 30,381 39,502 40,966 40,622 43,961 46,214..65-84 13,212 15,069 21,337 28,003 29,488 30,579..85+ 1,240 1,942 2,403 3,340 5,573 7,749
.FEMALE..TOTAL 143,713 157,121 170,711 185,022 199,540 213,377..0-4 9,387 10,479 11,216 11,873 12,863 13,732..5-19 29,877 30,187 32,251 34,633 36,831 39,632..20-44 51,781 51,711 53,666 56,747 60,209 64,745..45-64 32,059 41,510 42,687 41,658 44,650 46,891..65-84 17,582 19,051 26,026 33,848 35,152 35,265..85+ 3,028 4,182 4,866 6,263 9,836 13,112
Table with row headers in column A and column headers in row 5. Population numbers start in row 6, percent of total population starts in row 32.
0
10,000
20,000
30,000
40,000
50,000
60,000
..0-4 ..5-19 ..20-44 ..45-64 ..65-84 ..85+
Ages
Popula
tion
0
10,000
20,000
30,000
40,000
50,000
60,000
..0-4 ..5-19 ..20-44 ..45-64 ..65-84 ..85+
Ages
Popula
tion
0
10,000
20,000
30,000
40,000
50,000
60,000
..0-4 ..5-19 ..20-44 ..45-64 ..65-84 ..85+
Ages
Popula
tion
0
10,000
20,000
30,000
40,000
50,000
60,000
..0-4 ..5-19 ..20-44 ..45-64 ..65-84 ..85+
Ages
Popula
tion
0
10,000
20,000
30,000
40,000
50,000
60,000
..0-4 ..5-19 ..20-44 ..45-64 ..65-84 ..85+
AgesPopula
tion
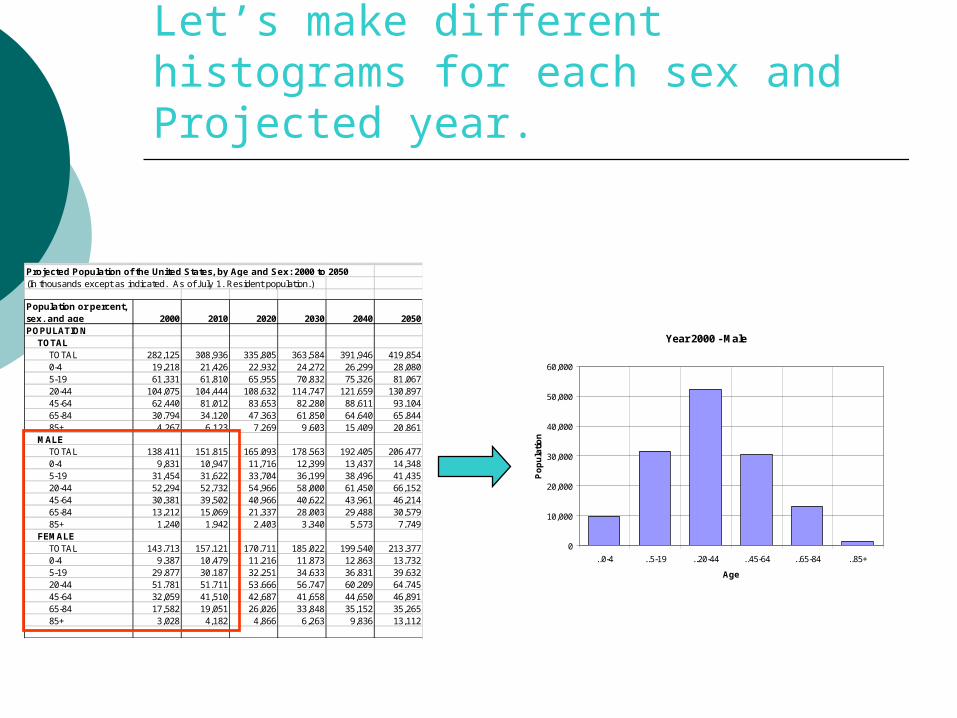
Let’s make different histograms for each sex and Projected year.
Projected Population of the United States, by Age and Sex: 2000 to 2050(In thousands except as indicated. As of July 1. Resident population.)(leading dots indicate sub-parts)
Population or percent, sex, and age 2000 2010 2020 2030 2040 2050POPULATION
.TOTAL..TOTAL 282,125 308,936 335,805 363,584 391,946 419,854..0-4 19,218 21,426 22,932 24,272 26,299 28,080..5-19 61,331 61,810 65,955 70,832 75,326 81,067..20-44 104,075 104,444 108,632 114,747 121,659 130,897..45-64 62,440 81,012 83,653 82,280 88,611 93,104..65-84 30,794 34,120 47,363 61,850 64,640 65,844..85+ 4,267 6,123 7,269 9,603 15,409 20,861
.MALE..TOTAL 138,411 151,815 165,093 178,563 192,405 206,477..0-4 9,831 10,947 11,716 12,399 13,437 14,348..5-19 31,454 31,622 33,704 36,199 38,496 41,435..20-44 52,294 52,732 54,966 58,000 61,450 66,152..45-64 30,381 39,502 40,966 40,622 43,961 46,214..65-84 13,212 15,069 21,337 28,003 29,488 30,579..85+ 1,240 1,942 2,403 3,340 5,573 7,749
.FEMALE..TOTAL 143,713 157,121 170,711 185,022 199,540 213,377..0-4 9,387 10,479 11,216 11,873 12,863 13,732..5-19 29,877 30,187 32,251 34,633 36,831 39,632..20-44 51,781 51,711 53,666 56,747 60,209 64,745..45-64 32,059 41,510 42,687 41,658 44,650 46,891..65-84 17,582 19,051 26,026 33,848 35,152 35,265..85+ 3,028 4,182 4,866 6,263 9,836 13,112
Table with row headers in column A and column headers in row 5. Population numbers start in row 6, percent of total population starts in row 32.
Year 2000 - Male
0
10,000
20,000
30,000
40,000
50,000
60,000
..0-4 ..5-19 ..20-44 ..45-64 ..65-84 ..85+
Age
Po
pu
lati
on
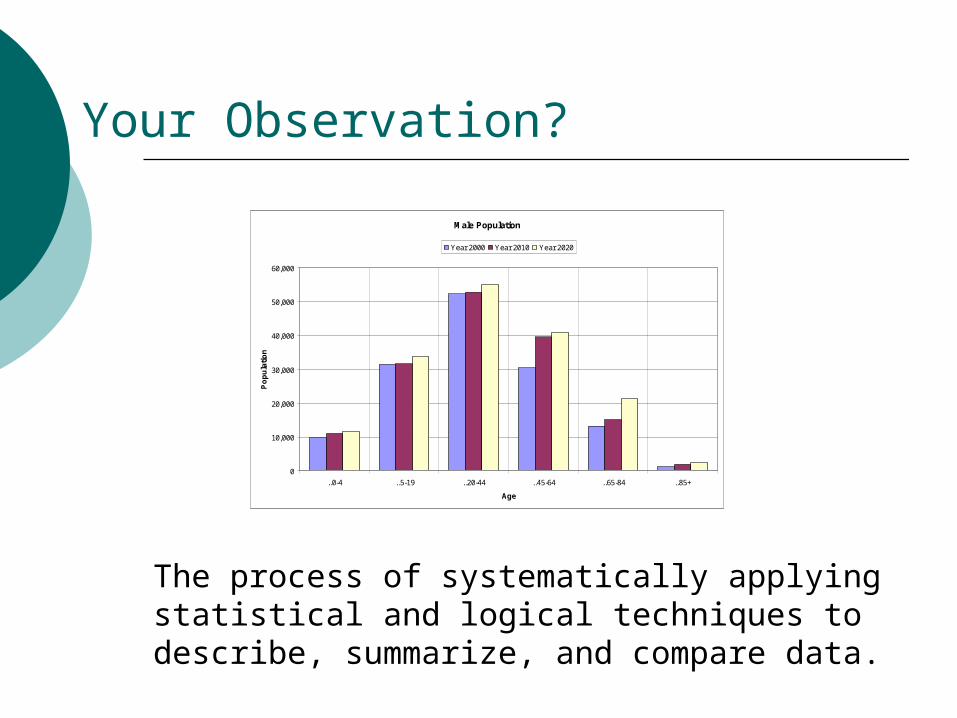
Your Observation?
Male Population
0
10,000
20,000
30,000
40,000
50,000
60,000
..0-4 ..5-19 ..20-44 ..45-64 ..65-84 ..85+
Age
Po
pu
lati
on
Year 2000 Year 2010 Year 2020
The process of systematically applying statistical and logical techniques to describe, summarize, and compare data.
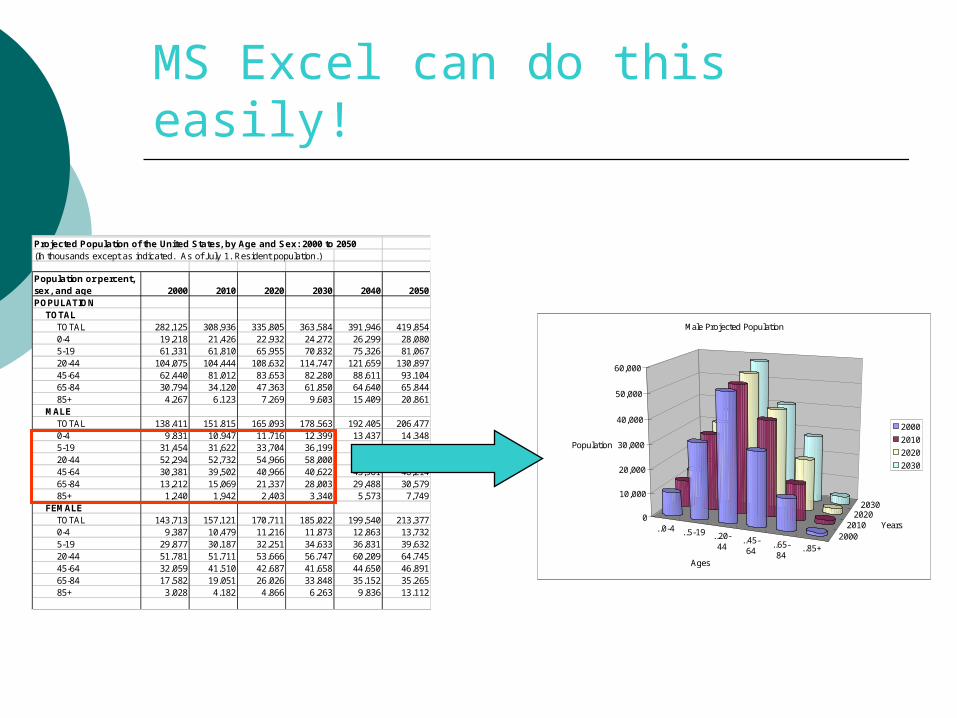
MS Excel can do this easily!
Projected Population of the United States, by Age and Sex: 2000 to 2050(In thousands except as indicated. As of July 1. Resident population.)(leading dots indicate sub-parts)
Population or percent,sex, and age 2000 2010 2020 2030 2040 2050POPULATION
.TOTAL..TOTAL 282,125 308,936 335,805 363,584 391,946 419,854..0-4 19,218 21,426 22,932 24,272 26,299 28,080..5-19 61,331 61,810 65,955 70,832 75,326 81,067..20-44 104,075 104,444 108,632 114,747 121,659 130,897..45-64 62,440 81,012 83,653 82,280 88,611 93,104..65-84 30,794 34,120 47,363 61,850 64,640 65,844..85+ 4,267 6,123 7,269 9,603 15,409 20,861
.MALE..TOTAL 138,411 151,815 165,093 178,563 192,405 206,477..0-4 9,831 10,947 11,716 12,399 13,437 14,348..5-19 31,454 31,622 33,704 36,199 38,496 41,435..20-44 52,294 52,732 54,966 58,000 61,450 66,152..45-64 30,381 39,502 40,966 40,622 43,961 46,214..65-84 13,212 15,069 21,337 28,003 29,488 30,579..85+ 1,240 1,942 2,403 3,340 5,573 7,749
.FEMALE..TOTAL 143,713 157,121 170,711 185,022 199,540 213,377..0-4 9,387 10,479 11,216 11,873 12,863 13,732..5-19 29,877 30,187 32,251 34,633 36,831 39,632..20-44 51,781 51,711 53,666 56,747 60,209 64,745..45-64 32,059 41,510 42,687 41,658 44,650 46,891..65-84 17,582 19,051 26,026 33,848 35,152 35,265..85+ 3,028 4,182 4,866 6,263 9,836 13,112
Table with row headers in column A and column headers in row 5. Population numbers start in row 6, percent of total population starts in row 32.
..0-4 ..5-19 ..20-44
..45-64
..65-84
..85+2000
20102020
2030
0
10,000
20,000
30,000
40,000
50,000
60,000
Population
Ages
Years
Male Projected Population
2000
2010
2020
2030

Due Next Monday
Personal Information Form First Homework