Embed Size (px)
Citation preview

0
The information contained in this document belongs to Grupo Los Grobo and to the recipient of the document. The information is strictly linked to the oral comments which were made at its presentation, and may only be used by attendees of that presentation. Unauthorized copying, disclosure or distribution of the material in this document is strictly forbidden and may be unlawful.
CONFIDENTIAL
Welcome toGrupo Los Grobo
1
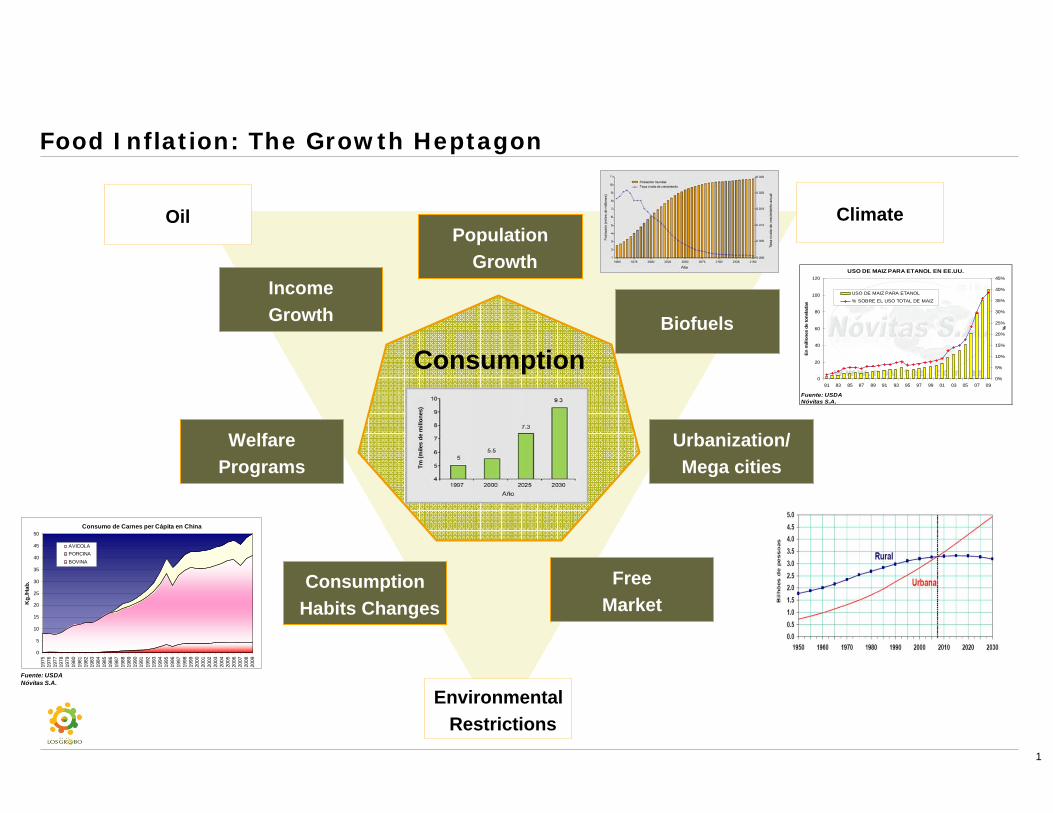
Food Inflation: The Growth Heptagon
ClimateOil
Environmental Restrictions
Biofuels
Urbanization/ Mega cities
Free Market
Consumption Habits Changes
Welfare Programs
Income Growth
Population Growth
Consumption
consumo per cápita
Fuente: USDANóvitas S.A.
Consumo de Carnes per Cápita en China
0
5
10
15
20
25
30
35
40
45
50
1975
1976
1977
1978
1979
1980
1981
1982
1983
1984
1985
1986
1987
1988
1989
1990
1991
1992
1993
1994
1995
1996
1997
1998
1999
2000
2001
2002
2003
2004
2005
2006
2007
2008
2009
Kg.
/Hab
.
AVICOLAPORCINABOVINA
Pob
laci
ón (m
iles
de m
illone
s)P
obla
ción
(mile
s de
millo
nes)
Fuente: USDANóvitas S.A.
USO DE MAIZ PARA ETANOL EN EE.UU.
0
20
40
60
80
100
120
81 83 85 87 89 91 93 95 97 99 01 03 05 07 09
En m
illon
es d
e to
nela
das
0%
5%
10%
15%
20%
25%
30%
35%
40%
45%
%
USO DE MAIZ PARA ETANOL
% SOBRE EL USO TOTAL DE MAIZ
Tm (m
iles
de m
illon
es)

2
Food Inflation: The Solutions
Area
Yield
Infra Structure
Institutional Framework
Demand
• Innovation through Biotech and Operational Technology Improvements
• New generation of Fertilizers / The water challenge
• New Areas through environmental sustainable processes
• Improvement of Actual Areas
• In Land Logistics (Railways, Roadways, Warehouses)
• Ports and Ships
• Improvement of Local and Trading Institutional Framework
• High Quality Organizations
• Change in Consumption Habits
• Biofuels Efficiency

3
It is expected that 50% of agricultural growth takes place in MERCOSUR
2
4
5
2 4
2
6
13
35
50%of total growth
Forecasted production growth
Source: Based on OECD-FAO projections.
• Only 3% of the world land is suitable for agriculturewithout irrigation
• Growing urbanizationprocess in Emerging Countries
• Water shortage in different places in the world
• Desertification and land degradation
• MERCOSUR is the region with the highest growth potential to meet demand

4
100 years of agricultureCereals and oilseeds produccion in tons
0
10.000.000
20.000.000
30.000.000
40.000.000
50.000.000
60.000.000
70.000.000
80.000.000
90.000.000
100.000.000
1900
/01
1903
/04
1906
/07
1909
/10
1912
/13
1915
/16
1918
/19
1921
/22
1924
/25
1927
/28
1930
/31
1933
/34
1936
/37
1939
/40
1942
/43
1945
/46
1948
/49
1951
/52
1954
/55
1957
/58
1960
/61
1963
/64
1966
/67
1969
/70
1972
/73
1975
/76
1978
/79
1981
/82
1984
/85
1987
/88
1990
/91
1993
/94
1996
/97
1999
/00
2002
/03
2005
/06

5
0
2.000
4.000
6.000
8.000
10.000
1914
1917
1920
1923
1926
1929
1932
1935
1938
1941
1944
1947
1950
1953
1956
1959
1962
1965
1968
1971
1974
1977
1980
1983
1986
1989
1992
1995
1998
2001
2004
2007
Carne (miles de tn) Leche (millones de lt)
Milk and meat production. 1914-2008in millions of tons, and millons of litres

6
0
50
100
150
200
250
300
1990 2000 2010 2019
MERCOSUR is today the largest soybean producerMillions of tn.
World’s soybean production
• Brazil and Argentina are the main producers in the MERCOSUR
• US and Canada rate of growth decreases, as farmland is scarcing
• The rest of the world is not suitable for high yield agriculture
CAGR* Share of total production by 2019
50%
36%
14%
Source: Oilworld.* CAGR: Compound Average Growth Rate.
+6.2%
+4.2%
+2.4%
+8.1%
+3.0%
+2.8%
+3.6%
+0.6%
+2.1%
US + Canada
MERCOSUR
Rest of the world

7
Food Supply: The Big Change
World Soybean Complex Net Exports
14%
56%
Argentina
USA
23%Brazil
8%Others
31%
29%
Argentina
33%
Brazil
USA7%
Others
1983/84 - 87/88 2003/04 - 07/08
Total: 47 million tons Total:120 million tons

8
Technology: Growth in Adoption Speed
New Technology Adoption in Pampean Agriculture – 1980/2000
GMO
Pesticides
Direct seeding
Fertilizers
PrecisionAgriculture
Silo bags
Inoculants
Tech
nolo
gy a
dopt
ion
by fa
rmer
s (%
)

9
A highly scalable model allowed GLG to become one of the largestLatAm agribusiness players in less than a decade, establishing a solid track record of organic and M&A growth
RevenuesPlanted area
Regional Leader Internationalization New Growth Era
Thousands of ha., Millions of USD
Development of a strong origination network divided into three separate business units:- Origination- Input Retailing- Agricultural Production
First agribusiness company to obtain the ISO 9001 certification
Knowledge exchange program with the Texas A&M University and Universidad de Buenos, first Los Grobo Case published
Expansion to Uruguay with creation of Agronegocios del Plata Launching of Los Grobo SGR* leverages the network’s financing potential
Expands to Paraguayby founding Tierra Roja
Los Grobo Group becomes a Harvard Business School Case Study
Transaction with Vinci Partners opens the door to Brazil
Rapid growth in Brazil- Partnership with Ceagro- Acquisition of Selecta (Brazil) - Sponsorship of Sollus Capital
Acquisition of UPJ (Argentina)
240
691
246
116
172
154
267
173
557
104
138
Los Grobo Agropecuaria S.A. is founded by Adolfo Grobocopatel
773
1,058
263
280
1,305
Mutual guarantee society.*
2004200320001990’s1984 2009 20102006 2007 20082005 2011 2012E
Today GLG is one of the largest grain producers and
service providers in Latin America

10
Grupo Los Grobo is present throughout the agribusiness value chain
Production Services Processing
• Development of geographically diversified portfolio of farms
• Applying modern techniquesto crops production…
• …focusing on:- Maximizing yields in the
selected fields while…- …reducing yield volatility…- … generating better risk
adjusted returns
• Adding value to our grain origination network by integrating downstream activities:- Wheat milling on a regional scale…- …combined with a state-of-the-art
dried pasta plant- Soybean deactivation facilities in
Brazil
• Supply of agricultural inputs to local farmers…
• …as well as financial services such as: - Grain commercialization- Hedging
• Supply of warehousing and logistic services
• Leveraging its potential through GLG network

11
Grupo Los Grobo property framework2010
Shareholders Structure
Vinci PartnersGrobocopatel family
A brief description
Grobocopatel family• More than 90 years of agribusiness experience• In 1984 Adolfo founded Los Grobo Agropecuaria composed by 4
employees and 3k ha and became a Professional company at the first half of the 90’s decade, managing today more than 1K employees
• Under Gustavo´s management, Los Grobo was the first agro company in the world to obtain the ISO 9001, becoming also a Harvard Business Case, farming in more than 260K ha
Vinci Partners• One of the most successful history in private equity in Brazil• Started as an investment vehicle of Banco Pactual´s former partners
- Pactual was the largest investment bank in Brazil and one of the largest Asset Managers…
- …sold to UBS for US$ 3.1Bn in 2006• Vinci is Partners is one of the main shareholder of:
- PDG Realty, the largest real estate company in Brazil by market cap- Equatorial Energia, a leading Brazilian energy company- Ethanol business in Brazil through CMAA - The retail /fashion business through InBrands
Local partners• Paulo Fachim, partner in Brazil, founded Ceagro in 1994, and has more
than 20 years of experience in the Brazilian agricultural market• Marcos Guigou, partner in Uruguay, founded ADP in 2004, and has over 16
years of experience in agribusiness
22%78%
100% 100% 100% 65% 100% 100%
59,5%

12
Grupo Los Grobo: One of the largest agribusiness producers and services provider in South America
Regional Presence
2011/12, Thousands of ha., Millions of tn.
Own Planted Area
CAGR*
Brazil:
Production Area: 56k haInput Sales: US$ 122 mmGrain Origination: 680K tnCrushing: 540 tn/day
Argentina:
Production Area: 115k haInput Sales: US$ 72 mmGrain Origination: 1,810k tnCrushing: 735 tn/day
Uruguay:
Production Area: 92k haInput Sales: US$ 35 mmGrain Origination: 400k tn
Paraguay:
Production Area: 16k haGrain Origination: 50k ton
Total:
Production Area: 280k haInput Sales: US$ 229 mmGrain Origination: 2,9 mm tnCrushing: 1,275 tn/day
Grain origination
* CAGR: Compound Average Growth Rate.
73%
27%
2006/07
1,5
2009/10
72%
2,0
28%
2,7
76%
24%
67%
33%
2004/05
0,7
65%35%
22%
2007/08 2008/09
78%
1,9
2005/06
26%
74%
1,10,9
27% Own
73%
2011/12E
2,9
2010/11
Clients
19%
121
28%
2007/08
18%
25%
48%
14%
51%
7%
2005/06
9%
2006/07
178141
50%
Wheat
CornOthers
Soybean
5%12%
22%
263
52%
7%
2010/11
67%
16%
66%
21%6%7%
2009/10
24715%
2011/12E
2807%
2008/09
245
59%
18%
12%
49%
28%29%10%
2004/05
15%7%
105
Areas where GLG has an active presence
UruguayArgentina
Brazil
Paraguay
MAPITO
GOMG
BA
Brazil
MT

13
GLG in numbers: fast growth leveraged on acquisitions Acquisitions
Revenues
Millions of USD
Note: Revenues and EBITDA 08/09 in accordance to IRFS as of 30/04/09; Revenues and EBITDA 09/10 in accordance to IRFS as of 30/04/10.
CAGR*
* CAGR: Compound Average Growth Rate.
26%
19%1%7%
2007/08
557.3
48%
21%
19%2%11%
2006/07
267.1
67%15%2%16%
171.5
69%17% 2%
12%
2004/05
138.1
79%
2005/06
1%9%
2009/10
664.6
17% 4%
2003/04
96.7
75% 21%4%
2011/12E
TRIndustrial
LGA
UPJ
2010/11
1,058.5
31%
Ceagro
ADP
27%
35%
16%+38%
6%
39%
17%2%
9%
2008/09
8%
772.8
41%
6%
10%1%
14%
31%
8%
35%
1,305.3

14
Grain production is on the rise, expanding to new geographies
19%
33%
6%
2009/10
246.9
36%
1%20%
37%
6%
2008/09
244.6
49%
1%13%
30%
7%
2007/08
178.0
68%
22%9%
2006/07
141.3
80%
20%
2005/06
120.7
81%
19%
+15%
LGA
UPJ
Ceagro
ADP
TR
2010/11
262.8
40%
2%
6%
33%
2011/12E
1%20%
3%
38%
279.7
Thousands of ha., % CAGR*
* CAGR: Compound Average Growth Rate.
• GLG has focused it expansion in new geographies…• … and improvement of the revenues mix in each country…• … leveraging on experience exchange between managers and companies
GLG managed production (ha.)

15
GLG focus on service provision, leveraged on its own production, will grow as local commercial links matureMillions of tn., Millions of USD
15%
2008/09
142.3
37%
7%
35%
21%
2007/08
119.9
39%
36%
17%+42%
206.9
UPJ
LGA
ADP
Ceagro
22%
2010/11
54%
7%
28%
2005/06
28.3
75%
25%
2006/07
25%
36.7
72%
2009/10
158.1
18%6%
61%
2011/12E
16%
53%
7%
25%
228.7
Note: Revenues and EBITDA 08/09 in accordance to IRFS as of 30/04/09; Revenues and EBITDA 09/10 in accordance to IRFS as of 30/04/10.
CAGR*
* CAGR: Compound Average Growth Rate.
• While Argentina is intensive on grain trading…• …Brazil is focused on agricutltural inputs distribution
Grain traded Agricultural inputs distribution
50%
ADPTR
2010/11
+18%
LGA
UPJ
Ceagro
0%0%
0%0%
0% 12%
22%
14%
1%
2009/10
2.4
49%
9%
20%
21%
1%
2008/09
1.9
52%
8%
19%
20%1%
2007/08
1.9
74%
11%
13%2%
2006/07
1.5
87%
13%
2005/06
1.1
89%
11%
2.7
0%0%
2%
14%
23%
11%
51%
2.9
2011/12E

16
Leveraging the company’s through a vast regional network of storage capacity2011, Thousand of tn.
156.0
38%
62%
339.673%
9.5
27%
481.011%
986.175% 25%
89%
OwnRented
Total storage capacity per country
Total storage capacity
• GLG relies on asset light strategies when possible…
• …renting 39% of storage capacity
• Brazil has rapidly become the company’s main storage capacity country (54%)
More than 50 storing facilities
spread over 4 countries

17
…where export logistics are key
Uruguay
ArgentinaChile
Brazil
Venezuela
Peru
Bolivia
Paraguay
MAPI
TO
MTGO
MS
PR
MG
Colombia
BA
Ponta da Madeira/MA, BR
Ponta da Madeira port:Loading Rate: 2 k mt/h.Draft: 15 mExpectable Line up: no line up (only by rain).Access: Only railway.
Paranaguá/PR, BR Paranaguá port:Loading Rate: 3 k mt/h.Draft: 12 mExpectable Line up: 15 days (plus rain).Storage Capacity: 65 k mtAccess: mainly truck. 1 railway
Santos/SP, BR Santos port:Loading Rate: 2 k mt/h.Draft: 13 mExpectable Line up: 15 days (plus rain).Access: truck and 3 railways
Lima (up river)Loading Rate: 1,5 k mt/h.Draft: 9 mExpectable Line up: 2 daysAccess: truck.
Nueva Palmira, UYNueva Palmira port (up river)Loading Rate: 1,5 k mt/h.Draft: 9 mExpectable Line up: 7 daysAccess: truck. 1 railway
Necochea, ARNecocheaLoading Rate: 1,5 k mt/h.Draft: 12 mExpectable Line up: 15 days (plus rain)Access: truck. 1 railway
Bahia BlancaLoading Rate: 1,5 k mt/h.Draft: 13 mExpectable Line up: 15 days (plus rain)Storage Capacity: 100 k mtAccess: truck. 1 railway
Bahia Blanca, AR

18
GLG collects awards, attesting our track record by external evaluations
InstitutionAwardedYearAwards
Top 34 agribusiness company in Brazil 2010 Ceagro Exame Magazine
Best "Corporate Citizenship" in “large company category” for sustainable management 2009 Los Grobo Agropecuaria The American Chamber of Commerce in Argentina (AMCHAM)
Top 50 Companies to work for in Argentina and Top 20 in Uruguay 2009 Los Grobo Agropecuaria and Agronegocios del Plata Great Place To Work (ARG)
Top 150 place to work and made into 500 best companies charts 2009 Ceagro Revista Exame
Readers Choice Award: "Best Sustainability Report" 2008 Fundación Emprendimientos Rurales Los Grobo Global Reporting Initiative (GRI)
Award to Excelence 2008 Los Grobo Agropecuaria América Economía Magazine
Enviromentally responsible company of the year 2008 Los Grobo Agropecuaria Institute for Enviromental Research at UCES (ARG)
Creative award “Diente 2007” 2007 Los Grobo Agropecuaria Círculo de Creativos Argentinos (Publicist Organization)
1st Place in CSR survey organized by the magazine “Valor Sostenible" 2007 Los Grobo Agropecuaria Valor Sostenible Magazine (ARG)

19
Committed and experienced management team, fully aligned through a long term SOP program
Years
AgribusinessCompany Executive Position Experience
Gustavo Grobocopatel Chairman
• Founder and leader of GLG• More than 25 years of experience in the industry, has been awarded a Honor
Mention at the Argentine Senate and a recognized as the agribusiness entrepeneur of the decade with the Konex Platinum Award
• Graduated as an Agronomy Engineer at Universidad de Buenos Aires
Horacio Busanello
Chief Executive
Officer
• Joined GLG in 2011 as Regional COO and LGA CEO• Have worked all his life in top agribusiness companies such as Monsanto, Seneca
and Syngenta at top management positions• CPA with postgraduate courses at INSEAD and Harvard
Antonio Neto
Chief Financial Officer
• In 2008 Mr. Oliva Neto Joined Vinci Partners team and been appointed to be CFO at Los Grobo Brazil, becoming CFO at the group recently
• Mr. Oliva has 13 years career with corporate finance, working in financial institutions • Major in economics by Pontificia Universidade Católica de Rio de Janeiro (PUC-RJ)
and holds an MBA in Corporate Finance by IBMEC
GerardoBurriel
CEO LGA Argentine Division
• Mr. Burriel has been a key commercial manager for the company since it’s professionalization process began in the early 90’s, becoming CEO in 2011
• He holds several postgraduate courses in agribusiness and management by both the Universidad de Buenos Aires and Universidad de San Andrés
Paulo Fachin
CEO Ceagro
Brazilian Division
• Founded Ceagro in 1994• Strong entrepreneurship capacity, named Entrepeneur of the Year by the City of
Balsas Chamber of Commerce and Industry• Over 20 years in agricultural production
Marcos Guigou
CEO ADPUruguayan Division
• Founded ADP in 2004• Second largest soybean producer in Uruguay• Several years of experience in agricultural production, being awarded one of top 100
most influential people in Uruguay
Elena Morena
DirectorIndustrial Division
• Joined GLG in 2005, having worked for 8 year at Pioneer, the international seed company
• Graduated as a Business Administrator at Universidad de Buenos Aires
25 25
3 3
17 17
2 20
5 16
8 16
1 25

20
GLG capital is fully invested in farming and services development leading to superior returns
• Quality management model• Intensive technology use• State-of-the-art planting
techniques• Continuous innovation
• Partnerships with local agribusiness leaders
• Local management• Decentralized micro decision taking• Deep insights on clients
• Asset light (100% leased land and machinery)
• Focus on services and production• Active interaction with local producers• Creation of ecosystem in the region
Network model
Local knowledge
Risk management
Quality / Innovation
Geographic diversification
Integration
• Strict policies designed at board level
• Price and foreign exchange hedging
• Climate risk control• Credit limits
• State of the Art land operator• Relevant additional revenues
through services• Leverage the company’s
market knowledge
• Second largest player in LatAm,with planted area of 273k ha
• Operations in 4 countries diversifying crops risks

21
Season
Production philosophy
Type of crops
2009/2010
27% 31% 28% 31% 21%
12% 13% 13% 17% 20%
7%9%7%8%10%
51%
2005/06
48%
2006/07
52%
2007/08
44%
2008/09
52%
2009/10E
OthersCornWheat
Soybean
• GLG geographical diversification and…• …positioning in different weather areas…• …are key to take advantage of year round
seasons…• …allowing two harvests per year
59% Summer
41%Winter
0%
5%
10%
15%
20%
25%
30%
35%
0% 5% 10% 15% 20% 25% 30%
RS
GO
MS
MAPR
GOMT
MAPR
10Y
Yiel
d Vo
latil
ity
Gross Margin
Integration
• GLG specializes in non perennial crops, meaning…
• ...crops with a 100 to 180 days that after harvesting requires re-seeding…
• … increasing flexibility of crops…• …with a large portion being soybean,
wheat and corn
• GLG follows a strict risk-reward philosophy…
• …analyzing locations not only on a profit basis, but adjusting it for actual risks…
• …which combined with our scale and diversification allows GLG to choose the best risk-reward sites for production
GLG specializes in non-perennial crops, active year round following a strict risk-reward philosophy

22
GLG has a one-stop-shop service concept that generates cash inflows all year round Integration
Wide portfolio of services offered…
…available all year round
J F M A M J J A S O N D J F M A M J J A S O N D J
Summer I Growing Harvest Commercialization
Winter I Inputs buying Planting Growing Harvest Commercialization
Summer II Inputs buying Planting Growing Harvest Commercialization
Crop season planning
Technical decisions Inputs combo Planting Harvest Grain sale
• Los Grobo provides technical expertise and other consulting servicesto other agricultural producers
• Over 120 Specialists on Field
• Research and seed tests
• Over 10 fields dedicated to research
• Los Grobo’s trading desk and hedging services leverage the company’s market knowledge
• Comprehensive logistic network, providing transportation and storage solutions
• Sale of own and third party productionsecuring improved scale
• Input acquisition for Los Grobo and all partners resulting in economies of scale and appropriate soil treatment…
• …providing also financing to farmers
• Constant crop monitoring and advising to farmers

23
GLG is present in three different climate regions, which combined with crop diversification, reduces yield risks
Based on company research of soybean yields
Brazil
MAPI
TO
MTGO
MG
BA
Argentina
Paraguay
Uruguay
Brazil
Tropical dry or savanna climateHumid subtropical climateMaritime Temperate climate
Regional presence allows… …reduces risks…lower climate correlation which…
Argentina Uruguay Paraguay Brazil
Argentina
Uruguay0.44
Paraguay-0.10 0.26
Brazil-0.04 0.12 0.19
• Low yield correlation between the countries Los Grobo…
• …has presence brings a portfolioeffect both to Own Productionand also to Services Business
• Diversification through different production cycles, as shown in the previous chart, generates a cash flow stream for the company less risky and seasonal
Geographical diversification
Areas where GLG has an active presence

24
Different cost structures between countries improves GLG exposure to different assets Geographical
diversification
7% 10% 11% 9%
15% 9% 10% 12%
22%
5%17% 16%
19%45%
32% 28%
6%11% 5% 9%
22%10% 14% 15%
9% 10% 11% 11%
Grain
Grain
Grain
US$
US$
Local currency
Local currency
Brazil Argentina Uruguay Paraguay
Land Lease
Harvest
Seeds
Chemicals
Fertilizer
G&A
Labor/machinery
Inputs
1,237 794 895 705Cost US$/ha=
• There are significant cost/ha differences throughout countries
• Land lease cost, ranging from 19% in Brazil to 45% in Argentina for soybean production, while…
• …Inputs range from 24% in Argentina, being larger in Uruguay and...
• …particularly higher in Brazil where inputs stand for 44% of total cost production
Soybeans Main exposureCost item
USD/ha.

25
GLG applies state-of-the-art technology to produce grains in both, the field and the office… Quality /
Innovation
• Crop rotation ensures higher productivity in the long run• Appropriate fertilizer utilization• Environmentally conscious crop disease control• No-tillage seeding approach
- Optimization of water use efficiency- Improved fertility of soil chemistry and physics- Increased soil biological activity- Protection from exogenous factors (erosion by wind
and water)• Precision Agriculture
- Measures soil characteristics within a 5Ha grid...- …combined with high technology machinery, allows
for optimal fertilizer application
Superior field technology
• 1st Agribuisness company ISO-certified in the world• In-house developed GroboSoft System, allows
management of production network with superb quality standards
• Process and Technology Support- Ceres modeling allows optimization of fertilization- RISK modeling for budgeting, simulating over 5,000
different scenarios through Monte Carlo - Agroecoindex generate KPIs that measure our
relationship with the environment
Process management and IT Support
Corn 1st CropSoybean
Wheat2nd Crop Soybean
Crop rotation diagram Precision agriculture render
Volver al inicio Ayuda
Establecimiento Los Grobo Agrop Teléfono Localidad CONSOLIDADOPropietario LG Prod. Predominante Provincia Buenos Aires
Año de evaluación 2006 Período Evaluado Ecorregión Pampa Ondulada - Buenos Aires
Indicador 0 71.986 % Porcentaje de cultivos anualesIndicador 1 9483.636 Mj/ha/año Consumo de energía fósilIndicador 2 0.181 Mj EF/Mj prod. Eficiencia de uso de la energía fósilIndicador 3 -1.184 kg/ha/año Balance de NitrógenoIndicador 4 -2.084 kg/ha/año Balance de FósforoIndicador 5 0.000 mg/l Riesgo de contaminación por NIndicador 6 0.000 mg/l Riesgo de contaminación por PIndicador 7 1772.625 Indice relativo Riesgo de contaminación por plaguicidasIndicador 8 5.197 ton/ha/año Riesgo de erosión hídrica y eólicaIndicador 9 0.016 Indice relativo Riesgo de intervención de hábitat
Indicador 10 0.007 ton/ha/año Cambio del stock de carbonoIndicador 11 105.675 ton/ha/año Balance de gases invernadero
Hoja 1 de 2 Panel de Resultados
RESULTADOS02395-459022AGRICOLA2005-2006
Desagregación por Actividades / Potreros
GroboSoft order input screen Ceres modeling wheat fertilization curve
Agroecoindex KPI sheetRisk forecasting result slip

26
…and a 21st Century corporate governance model Quality / Innovation
• General framework…
• …addressing the Millenium Goals of United Nations
United Nations Global
Commitment
Ethics codeArea policies
Coexistence manualEthics committee
Risk map
Resguarda system
Global Reporting
Initiative (GRI)
Board of Directors and External
Auditing
• Corporate governance framework…
• …guaranteeing transparencyof the decisions of the Board of Directors and…
• …preventing frauds
• Management’s internal framework…
• …prevents risks within the organization, under the guidelines of an international standard by Global Compact
• Preemptive and control framework…
• …in line with the Río de Janeiro Declaration (1992) Precautionary Principle
• Communication channel…
• …which is a transparent, confidential and outsourcedclaim management entity open to all stakeholders
• Management and reporting tool…
• …based on a triple bottom line approach to compliment financial reports
Corporate governance

27
Local knowledge is a key asset to GLG business strategy and is carefully cherished and developed at all levels Local
Knowledge
Local management
Deep client knowledge
Local partners
• Operations are usually managed by local people that have deep insights of the area• Approximately 70% of employees are on the country side, having direct contact with the local business
ecosystem, were everyday decision taking is made locally…• …with the coordination of a corporate division…• …overviewed by a board of directors quarterly
• Business practices and culturesare different at micro local level…
• …and GLG thoughtfully studies client characteristics in more than 50 micro regions
• GLG observes variables such as:- Market size (farmers, ha.,
productivity, etc)- Farmer’s financial preferences
and input purchasing habits- Local competition
19%44%
19%
30%19% 20% 27% 24%3%
3%6%
3%
94%
Pamplona
45%
Sete Placas
81%
Campo Lindo
80%
Jatoba
26%
BR050
9%
49%
São Bartolomeu
Banks
Barter
Tradings
Own
Farmer’s financial preferences in Cristalina, Goiás
• GLG acquisition strategy relies in a thoughtful search for local agribusiness leaders…• …that stay after acquisition…• …fully aligned with GLG:
- Paulo Fachim owns 40,5% of Ceagro (Brazil)- Marcos Guigou owns 35% of ADP (Uruguay)

28
The network model generates operational and financial leverage
Wharehouse Los Grobo
Own Production: 5 – 6 k ha
Clients: 10 – 12 k ha
Railway
… and centralizes crop operations
For each hectare Los Grobo utilizes for own production……it intends to provide services for other 2 hectares in the region
Los Grobo operates several mid-size properties……positioning each property as the center of a large network of producers
Los Grobo leases 100% of its land and machinery……immobilizing less capital than the traditional producer
Typical Los Grobo Influence Area
Own Area: 1 / 3
Clients: 2 / 3
Capex NeedsLos Grobo vs. Traditional Producers Example of Los Grobo Network
Provides services for local producers… .... shares resources…
Clients
Leverages on Scale Asset Light Develops the Ecosystem
Network model
Contractor
Land Owner
Traditional Producers
Land
Machinery
InfrastructureInfrastructure
29
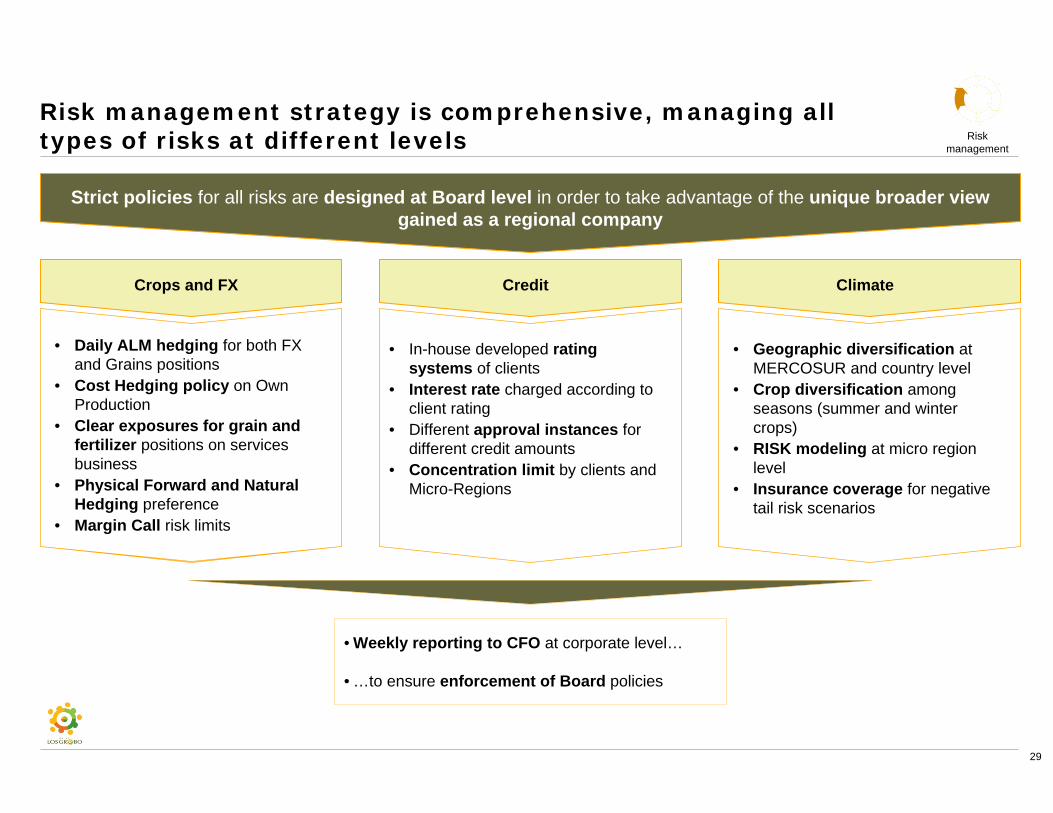
Risk management strategy is comprehensive, managing all types of risks at different levels Risk
management
• Weekly reporting to CFO at corporate level…
• …to ensure enforcement of Board policies
Strict policies for all risks are designed at Board level in order to take advantage of the unique broader view gained as a regional company
• Daily ALM hedging for both FX and Grains positions
• Cost Hedging policy on Own Production
• Clear exposures for grain and fertilizer positions on services business
• Physical Forward and Natural Hedging preference
• Margin Call risk limits
• In-house developed rating systems of clients
• Interest rate charged according to client rating
• Different approval instances for different credit amounts
• Concentration limit by clients and Micro-Regions
• Geographic diversification at MERCOSUR and country level
• Crop diversification among seasons (summer and winter crops)
• RISK modeling at micro region level
• Insurance coverage for negative tail risk scenarios
Crops and FX Credit Climate

30
Grupo Los Grobo is the preeminent vehicle in the Latin American Agribusiness Community
+
+
+
+
+
Integration
Geographic Diversification
Quality / Innovation
Local knowledge
Network Model
Risk management
Organized and scalable growth platform with secure access to key grain production / origination