Embed Size (px)
Citation preview

Welcome to Econ 1
Introduction to Microeconomics
Week 2.2, Tuesday, February 15

Review: Definitions
• GoodGood : is anything that an individual wants to have more of, at zero price.• Resource: Anything that can be used to produce goods.• Scarcity: A good is scarce if the amount desired at zero price is more than the amount available at zero price. •(Scarce good = Economic Good)
Review:AssumptionsReview:Assumptions
• Humankind has unlimited wants
• Our resources are limited
• ScarcityScarcity : Individually, and as a Society, we do not have enough resources to produce all the things we want.

Review:Implications of ScarcityReview:Implications of Scarcity
• ChoiceChoice: people must choose which goods to acquire.
• Economic CostEconomic Cost: The Cost of any action, is the personal value of the next highest valued alternative given-up.

Costs: Economic vs. Accounting
• Accounting Cost: The explicit expenditure for a given activity.
• Economic CostEconomic Cost: The Cost of any action, is the personal value of the next highest valued alternative given-up.
• Economic Cost includes Explicit & Implicit• Sunk Cost: Past expenditures that no
longer represent an alternative (Not a part of Economic Cost)

Review:Implications of ScarcityReview:Implications of Scarcity
• ChoiceChoice: people must choose which goods to acquire.
• Economic CostEconomic Cost: The Cost of any action, is the personal value of the next highest valued alternative given-up.
• CompetitionCompetition: We are in a state of competition for the use of resources

Forms of Competition in SocietyForms of Competition in Society
• ViolenceViolence, , or Threat of Violence
• Social/PoliticalSocial/Political : competition on the basis of some limited behavior or characteristic
• Economic/MarketEconomic/Market: competition based on offering the highest value in exchange.

Scarcity Society Choices
• What to produce? Goal find the mixture of outputs that maximizes society’s value.
• How to produce? Goal: find the optimal mix of inputs to maximize technical output.
• For whom to produce? Who will get to consume the goods produced.

What Economics Is About
• Microeconomics: decisions of individuals and firms: what to buy and what to produce.
• Macroeconomics: the whole economic system and the role of government.

Mechanisms of Choice
• Political: our representatives make choices
• Economic/market: individuals and firms make choices based on relative prices about what to produce

Ten Principles of Economics
• Individual decision making
• How people interact
• The economy as a whole

Individual Decision Making
• People Face Trade-offs: Choice
• Opportunity Cost
• Rational people think at the margins
• People respond to incentives

How People Interact
• Trade Makes everyone better off
• The market system organizes production efficiently
• Markets outcomes can sometimes be improved upon by Government

The Economy as a Whole
• The standard of living depends on productivity
• Inflation results from too much Money
• The short-run trade-off: inflation vrs. unemployment
The Economic/Market Form of Competition

Product Markets
FIRMSHOUSEHOLD
ResourceMarkets
$'s $'s Revenue
$'s Income $'s
Goods &Services
Goods &Services
Resources Inputs
Circular Flow Diagram of the Exchange Economy
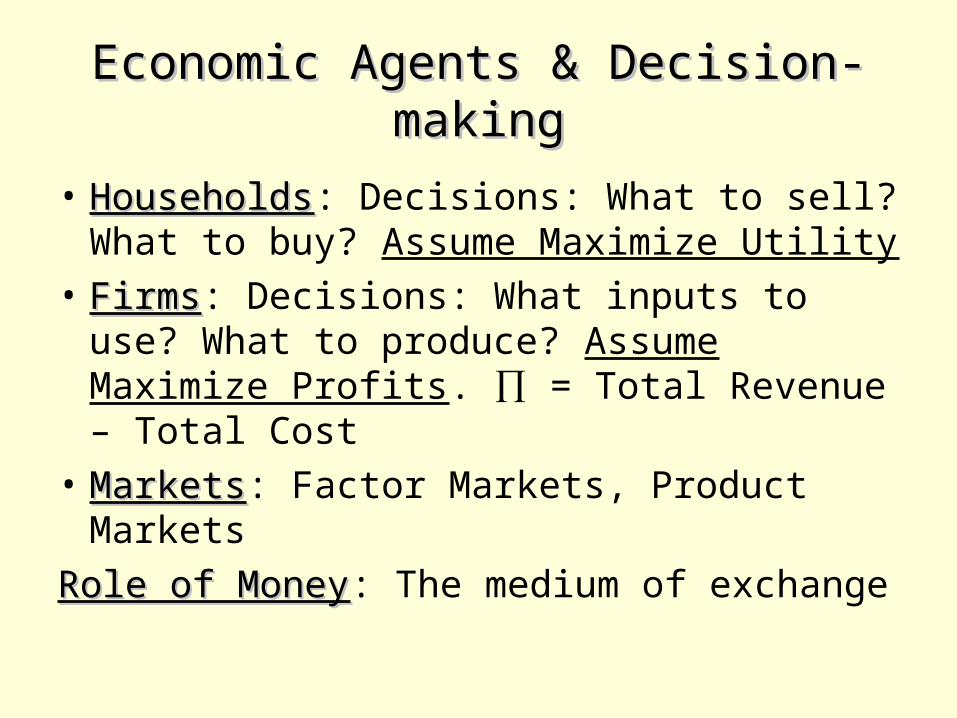
Economic Agents & Decision-makingEconomic Agents & Decision-making
• HouseholdsHouseholds: Decisions: What to sell? What to buy? Assume Maximize Utility
• FirmsFirms: Decisions: What inputs to use? What to produce? Assume Maximize Profits. ∏ = Total Revenue – Total Cost
• MarketsMarkets: Factor Markets, Product Markets
Role of MoneyRole of Money: The medium of exchange

Definition of Money
• Currency in Circulation: Currency outside of Banks in the hands of households,or firms
• Checkable deposits in Banks, Savings & Loans, Credit Unions
Interdependence & the Gains from Trade
(Chapter 3)
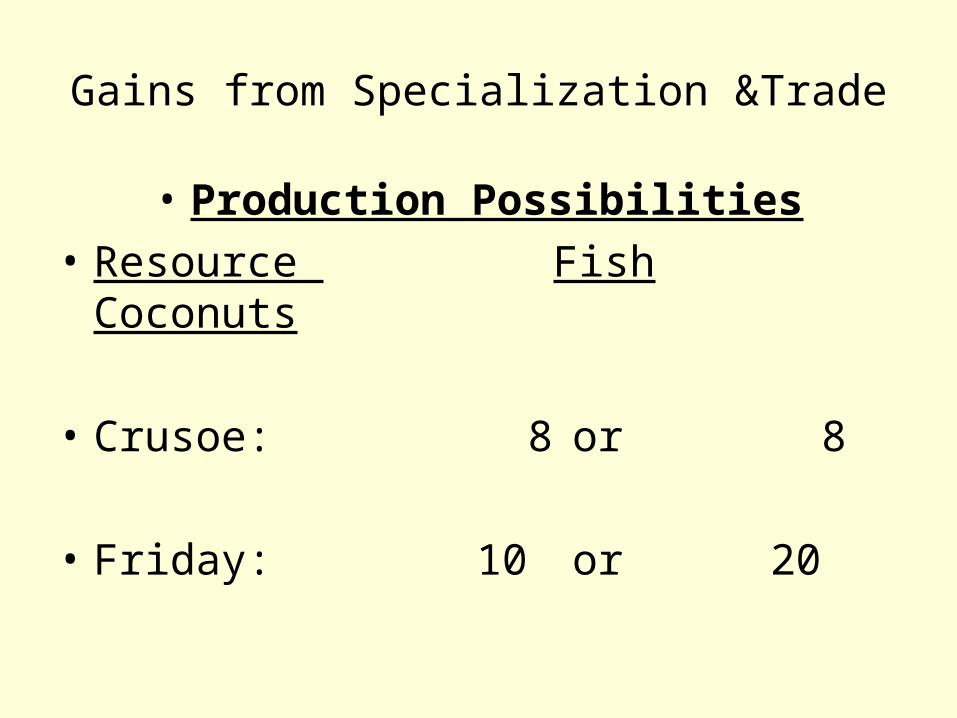
Gains from Specialization &Trade
• Production Possibilities
• Resource Fish Coconuts
• Crusoe: 8 or 8
• Friday: 10 or 20

Opportunity Cost in Production
Crusoe: 8 F = 8 C 1 F = 1C and 1C = 1F Friday: 10 F = 20 C 1 F = 2C and 1C = ½ F Thus Crusoe has a comparative advantage in the production of fish ( 1F = 1C) and Friday has a comparative advantage in the production of Coconuts ( 1C = ½ F)
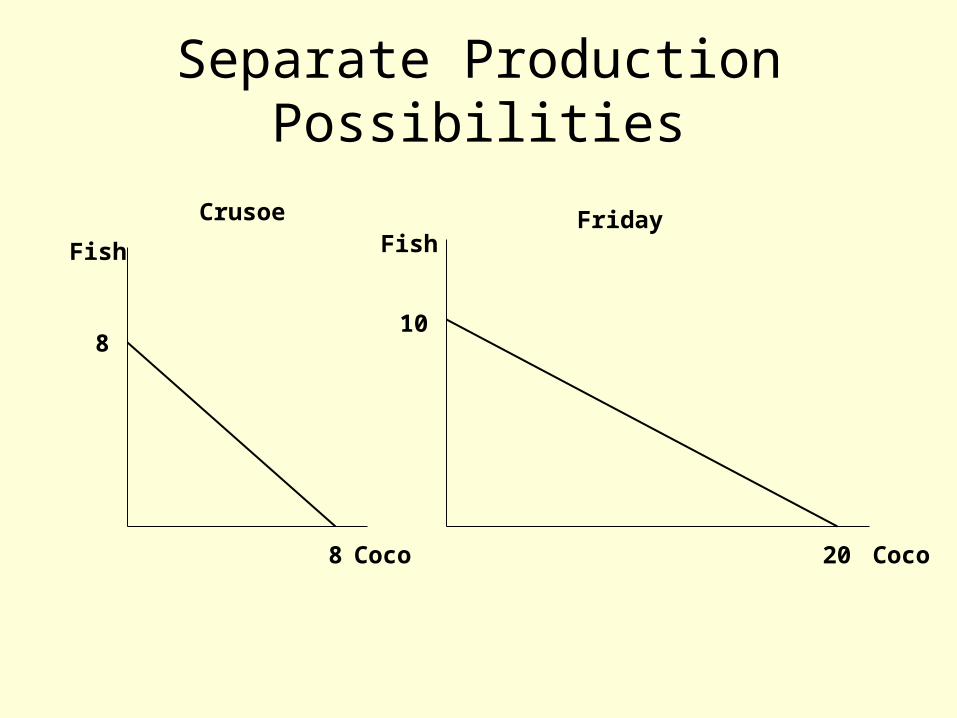
Separate Production Possibilities
Crusoe FridayFish Fish
Coco Coco
8
8
10
20

Pre-Specialization Production
• Resource Fish Coconuts
• Crusoe: 4 and 4
• Friday: 5 and 10
• Total Output: 9 and 14
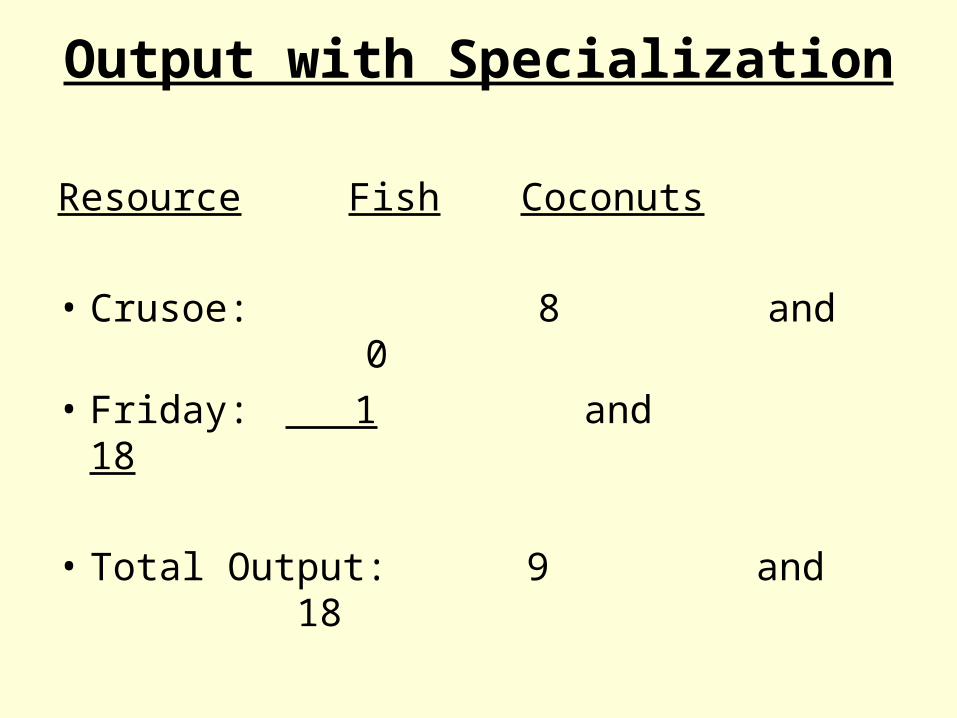
Output with Specialization
Resource Fish Coconuts
• Crusoe: 8 and 0
• Friday: 1 and 18
• Total Output: 9 and 18

Results of Specialization• No increase in Resources
• No increase in effort
• Increased output by 4 coconuts
• Increased output will be shared by the two people or countries so as to make both better off

Apply Reasoning to more than two Resources
• Analyze production decisions using several resources with different relative abilities
• How to organize production to maximize output
• The graphical technique

Graph: Production Possibilities Function
Assumptions:
1. Fixed resources: 10 acres in rows.
2. Fixed technology: current knowledge of how to produce.
3. Resources vary in relative productive ability.
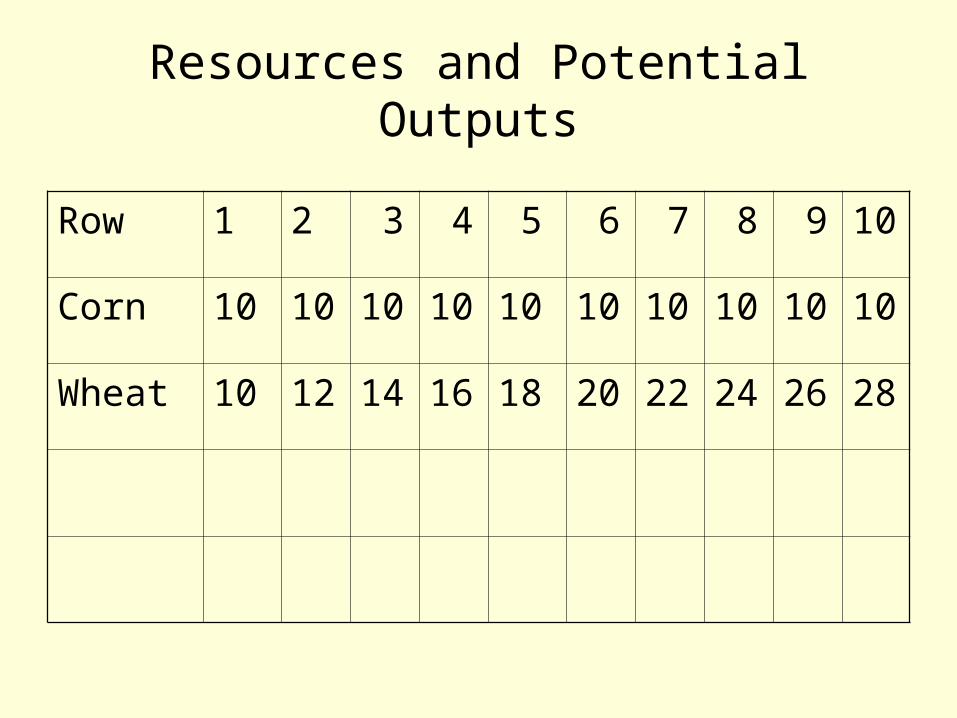
Resources and Potential Outputs
Row 1 2 3 4 5 6 7 8 9 10
Corn 10 10 10 10 10 10 10 10 10 10
Wheat 10 12 14 16 18 20 22 24 26 28

Resources and Opportunity Cost
Row 1 2 3 4 5 6 7 8 9 10
Corn 10 10 10 10 10 10 10 10 10 10
Wheat 10 12 14 16 18 20 22 24 26 28
Cost of
1 corn
1.0 1.2 1.4 1.6 1.8 2.0 2.2 2.4 2.6 2.8
Cost of
1 wheat
1.0 .83 .71 .63 .56 .50 .45 .42 .38 .36


Graph MechanicsGraph Mechanics
• The curve divides the space: interior points possible; Points beyond impossible
• SlopeSlope: Rise/ Run: The slope reflects the relationship: Negative, more corn means less wheat, more wheat means less corn
• ShapeShape: The concave shape reflects increasing cost of production for either good.

Changing assumptions Shifts the Curve
• An Increase in resources– Shifts the curve outward
• An increase in technology of Wheat production: Effects on Cost– Lowers cost of producing Wheat– Raises the cost of producing corn