Embed Size (px)
Citation preview

ISSN 2302-786X
Proceeding of Annual South East Asian International Seminar (ASAIS) 2013 i
WELCOME FROM THE ORGANIZING COMMITEE
Assalamualaikum Wr Wb
We pray to Allah SWT for all His grace and gift He has given to us all so that the
International Seminar on the Results of Researches and Community Services can
today be conducted.
This international annual seminar (ASAIS 2013) is aimed to provide a dissemitaion
forum for the results of researches and community services. This is expected to be a
forum for information exchanges, discussion involving many parties: scholars,
practitioners, and government. Interaction among different perspectives could
become a medium to create technology development and sustainability accurately
applicable in industry and society to enhance and support their autonomy in this
modern era.
The ASAIS 2013 Program cover a broad spectrum of topics ranging from
Technology, Commerce and Environment, following the reseachers/authors from
Cambodia, Indonesia, Malaysia, Singapura and Thailand.
We would like to take opportunity to thank all those who have contributed to the
technical program in particular, all the participant for submitting their works and we
hope you enjoy the progam
Finally, we look forward to suggestions and iriticism so that we can carry out the
next international seminar in 2014 better.
Wassalamualaikum Wr Wb
ASAIS 2013 Organizing Commitee

ISSN 2302-786X
ii Proceeding of Annual South East Asian International Seminar (ASAIS) 2013
WELCOME FROM DIRECTOR OF STATE POLYTECHNIC OF
JAKARTA
Assalamu’alaikum Wr Wb,
We pray to Allah SWT for all His grace and gift He has given to us all so that today
we can attend the International Seminar on the Results of Researches and
community Services under the theme of ”Creative industry based research and
community services to encourage community autonomy”, as a basis of knowledge
and research development in higher education, both national and international
which can be conducted by Research and Community Service Center in State
Polytechnic of Jakarta.
The purpose of conducting this seminar is to provide knowledge and concepts
exchange opportunity for multidiciplinary scientists to put forward their
perspectives in national and state problems under the three defined sciences. Beside
that, this forum can also be used to strengthen relationship of researchers from both
national and international institutions.
In this instance we would like to thank:
1. The Minister of Culture and Education of the Republic of Indonesia
2. Prof. Oum Saokosal , NPIC – Cambodia
3. Associate Profesor, Dr. Wipawee Hatagam , Suranaree University of
Technology Nakhon Ratcasima Bangkok
4. Presenters
5. All boards of committee who have made this happens
We hope that this academic activity can be conducted regularly and the spirit of the
research will always sustain and give valuable contribution to the welfare and the
development of the nation.
We thank you and hope you gain valuable benefits from the seminar.
Wassalamu’alaikum Wr Wb,
Jakarta, 12 December 2013
Director of state Polytechnic of Jakarta

ISSN 2302-786X
Proceeding of Annual South East Asian International Seminar (ASAIS) 2013 iii
ASAIS 2013 COMMITTEE
Executive Board
Director of PNJ
Head of P3M PNJ
General Chairs
Dianta Mustopa
Vice Chairs
Anis Rosyidah
Nur Hasyim
Nining Latianingsih
Managing Commitee
Putera Agung Maha Agung
Agus Edi Pamono
Belyamin
Iis Mariam
A. Tossin Alamsyah
Dewi Winarni
Budi Damianto
Gun Gun Ramdlan Gunadi
Ina Sukaesih
Yogi Widiawati
Zainal Nur Arifin
Ade Sukma Mulya
Saeful Imam
Darna
Publication
Zaenal Arifin
Saeful Imam
Mahar Azhari
Administration Staf
Nurmalisna
Dessy
Sugianto
Muji Sutrisno
Contact Address Pusat Penelitian dan Pengabdian kepada Masyarakat (P3M)
Gedung Q, Lantai 2,
Politeknik Negeri Jakarta, Kampus Baru UI Depok,
Tlp. 021 7270036 ext 236,
www.asais-pnj.org; [email protected]

ISSN 2302-786X
iv Proceeding of Annual South East Asian International Seminar (ASAIS) 2013
PREFACE
This proceedings contain sorted papers from Annual South East Asian International
Seminar (ASAIS) 2013. ASAIS 2013 is the second annual international event
organized by Pusat Penelitian dan Pengabdian (P3M) Politeknik Negeri Jakarta
Indonesia. This event is a forum for researchers for discussing and exchanging the
information and knowledge in their areas of interest. It aims to promote activities in
research, development and application on Technology, Commerce and
Environment.
We would like to express our gratiture to all technical commite members who have
given thir efforst to support this seminar. We also would like to express our sincere
gratitude to Higher Education Republic of Indonesia, NPIC Cambodia , Suranaree
University of Technlogy (SUT) Rankon Ratchasima Bangkok Thailand and the
our sponsor National Instrument and, PT. Panairsan Pratama.
Finally we also would to like to thank to all of the keynote speakers, the authors, the
participant and all parties for the success of ASAIS 2013.
Editorial Team.

ISSN 2302-786X
Proceeding of Annual South East Asian International Seminar (ASAIS) 2013 v
TABLE OF CONTENTS
WELCOME FROM THE ORGANIZING COMMITEE ................................................................... i
WELCOME FROM DIRECTOR OF STATE POLYTECHNIC OF JAKARTA .............................. ii
ASAIS 2013 COMMITTEE ............................................................................................................ iii
PREFACE .......................................................................................................................................iv
TABLE OF CONTENTS .................................................................................................................. v
TITLES OF COMMERCE AND ENVIRONMENT PAPER ...........................................................vi
ISSN 2302-786X
vi Proceeding of Annual South East Asian International Seminar (ASAIS) 2013
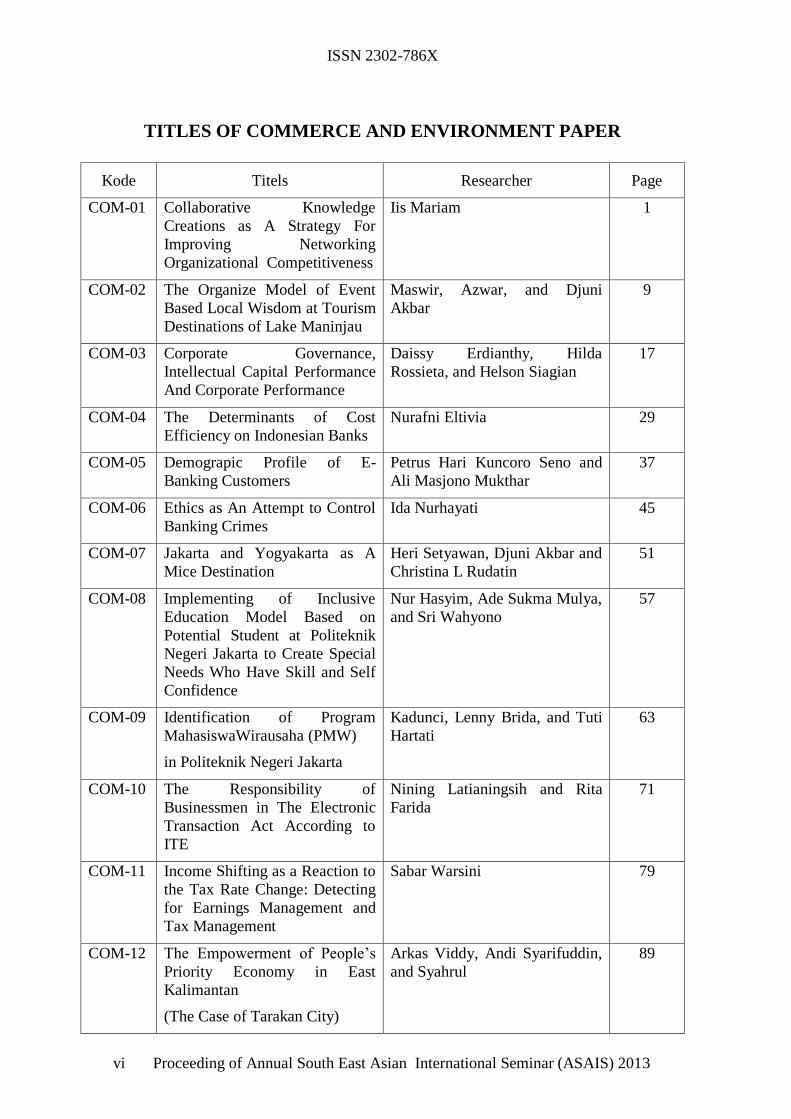
TITLES OF COMMERCE AND ENVIRONMENT PAPER
Kode Titels Researcher Page
COM-01 Collaborative Knowledge
Creations as A Strategy For
Improving Networking
Organizational Competitiveness
Iis Mariam
1
COM-02 The Organize Model of Event
Based Local Wisdom at Tourism
Destinations of Lake Maninjau
Maswir, Azwar, and Djuni
Akbar
9
COM-03 Corporate Governance,
Intellectual Capital Performance
And Corporate Performance
Daissy Erdianthy, Hilda
Rossieta, and Helson Siagian
17
COM-04 The Determinants of Cost
Efficiency on Indonesian Banks
Nurafni Eltivia 29
COM-05 Demograpic Profile of E-
Banking Customers
Petrus Hari Kuncoro Seno and
Ali Masjono Mukthar
37
COM-06 Ethics as An Attempt to Control
Banking Crimes
Ida Nurhayati 45
COM-07 Jakarta and Yogyakarta as A
Mice Destination
Heri Setyawan, Djuni Akbar and
Christina L Rudatin
51
COM-08 Implementing of Inclusive
Education Model Based on
Potential Student at Politeknik
Negeri Jakarta to Create Special
Needs Who Have Skill and Self
Confidence
Nur Hasyim, Ade Sukma Mulya,
and Sri Wahyono
57
COM-09 Identification of Program
MahasiswaWirausaha (PMW)
in Politeknik Negeri Jakarta
Kadunci, Lenny Brida, and Tuti
Hartati
63
COM-10 The Responsibility of
Businessmen in The Electronic
Transaction Act According to
ITE
Nining Latianingsih and Rita
Farida
71
COM-11 Income Shifting as a Reaction to
the Tax Rate Change: Detecting
for Earnings Management and
Tax Management
Sabar Warsini
79
COM-12 The Empowerment of People’s
Priority Economy in East
Kalimantan
(The Case of Tarakan City)
Arkas Viddy, Andi Syarifuddin,
and Syahrul
89

ISSN 2302-786X
Proceeding of Annual South East Asian International Seminar (ASAIS) 2013 vii
Kode Titels Researcher Page
COM-13 The Effect of Strategic
Corporate Social Responsibility
and Competitive Strategy
Against The Relationship
Between Supply Chain
Management and Company
Performance
Titi Suhartati 99
COM-14 Model Development of
Integrated Entrepreneurship
Learning With Based
Internet/Intranet Learning
Management System Applied at
Malang State Polytechnic
Mohammad Maskan, Ahmad
Fauzi, and Ludfi Djajanto
111
COM-15 Evaluation of The
Implementation of Accounting
Entity Without Public
Accountability (Sak Etap) and
Development of Financial
Statements in Micro, Small and
Medium Enterprises (SMEs)
Nedsal Sixpria, Titi Suhartati,
and Sabar Warsini
123
COM-16 Theutilizationof Indonesian
Hedges as Politeness Strategy
Spoken by Academician in
University of Indonesia: A Case
Study of Pragmatics
Yogi Widiawati
131
COM-17 The Development of
Enterpreneurship for Illegal
Migrant Workers in Indonesia
Lenny Brida
139
COM-18 Village Potential Through
Village Tourism
Dewi Winarni Susyanti and
Christina LR
151
COM-19 The Study on Drivers Factors of
Business Development
Activities in Sebatik Island and
Tawau (The Borders Area of
Indonesia and Malaysia)
Besse Asniwaty
, Suminto
M.Nawawi , and Armini Ningsih
155
COM-20 Investments in The Capital
Region to The Regional-Owned
Enterprises (A Case Study of
Equity Participation Kutai
Regency Government to The
Regional Water Company
Indah Martati
167
COM-21 Performance Based Budgeting
Models: Case Study At State
Polytechnic of Malang
Atika Syuliswati
173

ISSN 2302-786X
viii Proceeding of Annual South East Asian International Seminar (ASAIS) 2013
Kode Titels Researcher Page
COM-22 Studying the Significance of
Marketing Category Business
Award on Brand Owner
Companies in Indonesia: The
Implication on Corporate
Reputation and Marketing
Performance
Sylvia Rozza
183
COM-23 Phenomenology Study Towards
Application E-Government
Processon Framework Social
Coqnitive Theory.(Empirical
Study in SatuanKerjaPerangkat
Daerah) Local Government in
Malang
Siti Amerieska
191
COM-24 Communalland Regulation and
Its Relation to Investment
Progress in Padang City
Yosi Suryani and Rudy Rinaldy 199
COM-25 Performance of Kampuang
Bordir Kerancang Bukittinggi
Business Center
Willson Gustiawan, Afifah , and
Gustina
205
COM-26 Implementation Manufacturing
Flexibility and Spanning
Flexibility to Customer
Satisfaction Improvement
Sarwoto
213

COMMERCE AND
ENVIRONMENT

ISSN 2302-786X
Proceeding of Annual South East Asian International Seminar (ASAIS) 2013 1
Collaborative Knowledge Creations as A Strategy For Improving Networking Organizational Competitiveness
Iis Mariam
Lecturer of Business Administration Department - State Polytechnic of Jakarta Jl. Prof. Siwabessy, Kampus Baru UI – Depok
e-mail: [email protected]
Abstract
Innovation in education organizations in facing the challenges of globalization and the development of information technology, learning is a process of knowledge creation , thus supporting the creation of Collaborative Knowledge Creation ( CKC ) to answer " the right knowledge " to " the right people" on " the right time" . Referring to Salisbury ( 2008 ) that different types of knowledge will require different levels of cognitive skill . While Alvarez ( 2012 ) explained that the implementation of CKC in the organization is a requirement in order to survive in the global competition . CKC implementation at the organizational level , knowledge is seen as a commodity , while at the individual or group level , knowledge of a situation or context associated with a personal capacity , according to the interpretation and analysis of the individual . Furthermore Chaternier Du et al , ( 2009 ) describes four phases of implementation CKC , namely : ( 1 ) Externalizing and Sharing , ( 2 ) Interpreting and Analyzing , ( 3 ) Negotiating and Revising , and ( 4 ) Combining and Creating . General purpose of this study is to analyze the learning process is participatory and based culture within the framework of an open system is complicated and complex form of human activity systems ( HAS ) on the organization of the Polytechnic of collaborative knowledge creation ( CKC ) with dual imperative systems approach and borrow Polytechnic Jakarta as a laboratory for the benefit of research interest and problem solving . CKC application of the Polytechnic organization has the same characteristics with the characteristics and advantages as the Polytechnic of higher vocational education . The results showed that all four stages of the CKC ( Externalizing and Sharing , Analyzing and Interpreting , Negotiating and Revising , and Combining and Creating ) can be used in the formulation and development of higher vocational education models and support the implementation of quality improvement Tri Dharma college in the PNJ round -shaped system of human activity which involves several actors and competent authorities , starting from the level of the individual , group , organizational and inter- organizational Polytechnic Polytechnic . Implementation of each phase of CKC in the process of drafting and development of higher vocational education model requires the contribution of each individual role ( Director , Assistant of Directors, Head of Study Program , Head of Unit and lecturer ) , group ( PNJ Chairman , Head of Department, Head of Unit ) , organization ( PNJ and some other Polytechnic in Indonesia) , and inter-organizational ( Polytechnic Director 's Forum , representatives of Higher Education – Ministry of Culture and Education, industry and professional associations ) . Keywords : innovation , collaborative knowledge creation , polytechnics , action research , soft systems methodology . 1. INTRODUCTION Information and communication technology advances very rapidly has become the driving the rapid process of change . The importance of the nation's productivity is expressed by the World Economic Forum which measures the competitiveness of nations through the Global Competitiveness Index ( GCI ) . The WEF explains that there are 12 pillars that determine the GCI . Three of the
12 pillars are the pillars relating to the role of higher education both academic and vocational higher education in improving the GCI . These three pillars are : ( 1 ) institutional ( first pillar ) , (2 ) higher education and training ( fifth column ) , and ( 3 ) innovation ( pillar twelfth ) . Special fifth pillar , the WEF even explicitly states that the fifth pillar of the GCI donations need to be done by strengthening the vocational

ISSN 2302-786X
2 Proceeding of Annual South East Asian International Seminar (ASAIS) 2013
education and apprenticeship training in the rapidly increasing number of Indonesian people are well - educated workers. Knowledge creation within higher education organizations can take place through the creation of products , systems and services that are new or adaptation of a product , system or service that already exists within the organization .
Collaborative knowledge creation ( Hermans and Castiaux , 2007) is one form of the development of knowledge creation in the organization that carried out one or more organizations to cooperate in the field of education and research with industry , enterprises and governments . The importance of the implementation of the notion that opposite CKC concept of knowledge creation Nonaka (1994 ) explanation of the relationship need to be equipped with the individual types and kinds of knowledge that will be created . According to Gourlay (2005 ) in the process of knowledge creation , the role of the individual is more important than the manager's role in decision-making . The question that arises is how the process of Collaborative Knowledge Creation ( CKC ) to enhance cooperation in the PNJ organization ahead of the competition.
2. REVIEW OF LITERATURE In a research -based action research (action research ) conducted in educational organizations basically aims to investigate how a knowledge (knowledge ) created in the organization so as to answer the problem . This study used the theory to solve research problems , namely : ( 1 ) knowledge creation : how the learning process is done using the concept of creating pengetahundengan SECI ( socialization , externalization ,
combination , Internalization ) of Nonaka and Takeuchi ( 1994 ) , ( 2 ) collaborative cognition model ( CCM ) : CCM refers to Salisbury ( 2008 ) is a development of the concept of SECI of Nonaka ( 1994 ) where the growth and dissemination of knowledge become one of the key elements to be a learning organization , then CCM used to show how individual learning and performance in the organization , ( 3 ) collaborative knowledge creation ( CKC ) : CKC concept manajamen emphasize how the process is done in improving the management effectiveness level of each member of the organization's expertise in producing knowledge products organization . CKC created in a process of two or more individuals are exchanged between the stage and the interactive individual stages that produce different types of both exclusive and general knowledge to the group .
According to Du Chaternier et.al. , (2009 ) CKC , divided into 4 stages , namely : ( a) externalizing and sharing : occurs at the group level while producing ' distribute knowledge' . At this stage , professional conduct verbalization and share knowledge ( implicit ) , information and needs with other professionals . ( b ) interpreting and analyzing tend to occur at the individual level while generating decentralized knowledge . At this stage , professionals will absorb what it sounds and then analyzed terinterpretasikan associated with other knowledge already possessed . ( c ) negotiating and revising usually happens at the group level . Professionals to collect and sort the various interpretations , and build mutual understanding, which is necessary for all parties to revise their way of thinking . This stage produces
ISSN 2302-786X
Proceeding of Annual South East Asian International Seminar (ASAIS) 2013 3
a shared knowledge , shared meanings , and common ground on concepts , roles , tasks and goals . ( d ) combining and creating typically occurs at the individual level when producing concrete knowledge that supports innovation and new technology . At this stage professionals will combine different knowledge base and then create new ideas .
3. METHODOLOGY McKay and Marshall ( 2001) on ' action research ' to achieve the dual purpose ( dual aim ) . In the dual aim is no cycle of research related to responsibility and interest in research or problem solving and problem solving interest cycle action research related to issues of responsibility and interest in the study investigators or research interest ( McKay and Marshall , 2001) . In the process , researchers working with the problem owner in hopes of bringing change in the context of the problems in a given situation . Therefore the form of collaboration between the problem owner to be a factor of success and have a relationship of interdependence in skills , experience and competencies to achieve the research objectives . While Checkland 's (1991 ) suggested an alternative to using cycles positivistic research to explain how the research process is done . The cycle consists of components research , real-world problem situations , reflection is based on a way of thinking ( F ) and method ( M ) are used and discovery .
3.1 Stages in the Soft Systems Methodology : 1 ) Phase One and Two - defining the situation , 2 ) Stage Three : Root definition of Relevant systems , 3 ) Phase - Four : Developing the Model , 4
) to Phase - five : Compare models and the real world , 5 ) Phase - six : Make intervention ( intervention) and 6 ) The seventh stage : Measures to improve the situation .
3.2 Research Methodology Research Methods used in this study is divided into several stages , namely :
a) The place and time of the study : PNJ and the timing of this research was conducted during the 8 ( eight ) months
b ) Object of research : PNJ
c ) The sampling method is policy makers and decision in this regard is the leader and also the staff . For informants in each group selected by : for a group of decision makers and policy taken the leadership level ( Director / Ass.Director / Head of Department ) and for the academic community ( lecturer and administration staff taken by a proportional random techniques) .
d ) Method of Approach : method approach is used Action Reearch by using SSM
e ) Specifications research : in this research used Soft Systems Methodolgy method ( SSM ) with CATWOE approach ( Checkland , 2006 ) .
f ) Data Collection Methods : interviews , focus group discussions and study of literature .
4. DATA ANALYSIS METHODS Qualitative data analysis conducted in accordance with the type of the data

ISSN 2302-786X
4 Proceeding of Annual South East Asian International Seminar (ASAIS) 2013
Studied . The Data have been grouped to associate with one another and interpreted by using the Soft Systems Methodology ( SSM ) and CATWOE ( clients , actors , Transformation ,
Weltanschauung or world view , owners and environment ) in analyzing the application of the concept of collaborative knowledge creation in PNJ.
Tabel 4-1 General Framework for Action Research
Collaborative Knowledge Creation at PNJ toward organizational competitiveness ( Based action research SSM at Jakarta State Polytechnic organization )
Theoretical Framework (F)
How does the theory of collaborative knowledge creation in the organization PNJ used toward organizational competitiveness
Problematic Situations Real World ( P )
Through collaborative knowledge creation begins at the level of individual interaction , group , organizational and inter-organizational networks to decision making and cooperation as well as improving the quality of Three programme of University to achieve the organization's vision PNJ be superior , world-class technical colleges by 2029y
Metodology used in this research (MR)
Metodology of Action Reseach - SSM (Soft Systems Methodology)
Specific area in this research to be studied ( A1)
Identify the process of Collaborative Knowledge Creation ( CKC ) in the field of organizational cooperation organization PNJ to win the competition .
Source: Adapted from McKay and Marshall , 2001
Tabel 4-2 Root Definition (RD) Research for Problem Solving and Research Interest
No. Name of RDs Activity Explanation RD1 policy formulation
process Establishment of institutional cooperation network system owned and operated by PNJ in the formulation of policy (P ) through improved interaction and communication on stage externalizing and sharing that can overcome the challenges of information asymmetry in the institutional cooperation network (Q) that can facilitate the implementation of all phases of the CKC PNJ in the policy formulation process that leads to the achievement of vision 2029
Problem Solving
Source: Primary data research, 2013
Patterns of cooperation on policy institutions , the creation of knowledge and the interaction network of strategic issues formulated institutional cooperation by identifying the root of the causes of low industrial cooperation ( LAKIP PNJ , 2012) . For the role of Ass.Director of Industrial Relations and team designated institutions to collect data on the industry feedback , companies , governments , universities and the professions association already cooperating . Cooperation in the form of rules
regarding PNJ existing and currently implemented , but based on interviews with Ass.Director of Industrial Relations that is currently being done especially regarding the realignment of the financial administration of the reporting process related forms of cooperation that has been done by the department . The achievement of ISO 9001 : 2008 in the PNJ every form of activity SOP , therefore the availability of the guidebook industry cooperation is important in the PNJ . The presence of SPM (Quality Assurance System)

ISSN 2302-786X
Proceeding of Annual South East Asian International Seminar (ASAIS) 2013 5
and SPI (Internal Assurance System) activities in each program make PNJ institutions conduct courses in accordance with the mechanism and rules that apply in the PNJ .
Giudance of Industrial Relations should be prepared and then do a workshop on the preparation of the guidebook industry cooperation . In the workshop were invited not only stakeholders but also PNJ will involve input from industry to industry can be considered as part of porses knowledge creation and knowledge sharing . The guidance has been prepared subsequent to the majors and discussed socialized to get feedback and improve the content not only administrative but also the technical implementation . Disclosure of information in decision-making and policy cooperation by stakeholders in the PNJ will be able to answer the research questions regarding the interaction process in the application phase of externalizing and sharing that can overcome the challenges of information asymmetry . Process monitoring and evaluation of any form of cooperation worked to facilitate the implementation of all phases of the CKC in strengthening the ability to produce dynamic organizational strategies that lead to achievement of vision 2029 PNJ .
5. CONCLUSIONS Implementation of each phase of CKC in the process of drafting and development of higher vocational education model requires the contribution of each individual role ( Director / Ass.of Director / Head of Deaprtment / Head of Unit / Lecturer and Administration Staff ) .
a. Externalizing and Sharing stages can explain PNJ role in improving the nation's competitiveness .
b. Interpreting and Analyzing phases can explain the activity leader of the organization do to improve the interpretation and analysis aspects keuanggulan PNJ.
c. Negotiating and Revising stages can explain the activity director of PNJ invite all members of the Forum to discuss the proposed Director Polytechnic concept and model of higher education , including vocational and industrial areas of cooperation with the company .
d. Combining and Creating phases can explain the activity of the seventh, the Director of the Polytechnic Forum agreed on the preliminary draft model of higher vocational education.
CKC characteristics suitable for use in all phases of the CKS is : ( a) at the level of the individual : Cognitive distance , Power distribution, Hierarchy , Leadership , Geographical Proximity , and Autonomy , (b ) at the level of groups : group efficacy , social cohesion , learning climate , cognitive distance , and fuctional composition ; ( c ) at the organizational level and ( d ) inter- organization : autonomy , resources availability , innovation goals , nature of knowledge , level of uncertainty , learning futures , and structural composition . All characteristics needed to cope with the CKC CKC challenge especially in organizational and inter- organizational level , the perceived resource contribution , perceived equity or fairness , and dual allegiance or dual commitment .
6. SUGGESTIONS In a study of research interest are the stages of implementation of SSM only until stage 6 , the stage of recommendation and not until the seventh stage of the implementation

ISSN 2302-786X
6 Proceeding of Annual South East Asian International Seminar (ASAIS) 2013
(action ) steps are recommended . Therefore, the researcher recommends that further studies be done to see how the recommendations are systematically desirable and culturally feasible , according to the national education policy and applicable legislation .
Furthermore , to implement some of the recommendations of problem solving , for PNJ needed discussion forums and persuasive - constructive approach to convince the leadership of PNJ , faculty and other stakeholders , in accordance with CKC choices that match the characteristics of the existing system and are culturally acceptable to increase the quality and quantity of the areas of cooperation .
7. REFERENCES [1] Checkland, Peter dan Scholes,
Jim. 1990. Soft System Methodology In Action. John Wiley & Son. New York. USA.
[2] Choo, Chun W. 1998. The Knowing Organization : How Organizations Use Information to Construct Meaning, Create Knowledge, and Make Decision. Oxford University Press. New York.
[3] Choo, Chun W. dan Bontis, Nick. 2002. The Strategic Management of Intellectual Capital and Organization Knowledge. Oxford University Press. New York.
[4] Lubis, Hari. S.B. dan Huseini, M. 2009. Pengantar Teori Organisasi : Suatu Pendekatan Makro. Departemen Ilmu Administrasi. Fakultas Ilmu Sosial dan Ilmu Politik Universitas Indonesia. Depok.
[5] Nurmandi, Achmad. 2009 . Dampak Perubahan Organisasi
Terhadap Manajemen Pengetahuan pada Pelayanan Perizinan dan Pembinaan Pedagang Kaki Lima oleh Organisasi Pemerintahan Kota Yogjakarta, Disertasi , UI.
[6] Tuomi, I. 1999. Corporate Knowledge : Theory and Practice of Intelligent Organizations. Metaxis. Helsinki.
[7] Alvarez, Harold, 2012. Collaborative Knowledge Creation, Maastricht University, The Netherland.
[8] Bratianu, Constantin dan Orzea, Ivona. 2010. Organizational Knowledge Creation. Management Marketing Challenges for Knowledge Society 5 (3) : 41-62
[9] Chen, Su-Chang., Hsiao, His-chi., Chang, Jen-Chia., Shen, Chien-Hua., dan Chou, Chun-Mei. July 2010. School Organizational Innovative Indicators for Technical Universities and Institutes. Contemporary Issues in Education Research 3 (7) : 43-50
[10] Choo, Chun W. dan Johnston, Ray. 2004. Innovation in the Knowing Organization : a case study of an e-commerce initiative. Journal of Knowledge Management 8 (6) : 77-92
[11] Cook, Scott. D. N. dan Brown, John. S. July – August 1999. Bridging Epistemologies : The Generative Dance Between Organization Knowledge and Organization Knowing. Organization Science 10 (4) : 381-400
[12] Daft, Richard. L. dan Weick, Karl. E. 1984. Toward a Model of Organization as Interpretation Systems. Academy of

ISSN 2302-786X
Proceeding of Annual South East Asian International Seminar (ASAIS) 2013 7
Management Review 9 (2) : 284-295
[13] Fogarty, Timothy. J. dan Dirsmith Mark. W. Fall 2001. Organization Socialization as Instrument Symbol : An extended institutional theory perspective. Human Resources Development Quarterly 12 (3) : 247-266
[14] Lindell, Mats dan Stenstrom, Marja-Leena. 2005. Between Policy and Practice : Structuring workplace learning in higher vocational education in Sweden and Finland. Journal of Workplace Learning 17 (3/4) : 194-211
[15] Mitchell, Rebecca dan Boyle, Brendan. 2010. Knowledge Creation Measurement Methods. Journal of Knowledge Management 14 (1) : 67-82
[16] Nonaka, Ikujiro. February 1994. A Dynamic Theory of Organizational Knowledge Creation. Organization Science 5 (1) : 14-37
[17] Parry, J. 2003. Making Sense of Executive Sensemaking : A phenomenological case study with methodological criticism. Journal of Health Organization and Management 17 (4) : 240-263
[18] Petruzzelli, Antonio, M. 2008. Proximity and Knowledge Gatekeepers : the case of the Polytechnic University in Turin. Journal of Knowledge Management 12 (5) : 34-51
[19] Sakellariou, C. 2006. Benefits of General vs Vocational/technical Education in Singapore using Quantile Regressions. International Journal of Manpower 27 (4) : 358-376
[20] Smith, Elizabeth. A. dan Mireless, Matthew. 2010. North American Perspective. Community of Competence : background theory and concepts – part I. Clinical Governance: International Journal 15 (3) : 220-229
[21] Thomas, James. B., Sussman, Stephanie. W. dan Henderson, John. C. May – June 2001. Understanding “Strategic Learning”: Linking organizational learning, knowledge management and sensemaking. Organization Science 12 (3) : 331-345
[22] Toner, P. 2010. Innovation and Vocational Education. The Economic and Labour Relations Review 21 (2) : 75-98
[23] Weick Karl. E. 1993. The Collapse of Sensemaking in Organization : The Mann Gutch Disaster. Administrative Science Quarterly 38 : 628-652
[24] Weick, Karl. E., Sutcliffe, Kathleen. M. dan Obstfeld, David. July – August 2005. Organizing and the Process of Sensemaking. Organization Science 16 (4) : 409-421

ISSN 2302-786X
8 Proceeding of Annual South East Asian International Seminar (ASAIS) 2013
ISSN 2302-786X
Proceeding of Annual South East Asian International Seminar (ASAIS) 2013 9
The Organize Model of Event Based Local Wisdom at Tourism Destinations of Lake Maninjau
Maswir1, Azwar2, and Djuni Akbar3
1,3Lecture of MICE Study Program, Jakarta State Polytechnic Tel : 081311049524
E-mail addresses : [email protected] 2Lecture of Busines Administration Study Progra, Jakarta State Polytechnic
ABSTRACT
Indonesia is famous for a pluralistic society that has the uniqueness of each region or tribe ranging from culture, arts and crafts folk until the food is an attraction for tourists who come.However, it is unfortunate uniqueness as an appeal is not well organized and notknownyet , so that the tourists who come to enjoy the beauty of nature just new course on attraction . The general objective of this research is to create an event-based model of organizing local wisdom as an attraction for tourists to come in tourism destination . Specific target of this research is that people who reside in Lake Maninjau as local communities are able to hold an event based Minangculture . To achieve the research objectives , the study design is Multiple Case Study in which data is collected by a method using a combination of approaches which include : surveys , observations , field studies , focus group discussions , PRA ( Participatory rural appraisal) and action research . Level and type of research is exploratory analysis is qualitative analysis. Keywords :Event Organize, Local Wisdom, Tourism Destination 1. INTRODUCTION
1.1 Backround of the Problem The process of globalization continues to movemarked by thethehigh level of competitionbetween countries. While the commitment of countries in the world in a variety of bonding such as the WTO, APEC, and AFTAhasblurredthe boundaries of the state.Consequently countries are not ready to be crushed, he competition is not just limited to the products manufacturing and trade, but also on the availability of qualified human resources.
In realizing the development goals prosperous society, a fair and wealthy, the government and the public should no longer have to rely on oil and gas which has been the main stay, Indonesia should begin to attention the potential and
competitive advantages compared to other countries in the field of tourism, this sector can be acommodity a gold mine of foreign exchange.The way that canbringin more foreign exchange once guspromote Indonesian products and other potential is through Meeting, Incentive, Convention and Exhibition(MICE) (Christina: 2005).Then M Kesrul(2004) confirmed that the MICE increasingly important in economic growth, because the MICE industry is multiplier effect, high yield, and massif.
With the enactment of Law No. 22 of 1999 and Law No. 32 of 2004 , the Government has the authority to run the economy of the area including the tourism sector . This is an opportunity for those areas that have tourism destinations to promote the local economy through the tourism sector . Development of tourism

ISSN 2302-786X
10 Proceeding of Annual South East Asian International Seminar (ASAIS) 2013
one of the local governments need to consider the development of tourist destinations . For the development of tourism destinations one can apply the " Social / Culture Carrying Capacity " ( IGdePitana& I Ketut Surya Diarta ; 2009 , 137 ) is a concept to accommodate the development of tourist destinations and involve the community to be able to reflect the needs of visitors or tourists , so the more travelers are interested in visiting the tourist destinations of the area and can enjoy local cultural performances and crafts feel to the community as a souvenir of the area .
The concept of the above laws, not just an opportunity for local governments to improve tourism sector of the economy, according to researchers, the government is also faced with the development of human resources for the development wheel drive.As it according to Hendri Adjie Kusworo and Janiant on Damanik(2002) in his study of Tourism Regional Development; policy agenda for policy makers, confirmed that the implementation ofthe order of human resource development policy is still biasedhost of frontliners(industry). It must be recognized,that this strategy has the advantage of being the chosen target is to createservices that meet the quality standard sofinternational tourism, how ever showed that t he improvement of human resources focus on the frontliners and ignore the bureaucratic resources cannot
produce the quality of the tourism product in accordance with market needs.
To find solutions of revampin group grading of human resources who are living around tourist destinations, so in this study tried to study, analyze and evaluate the application of social entrepreneurship community in order to contribute to the development of tourism destinations in particular and generally through the organization of community-based events by wisdom the local area.
1.2 The Problems a. How the arts, culture,
religion, social relationships and business description aslocalwisdom ofManinjaucommunities?
b. Is thelocalwisdom ofManinjaucommunitiesprovide traction for touristswho visit?
c. How to designpotential of the region(local wisdom) become aneventwichhastheattraction of touristswho visit thelakeManinjau ?
d. How modelpropertoeventorganizeattouristdestinationslakeManinjau ?
2. LITERATURE REVIEW
2.1 State of the art Model of organizing an event is still slightly is done by there searchers, if there is more to research destination marketing, however,the author tries to present some research on the organization of the event :

ISSN 2302-786X
Proceeding of Annual South East Asian International Seminar (ASAIS) 2013 11
1. Maswir&Nining Latianingsih(2010) the title of "Model Affiliate Marketing Activity In ANExpoatthe Jakarta State Polytechnic”. This study uses"Action Research" This study aims to examine the event marketing strategies by students, so the results obtained from an affiliate marketing event procedure
2. Etty Kongrat(2010) the title of "Model Execution Even tRegistration In Wolrd Ocean Conference (WOC) in Manado". This research was aqualitative study with observational implementation. Of this study indicated that the model registration in the form of reWOCevent registration and on site registration
3. Kambiz Heidarzadeh Hanzee (2011) with the title “ A Model of Destination Branding For Isfahan City : Integrating Concepts of the Branding and Destination Image “, The purpose of the current study examines the relationships among brand association, brand image, and tourists future behaviour. For this purpose, an emperical test was conducted in Isfahan City, which proved the successful destination branding was necessary to overcome its lack of clear destination image. The results confirm that overall image is influenced by three types of brand associations and is considered a critical mediator between brand
associations and tourists future behaviour.
2.2 Models, PrinciplesandProcessFormation In Indonesian Dictionary(1990) defines the term"model" is1) pattern(eg, reference, variance, etc.) of something that will be created or generated, 2) a person who is used as an example to be painted, 3) people who(work) demonstrate examples of clothing that will be marketed, and4) a small counterfe it good swith form(rupa) exactly asimitated. The same thing in Business English Dictionary defines the model: small copy of something to show what it will look like when finished.
Modeling background and influenced by the natural mind of the creator.However,in making models to consider the following principles:
1. Building Block The modelis made easy organizing, meaning that the goal is to simplify the organization of interaction within the system and seen a clear relationship between the unit with another unit
2. Accuracy The model madean inherentnature and includes aspects that are relevant to the target.
3. Relevance The model was made not loose its own, but is closely related to the needs of users
4. Unity /Aggregation The model created is a unity with other units

ISSN 2302-786X
12 Proceeding of Annual South East Asian International Seminar (ASAIS) 2013
To get the right model can not bed one directly, but the necessary steps that must be followed in the modeling : 1. Based on the observation
problem, selector startmodels.
2. Conduct observations and measurements to compare reality with what is described or predicted by the model.
3. From the comparison and the deviation between the model and reality then decide whether the select stage 4 or stage 5.
4. Stop the refinement model because it is no teconomical anymore or because the accuracy is sufficient.
5. Repeat the process with the assumption that it would be more economical or they can be processed more carefully.
2.3 Understanding Of Event The term"event organizer" is atermin the language of Britain is made up of two words, which in Indonesian English Dictionary(John M.Echolsand Hassan Shadily; 1988) "event" means1events, happenings, 2games, competitions, while the word"organizer"derived fromthe word" organize"means1mengatur, 2organizing, and" organizer"means the organizerorthepersonwhoset up.
2.1.UnderstandingofLocal wisdom. The generaly,the local wisdom can be understood as the ideas of local who is wise, full of wisdom, good value, which is embedded andf ollowed by members of the
community.AccordingGobyah(2003), said that the local knowledge (local genius) is a truth that has been a tradition or monotonically in a region. Local knowledge is a blend of the values of God'sholy word and the values that exist. Local knowledge is formed as a local culture of excellence and geographical conditions in a broad sense.Local knowledgeis a product of past cultures that should continuously hold onto life.According to S.Swarsi Geriyain" Menggali Kearifan Lokal Untuk Ajeg Bali "conceptually, local knowledgee and local advantage is human wisdom grounded in the philosophy of values, ethics, and behavior in ways that traditional in stitutionalized. Local knowledge is a value that is considered good and right so that it can survive for a long time and even institutionalized (www.Balipos.co.id)
2.4 Understanding Tourism Destination Destination is a place visited by a significant time during the course of a person compared to other places that crossed during the trip(eg transit area). As according Ricardson and Fluker(2004:48) defines tourism destinations is a significant place visited on a trip, with some form of actual or perceived boundary. The basic geographic unit for production of tourism statistics.
According to Prof.Dr..I Gede Pitanain his speech at the seminar Cooperation in the Development of Education and Tourism in the Global Eraon
ISSN 2302-786X
Proceeding of Annual South East Asian International Seminar (ASAIS) 2013 13
May 31, 2012 in Surabaya confirms that for the primacy of a tourist destination needs to have 4 main aspects, namely: Attraction
Attraction are what can be seen and what can be done
Accessibility Accessibility is the leading destination for infrastructure
Amenity The amenities are all supporting facilities that can meet the needs and desires of tourists while in destination
Ancilliary Ancilliary related to the availability of an organization or the people who take care of these destinations
3. RESEARCH METHODS
3.1 Research Design This study is a qualitative research category level descriptive explanation. This study was designed to for two years, the first year to identify local knowledge and design models of organizing the event, and in the second year of implementing the action research model generated in the first year
3.2 Data Collection Method Methods of data collection using a combination of approaches (triangulation) which include: surveys, observations, field studies, focus group discussions, PRA (Participatory rural appraisal) and action research. Level and type of research is exploratory analysis is qualitative.
4. RESULTS ACHIEVED From the results of data collection the researcher can explain about the local knowledge of the destination lake Maninjau are as follows: a. Socioeconomic Maninjau communities around the lake was originally a farming community, it is based on interviews with people, society must depend on the results of cloves and nutmeg that grow around the hills that surround the lake Maninjau, in addition to being close to the edge of the lake produce "fish lake" or local name “ palai “ (a name of a small fish ± 2-3 cm) to be used as food "palaibada" (spiced fish wrapped in banana leaves and baked) or chips bada, and art shows (mussels) cooked with savory and salty flavors. At that time very attractive to the tourists who come to experience its cuisine alongside a lake. Fish harvest fish cages before the disaster died as a result of contaminated water by the fish feed , harvest every 3 months with an average yield of fish cages per plot ± 5 to 7 quintals , which are marketed to Feed New life , Padang and Medan , but now the time is no longer harvest per three months , but more than three months to 1 year even new farmers to harvest fish in cages , making the condition most fish cage farmers began to abandon the fish cages. Then around the lake Maninjau unitsencountered some travel agencies and several hotels and inns for travelers inn b. Social and Cultural Based on interviews and discussions with community groups, local knowledge of normative cultural social angle as follows: (1) Customs can not be separated, as
the proverb goes Minang culture Kabau "Adat basandiSyarak, SyarakbasandiKitabullah",

ISSN 2302-786X
14 Proceeding of Annual South East Asian International Seminar (ASAIS) 2013
meaning that provisions (rules) based on religious tradition, and religion in question is Islam. Thus the implementation of the ordinance or everyday culture in society, must be in accordance with the norms of Islam, including the arts and culture, so if there is activity that is incompatible with religion, it is forbidden and must be shunned
(2) In realizingthegoal of a commitment to carrying out equally, it is seen from the answer"Barek samo dipikua, ringan samodijinjiang ". Example during afestivity held, men have the task of cooking rice and side dishes, while women make cakes or dessert after meals
(3) Democracy prevailing in society Maninjauis"Participatory Democracy" means any public decision Maninjau nearly always argue for an opinion first, then just approved what has been encountered when a mutual thought, it was revealed from the public response Maninjau during discussions with the phrase" kayu basilang ditungku, disitu api mangkonyo hiduik "
(4) In the arts , it was in every districts have their peculiarities though the basic essence of art is almost the same , which kind of art that are in the form of dances Maninjau among others ; plate dance , dance offerings time to welcome guests , a dance with dance Sewah martial step , then in the field of sound art are various folk songs played with traditional and modern musical instruments such as saluang ( wind instrument made of bamboo and greater than flute ) , talempong ( gamelan ) , Gendrang , rabab ( a typical violin Minang ) and other modern
music instruments . Besides the typical Minang arts drama or theater called “randai” the form of a merger between the sendra dance drama played jointly by a group of players , such as RandaiSabaiNanAluih , RandaiSiumbuikMudo , and RandaiBujangSambilan played by young people with existing art galleries of the information society among other Gumarang studio , Sabai Nan Aluihstudio, and PutiBungsustudio, unfortunately during this workshop was a call if there is a party that marriage alone . Then played a populist art by elementary and junior high school students known as " Tambo Dance " is an art that uses Gendrang(isa musical instrumentthatis struck ) large enough size that is played by a group of children with typical rhythm in welcoming guests as the opening ceremony is formal in Maninjau area.
(5) Maninjautruthcanbeused as areligioustourism destination, becauseManinjauarea(village Preciselystemriver) was the birthplaceofthescholarswhoareknownbyall the people ofIndonesia and evenneighboringcountriesnamelyBuyaHamka, butaftertheobservedlackofinfrastructuresupportandtheonlyvisiblepresenceofpesantrenBuyaHamkain Sungai Batang
To answer the above problems, the design model of the organization of events in Maninjau necessary steps:
1. Sosialisaasi community economic development by improving social entrepreneurship to organize events.

ISSN 2302-786X
Proceeding of Annual South East Asian International Seminar (ASAIS) 2013 15
2. Forming the committee organizing the event
3. Designing the concept of event with the appropriate model with potential, wisdom lokal.dan show the uniqueness
4. Planning the organization of events 5. Getting the acquisition of the local
government, the industryas a potential sponsor
6. Marketing and promotion of events 7. Organizing cultural and economic
events 8. Monitoring and evaluation
5. CONCLUSIONS AND RECOMMENDATIONS
5.1 Conclusions 1) Indigenous communities
around Lake Maninjau based on custom and religious teachings are strong.
2) Maninjauas a tourist destination has a major aspect of a tourist destination area, only draw back encountered by acontaminated lake water began to feed the fish so that the foreign tourists who love to swim in the lake decreased in number.
3) To designthe potential of becoming an event Maninjau area is through out reach to local government, traditional leaders, religious and cultural groups in order to build local culture through unique art.
4) Model appropriate event is organized special events based on the potential of the community's culture Maninjau lake.
5.2 Rekommendations 1) There needs to be a
socialization and
maintenance of cultural preservation of art incollaboration with the Department of tourism and higher education to build up the spirit ofthe younger generation to build more creative and innovative community-owned tourism potential lakeManinjau
2) So that event activities take place in kontiniutas, social community groups, villages and government studios are able to work together with investors, sponsors and other parties in promoting sympathy tourists through event-based local knowledge
6. REFERENCES [1] Doug Matthewus, “ Special Event
Production “, First Edition 2008 by Charon Tec Ltd, Chennai India.
[2] Elsa PujiSetiati (2013 ) “ Penyusunan Model “, FakultasKedokteran ,UniversitasPadjadjaran, Bandung
[3] EttyKongrat( 2010 ), “ Model RegistrasiPadaPelayanan Event World Ocean Conference (WOC ) Di Manado “, Prosiding Seminar Nasional II MICE danAdministrasiBisnis, JurusanAdministrasiNiagaPoliteknikNegeri Jakarta.
[4] EttyKongrat et al ( 2011 ), “ Model StrategiPromosi Stand PameranPada Perusahaan PCO (Profesional Conference Organizer “, JurnalEkonomi&Bisnis, Volume 10, Nomor 2, Desember 2011.
[5] I GdePitanadan I Ketut Surya Diarta( 2009 ), “

ISSN 2302-786X
16 Proceeding of Annual South East Asian International Seminar (ASAIS) 2013
PengantarPariwisata“, PenerbitAndi Yogyakarta
[6] JohnnyAllen et al (2002), “ Festival And Special Event Management “, John Wiley & sons Australia.
[7] John M. Echols Dan Hassan Shadily ( 1988 ), “ KamusInggris Indonesia “ PT Gramedia Jakarta.
[8] Lynn Van Der Wagen( 2007 ), “Event Management For Tourism, Culture, Business and Sporting Events 3rd Edition, Pearson Education Australia.
[9] Maswir (2008 ), “ Usaha PameranUntukMahasiswa Program Studi MICE”, PoliteknikNegeri Jakarta.
[10] MaswirdanNininglatianingsih( 2010 ), “Model AfiliasiPemasaranKegiatan AN Expo Di PoliteknikNegeri Jakarta”, Prosiding Seminar NasionalHasilPenelitiandanPengabdianKepadaMasyarakat ( SNP2M ) 2010, Unit Penelitian Dan PengabdianKepadaMasyarakat, PoliteknikNegeri Jakarta.
[11] Oliver Thomas, Bettina Hermes, Peterloss( 2008 ), “ Reference Model Based Event Management “, International Journal Of Event Management, Volume 4 Number 1 2008
[12] Richardson, John I dan Martin Fluker( 2004) “ Understanding and Managing TourismI “, Australia : Pearson Education New York : John Willey & Sons
[13] Sartini( 2004 ), “ MenggaliKearifanLokal“, JurnalFilsafatAgustus 2004, Jilid 37 No. 2
[14] W. Lawrence Neuman, “ Social Research Methods : Qualitative and Quantitative Approaches “, sixth Edition, Boston New York San Francisco.
[15] www.Balipos.co.id
[16] https://www.business.nsw.gov.au
[17] https://alumni.stanford.edu
[18] https://www.blackbaud.com
[19] http://www.yesweb.org
[20] http://www.irishrugby.ie

ISSN 2302-786X
Proceeding of Annual South East Asian International Seminar (ASAIS) 2013 17
Corporate Governance, Intellectual Capital Performance And Corporate Performance
Daissy Erdianthy, Hilda Rossieta, and Helson Siagian
Graduate Program in Accounting, Faculty of Economics, Universitas Indonesia UI Depok Campus 16424, Phone: +62-21-727 2425, 727 2646, Fax: +62-21-727 0024
e-mail: [email protected]
Abstract
Many arguments that the corporate governance practices in Indonesia was limited to the obedience of the regulations and has not been effectively implemented, and the mixed result on intellectual capital performance research, encourage this research to provide empirical evidence in Indonesia about: 1) the influence of corporate governance practices on corporate performance 2) the influence of intellectual capital performance on corporate performance 3) the effect of corporate governance practices on corporate performance through intellectual capital performance 4) the effect of intellectual capital performance on the relationship between corporate governance practices and corporate performance. The samples of this research were the companies that had a Corporate Governance Performance Index (CGPI) from the Indonesian Institute of Corporate Governance (IICG) between 2005 and 2009. Intellectual Capital Performance was measured by VAICTM method from Pullick (1998) and corporate performance was measured by CFROA. The results showed that 1) corporate governance practices had a significant positive effect on corporate performance 2) intellectual capital performance had a significant positive effect on corporate performance 3) corporate governance practices had a significant positive effect on corporate performance without going through the intellectual capital performance 4) intellectual capital performance strengthened the relationship of corporate governance practices on corporate performance Key words: corporate governance, intellectual capital performance, VAICTM, corporate performance. 1. INTRODUCTION The Indonesian Institute for Corporate Governance (IICG) research in 2002 found that the main reason the company implements Good Corporate Governance (GCG) is the compliance with the regulations. General guidelines for Good Corporate Governance (GCG) Indonesia in 2006 stated that each company must ensure that the principle of Good Corporate Governance is applied to every aspect of business and across all ranks of the company. The implementation of GCG is the other forms of business ethics and work ethic enforcement of that should has been a corporate commitment, and could repair and improved the corporate image, so it will increase the value of the company. Since 2001 the Indonesian Institute of Corporate Governance (IICG) conducts research and rates of
practice/implementation of good corporate governance in Indonesia in the form of Corporate Governance Performance Index (CGPI). This Research Program is carried out to know the extent to which companies have been implementing the principles of good corporate governance.
With the changes of economy era, the increase in the value of the company is also highly dependent on the ability of companies to compete, not only in the ownership of tangible assets, but also on innovation, information systems, organizational management and human resources of the company (Petty and Guthrie, 2000). The increase in the value of the company in the form of hidden value of innovation, information systems, organizational management and

ISSN 2302-786X
18 Proceeding of Annual South East Asian International Seminar (ASAIS) 2013
human resources of the company is indicated as intangible assets or intellectual capital (intellectual capital (IC)). Intellectual capital (intellectual capital / IC) has become the focus of attention in many fields, good management, information technology, sociology, and accounting (Petty and Guthrie, 2000; Sullivan and Sullivan, 2000).
VAIC™ method developed by Pulic (1998) is designed to provide information about the value creation efficiency of tangible assets and intangible assets of the company. This method calculates the value added created by a company which is the difference between output and input. Agreed with the Resources-Based Theory, these methods are based on the premise that the creation of corporate value depends on what is as effective as the company manages its resources. Although this method is also much to criticize, but according Iazzolino and Laise (2013): VAIC™ does not modify or contradict any of the fundamental accounting principles. VAIC™ and other performance measurement usefully may live together in a context in the which the performance is measured through multicriteria methodologies, such as the Balanced Scorecard, Skandia Navigator or Intangible Asset Monitor.
Studies on the implementation of good corporate governance by using CG Index have been carried out and shows that the CG is believed to improve the performance and value of companies (Silveira and Barros, 2006), Black, Jang, and Kim, 2005). Dr. Benny Tabalujan Simon (2002) stated that Indonesia has failed to implement the CG system in the 1990s due to the absence of a legal culture supportive. Studies on the
relationship between intellectual capital and corporate performance has been demonstrated empirically by several researchers in the various approaches in several states with mixed results. For example, the results of research conducted of Firrer and Williams (2003) states that the three components of intellectual capital had no effect to ROA, but some of the intellectual capital components effect (positive and negative) to the Market Book. Results of research conducted by Ulum, Ghozali, and Chariri (2008) states that one of the IC component has a positive effect on ROA.
Many arguments that the corporate governance practices in Indonesia was limited to the obedience of the regulations and has not been effectively implemented, and the mixed result on intellectual capital performance research, encourage this research to provide empirical evidence in Indonesia about: 1) the influence of corporate governance practices on corporate performance 2) the influence of intellectual capital performance on corporate performance 3) the effect of corporate governance practices on corporate performance through intellectual capital performance 4) the effect of intellectual capital performance on the relationship between corporate governance practices and corporate performance.
This research is expected to contribute in giving an overview of corporate governance practices and performance of intellectual capital in Indonesia, pushing financial statement preparers to disclose intangible assets (intellectual capital) in the company reports, and contribute ideas to the users of financial statements and management company to understand

ISSN 2302-786X
Proceeding of Annual South East Asian International Seminar (ASAIS) 2013 19
the role of intellectual capital performance as both mediating and moderating variables in the influence of corporate governance practices on corporate performance.
This paper will be divided into five sections. The first part contains an introduction that will discuss the background, research objectives, and scope. While the second part is the theoretical basis and development of hypotheses that will discuss theories related to corporate governance, intellectual capital performance, and financial performance. In part three will discuss the research methodology related to the sample selection, empirical models are used, the operationalization of the variables, and model testing. While on the four will discuss the results of this study. Finally, in section five will discuss the conclusions, limitations, and potential for future research.
2. THEORY AND HYPOTHESES DEVELOPMENT
2.1 Corporate Governance According to the agency theory of Jensen and Meckling (1976), an agency relationship is a contract between shareholders (principals) and managers (agents) to perform services for the principal. The principle of good corporate governance, that is transparency, accountability, responsibility, independence, and fairness is necessary to achieve sustainability of the company with due regard to the interests of stakeholders. Several previous studies have shown that the good corporate governance practices will improve the performance of the company (Black et al. (2003), Gompers et al. (2003), and
Drobetz (2003). Klapper and Love (2003) asserts that there is a high correlation among the indicators of high corporate governance mechanisms to performance and market valuation. Those study empirically explained that even corporate governance is measured differently, it still remain positive effect on corporate performance.
Hypothesis 1: The good corporate governance practices will affect positively to the corporate performance
2.2 Intellectual Capital Resource-based theory states that the company's resources consist of tangible and intangible assets, are used effectively and efficiently to achieve the company's goal, is a major source of competitive capabilities and corporate performance (Belkaoui, 2003; Firer and Williams, 2003). Agreed with the Resources-Based Theory, Pulic (1998) propose a measure to assess the efficiency of the company's intellectual capabilities added value (Value Added Intellectual Coefficient - VAIC ™). Seeing from the corporate resources, the main component VAIC™ (Pulic, 1998) consists of physical capital (VACA - value added capital employed), human capital (VAHU - value added human capital), and structural capital (STVA - structural capital value added) .
Firer and Williams (2003) demonstrate empirically the relationship between the financial performance VAIC™

ISSN 2302-786X
20 Proceeding of Annual South East Asian International Seminar (ASAIS) 2013
in South Africa. The results showed that the phisical capital is the most significant factor to affect the performance of companies in South Africa. Chen et al. (2005) examined the relationship between the IC to the market value and performance of public enterprises in Taiwan. The results showed that intellectual capital positively affect the market value and performance of the company. Mavridis (2004) and Kamath (2007) showed that VAIC™ can be used as an instrument to make the ranking of the banking sector in Japan and India based on its IC performance.
Hypothesis 2: The high performance of intellectual capital will affect positively to the corporate performance
2.3 Corporate Performance Corporate performance can be measured in several ways, based on the accounting method using operating cash flow, return on assets (ROA) and return on equity (ROE), and based on the stock market by using stock returns. This study used the Cash Flow Return on Assets (CFROA) as a measurement of corporate performance (Healy et al. (1992) and Kothari, Leone, and Wasley (2005)). This measurement is effectively independent from financial leverage and more focused to measure on current performance.
2.4 Corporate Governance, Intellectual Capital Performance and The Performance of The Company CG is a set of mechanisms that influence the decision by the manager when there is a separation between ownership and control, some of this control lies in the function of the board of directors, institutional shareholders, and control of the market mechanism (Wardani, 2007). Included in the decision is the use of intellectual capital efficiently. Performance of intellectual capital in this case may affect the relationship of corporate governance on corporate performance. Intellectual capital performance can be a mediating or moderating factor in the relationship of god corporate governance practices to corporate performance.
Hypothesis 3: The good corporate governance practices will affect positively to corporate performance through the high performance of intellectual capital
Hypothesis 4: The high performance of intellectual capital will strengthen the influence of corporate governance practices on corporate performance.
3. RESEARCH METHODS
3.1 Sample Samples were taken by purposive sampling method, that is the companies with the Corporate Governance Performance Index (CGPI) from the Indonesian Institute of Corporate Governance (IICG)

ISSN 2302-786X
Proceeding of Annual South East Asian International Seminar (ASAIS) 2013 21
between year 2005 to 2009. The final sample is 69 year company observation. This study use secondary data from the Annual Reports issued information companies listed on the JSE, the company's website, the website IICG, OSIRIS data bank, Indonesian Capital Market
Directory (ICMD), JSX Statistiks, Fact Book and list the Securities Exchange (EFD)
3.2 Research Framework Based on the literature study and hypothesis development, the research conceptual framework is described as follows:
3.3 Data Analysis Method This study use descriptive statistics and hypothesis testing to analyse the data. The data processing method is pooled least squares with first test assumptions of Ordinary Least Square (OLS) is required as a test of normality, multicollinearity, autocorrelation and heteroscedasticity. After having no problems with the regression method, the results of this regression will be tested siginificantly influence of each variable, and it will be determined whether the research hypothesis was rejected or accepted. The results presented in this study are the results of a regression that already meet these assumptions. This study use dependent variable: CFROA, independent variable: CGPI and VAIC™, intervening/mediating variable
and moderating variable: VAIC™ and control variables: GROWTH , SIZE and DEBT. To examine the effect of intervening, used path analysis method which is an extension and multiple regression analysis techniques (Ghozali 2006). This study use EViews 6 program as a data processing.
Regression equations were used to test the hypothesis is as follows :
a. To test the first hypothesis the following regression equation is used:
CFROA = C + β1.CGPI + β2.GROWTH + β3.SIZE +
β4.DEBT + ε (1)
CFROA: corporate performance assessed by calculating the company's earnings before interest and
Corporate Governance (indeks
CGPI) H1 (+)
H3 (+) H2 (+)
H4 (+)
Size, Growth, Debt
Company Financial Performance (CFROA)
Intellectual Capital(VAIC™) H3 (+)

ISSN 2302-786X
22 Proceeding of Annual South East Asian International Seminar (ASAIS) 2013
taxes plus depreciation and then divided by total assets
CGPI: corporate governance practices are assessed based on reports research results and rankings CGPI IICG 2005 to 2009.
GROWTH: corporate growth rate, assessed by the difference in sales divided by total sales of the previous year. Growth is expected to be positive on the performance of the company.
SIZE : corporate size, assessed by calculating the logarithm of the total assets of the company. Predicted size was positively related to corporate performance.
DEBT: corporate debt levels, assessed by calculating the Total Debt divided by Total Assets of the company. Debt is predicted to have a negative coefficient.
b. To test the second hypothesis the following regression equation is used:
CFROA = C + β1.VAICTM + β2.GROWTH + β3.SIZE +
β4.DEBT + ε (2)
VAIC™ = VACA + VAHU + STVA
- VACA = VA/CE
VA = OUT – INP
OUT (Output) = Total sales and other income.
IN (Input) = Expenses and costs (other than employee costs).
CE (Capital Employed) = available funds (equity, net income)
- VAHU = VA/HC
HC (Human capital) = employee costs
STVA = SC/VA
SC (Structural Capital) = VA – HC
c. To test the third hypothesis we used two estimates of the regression equation. The first estimate of the regression equation to determine the effect of CG on intellectual capital (VAICTM):
VAICTM = C + δ1.CGPI + ε (3.1)
And the second estimate of the regression equation to determine the effect of CG and VAICTM jointly on the performance of the company:
CFROA = C + β1.CGPI + β2.VAICTM + β3.GROWTH + β4.SIZE + β5.DEBT + ε (3.2)
By using the method of path analysis, intellectual capital performance proved to be a variable mediating/intervening in relation to corporate governance practices on financial performance if the
ISSN 2302-786X
Proceeding of Annual South East Asian International Seminar (ASAIS) 2013 23
equation (3) CGPI variable is positive and significant in equation (4) variable is positive VAICTM also significant. So that the effect of corporate governance on financial performance through the performance of intellectual capital can be calculated that is equal to δ1 x β2.
d. To test the fourth hypothesis the following regression equation is used:
CFROA = C + β1.CGPI + β2.VAICTM + β3.CGPI.VAICTM
+ β4.GROWTH + β5.SIZE + β6.DEBT + ε (4)
Intellectual capital performance proved strengthen relations practices of corporate governance on financial performance if CGPI and CGPI.VAICTM are positive and significant.
4. RESULTS
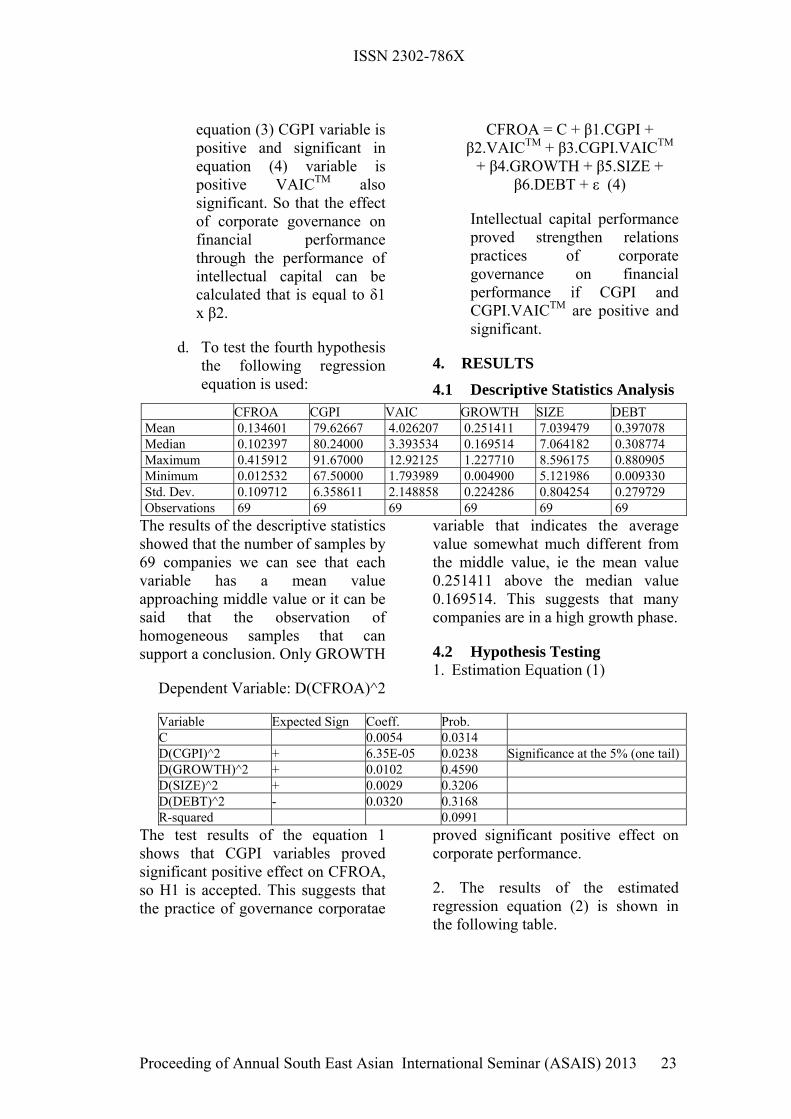
4.1 Descriptive Statistics Analysis CFROA CGPI VAIC GROWTH SIZE DEBT Mean 0.134601 79.62667 4.026207 0.251411 7.039479 0.397078 Median 0.102397 80.24000 3.393534 0.169514 7.064182 0.308774 Maximum 0.415912 91.67000 12.92125 1.227710 8.596175 0.880905 Minimum 0.012532 67.50000 1.793989 0.004900 5.121986 0.009330 Std. Dev. 0.109712 6.358611 2.148858 0.224286 0.804254 0.279729 Observations 69 69 69 69 69 69 The results of the descriptive statistics showed that the number of samples by 69 companies we can see that each variable has a mean value approaching middle value or it can be said that the observation of homogeneous samples that can support a conclusion. Only GROWTH
variable that indicates the average value somewhat much different from the middle value, ie the mean value 0.251411 above the median value 0.169514. This suggests that many companies are in a high growth phase.
4.2 Hypothesis Testing 1. Estimation Equation (1)
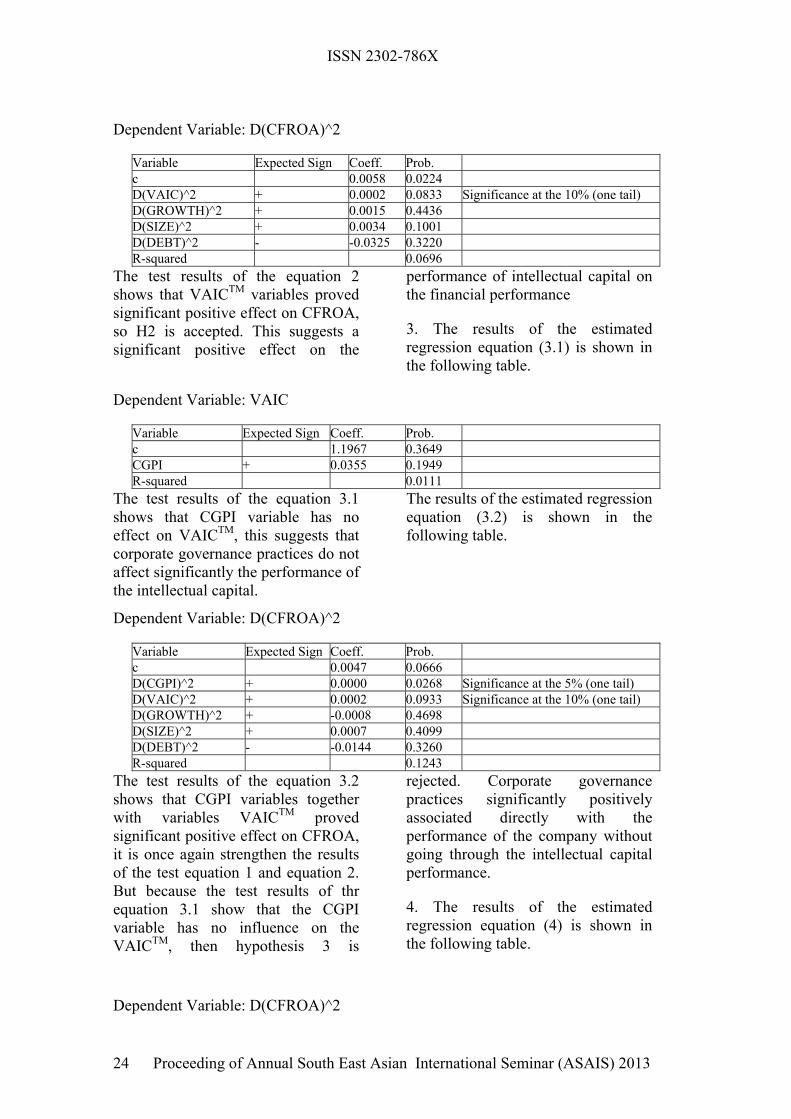
Dependent Variable: D(CFROA)^2
Variable Expected Sign Coeff. Prob. C 0.0054 0.0314 D(CGPI)^2 + 6.35E-05 0.0238 Significance at the 5% (one tail) D(GROWTH)^2 + 0.0102 0.4590 D(SIZE)^2 + 0.0029 0.3206 D(DEBT)^2 - 0.0320 0.3168 R-squared 0.0991
The test results of the equation 1 shows that CGPI variables proved significant positive effect on CFROA, so H1 is accepted. This suggests that the practice of governance corporatae
proved significant positive effect on corporate performance.
2. The results of the estimated regression equation (2) is shown in the following table.
ISSN 2302-786X
24 Proceeding of Annual South East Asian International Seminar (ASAIS) 2013
Dependent Variable: D(CFROA)^2
Variable Expected Sign Coeff. Prob. c 0.0058 0.0224 D(VAIC)^2 + 0.0002 0.0833 Significance at the 10% (one tail) D(GROWTH)^2 + 0.0015 0.4436 D(SIZE)^2 + 0.0034 0.1001 D(DEBT)^2 - -0.0325 0.3220 R-squared 0.0696
The test results of the equation 2 shows that VAICTM variables proved significant positive effect on CFROA, so H2 is accepted. This suggests a significant positive effect on the
performance of intellectual capital on the financial performance
3. The results of the estimated regression equation (3.1) is shown in the following table.
Dependent Variable: VAIC
Variable Expected Sign Coeff. Prob. c 1.1967 0.3649 CGPI + 0.0355 0.1949 R-squared 0.0111
The test results of the equation 3.1 shows that CGPI variable has no effect on VAICTM, this suggests that corporate governance practices do not affect significantly the performance of the intellectual capital.
The results of the estimated regression equation (3.2) is shown in the following table.
Dependent Variable: D(CFROA)^2
Variable Expected Sign Coeff. Prob. c 0.0047 0.0666 D(CGPI)^2 + 0.0000 0.0268 Significance at the 5% (one tail) D(VAIC)^2 + 0.0002 0.0933 Significance at the 10% (one tail) D(GROWTH)^2 + -0.0008 0.4698 D(SIZE)^2 + 0.0007 0.4099 D(DEBT)^2 - -0.0144 0.3260 R-squared 0.1243
The test results of the equation 3.2 shows that CGPI variables together with variables VAICTM proved significant positive effect on CFROA, it is once again strengthen the results of the test equation 1 and equation 2. But because the test results of thr equation 3.1 show that the CGPI variable has no influence on the VAICTM, then hypothesis 3 is
rejected. Corporate governance practices significantly positively associated directly with the performance of the company without going through the intellectual capital performance.
4. The results of the estimated regression equation (4) is shown in the following table.
Dependent Variable: D(CFROA)^2

ISSN 2302-786X
Proceeding of Annual South East Asian International Seminar (ASAIS) 2013 25
Variable Expected Sign Coeff. Prob. c 0.0044 0.0813 D(CGPI)^2 + 0.0000 0.0471 Significance at the 5% (one tail) D(GROWTH)^2 + -0.0013 0.4997 D(SIZE)^2 + 0.0003 0.4528 D(DEBT)^2 - -0.0105 0.3702 D(CGPI.VAIC)^2 + 0.0000 0.0365 Significance at the 5% (one tail) R-squared 0.1449
The test results of equation 4 indicate that the variable CGPI together with variable CGPI.VAIC proved significant positive effect on CFROA, so H4 is accepted. This suggests a significant positive effect of corporate
governance practices on corporate performance and proven intellectual capital performance reinforces the influence of corporate governance practices on corporate performance.
5. CONCLUSION Overall, of the four research hypotheses, only one research question that has not been proven. This suggests that good CG practices of the company and appreciation from an entity that provides an assessment of the company's CG practices, proved significantly positive affect on corporate performance. Intellectual capital performance proved significant positive affect on corporate performance and strengthen the influence of CG practices on financial performance, but not proven significantly as mediation between CG practices on financial performance.
Another impression gained in this study is the absence of regulation to assess implementation of CG mandatorily. During these companies voluntarily participate in the program IICG. Since the cost of CG survey is quite large, so only small numbers of company that voluntarily has been assessed in regard to CG implementation. CG in general practice has not provided meaningful feedback to the business world as well as regulators. The Government, through the community colleges and other NGOs are expected to contribute to further enhance the presence of a positive requirement on corporate governance practices in
Indonesia and taking heed legal culture in Indonesia (Dr. Beni S Tabalujan, 2002).
There are several limitations to this study:
1) The use of secondary data obtained from various sources of data banks, and internet websites contain limitations on the quality of the data used because it turned out to the same data, but derived from a different source, may be different.
2) The use of variable VAIC™ research has not been expanded into three components to test the association with corporate performance.
3) This study examines only those companies that are rated CGPI of IICG so the results can not be generalized.
For further research, it is expected that other researchers can extent the period of research, expand with the use of VAIC™ components and conduct comparisons against companies that do not have a ranking CGPI and take a more objective in getting quality data.

ISSN 2302-786X
26 Proceeding of Annual South East Asian International Seminar (ASAIS) 2013
6. BIBLIOGRAPHY [1] Black Bernard S, Jang Hasung,
and Kim Woochan (2003) Does corporate governance affect firm value? evidence from Korea. Stanford Law School Working Paper.
[2] Black Bernard S, Jang Hasung, and Kim Woochan (2005) Predicting Firms' Corporate Governance Choices: Evidence from Korea. Journal of Corporate Finance.
[3] Chen MC, Cheng SJ, and Hwang Y (2005) An empirical investigation of the relationship between intellectual capital and firms’ market value and financial performance. Journal of Intellectual Capital.
[4] Fama Eugene F (1980) Agency Problems and the Theory of the Firm. Journal of Political Economy.
[5] Firer S, and Williams SM (2003) Intellectual capital and traditional measures of corporate performance. Journal of Intellectual Capital.
[6] Gompers P, Ishii L, and Metrick A (2003) Corporate governance and equity prices. Quarterly Journal of Economics.
[7] Healy P, Palepu K, and Ruback R (1992) Does corporate performance improve after mergers? Journal of Financial Economics
[8] Iazzolino Gianpaolo and Laise Domenico (2013) Value added intellectual coefficient (VAIC): A methodological and critical review. Journal of Intellectual Capital.
[9] Ikatan Akuntan Indonesia (2002) Pernyataan Standar Akuntansi
Keuangan No. 19. Salemba Empat. Jakarta.
[10] Kamath GB (2007) The intellectual capital performance of Indian banking sector. Journal of Intellectual Capital.
[11] Kothari SP, Leone AJ, and Wasley CE (2005) Performance Matched Discretionary Accrual Measures. Journal of Accounting & Economics.
[12] La Porta R, Lopez-de-Silanes F, Shleifer A, and Vishny R (2000) Investor Protection and Corporate Governance. Journal of Financial Economics Mavridis DG (2004) The Intellectual Capital Performance Of The Japanese Banking Sector. Journal of Intellectual Capital.
[13] Meritum (2002) Proyeto Meritum: Guidelines for Managing and Reporting Intangibles. Madrid.
[14] Oliveira Lidya, Rodrigues Lucia Lima, Craig Russel (2008) Applying Voluntary Disclosure Theories to Intangibles Reporting: Evidence from the Portuguese Stock Market. researchgate.net
[15] Petty R and Guthrie J (2000) Intellectual Capital Literature Review: Measurement, Reporting and Management. Journal of Intellectual Capital.
[16] Pulic A (1998) Measuring the performance of intellectual potential in knowledge economy. Paper presented at the 2nd McMaster Word Congress on Measuring and Managing Intellectual Capital by the Austrian Team for Intellectual Potential.

ISSN 2302-786X
Proceeding of Annual South East Asian International Seminar (ASAIS) 2013 27
[17] Rachmawati D, Wulani F, and Susilowati CE (2004) Intellectual Capital dan Kinerja Bisnis: Studi Empiris pada Industri di Indonesia. Presenting at The International Seminar Management and Research Conference, Sanur Beach Hotel Bali, Faculty of Economics – Universitas Indonesia.
[18] Riahi-Belkaoui A (2003) Intellectual capital and firm performance of US multinational firms. A study of the resource-based and stakeholder views. Journal of Intellectual Capital
[19] Silveira and Barros (2006) Corporate Governance Quality and Firm Value in Brazil. http: //papers.ssrn.com/sol3/papers.cfm?abstract_id=923310
[20] Stewart T (1999) Capital Intelectual – A nova riqueza das organizações. Lisboa: Edições Sílabo.
[21] Sullivan Patrick H Jr and Sullivan Patrick H Sr (2000) Valuing intangibles companies An intellectual capital approach. USA Journal of Intellectual Capital: MCB University Press.
[22] Sveiby K (1997) The New Organizational Wealth. Managing & Measuring Knowledge-based Assets. San Francisco: Berrett-Koehler Publishers Inc.
[23] Syaipudin Usep (2008) Pengaruh Intellectual Capital terhadap Kinerja Perusahaan. Thesis. Universitas Indonesia.
[24] Ulum Ihyaul, Ghozali Imam, and Chariri Anis (2008) Intellectual Capital Dan Kinerja Keuangan Perusahaan: Suatu Analisis Dengan Pendekatan Partial Least Squares. Paper presented at the 11th Seminar Nasional Akuntansi (SNA). Pontianak.
[25] Watts R and Zimmerman JL (1978) Toward a Positive Theory of Determination of Accounting Standards. The Accounting Review.
[26] Wardhani Ratna (2007) Mekanisme Corporate Governance Dalam Perusahaan Yang Mengalami Permasalahan Keuangan. Jurnal Akuntansi dan Keuangan Indonesia.

ISSN 2302-786X
28 Proceeding of Annual South East Asian International Seminar (ASAIS) 2013

ISSN 2302-786X
Proceeding of Annual South East Asian International Seminar (ASAIS) 2013 29
The Determinants of Cost Efficiency on Indonesian Banks
Nurafni Eltivia Accounting Department, State Polytechnic of Malang
65141 [email protected]
Abstract
This research investigated the effect size of commissioner, public ownership and intellectual capital on cost efficiency of Indonesian Banks. Intellectual capital was measured by Value Added Intellectual Capital coefficient. The population of data was Indonesian listed Bank on 2004-2011. Data Envelopment Analysis was employed in this research to measure the cost efficiency score. Tobit Regression was used to analyze the effect of those variables on efficiency. The result shows that cost efficiency was affected by size of commissioner, public ownership and Intellectual Capital. Size of commissioner give negative effect on cost efficiency, on the other hand intellectual capital and public ownership give positive effect on cost efficiency. Key Words: Cost Efficiency, Banks, Size of Commissioner, Public Ownership, Intellectual Capital 1. INTRODUCTION Banking as an intermediary institutions have an important role in the economy of the country, so it is required to have a good performance. One important aspect in the measurement of bank performance is efficiency, which can be improved through the reduction of costs in the production process.
On January 9, 2004 Central Bank of Indonesia issued the Indonesian Banking Architecture (API). API became the basic framework Indonesian banking system that is comprehensive and gives direction, shape, and structure of the banking industry for a span of five to ten years into the future. Efficiency is one of the main goals to be achieved banks, as in the API for a healthy economic system requires financial institutions, especially banks that work efficiently.
Indonesian banking efficiency so far measured using BOPO ratio that compares operating costs to operating income. The ratio illustrates how a bank uses its resources to generate income. Many previous studies to measure the technical efficiency of banks by measuring the ability of
banks to manage input and output, thereby increasing efficiency in the banking sector can be achieved by minimizing inputs and maximizing outputs or vice versa.
2. THEORY According to Berger and Mester (1997) cost efficiency can provide a calculation of how much the results of the difference between the costs incurred by the bank against best practice costs under the same conditions. To calculate the cost efficiency, cost minimization need to be calculated in advance, and can be calculated using the DEA approach. The following calculation formula of cost minimization DEA (Coelli, Rao, and Battese Donnel, 2005:184):
Min λ.xi* wi’ xi*, -qi + Q λ ≥ 0. xi* - X λ ≥ 0,
I 1’ λ =1 λ≥ 0……………(1)
Where:
wi’ = NX1 input prices vector of bank i

ISSN 2302-786X
30 Proceeding of Annual South East Asian International Seminar (ASAIS) 2013
xi* = cost minimizing vector from input quatity bank –i
Berger and Mester (1997) stated that the ratio of cost efficiency is the proportion of costs or resources which used efficiently. More specifically, when the banks produce cost efficiencies of 70%, there is wastage of 30% of the cost when compared to best practice under the same conditions. Distance (range) efficiency is zero until one, the equivalent of 1 show that the bank has reached best practice in the proportion of costs or resources are used efficiently.
2.1 Public Ownership and Cost Efficiency Ownership of the company by outside parties has great power in influencing the company through the mass media in the form of criticism or comments which are all considered public or community voice. The more shares owned by the public, the greater pressure will be faced by the company to disclose more information in its annual report.
Hadad, Santoso, and Mardanugraha (2003) conducted study on Indonesian Bank. Study conducted by using empirical data 131 banks in Indonesia showed that there was no correlation between ownership structure and performance. Shleifer and Vishny (1986) stated that the ownership structure is an important element in creating good governance, because the concentration of ownership can be used as a management tool to control behavior, furthermore to avoid inefficient use of company resources. Shleifer and
Vishny (1997) suggest that concentrated ownership structure will improve the efficiency of the company, due to more stringent control manager.
Based on the above explanations, research hypothesis can be formulated as follows:
H1.1: Percentage of public ownership negatively affects the cost efficiency of bank
2.2 Capital Intellectual Efficiency can be done if the bank is able to manage its resources well. Resource-Based Theory considers the company as a collection of resources and capabilities. One resource bank that plays an important role is intellectual capital. Knowledge-Based Theory is based on the view that human resources but emphasizes the importance of corporate knowledge. This theory gives one approach used to having a competitive advantage is a resource-based approach (resource-based theory).
Knowledge-based view of the firm emphasizes the strategic role of knowledge, intellectual capital, and intangible property (intangible assets) as hoarse to achieve competitive advantage and superior performance. The ability of the company to mobilize and exploit intangible assets far more decisive than investing and managing physical assets in the form (Kaplan and D. Norton, 1996: 3). Intangible resources (intangible resources) is the

ISSN 2302-786X
Proceeding of Annual South East Asian International Seminar (ASAIS) 2013 31
most valuable asset for a company (Mulyadi, 2001: 288).
Changes in intellectual capital leads to changes in the performance of the company (Inaki Pena, 2002;, and Tsai and Ghoshal, 1998). Research conducted Delios and Beamish (2001) found that the intangible assets a positive influence on Subsidiary Performance. Furthermore Belkoui (2003) conducted research on multinational companies in the United States and found a significant influence on the performance of intellectual capital
Based on the above expalanations, research hypothesis can be formulated as follows:
H 1.2: Capital intellectual give positive effect on the cost efficiency of banks
2.3 Board of Commissioner The composition of the individual who was working as a member of the board of commissioners is important in monitoring management activities effectively (Fama and Jensen, 1983). The board of commissioners who come from outside company will be seen better because parties from outside will establish policies related to the company more objective than the company that has the order of Board of Directors that only comes from the company. The Board of Directors consists of inside and outside directors will have special access to information that is valuable and very helpful
and effective tool in controlling decisions.
Dalton, Daily, Johnson and Ellstrand (1999) state that greater number of the board of commissioner will be able to provide greater information, so it can improve the performance of the company. So, when the board has a greater amount of information gleaned more useful to perform a supervisory function (Lehn, Sukesh, and Zhao, 2004). Both of these functions it is expected to be increased when an increase in the number of board.
On the other hand, there are disadvantages that arise when the board of commissioners has large numbers due to the incidence of the costs of coordination and the existence of free rider problems. Both these things, that the incidence of the costs of coordination and the free rider, causing problems in coordination and communication. A large numbers of complicate the board of commissioners in the conduct of meetings and make it difficult to achieve a consensus that led to the decision making becomes slower and less efficient. Second, when the number of the Board of Directors is getting bigger, the unity and cohesiveness of the Board of Directors will be reduced as more difficult to share the thinking that lead to each have different ideas in achieving a consensus (Lipton and Lorsch, 1992).
Yermack (1996) found a negative effect of the number of

ISSN 2302-786X
32 Proceeding of Annual South East Asian International Seminar (ASAIS) 2013
the board of directors on company's performance. Eisenberg, Sundgren and Wells (1998) conducted a study in Finland and found a negative relationship between the number of the board of directors of the company's performance. Taktak and Triki (2012) found that the number of the board of directors of Influential negatively to the efficiency of the company. The number of the board of directors of the vulnerable pose a conflict, also causes more difficult coordination between the board of directors.
On the contrary, Adams and Mehran (2005) found a positive relationship between the number of board of Directors of the company's performance. Goodstein, Gautam and Boeker (1994) stated that the number of board of director that is larger can improve diversity can increase the acquisition of resources and critical thinking
in decision making so that companies can increase efficiency.
Based on the above expalanations, research hypothesis can be formulated as follows:
H 1.3: The number of commissioners give positive effect on the cost efficiency of banks
3. METHODOLOGY The population of this research was listed bank in Indonesia. The unit of analysis in this research was financial statements in the period of 2004-2011. This research used purposive sampling method with the type of judgment sampling because the sample selected with certain criteria that were tailored to the purpose of this research. The criteria’s were defined as follows:
There were 14 banks through 2004-2011 on this research become the research sample.
Tabel 1 Data Sampel
Criteria Amount
Listed Bank until 31st December , 2011 31
Less:
- IPO between 1 January, 2004 until 31 December, 2011 10
- Loss between 2004-2011 6
- Recapitalized 1
Total 14
This research is analyzing the determinants of efficiency using two-stage analysis. The first stage of the two-stage analysis is conducted by calculating the efficiency scores of each bank using Data Envelopment Analysis (DEA) analytical tool. DEA method is a non-parametric frontier method that uses linear programming
models to calculate the ratio of output and input for all units compared in a population. The purpose of the DEA method is to measure the efficiency level of bank.
According to Kumbhakar and Lovel (2000:64),the second stage regression is not using ordinary least squares

ISSN 2302-786X
Proceeding of Annual South East Asian International Seminar (ASAIS) 2013 33
(OLS), as the dependent variable in this equation is limited between zero and one, OLS is not appropriate to be used so that the dependent variable is transformed in advance or use estimation techniques the dependent variable is limited Tobit analysis. Tobit assumes that the independent
variables are not limited in value (non-censured), only a limited dependent variable value (censured).
4. ANALYSIS AND DISCUSSION
Tabel 2 Cost Efficiency Score
Bank Year
2004 2005 2006 2007 2008 2009 2010 2011
BBCA 0.690 0.537 0.609 0.579 0.317 0.409 0.599 0.305 BBNI 0.525 0.466 0.578 0.598 0.311 0.448 0.329 0.415 BBNP 0.851 0.683 0.766 0.951 0.487 0.889 0.487 0.743 BBRI 0.506 0.358 0.399 0.414 0.274 0.421 0.305 0.375 BDMN 0.550 0.495 0.602 0.664 0.466 0.584 0.437 0.510 BMRI 0.863 0.686 0.692 0.591 0.362 0.613 0.550 0.390 BNGA 0.504 0.579 0.453 0.428 0.359 0.568 1.000 0.818 BSWD 0.712 0.714 0.862 0.817 0.505 1.000 0.701 0.470 BVIC 1.000 1.000 1.000 1.000 1.000 1.000 1.000 1.000 INPC 0.654 0.580 0.742 0.698 0.467 0.894 0.649 0.600 MAYA 0.837 0.714 0.651 0.645 0.433 0.779 0.639 0.667 MEGA 0.865 1.000 1.000 0.960 0.545 0.671 1.000 0.635 NISP 1.000 0.690 0.522 0.542 0.347 0.499 0.447 0.385 PNBN 1.000 1.000 1.000 0.557 0.666 0.974 0.847 0.673
Tabel
Regression Analysis Result
Independent Variable Hypothesis Coefficient P-value
Konstanta 0.501
Percentage of Public Ownership (X1) H 1.1 0.003 0.001***
Intellectual Capital (X2) H 1.2 0.059 0.000***
Size of Board Commisioner (X3) H 1.3 -0.033 0.001***
Dependent Variabel = Cost Efficiency (Y1)
R2 = 0.598 Note: * significant on 10% level, ** significant on 5% level, *** significant on 1% level
Hypothesis 1.1
This hypothesis states that the percentage of public ownership negatively affects cost efficiency. The greater percentage of public ownership of the efficiency the lower the cost. Statistical analysis showed a coefficient of 0.003 values obtained
with p-value of 0.001. Since the p-value is less than 1% (0.000 <0:01), then the significance level of 1% can be said that the percentage of public ownership variables significantly influence the efficiency of the variable costs. Based on the value of the regression coefficient is positive, indicating a positive effect. This

ISSN 2302-786X
34 Proceeding of Annual South East Asian International Seminar (ASAIS) 2013
means that the higher the percentage of public ownership, the higher the cost-efficiency, as it can be concluded that the hypothesis is rejected.
Hypothesis 1.2
This hypothesis states that intellectual capital positively influence cost efficiency. Statistical analysis showed the value of a coefficient of 0.059 with p-value of 0.000. Since the p-value is less than 1% (0.000 <0:01), then the significance level of 1% can be said that the Intellectual Capital variables significantly influence the efficiency of the variable costs. Based on the value of the regression coefficient is positive, indicating a positive effect. Intellectual Capital means the higher, the higher the cost efficiency, therefore we can conclude that this hypothesis is accepted.
Hypothesis 1.3
This hypothesis states that the number of commissioners positive effect on cost efficiency. The more the number of commissioners, the higher the cost-efficiency. Statistical analysis shows the value of the coefficient of -0033 with p-value of 0.001. Since the p-value is less than 1% (0.001 <0:01), then the significance level of 1% can be said that the variables significantly influence the number of commissioners variable cost efficiency. Based on the value of the regression coefficient is negative, indicating a negative effect. This means more number of Commissioners, the lower the value of cost efficiency, therefore we can conclude that this hypothesis is rejected
5. CONCLUSION Size or the number of commissioners will be able to effectively provide
feedback to management in making decisions about efficiency if it has a certain amount, it means the board of commissioners that is in proportion to the number of company-owned authority. If the number of commissioners in the company too much then to provide input to the management to take decisions on efficiency is less effective and the possibility of much consideration, so that when viewed from a number of then every company should be able to determine the number of commissioners in accordance with the conditions of each. From the least amount to the amount that is more and more and at a certain number of points will be found the most ideal number of boards of commissioners. Another meaning at some point will be obtained a number of commissioners and the most efficient company that added the result to be inefficient in performing the task. This is why a growing number of commissioners who sit on the company would negatively affect the cost efficiency. The existence of the commissioners are increasingly causing greater expense. Small size of the board of commissioners will be more effective in monitoring action than large commissioners. Large board size is considered less effective in carrying out its functions because it is difficult in communication, coordination and decision-making.
The bigger percentage of public ownership, the larger mechanisms to control the behavior of management. The existence of the composition of public shareholders will facilitate monitoring, intervention or some other disciplinary effect on managers, which in turn will make managers act as the interests of shareholders. The composition of public shareholders ownership affects members of the

ISSN 2302-786X
Proceeding of Annual South East Asian International Seminar (ASAIS) 2013 35
board of directors and board of commissioners of the company. In other words, increasing the public shareholders will be accompanied by the larger council election from the outside, which in the end this will affect the cost efficiency.
Intellectual capital put as an important part that cannot be ignored in a company, as in Resource Based Theory and Knowledge Based Theory. Banks will be able to win the competition is increasingly competitive, if banks can improve efficiency. Efficiency can be done if the bank able to manage its resources well. Bank that has high intellectual capital can manage its resources well, so that efficiency can be achieved.
6. BIBLIOGRAPHY [1] Adams R., Mehran H (2005)
Corporate Performance, Board Structure and its Determinants in the Banking Industry EFA 2005 Moscow Meetings. Available at http://papers.ssrn. com/Sol3/papers.cfm?abstract_id=302593
[2] Belkoui, A.R. (2003) Intellectual Capital and Firm Performance of U.S. Multinational Firms: A Study of the Resource-Based and Stakeholder View. Journal of Intellectual Capital, No.3.Vol.2. hal 215 - 226.
[3] Berger, Allen,N., and Mester, Loretta, J (1997) Inside the Black Box: What Explains Differences in Efficiencies of Financial Institutions? Journal of Banking & Finance 21: 895-947.
[4] Coelli, T., D. S. Prasada Rao, and G. E. Batese (1997) An Introduction to Efficiency and Productivity Analysis. Boston: Springer
[5] Dalton, D. R., Daily, C. M., Johnson, J. L. and Ellstrand, A. E (1999) Number of directors and financial performance: A meta-analysis, Academy of Management Journal, 42(6), 674-686.
[6] Fama, Eugene and Jensen (1983) Separation and Ownership Control. Journal of law and Economics, 26, 301-325
[7] Goodstein, J., Gautam K. & Boeker, W (1994) The effects of board size and diversity on strategic change. Strategic Management Journal , 15: 241–250.
[8] Hadad, Muliaman D., Santoso, W., dan Mardanugraha, E., Illyas, D (2003) Analisis Efisiensi Industri Perbankan Indonesia: Penggunaan Metode Non Parametrik Data Envelopment Analysis. Buletin Ekonomi Moneter Perbankan.
[9] Inaki Pena, 2002, Intellectual Capital and Business Start-up Success, Journal of Intellectual Capital, No.3.Vol.2. hal 180 - 198.
[10] Kaplan, S. Robert, dan David, P. Norton ( 1996) The Balanced Scorecard: Translating Strategy into Action, Edisi satu, Boston, United States of America: Harvard Business School Press.
[11] Kumbhakar, S.C., and C.A.K. Lovell.(2000) Stochastic Frontier Analysis. Cambridge UK:Cambridge University Press
[12] Lehn, Kenneth, Sukesh Patro, and Mengxin Zhao (2004) Determinants of the size and structure of corporate boards. Working paper, University of Pittsburgh

ISSN 2302-786X
36 Proceeding of Annual South East Asian International Seminar (ASAIS) 2013
[13] Lipton, M. and Lorsch, J. W (1992) A Modest Proposal for Improved Corporate Governance, Business Lawyer, 48, 59- 77.
[14] Mulyadi (2001) Balanced Scorecard: Alat Manajemen Kontemporer untuk Pelipatganda Kinerja Keuangan Perusahaan, Jakarta: Penerbit Salemba Empat.
[15] Shleifer, A., & Vishny, R. W (1997) A Survey of Corporate Governance. The Journal of Finance, 52(2), 737-783.
[16] Shleifer, A., & Vishny, R (1986) Large shareholders and corporate control. Journal of Political Economy, 94, 461-488.
[17] Taktak S, Triki M (2012) The Effect of Board and Ownership Structure on the Efficiency of Banks in Tunisia: The Stochastic Frontier Approach. International Journal of Business and Management. Vol. 7 No. 16 Pp. 139-150.
[18] Tsai, W., dan Ghoshal, S. (1998) Social Capital and Value Creation: The Role of Intrafirm Network, Academy of Management Journal, Vol, 41, P.464-478.
[19] Yermack, D., (1996) Higher Market Valuation of Companies with a Small Board of Directors. J. Financial Econ., 40: 185-211.

ISSN 2302-786X
Proceeding of Annual South East Asian International Seminar (ASAIS) 2013 37
Demograpic Profile of E-Banking Customers
Petrus Hari Kuncoro Seno1 and Ali MasjonoMukthar2
1,2 Accounting and Finance Department and , Jakarta State Polytechnic Professor SiwabesySt , University of Indonesia Campus
[email protected], [email protected]
Abstract
Financial liberalization and technology revolution have allowed the developments of new and more efficient delivery and processing channels as well as more innovative products and services in banking industry. Banking institutions are facing competition not only from each other but also from non-bank financial intermediaries as well as from alternative sources of financing. Another strategic challenge facing banking institutions today is the growing and changing needs and expectations of consumers in tandem with increased education levels and growing wealth. Consumers are becoming increasingly discerning and have become more involved in their financial decisions. This paper investigates the demographic profile of internet-banking services customers in Indonesian context. Primary data was collected from 64 respondents through a structured questionnaire. Descriptive statistics was used to explain demographic profile of respondents. The finding depicts thedemograpic profile of the internet - banking customers in Indonesia.
Keywords: Demographic profile, internet banking customers
1. INTRODUCTION The fierce competition among bankers and the trend towards reducing operational banking cost has force banks to utilize internet in their business. Besides people’ s mobility has grown from year to year has forced the service provider for the society such as banking business to continuously innovate in serving their customers. One of the application which is getting more and more attention is internet banking.
The rapid advancement in electronic distribution channels has produced tremendous changes in the financial industry in recent years, with an increasing rate of change in technology, competition among players and consumer needs (Hughes, 2001). The proliferation of, and rapid advances in, technology-based systems, especially those related to the internet, are leading to fundamental changes in how companies interact with customers (Ibrahim et al, 2006; Bauer et al., 2005; Parasuraman and Zinkhan, 2002). Internet banking has become the self-service delivery channel that allows banks to provide information
and offer services to their customers with more convenience via the web services technology The evolution of e-banking has fundamentally transformed the way banks traditionally conduct their businesses and the ways consumers perform their banking activities (Eriksson et al., 2008; Sayar and Wolfe, 2007). Today e-banking has experienced phenomenal growth and has become one of the main avenues for banks to deliver their products and services (Amato-McCoy, 2005).
Electronic banking (e-banking), also known as Internet banking is defined as the automated delivery of new and traditional banking products and services directly to customers through electronic, interactive communication channels (Daniel, 1999; Sathye, 1999). E-banking includes the systems that enable financial institution customers, individuals or businesses, to access accounts, transact business, or obtain information on financial products and
ISSN 2302-786X
38 Proceeding of Annual South East Asian International Seminar (ASAIS) 2013
services through a public or private network, including the internet. Customers access e-banking services using an intelligent electronic device, such as a personal computer (PC), personal digital assistant (PDA), automated teller machine (ATM), kiosk, or Touch Tone telephone. Chou and Chou (2000) identified five basic services associated with online banking: view account balances and transaction histories; paying bills; transferring funds between accounts; requesting credit card advances; and ordering checks for more faster services that can be provide by domestic and foreign bank.
E-banking reaps benefits for both banks and its customers. From the banks‟ perspective, e-banking has enabled banks to lower operational costs through the reduction of physical facilities and staffing resources required, reduced waiting times in branches resulting in potential increase in sales performance and a larger global reach (Sarel and Mamorstein, 2003). From the customers‟ perspective, e-banking allows customers to perform a wide range of banking transactions electronically via the bank's website anytime and anywhere (Grabner-Kraeuter and Faullant, 2008). In addition, customers no longer are confined to the opening hours of banks, travel and waiting times are no longer necessary, and access of information regarding banking services are now easily available (Hamlet, 2000). However the success of e-banking isn‟t without its problems. Firstly the adoption of e-banking has not kept pace with that of internet usage (White and Nteli, 2004). This gap is attributed to the lack of trust among bank customers, particularly among internet users age 65 and older (Ilett, 2005; Perumal and
Shanmugam, 2005). Secondly, customers still prefer face to face interaction (Asher, 1999) due to reasons such as fear of the online environment and lack of trust in the internet. Recent literature on e-banking showed that the formation of trust can help reduce the impact of key inhibiting factors such as fears about using the online service among non-e-banking customers (Vatanasombut et al., 2008).
The purpose of this paper is to gain an understanding of the demographic profile of Indonesian market where the 70 percent population reside in rural areas and 30 percent population reside in urban area of the country. This study explore the demographic profile of the internet bank consumers in Indonesia.
2. THEORY Numerous studies have been undertaken on the adoption of Internet banking service (e.g., Mohd. Suki, 2010; Ndubisi&Sinti, 2006; T. Ramayah et al., 2003). Several theories have also been developed relating to consumers’ behavior which affect the rate of adoption and degree of acceptance of any new innovation such as theInternet banking. According to Rogers and Shoemaker (1971), consumers go through several stages in knowledge conviction and decision confirmation before they eventually adopt a new idea, product or service. Rogers’s points out that the process of diffusion is considered to pass through knowledge, persuasion, decision, implementation and confirmation of the innovation in sequence. In this regard, the mass media and other communication channel play important role in all of the stages. In the early stage mass media is very important. An interpersonal channel is perceived as

ISSN 2302-786X
Proceeding of Annual South East Asian International Seminar (ASAIS) 2013 39
more vital in the stage of persuasion and adoption. In diffusion process, new ideas, products and service is communicated through interpersonal network. Information and knowledge about innovation are shared among people in the social system. For new business or industrial products, the role of change agents is important as they may directly affect the diffusion of products. Whereby, for consumers’ goods, opinion leaders play crucial role, as they are normally the first to obtain information about innovation and then pass the information on to the rest of people in the community.
Studies on Internet banking adoption analyses the evolution of e-banking, (Balachandher et al., 2000) and factors influencing Internet banking adoption (Sohail&Shanmugam, 2002; Suganthi et al., 2001). Studies by Balachander et al. (2000) studies analyzed the evolution of e-banking in Malaysia; they highlights the development of e-banking since the introduction of ATM machine in 1980’s up until the implementation ofInternet banking service in middle of 2000. They found that most consumers still prefer ATM and human tellers compared to Internet banking. During the early stage of Internet banking the study revealed that human tellers and ATM machine are still important with regards to their banking needs even though the majority of the respondents have Internet access at home.
Studies on factors influencing Internet banking adoption demonstrated that factors such as psychological and behavioral factors such as trust, costs, reluctance to change and preference for human interface influenced the adoption of Internet banking (Suganthi et al., 2001). Study conducted by Sohail and Shanmugam
(2002) revealed demographic factor in particular income level is found to be a significant factor that affect the adoption of Internet banking. In addition, they also found that other factors such as accessibility, reluctance to change and awareness of Internet banking significantly influenced the usage of this service. Other studies found that perceived ease of use and perceived usefulness also significantly influence intention to use Internet banking (T. Ramayah et al., 2003). With regards to product attributes influence on Internet banking adoption, past studies have found that compatibility, complexity and trialability (Ndubisi&Sinti, 2006)..
3. METHODOLOGY This study employed the method of personal interview for data collection using a close-ended questionnaire as the research instrument. Respondents of this exploratory study consisted of customers of several banks in Jakarta, Depok, Tangerang and Bekasi. A total of 64 respondents were selected and interviewed for a period of two weeks. The data collection is done in the period of one week. The questionnaire is divided into three sections. Section A is designed to solicit information regarding banking activities and category of adopters. Section B consisted of questions on perception of the Internet banking based on the products characteristics (Internet banking) attributes.In this section, respondents were asked to indicate the degree to which they agreed with each statements on a 5 point Likert-scale, ranging from 1 (strongly disagree) to 5 (strongly agree). Section C is on demographic factors which seek to obtain responses based on factors such as gender, town, and education level. The data solicited

ISSN 2302-786X
40 Proceeding of Annual South East Asian International Seminar (ASAIS) 2013
were then analyzed for some statistical discriptive using SPSS.
Operational Definitions:
Self Eficacy :" judgments of how well one can execute courses of action required to deal with prospective siuations" (Bundora 1982)
Perceived usefulness -"the degree to which a person believes that using a particular system would enhance his or her job performance"(Davis 1989).
Perceived ease-of-use - Davis defined this as "the degree to which a person
believes that using a particular system would be free from effort" (Davis 1989)
4. ANALYSIS AND DISCUSSION
4.1 The Cutomers’ Occupation Based on the data which have been collected it is revealed that majority of the respondents were company workers (32.8%) and then students (23.4%), entrepreneurs (18.8%) . A complete accouts of the customers’ accopation can be found on table 1.
Table 1 Cutomers’ Occupation
Frequency Percent Cumulative Percent Medical Doctor 1 1,6 1,6
Teacher 1 1,6 3,1
House wife 4 6,3 9,4
Company worker 21 32,8 42,2
University/college Student 15 23,4 65,6
Governernment owned company worker 2 3,1 68,8
Lecturer 1 1,6 70,3
Retired worker 1 1,6 71,9
Public servant 4 6,3 78,1
Artist 1 1,6 79,7
Teller 1 1,6 81,3
Entrepreneur 12 18,8 100,0
Total 64 100,0
The Customers’ Gender , The Customers’ Education and The Age of the Customers
In this study there is a balance between male and female in the internet banking customers under study. There is only a slight difference between the male customers (53.1%) and female customers (46.9%).The education level of the internet banking customers were mostly bachelor degree graduate (46.9%) followed by high school graduate (28.1%) and then three years diploma (21.9%) and other degress less
than 4 %. The median age of the internet banking customers in this study is 25 years old. The youngest was 19 years old and the oldest was 68 years old
4.2 The Internet Banking Services Chosen by Customers The intenet banking service providers which are chosen by the custumers were dominated the three big banks in Indonesia which are Mandiri Bank

ISSN 2302-786X
Proceeding of Annual South East Asian International Seminar (ASAIS) 2013 41
(28.1%) , BCA bank (26,6 %) , BNI Bank (15.6%). Table 2.Internet Banking Chosen by Customers
Frequency Percent Cumulative Percent BCA Bank 17 26,6 26,6
Mandiri Bank 18 28,1 54,7
BNI Bank 10 15,6 70,3
CIMB Niaga Bank 1 1,6 71,9
Permata Bank 1 1,6 73,4
BNI Syariah Bank 1 1,6 75,0
Combination of several bank 16 25.1 100
Total 64 100,0
4.3 The Computer Self Efficacy Based on the questions which are used to measure the computer self efficacyit is
revealed that the median values were 4 (“agree”) for learning avability and help availability and 5 (“quite agree”) for the manual availability.
Table 4 Computer Self Efficacy
Manual Availibility Learning Aviaibility Help avaibility N Valid 64 64 64 Mean 4,50 3,80 3,50 Median 5,00 4,00 4,00 Std. Deviation ,535 ,929 ,959
4.4 The Perceived Value The median value for the customers perceived value for
internet banking was 5 (“quite Agree”) for Speed of transaction, easier transaction and usefulness.
Table 4 Perceived Value
Speed up transaction Easier transaction Usefulness N Valid 64 64 64 Mean 4,61 4,52 4,50 Median 5,00 5,00 5,00 Std. Deviation ,633 ,666 ,617
4.5 The Perceived Ease of use The median value for the perceived ease of use for
internet banking was 4 (“agree”) for user friendliness,easy to learn, fast learning and easy to use.
Table 5.Perceived Ease of use
User Friendly Easy to learn Fast learning Easy to use
N Valid 64 64 64 64 Mean 4,02 3,91 3,83 4,00 Median 4,00 4,00 4,00 4,00 Std. Deviation ,678 ,771 ,808 ,642

ISSN 2302-786X
42 Proceeding of Annual South East Asian International Seminar (ASAIS) 2013
4.6 The Perceived Credibility The median value for perceived credibility for internet banking
was 4 (“agree”) for privacy and secure transaction.
Table 6 Perceived Credibility
Privacy Secure Transaction N Valid 64 64 Mean 3,81 3,95 Median 4,00 4,00 Std. Deviation ,833 ,805
4.7 The Behavioral Intention The median value for the behavioral intention was 4
(“agree”) for willingness to use and use of internet banking in the future.
Table 7 Behavioral Intention
Willingness to Use Use in the future N Valid 64 64 Mean 4,23 4,14 Median 4,00 4,00 Std. Deviation ,660 ,794
5. CONCLUSION The demographic profile of the internet banking customer which has been written in this article revealed that the majority of the respondents were company workers (32.8%) and then students (23.4%), entrepreneurs (18.8%).The median age of the internet banking customers in this study is 25 years old,The intenet banking service providers which are chosen by the custumers were dominated the three big banks in Indonesia which are Mandiri Bank (28.1%) , BCA bank (26,6 %) , BNI Bank (15.6%).The education level of the internet banking customers were mostly bachelor degree graduate (46.9%) followed by high school graduate (28.1%) and then three years diploma (21.9%).Based on the questions which are used to measure the computer self efficacy it is revealed that the median values were 4 (“agree”) for learning avability and help availability and 5 (“quite agree”) for the manual availability. The median value for the customers
perceived value for internet banking was 5 (“quite Agree”) for Speed of transaction, easier transaction and usefulness.The median value for the perceived ease of use for internet banking was 4 (“agree”) for user friendliness,easy to learn, fast learning and easy to use.The median value for perceived credibility for internet banking was 4 (“agree”) for privacy and secure transaction. The median value for the perceived ease of use for internet banking was 4 (“agree”) for user friendliness,easy to learn, fast learning and easy to use.The median value for the behavioral intention was 4 (“agree”) for willingness to use and use of internet banking in the future.
6. BIBLIOGRAPHY [1] Abrazhevich, D. Electronic
Payment Systems: A User-Centered Perspective and
[2] Interaction Design.TechnischeUniversiteitEindhoven, Eindhoven, 2004, 24–26.

ISSN 2302-786X
Proceeding of Annual South East Asian International Seminar (ASAIS) 2013 43
[3] Belkhamza , Zakariya , Syed AziziWafa, The Effect of Perceived Risk on the Intention to Use E-commerce: The Case of Algeria, Journal of Internet Banking and Commerce, April 2009, vol. 14, no.1 , URL:http://www.arraydev.com/commerce/jibc/
[4] Dai, X., and Grundy, J. NetPay: an off-line, decentralized micro-payment system forthin-client applications. Electronic Commerce Research and Applications, 6, 2007,91–101.
[5] Davis, F.D. (1989). Perceived usefulness, perceived ease of use, and user acceptance of information technology. MS Quarterly (online), Vol. 13 Iss. 3, pg. 318. (2005, 20 Juli).
[6] Gefen, David , Elena Karahanna, Detmar W. Straub, Trust and TAM in Online Shopping: An Integrated Model , MIS Quarterly, Vol. 27, No. 1 (Mar., 2003), pp. 51-90 P, Management Information Systems Research Center, University of Minnesota Stable
[7] Guan, S., and Hua, F. A multi-agent architecture for electronic payment.International Journal of Information Technology and Decision Making, 2, 3, 2003,497–522.
[8] Kim, Changsu , Wang Tao , Namchul Shin , Ki-Soo Kim , ,An empirical study of customers’ perceptions of security and trust in e-payment systems, Electronic
Commerce Research and Applications , Vol9 (2010) pp. 84–95
[9] Kousaridas, A., Parissis, G., and Apostolopoulos, T. An open financial servicesarchitecture based on the use of intelligent mobile devices. Electronic CommerceResearch and Applications, 7, 2008, 232–246
[10] Linck, K., Pousttchi, K., Wiedemann, D. G. Security issues in mobile payment from
[11] the customer viewpoint. In Proceedings of the 14th European Conference onInformation Systems (ECIS 2006), Goteborg, Schweden, 2006, 1–11.
[12] Mukherjee, A., and Nath, P. A model of trust in online relationship banking.
[13] International Journal of Bank Marketing, 21, 1, 2003, 5–15.
[14] Theodosios, T., and George, S. Concept of security and trust in electronic payments.Computers and Security, 2005, 10–15.
[15] Lawrence, E., Newton, S., Corbitt, B., Braithwaite, R., and Parker, C. Technology ofInternet Business. John Wiley and Sons Australia Publishing, 2002.
[16] Weir, C. S., Anderson, J. N., and Jack, M. A. On the role of metaphor and language indesign of third party payments in eBanking: usability and quality. InternationalJournal of Human-Computer Studies, 64, 8, 2006, 70–784.

ISSN 2302-786X
44 Proceeding of Annual South East Asian International Seminar (ASAIS) 2013

ISSN 2302-786X
Proceeding of Annual South East Asian International Seminar (ASAIS) 2013 45
Ethics as An Attempt to Control Banking Crimes
Ida Nurhayati Program, Jakarta State Polytechnic
Abstract
This study aims to examine and criticize the existence of ethics in the banking business. Bankers in conducting their duties could not be removed with ethics , and ethical theory as well as the work of evil in the basic theory. Therefore, it is expected to maintain moral ethics in their behavior. This research criticize and evaluate the implementation of ethics contained in the principles of good corporate governance in general.Target to be addressed is what are the things that cause a banker breaking,on the other hand there are bankers who obedient. This research using secondary data as initial data that led to the initial conclusion , and using primary data for comparison with the current situation that occurred ( empirical ). Studytries to fill this gap previous research related to the importance of ethics in business, which has been largely ignored byresearchers,especiallythescienceofcriminology. Keywords : Ethics , Control , Crime , Banking. 1. PREFACE Crime in banking as part of economic crime. Economic crime is usually referred to as white-collar crime (white collar crime). Economic crime is a crime that has economic motives and usually done by people who have the intellectual ability and have an important position in society, and was related to his job. Banking crimes, mostly carried out by the internal, in terms of criminological called white collar crime (white collar crime).Different modes to do with the mode of conventional crime, while the value of the object is very large theft (Wiryosukarto, 2012).
Banking crime is not merely a violation of regulations relating to banking, but there needs to be some
things that lead to violations / crimes committed by bankers and bank officials, which is associated with his work and even his post. It was like proposed in the study, that some professional crime differs significantly from conventional crime. First, a professional criminal involved in the life of criminal behavior for the purpose of economic gain, or even as a livelihood. Second, highly developed professional career criminals.Third, in committing a crime, supported with sufficient professional skills. Fourth, professional criminals enjoy a high status in the community. And fifth, professional criminals are usually able to avoid detection and is quite successful in avoiding prison (Clinard-Quinney, 1972).
Data Banking Crime Police Headquarters in 2011
NO NAME YEAR VALUE CASE PERFOMERS 1 BRI 2011 U.S.$6 million Forgery, burglary Cash Office
Supervisor 2 Bank
Mandiri 2011 Rp 18 billion Forgery signature
on the withdrawal slip
Customer Service
3 Bank BNI 2011 - Counterfeiting slip Vice Chairman Letter of Credit decisions of Depok
4 Bank Danamond
2011 Rp 1,9 M and 110 $ US
Embezzlement of Customer Funds
Head Teller

ISSN 2302-786X
46 Proceeding of Annual South East Asian International Seminar (ASAIS) 2013
NO NAME YEAR VALUE CASE PERFOMERS 5 Panin Bank 2011 Rp 2,5 M Embezzlement Chief of Operations
Customer Fund 6 Citibank
Landmark 2011 Rp 16,63 M Embezzlement Senior Relationship
Manager 7 Mega Bank 2011 Rp 111 M Fraud Investment
Deposit Head Branch
Source: Adapted from Compass . com 2011.
Of crime data bank above , shows that the banking crime , both in the government and private commercial banks , of which there are many cases , have considerable value for money , as well as most of the perpetrators were in or the bankers . These cases is not the first case ( before the economic crisis of 1997) , some time before the crime in the banking sector, which we know as the evil " white collar " has several times occurred for instance the case of BNI bank and others. To minimize and detect the occurrence of crime in the banking company , the company should focus on corporate governancebased on a set of ethical principles that guide the company to make a decision or action . In addition ,developing a corporate governance framework to reduce the risk and detection offraud that might arise ( Nabhan - Hindi , 2009) . Efforts to deter violations and bank fraud , Bank Indonesia has made a Rule of Good Corporate Governance , as well as ethical guidelines for commercial banks , issuing and Regulations on Test Fit and Proper Test ( Fit and Proper Test ) which is intended for prospective bank officials . Both regulations are closely related to behavioral and ethical issues , especially for bankers to run the bank's operations A crime that occurred in banking, for it can be argued that the opinion Cressey (1968) pointed out that the crimes committed by them is related to the job, no breach of trust by the manager. There is a conflict between
the role of a businessman with a role as a professional, as well as to rationalize their crimes.As in the above data , the figures showed that almost all bank crimes committed by those who have a position or authority for each task , such as director , branch manager , deputy director , head teller , supervisor , and so on . Of these conditions , the managers , are ideally before taking office have passed the fit and proper test and after that , in carrying out his duties the principles of corporate governance ( GCG ) as ethical .
2. THEORY Ethics is the study of all things good and evil in human life , especially regarding the movements of thought and feeling which can be a consideration and feelings , in the form of its intention to act ( Zubair , 1995) . With ethics , humans are expected to behave in the absence of guidance , especially in their role , both as individuals and in society . Similarly, ethics is the science which deals with morality or a science that investigates moral behavior ( Bertens , 2004 ) . Ethics is a reflection of what is called "self control" , because everything was built and applied from and to the interests of social groups ( professional ) itself . To get the same concept of the good and bad assessment for all human beings to an act in a group , space and time.In the business community , especially the banking business , the code of conduct has been defined as the Code of Conduct in business activities in

ISSN 2302-786X
Proceeding of Annual South East Asian International Seminar (ASAIS) 2013 47
the company ( Code of Corporate and Business Conduct), an implementation of one of the principles of Good Corporate Governance.
Code of ethics , demanding the bankers to conduct ethical business practices are the best in all things done on behalf of the bank . If this principle is deeply embedded in the culture of the bank ( bank culture) , all bankers in the bank should try to understand and try to adhere to the " which should " and " which should not be " carried out in the banking business . Violation of the Code of Conduct is a serious matter , even be categorized as a violation of the law or the so-called crime . Therefore there is the aggrieved party , in this case is the loss of material.
2.1 Bankers Code Bankers as one of a variety of professions , where they are incorporated into the business organization called the Bank . Profession into a group that has its own power and because it has a special responsibility , has a monopoly on a particular skill , so there is a danger of a profession that is closed to outsiders and themselves into a circle that is difficult to penetrate ( Bertens , 2002 ) . In the banking world are accepted and adhered to by the national bankers and then settles into a normative. Ethical banking is a good habit or regulations in the banking world are accepted and adhered to by the national bankers and then settles into a normative ( Simorangkir , 1985 ). The existence of a code of conduct , attempted to compensate for the state , which is expected to memperbasar
public trust in the professions . Similarly, in order to function properly the profession , it is necessary to create a code of ethics created by the professional community . From there it will be black and white set his intention to embody moral values are essential , which are not imposed from outside .
Every banker in Indonesia are required to manage the bank in a healthy respect for the norms and banking are applicable , comply with all the values as basic guidelines in determining attitudes and actions . Banking norms recognized , accepted and adhered to the Code of Conduct contained in the Indonesian Bankers in the contents as follows:
1. A banker comply with and obey the laws and regulations applicable regulations.
2. Keep records correct on all transactions related to bank activities.
3. Refrain from unfair competition .
4. Not misuse authority for personal benefit.
5. Refrain from involvement in the decision -making kepentingan.gambilan event of a conflict.
6. Maintain confidentiality of customer and bank.
7. Can take into account the impact of any policy set merugikandari bank against economic , social and environmental .
8. Not accept gifts or rewards that enrich themselves personally and their

ISSN 2302-786X
48 Proceeding of Annual South East Asian International Seminar (ASAIS) 2013
families, which can enrich themselves personally and their families.
9. Not committed a disgraceful act that could harm the image of his profession .
3. METHODOLOGY In obtaining the required data , it will perform the following phasesStudies LibraryRead the case files District Court or the Supreme Court , literature , scientific journals , articles , case files related to the investigation of the problemof evil / banking violations Interviews .Conducted to determine what are the factors that encourage and influence the perpetrators perbankann it to do so . Interviewswill be conducted with the participants , whether they are in prison or who have completed their sentences. Data and Study SampleSecondary data required is data on banking crime obtained from official institutions , namely the South Jakarta District Court , Central Jakarta District Court , to the Supreme Court premises Republic of Indonesia in Jakarta . This is because in the process of doing research guidance in the completion of a dissertation , the Promoter suggestions have been changes in other research methods , namely a multiple case study.
4. ANALYSIS Atthis stage, researchers have not beenable toconcludeon the whole, but onlyto the extentthe identification ofbank fraudcasesthat have beendecided bythe Supreme Court. So itis still thecase fileanalysisdocumentsthatthe perpetratorsbanking crimes .Theyhave broken the law, thebanking lawand code of ethicsas has beenenforced forthe bankers. For his actions, then the perpetratorsto be punishedin
accordancewiththe level ofoffensethey have done.
5. CONCLUSION Developments in the field of financial crime , particularly in the banking industry is still going on , especially in terms of quality . This dissertation research emphasis on ethics violations that can lead to a crime in banking . Banking crime in criminology included in the white collar crime , the perpetrator is a general characteristic of a highly educated , high social status . In the banking sector white collar crime , most perpetrators are men in the bank ( banker ) , with the victims were bank customers . Need for subsequent research , so that ethical issues in a variety of professions , especially bankers , further expanded . For the existence of something more womanly ethics precedence in discussing issues of human behavior , in order to act in defiance of the rules can be minimized.
6. BIBLIOGRAPHY [1] Appelbaum H. Steven, et al.
2009. (Good) corporate governance and the strategic integration of meso ethics", Social Responsibility Journal, Vol. 5 Iss: 4, pp.525.
[2] Bertens, K. 2004. Etika. Jakarta. PT Gramedia Pustaka Utama.
[3] Holtfreter, Kristy, 2005. Is Occupational Fraud “Typical” white-collar crime? A Comparison of Individual and Organizational Characteristics. Journal of Crime Justice. Florida State University, College of Criminology, 634 West Call Street, Tallahassee, FL 32306-1127, United States
[4] Joseph, Heath. 2008. Business Ethics and Moral Motivation: A
ISSN 2302-786X
Proceeding of Annual South East Asian International Seminar (ASAIS) 2013 49
Criminological Perspective. Journal of Business Ethics 83:595–614 _ Springer 2008
[5] Lukviarman, Niki. 2004 "Etika Bisnis Tak Berjalan Di Indonesia: Ada Apa Dalam Corporate Governance?"Jurnal Siasat Bisnis: 139-156.
[6] Mackenzie, Craig. 2004. Moral Sanctions: Ethical Norms as a Solution to Corporate Governance Problems.The Journal of Corporate Citizenship 15: 49-61.
[7] Mugalu, Geoffrey, etc.2010. The Role of Senior Leadership in Ethical Behavior of Financial Institutions: A Case Study. Capella University.
[8] Mustofa, M. 2013. Metode Penelitian Kriminologi. Edisi Ketiga. FISIP UI Press.
[9] Mustofa, M. 2010. Kleptokrasi-Persekongkolan Birokrat-Korporat Sebagai Pola White Collar Crime di Indonesia. Jakarta: Kencana Prenada Media Group.
[10] Nabhan, Latif R.A, and Hindi, M. Nitham. 2009. Bank Fraud: Perception of Bankers in the State of Qatar. Academy of Banking Studies Journal, Volume 8, Number 1. Qatar University.
[11] Nitibaskara, T. R. 2001. Ketika Kejahatan Berdaulat. Jakarta: Peradaban.
[12] Phongstorn, Ermongkonchai. 2010. Understanding Reasons for Employee Unethical Conduct in Thai Organizations: A Qualitative Inquiry. Contemporary Management Research 6. 2: 125-140.
[13] Quinney, Richard and Marshal B Clinard. 1972.Criminal Behavior
System ATypology.Second Edition. Chapel Hill, Nort Carolina: Madison, Wisconsin.
[14] Schell-Busey, etc. 2009.The Deterrent Effects of Ethics Codes for Corporate Crime: A Meta-Analysis.University of Maryland, College Park, 2009. 2009. 3359755.
[15] Sembiring, Sentosa. 2000. Hukum Perbankan. Bandung. CV. Mandar Maju.
[16] Simorangkir, O.P. 1985. Etik dan Moral Perbankan. Jakarta.Ind-Hill, Co.
[17] Singleton,Tommie;King Brett, et al. 2003.Pro-ethics activities: Do they really reduce fraud?.The Journal of Corporate Accounting & Finance14.6 (Sep/Oct ): 85-94.
[18] Sutherland, E.H. 1983. White Collar Crime. With an Introduction by Gilbert Geiss and Colin Goff. New Haven and London. Yale University Press.
[19] Tran, Ben. 2008. Corporate Ethics: An End to The Rhetorical Interpretations of an Endemic Corruption. Social Responsibility Journal4. 1/2: 63-81.
[20] Wiryosukarto, Darto. 2012."Agar BPD Aman Dari Fraud." No. 396 Vol.XXXIV. Diakses pada 7 Maret 2012 6667dihttp://www.bi.go.id/web/id/Tentang+BI/Perpustakaan/Periodikal/default.aspx?iddl=71288.
[21] Yeager, Marshal B Clinard and Peter C. 1980.Corporate Crime. New York: The Free Press.
[22] Undang-Undang Perbankan Nomor 10 Tahun 1998 dan Peraturan Bank Indonesia Nomor 8/4/PBI/2006 tentang Good Corporate Gocernance bagi Bank Umum.

ISSN 2302-786X
50 Proceeding of Annual South East Asian International Seminar (ASAIS) 2013

ISSN 2302-786X
Proceeding of Annual South East Asian International Seminar (ASAIS) 2013 51
Jakarta and Yogyakarta as A Mice Destination
Heri Setyawan1, Djuni Akbar2 and Christina L Rudatin3 1,2,3MICE Study Program State Polytechnic of Jakarta
Depok 16425 email: [email protected]
Abstract
The purpose of the study is to map the leading MICE destinations in Indonesia, which has a strength that is not the same with each other as well as to provide an overview for local government and relevant stakeholders in developing MICE destinations globally competitive and sustainable. So that each profile has a MICE destination of each different in terms of potential. As the initial development of MICE destination, there are two destinations, namely Jakarta and Yogyakarta. There are 9 criteria and 68 indicators were used to obtain the data mapping MICE destinations in Indonesia. From the data obtained, the Yogyakarta achieved a score of 3.34 from a scale of 5, so the above is categorized. While Jakarta is good enough, that score is 3.65 of scale 5. The next step is to get input from expert judgment, of the MICE industry (PCO / PEO / other), most of which stay in Jakarta. Keyword : mice destination, Jakarta, Yogyakarta 1. INTRODUCTION Indonesia is one of countries that has a large potential destinations, but in fact it has not been able to the top destination of choice for International events. According to the statistics, ICCA (International Congress and Convention Association), Association for organizing meetings in 2010, Bali is the 67th of rank, It held the International events 27 times. The rank is further when we compare to other ASEAN countries such as Singapore which is the fifth of rank (136 meetings), Kuala lumpur is the 23rd of rank (79 meetings) and Bangkok is the 39th of rank (55 meetings). But Bali is still much better than other destinations in Indonesia, such as Jakarta, which is 112nd of rank only (16 meetings) and Bandung is 309th of rank (5 meetings).
Meanwhile, we don’t have any agreement to appoint the city as a MICE destination, Recorded some information released by the government agency responsible for the regulation, namely Tourism and
Creative Economy Ministry. Determination which is done is always changing.
To the middle of 2008 , ten cities made or promoted as a leading MICE destination in Indonesia. As the standardized of MICE destination, they should be have many facilities, such as; the capacity and the implementation of these events internationally. At that time, the ministry release ten cities, including Jakarta, Bali, Batam, Surabaya, Medan, Yogyakarta, Padang, Makassar, Manado, and Bandung. The reason is that the facilities of city for MICE events at least 500 participants, meeting facilities, lodging, and international access (bisnis.com, June 6, 2008). So many cities claim itself as a MICE destination, regardless of whether the standards are met or not, which is essential not want to miss. But at the beginning of this year, precisely in March 2009, the ministry said there were 10 major tourist destination (Jakarta , Yogyakarta, Surabaya, Bali, Balikpapan, Medan, Batam - Bintan,

ISSN 2302-786X
52 Proceeding of Annual South East Asian International Seminar (ASAIS) 2013
Padang - Bukittinggi, Makassar, and Manado) . Suddenly appeared Balikpapan standed to replace Bandung. Then, the event of Sumatra International Travel Fair 2009 in Padang, the ministry officials stated that there are 14 Indonesian MICE destinations. In December 2012 , the Ministry of Tourism and Creative Economy through Tourism Destination Development Directorate stated there are 15 MICE destinations, namely Jakarta, Yogyakarta, Surabaya, Bali, Lombok, Makassar, Medan, Padang, Batam, Manado, Semarang, Lombok, Palembang, Balikpapan, and Padang.
The problem, not changing the amount and which city as a leading MICE destination in Indonesia, but it doesn’t have some criteria of city as a MICE destination.
It doesn’t have profile of MICE destination, because they don’t have some criteria of city as a MICE destination.
2. THEORY Based on “ The World Tourism Organization”, Destination is a location where visitors spent at least one night and packed in a tourism product that is supported by the services as well as tourism attractions and resources, as well as having boundaries, both physically and administration as well as the image shows perception of market competitiveness.
Traditionally, the destination will respond with a decrease number of tourist, by increasing their spending on marketing destinations ( Buhalis 2000; Ritchie
and Crouch 1993). This strategy was later to become less effective as more and more destinations that do the same thing, but the result is very limited (Vengesayi , ANZMAC 2003 Conference proceedings Adelaide, 2003). Therefore, it is necessary to find ways to increase tourist arrivals to be further explore opportunities arrival of various types of tourists (visitors). The visitors who come to a destination can be divided into two categories, namely the first visitors for business purposes (business visitors ). Included in this category are business visitors, those who come for the sake of meetings, congresses/conventions and exhibitions, or better known to tourists MICE (Meeting, Incentive, Convention and Exhibition). The second category is for non business visitors, including visitors who come here, of course, it has benefit traveled, enjoy the beauty of uniqueness destination, and visitors who will meet with many friends or family (Kotler, Haider, Rein, 1993). There are several versions criteria of the city as a MICE destination, eg. the theory of expert marketing, Philip Kotler (Marketing Places) stated there are four factors, namely: (1) image marketing, (2) attractions, (3) infrastructure, and (4) people. Article "Macao 's MICE Dream: Opportunities and Challenges" which was written by Sanjay Nadkarni and Aliana Man Wai Leong (International Journal of Event Management Research, volume 3, no.2, 2007) found the critical attributes to be a MICE destination. These attributes are : (1) MICE facilities and lodging, (2) Cost and affordability, (3) Leisure and entertainment facilities, (4) Service & professionalism, (5) Infrastructure & accessibility, (6) Business - friendliness and image, and (7) Government support.

ISSN 2302-786X
Proceeding of Annual South East Asian International Seminar (ASAIS) 2013 53
The aim of the Mapping Power MICE Destinations is to determine and measure the strength of leading destinations in Indonesia that have unequal power between each other as well as to provide an overview for local government and relevant stakeholders in developing MICE destinations globally competitive and sustainable. As an outcome of this study is the availability profile MICE Destinations cities / regions in Java.
The research is important so that no longer declared a city/region as a MICE destination without basic studies. If a region /city into the future development of MICE destination will be more focused.
Profile MICE Destinations can be beneficial to stakeholders are as follows:
a. Central Government as the basic for determining reference MICE destinations
b. The local government / destination as a basic for assessing the self-evaluation as a MICE destination
3. METHODOLOGY Stages of the research to be carried out is as follows:
1) Phase Preparation and Assessment destinations using critetria that have been set by the Development Destinations of Kemenparekraf.
2) Survey to destination/city in Java Island, Kemenparekraf recommended , namely : Jakarta and Yogyakarta,
3) Survey to the MICE industry (expert judgment).
4) To process and analyze the data.
5) Create a profile of MICE destination for Jakarta and Yogyakarta.
4. ANALYSIS Phase Preparation and Assessment destinations using criteria that have been set by the Development Destinations Kemenparekraf ( Compilation Indicator ).
After the criteria of a destination was agreed , then the next step is the determination of indicator . Indicators of each criteria will be described as follow;.
1) Indicators for Accessibility Criteria
Accessibility criteria is how the participants / delegates a congress / conference / meeting , the winners , the exhibitor ( exhibitor ) and the exhibition visitors ( visitors) can reach a destination easily and comfortably , both in terms of time , effort and cost.
From the result of desk research could be generated 8 indicators . Each indicator for accessibility criteria are: International Airport , cost, Flight schedule, Flight frequency, Leisure Transit, Customs services, Immigration and Quarantine services, and Airport connectivity.
2) Criteria Indicators for Local
Stakeholder Support
Criteria Local Stakeholder Support is the support provided by the stakeholders who contributed to the MICE events effectively, which are consists of : Professional Associations and Industry, Destination Marketing Organization, Local Government.
3) Indicators for Criteria Places of Interest ( Places of Interest )

ISSN 2302-786X
54 Proceeding of Annual South East Asian International Seminar (ASAIS) 2013
‘Places of Interest’ is interesting places to the participants / delegates congress / conference / meeting , the winners , the exhibitors and visitors to visit. These places can be comprised of: Attractions and Points of Intereste d, Mall, Restaurant, Entertainment places, Landscape, Recreation, and Business opportunities.
4) Indicators for Facilities Accommodation
Accommodation facilities are have the comfortable facilities for lodging in the destination sector in order to carry out their duties. The convenient destination, when there are several indicators, they are: Variety and Type Accommodation, Capacity, Price, Quality of Service, Security and Availability.
5) Indicators for Meeting Facilities
Basically, whatever the participant do, actually they would be hold a meeting . So, MICE activities should have the facilities to conduct meetings . These facilities are : Variations Venue , Capacity, Layout, Atmosphere, Service, Security, and Availability
6) Indicators for Facilities Exhibition
The exhibition is one of component of MICE which is mostly done , but it is still far from international standards. The exhibition can be categorized in order to international exhibitions , it needs some supporting facilities as follows : Variations Venue , Capacity, Layout, Atmosphere, Service, Security, and Availability.
7) Indicators for Destinations Image
The image of a destination is a necessary indicator, because it will increase the destinations image. Some indicators of Destinations image is as follows: Experience Destinations, Reputation, Security, Social Political Economic conditions, Hygiene, Risk, and Marketing Destinations.
8) Environmental Indicators for State
The environment is a contributing factor may be regarded as MICE destinations, which consists of : Infrastructure, Police, Hospital, Money Changer , Banking, Post Office, Public transport, Hospitality General Public, Local culture and Maintenance.
9) Indicators for HR Professionalism
Destination is as good as anything if not supported by human resource professionals will be able to damage to all MICE activities . HR professionalism indicators consist of : PCO /PEO/ DMC/ EO, Travel Agent, Freight Forwarder, Related contractors MICE, Tour Guide, Hospitality Arts and Culture, Printing services, Airport Authority Services, Related Institutions MICE, and Airlines Flights,
4.1 Analysis Mapping of Yogyakarta and Jakarta Destinations For each Assessment criteria and destinations look into each indicator is given a scale as follows:
Scale
1 2 3 4 5
Very Poor Poor Fair Good Very Good
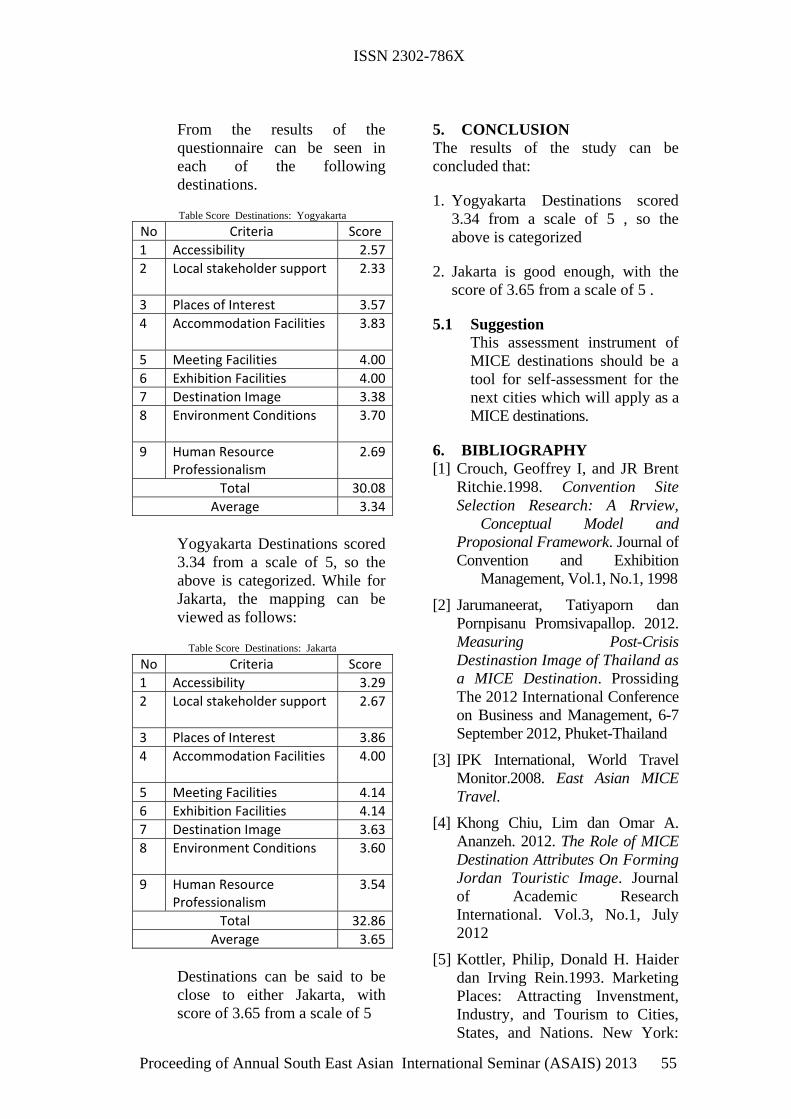
ISSN 2302-786X
Proceeding of Annual South East Asian International Seminar (ASAIS) 2013 55
From the results of the questionnaire can be seen in each of the following destinations.
Table Score Destinations: Yogyakarta
No Criteria Score
1 Accessibility 2.57
2 Local stakeholder support
2.33
3 Places of Interest 3.57
4 Accommodation Facilities
3.83
5 Meeting Facilities 4.00
6 Exhibition Facilities 4.00
7 Destination Image 3.38
8 Environment Conditions
3.70
9 Human Resource Professionalism
2.69
Total 30.08
Average 3.34
Yogyakarta Destinations scored 3.34 from a scale of 5, so the above is categorized. While for Jakarta, the mapping can be viewed as follows:
Table Score Destinations: Jakarta
No Criteria Score
1 Accessibility 3.29
2 Local stakeholder support
2.67
3 Places of Interest 3.86
4 Accommodation Facilities
4.00
5 Meeting Facilities 4.14
6 Exhibition Facilities 4.14
7 Destination Image 3.63
8 Environment Conditions
3.60
9 Human Resource Professionalism
3.54
Total 32.86
Average 3.65
Destinations can be said to be close to either Jakarta, with score of 3.65 from a scale of 5
5. CONCLUSION The results of the study can be concluded that:
1. Yogyakarta Destinations scored 3.34 from a scale of 5 , so the above is categorized
2. Jakarta is good enough, with the score of 3.65 from a scale of 5 .
5.1 Suggestion This assessment instrument of MICE destinations should be a tool for self-assessment for the next cities which will apply as a MICE destinations.
6. BIBLIOGRAPHY [1] Crouch, Geoffrey I, and JR Brent
Ritchie.1998. Convention Site Selection Research: A Rrview, Conceptual Model and Proposional Framework. Journal of Convention and Exhibition Management, Vol.1, No.1, 1998
[2] Jarumaneerat, Tatiyaporn dan Pornpisanu Promsivapallop. 2012. Measuring Post-Crisis Destinastion Image of Thailand as a MICE Destination. Prossiding The 2012 International Conference on Business and Management, 6-7 September 2012, Phuket-Thailand
[3] IPK International, World Travel Monitor.2008. East Asian MICE Travel.
[4] Khong Chiu, Lim dan Omar A. Ananzeh. 2012. The Role of MICE Destination Attributes On Forming Jordan Touristic Image. Journal of Academic Research International. Vol.3, No.1, July 2012
[5] Kottler, Philip, Donald H. Haider dan Irving Rein.1993. Marketing Places: Attracting Invenstment, Industry, and Tourism to Cities, States, and Nations. New York:

ISSN 2302-786X
56 Proceeding of Annual South East Asian International Seminar (ASAIS) 2013
The Free Press
[6] Nadkarni, Sanjay dan Aliana Leong Man Wai. 2007. Macao’s MICE Dream: Opportunities and Challenges. International Journal
of Event Management Research, Vol.3, No.2, 2007.
[7] Su Richard Tan, Cheong. 2007. A Comparative Analysis of MICE Destinations between Macao and Singapore. UNLV Theses/Paper 704, 12-1-2007

ISSN 2302-786X
Proceeding of Annual South East Asian International Seminar (ASAIS) 2013 57
Implementing of Inclusive Education Model Based on Potential
Student at Politeknik Negeri Jakarta to Create Special Needs Who
Have Skill and Self Confidence
Nur Hasyim
1, Ade Sukma Mulya
2 and Sri Wahyono
3
1,2,3 Politeknik Negeri Jakarta Lecturer
Abstract
This study investigated implementing of inclusive education model based on potential student at
Politeknik Negeri Jakarta to create special needs people that have skill and self confidence. The
focus research (1) can implementate of inclusive education model based on potential student, (2) can
identify effective inclusive model: student admission system, curriculum, learning system, teacher,
infra structure, competence student outcome, and alumnus distribution system. The data collecting
used direct observation at research field, that is Politeknik Negeri Jakarta, interview to student,
teacher, and student parent. The data then analysed with desriptive analysis. The result research is
(1) student admission system can be used well, (2) curriculum design can be implemented well, (3)
learning system can be implemented well, (4) teacher criteria can be implemented well, (5) infra
structure criteria can be implemented well, and (6) student competence and alumnus distribution
system not yet known.
Key word: inclusive education, implementing, effective
1. INTRODUCTION
The research implementing of
inclusive education model based on
potential student at polytechnic to
create special needs people that have
skill and self confidence is furthur
research of Nur Hasyim. The last
research of Nur Hasyim, that is (1)
Implementing inclusive education at
Politeknik Negeri Jakarta (2011), and
(2) Forming Inclusive education
model for politechnic education
(2012). Essency of Forming Inclusive
education model for politechnic
education is inclusive education
model based on potential bring
through to create special needs people
that have skill and self confidence.
That principle of education model is
(1) the system selection is used
selection of academic ablity,
psikology data/test, helth data/test, (2)
curriculum is designed based on
competency, (3) learning system is
done flexible by considering student
condition, (4) teacher was given
inclusive education knowledge, (5)
infra structur is design standar by
adding infrastructure special needs,
(6) good competence alumnus, and
(7) building alumnus distribution
system.
The focus of research is investigated
effectivity of implementing of
inclusive education model based on
potential student at polytechnic to
create special needs people that have
skill and self confidence How?
2. THEORY
Bagian 2 menjelaskan Teori yang
digunakan dalam penelitian yang
yang dilengkapi dengan gambaran
model, hipotesis analisis atau
rancangan dan implementasi.
Reffered to the prior reseacrh
conducted, It did not find a model for
inclusive education for slow learners,
but the researchers found the model
applied in inclusive education for
senior high schools researched by
Fuadi (2010), Irenewaty and
Aman(2010). Fuadi said that model
for inclusive education at the senior
high school level can use full
inclusion model. The model involved

ISSN 2302-786X
58 Proceeding of Annual South East Asian International Seminar (ASAIS) 2013
all the participants in normal or
regular class, and partial inclusion
model; this model only involved
participants attending only part of
subjects in regular class, and the other
parts of the the subjects were studied
in the special class assested by
teachers.
According to Irenewati’s and Aman’s
research finding said that there was no
clear standar or criteria in managing
and conducting inclusive education.
On the other hand, Nowdays
presently, The state Polytechnic of
Jakarta is an higher vocational
education institution which conducted
inclusive education for slow learners.
The Polytechnic has been condacting
the inclusive education since
academic year of 2009/2010. In
academic year of 2009/2010, The
Polytechnic received 12 students, and
in accademic year of 2010/2011, the
Polytechnic received 11 students. In
accademic year of 2011/2012, the
Polytechnic received 11 students. The
total students until Febuary 2012 was
33 students.
Nur Hasyim (2010) had done the
reseach related with the
implementation of inclusive education
at State Polytechnic Of Jakarta. His
reseach only focused on the
implementation, not on evaluation, so
the researh has not found the model
for inclusive education for slow
learners. On the other hand, the
inclusive education is still new and it
needs the model that will be used as
criteria or guiden in managing,
conducting and evaluating the
education. Related with the evaluation
reseach on inclusive education, the
research can find the model that can
be implemented in inclusive
education for a higher vocational
education level.
3. ANALYSIS AND
DISCUSSION
The research finding is inclusive
education which is conducted in
Politeknik Negeri Jakarta at 2010—
2012 is focusing on how to prepare
the students have an enterpernership
so they become independent for
living. The program is Diploma I and
II. The students are slow learner with
their IQ between 70 up to 90.They
must study some subjects such as
English, Inonesian Language,
Communication, computer,
introduction to business etc. They are
taught by most of the teachers who
have no experiencesto handle slow
learners.
With the limitation of their IQ, in the
process of learning, they have
difficulties to understand the classes,
and even they did not find anything
from learnning process. They do not
seem to have some interests to learn
more about knowledge needed a
contrentration and an analysis. If the
education system does not change and
find new model , the education wiil
not advantage for the them.
When the inclusive students are not
interested with a subject, their
expression will show unhappy and
even they will not give any respond,
but they will be happy with the class
and give any respond if they like the
subjects. Based on the observation,
they would learn the subjects well if
they were interested in the subjescts,
and they would like the subject if it is
closely related with their interest or
potency. In relation with fact findings
, the education system must be
developed their potency that have
been brought before. If the
educational system is developed
based on their potency, the inclusive
education will result graduates who

ISSN 2302-786X
Proceeding of Annual South East Asian International Seminar (ASAIS) 2013 59
have certain skill and the skill can
help them become idependent.
Another research finding is the
inclusive students alwayas need over
protection from any body . One of the
reasons why they always need
oveprotection, the family always
protect them overly. It is very
contrasted with the goal of inclusive
education. One of the output of the
education goals is independence.
When education model for slow
learners is designed, one of the
aspects that must be considered is
how to create the educational
systems that can release the students
against the needs of overprotection.
The ideal process of teaching and
learning for the inclusive students is
mixing with normal students. The
class mix is one process to make the
slow learners independent, and also
they have opportunities to interact
with the reguler students. To achieve
the class mix, some teachers had
mixed the slow learners with regular
students. The result of the mix, the
slow learners were difficult to adapt
with environment and even they felt
unhappy and underpresser. Based on
the result, the class mix must be
avoided because it will have negative
effect to their health. One of the
reasons why they could not enjoy
when they were mixed because their
IQ cannot meet the IQ standard for
studying in higher education level.
With the limitation of their IQ, they
are not able to learn the subjects
requesting analysis and
comprehension.
The researhers observed their
behavior when the inclusive students
were mixed with regular students for
the practical subjects like computer,
photo graphy, design grafis, or art.
The result of the class mix showed
that the slow learners were able to
adaft such enivironment, and they
seemed to have intersts to learn more
about the class because they could
learn visual subjects , and it could be
observed directly. It is a valuable
finding to support the education
model for slow learners.
The other research finding is some
inclusive students have closely
relationship with the normal students.
The close relation happened because
they are used to interact each other. It
is also a valuable finding to be
considered into the educational model
for slow learners. To create The
environmental mix, the class rooms
are set side by side with the normal
students’classrooms, so the inclusive
students will have more opportunities
to interact naturally with normal
students.
The inclusive education for slow
learners must be developed based on
students’ potency or talen. If there are
ten studets with different potency, the
curriculum must be designed to
develop their different potency. If
there are 10 potencies, there are 5
curricular. One of the reseach was
finding one of the participants named
Satrio. He has a potency or talented in
Photography. He is not interested in
any subjects, except potography. In
the college, he focused on
development of his skill in
photography. After he graduated from
his study , he works as a photografer
in a photostudio company. Another
subjects like Bahasa Indonesia,
Communication, English, computer
that he learned during his study
helped him to have a good self
confidence. Such best practice is a
valuable finding that can support to
the education model for slow learners.

ISSN 2302-786X
60 Proceeding of Annual South East Asian International Seminar (ASAIS) 2013
On 2013, Politeknik Negeri Jakarta
held Diploma III, Concentration
Desain Grafis, Aplikasi Komputer,
dan Seni for special need people with
used inclusive education model based
on potential student to create special
needs people that have skill and self
confidence.
That principle of education model is
(1) the system selection is used
selection of academic ablity,
psikology data/test, helth data/test, (2)
curriculum is designed based on
competency, (3) learning system is
done flexible by considering student
condition, (4) teacher was given
inclusive education knowledge, (5)
infra structur is design standar by
adding infrastructure special needs,
(6) good competence alumnus, and
(7) building alumnus distribution
system.
The significant result research is (1)
student admission system can be used
well, (2) curriculum design can be
implemented well, (3) learning system
can be implemented well, (4) teacher
criteria can be implemented well, (5)
infra structure criteria can be
implemented well, and (6) student
competence and alumnus distribution
system not yet known.
Steps of developing potency for
inclusive students:
1. Identify the student’s potency .
2. Group the students according to
their potency or talend.
3. Set curricullum and sylabuss for
developmen of potency
4. Assess the development of
student’s potency periodically
5. Have developed potency.
6. Work with his developed potency.
4. CONCLUSION
Implementing of inclusive education
model based on potential student at
Politeknik Negeri Jakarta to create
special needs people that have skill
and self confidence is (1) student
admission system can be used well,
(2) curriculum design can be
implemented well, (3) learning system
can be implemented well, (4) teacher
criteria can be implemented well, (5)
infra structure criteria can be
implemented well, and (6) student
competence and alumnus distribution
system not yet known.
5. BIBLIOGRAPHY
[1] Azizah, Nur. 2011. “Pendidikan
Inklusi bagi Anak Berkebutuhan
Khusus”.Dalam Jurnal
Perempuan.com. Diakses pada 5
Februari 2011.
[2] Convention on the Rights with
Disabilities and Optional
Protocol.Disahkan pada Maret
2007.
[3] Deklarasi Bandung: Indonesia
Menuju Pendidikan Inklusi.
2004. Dalam
http://www.idpeurope.org/indone
sia/compendium/id/deklarasi_ban
dung.php, Diakses 20 Desember
2009).
[4] Dika. 2010. “Pendidikan Inklusi.
Dalam
wordpress.com/2009/02/20/pendi
dikan-inklusi”.Diakses 29
November 2010.
[5] Direktorat Pembinaan Sekolah
Luar Biasa, Dirjen Manajemen
Pendidikan Dasar dan Menengah.
2009. ”Pendidikan Inklusi”.
Bahan pelatihan.
[6] Edeswari. 2009. Pendidikan
Inklusi.Dalam
http://elvinadeswari.wordpress.co
m/2009/02/20/pendidikan-

ISSN 2302-786X
Proceeding of Annual South East Asian International Seminar (ASAIS) 2013 61
inklusi/. Diakses pada 20
Desember 2009.
[7] Erenawaty, Terry dan Aman.
2010. ”Evaluasi kebijakan
Pendidikan Inklusi di SMA
Muhammadiyah 4 Yogyakarta”.
Hasil Penelitian.
[8] Fuadi, Kamal. 2010. “Pendidikan
Inklusi”. Hasil penelitian.
Dalam http://fuadinotkamal.wor
dpress.com/2011/04/12/pendidik
an-inklusif. Diakses 1 Febrauari
2012.
[9] Hadjam, M. Noor Rochman.
2010. Pendidikan Inklusi. Dalam
Webinar Transcript. Diakses
pada diakses 5 Februari 2011.
[10] Nur Hasyim dan Ferlian. 2010.
”Perubahan Karakter Mahasiswa
Inklusi Angkatan 2009/2010
setelah Mengikuti Pendidikan
Inklusi pada Politeknik Negeri
Jakarta.” Laporan Penelitian.
[11] Nur Hasyim dan Darul Nurjanah.
”Pelaksanaan Pendidikan Inklusi
pada Politeknik Negeri Jakarta”.
Dalam Epigram, vol. 8, No. 2,
Oktober 2011. Depok.
[12] O'Neil, John. 1994. Can
Inclusion Work? A Conversation
with Jim Kauffman and Mara
Sapon-Sevin, 1 Desember 1994.
[13] Peraturan Menteri Pendidikan
Nasional Republik Indonesia
Nomor 70 Tahun 2009 tentang
Pendidikan Inklusif bagi Peserta
Didik yang Memiliki Kelainan
dan Memiliki Potensi Kecerdasan
dan/atau Bakat Istimewa.
[14] Sugiyono. 2006. Metode
Penelitian Pendidikan:
Pendekatan Kuantitatif,
Kualitatif, dan R&D. Bandung:
Alfabeta.
[15] Suparno. ”Pendidikan Inklusif
untuk usia Dini”. Dalam Jurnal
Pendidikan Khusus UNY, Vol. 7,
No. 2, November 2010
[16] Tim Bintangbangsaku. 2010.
“Konsep Pendidikan Inklusi”.
Dalam
www.bintangbangsaku.com.
Diakses pada diakses 5 Februari
2011.
[17] Undang-Undang No. 20 Tahun
2003 tentang Sistem Pendidikan
Nasional

ISSN 2302-786X
62 Proceeding of Annual South East Asian International Seminar (ASAIS) 2013

ISSN 2302-786X
Proceeding of Annual South East Asian International Seminar (ASAIS) 2013 63
Identification of Program Mahasiswa Wirausaha (PMW)
in Politeknik Negeri Jakarta
Kadunci
1, Lenny Brida and Tuti Hartati
1Department, Faculty,University
Postal Address
email : [email protected],
Abstract
In the future, Indonesia needs a lot of new entrepreneurs in pursuit of 2 % of the total population,
while today only about 1.55 % of the total population. Politeknik Negeri Jakarta (PNJ) as
educational institutions share responsibility in developing or creating new entrepreneurs. PNJ has
been providing assistance to students in six majors in PMW activities. The problem faced today is
whether PMW do SPOTCHECK (periodic monitoring)?. In the selection of recipients PMW,
psykotes not implemented to determine the recipients have entrepreneurial spirit or not. In addition,
the Committee doesn’t involve a third party in the selection process, for exampleUMKM or banks in
the selection of Business Plan. Internships Programe for prospective recipients PMW has not
performed optimally. PMW late disbursement of funds from the Directorate General of Higher
Education, Ministry of Education (DIKTI), influential in the business activities must to do. In fact,
the implementation of a business by receiver can not run optimally, because the duties and functions
of the PMW supervisor unclear. Monitoring PMW not run properly, the task of monitoring for
DirectoreD3 staff or supervisor. Business reporting by participants receiver is not done consistently.
Receivers partially still in doubt, whether to continue the focus of business /entrepreneur with a
guarantee izajah or want to find work with the risks in return the funds to Pembantu Direktur 3.
Key words: Spotcheck,Program MahasiswaWirausaha
1. INTRODUCTION
As a complement to the programs that
have been there before , since 2009
the Government through the
Directorate General of Higher
Education, Ministry of Education
(DIKTI) and Culture has launched the
Program Mahasiswa Wirausaha
(PMW) to be implemented and
developed by universities . The
program is implemented in the entire
State College (PTN) and in some
private universities (PTS) selected
results of Private Higher Education
Coordinating (Kopertis) with the
allocation of different funds . PMW
aims to provide a stock of knowledge
, skills and attitude or spirit of
entrepreneurship based science and
technology to students in order to
change the mindset of job seekers to
be a job creators as well as being a
tough businessman and successfully
face global competition. In the
framework of sustainability, the
program also aims to encourage
institutions to universities to support
the development of entrepreneurship
programs.
As a final result, it is expected the
decline in the unemployment rate of
higher education graduates. The
success of this program at least seen
of the three indicators, namely the
number of students who successfully
run a business, the establishment of a
model of entrepreneurship education
in higher education, and the formation
of the development of
entrepreneurship education
institutions strong and independent
and coordinate various activities
related to entrepreneurship at
universities .
Guidelines PMW improved every
year based on a variety of input and
consideration of the various parties as
well as experience implementing

ISSN 2302-786X
64 Proceeding of Annual South East Asian International Seminar (ASAIS) 2013
PMW previous years . It is expected
that these guidelines can assist
universities in planning and
implementing the Program
Mahasiswa Wirausaha (PMW) in
2013 to more effectively and
efficiently with optimal performance ,
which also can serve as the basis for
determining the allocation of funds
based on performance in the next
financial year. (Illah Sailah, Director
of Education and Student Affairs ,
February 2013 )
Research and Technology Minister
Gusti Muhammad Hatta said that
Indonesia still needs 4.4 million
entrepreneur. The number of
entrepreneurs in Indonesia is still 400
thousand. Ideally, a country has a
number of entrepreneurs who no less
than two percent of the total residents
. While Indonesia has only 0.18
percent (Tempo, Monday, July 9,
2012 ) .
Senior businessman Ciputra said
Indonesia still needs millions of
entrepreneurs . Currently , the number
of entrepreneurs in Indonesia has not
reached 1 % of the total population .
He revealed the presence of three
important factors that must be applied
in Indonesian society to foster
entrepreneurial spirit : integrity,
professionalism, and entrepreneurship
(detikFinance, Wednesday, November
28, 2012 ) .
Indonesian entrepreneur only has 1.55
percent of the total population . The
fact that Indonesia as the country with
the lowest number of entrepreneurs in
the ASEAN region (National Journal ,
Thursday, July 19, 2012 ) .
Based on the above illustration, the
Politeknik Negeri Jakarta (PNJ)
implementing student subjects like
Entrepreneurship,which is supported
by the Program Mahasiswa
Wirausaha (PMW ). It is intended, in
part so that there PNJ graduates into
business, not always looking jobs, but
create jobs.
Population and sample
Population, the population in this
study was the recipient students
Entrepreneurial PNJ Mahasiswa
Program, which receives funding
PMW in 2011 and 2012. PMW
Receivers In 2011 there were 12
groups involving 51 students . While
in 2012, there are 10 groups with 42
students involved ( PMW report PPNJ
, PD3 , 2012, page 9 ).
Because the population of 22 recipient
groups and some individual have 2
groups, so the population including
saturation sampling, the samples used
were 20 groups of receivers in the
PNJ.
2. RESULTS AND DISCUSSION
2.1 Recipients PMW
PMW Selection Process
Here are the results of a
questionnaire to 20 respondents
in the PNJ PMW recipients, as
follows :
In PMW recipient selection
process ,which was announced
by the corresponding stage 3
Pudir Student Affairs any
student group that filed PMW
up Business Plan. From the 20
respondents was 100 % they
make the Business Plan.
In addition, The group of
students who filed PMW also
asked to present their Business
Plan 95 % , while not presenting
a Business Plan by 5 % .

ISSN 2302-786X
Proceeding of Annual South East Asian International Seminar (ASAIS) 2013 65
In the selection of recipients
PMW, things that should be
followed is psykotes PMW
recipients , to determine the
entrepreneurial spirit and
networking . From the 20
respondents in the PNJ Receiver
PMW was 100 % doesn’t do
psykotes, because the
institutions do not require the
selection of beneficiaries
psykotes PMW .
Additionally, the PMW
recipient selection process ,
according to the institution
100% of respondents in this
case the selection of the Student
Affairs Business Plan is entered.
However, in the selection of
beneficiaries PMW, the
institution/ Student Affairs does
not involve a third party, such
as bankin, entrepreneurs, and
UMKM. When it is asked of
respondents PMW receiver, it
turns out that 85 % of
respondents answered stated
Business Plan is not assessed by
the banks , but no one answered
15% of rated banks .
Meanwhile, when asked if the
proposal Business Plan also
assessed by representatives of
entrepreneurs, 90 % of
respondents answered not
judged by representatives of
entrepreneurs, and some
respondents answering 10 %
assessed by UMKM . When
asked , whether, after the
selection process Business Plan
proposal , the prospective
recipient of PMW 's visitation
by the reviewer, in order to
verify the information about the
business , scale , etc. 90 % of
respondents answered no
visitation , and some
respondentsanswered visitation
10 % .
Debriefing
The PMW receiver after passing
the selection Busines Plan
conducted debriefing . Here are
the answers of respondents
recipient of PNJ PMW
debriefing for the recipient .
Most of that 90 % of
respondents had received
training, while 10 % did not
receive debriefing. In addition,
at the time following the
debriefing , whether the
respondent were asked to rate
the performace of the material
or speaker by the organizers, 95
% of respondents were not
asked to assess, the remaining 5
% of respondents answering
judge .
The recipient PMW also
internship program? In a fact,
95 % of the PMW Receivers do
internship Business Plan in
accordance with the proposal,
and only 5 % PMW Receivers
did not do an internship .
Disbursement of Funds
Before do PMW , then 100 % of
the PMW receiver signed a
contract Implement Work Order
( SPMK ) with the institution in
this case PD3 Student Affairs .
When asked if the recipient
PMW know their rights and
obligations , 95 % of the PMW
Receivers know their rights and
obligations, but there are 5 % of
respondents who answered do
not know their rights and
obligations as PMW receiver.
In terms of disbursement PMW,
most of the 100 % of the PMW

ISSN 2302-786X
66 Proceeding of Annual South East Asian International Seminar (ASAIS) 2013
Receivers do not know, if the
disbursement of funds in the
PNJ PMW done gradually.
When respondents were asked
whether the disbursement phase
2. PMW recipients reporting
business development and proof
of expenditure, there are only 5
% of respondents who made the
report , while the remaining 95
% did not make a report on the
development of its business.
One interesting thing , when
asked whether the recipient
PMW, disbursement of funds
received on time. 100% of
respondents answered latewith
reason funds from DIKTI did
not down
Implementation Effort
Average turnover of each group
between Rp.1.250.000 to
Rp.3.000.000 per month, except
Ex Nara Creative Rp.20.000.00
average turnover per month and
Ex Beau Cake average de'La
Rp.12.5000.000 turnover per
month . Advertisingproducts
from 20 beneficiary groups
PMW PNJ is jabodetabek. As
for the problems or obstacles
encountered in conducting the
business of the group of
recipients each PMW PNJ is as
follows:
a. Still less dipaearacaya
clients ,
b. Many competitors of
similar products;
c. Difficult for the time
between college and take
care of business;
d. There is no cooperation
with vendors;
e. Shop is still less extensive;
f. Needing a place for
production;
g. PMW recipient feel
deadline payback , payback
period is too short;
h. Funds received for PMW
Receiver too long;
i. Lack of commitment to the
team each group, many
members who are not active
contribute;
j . Marketing is not running
maximum;
k. Fluctuating prices of raw
materials ( silk screening
business and cassava chips
);
l. Certain products sold at
wholesale system;
m. Rent a place of business is
still considered expensive.
Mentoring / Mentor
In the opinion of the respondent
PMW recipients , 70 % lecturers
do not have knowledge about
the field of business run by
receiver mahaisiswa PMW .
The remaining 30 % supervisor
PMW assessed by the receiver
has knowledge of the business
carried on by the recipient
PMW.
Respondents that 85 % PMW
receiver supervisor conduct
business guidance to students . ,
The remaining 15 % of
respondents answering
optimally guided not by decen
supervisor .
When respondents were asked
about the monitoring of the
implementation of the PMW by
the supervisor, according to 70
% of respondents did not
conduct monitoring supervisor .
While lecturers to monitor only
30 % monitored by the
supervisor . The reason
supervisor are not optimal

ISSN 2302-786X
Proceeding of Annual South East Asian International Seminar (ASAIS) 2013 67
monitoring ( generally only
performed on campus as
guidance final project) . The
reason supervisor do not
underground monitoring, among
others: duties and functions are
not clearly, the supervisor did
not receive a letter of
assignment, the supervisor did
not receive an honorarium etc.
Nevertheless, according to 70%
of respondents faculty mentors
provide alternative
fragmentation problems faced
receiver PMW, whereas 30% of
the respondents according to
faculty and engulfment provide
solutions to problems faced by
impoverished PMW receiver.
According to the respondents
only 10% of faculty mentors
provide mediation for students
who receive PMW in the
development efforts of other
parties, the remaining 90% of
faculty mentors do not do,
mediation by a third party.
Monitoring / Evaluation
Effort
According to the respondents
85% of recipients PMW not
dimonitoring by monitoring
team, either by staff or
representing Pudir, whereas
15% of the recipients
dimonitoring. As for the
material at the time
dimonitoring is as follows:
omzet, assets, employment and
reach the market and the variety
of products as you see in the
diagram as follows:
In addition, when only 10% of
the monitored,and monitoring
team to inquire about the
process of production to
marketing, while 90% did not
ask for it.
Participant Activity Reporting
By PMW
In terms of making a report, on
the implementation PMW
conducted by the students
receiving the PMW as follows:
a).Monthly reporting
Of the 20 respondents, 85%
PMW Receivers make monthly
reports, while the remaining
15% did not make a report.
b).Progress Report
To report making progress most
respondents, 90% did not make
a progress report, the remaining
10% made progress report.
c). Final Report
In the manufacture of the final
report, 75% of PMW Receivers
make the final report, while
25% did not make a final report.
Omzet Aset
Penyerapan
TenagaKerja
Jangkauan
Pasar
JumlahVariasiProduk
Tidak 20 19 17 17 17
Ya 0 1 3 3 3
20 19 17 17 17
0 1 3 3 3
0510152025
Data were asked by the monitoring team
Tidak Ya

ISSN 2302-786X
68 Proceeding of Annual South East Asian International Seminar (ASAIS) 2013
2.2 Supervisor PMW
Of the 20 lecturers at the PNJ,
following some kind of business
carried on by the group as the
recipient PMW mahasswa in
PNJ, among others: 25%
Culinary ussahanya types, 15%
clothing sale, 10% silk
screening.
Groups of students were guided
by the supervisor PMW , most
of 45 % starting his business in
2012 and 40 % in 2011 , the
remaining 10 % in 2010 . In
conducting its business , the
PMW receiver involve 5
laborwas 50 % , 3 labor was
25% , and 2 labor was 15 % .
Most of the 65 % visitation
supervisor never did the work
done by groups of students
receiving PMW , while the
remaining 35 % had never had
visitation . The meeting
between supervisor with LPA
receiver group performed a
scheduled 90 % , the remaining
10 % is not done in a scheduled
meeting . Additionally
supervisor then performed 70 %
for students receiving mentoring
PMW , the remaining 30% of
the lecturers are not coaching .
In the case of mediation
between PMW receiver with
UMKM, it turns out most of the
lecturers 75 % do not do it ,
while only 25 % did .
Supervisor recipient PMW 100
% most of the monitors , even
though the danger is done over
the phone. As for evaluating the
activities of PMW receiver 95
% , only 5 % are not doing the
evaluation. While the supervisor
who did consulting activity in
PMW recipients of 100 %. Most
of the 95 % do not participate
lecturers provide investments in
businesses run by students
receiving PMW , only 5 %
participating business
participation .
2.3 For business input PMW in
PNJ
In the implementation of PMW
in PNJ , there is some input
from student groups PMW
recipients are as follows :
a. Need encouragement and
msteriil , as well as the
entrepreneurial spirit ,
b. The assistance or guidance
of lecturers maximum;
c. PMW -run schedules PD3 ,
information to students;
d. Slow decision making;
e. PNJ should collaborate
with UMKM , to follow for
PMW receiver;
f. It takes its own institutions
to manage PMW;
g. PMW clear targets ,
whether for start up or
business development;
h. Try not to be late
disbursement PMW;
i. The existence of award to
the successful PMW;
5% 5%
25%
5% 5% 5% 5% 5% 5%
5% 5%
10% 5%
5% 5%
Type of Business
Pakaian EO
Kuliner Pakaian dan EO
Pakaian Muslim Recycle
Las Warnet
Ternak Lele Laundry
Tas Sablon

ISSN 2302-786X
Proceeding of Annual South East Asian International Seminar (ASAIS) 2013 69
j. The existence of a monthly
meeting for PMW
Receivers on campus;
k. Less PMW periodic
monitoring , as a means
konmunikasi with PMW
receiver;
l. The role of the supervisor is
not optimal;
m. Lecturer not go to the field ,
the monitoring is done only
by phone ,
n. Less field training for
PMW resultant product
marketing ,
o. PMW recipient does not
feel the ease of bureaucracy
in the PNJ
p. PMWreceiver detachable
tendency or her own path ,
3. CONCLUSION
a. In the selection of recipients PMW
in PNJ,PNJ didn’tdo psykotes to
determine the recipients who
haveentrepreneur soul.In addition,
PNJ no third party involved in the
selection process, for example,
UMKM or banks in the selection
of Business Plan.
b. Internship program for prospective
recipients PMW has not done
optimally.
c. Disbursement of funds PMW late
fall of DIKTI, influential in the
early course of business.
d. In business execution by PMW
receiver can not run optimally,
because the supervisor duties
PMW unclear.
e. Monitoring PMW are not clear,
this task PD3 staff or supervisor.
f. Reporting activities / efforts by the
participants of PMW Receivers do
not in consistently.
g. PMW Receivers partially still in
doubt, whether to continue the
focus of entrepreneur with
guarantee izajah or want to find
work with the risks in return the
funds to PD3.
4. BIBLIOGRAPHY
[1] Almar, Buchori, 2001,
kewirausahaan, Bandung,
Alfabeta.
[2] Ku Lun-Wei, Liang Yu-Ting, and
Chen Hsin-His (2006) Opinion
Extraction, Summarization and
Tracking in News and Blog
Corpora. Journal of American
Association for Artificial
Intelligence.
[3] Drucker, P.F, 1996,
KonsepKewirausahaan Era
Globalisasi, Erlangga: Jakarta.
Terjemahan
[4] Fadiati, Ari, M.Si.,PurwanaDedi,
M.Buss,. (2011).
MenjadiWirausahaSukses.
(cetakankedua). Bandung. PT.
RemajaRosdakarya.
[5] Kasmir.(2011). Kewirausahaan.
(edisirevisi). Jakarta.
RajagrafindoPersada.
[6] Lupiyodi, Rambat, 1998,
Wawasankewirausahaan , Jakarta,
LembagaPenerbit FE-UI
[7] Meredith, G. Goffrey, 1996,
Kewirausahaan: Teoridanpraktis,
Jakarta,
PustakaBinamanPressindo
[8] NasutionH.A. Bustanul A.N
Mukhammad
S.,2001,Membangun Spirit
Entrepreneur Muda Indonesia,
Jakarta, Gramedia.
[9] PrihatinDwiRiyanti, Benedicta,
2008, MetodeExperintal Learning
Berbasispadapeningkatan rasa
percayadirimampu,kreatifdanbere
sikodalammatapelajarankewiraus
ahaanuntuk SMK, Jakarta,
UnikaAtma Jaya.

ISSN 2302-786X
70 Proceeding of Annual South East Asian International Seminar (ASAIS) 2013
[10] RiduandanAkdon, 2007,
Rumusdan Data
dalamAnalisaStatistika, Bandung
Alfabeta
[11] Saiman Leornardus, 2009,
Kewirausahaan: Teori, Praktik,
danKasus-kasus, Jakarta,
SalembaEmpat.
[12] Sugiono, 2008,
MetodePenelitianKuantitatif,
Kualitatifdan R&D, Bandung
Alfabeta.
[13] Sugiyono.(2007).
StatistikaUntukPenelitian.Bandun
g :Alfabeta.
[14] Suharsimi, Arikunto, 2003,
ManajemenPenelitian, Jakarta,
RinekaCipta
[15] _______________,2010,
ProsedurPenelitian, RienikaCipta,
Jakarta
[16] Sukardi, 2006,
PenelitianKualitatif-Naturalistik;
DalamPendidikan, Yogyakarta,
Usaha Keluarga
[17] Suryabrata, Sumadi. (2005).
PengembanganAlatUkurPsikologi
s.Yogyakarta :PenerbitAndi.
[18] Suryana, Dr., Yuyus, S.E., M.S,
IR. BayuKartib, M.Si. (2010).
Kewirausahaan:PendekatanKarak
teristikWirausahawanSukses.
(edisi pertama). Jakarta.
Prenada Media Group.
[19] Suryana, Dr.M.Si.
(2008).Kewirausahaan:
PedomanPraktis: Kiatdan Proses
MenujuSukses. (cetakanketiga).
Jakarta. PenerbitSalembaEmpat.
[20] _____________, 2008,
StatistikaUntukPenelitian,
Bandung Alfabeta
[21] _________(2009). Undang-
Undang UKM (Usaha Mikro
Kecil &Menengah). Jakarta.
Sinargrafika

ISSN 2302-786X
Proceeding of Annual South East Asian International Seminar (ASAIS) 2013 71
The Responsibility of Businessmen in The Electronic Transaction Act According to ITE
Nining Latianingsih1 and Rita Farida2
1Department Business Adninistration State of Polytechnic Jakarta e-mail : [email protected],
2 Departement Civil Engineering State Of Polytechnic Jakarta
Abstract
The development of information technology and telecommunications today has led to the various existing telecommunication facilities, as well as sophisticated information technology products that are able to integrate all of the information and communication media. The computer one of the proponents of the development of information technology, so as to make the trade to be smooth and easy to be accessed by any person or company. Problem in this research is how the principle of the responsibility of perpetrators of usha in electronic transactions as seen from the UU ITE. The methods used in this research is the juridical normative and descriptive analysis is done with a qualitative approach to view and analyze the legal norms (normative analysis) in the existing legislation. The results obtained that the legal responsibility applicable trade is the principle of liability for negligence, but in accordance with its development began to shift in the application of strict liability in particular on transactions that have a major impact for risks. While the ACT ITE is liability businessmen on the principle of presumed liability because businessmen are at the wrong position so charged to compensate for the loss as a form of responsibility. Key Words: electronic transactions, Businessmen, responsibility, legal contracts, Information Technology 1. INTRODUCTION In the middle of a communication that is increasingly integrated globalization (global communication network) with the growing popularity of the internet has made the world increasingly seeming shrunk (shrinking the world) and increasingly fades the boundaries of State sovereignty and the following tatananan of the people. Community dynamics of Indonesia who are new to grow and develop as an industrial society and the information society, as it still seems premature to accompany the technological development (research group University of Indonesia 1999: 1)
The computer as a tool for human development with the support of information technology has helped the network access to the public network (public network) in conducting the transfer of data and information. With the ability to access computers and
increasing trade transactions was then ilakukan in the communication network. The public network has eunggulan compared to the private network that is cost and time efficiency. This makes trade with electronic transactions (Electronic ommerce) became the choice for the businessmen to launch deals its trade because of the nature of a public network that is easy to access by any person or company. Some research has been done to electronic transactions According to commendation section 1367 KUH Perdata and UU ITE remain open opportunities for judges to apply the principle of strict liability for the sake of greater common interests (the law on line). While the research conducted by Edmon Makarim, in a Dissertation in written, regarding legal liability the organizers in electronic systems.

ISSN 2302-786X
72 Proceeding of Annual South East Asian International Seminar (ASAIS) 2013
Basically an electronic system is using the principle of presumption of innocence, or the principle of liability based on negligence (negligence). Also called presumed liability that is by concluding that the Undang Undang Dasar No. 11 of 2008 of the information and electronic transactions (UU ITE) reciprocity presumption of guilt. This summary can be pulled from the formulation of article 15: each Organizer electronic systems must conduct electronic systems reliable and safe as well as responsible for the operation of the electronic system as it should be.Organizers are positioned in a State of guilt laid upon the duty to always take responsibility, except when it can be proven that the fault of the electronic system is not a gaffe
While the Issues raised in the study is how the principle of the responsibility of Businessmen in electronic transactions according to ITE. The objectives of this research were: to understand the prinisip responsibility the electronic transactions ACT as well as material input for electronic business transactions.
Margin atas 3,2 cm, margin kiri 3,7 cm , margin kanan 3 cm, margin bawah 2 cm dan Gutter 0. Halaman 1 kolom, orientasi Potrait ukuran kertyas A4, makimal 8 halaman.
2. THEORY To clarify the legal responsibility then woke to a standard that is expected to become the benchmark for conducting assessment of the aspects of the legal responsibility of the perpetrators of the attempt on transactions carried out by small businesses. The theory will be used here is a theory of law about the existence of a legal obligation or legal liability (legal responsibilities) against any action interactive between
humans (2010: 14). In other words, the responsibility of each person to others is as the legal consequences of any award the same with respect to the freedom of everyone's external (external equal right to freedom)
An important role in interactive justice to protect everyone from adverse interaction (harmful interaction), which are commonly applied in Tort Law (tort Law) and the law of Contract as well as criminal law. Its essence is that legal responsibility in criminal and civil litigation is the same i.e. provide sanctions against those who do such adverse action
If the wrong actions of the civil code in diistilahan with the "Private wrong" in violation of the contract and ownership (property) of a person, is a criminal known as the "public wrongs" which is an error against the dignity of a person (dignity), community norms and public order (public peace and order).
The principle of responsibility is based on the existence of the element of fault (fault liability, liability based on fault principle) is a reaction to the principle or absolute liability (No. foult liability) in effect at the time of primitive society.
Then apply a formula (formula) "a man acts at his peril" which means that any act done, when someone harms another person, he shall cause the reproach had broken the law based on the opinion of saefulaah (1988: 20), in other words a person accountable for any possible harm to another person as a result of his actions. the process, gradually began to put law greater attention on matters that are giving the apology and the influence of the teachings of religion

ISSN 2302-786X
Proceeding of Annual South East Asian International Seminar (ASAIS) 2013 73
so that the cnderung leads to a moral fault recognition as a basis for tort
In addition, according to the history that the principle of liability based on the existence of the element of fault was originally known by the ancient civilization of Babylonia. Where this principle is known in the early stages of the Roman law.
This theory is in contrast to the principle of liability based solely on the existence of the element of fault and liability of presumtion that the second principle in the burden of proof shifted from the plaintiff (the victim) to the defendants. That loss is incurred unless he can prove p ihaknya has taken all necessary measures to avoid such kerugain or that it cannot be done. So the plaintiffs or victims can file claims to get compensation without having to prove the existence of the fault of the carrier.
The principle of absolute responsibility is usually known for the phrase "absolute Liability" meant responsibility without having to prove any wrongdoing. Or in other words, a principle of responsibility which looked at "fault" as an irrelevant to talk about is whether in fact there or not. According to Makarim is the concept of exposure is thought to be demonstrating some key factors or varibel covered in a research.On the process of assessment and exposure in the study will look at how the information systems should be developed and implemented by the Government, the businessmen and the community as a user. Because the parties have to comply with what is required by law, then logically the consequences is getting legal protection especially legal protection of the consumer or his best effort in
the form of their terhindarnya of the pattern responsibilities that are absolute (strict liability). So in this penilitian need to explain some concepts.
3. METHODOLOGY This research is the juridical normative research (Mukti dawn. 2010: 34) namely legal research that put the law as a system of norms; system of norms intended will explore legal principles as well as reviewing the harmonization of legislation in the field of information and electronic transactions.This research is a descriptive analytical (adi Rianto. 2004: 130) that expose data observations without held testing hypotheses and exploratory (Rianto adi. 2004: 3)
This research is research that is analytical, the intent is so that researchers can expose the legal picture comprehensively and systematically about the responsibility of the perpetrators of the attempt against the failure of top achievers in selling through electronic transactions linked with the principle of good faith. Sources and techniques of Data collection, data obtained through a search of legal documents, either in the form of primary legal documents, secondary or tertiary
Doing research libraries (library research) done by researching library materials which include primary legal materials among other Academic Texts in the form of draft law on information and electronic transactions, laws, government regulations and other regulations. To analyze data and draw conclusions from the results of this research, primary and secondary law data are analyzed with a qualitative method

ISSN 2302-786X
74 Proceeding of Annual South East Asian International Seminar (ASAIS) 2013
and subsequently served in the form of deskriftif-analysis
4. ANALYSIS AND DISCUSSION
The central point of discussion the responsibilities of employers in General is related to the theory of liability (the liability principle) are applied. The use of a certain responsibility principle depends on certain circumstances
There are four theories about the responsibility that is known and can be applied on employers in relation to the responsibility for the implementation of consumer protection.
The principle is the principle of liability on the basis of error (based on fault/negligence), on the basis of the presumption (presumption of liability), tort-based liability (liability based on breach actions of contract) or absolute liability (strict/absolute liability) which are further described below (Raharjo 2006: 51)
The principle of the presumption of guilt or the spacey followed by a principle of a presumption of responsibility. This principle States, defendants have always considered responsible (presumption of liability principle), until it can be proven, not guilty. So, the burden of proof is on the defendant to. While the element of fault in this principle is absolute in accountability and terms of an error as to the existence of a general principle of liability is known as the principle of "mens rea".
Based on the above description, that the issue of accountability is closely related to the error elements, discussing elements of this error meant about his heart, Idema said.
This principle was born and is a reaction to the theory of the absolute responsibility of the Act on ancient societies
In the modern concept of keperdataan pembuktiannya, the burden is on the defendant. In this case seemed to reverse the burden of proof (omkering van bewijslast). It is certainly contrary to the legal principle of presumption of innocence (presumption of innocence). The birth of the doctrine of strict liability is based on the idea that the law (common law) must be responsive to the needs of the community. The role of the judge is to meet those needs and shaping the law to meet the needs of the community. The birth of the doctrine of strict liability is based on the idea that the law (common law) must be responsive to the needs of the community. The role of the judge is to meet those needs and shaping the law to meet the needs of the community. The theory of responsibility without having to prove any mistake or in other words, a principle that responsibility looked a mistake as an irrelevant to question whether in fact there or not.
Originally, the law regarding the liability of tort law is not at all concerned about the responsibility of moral or jawabn elements of the fault of the offender. In modern society, the sole responsibility or liability that are not based on any element of fault should be viewed from a social value considerations, that someone who undertake activities to gain advantage for himself must bear the risks resulting from these activities. Responsibility (responsibility) is a reflection on human behaviour. The appearance of human behaviour associated with control of his soul, is part of his intellectual consideration

ISSN 2302-786X
Proceeding of Annual South East Asian International Seminar (ASAIS) 2013 75
forms or mental state. When a decision has been adopted or rejected, it is part of the responsibility and consequences of choice.
Therefore, there is no other reason why it is done or abandoned. The decision is thought to have been led by his intellectual awareness, so that responsibility within the meaning of the law is the responsibility of that really is related to the rights and obligations, not in the sense of responsibility associated with momentary mental turmoil or the unconscious as a result. Responsible to the community, meaning that the willingness of providing the best possible service, without distinguishing between the service fee and service charge as well as quality service, generating a positive impact for the community.
According to Onno w. Purbo (2008: 1) Of the ACT ITE, said that on the one hand, this nation needs to be grateful for the Government efforts to make the world's cyber protection. It hasn't been perfect, but the work done needs to be appreciated. There are some missions that seem to be in, which emban Protect electronic transactions, protecting users IT/Internet.
While the Torso UU ITE, namely: article 5-22 electronic transaction of Affairs (article 17), article 23-26 of domain name & Copyright (article 3), article 27-37 affair is not good deeds (10 articles), article 38-44 Government Affairs, investigators, disputes (article 6), article 45-52 criminal affairs/penalty (7 articles)
The law on Electronic Transactions & Information (ITE) No. 11 in 2008 guarantee for electronic transactions, that with this Act, the presence of
electronic information and electronic transaction and has had a clear legal umbrella of songs (2009)
However, acknowledgment that government regulation still needed for its implementation. Mainly related to electronic information, electronic documents, electronic signature, electronic certification, making electronic transactions, domain names, actions that are prohibited as well as dispute settlement, dispute-even the Government can conduct an intensive coaching against all perpetrators of information technology, and to keep this law product is not misused by irresponsible parties. There are a few examples of conditions that can be made the cornerstone of legal protection for consumers over transaction data by electronic group in the objective of internet banking which Act No. 11 of 2008 about electronics, Act No. 36 of 1999 regarding telecommunications and law No. 8 of 1997 concerning the application of the corporate documents of telecommunication laws to observe the protection of personal data the customer due to that implementation of internet banking will not essentially regardless of its telecommunications services. In article 9 of the ACT ITE disebtukan that businessmen in offering products through the electronic system must provide information that is complete and correct with regards to the terms of the contract, the manufacturers and the products offered.
While in 15 explained that any organizer of electronic system must organise electronic system reliably and safely as well as responsible for the operation of the electronic seagaimana system it should be. In article 17 (2) mentioned that the

ISSN 2302-786X
76 Proceeding of Annual South East Asian International Seminar (ASAIS) 2013
parties including mandatory good intentioned efforts the perpetrator in carrying out interaction in electronic transactions
So here it is said that the responsibility of businessmen in electronic transactions must follow the standards set by the berlku Government. Because basically he should be absolutely liable for all damages caused to the other party.
5. CONCLUSION The responsibility of businessmen in UU ITE is the Absolute responsibility of the tida kterbatas (absulut Liability), so businessmen should implement proofs exist or absence of compensation to be paid by the party at fault to the get the losses.Need government regulation that guarantees the presence of certifying the reliability, so that consumers in carrying out online transactions can be assured.
6. BIBLIOGRAPHY [1] Clive M. Schmitthoff, Export
Trade: The Law and Practice of International Trade, London: Stevens and Sons, 1990
[2] Edmon Makarim. Legal responsibility of organizers of the electronic system. Jakarta: The Legal Studies Institute Of Technology. 2010.
[3] Endang Saefullah. The principle of liability in International Transport. Jogyakarta: Liberty. 1989.
[4] Mukti Dawn ND. Legal Aspects Of Trade Agreements In Electronic Transactions (Electronic Commerce) Muhammadiyah University Of Yogyakarta. 2008
[5] Rianto Adi. Social and legal Research methodologies. Jakarta: Granite. 2004
[6] Richard hill and Ian Walden The UNCTRAL Model Law Draft for the Electronic Commerce; isues and solutions, terjem. By m. dawn published in March 1996, p. 1 see > http//: www. Banet.com/_ricard hill
[7] Jonathan Rosenoer,. Cyber Law The law of The Internet, springer verlag, New York, May 1996
[8] Agus Sarjono, a hybrid Model of the law of cyberspace (the study of the model of the Arrangements of human activity in Cyberspace and the choice of Model settings in Indonesia). desertasi 2008.
[9] slouka, Mark. The lost room, the view of humanist culture of cyberspace that is troubling, Bandung: Mizan. 1999,
JOURNAL:
[10] Arrianto Mukti Wibowo. 1998. Digital signature & digital certificates: what is it? This article appeared in the June 1998 edition of the Internet Infokomputer
[11] Atif Latifulhayat. 2000. Cyber law and books for Indonesia, adapted from virtual light (1993) william Gibson, presented the Seminar a day Cyber Law.
[12] Budi Raharjo. 2003. A working paper presented in the seminar the main accounting at the Faculty of Economics University of Widyatama.
[13] Erman Radjagukguk, International Contract Law and free trade, Business law journal, vol 2, Foundation for the

ISSN 2302-786X
Proceeding of Annual South East Asian International Seminar (ASAIS) 2013 77
development of business law, 1997
[14] Results of the study by the research group of Digital and electronic security and ever presented before the Society of telecommunication Indonesia in June 1999 in the center of computer science of the University of Indonesia in Depok, West Java, kerangaka digital signature law in Electrionic commerce, 1999
[15] Onno W Purba, E-com in Indonesia beginning in 2000, the MikroData media your computer Volume 3 Series 15
LAWS AND REGULATIONS:
[16] The Constitution of 1945
[17] The book of law civil law
[18] Law No. 11 of 2008 of the information and electronic transactions
[19] Dawn, ND, Mukti. Electronic Commerce in Indonesia, the legal principle Thesis 2001view http://www.geocities.com/amwibowo/resource/.htm >
[20] Onno w. Purbo, articles, 10 questions about E-com. see http://www.mastel.or.id/indonesia/ artikel10.htm
[21] -----------opinions on the ACT ITE. March 2008
[22] --------------The development of information technology and the internet in Indonesia, kompas, June 28, 2000

ISSN 2302-786X
78 Proceeding of Annual South East Asian International Seminar (ASAIS) 2013

ISSN 2302-786X
Proceeding of Annual South East Asian International Seminar (ASAIS) 2013 79
Income Shifting as a Reaction to the Tax Rate Change: Detecting for Earnings Management and Tax Management
Sabar Warsini
Politeknik Negeri Jakarta e-mail: [email protected]
Abstract
The research is aimed to investigate income shifting strategy carried out by the company as a reaction to the corporate income tax rate decrease. It is conducted by the Indonesian government from 30 % to 28 % in 2009 and decreased again to 25 % in 2010. Furthermore, this study also investigated whether the motive for income shifting is resulted from earnings management incentives or tax management incentives. In contrast to existing research, this study used the book-tax difference approach to measure of income shifting. By using a sample of 240 public companies listed on the Indonesia Stock Exchange, the following results obtained: First, in 2008 and 2009 the company performed income shifting in response to a decrease in corporate tax rates, and shifting income in 2009 was not significantly different from in 2008. Secondly, earnings management incentives factor gave negative effect on income shifting, while tax management incentives factor did not significantly affect income shifting. Key words: income shifting , book-tax differences , earnings management incentives , tax
management incentives. 1. INTRODUCTION In 2008 the Indonesian government made a fundamental change in corporate income tax rates initially adopting a layered tax rate with the highest rate of 30% converted into a single tax rate of 28% for fiscal year 2009 and will decrease to 25 % effective for tax years beginning on January 1, 2010. The policy of corporate income tax rate reduction will encourage corporate management to shift taxable income from periods of higher tax rates to periods of lower tax rates to minimize income tax liabilities.
Previous research related to the act of shifting income toward the enactment of lower tax rates have been carried out and reported that the company's management has done a shifting income in the period of 1 year before the enactment of lower tax rates (Guenther, 1994; Rafaat and Richardson, 1998; Yin and Cheng, 2004; Yamashita and Otogawa, 2007, and Bingxuan Liu, Rui Lu and Ting Zang, 2012). Using discretionary
current accruals as measure of income shifting, all of these studies can prove that propensity to shifting income is affected by earnings management incentives and tax management incentives.
In the development of earnings management research , accruals approach reaps some criticism because of some weaknesses, Roychodhury (2006) criticized that the accruals is the difference between accounting profit with cash flow so as not to catch the action setting earnings through real activities. On the other hand, in the development of tax literature (Mills and Newberry, 2001; Philips et.al. 2003; 2004) suggest that book-tax differences is a good indicator of earnings management and some studies suggest that book-tax differences may indicate tax management (Plesko, 2004; Desay and Dharmapala, 2006; 2009; Wilson, 2009). Motivated by the development of earnings management research and tax research, Tang and Firth (2011) developed a conceptual framework to

ISSN 2302-786X
80 Proceeding of Annual South East Asian International Seminar (ASAIS) 2013
demonstrate book-tax differences as an appropriate measure of earnings management and tax management.
Accruals approach is also seen as less realistic because the basic assumption used is done by shifting income through transaction management merely conforming book tax transactions so that earnings management incentives and tax management incentives are substituted (Shakelford and Shevlin, 2001). Current tax research found evidence that management can make arrangements for accounting earnings and taxable earnings at the same time because it's different rules and objectives. Management can perform shifting income through transaction setting both conforming and nonconforming book tax transaction (Frank et. al. 2009; Lalak, 2011), so the approach of book tax differences is more realistic.
In contrast to existing research, this study uses book-tax differences concept to investigates income shifting action in the hope of enriching the literature of income shifting strategy and to remedy the weakness in using accounting accruals approach. Therefore, the objectives of this study were: (1) find empirical evidence of whether the public company in Indonesia acts income shifting in the period 1 year before the enactment of lower income tax rates, and (2) find empirical evidence of whether the action of the shifting income is affected by earnings management incentives and tax management incentives.
The results of this study are expected to contribute to developing the two areas of research: (1) in earnings management research, the measurement of income shifting
approach to book-tax differences are expected to be more superior measurement than accruals and can overcome the drawbacks of the accruals approach, (2) in book-tax differences research, to explore the causes of book-tax differences. Some of the practical contribution of this research is: (1) to inform investors/analysts that it is necessary to consider the book-tax differences in making an investment decision, if the financial statement information as a base of their decisions, (2) provide input for the tax authorities to conduct tax audit, (3) the government will provide input for the potential reduction in tax revenues as a result of a decrease in tax rate policies.
2. THEORY
2.1 Income Shifting Strategy toward Corporate Tax Rate Decrease The Tax Reform Act of 1986 in U.S. was enacted on October 22, 1986 and reduced the maximum rate from 46 percent to 34 percent, effective for tax years beginning on or after July 1, 1987. Scholes et. al.(1992) were the first to investigate whether companies in the U.S. doing income shifting in response to the presence of the Tax Reform Act of 1986. They develop a random walk time series to estimate unmanaged earnings and find statistically significant evidence that firms deferred gross margin until tax rate decreased. However they do not find evidence that firms accelerated selling, general and administrative expense deductions. One limitation of this study is that earnings management is evaluated by only two items, gross margin

ISSN 2302-786X
Proceeding of Annual South East Asian International Seminar (ASAIS) 2013 81
and selling, general and administrative expense.
Guenther (1994) developed a research by focusing on discretionary current accruals as a measure of earnings management and find that firms take negative discretionary current accruals in the year prior to tax rate reduction. Maydew (1997) extended Scholes et al (1992)’s research by using a random walk model to estimate tax-induced income shifting by firms with net operating loss carryback and find that these firms managed recognition of revenue and expenses to increase their net operating loss carryback in response to declining tax rates and thereby increase the refund of prior years’ taxes at the old higher tax rates. These studies each examine the effect of one or more non-tax factors on income shifting. Guenther (1994) also find that firms expected to reduce financial statement income to achieve tax saving are large firm and firms with low levels of debt. Maydew (1997) finds that firms with lower debt ratios shifted more income and firm size does not appear to affect the propensity to shift income.
Tax reform was also carried by a number of countries outside of the U.S. The reduction in tax rates not only resulted in lower income taxes payable on an ongoing basis but also created an opportunity for corporations to reap a short term benefit by managing revenues and expenses so as to defer the payment of income taxes for
one or more years. Using data from manufacturing companies in 3 countries: Canada, Singapore and Malaysia, Rafaat and Richardson (1998) find that management of companies accelerated expenses in the year prior to the change in corporate income tax rate reduction and deferred revenues in the year after the change in corporate income tax rate reduction. These results are very similar to the empirical evidence reported by Guenther (1994).
More recent research has incorporated tax and financial reporting factors into the study of earnings management induce by tax rate reduction, and separated between profit and loss firms. Yin and Cheng (2004) extended prior research in U.S by contrasting earnings management behavior of profit firms and loss firms within the same study. They provide evidence that profit firms use more negative discretionary accruals in the year prior to the change in corporate income tax rate reduction than in the year after the change in corporate income tax rate reduction. They also find that loss firms are less opportunistic tax planners. An empirical study in Japan performed by Yamashita and Otogawa (2007). They found evidence that the average value of discretionary current accruals for profit firms is more negatively than loss firms in the year prior to the tax rates reduction.
China issued the new enterprise income tax law in 2007, which canged the corporate income tax

ISSN 2302-786X
82 Proceeding of Annual South East Asian International Seminar (ASAIS) 2013
rate from 33 percent to 25 percent and effective for tax year beginning 2008. By using the simulated marginal tax rate as an indicator of firms’ earnings management incentives and discretionary current accruals as a proxy for earnings management, Binguan Lin, Rui Ting Lu and Zhang (2012) find significant tax-induced earnings management in 2007. They also find that firm’s long term growth rate and firm’s size has a positive effect on discretionary current accruals, and negatively affect by net operating cash flow, but no significant relation between discretionary current accruals and intangible assets and firm profitability.
2.2 Conceptual Framework of Book-Tax Differences In the earnings management research, discretionary accruals proxy is widely used to measure earnings management despite some drawbacks which remain. The notion underlying this literature is that accruals reflect the inconsistency of earnings and cash flows cause by accounting choice and managerial discretion. If discretionary accruals reflect accounting adjustment to cash flow mandated by GAAP, discretionary accruals can capture manager’s adjustment to cash flow. However some argue that, if earnings management is conducted by real transactions which create cash flows and earnings, accruals proxy cannot detect it (Roychodhury, 2006).
On the other hand, in the development of tax literature (Mills and Newberry, 2001;
Philips et.al. 2003; 2004) suggest that book-tax differences is a good indicator of earnings management and some studies suggest that book-tax differences may indicate tax management (Plesko, 2004; Desay and Dharmapala, 2006; 2009; Wilson, 2009) . Motivated by the development of earnings management research and tax research, Tang and Firth (2011) developed a conceptual framework to demonstrate book-tax differences as an appropriate measure of both as earnings management and tax management.
The framework of book-tax differences is built on two major premises: (1) accounting rules and income tax laws differ, mechanically causing some amount of book-tax differences, and (2) management has incentives to opportunistically manage book and taxable income and hence affecting book-tax differences. Book-tax differences refers to the gap between pre-tax book income reported in a company’s published financial statement and taxable income reported to tax authorities. The difference of accounting and tax rules lead to divergent requirements in income reporting and hence generate mechanical book-tax differences (thereafter normal book-tax differences), and management’s discretion to opportunistically manage book and taxable income create abnormal book-tax differences. Assuming that normal and abnormal book-tax differences may be reliably measured, the

P
3TpEfn
Proceeding
magnidiffereextentmisalimagnitax dilevel managmanag
Threein this
H1: taxablsignifidiscrediffereprecedtax rat
H2: incentdiscrediffere
H3: Taffect tax dif
3. METHThis study public compExchange following cnon-mining
of Annual S
itude of noences mayt of ignment, itude of abifferences m
of potengement gement.
hypothesess study are :
Firms thale incomeficantly etionary ences in tding the cote decrease.
Earnings tives etionary bences
Tax managemon discret
fferences
HODOLOGused a s
panies listeuntil 20
criteria: (1)and non-re
I
South East A
ormal booky signify accounting
and bnormal bomay proxy ntial earn
and
Figu
s are develo
at has shie will h
posibook
the fiscal orporate inc.
managemaffect
book -
ment incenttionary boo
GY sample of ed on the S11 with . non-finaneal estate fi
ISSN 2302-
Asian Inter
k-tax the
g-tax the
ook-y the nings
tax
gure 1. Research F
oped
ifted have itive
k-tax year
come
ment on tax
tives ok -
240 Stock
the ncial, irms,
786X
rnational Se
2.3 ReseHypoBaserelateincomloweframdiffe2011resea
Framework
because thhave a sp(2), compaset of finan2007 to analyzed inare obtaineDatabase.
Refer to concept is this researcalculated book-tax d
BTDit = β2∆REVit β4∆INVESεit (1)
and
BTDit = DBTDit = + β2∆REV
eminar (ASA
earch Framothesis Dev
ed on the ed to the me toward ter tax rates ework rences (Ta), this stu
arch framew
he companecific finananies that hncial statem2010. Firmn 2008 anded from Th
the book-developed rch develothe value
differences i
β0 ++ β3∆
Sit + β5NO
NBTDit +BTDit – (β
Vit + β3∆RE
AIS) 2013
mework andvelopment
prior resact of sh
the enactmeand refer tof boo
ang and udy devel
work as follo
nies themsncial statemhave a com
ments for thems’ year
d 2009. Thehompson R
-tax differby Tang (2
ops a modof discretio
is as follows
β1∆PPEIT∆RECALLiOLit + β6T
+ DBTDit β0 + β1∆PPEECALLit +
83
d
search hifting ent of to the ok-tax Firth, op a ows:
selves ments, mplete e year were
e data Reuter
ences 2011), del to onary s:
Tit + t +
TLUit
EITit

ISSN 2302-786X
84 Proceeding of Annual South East Asian International Seminar (ASAIS) 2013
β4∆INVESit + β5NOLit + β6TLUit (2) Where, for firm i and time t :
BTDit = Book-tax differences, ΔPPEITit = Changes in property, plant, equipment and intangible assets, .ΔREVit = change in revenue, ΔRECALLit = Change in Receivable allowance, ΔINVESit = Change in the temporary investment, NOLit = Net Operating Loss, TLUit = tax Losses utilized, NBTDit = Normal book-tax differences, DBTDit = Discretionary book-tax differences. The significant positive value of discretionary book-tax differences prove that the company acts income shifting.
Refer to Yin and Cheng (2004), this research used a regression model to examine the effect of earnings management incentives and tax management incentives on discretionary book-tax differences.
DBTDFit = α0 + α1CETRit + α2YDH*CETRit + α3YDL*CETRit +α4EPRESit + α5LEVit + α6SIZEit + α7NOL*CETRit + α8NOL*EPRESit + α9NOL*LEVit + 10NOL*SIZEit + εit …(3)
Where, for firm i and time t :
DBTDit = discretionary book-tax differences which is obtained in equation (2), CETRit = Cash effective tax rate, which is calculated by dividing the cash tax paid with pre- tax book income, YDH*CETRit = year dummy = 1 if the year using the higher tax rate and 0 if other years, YDL*CETRit = year dummy = 1 if the year using the lower tax rate, and 0 if other years, EPRESit = Earnings pressure, is a dummy variable = 1 if the difference earnings is negative and 0 if others, LEVit = Leverage, which is the ratio of total debt to total assets, SIZEit = size which is calculated from the value of the natural logarithm total assets, NOLit = loss firm, a dummy variable = 1 if the loss company and 0 if others , εit = error value during the period of observation
4. ANALYSIS AND DISCUSSION
4.1 Descriptive Statistics Analysis Descriptive statistics of firms samples are summarized in table 1. The average value of discretionary book-tax differences is positive = 0.1127, indicate that the companies reported higher pre-tax book income to shareholders and lower taxable income to tax authorities.
Table 1 Descriptive statistics
Variable Minimum Maximum Mean Std. deviation DBTD -0.1980 1.3486 0.1127 0.1723 CETR -0.0115 19.9200 0.1022 0.0619 EPRES -1.4523 1.3914 0.0297 0.1840
LEV 0.0073 0.8558 0.1577 0.1567 SIZE 1.0374 18.3035 8.8658 4.1018
Source: SPSS output
The average value of cash effective tax rate is positive = 10.22 and maximum value = 19.92, both lower than statutory income tax rate, indicate that the companies performed tax
planning. As show in table 1, the mean value of EPRES is positive = 0.0297, indicate that the companies performed income smoothing. The values of leverage and size have a wide

ISSN 2302-786X
Proceeding of Annual South East Asian International Seminar (ASAIS) 2013 85
range, indicates that firms samples are highly varied.
4.2 Testing Results for Hypothesis 1 Testing result for hypothesis 1 is presented in table 2. This research use one-sample t-test to compare the mean value of the variable DBTD in 2008 and 2009 are significantly different from zero. The result of
different test shown that discretionary book-tax differences in 2008 and 2009 are significantly different from zero with a significance level below 5 % . This result is consistent with the hypothesis that companies shifted taxable income in the year preceding the corporate income tax rate decrease.
Table 2. t-test of discretionary book-tax differences
One-sample t-test variable mean Sig.(2-tailed)
2008 (240 companies) DBTD 0.1078 0.04046** 2009 (240 companies) DBTD 0.1491 0.03755**
Independent sample t-test variable mean Sig.
Equal variances assumed DBTD2008 0.1078 0.34326 DBTD2009 0.1491
Source: SPSS output
Further testing conducted independent sample t-test to testing the difference of mean value of DBTD in 2008 from in 2009. The result showed that mean value of discretionary book-tax differences in 2008 was not significantly different from in 2009.
4.3 . Testing Result for the effect of Earnings Management Incentives and Tax Management Incentive on Discretionary Book-tax differences. Results of the OLS regression are reported in table 3 is as follow:
Table 3. OLS Regression Results
DBTDit = α0 + α1CETRit + α2YDH*CETRit + α3YDL*CETRit + α4EPRESit + α5LEVit + α6SIZEit + α7NOL*CETRit + α8NOL*EPRESit + α9NOL*LEVit + α10NOL*SIZEit + εit ……. (3)
Independent variable
Hypothesis
2008 2009
coefficient Prob. coefficient Prob.
C 0.095864 0.0133** 0.130956 0.0393**
CETR +/- 0.072728 0.2025 0.028145 0.0620*
YDH*CETR +/- 0.123648 0.0504* 0.004364 0.0977*
YDL*CETR +/- 0.049762 0.6489 0.254710 0.0846*
EPRES +/- 0.119828 0.0893* 0.097863 0.0633*
LEV -0.004456 0.0307** -0.175230 0.0147**
SIZE 0.053831 0.2219 0.188315 0.4271
NOL*CETR -0.145524 0.2664 -0.274523 0.4762 NOL*EPRES 0.093837 0.0158** 0.123831 0.0583* NOL*LEV -0.049874 0.4640 -0.141189 0.3910

ISSN 2302-786X
86 Proceeding of Annual South East Asian International Seminar (ASAIS) 2013
DBTDit = α0 + α1CETRit + α2YDH*CETRit + α3YDL*CETRit + α4EPRESit + α5LEVit + α6SIZEit + α7NOL*CETRit + α8NOL*EPRESit + α9NOL*LEVit + α10NOL*SIZEit + εit ……. (3)
Independent variable
Hypothesis
2008 2009
coefficient Prob. coefficient Prob.
NOL*SIZE 0.127810 0.2694 0.217182 0.3338 Adjusted R-square 0.24584 0.32115 F-statistics 11.75843 59.23097 Prob. (F-statistics) 0.000000*** 0.000000*** Source: SPSS output
From the regression results, the coefficient of CETR is positive and significant (0.028145, p = 0.0620*) in 2009 but insignificant in 2008 (0.072728, p = 0.2025). It can be interpreted that companies which a good tax planning tends to reduce income shifting action in the year preceding the corporate income tax rate decrease. This finding contrasts to Yin and Cheng (2004) suggest that if a firm engages in aggressive tax planning activities, it is more likely to shift income from the higher tax rates period to the lower tax rates period for tax benefits. But consistent with Bingxuan Liu, Rui Lu and Ting Zhang (2012) suggest that firms with lower marginal tax rate will be less likely to shifts their taxable income from a high- to the low-tax period. The significant coefficient on YDH*CETR and YDL*CETR corroborate evidence that companies engages lower cash effective tax rate tends to reduce the income shifting action.
The coefficient on the earnings management incentive, EPRES is positive and significant for both periods (0.119828, p = 0.0893*, in 2008) and (0.097863, p = 0.0633*, in
2009) proved that earnings management incentives affects on discretionary book-tax differences. Companies that have greater earnings pressure tends to report a higher pre-tax-book income, so the value of book-tax differences increase. This finding consistent with the previous research (Ying and Tang, 2004; Yamashita and Otogawa, 2007; Bingxuan Liu, Rui Lu and Ting Zhang, 2012) suggest that if current year’s pre-managed earnings are lower than last year’s earnings, manager have pressure to take income-increasing to meet the earnings target or they are less likely to take income decreasing shifts.
Testing of the control variables, level of debt and firms’ size obtained results that the coefficient of LEV is negative and significant (-0.004456, p = 0.0307**, in 2008 and -0.175230, p = 0.0147**, in 2009). This finding can be interpreted that for firms with higher debt ratio, downward income shifting will be mitigated by debt incentive. This finding is in line the positive accounting theory suggest that firms approaching a debt covenant violation will make income-increasing choices

ISSN 2302-786X
Proceeding of Annual South East Asian International Seminar (ASAIS) 2013 87
to loosen their debt constrains (Watt and Zimmerman, 1986). The coefficient of SIZE is not significant (0.053831, p = 0.2219 in 2008, and 0.188315, p = 0.427 will tend to manage their earnings decline because large firms are more sensitive to political cost (Watts and Zimmerman, 1986).
5. CONCLUSION Based on the test results and the above discussion, it can be concluded that when the government policy reduces income tax rates, the company’s management will respond by shifting income to act so as to reduce the burden of taxes to be paid to the state. The magnitude of income shifting is affected by tax management incentive and earnings management incentive. For companies that have a good tax planning is demonstrated by the lower cash effective tax rate, are less likely to perform income shifting. For companies that have greater earnings pressure indicated by current year’s pre-managed earnings are lower than last year’s earnings, are less likely to perform income shifting.
6. BIBLIOGRAPHY [1] Bingxuan Lin, Rui Lu and Ting
Zhang (2012), Tax-Induced Earnings Management in Emerging Markets : Evidence from China, JATA, 34: 19-44
[2] Desai, M and Dharmapala, D. (2006), Corporate Tax Avoidance and High-Powered Incentives, Journal of Finance Economic, 79 : 145-179.
[3] Desai, M and Dharmapala, D. (2009), Corporate Tax Avoidance and Firm Value, Review of Economic and Statistics, 91: 537-546.
[4] Frank, Lynch, L.J and Rego Sonja, (2009), Tax Reporting Aggressiveness and Its Relation to Aggressive Financial Reporting, The Accounting Review, 84: 467-496
[5] Guenther, D. (1994), Earnings Management in Response to Corporate Tax Changes: Evidence from the 1986 Tax Reform Act, The Accounting Review, 69: 230-243.
[6] Lalak F. Rudolph, (2012), An Examination Of The Impacts of Aggressive Tax Reporting, Earnings Management and Risk Taking on Tax Chusion in A Post FIN 48 Environment, SSRN
[7] Maydew, Edward L. (1997), Tax-Induced Earnings Management by Firms with Net Operating Losses, Journal of Accounting Research, 35: 83-96.
[8] Mills, L. and Newberry K (2001), The Influence of Tax and Non-tax cost on book-tax Reporting Differences : Public and private Firms, Journal of the A mericanTaxation Assiacion, 23: 1
[9] Phillips, J.D., Morton Pincus, S.O. Rego and Huishan Wan, (2004), Decomposing Changes in Deferred Tax Assets and Liabilities to Isolate Earnings Management Activities, The Journal of the American Taxation Association, 26: 265-292.
[10] Phlilips, John, Morton Pincus and Sonja Olhoft Rego, (2003), Earnings management New Evidence based on Deferred Tax Expense, The Accounting Review, 78: 491-521.
[11] Plesko, G. (2004), Corporate Tax Avoidance and the

ISSN 2302-786X
88 Proceeding of Annual South East Asian International Seminar (ASAIS) 2013
Properties of Corporate Earnings, National Tax Journal, 57: 729-737.
[12] Raafat R.,Roubi and A.W. Richarson, (1998), Managing Discretionary Accruals in Response to Reductions in Corporate Tax Rate in Canada, Malaysia and Singapore, The International Journal of Accounting, 33: 455-467.
[13] Roychowdhury, Sugata, (2006), Earnings Management through Real Activities Manipulation, Journal of Accounting and Economic, 42: 335-370.
[14] Scholes, Myron S., G. Peter Wilson and Mark A . Wolfson, (1992), Firms’ Responses to Anticipated Reduction in Tax Rates : The tax Reform Act of 1986, Journal of Accounting Research, 36: 161-191.
[15] Shackelford, D.A, and Terry Shevlin, (2001), Empirical Tax
Research in Accounting, Journal of Accounting and Economics , 31: 321-386.
[16] Tang, T. and Firth, M.(2011), Can Book-Tax Differences Capture Earnings Management and Tax management ? Empirical Evidence from China, The International Journal of Accounting, 46: 175-204.
[17] Watts, R.L. dan J.L. Zimmerman, (1986), Positive Accounting Theory, New York : Prentice Hall
[18] Wilson, R., (2009), An Examination of Corporate Tax Shelter Participants, The Accounting Review, 83: 696-1000.
[19] Yin, Q. Jennifer and CS. Agnes Cheng, (2004), Earnings Management of Profit Firms and Loss Firms in Response to Tax Rate Reduction, Review of Accounting & Finance, 3: 67-89.

ISSN 2302-786X
Proceeding of Annual South East Asian International Seminar (ASAIS) 2013 89
The Empowerment of People’s Priority Economy in East Kalimantan
(The Case of Tarakan City)
Arkas Viddy 1, Andi Syarifuddin 2 and Syahrul 3 1,2,3Business Administration, The State Polytechnic of Samarinda
Jl. Ciptomangunkusumo Samarinda Seberang, Samarinda e-mail: [email protected],
Abstrack
Tarakan City is an island where located between several districts among all districts in the north part of East Kalimantan. Most of local community can survive because of this resources by utilizing them. Unfortunately they still using a traditional method and lead their level of income is still low. For these reasons it needs to be designed the model which can improve the local community income in East of Kalimantan. The main objective of this research is to build the economy cluster which can increase the local community income in Tarakan City using cartesius diagram, diamond porter, STP Marketing analysis for creating the empowerment of local community income in Tarakan City. The most potential people’s product are Seaweed and Soka Crab which can be identified by involving of almost all family members and the amount of production. There are some obstacles in this business such as capital for Soka Crab Busines. Lack of capital these businesses because in all of a loan proposal need to be followed by a certificate as a collateral, while they haven’t any certificate (land or house certificate) The solution can be proposed are The Small Business Association needs to be built which can be used for price stabilization for Seaweed and Soka Crab business. The small business association system need to be established which all of the productions need to be collected by association and distribute it to the potential market with the good price. The association must provide a certainty amount of fund to be lent to the farmers and avoiding high rate cost of capital. 1. INTRODUCTION Local community economy is the strategic issue because it is proved powerful facing the economy crisis. It is noted when Indonesia experienced some crisis era such as a multy dimension crisis in 1998, a global financial crisis in 2008 until now. Relationship between country to country could impact the economy of those countries. Each country must prepare all of their competetive and comparative advantages, including Indonesia and lead improving the competence in making country’s profit. The most powerful defence for Indonesia in facing economy crisis is to generate small businesses in agriculuture fields
Agriculture fields and local raw resources should be used for increasing Indonesian economy,
because they could be utilized as the strenght points for avoiding the negative impact of global crisis. This economy must dominated by local people for improving their income with generating small, middle and micro scale of businesses. The businesses should be labour intensive and not capital intensive, so it is called a people priority economy.
The local community economy can be identified by the structure of Gross Domestic Product (GDP). Since the increasing of sub sector in GDP dominated by labour intensive, so that country economy policy can be called as a people’s priority economy policy. It needs to be identified and analized that the country implements this kind of policy or a capitalism economy policy, or mixed economy policy between a people’s priority economy

ISSN 2302-786X
90 Proceeding of Annual South East Asian International Seminar (ASAIS) 2013
and a capitalism economy by comparing the number of labour and the number of capital.
Infact, the model of people’s priority economy does not exist both at city/district or village level and it creates the main cause of innequally of income and social-economy unfair from local to national level. The local economy structure is dominated by a group of broker as a capital owner, government officers at all levels, and big companies. This parties are the main barriers of local communities which could lead inequally and unfair in managing economy resources. On the other hand, all of economy resources are behalf of people. It is noted that at about 70 percent farmers have only a few of land with a very narrow agriculture field, while other haven’t any land and they work as an agriculture labour.
It is indicated that land productivity is declining because of changing function the farms into local communities houses. In 2001 to 2003, on at about 610.596 ha farms be built local communities houses and other local communities activities. On the other hand, even Indonesia experienced decreasing of agriculture fields, but the number of farmers increase and it is noted that in 1993 only 20.8 milion farmers to be 25.4 milion farmers in 2003 (Agriculture Census, 2003). In average, each farmer has only at about 0.25 ha farm (Ismawan, 2005).
As a policy decision maker, the government should attempt to fullfil all of basic human right their people especially economy walfare. In this case the government should implement more suitable the national economic system with the real Indonesian
internal conditions for creating economy oppurtunities. In fact, the natural and human resources, or the economy institution are not homogeneous, hence the economy development strategies should focus on people’s needs based on family or democratisation economy and implementing the sustainable development.
For strenghtening the people’s priority economy, the agricultural industry is the cumpulsary requirement for supporting macro economy condition in developing the people’s priority economy which most of them are focus on agricultural basis. In term of this kind strenghtening, it needs to be fullfiled sufficient condition infrastructures for developing the farmer business organization for creating the added value for agricultural industry including putting farmer business organization on the right function as a marketing institution of agricultural products.
The East Kalimantan is one of the wealthiest province in Indonesia which has the highest GDP in Indonesia with the structure of GDP consist of Mining Sector (42.52 percent), Trade, Hotel and Restaurant Sector (14,39 percent), Agriculture Sector (10.72 percent), Industry and Manufacture Sector (8.96 percent), and Transportation and Communication Sector (6.96 percent), economic growth at about 6.32 percent and unemployment rate at about 7.66 percent or 243 thousand people in 2012 (Bappeda Kaltim, 2011). It is resulted based on implementation of various economy development policy.
Nowaday, there are some policy being implemented by the district or city government in East Kalimantan such

ISSN 2302-786X
Proceeding of Annual South East Asian International Seminar (ASAIS) 2013 91
as the soft loan called People Business Finance (Kredit Usaha Rakyat/KUR) with 9 percent interest rate per year and the target costumers are the small and middle businesses at about Rp 500 milion per unit business using all of banks in East Kalimantan which Trading and Industry Department to be a department in charge. The fund being lent called rolling fund. The rolling fund is the fund with the certainty amount be provided for local community who has a good prospect small business. After the payback this soft loan, other small business can propose this amount of soft loan. The complete planning for increasing local community has been designed by central government followed by the standard supervisory and standard evaluation. It is expected the growth of local community income would better in future.
Ironically, the income of each small and medium business in East Kalimantan are still low and it is indicated an unexpected number of income. Moreover, the rate of poor people East Kalimantan reaches 6.77 percent or at about 247 thousand people in 2011, while in year 2010, it is indicated 7.66 percent or at about 243 thousand people. It lead the contribution of the small and medium business into GDP are low which pushed the number of poor people in East Kalimantan. It can be conluded that there are some serious matters in implementing the people’s priority economy in East Kalimantan.
Based on these reasons, the research with title The Empowerment of People’s Priority Economy in East Kalimantan the case of Tarakan City needs to be done for generating an useful model and leads people income higher.
The problem needs to be formulated are:
1. How is the economy cluster priority can be proposed for local community people in East Kalimantan?
2. How is the model in developing an economy cluster priority in term of a production, a consumption, a distribution and allocation pattern, and a village production factor in Tarakan City?
3. What is the model can be generated for increasing the local people income?
The objectives of this research are:
1. To create the economy cluster priority can be proposed for local community people in East Kalimantan.
2. To design the model in developing an economy cluster priority in term of a production, a consumption, a distribution and allocation pattern, and a village production factor in Tarakan City.
3. To decide the model can be generated for increasing the local people income.
The contribution of this research to the government and local communities are:
1. As a consideration thing in deciding some economy development policies in East Kalimantan scope or national scope.
2. As a guidline for empowerment the people’s priority economy in East Kalimantan.
3. As a selected the empowerment the people’s priority economy sample in Indonesia

ISSN 2302-786X
92 Proceeding of Annual South East Asian International Seminar (ASAIS) 2013
2. THEORY 2.1 People’s Priority Economy
The economists have different views of economic development, some of them stated that an economy development needs to be done based on inter action with a global economy, in case of competetion and capital factors which are the main matter needs to be focused on, so the developing of economy policy tends to the neo-liberalism direction. On the other hand, some economists state that economy development policy should focus on local communities and to empower the local communities’ economy is the unconditional requirement. (Mubyarto, Ekonomi Pancasila, 2003)
Osborne and Gaebler (1993) stated that the empowerment people’s priority economy is an independent development local community paradigm concept which has some principals such as a community oriented.
2.1 The Empowerment of People’s Priority Economy For increasing the local community income, it need to be optimalized all of the resources which have involved in people’s priority economy. The resources consist of natural resources, human resources and technology which could be empowered for achieving the increasing people’s welfare as a main goal of the country.
The empowerment contains the main target such as creating the fair competetion which could be a trigger for creating survival
opportunities for the small and midle size businesses, and then to develope it, in order to contributing the beneficial economy (Prawirokusumo, 2008)
3. METHODOLOGY
3.1 Research Scope The scope of research is only one city in the north of East Kalimantan. In this case the research would to be done in Tarakan City as a respondent in this research.
3.2 Data Type Most of data used on this research are primary data combining with secondary data.
3.3 Collecting Data Method Data collection method done by the method of Rapid Rural and Urban Appraisal (RRUA).
3.4 Instrument Analysis Internal and External Analysis
This instrument usually called SWOT (Strengths, Weaknesses, Opportunities, Threats) 1. Internal
Cartecius Diagram Analysis
The four quadrants generate by X axis (production) and Y axis (labour/people). For cutting points, the average of X and Y needs to be calculated and then figured. The next step is put all of potential economy into the right quadrant and empowerment strategy can be formulated.

ISSN 2302-786X
Proceeding of Annual South East Asian International Seminar (ASAIS) 2013 93
Marketing Analysis
Segmentation, Targeting and Positioning analysis
Porter Five Industry Analysis
This instrument will identify five key structural features that determine the strength points of the five competitive forces within an industry and hence industry profitabilitysuch as : Buyer Power, Supplier Power, Threat of Entrants, Threat of Substitutes, and Competitive Rivalry. Michael E. Porter (1980).
4. ANALYSIS AND DISCUSSION
4.1 Analysis SWOT Analysis
Strength points
1. Plenty of natural resources such as fishery, agriculture farm and husbandary
2. Standard quality human resource
3. Good relationship between local communities and the government officers
4. The location of Tarakan City is strategic
5. Tarakan City accessibility is already connected to other cities in Indonesia
Weaknesses points
1. Lack of capital
2. Lack of clean water
3. Lack of input and technic production
4. Ethnic conflict is sensitive
5. Expensive of electricity price
Opportunities points
1. An effective implementation of China ASEAN Free Trade Agreement (CAFTA)
2. ASEAN Economic Community (AEC) in 2015.
Threats points
1. The progress of neighbourhood district or city economic development
2. Less of ballancing fund for Tarakan City
Cartecius Diagram Analysis
After identifying the economic resources, it can be clustered all of the potential economic resources as follow:
Clustering Based On Sector
Fishery Sector in Selumit Pantai, Sebengkok, Mamburungan, Mamburungan Timur, Lingkas Ujung, Karang Harapan, dan Pantai Amal.
Food and Agriculture Sector in Mamburungan, Mamburungan Timur, Juata Kerikil, Selumit Pantai, and Karang Harapan.
Agriculture Sector in Mamburungan, Mamburungan Timur, and Karang Harapan.

ISSN 2302-786X
94 Proceeding of Annual South East Asian International Seminar (ASAIS) 2013
Husbandary Sector in Pantai Amal, Pamusian, Mamburungan, Juata Kerikil, Sebengkok and Mamburungan Timur
Tourism Sector in Pantai Amal, Karang Anyar Pantai, Juata Kerikil and Juata Permi
Trading and Services Sector in Karang Anyar, Karang Balik, Karang Rejo, Lingkas Ujung, Gunung Lingkas, Sebengkok, Selumit and Pamusian.
Clustering Based On Product
Seaweed in Pantai Amal, Selumit Pantai and Juata Laut.
Soka Crab in Karang Anyar Pantai.
Crab in Juata Laut, Karang Harapan, Karang Anyar Pantai, Selumit Pantai, Mamburungan, and Lingkas Ujung.
Fish in Juata Laut, Karang Harapan, Karang Anyar Pantai, Selumit Pantai, Mamburungan, and Lingkas Ujung.
Prawn in Juata Laut, Karang Harapan, Karang Anyar Pantai, Lingkas Ujung and Mamburungan.
Cocoa in Mamburungan, Kampung Satu, Kampung Empat and Kampung Enam.
Cullinery in Pamusian, Karang Rejo, Karang Anyar, Karang Balik, Sebengkok, and Gunung Lingkas.
Tourism Destination in Mangrove Forest, Amal Beach, City Forest, and Seedbed.
Marketing Analysis
Using this kind of analysis the product of each village should has been identified and decided. In this research there are some the most potential products need to be analized such as:
Seaweed in Amal Beach Village
Soka Crab in Beach of Karang Anyar Village
Hard Skin Crab in Beach of Karang Anyar Village
Crab in Beach of Karang Anyar, Juata Laut and Selumit Beach Village
Fish in Juata Laut and Selumit Beach Village
Prawn in Juata Laut, Karang Harapan, Karang Anyar Pantai, Selumit Pantai, Mamburungan, and Lingkas Ujung Village
Segmentation
Tabel 4.1 Tarakan Product Segmentation No Product Segment can be taken based on
1 Seaweed Geographical Segmentation
2 Soka Crab Geographical and Psychographic Segmentation
3 Hard Skin Crab Geographical Segmentation
4 Crab Geographical and Psychographic Segmentation
5 Fish Geographical Segmentation
6 Prawn Geographical and Psychographic Segmentation
Source : fields research, processed

ISSN 2302-786X
Proceeding of Annual South East Asian International Seminar (ASAIS) 2013 95
Targeting
Tabel 4.2 Tarakan Products Targeting No Product Target Market 1 Seaweed Surabaya, Malaysia and Hongkong 2 Soka Crab Tarakan and other cities in East Kalimantan, Surabaya
and Japan 3 Hard Skin Crab Corporate in abroad (Malaysia and Japan) 4 Crab Tarakan and other cities in East Kalimantan, Surabaya
and Japan 5 Fish Tarakan, Malaysia and Japan 6 Prawn Tarakan, Malaysia and Japan
Source : fields research, processed
Positioning Tabel 4.3 Tarakan Product Positioning
No Product Positioning 1 Seaweed Low Price 2 Soka Crab Healthy Food 3 Hard Skin Crab Low Price 4 Crab Taste 5 Fish Fresh and Cheap 6 Prawn Fresh
Source : fields research, processed
Porter Five Industry Analysis
The strength points of the five competitive forces within an industry and hence industry profitability such as : Buyer Power, Supplier Power, Threat of Entrants, Threat of Substitutes, and Competitive Rivalry.
Using this kind of analysis the product of each village should has been identified and decided. In this research there are some the most potential products need to be analized such as:
1. Seaweed in Amal Beach Village
2. Buyer Power : dominant, Supplier Power : weak, Threat of Entrants : weak, Threat of Substitutes: Hard, Competetive Rivalry : weak/low competency
3. Soka Crab in Beach of Karang Anyar Village
4. Buyer Power : dominant, Supplier Power : weak, Threat of Entrants : Hard, Threat of Substitutes: Hard, Competetive Rivalry : high competency
5. Hard Skin Crab in Beach of Karang Anyar Village
6. Buyer Power : dominant, Supplier Power : weak, Threat of Entrants : Hard, Threat of Substitutes: Hard, Competetive Rivalry : weak
7. Crab in Beach of Karang Anyar, Juata Laut and Selumit Beach Village
8. Buyer Power : equally, Supplier Power : weak, Threat of Entrants : weak, Threat of Substitutes: weak, Competetive Rivalry : high competency
9. Fish in Juata Laut and Selumit Beach Village

ISSN 2302-786X
96 Proceeding of Annual South East Asian International Seminar (ASAIS) 2013
10. Buyer Power : dominant, Supplier Power : weak, Threat of Entrants : weak, Threat of Substitutes: weak, Competetive Rivalry : high competency
11. Prawn in Juata Laut, Karang Harapan, Karang Anyar Pantai, Selumit Pantai, Mamburungan, and Lingkas Ujung Village
12. Buyer Power : dominant, Supplier Power : weak, Threat of Entrants : weak, Threat of Substitutes: weak, Competetive Rivalry : high competency
4.2 Discussion Based on all of analized it needs to be discussed what need to be proposed. Tarakan has some strenghts and weaknesess points. Using all of the strenghts points, the weaknesess points need to be solved in a strategy formulation called WS strategy which all the weaknesess convert to the strenght Tarakan City. All of the micro, small and midle size businesses in Tarakan experience lack of capital, because the requirement to lend fund from the bank should fullfil the 5C requirements, including to provide the collateral such as land or house certificate, while not all of them have that certificate. Based on this condition model should be proposed is the local government need to create an independent legal business and finance consultant who has a very specific job as follow:
1. Advisory for the of the micro, small and midle size businesses for increasing the businesses’ profit.
2. Supervisory the human resources and financial management of those company.
3. As facilatator connectivity between the small companies, bankings and governments (including local government)
4. As a garrantor for fund loaning to the banks or the governments.
Other problems such as lack of clean water, lack of input technic production, and an expensive electricity price can be solved by allocating the sufficient budget to fix these kinds of public facilities, while etnic conflict should anticipate by creating social and religious local communities’ activities.
Other strategies can be formulated is TO strategy as follow:
1. Put the neighbourhood district or city as the target market
2. Efficiency and tight supervisory of budget need to be done.
In term of clustering analysis
Seaweed, Soka Crab, Crab, Fish and Prawn should be a priority of people’s priority economy development

ISSN 2302-786X
Proceeding of Annual South East Asian International Seminar (ASAIS) 2013 97
programme by proposing more budget next year and giving intensive supervisory for increasing people’s income.
Regarded to Segmentation, Targeting and Position, the local government should expand the market and decide the best market target for increasing people’s income.
In term of Porter Five Industry Analysis, there is a model can be proposed such as:
Seaweed, Soka Crab, Crab, Hard Skin Crab, Fish and Prawn, the local government with the farmers should create a stabilization seaweed price institutions like koperasi which can collect the seaweed, and keep it until the price higher. Other action needs to be taken is the local government has to create a legal business consultant as a garrantor when they propose loan for their businesses.
5. CONCLUSION Based on the analysis and discussion, to conclude that:
1. The economy cluster priority can be proposed for local community people in East Kalimantan the case of Tarakan City is Fishery, Food and Agriculture, Agriculuture,
Husbandary, Tourism, and Trading and Services Sector Cluster.
2. The model in developing an economy cluster priority in term of a production, a consumption, a distribution and allocation pattern, and a village production factor in Tarakan City is focused on the potential product such as Seaweed, Soka Crab, Crab, Hard Skin Crab, Fish, and Prawn
3. The model can be generated for increasing the local people income is the partnership local government, bank or financial institution, legal independent business consultant and people’s priority economy actors.
6. BIBLIOGRAPHY [1] https://faculty.fuqua.duke.edu/~m
oorman/GeneralMills/Section2/Section2.htm
[2] McDonald, Malcolm and Adrian Payne (1996), Marketing Planning for Services, Oxford: Butterworth-Heinemann, pp 77-117 (reference from Journal)
[3] Michael E. Porter (1980), Industry Structure and Competitive Strategy: Keys to Profitability, Financial Analysis Journal, July-August, 30-41. (reference from journal)

ISSN 2302-786X
98 Proceeding of Annual South East Asian International Seminar (ASAIS) 2013

ISSN 2302-786X
Proceeding of Annual South East Asian International Seminar (ASAIS) 2013 99
The Effect of Strategic Corporate Social Responsibility and Competitive Strategy Against The Relationship Between Supply
Chain Management and Company Performance
Titi Suhartati
Politeknik Negeri Jakarta Depok, 16425 e-mail : [email protected],
Abstract
This study aimed to examine the effect of supply chain management (SCM ) on firm performance moderated by strategic corporate social responsibility (SCSR) and competitive strategy. Specific targets to be achieved from this research is that there a choice of competitive strategy associated with supply chain management. If the choice of competitive strategy (cost leadership and differentation ) in accordance with the supply chain management,so it is expected to produce optimal business performance. Sample firms are manufacturing company listed in Indonesia Stock Exchange (BEI) for the period 2010-2011. Financial data and annual reports obtained from the Thomson Reuteursand Indonesia Stock Exchangedatabase. Multiple regression equation models was used to test the hypothesis. Results show that supply chain management and strategic corporate social responsibility have a positive and significant effect to the company performance. Also show that the effect of supply chain management on firm performance become stronger moderated by competitive stategy and proven that the supply chain management have related with competitive strategy.This study tries to fill the gap regarding the relationship of strategic CSR, competitive strategy,supply chain managemen and company performance that have not been examined by previous studies. Key Words: Supply Chain, Strategic CSR, Strategy, Performance 1. INTRODUCTION Current competitive strategy paradigm shift, from the beginning there is competition between companies to competition among network. The process of value creation over the business networking needs support increased efficiency and effectiveness of internal business operations such as supply chain management (SCM). This concept emphasizes on the integration of information and material flow through the business networks to support corporate innovation processes is an important thing to achieve increased capability of the company to meet the needs and desires of consumers ( Lee and Whang , 2000).
Increasingly competitive business competition requires companies to implement the right business strategy in the face of a turbulent business environment , as indicated by the
continuous process of innovation and the high rate of change in consumer tastes. According Kathandaraman and Wilson (2001) , one of the keys to success in a competitive business enterprise is to have and maintain a competitive advantage lies in the ability of the company to distinguish itself by its competitors and production capability with lower cost . Ramalhinho (2002 ) states that a company should have a good inventory system and efficient (SCM) in global competition .
Changes in the level of public awareness regarding the development of business in Indonesia, raises awareness about the importance of implementing new Corporate Social Responsibility (CSR). CSR disclosure practices has been widely applied by public companies in Indonesia. In the annual report, the company has mentioned aspects of social

ISSN 2302-786X
100 Proceeding of Annual South East Asian International Seminar (ASAIS) 2013
responsibility even in a relatively simple form. CSR disclosure through various media companies do as a form of accountability to stakeholders and also to maintain the reputation. CSR issues in Indonesia in recent years experienced a fairly intense attention from various parties (companies , academia and government). Government response seen from the issuance of Law no. 40 of 2007 on Limited Liability Companies, which includes liability company in which the company is exploring in particular the natural resources to undertake CSR (Badaruddin , 2008). The concept of CSR is still relatively new lead to an understanding of the concept and practice of CSR is still different. Strategic concept of CSR is not the same as charity or philanthropy is more spontaneous and less administration have long-term effects for the community in the sense of empowerment they both economically, socially, and culturally (Badaruddin, 2008).
Term strategic CSR used by Lantos (2001), Baron (2001) in Sayekti (2011) states that strategic CSR is the CSR activities that benefit the stakeholders in the company as well as an increase in profit. CSR is a strategic activity if the activity is affecting the company's core business, growth, profitability and sustainability of companies (Kolk and Pinkse, 2008). While non- strategic CSR activity is an activity which is not aimed at achieving the company's goals, such as charity ( donation ), in the form of donations or other charitable activities. Through strategic CSR activities, companies signals a good management related company's ability to manage relationships with stakeholders ( Akpinar et el . , 2008 at Sayekti , 2011).
The first problem is related whether there is influence of competitive strategy andstrategic CSR supply chain management to and company performance.
Selection of an appropriate strategy will create superior performance for the organization, creating value for consumers and generate competitive advantage for the company (Porter, 1980). The second problem is whether there is influence of competitive strategy on the relationship between supply chain management and company performance .
2. THEORY
2.1 Stakeholder theory Stakeholder theory assumes that the business does not stand alone but related to society. Thus, the presence of stakeholders will determine the company's business in the future (Perry and Towers, 2009). This theory also states that companies should be responsible for the stakeholders, both internal and external (Clarkson, 1995; Donaldson and Preston, 1995; Main, 2007; Galbreath, 2009). Stakeholder theory states that the company's financial success depends on the ability to formulate and implement effective corporate strategies related to the management of relationships with company stakeholders (Bramer et al., 2006). This is the basis for the emergence of corporate social responsibility activities.Although the concept of stakeholder management has emerged in the literature since the period of the 1960s, Freeman (1984) developed a stakeholder approach that is associated with the company's

ISSN 2302-786X
Proceeding of Annual South East Asian International Seminar (ASAIS) 2013 101
strategy (Lee, 2007; Sassed and Trahan 2007; Sayekti, 2011)
2.2 Strategic Corporate Social Responsibility Porter and Kramer (2002) stated that CSR activities should be supporting the company's goals. In line with Burke and Logsdon (1996) that strategic CSR is a social responsibility that generate benefits related to the core business of the company and contribute to the achievement of the company's mission effectiveness. The idea of strategic CSR is a way to bridge the interests of the owners of capital and social demands that will support the survival of the company (Porter et al., 2002: 2006).
Furthermore, Porter and Kramer (2006) states that strategic CSR can help companies to achieve cost leadership or differentiation or both. To identify the relationship of CSR to the strategy of the firm Burke and Logsdon (1996) proposed a more comprehensive basis in an attempt to capture the behavior of the overall business strategies and opportunities in achieving the benefits of CSR. The five strategies are centrality, specifyciti, proactivity, visibility and volunterism. This dimension has been adopted Husted and Allen (2007, 2009) and Novita (2010) to prove the strategic influence of CSR on company performance.
2.3 Supply Chain Management Understanding the supply chain generally describes how an organization (suppliers, manufacturers, distributors,
retailers and customers) are interconnected. According to Chopra and Meindl (2007), the supply chain consists of all parties involved directly or indirectly in meeting customer demand. Supply chain involves not only manufacturers and suppliers, but also a means of transport, warehouses, retailers , and customers themselves. The main objective of the supply chain is to maximize the overall value generated by integrating the components that are included in the supply chain, ie, suppliers, manufacturers, distributors, retail outlets and customers (Chopra and Meindl, 2007). Meanwhile, Chopra and Meindl (2007) suggested two strategies that supply chain lean supply chain (supply chain efficient) and agile supply chain (responsive supply chain). Efficient supply chain focuses on efforts to meet consumer demand at the lowest prices by minimizing the total cost (low cost strategy ), while the responsive supply chain focuses on efforts to respond quickly to consumer demand to support the stock in anticipation of uncertain demand and anticipate fluctuations in stock suppliers (innovative strategies ) .
Impact in addition to lowering the cost of SCM (Lambert and Cooper, 2000; Ellram and Liu, 2002; Farris and Hutchison, 2002 ) stated that a satisfactory supply chain management (excellence) is directly related to superior organizational performance (D' Avanzo et al., 2004; Ellram et al., 2004; Christopher, 2005). According to Christopher (1998), there are

ISSN 2302-786X
102 Proceeding of Annual South East Asian International Seminar (ASAIS) 2013
three main areas where SCM can affect the financial performance of the organization's profitability, liquidity and productivity or asset utilization.
2.4 Competitive Strategy Selection of an appropriate strategy will create superior performance for the organization. This strategy options that need to be considered to be part of the creation of value for the consumer and generate competitive advantage for the firm (Porter, 1980). The type of strategy chosen by the company should adjust to all the activities of every function in the organization.
Porter (1980) and Harrison (2003) stated that there are two competing strategies in general which are the cost advantage and differentiation. Cost advantage is achieved through reducing costs, improving profitability and differentiation by providing increased levels of service. Porter (1985) states that the company must have a clear competitive strategy in order to compete effectively and gain a sustainable competitive advantage. Porter suggested that the company may choose to become providers of products at low prices (cost efficiency strategy) or a provider of unique and innovative products
(innovation strategy). Competitive strategy aims to build on the advantages and defensive positions against the forces that determine industry competition.
2.5 Company Performance There are several criteria in assessing a company's performance are presented in the literature. Such criteria include financial and non-financial. Financial performance of the company can be seen from the profitability, the return on investment (ROI), the main achievement of the company, growth, innovation, rate of return assets ( ROA / ROE ) ( Denison, et al., 1995). Profitability is intended to determine the company's ability to generate profits and to find out how much the company is managed effectively. Harisis and Ogbonna (2001); Bae Lawler (2001), states that the performance is a measure of success or accomplishment that has been achieved by a company which is measured by a certain time. Company performance is the achievement of business objectives are established as the maximum benefit to be able to sustain growth and development.
2.6 Reseach Framework Based on the teory, we developed research framework in figure 1

P
3
3
Proceeding
We deto theabove
H1: Shave compa
H2: positivrelatiochain compa
H3: Cpositivrelatiochain compa
H4:Cowith s
3. METH
3.1 Data This quantisecondis reinformof mduringlisted ExchaOther from Thom2010-
of Annual S
evelop hyphe research e:
Supply chaipositive inany perform
Strategic ve influeonship be
managany perform
Competitiveve influeonship be
managany perform
ompetitive supply chain
HODOLOG
researchitative apprdary data. equired fr
mation and manufacturing 2010-20
in the Inange (ww
financial the OSIRIS
mson Reute2011.Data
I
South East A
hotesis, leaframework
in managemnfluence to mance.
CSR hnce on tween sup
gement mance.
e strategy hnce on tween sup
gement mance.
strategy reln manageme
GY
h used roach by uSecondary
from finanannual rep
ng compa011which ndonesia S
ww.jsx.co.id data der
S database ers for pe
consists
ISSN 2302-
Asian Inter
Figure 1
ading k, as
ment the
have the
pply and
have the
pply and
lated ent
a using
data ncial ports anies
are Stock d ). rived
and eriod
of
786X
rnational Se
annumanuon Exchyearo2011
3.2 ReseModstraterelatichaincomp(H2)
VALUβ2SCSβ4SIZ
Descperfo(tobithe sunifiof analyassetdebt/
Modcomprelatichaincomp
VALβ2ASβ4AS
eminar (ASA
ual saufacturing c
the Indhange, leadiobservation.
earch Modeels to testegic CSionship bn manapany perfor
UE = β0 +βSR+β3PROX
ZE + β5LEV
cription: vormance ofns'q); proxysupply chaied proxy; sstrategic
ysis; size is ts), lev is /total assets)
el to test petitive strionship bn manapany perform
LUE = β0 +βSSET + β3PSSET*PRO
AIS) 2013
ample companies donesia ing to 220
ns from 2
el t the effe
SR on between suagement rmance (H1
β1PROXY +XY*SCSR+
V + ε
value is f the com
xy is the siin by usinscsr is a me
csrby cofirm size (lleverage
).
t the effectrategy onbetween suagement rmance (H3)
β1PROXY +PRICE + OXY +
103
110 listed Stock firm-
2010-
ct of the
upply and
) and
+ + (1)
the mpany
ze of g the
easure ontent log of (total
ct of n the upply
and ).
+

ISSN 2302-786X
104 Proceeding of Annual South East Asian International Seminar (ASAIS) 2013
β5PRICE*PROXY + β6SIZE + β7LEV + ε (2)
Description: value is the company performance (tobins'q); proxy is the size of the supply chain by using the unified proxy; asset is asset utilization efficiency as a trend indicator low cost strategy; price is the price premium capability as a trend indicator differentiation strategy; size is firm size (log-assets), lev is leverage (total debt/total assets).
Model to test the company's strategy preferences in implementing supply chain management (H4).
PROXY=β0+β1ASSET+β2PRIC
E+β3SIZE + β4LEV + ε (3)
Description: proxy is a measure of the supply chain by using the unified proxy; asset is asset utilization efficiency as a trend indicator low cost strategy: price is the price premium capability as a trend indicator differentiation strategy: size is firm size (log of assets), lev is leverage (total debt/total assets).
This study predicts if one coefficient β1 or β2 significant positive then the company is implementing supply chain management, since competitive strategy will increasingly lead to low cost (ASSET) or differentiation (PRICE). If β1 and β2 are both significantly the trend of companies choosing both of strategy.
3.3 Measurements Strategic CSR (SCSR) is measured by using content
analysis method by using an index to assess the disclosure from company annual report. To assess the disclosure, research using content analysis by binary coding (Beatty, et al. , 2004). This study uses five strategic dimensions of CSR (Burke and Logsdon, 1996; Husted and Allen, 2007; 2009) developed by Novita (2010) using four coding ordinal scale of 0 when the information required by the analysis instrument available, 1 if information publicly disclosed, 2 if the information is more clearly expressed qualitatively and 3 if the information disclosed is qualitatively and quantitatively (eg, percentage, amount, frequency). The dimensions consist of centrality, specificity, proactivity, visibility, and voluntarism .
Supply chain management (SCM) proxy constructed from two financial ratios that measure of cash generation and asset efficiency. Cash generation ratio is computed by dividing net cash inflow from operations to sales. While asset efficiency ratio is calculated by dividing sales by total assets minus debts (Johnson & Templar , 2011).
This study used competitive strategies of Porter (1985); Gani and Jermias (2006) which are a lowcost and differentiation strategy. Asset utilization efficiency (low cost) is the ratio of total sales revenues divided by total assets. While the price premium capability (differentiation)is the ratio of gross margin divided by total sales revenues.Company

ISSN 2302-786X
Proceeding of Annual South East Asian International Seminar (ASAIS) 2013 105
performance used Tobin 's Q is measured from the ratio of the market value of the company (market capitalization) divided by total assets.
Multiple regression method use to prove developed hyphotesis beside using Eviews 7for results analysis.
4. ANALYSIS AND DISCUSSION
Table4.1. Result Model 1
VALUE = β0 +β1PROXY + β2SCSR+β3SCSR*PROXY+β4SIZE + β5LEV + ε
Variable Predicted Sign Coefficient t-Statistic Prob. C 3.376226 0.821849 0.4140
PROXY + 7.127149 1.628741 0.0540 * SCSR + 6.562398 1.858143 0.0429 **
SCSR*PROXY + 4.411102 1.261067 0.2116 SIZE + -0.116974 -0.293117 0.7703 LEV + 0.282217 0.253333 0.8008
Source data: Eviews 7 ***Significant at 1%,**significant at 5%, *significant at 10% (two-tail).
Test results (table 4.1) show that the activity of supply chain management and strategic CSR have positive affects and statistically significantto the company performance. Consistent findings that a satisfactory supply chain management (excellence) is directly related to superior organizational performance (D'Avanzo et al., 2004; Ellramet al., 2004; Christopher, 2005, Jonhson & Templar, 2011). Also strategic
CSRhave positive affects and statistically significant, meaningis directly related to company performance, similar with Husted and Allen (2007, 2009), Novita (2010). These results are consistent with the initial expectations and supports Hypothesis 1. While interaction between strategic CSR and SCM not related with company performance. So, the result do not support Hypothesis 2.
Table4.2. Result Model 2
VALUE = β0 +β1PROXY + β2ASSET+β3PRICE +β4ASSET*PROXY+β5PRICE*PROXY + β6SIZE + β7LEV + ε
Variable Predicted Sign Coefficient t-Statistic Prob. C 3.376226 0.821849 0.4140
PROXY + 7.127149 1.628741 0.0540 * ASSET + -0.562398 -0.58143 0.5629 PRICE + -3.762039 -1.52786 0.0656 *
ASSET*PROXY + 4.411102 1.261067 0.2116 PRICE*PROXY + 22.04563 2.03594 0.0457 **
SIZE + -0.116974 -0.293117 0.7703 LEV + 0.282217 0.253333 0.8008
Source data: Eviews 7 ***Significant at 1%,**significant at 5%, *significant at 10% (two-tail).
Table 4.2. shows that the strategy of variable low-cost strategy (ASSET) and their interaction with supply chain (ASSET * PROXY) does not affect the company performance. This possibility occurs because preferences
for companies that implement strategies supply chain management is not in accordance with the low-cost strategy. Result testing for strategy indicates that differentiation strategy (PRICE) and their interaction with

ISSN 2302-786X
106 Proceeding of Annual South East Asian International Seminar (ASAIS) 2013
supply chain (PRICE * PROXY) have positive and statistically significant at (0.0656) and (0.0457). Indicates that the strategy affects the relationship between supply chain management
and enterprise performance. These results are consistent with the initial expectations and supports Hypothesis 3.
Tabel 4.3. Result Model 3
PROXY = β0 +β1ASSET + β2PRICE+β3SIZE + β4LEV + ε
Variable Predicted Sign Coefficient t-Statistic Prob.
C 1.281983 1.748736 0.0847
ASSET ? 0.312066 2.436214 0.0174 **
PRICE ? -0.585682 -2.150263 0.0349 **
SIZE ? -0.087142 -1.219236 0.2268
LEV ? -0.400703 -2.037541 0.0453 ** Source data: Eviews 7 ***Significant at 1%,**significant at 5%, *significant at 10% (two-tail).
Results of tests of variable ASSET (low cost strategy) with supply chain management (PROXY) shows a positive and statistically significant. This suggests that there is a relationship between supply chain management and competitive strategy of low cost options. While the test results between PROXY and PRICE is negative and statistically significant -0.0349. This shows that the company that runs the trend in supply chain management will not undertake or differentiation strategy are more likely to perform low cost competitive strategy. It occurs in manufacturing industryas described by Said et al. (2006) that the implementation of supply chain management must follow the overall corporate strategy.
5. CONCLUSION The conclusion of this studi, as follows: first, there is a positive and significant relationship between supply chain management and company performance;second, there is a positive and significant relationship between strategic corporate social responsibility and company performance;third, proved thatcompetitive strategy strengthens the relationship between supply chain management and corporate performance; fourth, there is a
significant positive relationship between competitive strategy of low cost (cost efficiency) and supply chain management. These results indicate that the sample firms are implementing supply chain management tend to choose low cost competitive strategy.
Several limitations to this study, such as: research data is limited its only using two period with a limited sample size of manufacturing company; its only using the financial data to measure supply chain management and competitive strategy determine preferences.
6. BIBLIOGRAPHY [1] Basamalah, Anies S, 2005,
“Social and Environmental Reporting and Auditing in Indonesia: Maintaining Organizational Legitimacy?”, Gadjah Mada International Journal of Business, January-April, Vol. 7, No. 1, pp. 109 – 127.
[2] Baysinger, B. and Butler, H. 1985, ‘‘Corporate governance and the board of directors: performance effects of changes in board composition’’, Journal of Law, Economics, dan

ISSN 2302-786X
Proceeding of Annual South East Asian International Seminar (ASAIS) 2013 107
Organization, Vol. 1 No. 1, pp. 101-24.
[3] Burgess K Singh, PJ and Koroglu R. 2006, Supply Chain Management: a Structured Literature Review and Implications for Future Research, International Journal of Operation dan Production Management, Vol.26 No.7, pp.703-729.
[4] Chopra, S, Meindl, P., 2007, Supply Chain Management; Strategy, Planning dan Operations, 3rd Edition. Pearson Prentice Hall. Upper Sadle River, New Jersey.
[5] Christopher, M., 1998, Logistic and Supply Chain Management; Strategies for Reducing Cost and Improving Service, 2nd edition, Prentice Hall, London.
[6] Clark, TH., Hammond JH., 1997. Reengineering Channel Reordering Process to Improve Total Supply Chain Performance, Production and Operation Management, 6 (3), 248-262.
[7] Darwin, Ali, 2004. “Penerapan Sustainability Reporting di Indonesia”, KonvensiNasionalAkuntansi V, Program ProfesiLanjutan, Yogyakarta.
[8] Daryatno, Arief. 2004. Pengaruh Corporate Governance padaNilai Perusahaan denganManajemenLabasebagaiVariabel Intervening SimposiumNasionalAkuntansi VII Denpasar Bali, 2-3 Desember.
[9] Davis James H., Donaldson Lex., 1997, Toward Stewardship Theory of Management,
Academy of Management Review, Vol 22, No.1, pp 20-47.
[10] Dwiningsih, Nurhidayati, 2005, ManajemenRantaiPasokan (Supply Chain Management) dan E-Commerce, www.stekpi.co.id, kode MK 08/Bab 8.
[11] Ellram, LM and Liu B, 2002, The Financial Impact of Supply Management, Supply Chain Management Review, Vol.6, No.6, pp 30-37.
[12] Frohlich MT., Westbrook R., 2001, Arcs of Integration; an International Study of Supply Chain Strategies, Journal of Operation Management, Vol.19, No.2, pp 185-200.
[13] Gani, Lindawati dan Jermias,,Johnny., 2006, Investigating the Effect of Board Independence on Performance Across Different Strategies, The International Journal of Accounting, 41: 295-314
[14] Haigh, M. dan M. T. Jones, 2006, The drivers of corporate social responsibility: A critical review, The Business Review, Cambridge, Vol. 5 No. 2, 245 – 251.
[15] Hamm S., 2007. KolaborasiRadikal; PelajarandariPabrikInovasi IBM, Business Week, No. 25, September, 30-39.
[16] Hanfield, R.B., Nichols, E.L., 2002, Suplly Chain Redesign; Transforming Supply Chain into Integrated Value System, Prentice Hall, London.
[17] Haniffa, R.M., dan T.E. Cooke, 2005, “The Impact of Culture and Governance on Corporate Social Reporting”, Journal of

ISSN 2302-786X
108 Proceeding of Annual South East Asian International Seminar (ASAIS) 2013
Accounting and Public Policy 24, pp. 391-430.
[18] Hendricks KB.,Singhal VR., 2003, The Effect of Supply Chain Glitches on Shareholders Wealth, Journal of Operation Management, Vol.21, No.5, pp 501-522
[19] Herlina, 2006, HubunganTipeStrategiBisnisdan StrategiPemasaranDalamMenciptakanKeunggulanKompetitif Perusahaan DenganMenggunakanManajemenTenagaPenjual, JurnalManajemen, Vol. 6, No. 1, p.57-64
[20] Indriantoro, Nur dan Supomo, Bambang, 2002. Metodologi Penelitian Bisnis: untuk Akuntansi dan Manajemen, Edisi Pertama, BPFE -Yogyakarta.
[21] Johnson M, Templar S., 2011, The Relationship between Supply Chain Management and Firm Performance; The Development and Testing of a Unified Proxy, International Journal of Physical Distribution dan Logistic Management, Vol. 41 No. 2, pp.88-103.
[22] Kanthadaraman P., Wilson DT, 2001. The Future of Competition: Value Creating Network, Industrial Marketing Management, 30, pp.379-390.
[23] Kotler, Philip dan Nancy Lee. 2005. Corporate Social Responsibility: Doing the Most Good for Your Company and Your Cause. New Jersey: John Wiley dan Sons, Inc.
[24] Lalonde B.J., 2000, Making Finance Take Notice, Supply Chain Management Review, Vol.4, No.5, pp 11-12.
[25] Lambert D.M., Burduroglu R., 2000, Measuring and Selling the Value of Logistic, International Journal of Logistic Management, Vol.11, No.1, pp.1-18.
[26] Lantos, G. P. 2002. “The ethicality of altruistic corporate social responsibility”, Journal of Consumer Marketing, Vol. 19 No. 3, pp. 205- 230.
[27] Lena, 2007, Keselarasan Teknologi, Strategi Operasi dan Kinerja Perusahaan: Sebuah Studi explorasi pada Perusahaan Manufaktur di Indonesia, Usahawan, 04 April, XXXVI : 43-55
[28] Marcus,Intaher., 2010. Agile Supply Chain; Strategy for Competitive Advantage, Journal Global Strategic Management, Vol.7, June, pp. 5-17
[29] Nawari, 2010, Analisis Regresi dan SPSS 17, PT Elex Media Komputindo, Jakarta.
[30] Patten, D.M. 2002. “The relation between environmental performance and environmental disclosure: a research note”. Accounting, Organization and Society. 27. 763-773.
[31] Pearce, Brian. 2008. Sustainability and Competitiveness. Measuring The Benefit for Business Competitive Advantage from Social Responsibility and Sustainability.http://www.forumforthefuture.org.uk
[32] Pflieger, Juli; Matthias Fischer; Thilo Kupfer; Peter Eyerer. 2005. “The contribution of life cycle assessment to global sustainability reporting of Organization”. Management of Environmental. Vol. 16, No. 2.

ISSN 2302-786X
Proceeding of Annual South East Asian International Seminar (ASAIS) 2013 109
[33] Porter, Michael E. 1980. Competitive Strategy – Techniques for Analyzing Industries and Competitors. The Free Press.
[34] Porter, Michael E. 1985. Competitive Advantage – Creating and Sustaining Superior Performance. The Free Press.
[35] Sembiring, Eddy Rismanda, 2005, “Karakteristik Perusahaan dan Pengungkapan Tanggung Jawab Sosial: Study Empiris pada Perusahaan yang Tercatat Di Bursa Efek Jakarta”, Simposium Nasional Akuntansi VIII, 2005.
[36] Siegel, Donald dan Paul, Chaterina J. 2006. Corporate Social Responsibility and Economic, Springer Science and Business Media, p. 207-211.
[37] Simchi-Levi, David, Phillip K., Simchi-Levi, Edith, 2008, Designing and Managing the Supply Chain: Concept, Strategies and Case Studies. 3rd edition, McGraw Hill, New York.
[38] Srihartati, 2004, The Global Language Business: Management Supply Chain. http///www.gsl.or.id/article/archive.php?offset=40, 20 Agustus 2004.
[39] Suprapto, Siti Adiprigandari Adiwoso. 2006. Pola Tanggung Jawab Sosial Perusahaan Lokal di Jakarta. Jurnal Filantropi dan Masyarakat Madani GALANG. Vol. 1. No. 2.
[40] Suratno, Darsono, dan Siti Mutmainah. 2006. Pengaruh
Environmental Performance terhadap Environmental Disclosure dan Economic Performance. SimposiumNasionalAkuntansi IX. Padang. 23-26 Agustus. 18
[41] Trent R J., 2004, What Everyone Needs to Know about SCM, Supply Chain Management Review, Vol.8, No.2, pp 52-59.
[42] Utomo, Muhammad Muslim, 2000, “Praktek Pengungkapan Sosial pada Laporan Tahunan Perusahaan di Indonesia (Studi Perbandingan antara Perusahaan-Perusahaan High Profile dan Low Profile)”, Simposium Nasional Akuntansi3, 2000.
[43] Wallman, S., 1996, The future of Accounting and Financial Reporting Part II: The Colorized Approach, Accounting Horizons, June, 138-148.
[44] Watanabe, Ryoichi, 2001, Supply Chain Management: KonsepdanTeknologi, MajalahUsahawan, No.2 Vol.8, Tahun 30, Februari.
[45] Widiyanarti, Tantry. 2004. Persepsi Pelaku Bisnis Tentang Tanggung Jawab Sosial Perusahaan (Studi pada Beberapa Perusahaan Swasta di Jl. Jendral Sudirman Jakarta). Jakarta: Pusat Pengembangan Etika Unika Atmajaya. Tidak Diterbitkan.
[46] Winarno, Wing W, 2009, AnalisisEkonometrikadanStatistikdenganEviews, EdisiKedua, UPP Sekolah Tinggi Ilmu Manajemen YKPN, Yogyakarta.

ISSN 2302-786X
110 Proceeding of Annual South East Asian International Seminar (ASAIS) 2013

ISSN 2302-786X
Proceeding of Annual South East Asian International Seminar (ASAIS) 2013 111
Model Development of Integrated Entrepreneurship Learning With Based Internet/Intranet Learning Management System Applied at
Malang State Polytechnic
Mohammad Maskan1, Ahmad Fauzi2, and Ludfi Djajanto3 1,2,3Lecturer of Civil Engineering Department State Polytechnic of Malang Indonesia
Jl. Soekarno-Hatta no. 09 Malang, Indonesia
Abstract This studyfocused on development learning of the Entrepreneurship learning model at Malang State Polytechnic into learning model characterized by intranet/internet aided, which is Learning Management System (LMS) based Entrepreneurship learning model, in which this learning model employs students who are active, multi methods of teaching, and multi source of learning. Findings show that the product of Learning Management Sustem (LMS) based Entrepreneurship learning model is good. It means that product of Learning Management System based Entrepreneurship learning model is valid to use in the learning process of Entrepreneurship lesson at all department of Malang State Polytechnic. It is recommended that (1) teachers who are teaching lesson of Entrepreneurship should be given provision about Learning Management System - based Entrepreneurship learning model, (2) For further development, this Entrepreneurship learning model can be in the form of Web Modular based on internet (3) To validate this Entrepreneurship learning model, it can be applied in other lessons and (4) For organizing Web Modular learning of all lesson material have developed by computer aided, likely: e-book, e-module and e-tutorial, so Malang State Polytechnic should be build e-library in future.
Keywords: developing learning model, entrepreneurship, learning management system-based learning model, e-learning. 1. INTRODUCTION
1.1 Background Entrepreneurship learning approach existing up to now tend to teacher centered learning (CTL), where is only lecturer once sources in the learning, while student is learning object. Weakness of this approach is student only receive what lecture learned and passive attitude, competence of entrepreneurship learning material among lecturers diference because education background not only from management program and learning material mostly textual and learning methods are clasical approah, use intenet/intranet not yet so there is no strandatization of learning in State Polytechnic of Malang. Besides, student’s motivation view on learning method that
only listening, student only reach 30% from material what lecturer have learned so student’s soft skill low and boring.
In the global era recently, learning model like that not fairly again because media and learning resources are many more and variety likely used learning environment and technology progress. The learning approach recently to take student as subject, so more student learn activeky, because student construct self knowledge in the learning process. For this, student centered learning more suitable with situation and timing recently. In the student centered learning model, lecturer role as motivator, mediator and facilitator in student’s learning process. In other word, lecturer

ISSN 2302-786X
112 Proceeding of Annual South East Asian International Seminar (ASAIS) 2013
not only once sources of learning and learning process must no in the class room, but student can study from many learning sources likely: literature book, business man, business expert, internet, mass media (newspaper, research journal, paper), electronic media (television, radio, film) or business environment that around student lived. In the case, this learning process, student more actively, cooperative, participatise, reactive and pleasantly. Besides, student’s learning evaluation more completely and concist are cognitive, affective and psicomotoric.
Integration of information and communication technology in the learning process have change learning methodology between lecturer and student. Recently, there is challange for State Polytechnic of Malang to facilitate to learning process can be held anywhere and anytime. Other requirement is there is mobile learning and student can access material learning from outside area. Information technological and telecommunication progress likely internet/intranet progress can be reachable .
To answer this challange, so we develope learning model of entrepreneurship with learning management system based for State Polytechnic of Malang’s student.
1.2 Problem Research How is the learning model development process of learning management system based Entrepreneurship Subjectwith internet/intranet aided at State Polytechnic of Malang?
2. THEORIES REVIEW
2.1 The previous Studies on the Learning Model Development Banathy (1987) states that the criteria of the learning material development: (1) helps learners prepare an independent learning, (2) contains a comprehensive learning activity plan and enables a maximum response, (3) consists of a comprehensive learning content allowing to provide a learning opportunity to learners, (4) monitors all learning activities, and (5) provides feedback information to measure the learner’s progress.
The learning development of the Entrepreneurship applies Dick & Carey’s with the following considerations:
This model applies nine systematic and comprehensive steps, allowing to provide detailed guidance to the level of learning material production.
This model has a programmed learning format, so that it can be used for personal learning need.
The adoption of this model is based on the idea that the lecturer’s duty is as the learning planner, implementer, and evaluator.

ISSN 2302-786X
Proceeding of Annual South East Asian International Seminar (ASAIS) 2013 113
This model refers to the system theory proven to succeed in military, industry and education.
This model can be used as an attempt to develop the learning materials in the intellectual skill, psychomotoric and verbal information domains so that it is very appropriate to develop the materials of Entrepreneur subject.
This research employs the approach of the developing research adapted from the opinion of Dick and Carey (1990) consisting of five stages, namely (1) determine lesson which is going to develop, (2) identify syllabus of lesson which is going to develop, (3) develop portfolio-based entrepreneurship learning design, (4) develop a topic in the display of portfolio-based learning, and (5) try the product of portfolio-based entrepreneurship learning design
2.2 The Development Method of Learning Management System Learning Management System (LMS) is employ to learn electronic based automatically and virtually. While, many learning development models at the stage on student involevement and give channce for student to explore knowledge. The model shows a concept describing the real condition. Briggs (1978) stated that a model is a series of consecutive procedures to materialize a process. Based on
both opinions, it can be concluded that the learning development model is a series of procedures consecutively done to develop the learning system.
This development should cover the structure of clear subject content and meet the applicable criteria for the learning development. It is in line with Mustaji’s opinion (2000) stating that the advantages of the learning tool product with the developed constructivistic approach will gain the following: a) Considering the differences/variations of learning styles, the range of attention-interest-preference, memory, early competence, individual intelligence of the students, b) Considering that gifted students tend to have a strong curiosity about many things, have initiatives and competence to study independently, think critically-flexibly-productively, c) Considering that students have social aspects and gifted students should be able to learn together with other students, d) Students are provided with freedom atmosphere to have self-control, and e) Applying the individualized instruction, a learning activity that refers to AECT (1996) consisting of basic elements: choice of various forms of learning, choice of learning material, choice of learning location, flexible time arrangement, considering the early competence of the learners and learner evaluation with various forms and in a flexible schedule.
ISSN 2302-786X
114 Proceeding of Annual South East Asian International Seminar (ASAIS) 2013
3. RESEACH METHOD
3.1 Development Model The development model of this Entrepreneurship learning adopts the learning design model by Dick and Carey (1990), consisting of the following steps: (a) knowing the learning objective, (b) making the learning analysis, (c) knowing the input attitude and the student characteristics, (d) formulating the performance objective, (e) developing the pints of guideline reference test, (f) developing the learning strategy, (g) developing and selecting the learning material, (h) designing and doing formative evaluation, and (i) improving or revising the learning.
3.2 The Procedures of Learning Management System-Based Entrepreneurship Learning Development The Learning Management System--based Entrepreneurship learning design above consists of five phases of development procedures. The First Phase is determining the subject to develop. The Second Phase is identifying the syllabus of the subject to develop. The Third Phase is the development phase of the Learning Management System--based Entrepreneurship learning, consisting of seven steps, namely: 1) analyzing the learning need, 2) identifying the general objective of learning, 3) analyzing and identifying the input attitude and student characteristics, 4) formulating the specific learning objective, 5) developing the learning
material, 6) determining the steps and strategies of learning to follow, 7) determining the tool of process evaluation and learning outcome. The Fourth phase is developing topics into the presentation of the Learning Management System--based Entrepreneurship learning.The Fifth phase is the try-out phase of the Learning Management System--based Entrepreneurship learning design product, consisting of the learning model expert, field expert and learning technological expert review.
3.3 THE PRODUCT TRY-OUT 3.3.1 Population and Sample of
Try Out 1.a. Research Population
The population as the research subjects are the students of of State Polytechnic of Malang 600 studentsand 240 lecturers, at 10 departements of State Polytechnic of Malang.
1.b. Research Sample
The sampling methode for the product tryout is simple random sampling method by taking 3 subjects expert in entrepreneur, 1 learning expert and 1 learning technological expert.
3.3.2 Tryout Design The steps of the product tryout of this Learning Management System-based Entrepreneurship learning development are as follows:
3.3.3 Development Stages The Review of the Subject Expert, Learning

ISSN 2302-786X
Proceeding of Annual South East Asian International Seminar (ASAIS) 2013 115
Development/Design Expert and Computer Expert.
3.3.4 Type of Data The data required in this research can be categorized as follows:
a. Primary Data
This study tries to collect the primary data from the subject expert (lecturer), learning media expert and design expert and students in the forms of opinions, suggestions and discussions.
b.Secondary Data
The secondary data related to this research is lesson plans, syllabus, and Entrepreneurship lecturers’ names obtained through documentation and observations at State Polytechnic of Malang.
3.3.5 Data Collection Instrument The instruments used to collect data are as follows:
Questionnaires, used to collect the following data:
The reviews of the subject expert (lecturer), media expert and learning design expertThis measurement should meet four conditions, namely, the expert’s approval, comprehension on the general instructions, being valid and reliable (Cronbach, 1980; Saukah, 2004).
Documentation, used for collecting data on lesson plans, syllabus, and names, Entrepreneurship lecturers’ names
Observation, used for collecting the data on the Entrepreneurship learning method available at the State Polytechnic of Malang.
Discussions with the subject experts (lecturers), the learning media experts, learning design experts, and students. They are used for collecting data for revisions and validation of the teaching materials, lesson plans, syllabus, learning method and evaluation system products (empiric) and constructivistic learning model.
The consultation with the subject experts (lecturers), learning media experts, and learning design experts that are used to collect data for revisions and validation of the teaching materials, lesson plans, syllabus, learning method and evaluation system products (empiric) and constructivistic learning model.
3.3.6 Data Analysis Technique The data analysis used is as follows:
Content Analysis
This analysis is used for processing data from the interview and discussion with the experts, lecturers, and students and individual and small group tryout results. The content analysis is done by classifying information from qualitative data of input, opinion, criticism and suggestions for improvement in the questionnaire. The analysis results is used as the basis to revise the teaching material product.
Descriptive Analysis

ISSN 2302-786X
116 Proceeding of Annual South East Asian International Seminar (ASAIS) 2013
The Quality of Teaching Product
This analysis is used for finding out the responses of the subject experts (lecturers), learning media experts, learning design experts and students on the quality of Learning Management System-based Entrepreneurship learning model. The response score can be mathematically formulated as follows:
(Response x weight of each option)
Percentage = ------------ x 100%
n x Highest Weight
given:
n is the number of statements.
81 – 100% : very good/interesting/suitable
66 – 80% : good/interesting/suitable
56 – 65% : not good/interesting/suitable
0 - 55% : very bad/very not interesting/very not suitable
4. RESULT AND DISCUSS
4.1 Tryout Data Presentation a. Result Data of Need Analysis (Needs Assessment)
The need analysis data (Needs assessment) is obtained by collecting the questionnaires distributed to 3 subject lecturers of State Polytechnic of Malang. The question item on the need
analysis covers : (1) Respondents’ interest on the computer software in general, (2) Needs of Entrepreneurship Subject Development to develop based on the Learning Management System and to be used as the learning resources for the students of State Polytechnic of Malang, (3) The utilization of the Learning Managemenr System-based Entrepreneurship learning method, (4) The appropriateness of the design content in the Entrepreneurship subjects, and (5) the topics necessary and appropriate to develop.
b.The Data of Review Results of Subject Experts, Learning Design Experts, and Computer Experts
Findings show that the product of Learning Management System (LMS)-based entrepreneurship learning model is good. It means that product of LMS-based entrepreneurship learning model is valid to use in the learning process of entrepreneurship lesson at State Polytechnic of Malang. It is based on the try out results of its learning model development referred to Dick & Carey (1971) and Kusumo & Willis, with 6 indicators, namely (1) Learning Management System (LMS)-based entrepreneurship learning activity is interesting which is shown by the score of try out of 84.15%, (2) Learning Management System (LMS)-based entrepreneurship learning model enables students to get better knowledge more about materials which are taught which is shown by the score of

ISSN 2302-786X
Proceeding of Annual South East Asian International Seminar (ASAIS) 2013 117
78.36%, (3) relationship between objectives of learning and materials taught in Learning Management System (LMS)-based entrepreneurship learning model is relevant which is shown by the score of 78.6%, (4) test items can be used to measure the performance stated in the objective that stated in the achievement score of students’ entrepreneurship attitude which is 3.6202 and score of students’ entrepreneurship competence score which is 3.5238, (5) Learning Management System (LMS)-based entrepreneurship learning model is able to provide feedback, either for teachers or students, toward the process and results of students’ learning which is shown by the score of 79.28%, (6) Learning Management System (LMS)-based entrepreneurship learning model enables the improvement of satisfied materials and teaching which is shown by the score of 79.10%.
4.2 Discussion The development of Learning Management System (LMS)-based Entrepreneurship learning method in fact can help achieve the academic competence and motoric skill in Entrepreneurship. Theoretically, the academic achievement is possible from the result of the motivational effect leading to the improved attention and the intensity of the students’ involvement in the learning process period using their conceptual knowledge so that it broadens and deepens (Waras, 2003). Besides, the constructivisticism-based learning (project) bases on the
constructivistic perspective, where learning is not purely stimulus-response phenomenon as the perception of the behaviorists. Then the project assignment selected and determinded by the students is likely based on the conceptual knowledge they have had. In this context, the real activity done in the constructivisticism provides a learning experience that helps the reflection/abstraction and put the real life activities close to the underlying conceptual knowledge so that the academic knowledge develops more widely and deeply.
The advantages of Learning Management System (LMS) learning can also explained from the Constructive Learning theory. Simmons (1996) states that the memory representation is divided into three, namely semantic, episodic, and action representations. The semantic representation refers tot the concepts and princliples of a discipline with the accompanying characteristics. The episodic representation is based on the affective and personal experiences, while the action representation refers to the things done with the semantic and episodic information, for example, the settlement of a certain problem with certain knowledge. Thus, Learning Management System (LMS)based learning has more opportunities to develop the students’ efforts to build the complex and rich memory representation and develop a strong relationship between semantic, episodic and action

ISSN 2302-786X
118 Proceeding of Annual South East Asian International Seminar (ASAIS) 2013
knowledge. This finding is line with the researches done by some researchers: Wataon, Prieto & Dillon (1995), concluding that the concept comprehension on the discussion of the students learning through constructivisticism is better than those wo learn traditionally. Spinger, Sanne & Donovan (1999) and Johson, Johnson & Stanne (2000) studied some subjects, concluding that the learning collaboratively in small groups in constructivisticism with projects may improve the academic competence. Bragg & Reger IV (2000) conclude that the integration of the academic and technical (vocational) learning may improve the academic and technical competences. Maskan & Utomo (2009) concludes that the learning management system-based learning improves soft skill competence. While Maskan, Hadi and Aji (2010) points out that the psicomotoric, especially in e-learning competence (concept and principle comprehension) of student business administration following classes based on Web Modular is higher that Web Modular method.
But the improvement of the motoric competence from the theoretical perspective can be explained with the Motoric Learning theory on the “development rate” of the motoric competence (Schmidt, 1988) stating that it covers: 1) learning the technical (motoric) operation competence is a process of capacity achievement to perform; 2) Learning the
technical operation competence is a result of practice/experience; and 3) The process results in the relatively permanent competence change. Thus, this finding is in line with the research done by Knoll (2002) stating that the constructivisticism-based learning (project) improve the academic and technical competences. Santiyasa (2004) found a difference of concept comprehension between the students learning with the setting of Group Investigation (GI) cooperative learning and Student Team-Achievement Division (STAD). Thomas (2000) & Bragg & Reger IV state that the technical competence improves together with the academic competence from the learning that integrates the academic and vocational aspects. Atio and Hansen (2002) concluded that the constructivisticism-based learning (project) that integrates the academic and occupational domains will excel in the technical thinking achievement than that of the technical motoric competence.
5. CONCLUSION AND IMPLICATION
5.1 Conclusion The product of Learning Management System (LMS)-based entrepreneurship learning model is good. It means that product of LMS-based entrepreneurship learning model is valid to use in the learning process of entrepreneurship lesson at State Polytechnic of Malang

ISSN 2302-786X
Proceeding of Annual South East Asian International Seminar (ASAIS) 2013 119
5.2 Implication Based on findings, the researcher suggests several recommendations so that the implementation of Learning Management System (LMS)-based entrepreneurship learning model may achieve optimum results, which are (1) teachers who are teaching lesson of entrepreneurship should be given provision about Learning Management System (LMS)-based entrepreneurship learning model, (2) For further development, this entrepreneurship learning model can be in the form of e-book based on internet and to validate this entrepreneurship learning model, it can be applied in other lessons.
6. DAFTAR PUSTAKA [1] Adri, Muhammad, 2008,
Pengembangan Model Belajar Jarak Jauh FT UNP dengan P4TK Medan dalam Rangka Perluasan Kesempatan Belajar, Komunitas e-learning Ilmu Komputer.com
[2] Anwas, Oons, 2003, Definition of Educaional Technology, Association for Educational Adcroft,
[3] Andy; Willis, Robert & Dhaliwal, 2004, Missing Point? Management Education and EntrepreneurShip, Management Decision, Vol. 42, No. 34, pp. 521 – 530.
[4] Aji, Deddy Kusbianto Purwoko, 2007, Analisa Kesiapan Adopsi Pembelajaran Elekronik di Politeknik Negeri Malang, Politeknik Negeri Malang.
[5] Ary, D., Lucy C.J. & Asghar R., 2002, Introduction to Research in Education, Belmont Wadsworth
Thomson Learning.Communication and Technology, Washington, D.C.
[6] Anderson, T. (1996) What in the world is Constructivism.Learning.March/April, p.48-51
[7] Burke, John, W,. 1995. Competency Based Educational and Training. New York: The Palmer Prest.
[8] Cronbach, Lee. J., 1980, Essential of Psychological Testing, New York: Harper & Row Publisher
[9] Dick, W, L. Carey & J.O. Carey, 2001, The Systematic Design of Instruction, 5th edition, New York: Harper Collin Publisher.
[10] Hadi, Soetrisno, 2001, Statistik, Jilid 2, Andi Ofset, Yogyakarta
[11] Harmanto, 2002, Pengembangan Pembelajaran Mata Kuliah Metodologi penelitian dengan Word Wide WEB di STIKOM Surabaya, Tesis, Program Pascasarjana Universitas Negeri Malang.
[12] Hidayat, W., dan Fauzie, D., 2003, Pengalaman Menyelenggarakan School of Internet (SDI): Makalah dalam Workshop E-Learning di Perguruan Tinggi, ITB, Bandung
[13] Nuraini, Nuning, 2003, Modul Multi Media Sebagai Salah Satu Sarana Peningkatan Motivasi Mahasiswa dalam Mempelajari Kalkulus, Makalah Seminar e-Learning, ITB Bandung.
[14] Maskan, Mohammad, 2009, Pengembangan Model Pembelajaran Kewirausahaan untuk Meningkatkan Sikap dan Kompetensi Wirausaha pada

ISSN 2302-786X
120 Proceeding of Annual South East Asian International Seminar (ASAIS) 2013
Siswa SMK di Kota Malang, Disertasi, Program Doktor Pendidikan Ekonomi, Universitas Negeri Malang.
[15] Maskan, Mohammad & Utomo, Heru, Pengembangan Model Pembelajaran E-Commerce Berbasis Internat dan Intranet di Jurusan Administrasi Niaga Politeknik Negeri Malang, 2009, Penelitian Hibah Bersaing, DP2M Dikti, Jakarta.
[16] Maskan, Mohammad, Hadi, Musthofa & Aji, Dedi Purwoko, Pengembangan Model Pembelajaran Pemasaran Internasional Berbasis Web Modular Berbantuan Intarnat dan Internet di Jurusan Administrasi Niaga Politeknik Negeri Malang, 2010, Penelitian Hibah Bersaing, DP2M Dikti, Jakarta.
[17] Oetomo, Budi S. Dharma, 2002, e-Education: Konsep, Teknologi dan Aplikasi Internet Pendidikan, Andi Ofset, Yogyakarta
[18] Patmanthara, Syaad, 2004, Pembelajaran Berbantuan Komputer Sebagai Manfaat Media Pembelajaran, Jurnal Teknologi Elektro dan Kejuruan, Oktober, 2004
[19] Pancariana, Firman, 2005, Pengembangan Bahan Ajar Tekstual dan Digital pada Pembelajaran Aplikasi Komputer di Perguruan Tinggi, Tesis, Program Pascasarjana Universitas Negeri Malang.
[20] Pavlik, John V., 1996, New Media Technology: Culture and Commercial Perspectives, Singapore: Ally and Bacon
[21] Pramono, Y.G. Harto, 2002, Pengembangan Pembelajaran Berbantuan Komputer dalam
Pokok Bahasan Present Tense Mata Kuliah Bahasa Inggris Program Studi Bahasa Inggris FKIP Katolik Widya Mandala Surabaya, Tesis, Program Pascasarjana Universitas Negeri Malang.
[22] Purbo, Onno W., 2002, Teknologi e-Learning Berbasis PHP dan MySQL: Merencanakan dan Mengimplementasikan Sistem e-Learning, Jakarta: Gramedia.
[23] Raharjo, Budi, 2001, Pergolakan Informasi di Indonesia akan Siaran?, Artikel Majalah Tempo, Jakarta: November 2001.
[24] Saepudin, Asep, 2003, Penerapan Teknologi Informasi dalam Pendidikan Masyarakat, Journal Tekno, Pustekom.
[25] Soekartawi, 2003, Prinsip Dasar E-Learning: Teori dan Aplikasinya di Indonesia, Jurnal Teknodik, Oktober 2003
[26] Siswandari, 2006, Peningkatan Transferable Skills Mahamahamahasiswa Pendidikan Ekonomi Melalui Pengembangan Model Pembelajaran Statistika Berbantuan Komputer, Disertasi, Program Pascasarjana Universitas Negeri Malang.
[27] Soekartawi, Soehardjono, Hartono dan Ansyarullah, 1999, Meningkatkan Instructional Design untuk Meningkatkan Kualitas Belajar-Mengajar, Grafindo Persada, Jakarta
[28] Syakur, Abdus, 2006, Pengembangan Bahan Ajar Digital Mata Kuliah Aplikasi Komputer di STAIN Pamekasan, Tesis, Program Pascasarjana Universitas Negeri Malang.
[29] Zahorik, John A. 1995. Constructivist Teaching,

ISSN 2302-786X
Proceeding of Annual South East Asian International Seminar (ASAIS) 2013 121
Bloomington, Indiana: Phi Delta Kappa Educational Foundation.
[30] Zuriah, Nurul, 2006, Metode Penelitian Sosial dan Pendidikan;
Teori – Aplikasi, Bumi Aksara, Jakarta

ISSN 2302-786X
122 Proceeding of Annual South East Asian International Seminar (ASAIS) 2013

ISSN 2302-786X
Proceeding of Annual South East Asian International Seminar (ASAIS) 2013 123
Evaluation of The Implementation of Accounting Entity Without
Public Accountability (Sak Etap) and Development of Financial
Statements in Micro, Small and Medium Enterprises (SMEs)
Nedsal Sixpria
1, Titi Suhartati
2 and Sabar Warsini
3
1,2,3 Politeknik Negeri Jakarta
Depok 16425
email :[email protected], [email protected], [email protected]
Abstract
The implementation of the accounting process to produce financial statements is still difficult
activitiyfor SMEs. This is due to the limited knowledge of accounting and various obstacles in
preparing financial statements according to standards for SMEs (SAK ETAP). This study aims to:
reveal the perceptions of SMEs regarding accounting and financial reporting processes; describe
the application of SAK ETAP on SMEs; reveal of obstacles in the implementation of SAK ETAP on
SMEs. This study used a qualitative approach to the object of study of SMEs in Depok and
surrounding areas. This research used primary data with survey method through questionnaires and
interviews with the respondents. Results related to the perception of urgency regarding the existence
of the financial statements indicates that SMEs do not need accounting information and stated
difficulty to perform the accounting records with many limitations. In addition, the requirement in
the implementation of the accounting records are considered a waste of time and expense. All
respondents havebecame a participant of training about simple bookkeeping and preparation of
financial statements. They recognized the importance of the accounting process and the preparation
of financial statements in supporting the sustainability of the company, but have not applied it in
accordance with SAK ETAP due to various limitations, such as: the limitations of SMEs managers
regarding accounting knowledge, the number of managers of SMEs, also the amount of capital and
assets are still limited. The conclusion of this research is SMEs in the area of Depok do not perform
the appropriate accounting standards and accounting information has not used optimally in the
business.
Key words: accounting process, financial statements, SMEs
1. INTRODUCTION
Micro, Small and Medium Enterprises
(SMEs) has been shown to have a role
and contribute to the Indonesian
economic. According to the Ministry
of Cooperatives and Small and
Medium Enterprises , in 2009 listed
the contribution of SMEs to GDP
Indonesia account for about 45 % or
equivalent to Rp 2,000 trillion, while
for the year 2010 is estimated to
SMEs able to contribute even more to
the GDP of Indonesia which is about
Rp 3,000 trillion (www.depkop.go.id
). In 2010 the number of SME units in
Indonesia reached 52.2 million units
scattered businesses throughout
Indonesia.
Basically SMEs possess a great
opportunity to earn extra credit for
capitalize. Until now many financing
programs for SMEs either run by the
government and by banking. One of
the Indonesian government programs
related to financing of SMEs is the
People's Business Credit (KUR). The
purpose of the KUR is to be effective
capital financing solutions for SMEs,
because for many SMEs are
constrained to access to bank
financing is to obtain assistance (Basri
& Nugroho, 2009). But in practice,
the realization is far from the only
target because banks are designated as
KUR still are too cautious in lending,
because they do not have access to
adequate information regarding the
condition of SMEs. The majority of
SME entrepreneurs are not able to
provide accounting information
regarding the condition of its business

ISSN 2302-786X
124 Proceeding of Annual South East Asian International Seminar (ASAIS) 2013
so as to make the information be more
expensive for banks (Baas and
Schrooten, 2006).
Suhairi (2004) argues that the
weakness of SMEs in the preparation
of the financial statements, among
others, due to lack of education and
lack of knowledge in the Financial
Accounting Standards (GAAP).
While, Satyo (2005 ) argues that the
lack of preparation of the financial
statements due to the absence of
regulations requiring the preparation
of financial statements for SMEs .
Financial accounting standards are
used as guidelines in the preparation
of financial statements should be
applied consistently.
Related to the above conditions, the
Financial Accounting Standards
Board (DSAK) in 2009 has adopted
Accounting Standards for Entities
without Public Accountability (SAK
ETAP). SAK ETAP effective per
January 1, 2011 but before the
effective date the application is
allowed. The use of SAK ETAP is
intended for entities without public
accountability that is the entity that, 1)
not having a significant public
accountability, and 2) The entity that
issued the general purpose financial
statements for external users. SAK
Entities without Public Accountability
is one of the Accounting Standards
which its use is intended for business
entities that do not have public
accountability, such entity micro,
small and medium enterprises
(SMEs).
In general SAK ETAP is more easily
understood and not as complex as
GAAP. Expected future SMEs are
able to do bookkeeping accounting to
present a more informative financial
statements with the purpose of course
makes it easy for investors and
creditors to provide financial
assistance to the SME entrepreneurs.
The implementation of accounting
process to produce financial
statements is still difficult for SMEs.
Limited knowledge of accounting
books, the complexity of the
accounting process, and the
assumption that the financial
statements is not important for SMEs
(Teak et al, 2009). A wide variety of
other constraints faced by SMEs
ranging from educational
backgrounds that do not know about
accounting or bookkeeping, lack of
discipline and diligence in the
implementation of accounting books,
to the lack of sufficient funds to hire
an accountant or purchasing
accounting software to facilitate the
implementation of accounting books
Thus there needs to be an easy to
understand guide SAK - ETAP and
the preparation of financial
statements. Based on this, the problem
of this research is how forms guide
the preparation of financial statements
in accordance with generally accepted
standards that are easily understood
and implemented by the SME
entrepreneurs to produce financial
information that is useful to
stakeholders.
From the background appear that the
understanding of the SME
entrepreneurs to the accounting
process and the preparation of
financial statements is still very
limited, so the purpose of this study is
about : (1) the perceptions of SMEs
Depok regarding accounting and
financial reporting process; (2)
describe the application of Financial
Accounting Standards Without
Accountability for Public Entities (
SAK - ETAP ) in Depok SMEs; (3)
reveals the constraints faced in the

ISSN 2302-786X
Proceeding of Annual South East Asian International Seminar (ASAIS) 2013 125
application of Financial Accounting
Standards for Entities Without Public
Accountability (SAK - ETAP) in
Depok SMEs
2. THEORY
2.1 SAK ETAP
Entities Financial Accounting
Standards Without Public
Accountability (SAK ETAP) is
one of the Accounting Standard
use is intended for business
entities that do not have public
accountability, such entity
micro, small and medium
enterprises (SMEs). Financial
Accounting Standards Board
(DSAK) in 2009 have endorsed
SAK ETAP. The SAK ETAP
effective per January 1, 2011
but before the effective date the
application is allowed (IAI,
2009).
SAK ETAP aims to be able to
accommodate the needs of
entities that do not have public
accountability significantly. In
addition, to help make
accounting standards that can be
used by SMEs because it is
more concise and easier to use
compared with GAAP General.
A main feature of the
implementation of SAK ETAP
is a good understanding over the
SAK ETAP by the SMEs.
2.2 SMEs Criteria Table 1.1
Some Restrictions /Criteria for Small and Medium Enterprises
Institution Scale Desription of Criteria
Regulation Law No. 9/1995
SMEs Smalll
• Assets USD 200 million out of land and
buildings
• Annual turnover >Rp1 Billion
• Owned by the Indonesian
• Independent, not affiliated with a medium-
large
• Allow a legal entity, may not
Central Statistics Agency
(Badan Pusat Statistik/BPS)
Micro Workers <5 persons including unpaid family
labor
Small Workers 5-19 person
Medium Workers 20-99 person
State Minister for
Cooperatives and SMEs
(Menneg Koperasi & PKM)
Small (UU No.
9/1995)
Asset Rp 200 millionexcluded of land and
buildings
Annual revenue Rp 1 Billion
Medium Asset Rp 200 million – Rp 10 billion
Source: http://www.menlh.go.id/usaha-kecil/top/kriteria.htm.2010
3. METHODOLOGY
The study was conducted with the
basic approach of qualitative research.
Research using primary data by
conducting a survey of SME
entrepreneurs in the area of Depok
registered with the Ministry of
Cooperatives period 2010-2012 and is
a member of the DPC IWAPI Depok.
Obtained a sample of 30 SMEs Depok
and surrounding region. Data
collection techniques used were
interviews, questionnaires and
documentation. The attached
questionnaire is the development of a
questionnaire Rudiantoro & Siregar
(2011).
This study focused on the preparation
of the manual accounting by SAK
ETAP for SMEs, through stages:
identifying SMEs that will be the
object of research through agencies,
ISSN 2302-786X
126 Proceeding of Annual South East Asian International Seminar (ASAIS) 2013
formulate and test research
instruments, collecting data through
interviews with respondents,
verification and processing research
data, analyze data and concluded,
compiling reports and outcomes
research.
4. ANALYSIS AND
DISCUSSION
The results obtained data collection of
information related to the description
of the respondents as follows : field of
SME by 67 % engaged in
manufacturing, trading at 23 %, and
10% in services. General manager of
SME SMA and minimal formal
education equivalent, with a
composition of 50% graduate high
school / equivalent, graduated by 40
%, and 10 % of post-graduate
education .
The average age of the establishment
of SMEs is above 10 years, with 50 %
of the management status of a legal
entity CV/Firm, by 30 % in the form
of individual, and only 20%
incorporated limited liability company
(PT). About 65 % of respondents
have separate financial records related
to the business activities of private
activities. The financial records were
made in the form; recording sales and
purchases of goods/raw materials
(100 %); expenditures or operating
expenses that are cash (100 %) ; make
a profit and loss and balance sheet (50
%). Also business record still
combined with personal activities (35
%).
All respondents havejoined training
for simple bookkeeping and
preparation of financial statements.
Respondents recognized the
importance of the accounting process
and the preparation of financial
statements in support of corporate
sustainability, because business
owners do not know exactly the
benefits of each period of exercise of
the business so that the business plan
can not be made with certainty, it is
agree with Rachmawati (2008).
Although SME entrepreneurs realize
the importance of the preparation of
the financial statements, but in
general have not been carried out
consistently, with a variety of reasons.
Perceptions of SME entrepreneurs in
Depok and surrounding areas on the
urgency of the existence of the
financial statements:
a. SME entrepreneurs feel no need
accounting information and stated
that it is difficult to perform the
accounting records with all
limitations. This is consistent with
previous studies (Idrus, 2000;
Pinasti, 2001; 2007) .
b. The need for the implementation
of the accounting records are
considered wasting time and
expenses. SME entrepreneurs find
it difficult and troublesome
organized accounting records and
assume that the most important
thing is how to generate as much
profit as possible from the
business carried on without being
burdened with the problem of
bookkeeping/accounting,
consistent withIdrus (2000) and
Pinasti (2001). The results of this
study suggest that the SMEs
consider that the rewards of the
accounting information generated
is less than the cost of which
should be sacrificed when
properly organized accounting
practices.
Generally, respondents in particular
SMEs in the area of Depok not hold
the appropriate accounting standards
and the use of accounting information

ISSN 2302-786X
Proceeding of Annual South East Asian International Seminar (ASAIS) 2013 127
in the management of its business to
its full potential. This is consistent
with results of previous studies
(Rochmat, 2003; Fansuri, 2006;
Firdaus, 2010 ; Hubeis, 2012). Low
implementation and using of
accounting information in the
management of SMEs is caused by
several factors, including the
perception of the urgency of the
existence of accounting information
for SMEs, accounting knowledge
owner/staff of SMEs, the cost -
benefit considerations for SMEs and
SMEs size (Furqan and Karim, 2012)
.
The results from interviews and
questionnaires shows that there are
several problems that are often faced
by SME entrepreneurs related to
several areas, namely: (1)
Management/HR, associated with low
education levels, low motivation,
mastery of technology, (2)
Production, covering from raw
materials, production processes, as
well as output, (3)Marketing, include
limited market, and widespread
distribution of the target market, (4)
Finance, relating to capital
constraints, it is difficult to find
additional capital and also limitations
in accounting /finance administration,
consistent with Nursetto (2004).
Issues related to finance and
accounting, the SME entrepreneurs in
general they do not control and are
not practicing adequate financial
systems. In general, small businesses
do not have the knowledge and ability
to manage accounting records in strict
and disciplined with regular
bookkeeping, either in the form of
daily, weekly, monthly, and so on.
Many of them do not understand the
importance of recording and
accounting for business continuity.
Agree with Meutia (2010) that highly
influence the entrepreneurial
competencies and entrepreneurial
behavior in the act, in which the
overall results of these studies
indicate that there is a significant
relationship between competence and
knowledge of accounting staff of
SMEs to use accounting information.
It can be stated that there is an
optimal implementation of accounting
practices in SMEs during most of this
is because knowledge of both the
owner and staff accounting finance /
accounting SMEs is still not adequate
( Furqan and Karim , 2012 ) .
Data showed that the differences in
the application of accounting views of
the company turnover category. These
results are consistent with Wahyudi
(2009 ) which states that the turnover
of the company affect the application
of accounting. Implementation of
accounting practices in SMEs affected
by the turnover of the company due to
the higher turnover of the company
means that increasingly complex
financial management should be done
by the company. Therefore,
companies need a system that can
help ease the financial management of
the company, and therefore
companies apply accounting.
Meanwhile, companies that have
small turnover do not apply it because
they dont need accounting to perform
financial management with detailed,
just only manual calculation. For
small SMEs with a small turnover,
implemetation of accounting is
complicated and time-consuming.
These results support the Rudiantoro
and Siregar (2011) showed that the
size of the business has a positive
effect on the perception of the SME
entrepreneurs of the importance of
financial accounting and reporting for
their business, so that when the size of
the business is growing, SMEs began

ISSN 2302-786X
128 Proceeding of Annual South East Asian International Seminar (ASAIS) 2013
to take seriously the needs of the
financial statement. The owners start
to thinking about the importance of
accounting and financial reporting to
assist in asset management and
assessment of financial performance.
It can be stated that the
implementation of accounting
practices in majority of SMEs is not
optimalized because the number of
SMEs in Indonesia is still dominated
by the Micro and Small Enterprises,
which types of business groups more
manageable individually.
5. CONCLUSION
Based on the research results related
to accounting practices in SMEs, it
can take several conclusions,
including :
a. The perceptions of SME
entrepreneurs in Depok and
surrounding areas on the urgency
of the existence of the financial
statements: SMEs entrepreneurs
feel no need accounting
information and stated that it is
difficult to perform the
accounting records with any
limitations; the implementation of
the accounting records are
considered a waste of time and
expense. SMEs entrepreneurs
find it difficult and troublesome
organized accounting records and
assume that the most important
thing is how to generate as much
profit as possible.
b. Accounting practices in SMEs
refers to SAK ETAP has not been
implemented due to, lack of
knowledge of accounting MSME
entrepreneurs that do not practice
adequate accounting process .
c. The implementation of
accounting practices and use of
accounting information that is not
optimal for SMEs this is not
solely the fault of the
SMEsentrepreneurs, but also due
to non optimal participation of
government and society in
encouraging and facilitating the
accounting practices in SMEs.
d. In particular the implementation
of accounting practices for SMEs
in Depok and surrounding areas
still have the same problem with
some parts of Indonesia so that
solutions and approaches to
improve the accountability of
SMEs should be arranged in a
systematic and easily understood
by SMEsentrepreneurs.
6. BIBLIOGRAPHY
[1] Abubakar Arif., dan Wibowo.
2005. Akuntansi untuk Bisnis
Usaha Kecil dan Menengah. PT
Grasindo : Jakarta.
[2] Baas, Timo dan Schrooten,
Mechthild. 2006. Relationship
Banking and SMEs: A
Theoretical Analysis. Small
Business Economic Vol 27.
[3] Basri, Yuswar Zainul dan
Nugroho, Mahendro. 2009.
Ekonomi Kerakyatan: Usaha
Mikro, Kecil, dan Menengah.
Jakarta: Penerbit Universitas
Trisakti Bank Mandiri.
[4] Cziráky, Tiśma, dan Pisarović.
2005. Determinant of Low
Approval Rate in Croatia. Small
Business Economic, Vol 25.
[5] Ikatan Akuntan Indonesia. 2009.
Standar Akuntansi Keuangan
Entitas Tanpa Akuntabilitas
Publik (SAK-ETAP). Penerbit
Salemba Empat: Jakarta.
[6] Jati, Hironnymus, Bala, Beatus,
dan Otnil Nisnoni. 2009.
Menumbuhkan Kebiasaan Usaha
Kecil Menyusun Laporan
Keuangan. Jurnal Bisnis dan
Usahawan, II No. 8, 210- 218.

ISSN 2302-786X
Proceeding of Annual South East Asian International Seminar (ASAIS) 2013 129
[7] Meutia. 2010. Meningkatkan
Daya Saing Usaha Kecil
Menengah Melalui Kompetensi
Kewirausahaan dan Modal
Sosial, (Sebuah Kajian Teoritis).
Jurnal Ilmiah Ekonomi
Tirtayasa Ekonomi. Vol. 5 (2).
Hal. 167-174.
[8] Misra, Fauzan. 2008. Investigasi
Dan Analisis Empiris Praktik
Akuntansi Keuangan Pemerintah
Daerah (Studi Pada Kabupaten
dan Kota di Propinsi Daerah
Istimewa Yogyakarta dan Jawa
Tengah). Tesis Program
Pascasarjana Universitas
Gadjah Mada. Jogyakarta. Tidak
Dipublikasikan.
[9] Mohan, Isaac. 2006. Financial
Record-Keeping as a Tool for
Small Business Success: A Case
Study of Free State Province,
South Africa.
[10] Murniati. 2002. Analisis Faktor-
Faktor yang Mempengaruhi
Penyiapan dan Penggunaan
Informasi Akuntansi pada
Pengusaha Kecil dan Menengah
di Jawa Tengah. Tesis,
Semarang: Universitas
Diponegoro. Pinasti, M. 2001.
Penggunaan Informasi
Akuntansi dalam Pengelolaan
Usaha Para Pedagang Kecil di
Pasar Tradisional Kabupaten
Banyumas. Jurnal Ekonomi,
Bisnis, dan Akuntansi, No 1 Vol
3.
[11] _____. 2007. Pengaruh
Penyelenggaraan dan
Penggunaan Informasi
Akuntansi Terhadap Persepsi
Pengusaha Kecil atas Informasi
Akuntansi: Suatu Riset
Eksperimen. Jurnal Riset
Akuntansi Indonesia. Vol. 10
(3). Hal. 321-331.
[12] Presiden Republik Indonesia.
2008. Undang-Undang Republik
Indonesia Nomor 20 Tahun 2008
Tentang Usaha Mikro, Kecil dan
Menengah.
[13] Raharjo, M. D., & Ali, F. 1993.
Faktor-faktor keuangan yang
mempengaruhi usaha kecil dan
menengah di Indonesia, Dalam
K. James & N. Akrasanee,
Aspek-aspek finansial usaha
kecil dan menengah; Studi kasus
Asean, (pp. 16-50). Jakarta:
LP3ES.
[14] Rakyat Merdeka Online. 2011.
Syarif Hasan: Jumlah Koperasi
dan UMKM Terus Meningkat.
diakses tanggal 16 April 2012.
[15] Rudiantoro, Rizki dan Siregar,
Sylvia Veronica, 2011, Kualitas
Laporan Keuangan UMKM
Serta Prospek Implementasi
SAK ETAP, Simposium
Nasional Akuntansi XI,
Universitas Syiah Kuala, Banda
Aceh.
[16] Satyo, 2005. UKM dan
Kebutuhan Standar, Media
Akuntansi, 43(XII), 4.
[17] Suhairi dan Wahdini, 2006,
Persepsi Akuntan Terhadap
Overload Standar Akuntansi
Keuangan (SAK) Bagi Usaha
Kecil Dan Menengah, Makalah
yang disampaikan pada SNA IX-
Padang.
[18] Suhairi, 2004, Personality,
Accounting Knowledge,
Accounting Information Usage
and Performance: A Research 0n
Entrepreneurship of
Indonesia Medium Industries,
Disertasi, USM, Malaysia.
[19] Sujoko Efferin., dan Bonnie
Soeherman. 2005. “Analisis
Empiris Tentang Peran
Akuntansi Manajemen dalam

ISSN 2302-786X
130 Proceeding of Annual South East Asian International Seminar (ASAIS) 2013
Perencanaan dan Pengendalian
UKM”, Jurnal Akuntansi dan
Teknologi Informasi, Vol. 4, No.
2: 71-91.
[20] Undang-Undang No. 9 tahun
1995 Tentang Usaha Kecil,
Departemen Koperasi dan
Pembinaan Pengusaha Kecil,
1995/1996.
[21] Warsono, Sony dan Murti,
Endra. 2010. Akuntansi UMKM
Ternyata Mudah Dipahami dan
Dipraktikkan. Yogyakarta.
[22] www.bi.go.id
[23] www.depkop.go.id
[24] www.ekonomirakyat.org/edisi_2
0/artikel_7.ht
[25] www.menlh.go.id/usahkecil/top/
kriteria.ht2/201

ISSN 2302-786X
Proceeding of Annual South East Asian International Seminar (ASAIS) 2013 131
Theutilization of Indonesian Hedges as Politeness Strategy Spoken by Academician in University of Indonesia: A Case Study of
Pragmatics
Yogi Widiawati1 State Polytechnics of Jakarta1
English Lecturer at Electrical and Electronics Engineering Department [email protected]
Abstrak
This research is aimed to find kinds ofhedges mostly spoken by Indonesian, especially in University of Indonesia. They use hedges as language variation. They use them in their everyday life, both formal and informal situation. This research is conducted in formal situation. It means that hedges used in classroom settings where the speakers are lecturers and the hearers are students and Indonesian language is used as the medium of communication. Commonly they use hedges for showing politeness and some use habitually. The words, such as:“tolong”, “maaf”, are often used to mitigate the propositions or even to soften the force. The word “maaf” which means “sorry” does not mean the speaker really does the mistakes. The result of the research shows that the kind of hedges which is mostly used is “menurutsaya” (in English: according to my opinion). This has the highest occurences and the second is “saya rasa/sayapikir” (I think). Other hedges are “kira-kira/sekitar” (about), “cukup” (enough), “agak” (rather) and “maaf”(sorry) to show the lack of information but in polite way. Keywords: Indonesian hedges, language variation, politeness
1. INTRODUCTION In this paper, I will discuss one particular linguistic element which is very crucial, but sometimes forgotten by speakers of any languages. This particular element is hedging device. Hedging devices are words that are used - usually automatically and unconsciously spoken - by Indonesian to prevent from being blamed or false or sometimes to mitigate the propositions. These words are mostly spoken both in formal and informal environment.
When people do the communication, they don’t just talk but this activity brings two tasks. The two tasks are (1) to exchange information and (2) to convey interpersonal messages. Hedging is one of the ways to convey the interpersonal messages. Hedging is not only the communicative strategy to mitigate, for example, the propositions (Nikula, 1997), but also
to show politeness (Brown and Levinson, 1987).
Most Indonesians like to hedge themselves. There are some reasons why they like to do these. The reasons are (1) Indonesians are trying to make their mistakes being unseenfor something that they are not really sure, (2) they want the hearers unoffended for the hard statement used by the speakers, (3) They like to mitigate the force of the statement, (4) they respect the hearers, (5) They find difficulties to refuse and object to something that they do not like and (6) hedging activities now are becoming language variations in daily conversations.
The above-mentioned reasons are commonly employed by people in Indonesia in order to respect others. Since they are face-conscious, they often hedge their propositions. By doing so, speaker tries to do

ISSN 2302-786X
132 Proceeding of Annual South East Asian International Seminar (ASAIS) 2013
politeness and to be considerate conversational partner in order to achieve the goal of communication.
2. THEORETICAL BACKGROUND
2.1 Hedges Hedging devices are not popular enough among Indonesian learners who learn English as a foreign language. Commonly hedges are used to make distances between speakers and hearers (Prince, Frader, Bosk, 1982; Skelton, 1988), or to strengthen illocutionary force (Holmes, 1984), or politeness (Brown and Levinson, 1978,1987). Prince, Frader and Bosk have divided types of hedges clearly into two groups: approximators and shields.Meanwhile Brown and Levinson say that hedges are part of politeness systems in face-to-face communication. They base their theories on four strategies: bald on records, positive politeness, negative politeness and off records. In the direct conversation, these devices are used as mitigation (Brown and Levinson, 1978, 1987) to soften the statements in order to prevent FTA (Face Threatening Act) of hearers. Look at these sentences:
(1) I think he is a sort of generous man
(2)The hermes bag is extremely expensive
(3)I guess harry is coming
(4) I will help you if I am done with my work
(5) The distance between your house and mine is about 45 km
(6) According to the teacher, the students must collect the paper today
The italicized words are hedges which are commonly used in oral communication or face-to-face communication. Those hedges are used to prevent negative face of the speaker. Like sentence no (6), this sentence uses the third person singular (the teacher) to make an order to collect the assignment without losing the speaker’s face if she/he makes wrong instruction.
In making communication, participants should contribute in order to reach the goal wanted. They must follow the four maxims in Cooperative Principles proposed by Grice (1975). The maxims are Quality (be informative, but not over informative), Quantity (be truthful, according to the evidence you have), Relation (be relevant) and Manner (say things clearly, unambiguously, briefly).Yule (1996) calls hedges are cautious notes which mean that the participants of conversation should be “cautious” of what they communicate. Look at these examples:
(7) As far as I know, they are married. I heard that it was a secret ceremony
(8) He couldn’t live without her, I guess

ISSN 2302-786X
Proceeding of Annual South East Asian International Seminar (ASAIS) 2013 133
(9) I may be mistaken, I saw a wedding ring on his finger.
In face-to-face communication and writing communication, hedges are used as unique pragmatic devices. It can be said that these devices are lexical forms which have communicative force that may result strong effects on hearers/readers (Hyland, 1997). The same opinion is put forward by Jiang Hua (2011). She says that the use of hedges appropriately will be strengthening illocutionary acts and may result the intended communication. As pragmatic tools, hedges are able to make the readers’ understanding smoothly and may change their paradigms on something, or even influence thoughts of speakers or readers.
By seeing the functions and the influences that hedges may have, it can be said that hedges may not be underestimated. As Sperber and Wilson (1995) say that speakers must take into account what behind the propositions. Speakers should think about cognitive and conceptual effects of readers. In other words that the stronger the conceptual effects on readers, the more relevant information conveyed by speakers or writers.
2.2 POLITENESS It is traditionally known that Indonesian people are indirect, deferential and sometimes extremely polite - more polite than it should be. They sometimes are difficult to refuse an offer or object something
that they do not like. They find difficulties to say “no” for refusing or objecting to something. They sometimes use gestures and body language to do so in order to “save” someone’s face. Furthermore they use hedging devices to mitigate the refusal. By doing this, the communication will go smoothly.
“deh” is a kind of hedging device which is used as just language variation in Indonesian language. Indonesians are safe and comfortable to use these words when emphasizing or making sure of something, although the answer could be “no” to the question.
The word “menurutsaya” shows that the speaker is trying to say that this opinion comes from her/him, not other person. So there is an objection shown up, he/she is the one who is going to be blamed. Another word of hedging device is “lumayan”. It means that the speaker is trying to avoid insulting the hearer because the speaker might think that the dress either good or bad. He/she is in doubt to state his/her opinion. Other words like “sih” and “lah” are language variation for informal communication in Indonesian language.
When doing the communication, Indonesians do not like making other people embarrassed, shamed or even be criticized in public. This applies to people from other Asian Countries (Kadar and Mills, 2011). They say that people in

ISSN 2302-786X
134 Proceeding of Annual South East Asian International Seminar (ASAIS) 2013
East Asia exhibit politeness, considerate and well-mannered behavior. They also show indirectness and like to make implicit statements.
Indonesians are face-conscious. They do not want to cause other people lose their “face” in public. It is unforgiveable and will be making the relationship broken. Generally in Indonesia there is a tendency to make negative politeness as the norms. According to Brown and Levinson (1978, 1987), hedges are very important to do negative politeness. Hedges are pragmatic markers that attenuate the force of the utterance. Hence negative politeness enables the speaker to go on-record in order to make his/her statement clearer to hearer.
3. METHODOLOGY The methodologies for this research isqualitative and quantitative methods to analyze the findings. Qualitative method is used to classify the categories of the hedges found in the data found. The purpose to use this method is to explore and discover hedges spoken by the respondents (Johnson and Christensen, 2008). The quantitative method is used to measure the frequency of certain kinds of hedges used by the respondents. The data found are noted and put them into categories determined.
4. ANALYSIS AND FINDINGS
4.1 Analysis
As it is stated before that hedges are pragmatic markers that can weaken the strength of utterances which fall in the
negative politeness as postulated in Brown and Levinson’s politeness theory (1987). An FTA is viewed as a violation of the speaker’s privacy and freedom of action, for which hedges are tools for possible compensation.
Hedging devices are dominant devices in terms of expressing negative politeness. Hedges occur as mitigating devices which attenuate the propositional content of the message. Thus the softening the hard proposition can be achieved by employing linguistic and non-linguistic strategies.
As hedges functioned as negatively polite devices, they not only soften the illocutionary force of the utterance but also present the face-preserving principles. Fraser (1996) states that hedges can signal the speaker’s desire to reduce the face loss. Furthermore he categorizes the hedges into:
1. Modal Auxiliary verbs: may, might, can, could, would, must, should.
For example:
There is something I must ask you. It may sound naïve, or even rude, but I just want to know how you manage this department.
2. Modal Lexical Verbs doubting and evaluating rather than merely describing: to seem, to appear, to believe, to assume, to suggest, to estimate, to tend, to think, to argue, to

ISSN 2302-786X
Proceeding of Annual South East Asian International Seminar (ASAIS) 2013 135
indicate, to propose, to speculate.
For example:
I believe that this research will be fruitful
3. Probability adjectives:possible, probable, un/likely
For example:
That is a possible alternative to solve the problem
4. Nouns: assumption, claim, possibility, estimate, suggestion.
For example:
The estimate of the cost is presented by the graph
5. Adverbs: perhaps, possibly, probably, practically, likely, presumably, apparently;
For example:
Perhaps, you would like to go back by car while I am waiting for my son
6. Approximatorsof degree, quantity, frequency and time: approximately, roughly, about, often, occasionally, generally, usually, somewhat, somehow, a lot of
For example:
The distance from my office to the airport is about 30 km
7. Introductory phrases: to our knowledge, it is our view that, we feel that.
For example:
We feel that the solution to the problem does not sound good
8. “if” clauses: if true, if anything
For example:
You could work for me if you like
9. Compound hedges: seems reasonable, looks probable.
For example:
It seems reasonable for me that the system works very well
But–clauses occur in several types of contexts. Firstly, they contribute to increase agreement. As Leech (1983) says that there is a tendency to exaggerate agreement with other people, and to mitigate disagreement by expressing regret, partial agreement.
The next type of hedging devices are downgraders, such as just, just in case, a bit, a few, a little, rather, etc. these markers are used to minimize the size of imposition that is being made on the hearer. Look at the examples below:
I just want to apologize for the last night
I was justsurprised to see his coming to my apartment

ISSN 2302-786X
136 Proceeding of Annual South East Asian International Seminar (ASAIS) 2013
4.2 Findings After doing the research for a few months, lexical verbs/adjectives and probability are often spoken by Indonesian in making face-to-face communication. Those hedges are menurutsaya/menurutpendapatsaya (according to my opinion), saya rasa (I feel), sayapikir(I think), tampaknya/kelihatannya (it seems), cukup (enough), agak(rather), mungkin/barangkali (perhaps/maybe), and kira-kira/sekitar (about/around) and maaf (sorry/excuse me). Some of examples are written here:
a. Menurutsaya, pendapatAndasangatmenarikdansaya rasa sayasetujudenganAnda (According to me, your opinion is interesting and I think I agree with you);
b. Saya rasa penjelasansayacukupjelas (I think/feel my explanation is clear enough);
c. Kejadianinitampaknyaterjadiakibatketidaktahuanmasyarakatakanhukum yang ada (it seems that this incidenthappenedbecausethey are lack of knowledge of law);
d. Bu, maafsayamau Tanya lagimengenaimasalah yang tadi (Mam, excuse me I want to clarify about this problem).
Based on the table above, we can see that Indonesian hedges mostly used are
menurutpendapatsaya which holds 28 percent andmungkin/barangkali 24 percent.They indicate that the speakers have doubts to prove their propositions or claims. This is kind of strategy to prevent of being blamed or false. In other words, it can be said that it is a kind of avoidance strategy to minimize conflict. This kind of hedge device is also used to soften the criticism if the interlocutor has argument on it.
Other hedges, like cukup(enough/sufficient) which holds 13 percent and kira-kira/sekitar (about) which holds 9 percent are used by speakers because they have lack of information, so they use such hedges to avoid of being blamed if their propositions are found wrong or untrue.Kira-kira is sometimes used for showing the distance or length of something, like in a sentence: “presentasiinikira-kiraakanberlangsungselama 10 menit” (this presentation will take about 10 minutes).
Surprisingly, formal language is often combined with informal language, although the setting is conducted in the classroom. The words like “gitu” the short from “begitu” (If so..), “baiklah” (well) and “gaapa-apa” (it does not matter) mostly occur automatically during the conversation. Look at the example:
Kalaugitu, topic iniakankitalanjutkanminggudepan

ISSN 2302-786X
Proceeding of Annual South East Asian International Seminar (ASAIS) 2013 137
If so, topic will be continued by us next week
Other words like “…hmm..” and “….kan..” are language variations that informally spoken by speakers which do not carry meaning. However, the word “..kan..” is employed for emphasizing the previous proposition which has been mentioned before the utterance process happens. It presents in the example below:
Saya kan sudah pernah katakana bahwa masalah ini bias diselesaikan dengan baik
I already stated that this problem was able to be solved well
The word “kan” here neither carry the meaning for the proposition nor change the message if the word is eliminated. This can be categorized as hedging device as it tries to hedge the proposition from being false. Other words like “gaapa-apa” or “gitu” are commonly used in big cities, such as Jakarta, the capital city. This style then influences other cities and makes it popular as slang words.
5. CONCLUSION Indonesian hedges are used as communicative strategy. They are crucial strategy in order to save speaker’s face or minimize threats to interlocutors. These are also something to do with the culture that inherits in Indonesian people as culture is as part as their life. They learn this culture which teaches them to respect others, do something
politely and always follow norms applied in community.
In other words, hedges are now becoming part of everyday life or habits. They are unconsciously spoken by speakers to show respect, deference and mitigate the criticism or force. These are done to achieve the objective of communication by employing hedges.
This finding will be more interesting if we compare slang words used as hedges with slang words used in other regions scattered in Indonesia, since there about 740 local languages used.
6. REFERENCES [1] Adolphs, Svenja., O’Keeffe,
Anne., and Clancy, Brian. 2011. Introducing Pragmatic in Use. UK: Routledge
[2] Blum-Kulka, Shosana.1987.“Indirectness and Politeness in Requests: Same or Different?” Journal of Pragmatics 11//2:131-146
[3] Brown, Penelope and Steven C. Levinson, 1987.Universals in Language Usage. Cambridge: Cambridge University Press.
[4] Channell, Joanna. 1994. Vague Language. Oxford: Oxford University Press.
[5] Cherry, Roger D. 1988.Politeness in Written Persuasion. Journal of Pragmatics 12/1:63-81
[6] Fraser, Bruce, 1975. Hedged Performative. In Peter Cole and Jerry L. Morgan (eds), Syntax and Semantics 3: Speech Acts. New York: Academy Press: 187-210
[7] _________ ,1980. Conversational Mitigation.

ISSN 2302-786X
138 Proceeding of Annual South East Asian International Seminar (ASAIS) 2013
Journal of Pragmatics 4/4: 341-350.
[8] _________ , 1990. Perspective in Politeness. Journal of Pragmatics 14/2: 219-239.
[9] Holmes, Janet. 1984a. Modifying Ilocutionary Force. Journal of Pragmatics 8/3: 345-365
[10] __________ , 1984b. “Hedging Your Bets and Sitting on the Fence: Some Evidence for Hedges as Support structure” The Relo 24/3: 47-62
[11] Hubbler, Axel. 1983. Understatement and Hedges in English. Amsterdam: John Benjamins Publishing Company.
[12] Hyland, Ken. 1996a. Talking to the Academy: Forms of Hedging in Scientific Research Articles. Written Communication 13/2: 251-281.
[13] ________ , 1996b. “Writing without Conviction? Hedging in Science Research Articles” Applied Linguistics 17/4: 433-454.
[14] Johnson, B. and Christensen, L. (2008).Educational Research:Qualitative, Quantitative and Mixed Approaches. Thousand Oaks, CA: Sage Publication.
[15] Lakoff, George. 1972. The Pragmatics of Modality. Chicago Linguistics Papers 8: 229-246.
[16] __________ , 1973. The Logic of Politeness: or, Minding Your p’s and q’s. Papers from
Regional Meeting of the Chicago Linguistics Society 9.
[17] Leech, Geoffrey N. 1983. Principles of Pragmatics. London: Longman.
[18] Lyons, John. 1995. Linguistic Semantics: An Introductions. London: Longman
[19] Maryanto. 1998. Hedging Devices in English and Indonesian Scientific Writings: Towards A Sociopragmatic Study. Thesis. Jakarta: Atmajaya University
[20] Nikula, T. 1997. Interlanguage View on Hedging.InMarkannenR.andH.Schoder (eds). Hedging and Discourse: Approaches to the analysis of a Pragmatic Phenomenon in Academic Texts. Berlin: Walter de Gruyter. 188-207
[21] Skelton, John. 1988. The Care and Maintenance of Hedges. English Language TeachingJournal 42/1:37-48.
[22] Sperber, Dan and Wilson, Deirdre. 1995. Relevance: Communication and Cognition (2nd edition). Blackwell: Oxford.
[23] Prince, Ellen F., Joel Frader, and Charles Bosk.1982.On Hedging in PhysicianDiscourse.Proceeding of the Second Annual Symposium on Language Studies: 83-96.
[24] Thomas, Jenny A. 1983. Cross-Cultural Pragmatic Failure.Applied Linguistics. 4/2: 91-112.

ISSN 2302-786X
Proceeding of Annual South East Asian International Seminar (ASAIS) 2013 139
The Development of Enterpreneurship for
Illegal Migrant Workers in Indonesia
Lenny Brida
State Polytechnics of Jakarta
Abstract
The movement of migrant workers from Indonesia to the other countries becomes one of the human
resource problem faced by Indonesia, because many of them were sent abroad illegally by labor
exporters. Every week hundreds of workers are deported from Malaysia, Saudi Arabia and another
country through Tj Pinang, Batam and Tj Priok Debarkation.
The biggest number of deported workes were from Malaysia. Among 3.5 million migrant workers in
Malaysia, there are 1.5 million legal foreign workers and 2 million are illegal, mostly come from
Indonesia as the neighbour. As illegal migrant workers, they faced many problems, not only their
problem, but also influence our dignity as a nation. Therefore, the aim of this study is to achieve 3
objectives, Firstly; to investigate the types of the problem faced by the deported migrant workers,
secondly; to investigate the process of returning migrant workers from the debarcation to their
hometown, Thirdly; to investigate the enterpreneurship program given to the ex-illegal migrant
workers.
In order to achieve the objectives of this study, the data collection was done through intensive
observation in the debarkation spot (Tj Pinang, Batam, Tj Priok) and held in depth interview to the
illegal migrant worker while they were returned in the three debarkataion. Collecting
enterpreneurship data was done through direct observation and asessment of their business.
Due to the complicated process of collecting data, the process of data analysis was done in sequence
steps of qualitative research process, firstly by analize domain and categorizing the data into group
of data components. Then the data components were visualised and tabulated into matrix and figures
in order to be interpreted easily and looking for deep meaning hidden behind the data.
The findings of this research explained that illegal migrant workers were from 4 countries;
Malaysia, Saudi Arabia (Riyadh & Jeddah), Singapore and Brunai. The type of work they had in the
4 countries; 42% construction labor, 17 % restaurant , 11% domestic worker and servent, 5%
private company, 15% worked in plantation.When the research process, there were 283 people
deported, it was because of illegal document (33%), using short visitor pasports (18%), no
document (15%) illegal Permit (13%) Invalid Pasport (11%) Invalid Visa mati (10%) Missing
Pasport (2%).
The reason why they become illegal workers is due to the limited education and limited job
opportunity in Indonesia and the enterpreneurship program is also very limited in numbers and
budgets.
Key Words : Enterpreneurship, Social Protection, illegal Migrant Workers
1. INTRODUCTION
1.1 The Back Ground
According to UU No.11,2009
about social welfare, Chapter 14
article 1, Indonesia through
Sosial Ministry is responsible to
give social protection, including
giving preventive assistance
from furnarable risk in order to
achieve sustainable life and
fulfill minimum basic needs.
In the implementation of the
regulation, Social Ministry,
(Directorate of Social
Protection, Victims of Violance
and Migran Workers has given
various services, such as :
providing stimulant budget to
empower the community to
develop enterpreneurship
(UEP), to facilitate the process
of the deportation and returning
them into their home town,
provide social services such as
psycho-social theraphy in the

ISSN 2302-786X
140 Proceeding of Annual South East Asian International Seminar (ASAIS) 2013
Protection House and Trauma
Center (RPTC), done by the
central government as well as
the regional government and
NGO.
Since 2004, due to the
increasing numbers of illegal
migrant workers, the Indonesia
government produced Kepres
no 106, 2004 to form
Coordination team of returning
them from Malaysia and the
other country, such as Ministry
of Manpower, Ministry of
Health, Ministry of Social
Affairs, Imigration,
Transportation and
Communication Ministry,
BNP2TKI, local government of
the debarkation location.
The prob;em of deportation and
returning is veri dynamic since
the deportation process happens
every months and many
institutions have to be involved
because the problem can not be
solved only by one institution
but it needs colaboration among
the institutions above.
Therefore, this reserach was
done in order to observe and to
anlyse the real problem, as an
input to the government to find
the solution to the problem
faced. This research also
provides recommendation as
the scientific justification to do
some improvement to the
services of migrant workers
who would like to work in
foreign country. As long as the
government could not provide
the job vacation for them, the
government can not stop them.
One way of solving this
problem, the government
develop enterpreneurship
program to prevent them of
working outside of this country,
This research also would like to
know, how far this program can
answer the need of the society
to live safe and sound.
The objectives of the study
This research is done inorder to
achieve 3 main objectives :
1. to investigate the types of the
problem faced by the
deported migrant workers,
2. to investigate the process of
returning migrant workers
from the debarcation to their
hometown,
3. to investigate the
enterpreneurship program
given to the ex-illegal
migrant workers and the
contribution of this program
to the sustainability of their
economic and social life.
1.2 The Location of the study
The Location of the study was
done in 2 provinces and 3
Debarkations : Batam, Tj
Pinang and Tj. Priok)
Tabel 1.1 Location of the study
No Province Debarkation Aspek yang dispotcheck
1 Kepulauan
Riau
Tj. Pinang The process of Deportation,
Enterpreneurship (UEP)
Batam The process of Deportation,
Enterpreneurship (UEP)
2 DKI
Jakarta
Tanjung Priok The process of returning the illegal
migrant worker to the hometown.

ISSN 2302-786X
Proceeding of Annual South East Asian International Seminar (ASAIS) 2013 141
No Province Debarkation Aspek yang dispotcheck
Jakarta Timur Enterpreneurship Development (UEP)
Jakarta Utara Enterpreneurship Development (UEP)
2. THEORY
2.1 Social Protection
Sosial Protection is an effort to
help people who experienced
social disfunction, in order to
be able to prevent and to
manage social risks faced by
the society ( Social Protection
Guidance, 2011: p. 2). Sosial
protection for the illegal
migrant workers is provided by
the government in the form of
psychososial rehabilitation,
Enterpreneurship program,
Sosial Advocation, and sending
them to their country, etc.
According to UU no 11, 2009
about sosial welfare, the scope
of Sosial Protection consists of
3 aspects; 1) Sosial Assistance
can be in the form of cash
transfer, accessibility of basic
needs services (Health and
Education) and community
institutional reinforcement.
The program is designed to
help the community to face
sosial furnaribility in order to
be able to live normally 2)
Sosial Advocation is provided
in the form of individual and
group awareness towards their
duties and rights, advocation
for the fulfilment of the
community rights. 3) Law
Assistance and consultancy to
protect citizens right who face
law dispute in the courts.
2.2 The Victims of Violance
Domestic violence can happen
in any relationship, regardless
of ethnic group, income level,
religion, education or sexual
orientation. Abuse may occur
between a married people, or
between an unmarried people
living together or in a dating
relationship. It happens in
heterosexual, gay and lesbian
relationships. However,
researchers have found that
some people are more likely to
become the victims of domestic
violence. As the reserach
finding explains that a likely
victim:
Has poor self-image.
Puts up with abusive behavior.
Is economically and emotionally dependent on the
abuser.
Is uncertain of his or her own
needs.
Has low self-esteem.
Has unrealistic belief that he or she can change the abuser.
Feels powerless to stop violence.
Believes that jealousy is
proof of love.
While abuse can happen to
anyone, women are by far the
most frequent victims and men
are the most frequent abusers.
The U.S. Department of Justice
estimates that 95 % of the
assaults on partners or spouses
is committed by men against
women.

ISSN 2302-786X
142 Proceeding of Annual South East Asian International Seminar (ASAIS) 2013
2.3 Illegal Migrant Workers
Since in this study the focus of
the research is illegal migrant
workers as well as social
protection, therefore it is
important to explain that
Migrant workers are
individual, group, who work
internal and outside of this
country which have , legal,
violence problem and social
disharmony social or disability
to adapt themselves to work in
another country (Juklak
Penanganan Pekerja Migran,
2011).
Some of the illegal migrant
workers are influenced by labor
exporters that take advantages
from the campaign from other
country, such as Malaysia,
Saudi Arabia, Kuwait and other
countries have aggressively
supported proposals to open
more jobs for foreign citizens.
2.4 Enterpreneurship
development (productive
economic enterpreneur)
This program has been given for
many years and the ex-illegal
migrant workers are given Rp.
3.000.000 for each person as the
stimulant budget to run their
business. As it is already
developped and the
implementation of this business
is controlled by a facilitator.
As we know that this
enterpreneur acticity is not only
poorly business but also as a
solution of the reintegration of
the migrant worker to the socity,
since they have left their
countries for months and years,
therefore they need to adapt
themselves to the culture of
their hometown. It can be said
that it has multifacet program.
3. METHODOLOGY
Based on the research objectives
above, the target and the expected
output which is going to be focused
will be done in a sequence steps as
shown in the following roadmap and
framework as seen in the diagram be
ini.

ISSN 2302-786X
Proceeding of Annual South East Asian International Seminar (ASAIS) 2013 143
Figure 3.1 The method of the study
3.1 Problem Identification and data collection model
In order to achieve the objective of the research, the researcher decide the
problem Identificasion and the data collection model as can be seen in the
following table.
Tabel. 3.1. research objective and data collection model
No Sasaran yang diSpotcheck Model Penggalian data
1 To investigate the types of the problem faced
by the deported migrant workers, Indepth interview and quesioner
2 To investigate the process of returning
migrant workers from the debarcation to their
hometown,
Observation and depth interview and crosscheck in 3
debarkation (Tj Pinang, Batam dan Tj Priok) FGD with
Stake holders Unit (Satgas)
3 To investigate the enterpreneurship program
given to the ex-illegal migrant workers and the
contribution of this program to the
sustainability of their economic and social life
Assessment Instrument in 3 components administration,
sosial and economy.
3.2 Sampling Technics
The total of population for
every research objective will
depend on deportation number
of the illegal migrant worker
and the technique of the
sampling should be done
accidentally (Accidental
Sampling), based on the
condition of accident in the
debarkation, that is the
responden were choosen from
the deporten workers.
3.3 Data Analysis
There are five types of data in
this research, that is :
Data from Observation
Data from indepth interview
Data from quesioner
Data from Focus Group Discussion
Identification and
formulation of
Problem
Desk Research Quesioner and
Asessment Design C
oll
ecti
ng
data
su
rvey
Data
An
aly
sis
Data
In
terp
reta
tion
an
d f
ind
ing F
act
Valu
e
Identification of Illegal Migrant
workers problem
Types of Violance
EnterpreneurDevelopment
Tindak Kekerasan
Returning Proses To Home
Deportation Process in
Debarkation
Con
clu
ssio
n a
nd
Rec
om
men
dati
on

ISSN 2302-786X
144 Proceeding of Annual South East Asian International Seminar (ASAIS) 2013
Data from Desk Research
The way of analysing the data is
done as explain in the fo;;owing
steps :
1. Data from observation
actities by using checklist
for observation focus,
particularly in the prosess
of the returning and
deprtation in the
debarkation, to the interim
debarkation and to the
hometown. All the
sequence of prosess will be
analized in the form of flow
chart.
2. Data from indepth
interview is visualized in
table and grafic figures,
after analysing and finding
meaning and explain it in
compact narration.
3. Data from quesioner is
analized in three steps
editing, coding and
tabulating and the tabulated
data is visualized in the
form of grafix figures and
tables.
4. Data from FGD and desk
research is explained in
table, and provide detail
interpretation in compact
narration.
5. Data from enterpreneur
asessment is refered to the
indicators formulated in the
asessment instrument. The
result is explained in form
of tables.
4. THE RESULT OF ANALYSIS
4.1 The Category of Violence
Violence is every action against
the law with or without tools,
towards the physics, psychis
that cause danger to human
beings including the
independence rights. UU no 23,
2004 about the dismiss of
family violence (Domestic
Violence Protection), article 5,
it is mentioned that it is forbiden
to do violence physically;
psycholoically; seksually. In
2007 Indonesia produce UU No
21, 2007 about Traficking (UU
PTPPO). The regulation state
that the form of violence is as
follow:
1. Physical Violence that can
cause illness and injured
(article 6 UU Domestic
Violence, Jo. article 89
KUHP, article 80, UU
Child Protection).
2. Psyche Violence, that can
cause fear, self confident,
misery, etc (article 7, UU
Domestic violence
protection).
3. Sexual Violence,
harrasment and wrapped
commercially or
individually. (artcle 8, UU
domestic violence
protection).
4. Eksploitation (working
without rest, slavery,
bribery, organ reproduction
and transplation (article 1
point 7 UU PTPPO).

ISSN 2302-786X
Proceeding of Annual South East Asian International Seminar (ASAIS) 2013 145
4.1.1 Problems of illegal migrant
worker in foreign country
From depth interview to the
migrant workers and from FGD
with the stake holders, the kinds
of problems can be seen in the
following table :
Tabel 4.1 Identification of Problems
No Permasalahan Persentase
1 The Work is not suitable with the preliminary agreement with labor
exporters (PJTKI)
40%
2. The salary is not paid by the boss 33%
3 The salary is not as agreed with the labor exporters 27%
4 Work withour rest 27%
5 Cheated by foreign agency 27%
6 Experienced various Violence 27%
7 No working documents 13%
8 Can not adapt in the work environment 13%
9 Invalid Visa and difficult to prolong 7%
4.1.2 Types of work in foreign
country
From 50 respondent (man and
women) interviewed randomly
in the debarkation, it was found
out that types of work they did
is construction work (42%) ,
Restaurant (17 %) domestic
work (11%), private company
(5%), in plantation (3%), others
(22%), as can be seen in the
following figure.
Figure 4.1 Types of works
4.1.3 The Deportation Problems
There are four main reason why
the migrant workers are
deported is:
1. Use visitor pasports
2. Invalid Pasports
3. Invalid Exit permit
4. No documents
Perusahaan dagang
0%
Perusahaan perorangan
5%
Rumah tangga 11%
Jasa hiburan 0%
Rumah makan 17%
Hotel 0%
Perkebunan 3%
Buruh bangunan
42%
Dll 22%
JENIS PEKERJAAN

ISSN 2302-786X
146 Proceeding of Annual South East Asian International Seminar (ASAIS) 2013
From the data analysis , it was
found that 23,08% has got
violance <1 year, 61,54% 2-3
years, and 15,38% > 3 years.
Figure 4. 2 The periode of violence
4.1.4 The types of Violence
experienced by the migrant
worker
The four types of violence
experienced by the illegal
migrant worker while working
abroad :
1. Physical violence
2. Emosional and psichological
violence
3. Economic violence (unpaid
salary, insufficient salary,
trafficking)
4. Seksual harrasment and
wrapped
4.1.5 Recapitulation of Violence
Category
Table. 4.2 Category of Violance
4.2 The process of Deportation
4.2.1 Deportation Process from
Malaysia to Tj. Pinang
Debarkation.
The flowchart of the
deportation process can be seen
in the following figure
Kurang
dari 1
tahun
antara 2
sampai 3
tahun
Diatas 3
tahun
23,08%
61,54%
15,38%
Cate-
gory Types of violence The form of violence The doer of violence
Frekuency
I
Sexual violence 67% sexual harrasment
33% wrapped
34% the son of the
boss;
33% by the boss
33% others
When the wife
and parents are
not at home
II.
Physical violence 29% kicked and slapped 60%; wife
40%; husband and
children
80% any time
20% others
III
Psychological and
Emosional)
29% bad and nasty words 60%; wife
40%; husband and
children
80% when
making mistakes

ISSN 2302-786X
Proceeding of Annual South East Asian International Seminar (ASAIS) 2013 147
Figure 4.3 The flow of the process from Malaysia to Tanjung Pinang
In Tanjung Pinang the illegal
migrant workers fetched by the
Satgas, such as Imigrasi, local
government, Social institution,
Facilitator, Transoportation
institution. From the data of
Desk Research, it is found out
that every month there is
deportation of workes since
February untul Oktober 2012:
5342 people as seen in the
following table.
Tabel 4.3 Recapitulation of deportation in Tanjung Pinang
bulan Februari s/d Oktober Tahun 2012
Month
Total workers Total Frequency
Man Women Child
February 271 105 12 388 3 x
Mach 292 153 21 466 3 x
April 266 117 15 408 2 x
May 285 143 17 445 2 x
June 337 163 26 526 2 x
July 443 252 29 715 3 x
August 636 316 31 983 5 x
September 417 158 9 584 3 x
Oktober 548 247 32 827 3 x
Total 3486 1664 192 5342 26x
% 65,25 31,15 3,60 100 -
4.2.2 The Returning proses from
Tanjung Pinang to
Tanjung Priok
The flow of the returning
process in Tanjung Pinang is
tight. There are four steps in the
process as shown in the
following figure.
Figure 4.4 Returning Proces from Tj Pinang To Tj. Priok
2. Temporary
placement in
Protection
hause
3 Arrive in
debarkation
and
coordination
with Pelindo
and Pelni
1. The
migrant
workers are
facilitators
and Satgas
4 distribution
of tickets and
go to Tj Priok
Jakarta

ISSN 2302-786X
148 Proceeding of Annual South East Asian International Seminar (ASAIS) 2013
4.2.3 The Returning process from
Tanjung Priok to the home
town
The flow of the returning
process from Tanjung Priok to
the home town. There are five
steps in the process as shown in
the following figure
Figure 4.5 The proses of returning from Tj Priok to the home town.
4.3 Enterpreneurship Analysis
and asessment
The asesment of enterpreneurship is
based on indicator for three aspect,
administration indicators, Social
indicators and Business indicators.
The result of the asesment can be seen
in the table below.
1 Arrive in Tj Priok
and waiting for returning
4 Pthe distribution of
food, money and tickets
5 Note of accident
(Return to home town by
bus, ship, or go to RPTC
and hospital (traumatic and
sick workers)
3 Photo
documentation
2 The workers
are groupped
based on each
home town

ISSN 2302-786X
Proceeding of Annual South East Asian International Seminar (ASAIS) 2013 149
Table 4.12 The Recapitulation of Asesmen Keberhasilan UEP
NO Kab/Kota Level of Achievement Total
Sangat
Berhasil
Berhasil
Cukup
Berhasil
Kurang
Berhasil
Tidak
Berhasil
1 Jakarta
Timur
3 15 3 6 - 27
2 Jakarta Utara - - 13 - 1 14
3 Tanjung
Pinang
3 4 5 - - 12
4 Batam 2 2 5 9
Total
%
8
(19,8%)
21
(31,2%)
26
(41,7%)
6
(6.3%)
1
(1%)
62
(100%)
From the recapitulation above,
41,7% is successful enogh,
31,2% succesful and only
19,8% very successful. Not
successful is 6,3%.
5. CONCLUSSION AND
RECOMMENDATION
5.1 Conclussion
From the analysis and
discussion in the previous parts,
the following result can be
concluded :
5.1.1 Conclussion of the violance
categories
1. From the result of Depth
Interview Analysis, 45% of
the respondent feel cheated
by the labor exporter
(PJTKI), 32% of them feel
they do not know how is
the process of working
abroad, and 5% feel
cheeted foreign agency.
2. Due to the cheating
process, they faced many
problems : “work without
legal document (52%), the
salary received is not
suitable with preliminary
agreement (12%), work
overtime without payment
(6%).
3. The migrant workers
experienced physical
violance (50%) by using
instrument, 25% were
kicked; and 25% were
slapped and any other
violance.
4. The migrant workers
experienced psychological
violance; 34% treated by
un nasty words; 22%
treated badly; 11% work
without rest and others
33%.
5. For domestic workers, the
violance is done by the
house wifes 67%; by the
husbands 16%; by the
children 6% and other
families 11%.
6. Non-physical violance
experienced by the
migrant workers (56%)
never saw working
contracts, the working
contract was only explained
orally (33%) and the
working contract was only
seen (11%).
7. The migrant workers also
experienced sexual
violance; 67% experienced
sexual harrasment, 33%
wrapped ( 34% by the
children; 33% by the
husband and 33%.
5.1.2 Conclussion of Deportation
process

ISSN 2302-786X
150 Proceeding of Annual South East Asian International Seminar (ASAIS) 2013
1. The countries where the
illegal migrant workers
were from 4 countries;
Malaysia, Saudi Arabia
(Riyadh & Jeddah),
Singapore and Brunai.
2. The hometown of the
workers are East Jawa
(49%), NTB (11%), NAD
(10%).
3. The type of work they had
in the 4 countries; 42%
construction labor, 17 %
restaurant waiters and
cooked, 11% domestic
worker and servent, 5%
private company, 15%
worked in rubber and palm
plantation.
4. Before deportation; they
had worked for <1 year (45
%), 1- 2 tahun (30%) and ,
> 3 tahun is 25%.
5. When the research process,
there were 283 people
deported, it was because of
illegal document (33%),
using short visitor pasports
(18%), no document (15%)
illegal Permit (13%) Invalid
Pasport (11%) Invalid Visa
mati (10%) Missing Pasport
(2%).
6. Most of them experienced
violance in jail (60%),
beaten by rattan (14%),
beaten by wooden tools
(20%) and kicked (6%).
7. Most of the illegal migrant
worker were unskilled labor
and low education; 48 %
primary school and 20 %
secondary school, and 32 %
high schools.
8. Mostly, the problem is
caused by unoptimal law
ebforcement nasionally,
regionally and
internationally, particularly
between Indonesia,
Malaysia and Saudi Arabia.
5.1.3 The conclussion of
enterpreneurship assessment
1. The types of
enterpreneurship
developped by the ex-
illegal migrant worker in in
big city (DKI Jakarta) is
food production (75%),
such as traditional cakes,
noodle and fried rice,
Uduk rice and cookies.
Small shop of 9 main foods
(25%)
2. In Tanjung Pinang and
Batam the budget
assistance is mistargetting,
because they already have
good business and the
budget given is used for
business development.
Their business was
developped for more than
11 months - 8 years.
3. From the assessment of
Jakarta, from 17 UEP, the
result is : very successful :
1 UEP, succesful : 13 UEP
and unsuccesful : 3 UEP.
Tanjung Pinang, 12 UEP :
very succesful : 3 UEP,
succesful : 4 UEP and
unsuccesful : 5 UEP. In
Batam, 9 UEP were assess
: very succesful : 2 UEP,
succesful : 2 UEP and fair
:5 UEP.
4. From the recapitulation of
assessment in three aspects
(administration, social

ISSN 2302-786X
Proceeding of Annual South East Asian International Seminar (ASAIS) 2013 151
impact and business, 41%
is fair, 32% is succesful and
19% very successful sangat
berhasil and 8% is not
succesful.
5.2 Recommendation
Due to the poverty Alleviation,
the researcher would like to
recommend the following :
1. The government has to open
broader work opportunity for
the community in order to
prevent them to work outside
of this country.
2. The business development
should be based on the
competencies and the
experience of the migrant
worker.
3. The government should give
information and socialization
intensively to the community
about the requirement and
the procedure of going to
work in another country.
4. The government has to
control the mechanism of
returning and deportation
process, in order to avoid
recycling of workers in the
debarkation.
5. The government has to give
strong sunction to the labor
exporters which send migrant
worker illegally.
6. Indonesia government has
done ratification
“International Convention
on The Protection of The
Rights of all Migrant
Workers and Members of
Their Families” byecome
regulation; UU RI no.6 tahun
2012, yang diundangkan
bulan Mei tahun 2012.
Therefore, it is important for
central and local government
to harmonize the regulation
of law enforcement and for
the protection of the rights of
the workers.
6. BIBLIOGRAPHY
[1] “Undang undang Republik
Indonesia Nomor 13 Tahun 2003
Tentang Ketenaga Kerjaan” ; PT.
Bina Sejahtera Utama
[2] Sunit Agus Tri Cahyono ”Dilema
Pekerja Migran Indonesia di
Luar Negeri” Yogyakarta, Dian
Samudra , 2008.
[3] Kementerian Sosial RI, ”Standar
Teknis Perlindungan Sosial
Korban Tindak Kekerasan
Pada RPTC” ,Ditjen
Perlindungan dan Jaminan Sosial
[4] Kementerian Sosial RI,
“Panduan Pelayanan Sosial Di
Penampungan” Direktorat
Jenderal Bantuan dan Jaminan
Sosial, Jakarta 2010.
[5] Kementerian Sosial RI, “ Standar
Operasional Prosedur
Pemberian Bantuan Usaha
Ekonomis Produktif Bagi KTK
dan PM” Direktorat Bantuan
Sosial Korban Tindak Kekerasan
dan Pekerja Migran, Jakarta 2011
[6] BNP2TKI, “Standar Pelayanan
Perlindungan Tenaga Kerja
Indonesia”, Deputi Bidang
Perlindungan Tenaga Kerja
Indonesia, Jakarta 2010

ISSN 2302-786X
Proceeding of Annual South East Asian International Seminar (ASAIS) 2013 151
Village Potential Through Village Tourism
Dewi Winarni Susyanti1 and Christina LR2 1,2Politeknik Negeri Jakarta
e-mail: [email protected]
Abstract
The rural tourism concept with a unique product characteristics, distinctive and environmental friendly seems to be a new solution for the tourism development in the world. In response for the displacement of tourist interest, in Indonesia grow new tourism options such as rural tour in various provinces in Indonesia. The Development of Rural Tourism is not only beneficial for the emergence of alternative tours to fulfill the tourist interest, but also can be used as a solution for problem poverty, cultural preservation and environmental conservation. Indonesia in general and West Java particularly is an area which have uniqueness in the village. But, both societies and destination managers have not realized its potential. So there are many villages, which doesn’t well maintained. So this study focus on identification of the potential of various regions in West Java to be a rural tourism. The identification results will be used to the development model of Village Community Empowerment and Poverty Alleviation through Tourism Village. In the first year, from survey and interview, we got some datas about the conditions for rural tourism development potential of community -based tourism-, also the potential of tourism in rural locations. Besides, to complete the model of community empowerment and poverty through rural tourism, the success key is the readiness of the population to open and change. To prepare societies to be able to manage the rural tourism, the competence training should be given. So that the preservation of culture and poverty alleviation can be realized. Keywords : rural tourism , rural tour, society development , poverty alleviation , cultural preservation . 1. INTRODUCTION Tourism sector as one of the important sources of foreign exchange, are very able to provide significant contributions to the development. Conventional tourism products are now being left, and tourists start to choose tourism products which has special respect to the environment, nature, and culture. Tourist satisfaction no longer rely on the natural beauty and completeness of tourist facilities but also on the intensity of interaction with the environment and local communities. Based on the above facts it is necessary to formulate a form of sustainable tourism development to be more appropriate in the future. The concept of rural tourism (rural tourism) with a unique product characteristics, distinctive, and environmentally friendly, seems to be a new solution for the development of
tourism in the world. In response to the shift on the interest of the travelers, Indonesia grows new tourism options in the form of tourist villages in various provinces in Indonesia.
The understanding of rural tourism is quite varied, among others say is a form of living environment which has special characteristics at both nature and culture, in accordance with the demands of travelers where they can enjoy, recognize, appreciate and learn the peculiarities of the village and all its appeal. In practice, the travelers often live in or live close to the traditional atmosphere and learn about village life and the local environment, so there is a learning process of the people (hosts) to the tourists (guests), so the guests were able to reward the local values which still be embraced by the local community.

ISSN 2302-786X
152 Proceeding of Annual South East Asian International Seminar (ASAIS) 2013
The tourists who come to the tourist village will be able to enjoy the pristine nature of rural life and living in the village with its custom. Travelers staying with people, sleeping in a simple but clean and healthy room, and traditional food is the main course to be served. That way the tourists feel the satisfaction of the reception and care from the villagers.
Besides supported by the facts above, travelers trend is now more rational and has a character that tourist satisfaction isn’t based only on modern tourism facilities, but also on the flexibility and intensity of interaction with the environment and local communities. Based on this, the development of tourist village has become a new way for the development of tourism in Indonesia. The purpose of this study is to identify and recognize the potential of a village to become a tourist village.
2. THEORY Determination and application of Law No. 32 of 2004 on regional governance and Law No. 24 of 2004 on fiscal balance between the central government and local governments have brought big changes for local governments. Both laws are great benefit to local governments . The positive impact of the legislation is the independence of each region to manage all existing potentials that are expected to emerge justic . Thus the economic potential and the natural wealth that was much more absorbed into the central government can be distributed to local governments in the larger portion. In addition , local governments can implement policies in accordance with the local development potential of the area
because local governments are more aware of the advantages of the region. The development of the village into a tourist village that rests to the unique culture of the village community actually shows that it is need to develop the ecosystem to protect the indigenous villages.
The above conditions requires immediate research of the model of community empowerment and poverty alleviation through the development of rural tourism. The main benefit of this research is, the re-emergence on the public confidence that they have the potential to be able to further assist local governments in reducing poverty. More of it, the success of community empowerment through the development of rural tourism can boost confidence and self Indonesian society.
3. METHODOLOGY Approaching method is using sociologic normative approach and empirical normative, by collecting data not only from the literature but also in the field and research field, means to communicate with the public on the basis of observations of the activities of the poor in rural tourism, the problems studied is the relationship between sociological factors, psychologically. Methods of data collection is done directly on the objects of research that has to do with the problem under study. Source of information will be extracted from reliable information, also literature research in order to obtain a theoretical foundation opinions of other authorized parties, community groups and relevant government officials.

ISSN 2302-786X
Proceeding of Annual South East Asian International Seminar (ASAIS) 2013 153
4. ANALYSIS AND DISCUSSION
The first year of the three years plan of research, is to do a literature study on rural tourism. The existence of the tourist village is now urgently needed. Making all the village into a tourist village will complicate the task of local government. Therefore it takes help from universities to assess the potential of each village to be used as a tourist village. Synergy between universities and local governments will result in activities that are objective, so that the community and the village would grow into the vision of tourism products and have a sale value, at the same time will also boost the value of local culture to the outside world. By looking at the potential of what is suitable to be developed in the village, the village is expected to become a tourist destination village. By looking at the potential of what is suitable to be developed in the village, the village is expected to become a tourist destination village.
Reports of Human Resource Development Resource Development Agency-Ministry of Culture and Tourism (2009) describes the tourism sector as one of the important source of foreign exchange. Although tourism is a significant contribution to the development, but at the same time it turns out that activities tourism industry has also spawned a number of negative effects, such as deterioration of the quality of the environment, displacement of local culture and socio-economic disparities among the people. Negative impacts of tourism on the environment not only in Indonesia but in almost all over the world. As a result, there is a trend to a shift in market orientation and preference in the selection of travel products.
Tourist village should be distinguished from village tour, where the tourist only making visit to rural areas, but they don’t stay in the village. The problem of "stay in the village" is used as the difference between the tourist village to village tour. Stay in the village becomes an important thing, because to this day a long stay (length of stay) is still a benchmark for measuring the success of an attraction.
Tourists who come to the tourist village will be able to enjoy the clean nature of the countryside and feel to live in village with a number of custom. Travelers staying with people, sleeping in a simple but clean and healthy room, traditional food is the main course to be served during the tour, so the tourists feel the satisfaction of the villagers reception and cares. It is in order to increase tourism activities through community-based empowerment.
The Agency for Rural Empowerment and Governance, Badan Pemberdayaan Masyarakat dan Pemerintahan Desa (BPMPD) has established 23 Rural Tourism Development Potential Conditions and Community-based Tourism Travel and tourism potential in the location village / district that could be developed in Bogor regency. Rural tourism should be well managed and supported by the entire village. To get the support of the population, the planning of rural tourism should be regulated from the beginning so that the majority of the population can be involved in this project. Residents should be prepared to be able to be a good host. They have to be trained how to receive guests, arranging rooms, preparing the house so clean and decent inhabited by tourists, cooking properly served traditional

ISSN 2302-786X
154 Proceeding of Annual South East Asian International Seminar (ASAIS) 2013
foods, as well as to revive the culture of the village that had been almost extinct.
Therefore, the key to the success of the tourist village is the readiness of the people to open up and change. To prepare the residents to manage rural tourism, some management training should be given the tourist village. This requires training curriculum in accordance with the competencies that are expected to be possessed by the villagers.
5. CONCLUSION From the results of field surveys to several tourist villages can be seen that the villagers do not have adequate knowledge and skills in managing rural tourism. Departing from this, then there is an indication that the knowledge of the management of the tourist village is a skill that is needed by the existing rural tourism or for people who want to develop their village into a tourist village. Therefore, it is necessary to develop a knowledge that can enhance the knowledge and skills in managing rural tourism. The development of a model of rural tourism is expected to be a guideline for other areas to contribute to develop the village into a tourist village.
6. BIBLIOGRAPHY [1] Adi, Rianto, 2004, Metodologi
Penelitian Sosial dan Hukum, Jakarta: Granit.
[2] Badan perencanaan Pembangunan Nasional , 2006, Buku Potensi Ekonomi
[3] BPS Pusat, 2006, Tingkat Kemiskinan di Indonesia Tahun 2005-2006.Available at:
http://www.bps.go.id/releases/files/kemiskinan- 01September 2006.pdf.
[4] Combs, Philip H dan Manzzor Ahmed. 1974. Memerangi -Kemiskinan di Pedesaan Melalui Pariwisata Non-formal. Jakarta: CV Rajawali.
[5] Jurnal Triwulan, No.02 tahun 2006, Pembangunan Daerah No.02 tahun 2006
[6] Rais, M. Amien, 1995, Kemiskinan dan Kesenjangan di Indonesia. Yogyakarta: Aditya Media.
[7] Sarman, Mukhtar dan Sajogo, 2000, Masalah Penanggulangan Kemiskinan, Refleksi dari Kawasan Timur Indonesia. Jakarta: Puspa Swara.
[8] Sumarsono, dkk, 2007, Pelestarian dan Pengembangan Nilai Budaya, Pusdiklat Pegawai, Depbudpar
[9] Sumarsono, dkk, 2007, Nilai-nilai Budaya Tradisional dan Kontemporer, Pusdiklat Pegawai, Depbudpar
[10] Timbul Haryono, 2005 : Pengembangan dan Pemanfaatan Aset Budaya Dalam Pelaksanaan Otonomi Daerah, Jakarta: Mitra Publisher
[11] Undang-Undang Nomor 32 tahun 2004 tentang Pemerintahan Daerah, dan
[12] Undang-Undang Nomor 24 tahun 2004 tentang Perimbangan Keuangan antara Pemerintah Pusat dan Pemerintah Daerah

ISSN 2302-786X
Proceeding of Annual South East Asian International Seminar (ASAIS) 2013 155
The Study on Drivers Factors of Business Development Activities in Sebatik Island and Tawau (The Borders Area of Indonesia and
Malaysia)
Besse Asniwaty1 , Suminto2 M. Nawawi3 and Armini Ningsih4 1Department of Business Administration, Polytechnic of Samarinda, Jl.Cipto Mangunkusumo Centipede Mountain Campus, Samarinda
E - mail: [email protected] 2,3,4Jurusan Business Administration, Polytechnic of Samarinda,
Jl.Cipto Mangunkusumo Centipede Mountain Campus, Samarinda
Abstract
This study aims is to examine the driving factors of the development of business activities in Tawau Sebatik Island and the border area between Indonesia and Malaysia, through the identification of the driving factors of business development in the region, the identification and analysis of the trading of goods and services takes place accessibility and mobility performance in the border regions, the analysis of the factors that encourage the development of border areas in particular on the island of Sebatik and implications that arise, and to determine how far the mechanism of supply and demand mutual happens between the two countries in the border area. Through a descriptive analysis of the results obtained showed that the driving factors of the the business development of the border region covering population, basic facilities and infrastructure, the number of varieties of businesses, location, and means of transport, the driving factor for the development of the border areas are human resources, government seriousness to build the area, facilities and infrastructure, while the identification analysis of trade in goods and services covering almost all types of goods and services are easily obtained from Tawau Malaysia, because accessibility is very easy and smooth, especially for illegal trade. Then there is a gap of supply and demand mechanism of goods and services, but in reality, however, there is no other choice for Sebatik citizens. Key word: The driving factors , supply and demand , the development of business activities , the border region. 1. INTRODUCTION Sebatik Island is one of the areas immediately bordered with Malaysia and has a population of more than 36 295 inhabitants with vast region 246.61 km2. Economically the island Sebatik potentially very rich enough land, marine resources, mineral resources, and tourism. Infrastructure gaps and lack of light perceived by the public Sebatik Island inversely proportional to Tawau Malaysia that happens in the area bright and has excellent infrastructure . This fact is certainly unfavorable impact or interfere with the movement of economic growth in a variety of businesses that rely heavily scale facilities and infrastructures and or facilities provided by the local government.
The proximity of the area led to cross-border activities of the two countries continues to increase specializing in trade .In general, the needs of citizens be met Sebatik Island of Tawau Malaysia. mobility flow of goods, services and people between the two regions evolve unbalanced. Good quality items and low prices from Tawau Malaysia become an attraction Sebatik Island residents water traffic is supported only taken in a matter of minutes between Sebatik Island Indonesia,-Tawau, Malaysia. Commodities that are traded include clothing, food, agriculture, and others. But on the other hand there are many commodities traded illegally. Based on this phenomenon the writer is interested in conducting a study on

ISSN 2302-786X
156 Proceeding of Annual South East Asian International Seminar (ASAIS) 2013
the factors that encourage the development of business activities in the border region of Sebatik Island. The introduction of the driving factors are meant to understand the mechanisms of how and what market are growing as a result of the interaction of community activities. Research question of this study is whether the factors that encourage the development of business activities in the border region of Sebatik Island and Indonesia-Tawau Malaysia.
This study aim is to examine the factors that encourage the development of business activities in the border region of Sebatik Island, Indonesia, - Tawau, Malaysia . The urgency of this research is to provide accurate information to local governments and the central government on various types of business activities, both legal and illegal is happening and identify the factors that drive the activity of the border region, and the extent to which the mechanism supplay and demand, mutually beneficial that occurs between the two countries in the border. Accessibility and mobility performance analysis and implications arising Sebatik Island Indonesia particular region. Furthermore, the findings of which are targeted in this study are the results of the analysis will be formulated in the form of recommendations.
2. THEORY The development of today's global environment has brought about a paradigm change in border areas where development is seen as a an economic relation, because it is the location of cross-border trade in goods and services between countries. There is a need for goods and services gave birth to the interaction between
different regions, in the form of movement (displacement, exchange) of goods and services. Geographically economic system related to the spatial organization of the economic system: one in which certain elements of the system will be located, how the elements are connected in a space and the effect of spatial economic processes (Dicken and Lloyd , 1990: 7). To be able to grow and expand economic activities must be able to survive, with the aspect of range and threshold (Tarin, 2005: 85-87). Concepts range (range of services) associated with an area of influence of a center geographically, was the concept of threshold (threshold limit) is more related to the level of the minimum number of people who order a product or a service center is able to survive because of the location of the consumer who served Theory is defined as the science which investigates the spatial economic activity. In general, the choice of location by one unit of activity is determined by several factors such as raw material that can be removed and the outer query (Hoover and Giarratani, 2007).
Furthermore Augustloseh said that the location of the seller greatly affect the number of consumers who can be working on . Edward Ullman (Dicken and Lloyd, 1990 : 71-74) explains that there are three forms of spatial interaction, ie complementary spatial interaction, spatial interaction is intervention, and no form of interaction at all. The level of intensity (number, volume, number) the movement of goods and services between the various spaces is strongly influenced by the level of needs (consumption) of the population (demand) as well as other urban production activities. In general, there are three aspects (Dicken and Lloyd,

ISSN 2302-786X
Proceeding of Annual South East Asian International Seminar (ASAIS) 2013 157
1990: 181) that determines the level of demand for goods and services, namely: the prevailing price level, relative prices of all goods and services, and weights are given as measured consumer taste (taste) and desire or choice (preference).
According to Nugroho and Dahuri (2004 : 29) there are four things that affect the formation of the market area, namely: economies of scale, spatial total demand, transportation costs, and factors related to the population. To develop the border area as an economic node, need to learn from the development of shopping centers that had been built. In research Ahmadi (2005), the factors that affect physical development suburbs include: the availability of population (accretion, density and migration); development policy suburban areas; availability of housing support facilities that include the availability of educational facilities, health, and trade in services in suburban areas; housing allocation directives in this regard related to the construction of new housing by the government, developer, or by the people themselves in the outskirts of the area; accessibility or affordability conditions associated with the movement of the facilities and infrastructure of the city center to the outskirts of the area and vice versa, and relocation sector or zone of the city and the construction/development of new functionality in the suburbs.
Transportation system contributes to the growth of cities and economic growth through the levels of accessibility and mobility. Accessibility is simply a location associated with other locations through the transport system. Accessibility is a measure of the ease and convenience of the location of
land use means that each split can interact with each other (Miro, 2002: 18), which is expressed in sizes: distance, time, and travel costs (Tamin, 1997: 52). Mobility is defined as the degree of smoothness of travel, and is measured by the amount of travel (movement) from one location to another as a result of high access between these locations (Miro , 2002: 22). Essential essence of modern economic paradigm are (1) "knowledge" is among the most important resource in the development. (2) "innovation capability" determining the success of a business, (3) "Competence" is the basis for the principal productive activity (4). "Network" is the best pattern of economic activity (5). "Locality factor" rests on the ability to compete with the best local potential.
In research Ahmadi (2005), the factors that affect physical development suburbs include: the availability of population (accretion, density and migration ); development policy suburban areas; availability of housing support facilities that include the availability of educational facilities, health , and trade in services in suburban areas ; housing allocation directives in this regard related to the construction of new housing by the government, developer, or by the people themselves in the outskirts of the area ; accessibility or affordability conditions associated with the movement of the facilities and infrastructure of the city center to the outskirts of the area and vice versa , and relocation sector or zone of the city and the construction/development of new functionality in the suburbs.
Transportation system contributes to the growth of cities and economic growth through the levels of
ISSN 2302-786X
158 Proceeding of Annual South East Asian International Seminar (ASAIS) 2013
accessibility and mobility . Accessibility is simply a location associated with other locations through the transport system . Accessibility is a measure of the ease and convenience of the location of land use means that each split can interact with each other (Miro , 2002: 18) , which is expressed in sizes : distance , time , and travel costs (Tamin , 1997: 52) . Mobility is defined as the degree of smoothness of travel , and is measured by the amount of travel (movement) from one location to another as a result of high access between these locations (Miro , 2002: 22).
3. METHODOLOGY The approach used is factor analysis to formulate the factors driving the development of the border region Sebatik Island, Indonesia, - Tawau , Malaysia explanative and descriptive approach, aided study of the theory for the interpretation of data /information obtained by the development of border areas Sebatik Island Indonesia - Tawau, Malaysia. Description (interpretation) is done to understand the conditions that exist in order to answer some basic questions such as who is involved, how to trade and service activities in the border region, the magnitude of economic activity, commodity type, scale, constraints and what the implications would arise from phenomenon takes place. The overall aim of the factor analysis technique is to seek ways sums up the payload (the contents) of any of the information in a number of original variables into a smaller set amount of new things (factors), the combined dimensions or variations (factors) to minimize information loss (Hair, et al, 1998: 95).
The new grouping process is done by finding the relationship
(interrelationship) between a number of variables that can be made of one or a set of variables is smaller than the number of initial variables (Santoso, 2006: 11). The new variable is called a factor (latent variable) and fewer in number when compared with the baseline variables (manifest variables). Broadly speaking, the stages include factor analysis (Santoso and Tjiptono , 2001: 250):
• Selecting the proper variables included in the factor analysis.• After a number of selected variables, then the' extraction' of the variable so that it becomes one or several factors.
• Factors to be formed, made through the process of rotation to clarify whether the form factor has been significantly different from the other factors.
• Once the factors actually been formed, then the process is continued by naming the existing factors.
4. ANALYSIS AND DISCUSSION
4.1 The Driving Factor Border Area Development Business Activity
• Total Population
Border areas, including the outermost small islands one of which is Sebatik Island, has the potential of natural resources very large which can be optimized to increase the utilization of regional economic growth and improvement of people's welfare. In addition, the border region is a very strategic area for national defense and security. Potential of the border region is very large economic value, especially the potential of natural resources (forests, mines and minerals, fisheries and marine) that lie along and around the border.

ISSN 2302-786X
Proceeding of Annual South East Asian International Seminar (ASAIS) 2013 159
Sebatik island has an area of 246.61 with a population of 36 295 people is the object of development as well as the subject of development.
Basic Facilities and Infrastructure Sebatik island communities independently able to own their own home, without going through the developer or developers, almost all households in Sebatik Island has a home. Their houses are generally made of wood , they use existing resources to meet their basic needs, namely the need for adequate housing. Existing educational facilities ranging from kindergarten to the high school level, and spread to every distric that exist, it is quite enough for education and for those who wish to proceed to universities and local governments by the central government to facilitate their college synthetically by sharing this type of scholarship. Sebatik Island has 14 traditional markets and supermarkets 15 shophouses 3 Bank branch office, 3 guests 3 legal port (internal access) and 28 illegal ones.
Basic infrastructure such as electricity supply on the island that is still lacking. Sebatik can be seen when the electricity is turned on in rotation at each district or region - specific areas that have been announced this very disturbing activities that most businesses rely on electricity. Similarly k clean water is still very expensive things can be seen when the water needs to be met from neighboring Malaysia Tawau and availability of rainwater at almost every home island of Sebatik, water supply facilities is already arriving home each, two years ago but until now has not flowed as a whole, only certain in places. The availability of road and public transport services, are also still lacking, but the intention of
the local government to build roads is evident in some of the major pathways have been paved and the road development process continues to run, but public transport is still difficult to be seen by the general public as public transport only apply for school children with specific routes.
• Variations Business
Economic development of the border region is out of balance creates variation that consisted of two business business management business management: first legally covering 26 % agriculture, fisheries 9 %, 16 % trade, and other self-employed 31 % 19 %, both in management illegal with unsecured business management carried out by the community it happens every day and is a potential source of income, such as illegal logging and illegal fishing, illegal trade, illegal transportation, it can be observed through illegal ports 28 points can occur on land or at sea, and operations occurring at the ports. This fact is increasingly prevalent because of mutual need and there is no Demand offerings. Further strengthened by the similarities between the cultures and customs of people in both countries as well as economic inequality factors, led to the emergence of cross-border mobility of the population, and this has been going on for generations. Weak surveillance systems in the border region led to the region's potential vulnerability to transnational crime, such as human trafficking, and other drugs.
• Locations
Geographical location Sebatik Island directly adjacent land and sea with

ISSN 2302-786X
160 Proceeding of Annual South East Asian International Seminar (ASAIS) 2013
Tawau Malaysia to benefit the people of both regions although there are imbalances, some of the advantages of the frontier that allows the formation of high- interaction process due to demand - supply factors , demand (demand ) of Island residents Sebatik to meet a variety of needs at low prices, variety and number of options are many and the fulfillment of other needs that are easy to obtain from Tawau and vice versa Sebatik Island ability to perform the function of supply (supply ) against agricultural goods and marine Advantages of this location is supported the location, function, and strategic role held by Sebatik Island as the outermost island bebatasan directly with the third largest city of Tawau in Sabah Malaysia. Sebatik Island has a role in distributing goods produced from Tawau to control every aspect of Borneo island and vice versa agricultural goods from Sebatik Island and other Eastern Indonesia Tawau and marketed in cities around both legally and illegally .
4.2 The Drivers Factors of Border Area Development
1 . Interaction of Trade
At the border there Tawau Sebatik Island 4 - traditional markets are located in Tawau Tanjung Sari market, New Market, Farmers Market and Market Hanging. Of the four markets cape cider market is the largest market occupied about 2000 sellers, they sell almost all kinds of necessities of life, as well as New Market, but its capacity is smaller and only occupied by approximately 500 sellers, this market sells a variety of second types of goods such as clothes, pants, electronics, building materials, agriculture and fishing equipment, food, and more. Many
types of goods purchased by Sebatik Island residents are food (groceries), side dishes, gas, Building materials, spices, fruits, processed foods, pharmaceuticals, glassware, home furnishings, snack, produk electronics and others.
The appeal of Tawau town which is the third largest city in the state of Sabah Malaysia. As aktititas business center, greatly affect the interaction region of the border trade Sebatik Island Indonsesia - Tawau Malaysia. Three modern markets and traditional markets adjacent four offers options of shopping places that can give satisfaction to the visitors, the main attraction for residents and Nunukan Sebatik Island in East Kalimantan in particular and citizens in general. Every day more than 100 legal Indonesian citizen to wade through immigration Tawau to Nunukan Dangan various purposes such as streets just looking for entertainment, shopping to meet the needs, visit family and for business purposes. Nunukan government policies allow Indonesian citizen who visited Tawau to shop not more than 600 Malaysian ringgit.
This policy does not apply to citizens who crossed illegally from the Sebatik Island the predicted number is between 1-2 % of the total population of 36295 per day, over 28 small ports scattered coastal Sebatik Island which can only load small boats. Small boats that is the tool thransportation means for illegal goods such as agricultural products from Indonesia Sebatik Island heading to Tawau Malaysia, otherwise after the return of the boat carrying various kinds of goods from Tawau also illegal. In general, small ports in this illegal business activity

ISSN 2302-786X
Proceeding of Annual South East Asian International Seminar (ASAIS) 2013 161
occurs both in terms of demand and supply.
2 . Demand and Supply of goods / services of the border region,
a. Request for Goods and Services Sebatik Island Indonesia
Revenue derived from Sebatik Island community gardening, farming, fishing, self-employed, civil servants and private. Location of Sebatik Island that are geographically separated causing limited interaction Sebatik Island community, where people Sebatik Island when buying daily necessities always crossed over to Tawau Malaysia, geographical proximity and sea transport is always available at any time makes accessibility easy, and cheap, good quality goods, the prices of goods relatively cheap as a factor triggering growth in demand for goods and services from year to year Sebatik Island people even say that 80 % of their family's needs is obtained from Tawau Malaysia (survey results). Growing demand for goods and services than meet the daily needs to be a promising business area, the flare occurred, so that smuggling goods from Tawau, Malaysia can not be prevented even happen every day.
Ironically fish and vegetables from the island contrary sold in Tawau, bought back by the people who are shopping Sebatik Tawau Malaysian market. Can be calculated how much profit comes from Tawau Malaysia especially the people of East Kalimantan Sebatik every day. This is because inter- island transportation in East Kalimantan are still limited, investors who want to invest too much is still not interested Karen basic infrastructure alone is not able to be met by the local government. To
address this need to define a special space for economic activities will be directly drive economic activity. Local governments need to try to anticipate areas where that can be grown into a center of the region 's economy. Strategic regions of the area - and this can be a fast growing area that is already showing signs of agglomeration, as the centers of production of food crops, horticulture, plantation, animal husbandry and fishery. For Nunukan many potential areas to be used as the centers of which Sebatik, Sembakung, Kragan and Lumbis that happen equity in economic development.
b . Supply of Goods and Services Sebatik Island Indonesia
Basic infrastructure Sebatik Island, has not met with such good, clean water availability ketersedian angkutan general, and the availability of road that was paved a lot less than the road that is not paved. Roads are the lifeblood of the economy as a liaison between one region and another. If the existing road, not addressed the problem of development and community needs will be underfunded, especially for agricultural crops and bring them to the market for sale, this happens in Sebatik Island, where people sell crops and catch fish to Tawau, Malaysia because it is closer and marine transportation is very convenient and cheap, if Sebatik Island residents want to sell crops and fish to Nunukan Island takes a long time approximately 3 hours either using ground transportation ( public transportation) and outboard boats. This condition complicates the flow of goods from Sebatik Island to Nunukan, and vice versa. So the only effective market to supply goods is Tawau, Malaysia. The Malaysian

ISSN 2302-786X
162 Proceeding of Annual South East Asian International Seminar (ASAIS) 2013
government policy does not prohibit the supply of these items because it provides benefits for the country, except for cigarettes and batik sarong is prohibited to protect the same products in their country .
As well as the supply of goods is not much different service offerings, service offerings occur both legally and illegally, when there is demand for labor, or not, from Malaysia Tawau - formally or informally as building labor, palm plantation workers, shopkeepers, maids stairs and other, even this labor supply mostly illegally by certain parties, they are imported from Java, West Nusa Tenggara and South Sulawesi and other parts of Indonesia and smuggled through Nunukan Island Sebatik Island, the high standard of wages for unskilled workers in Tawau Malaysia, and the lack of employment in Indonesia as a shortcut for job seekers Indonesian citizens to work in Tawau Malaysia, although it must be smuggled, such practices often occur either through Nunukan and Sebatik Island, so the risks are affected by deportation often sparse occur.
Factors that influence the supply and demand of goods, especially the border region on the island of Sebatik and implications that arise.
• Accessibility and Mobiltas
Ease of access from Sebatik Island to Tawau via sea transport only a few minutes at a low cost is a trigger factor of demand and supply of goods and services the region, it was realized that the imbalance occurs and tends to be more profitable Negara Malaysia, due to the location factor, basic infrastructure, facilities, local government policies, the physical land, and management services,
security and stability / politics, population and economic actors are highly unbalanced. Tawau is the third largest city in Malaysia after Sabah Kinabalu and Sandakan. As a big city that has become a magnet for a wide range of facilities for local people with high accessibility that create community mobility, goods and services are high. Measured by the level of smoothness of travel, the demand and supply of goods and services.
The strategic location is also a factor that affects the volume of demand and supply of goods and services from Tawau Malaysia - Sebatik Island to Indonesia has increased both in terms of quantity and in terms of its variations. These various types of variety of goods ranging from the most basic needs such as gas groceries, spices, chicken and beef, fruits, household appliances, building materials such as cement, iron, and others. Ability to supply from Malaysia Tawau Sebatik Island, making Sebatik Island as a stopover area goods that enter illegally and then distributed to the various region in Indonesia like to Tarakan, Berau, Bulungan, Balikpapan, Samarinda even to South Sulawesi through the port of Pare - Pare, . Formed interaction flow supply goods and services to the border is the impact of the expansion of markets and the range of Malaysian products marine transportation more convenient and affordable through the PELNI ship in the port every week to Nunakan.
• Trade in Goods and Services
Trade is likely to increase, due to : an exciting prospect, security, level of profitable sales and market share there. Market needs is more people and spread to the needs of the

ISSN 2302-786X
Proceeding of Annual South East Asian International Seminar (ASAIS) 2013 163
business as a source of income. Process formed by the interaction of high demand from Sebatik Island, for Malaysian goods products, and conversely the amount of demand on Tawau residents and plantation agriculture and marine products Sebatik Island. Sebatik Island residents to shop for goods and services that are available in Malaysia Tawau more numerous and varied choice, and the price is cheaper . Interactions that take place more favorable to Tawau Malaysia compared to Sebatik island (inflow of foreign exchange) .
• Implications for Sebatik Island border area between Indonesia and Malaysia Tawau
Implications arising for Sebatik Island border region between Indonesia and Malaysia Tawau include: The Economy, society gain income, job opportunities, business opportunities occur, motivating farmers and fishermen as there is market share. Physical Spatial, development occurs, formed transportation access, mobilization and prevent immigration. In Socio-cultural, community aware of the importance of education, skills, understanding of health issues and other implications.
5. CONCLUSION
5.1 Conclusion a. Sebatik Island people generally
work as fishermen, farmers, planters, merchants, civil servants and private employees. Source of their income from farming, forestry, marine, cross-border trade and tourism. The only market for agricultural and marine estates are in Tawau Malaysia, accessibility and mobility are inexpensive and cheap and fast is to Tawau
Malaysian market, given the agricultural, plantation and marine nature can not last long, because it is still traditionally managed.
b. Tawau Malaysia has 4 traditional markets and 3 modern market appeal to Sebatik Island residents to shop and meet the needs of everyday life, it is supported by the marine transportation is easy, cheap and fast. Approximately 80 % of the people living in the supply Sebatik Island of Tawau Malaysia, Tawau Malaysia's ability to supply various types of goods in large quantities to the border region responded by market share because the quality is good, it's cheap and easy to get, so the demand for the various types of goods from Tawau Malaysia continuously increasing, even develop into a commodity business, so as to increase the income for residents Sebatik
c. Factors that influence the supply and demand of goods, especially the border region on the island of Sebatik ie Mobiltas accessibility and ease of access from Sebatik Island to Tawau via sea transpor only be reached in a matter of minutes at a low cost is a trigger factor for increasing the demand and supply of goods and services the region. The strategic location is also a factor that affects the volume of demand and supply of goods and services from Tawau Malaysia - Sebatik Island to Indonesia has increased both in terms of quantity and in terms of its variations.
d. Trade is likely to increase, due to : an exciting prospect,

ISSN 2302-786X
164 Proceeding of Annual South East Asian International Seminar (ASAIS) 2013
security, level of profitable sales and market share there. Market needs is more people and spread to the needs of the business as a source of revenue; Implications for Sebatik Island border area between Indonesia and Malaysia Tawau implications arising for Sebatik Island border area between Indonesia and Malaysia, especially in Tawau Sebatik Island include : Economically, people earn income, job opportunities, business opportunities occur, motivating farmers and fishermen as there is market share. Physical Spatial, development occurs, formed transportation access, mobilization and prevent immigration. In Socio-cultural, community aware of the importance of education, skills , understanding of health issues and other implications
e. Incentives for Border Area Development Business Activity Sebatik Island - Tawau covers, consisting of a basic infrastructure of electricity, water, roads, and the availability of public transport services, housing facilities built by the independently is quite healthy and well-organized school education suggestions high school , government policies, valuation businesses, as well as the strategic location factor is most important that there is a demand and supply for both countries, as a result of the easy and cheap accessibility and mobility created by the community.
5.2 Recommendation a. Sebatik Island requires a precise
approach to regional development, one of which is to make Sebatik Island as an Integrated Economic Development Zone (KAPET) it is possible because it is situated in the region bordering Malaysia that could be import export gate.
b. It needs a legal regulation for comprehensive marine management. through the Department of Fisheries and marine and East Kalimantan. How marine management significantly increase revenue for the community because there is a potential market share in Tawau Malaysia, people need to be trained in how to find or catch fish by using the method/modern technology, and techniques of modern storage
c. Need for local economic development that emphasizes the empowerment of the local potential, be it natural resources, human resources, institutional separately through efforts to improve the welfare of local communities. develop production centers (fisheries, agriculture, plantations, trade and services).
d. Facilitate the development of partnerships with forums for dialogue involving all stakeholder thinking about economic development, this forum serves as a vehicle for participation in the order of planning, policy formulation, and implementation.
6. BIBLIOGRAPHY [1] Adisasmita, Rahardjo., 2005.
Regional Economic Basics.

ISSN 2302-786X
Proceeding of Annual South East Asian International Seminar (ASAIS) 2013 165
Yogyakarta: Graha Science Publishers.
[2] Agustini, S.R., 2003. Provision of Facility City In City Cibinong: Factors Published Berpengaruh.Tidak , MPWK ITB , Bandung , Indonesia .
[3] Ahmadi., 2005. Factors Affecting the Development Area Physical Aspects of Perception Based Suburbs Now settled in Sengkang Town Selatan.Tesis Sulawesi Province , Not Published , MPPWK Diponegoro University in Semarang , Indonesia .
[4] Blair , J.P., 1995. Local Economic Development - Analysis and Practice . Canada : Sage Publication
[5] Dicken, Peter and Lloyd, P.E., 1990. Location in Space : Theoretical Perspectives in Economic Geography . New York, USA : Harper Collins Publishers Inc. .
[6] Guo, R, 2004. Cross Border Resource Management, Regional Science Association of China at Peking University , Beijing , China .
[7] Hair, J.F, et al., 1998. Multivariate Data Analysis . Fifth Edition . New Jersey, USA : Prentice - Hall International, Inc. .
[8] Husnadi ., 2003. Towards the Development Model of Inter- State Border Area Army (Case Study : Sub Paloh And Sajingan Great Sambas district , West Kalimantan ) . Thesis, Unpublished, MTPPWK Diponegoro University, Semarang , Indonesia.114
[9] Kuncoro, M., 2002. Spatial and Regional Analysis : Industry Cluster Study of Agglomeration
and Indonesia Yogyakarta : AMP YKPN .
[10] Moleong, L.J., 2005. Qualitative Research Methodology. Bandung : PT Publisher. Teens Rosdakarya .
[11] Miro, F., 2002. Transportation Planning, for Students, Planners and Practitioners . New York: McGraw .
[12] Nugroho, Iwan and Dahuri, Rochmin ., 2004. Regional Development Perspective on Economic, Social and Environmental . New York: Library Publishers LP3ES .
[13] O'Sullivan , A., 2003. Urban Economics . Fifth Edition . New York : Mc Graw - Hill Companies
[14] Santoso, Singgih, and Tjiptono , Fandy ., 2008. Concept and Application of Marketing Research With SPSS . Jakarta : PT . Elex Media Komputindo Scholastic .
[15] Santoso, Singgih. 2006. Using SPSS for Multivariate Statistics. Jakarta : PT . Elex Media Komputindo, Scholastic .
[16] Sulistyowati, D.Y. , 1999. Traditional Assessment And Market Competition Supermarket Shopping Behavior Based Observations In the Municipality of Bandung. Department of Planning, Institut Teknologi Bandung, Bandung, Indonesia .
[17] Syahmora, Abi ., 2005. Optimal location in the City Market Development Lahat Based Assessment Factors - Factors Determinants of Market Area. Thesis. Not Published, MPPWK Diponegoro University , Semarang , Indonesia

ISSN 2302-786X
166 Proceeding of Annual South East Asian International Seminar (ASAIS) 2013
[18] Tamin, O.Z., 1997. Transportation Planning and Modelling. Bandung : Bandung Institute of Technology
[19] Tarin, Robinson ., 2005. Regional Planning . Revised
Edition 2005. Jakarta : PT . Earth Literacy .
[20] Yunus, H.S. , 1999. Urban Spatial Structure. Yogyakarta : Pustaka Student.

ISSN 2302-786X
Proceeding of Annual South East Asian International Seminar (ASAIS) 2013 167
Investments in The Capital Region to The Regional-Owned Enterprises (A Case Study of Equity Participation Kutai Regency
Government to The Regional Water Company)
Indah Martati Marketing Management Study Program Samarinda State Polytechnic
e-mail : [email protected]
abstract
Local equity participation to the Regional Water Company Tirta Mahakam is an attempt Kutai Kartanegara regency government to help accelerate the development and improvement of water services. This study is intended to look at the positives and negatives of different perspectives recognition and treatment to the Company's equity Tirta Mahakam area. The data used are secondary data from equity values starting in 2006 - 2010 and local regulations as legal basis. The analysis method is based on a qualitative descriptive analysis of legislation concerning financial management, government equity participation to the state / local enterprises. The study shows that equity company Tirta Mahakam area to be recognized and treated differently. On one side of local equity participation in 2006 and 2008 are recognized and treated as a capital loan, while the other side equity in 2010 is recognized and treated as business ownership. This difference resulted in confusion in the internal management of the company in the prioritization of funding between public service policy or equity obligation to repay back the region of 500 million dollars from 2007 until 2026. Keywords: capital investments, liabilities, ownership 1. BACKGROUND Water is a vital necessity for human life. Impact of non-availability of clean water is the emergence of health and social insecurity. Thus, the availability of water for human needs must be met, either the quality, quantity and continuity. The trends in the provision of drinking water in the Kutai Kartanegara regency unfulfilled service quality of drinking water, the low coverage and the level of water services. Currently, the quality of water delivered by the Regional Water Company, hereinafter called PDAM Tirta Mahakam up to the customer to not meet drinking water quality standards. In other words, it is still within the limits of water quality. It happened due to contamination of the water in the distribution process due to the lack of viable distribution network and poor condition of the pipe, and as sources of raw water are polluted. PDAM Tirta Mahakam is still hampered by insufficient capital to make improvements and
development of water services to the community. Therefore PDAM Tirta Mahakam needs an injection of funds in the form of equity participation of the Government of Kutai Kartanegara regency. The problems faced are occurring differences in the treatment and recognition of local government capital participation before and after the year 2010 to the local water company Tirta Mahakam
2. PURPOSE Government equity participation intention is to help accelerate the development, improvement and service development drinking water. Regional equity objectives into PDAM Tirta Mahakam is an effort to encourage the creation of productivity, performance, accountability, effectiveness, efficiency and synergy for the benefit of local government purposes in the drinking water supply for the community. It be able to contribute to

ISSN 2302-786X
168 Proceeding of Annual South East Asian International Seminar (ASAIS) 2013
an increase in local revenue in the future.
3. URGENCY OF ACTIVITIES Capital investment made in order to improve and accelerate development in Kutai Kartanegara regency. Through equity participation to PDAM Tirta Mahakam, the Kutai Kartanegara regency governments be able to fulfill their obligations i.e. continuous availability of clean water for the community. Equity is also done as a form of encouragement to realize the quality of water supply services.
4. BENEFIT The benefit of local eequity participation to PDAM Tirta Mahakam area is to be able to improve the performance of PDAM Tirta Mahakam in the hope of contributing to the Government of Kutai Kartanegara regency in the form of local revenue.
5. LITERATURE REVIEW Investment is putting money into an asset with the expectation of capital appreciation, dividends, and/or interest earnings. Investment is the commitment of the current savings for a certain period to get the (rate of return) that compensate for the time involved, the expected inflation rate, and uncertainty. Investment is a conscious act of an individual or any entity that involves deployment of money (cash) in securities or assets issued by any financial institution with a view to obtain the target returns over a specified period of time (Edwin et al, 2009).
Revenue surplus countries/regions can be used to finance expenditures country/region next financial year and the use of surplus revenue the state / region referred to is to establish a reserve fund or its investment in the Company Countries / Regions that
must obtain prior approval from the DPR/DPRD [UU No. 17, 2003]. In the relationship between the government and state enterprises, regional companies, private companies, and public entities fund manager established that the government can provide loans/grants/equity participation to and receive loans/grants from company’s countries/regions after approval of DPR/DPRD.
Local governments can invest in short-term and long-term benefit for the economic, social , and / or other benefits through equity participation to regional-owned enterprises [ PP 58 , 2005 and Permendagri 13, 2006]. Local government equity participation in the form of long-term investment and can be implemented if the budgeted amount to be included in respect of the financial year has been set in the local regulation of local equity participation. Understanding of the concept of direct investment, equity investments, and lending and local regulations as stipulated in the Permendagri No. 52 of 2012 on Guidelines for the management of local government investment as follows:
a. The local government investment is the placement of funds and/or goods owned by the local government areas in the long term for the purchase of investment securities and direct investment, which is able to return the principal amount plus the benefits of economic, social, and/or other benefits in the period particular.
b. Direct investment is a capital investment and/or lending by local governments to fund operations.

ISSN 2302-786X
Proceeding of Annual South East Asian International Seminar (ASAIS) 2013 169
c. Next is the regional capital investments in the form of money is a form of local government investment in enterprises, finding the right property.
d. Investments in equity on the property of the local government area is the transfer of ownership of the property of the original area is not separated into wealth separated to count as capital/stock areas on state-owned enterprises, local state-owned enterprises, or other legal entity that owned by the state.
e. The provision of loan is a form of local government investment in state-owned enterprises, local owned enterprises, cooperatives, government, other local governments, BLUD other local government and the public with a right to repayment of loan principal.
f. Regulation, hereinafter referred to as regulations are laws set up by Parliament with consent of the Governor/Regent/Mayor, including applicable Qanun in Aceh Province and Provincial regulations prevailing in the province of Papua. [ Permendagri No. 52, 2012] .
G. METHODS Through the qualitative descriptive analysis to examine the concept of local equity participation to local companies regulated by UU 17 of 2003, PP 58 of 2005, Permendagri No. 52 of 2012, Perda No. 6 of 2006, Perda No. 10 of 2008, Perda No. 26 of 2010 as compared with the implementation of local equity participation to local company PDAM Tirta Mahakam case.
H. RESULTS PDAM Tirta Mahakam care coverage in 2012 may reach 52% of the total population. While the scope of services for the administration area of 49.39 % of the total population of 620 388 inhabitants in 2011, it is still below the target RPJMN of 62.5 % in 2011. The company’s range capabilities to serve a wide population depends on the financial support of the local government. Thus financial to support the development of supporting infrastructure improvement and development of water services.
In 2006 the local water company Tirta Mahakam acquires equity of Kutai Kartanegara regional government of Rp. 10,000,000,000 as outlined in the Regional Regulation No. 6 of 2006 on Regional Equity to In Water Company. This capital must be returned in stages at each end of the year which amounted to 500,000,000 (five hundred million rupiah ) paid in cash to the region with year payback period 2007-2026. Vendor's 2008 re-acquire government equity Kutai Kartanegara regency of 15.000.000.000, - (fifteen billion rupiah) as set forth in Local Regulation No. 10 of 2008. This fund was used for the construction and development increased PDAM Tirta Mahakam. Liability company against equity is equal to the duty on capital investment in 2006. Repayments are made at each end of the year amounted to Rp. 500.000.000, - (five hundred million rupiah) beginning in 2009-2038. By 2011 PDAM Tirta Mahakam re-acquire equity participation of local governments amounted to 25.000.000.000, - (twenty five billion rupiah) as outlined in the local regulation No. 26 of 2010. Equity is different from previous years, because there is no

ISSN 2302-786X
170 Proceeding of Annual South East Asian International Seminar (ASAIS) 2013
obligation PDAM Tirta Mahakam equity returns as in previous years.
I. DISCUSSION Based on the nomenclature titles of Perda No. 6 of 2006 and Perda No. 10 of 2008 is the Regional Equity to PDAM Tirta Mahakam , then understanding Permendagri No. 52 of 2012 is the area of capital investments in the form of money which is a form of local government investment on PDAM Tirta Mahakam with intent gets tenure. So the local government capital investments on local property is the transfer of ownership of the property of the original area is not separated into wealth separated to count as capital/ tock area at the locally-owned enterprises PDAM Tirta Mahakam.
In effect the capital investment area is to increase the income of local and regional economic growth and welfare of the community is expected to further increase. So Kutai Kartanegara government equity participation to PDAM Tirta Mahakam in 2006 and 2008 should be a direct investment or investment area on an ongoing basis without any intention of merchantability or withdrawn; aiming to Improve services and clean water or drinking water to the public; Encouraging economic growth areas, and to contribute to local revenue (PAD); Improving infrastructure PDAM Tirta Mahakam Tirta Mahakam, increase water service coverage, increase continuity, quality and quantity and increase the performance of PDAM Tirta Mahakam. The results showed a discrepancy of meaning ' equity is defined as lending to local governments PDAM Tirta Mahakam, so the impact on liability return on invested capital to the PDAM Tirta Mahakam. This is in contrast with the
recognition and treatment of equity to PDAM Tirta Mahakam area in 2011, the title of local regulations on capital investment has been interpreted as a direct investment in the local government equity. Kutai Kartanagera regency has three local regulations with the same name but different treatments and recognition.
Reimbursement of local government capital invested to PDAM Tirta Mahakam can affect to the performance of the company Tirta Mahakam itself, because every end of the year should return 500 million dollars of capital investment in 2006 and 500 million dollars of capital investment in 2008 . So total liabilities each year to deposit cash into the region of 1 billion dollars. The refund is large enough in the midst of efforts that still continue to clean OFF doing improvement and development of water services in order to reach more than 60 % of the population as required by the Millennium Development Goals by 2015. This difference resulted in confusion in the internal management of the company in the prioritization of funding between public service policy or equity obligation to repay back the region of 500 million dollars from 2007 until 2026.
Therefore, to maintain the achievement of goals and objectives to the local equity PDAM Tirta Mahakam necessary to revise Perda about the Regional Equity to PDAM Tirta Mahakam that can accommodate differences in the treatment of ' regional equity '. All must be returned in the correct context and concepts in the area of capital investment to regional companies according to the rules.

ISSN 2302-786X
Proceeding of Annual South East Asian International Seminar (ASAIS) 2013 171
6. CONCLUSION The conclusion that can be drawn from the case of equity Kutai district to OFF Tirta Mahakam are:
a. The existence of PDAM Tirta Mahakam not solely for profit, but to help the local government in serving the needs of clean water.
b. Investment in the capital region to PDAM Tirta Mahakam is hoping to secure direct investment dividends in the form a loan with repayment obligations.
c. There should be only one treatment that regional investment directly PDAM Tirta Mahakam into the wealth of separated and not a loan or grant.
7. ADVICES To three local regulations on equity into the local water company should be revised. 8. REFERENCES [1] Anonymous, Republic of
Indonesia, Law No. 17 of 2003 on State Finance (State Gazette of the Republic of Indonesia Year 2003 Number 47, Supplement to State Gazette of the Republic of Indonesia, No. 4286)
[2] Anonymous, Republic of Indonesia, Government
Regulation No. 58 Year 2005 on Regional Financial Management ( State Gazette of the Republic of Indonesia Year 2005 Number 140, Supplement to State Gazette of the Republic of Indonesia Number 4578 ).
[3] Anonymous, Republic of Indonesia, Permendagri No. 52 Year 2012 on Guidelines for the management of local government investment ( State Gazette of the Republic of Indonesia Year 2012 No. 754).
[4] Anonymous, Kutai Regency Regulation No. 6 of 2006 on Regional Equity to In Local Drinking Water Company Tirta Mahakam Kutai regency (Kutai District Gazette 2006 No. 6 )
[5] Anonymous, Kutai Regency Regulation No. 10 Year 2008 on Regional Equity to In Local Drinking Water Company Tirta Mahakam Kutai regency ( Kutai District Gazette Year 2008 No. 10 ).
[6] Anonymous, Kutai Regency Regulation No. 26 Year 2010 on Regional Equity to In Local Drinking Water Company Tirta Mahakam Kutai regency ( Kutai District Gazette of 2010 No. 10
[7] Edwin, J.E., et.all, 2009. Modern
Portfolio Theory and Investment Analysis, Publisher Wiley, 8 edition

ISSN 2302-786X
172 Proceeding of Annual South East Asian International Seminar (ASAIS) 2013

ISSN 2302-786X
Proceeding of Annual South East Asian International Seminar (ASAIS) 2013 173
Performance Based Budgeting Models: Case Study At State Polytechnic of Malang
Atika Syuliswati
Accounting Department, State Polytechnic Of Malang Jl.Soekarno-Hatta No.09, PO.BOX 04 Malang 65141
Email: [email protected]
Abstract
Over the past decade, there has been a significant and consistent worlwide reform agenda for higher education financing policy especially implementation Performance Based Bugeting (PBB) as public service board. The aim of this research is to explain the models of PBB of at state polytechnic of Malang. The inclusion of PBB is intended to improve the connectivity between planning and the achievement of outputs and outcomes and also improve the effectiveness and efficiency. Based on qualitative research, the technique of collecting data was done by observation, interview, and documentation study. Finding of this research showed that the models of PBB are strategic goal from ministry of national education, determine program and activity and measure it with performance indicators, determine the output and outcomes with appropriate efficiency and effectiveness examine output cost with cost standard, examine the implementation of outputs and outcomes with performance evaluation. The process of PBB are planning, implementation, performance measurement and evaluation, and reporting. Keywords: public service board, performance based budgeting, case study 1. INTRODUCTION
The current reform of public financial management in Indonesia began after the regional financial crisis of 1997-2000 and resulted in key legislation being passed in 2003 and 2004 with the intent that these would be implemented for the current long-term plan beginning in 2005. The Indonesian government has launched a reform in the financial sector of the country. Mardiasmo (2005) mentions that the reforms in the financial sector include the following five areas: financing reform, budgeting reform, accounting reform, audit reform, and financial management reform. One form of budgeting reform is the implementation of Performance Based Budgeting.
The main problem of budgeting is the emphasis given to the input rather than achievement of outputs and outcomes, it is traditional approach, allocation based on the concept of incremental expenditure is not based
on performance to be achieved so that it raises inefficient allocation. These problems require solutions, Performance based budgeting (PBB) is introduced to create connectivity between the funding resources and the expected outputs and outcomes (effectiveness), as well as efficiency in producing the outputs and outcomes. PBB is the system output oriented budgeting and organization are closely related to the vision , mission and strategic plan of the organization (Bastian, 2006). PBB approach emphasizes the concept of value for money and performance monitoring of output. PBB designed to overcome the weakness in the traditional budget, particularly the weakness caused by benchmark that can be used to measure performance in achieving the goals and objectives of public services (Haryanto, 2007).
Budgets are not effective and are not performance oriented will be able to threat the plans that have been prepared. Sustainable performance

ISSN 2302-786X
174 Proceeding of Annual South East Asian International Seminar (ASAIS) 2013
measurement will give you feedback, so that continuous improvement efforts will achieve success in the future (Bastian, 2006). Although the Indonesian government has mandated performance-based budgeting, but until now has not been full implemented and in practice still formalistic. Finance Minister Sri Mulyani Indrawati in 2009 recognizes the consequences of the application of performance based budgeting is not easy. Many countries have tried, but many do not succeed. According to her, the implementation of performance based budgeting is not trivial, some country need ten years.
The legal basis for applying Performance-Based Budgeting (PBB) in Indonesia is given in Law 17 (2003) on State Finance, Law 1 (2004) on State Treasury, Law 15 (2004) on Inspection of the Management and Accountability of State Finances, Law 25 (2004) on National Development Planning System, Government Regulation 21 (2004) on Guidelines for the Formulation of Work Plans and Budgets of State Ministries/Agencies (RKA-KL), and Regulation 20 (2004) on Government Work Plans. In general, these regulations confirm that higher education as public service board (BLU) model must implement PBB system. State polytechnic of Malang, as one of the higher education in Indonesia determined to improve services to the public in order to promote the general welfare and national life. To achieve this, In 2012, With SK No.58/KMK.05/2012 from Ministry of Finance, Polinema official status as a full BLU .
Based on this, the title of the research is Performance Based Budgeting Models: Case Study At State Polytechnic Of Malang (Polinema).
The research problem is how performance based budgeting models at Polinema. The aim of this research is to explain the models of PBB at Polinema. This research is expected to theoretical and policy contribution. Theoretically, the research results can be explained the PBB models of public service Polinema. For state polytechnic of Malang and the government, this study provides information about the PBB models of public service board that has been done by POLINEMA (either at central and department level) so that it can be used as an evaluation of the current implementation.
2. THEORY Budget by Salvatore Schiavo-Campo in his book Managing Government Expenditure (1999): the word "budget" comes from budjet, which means the king bag containing the money for the payment of public interest. Budget comes from the word budget (UK), formerly of the bougette (French) which means that a small bag. State budget by John F. Due to "Government Finance and Economic Analysis ": The budget is generally defined financial plan for a given period.
According to Wildavsky, budgets are: (i) the past record, (ii) future plans, (iii) resource allocation mechanisms, (iv) methods for growth; (v) the income distribution tool; (vi) mechanisms for negotiation; (vi) expectations-aspiration organization, (vi) the form of the power of control, and (vii) equipment or network communication. According to Freeman (2003), budget is a process allocating resources to unlimited demands. From that meaning budgeting has a strategic role in wealth management for public organizations. Organization is

ISSN 2302-786X
Proceeding of Annual South East Asian International Seminar (ASAIS) 2013 175
certainly provide excellent services to the public, but constrained by limited resources (Deddi Nordiawan: 2006).
Robinson and Brumby (2005) define performance budgeting as procedure and mechanism that are intended to strengthen the link between funding provided to public sector entity with outcome and output entity through the use of formal performance information in resource allocation decisions. Not different meaning given by Shah and Shen (2007), which is budgeting system that serves the goals and objectives for what fund is needed, the cost of proposed programs and activities related to achieving these goals, as well as output produced or services rendered on each program.
Meanwhile, Robinson and Last (2009) stated performance based budgeting aim to improve the efficiency and effectiveness of public expenditure by linking the funding of public sector organization with the result achieved by the systematic use of performance information. Carter (1994) as quoted by Young (2003), states use the budget performance of the mission statement, goals and objectives to explain why the money is spent. Determination of the mission, goal, and objective to explain why money is spent. Determination of the mission, goal, and objective is a way to allocate resources to achieve specific objectives based on program, output and outcome measured. PBB is distinguished from traditional approach, PBB focuses on result of the expenditure made, rather than the amount of money spent.
From the meaning that stated before, can be concluded that PBB is a systematic budgeting approach that link expenditure to public sector
organization with the result performance using performance information. PBB allocate resources to the program, not only organizational unit, and use the output as indicator of organizational performance measurement. In line with the definition, Robinson and Last (2009) stated the basic requirement in the application of simple form PBB are information about objective and outcome government spending especially performance indicators and evaluation of simple program and budgeting process that designed to facilitate the use of information.
Hou (2010) suggest that design of PBB based on the notion that include performance measure will facilitate the monitoring of the program to see how government achieve outcomes that has been promised before. Young (2003) stated four characteristics of PBB. First, set a goal that associated with allocate spending money. Second, provide information and data about the performance and result that have been achieved. Third, adjustment has been made to cover the difference between performance target and actual performance. Fourth, PBB provide an opportunity for regular evaluation of performance or use for decision making.
3. METHODOLOGY This research was conducted within qualitative method and the framework of phenomenology paradigm. Qualitative method is describe the phenomenology of budgeting with an understanding of performance budgeting models at state polytechnic of Malang. Consider to the value, culture, norm, and organizational structure. With phenomenology approach we can understand the response of human existence or community as well as the experience

ISSN 2302-786X
176 Proceeding of Annual South East Asian International Seminar (ASAIS) 2013
through interaction with others (Sri Rahayu, 2006). Consideration the use of phenomenological approach is that budgeting process is a social phenomenon that develop with social interaction between various object.
Based on qualitative research, the technique of collecting data was done by observation, interview, and documentation study. Observation about condition, resources, budgeting process from planning, implementation, reporting and the budgetary constraint and other conditions that can support the research. This method using in depth interview to get information about actual condition. The key informan of this research are director, deputy director II, head of department, and staff in handling budget. Document required in the performance based budgeting are state polytechnic profile include vision, mission, organizational structure, human resources, facilities and infrastructure. Budgeting document is the most important document needed.
The data analysis consist of (1) data from interview, observation, and
documentation organized based on similarities and differences in accordance with research questions, (2) determine theme from data that has been organized (3) looking linkages between themes, (4) interpretation of findings in accordance with relationship between theme using relevant theory, (5) the result outlined in the descriptive and analytical context. Data validation done by using triangulation methods, data sources, and the data itself. (a) triangulation method by combining interviews with direct observation, (b) triangulation by using different informant for cross checking and tracing secondary data. (c) triangulation data by restoring the data compilation and interpretation of data to the informant, to get feedback, correction of errors and avoid subjectivity researchers.
4. ANALYSIS AND DISCUSSION
Result of data analysis in table 4.1. Data from interview, documentation, and direct observation is organized. Next step is categorization, coding based on research question, and find theme.
Table 4.1 Data Analysis
Triangulasi Theme
Information From Interview
Interview Code Data
Activity have clear output AMR 101 Understand the meaning of performance budgeting
Usage based on performance IPG 101 Activity have output, supporting data and target MCL 101 Activity with clear orientation Al 101 Budget plan in which clear performance targets PHD 101 Shoping list budgeting MN 201 Renja, RBA,
and RSB Document
Performance planning Make a plan first then connected to RSB IPG 201
Doing activities then connected to the new strategic plan
PHD 201
Plans are evaluated at Raker AH 201 Unclear quota MCL 201 Determination of income and expenditure together
MN 202 RKAKL and RBA Document
Budget implementation
Determination of SPM and SOP AMR 201 Execution deviates from plan AMR 202 Implementation deviant, difficult financial MN 203

ISSN 2302-786X
Proceeding of Annual South East Asian International Seminar (ASAIS) 2013 177
Triangulasi Theme
Information From Interview
Interview Code Data
process Unknown activity performance MCL 202 LAKIP, RBA
Document Performance measurement
Much money is not for output performance IPG 202
Lack of control and evaluation PHD 202
LAKIP, RBA Document
Performance evaluation
Achievement of the strategic plan performance evaluated
PHD 201
SPI has not been effectively running AMR 204 Performance report is well prepared MN 201 LAKIP, RBA
Document Performance report
Sources: Interview Result
The conceptual basis of PBB follows a logical framework, with four key principles. The first principle “Money Follows Function, Function Follows Structure” means that the budget will be allocated to fund an activity which is based on the duty and function of a work unit. Tying an activity and performance measures to the duties and functions of a particular unit within the organization ensures that no duty or function of the organization is omitted from the plan and none is duplicated. At the same time it ensures that delivery of the output and related outcomes are the responsibility of that work unit.
The second principle “Let the Manager Manage” means that the manager of the work unit should have a fair degree of flexibility on the methods of implementation in order to
achieve the outputs and outcomes specified for that work unit and activity. With that comes also the third principle “Accountability” which implies that likewise the units will be held accountable for delivering the outputs and achieving the efficiency and effectiveness implied by the related indicators. The fourth principle covers the link between top-down planning and bottom-up implementation the policy and planning objective is achieved through authorizing the activity to a work unit with appropriate duties and functions, and the work unit is given the budget with which to achieve the outputs and outcomes with appropriate efficiency and effectiveness.
The PBB Models illustrated in figure 4.1.

ISSN 2302-786X
178 Proceeding of Annual South East Asian International Seminar (ASAIS) 2013
Figure 4.1 Performance budgeting Models Sources: Interview result
The PBB structure is formulated through three components: (1) Performance Indicator, a tool to measure the success of a program or activity. The Main Performance Indicator of Program (IKU Program) relates only to the program at Director level, and is the main measure by which the government will assess the performance of the agency. The Activity Performance Indicators (API or IKU Kegiatan) relate only to an Activity at Deputy Director and head of department these are used in assessing the work unit’s achievement of output against the budget and plan. Finally Output Indicators relate only to a sub-output or Stage of an Activity these are used internally in the ministry/agency to manage the performance of all parts of the budget execution process and to improve their efficiency and effectiveness. (2)
Cost Standard applied as a measure of output cost, initially in approximate form for preliminary planning to link budget to outputs. A General Cost Standard (SBU) is standardized across state ministries and or across regions (such as salaries or administrative costs). A Special Cost Standard (SBK) is an average or unit cost for a specific ministry or region. (3) Performance Evaluation is conducted by a Director to provide feedback for improving the quality of performance of its Program. The performance of each Work Unit (deputy director or head of department) is assessed in terms of efficiency (budget per unit output) and effectiveness (method of implementation and quality of outputs and outcomes) so as to identify opportunities for improving performance.
Ministry
Director
Deputy Director , Department
Strategic Goals
Program
Activit
Ministry’s outcome
Outcome Program Key Performance Indicators
Activity Performance Indicators
Stages Stages
Input Input Input
Output
Sub output Output Indicators
This part is the detail implemented action to produce output with the needed budget allocations

ISSN 2302-786X
Proceeding of Annual South East Asian International Seminar (ASAIS) 2013 179
The formulation of the Program also differs from the approach used previously. The Vision is expected to be a forward-looking stimulating goal which is not likely to change much from one 5-year plan to the next. The Mission is a statement of what needs to be done to achieve the vision and has some focus on the particular actions needed during this specific five-year period and the target of what will be achieved by the end of the five-year period. This links to the Strategic Targets which describe something that will be produced during the five-year term and can be allocated in annual intermediate periods, and which links to the Mission and strategic objectives of the ministry. Typically Polinema would have only one Strategic Target reflecting its mission statement and the primary goal of the five-year period, which would complement the Strategic Targets for other under the ministry.
A Program represents the effort needed, using available resources through a series of Activities, to implement a ministry policy in line with the main duties and functions of the unit. Polinema can have only one Program and can only support one Strategic Target. An Outcome reflects the result of the outputs under the Program, and can support only one Strategic Target. The detail of results coming from different activities under
the Program is represented through a series of 3 to 5 Program Main Performance Indicators (Program IKU). The Program IKU reflect the superiority of Program performance through measures of efficiency, effectiveness, customers or outcomes, are connected to the Strategic Target, and reflect the functions of the Director level.
An Activity is the part of a Program that is implemented by an Deputy Director and Head of Department and comprises a group of Actions which use resources, such as personnel tools and funds, to produce an output in the form of goods or services. The name of the Activity should reflect the duties and functions of the work unit, should show connectivity to the Program and should have clear measurable outputs. The Activity Output is in the form of goods or services produced by the Activity, and is a phrase which reflects the duties, functions and performance targets of the work unit and is measurable by the indicators. Activity Performance Indicators are measures of the quantity, quality or price of the activity outputs. Output Indicators are quantitative parts of the Activity output which are spelled out as budget heads in the work program of an Deputy Director and Head of Department thus they form the various parts of the work needed to produce the activity.

ISSN 2302-786X
180 Proceeding of Annual South East Asian International Seminar (ASAIS) 2013
Figure 4.2 Performance Budgeting Process
Sources: Interview Result
Performance Based Budgeting Process at State Polytechnic of Malang ilustrated in figure 4.2 and described at the following (1) Performance Planning is the basis for the application of performance based budgeting. Performance indicators defined and determined in accordance with the performance of the information desired by the organization. (2) Budget Implementation is execution process of realizing what is already planned in the planning documents. Budget execution is closely related to minimum service standards (SPM) and Standard Operating Procedures (SOP). (3) Performance Measurement is an objective and systematic process of collecting, analyzing and using the information to determine how effective and efficient the activities and objectives are achieved. To measure how effective the programs and activities, define the outcome (result) of the program to be achieved first. The next step is measure the
performance of programs related with result achievement and report the results to decision maker based on the information provided. Performance measurement to assess the success or failure of a work unit.
(4) Performance Evaluation is assess the activity or the success and failure of public managers in the activities and functions entrusted to him as the vision and mission of the organization. Performance evaluation is a continuation of the performance measurement activities, so that the evaluation should be based on the performance measures and indicators that have been agreed and set. Performance evaluation is also feedback on the results of the current and past performance as a basis and lesson to improve future performance. (5) Performance Reporting in government institution, in the form of performance reports compiled in Performance Accountability Report in Government Institution or commonly
Coordination meeting with DIKTI
Quota
DIPA 2013
Initial Coordination
Revised draft
Planning of programs, activities, and budget
Discussion with Kanwil
RKAKL Discussion with DJA
RKAKL draft
Compiling the proposed program
and budget
Renja Draft

ISSN 2302-786X
Proceeding of Annual South East Asian International Seminar (ASAIS) 2013 181
known as LAKIP. LAKIP is one of accountability form as a presidential instruction through Inpres No. 7 of 1999 on performance accountability of government institution. Reinforced by LAN No 239/IX/6/8/2003 in March 25, 2003 on guidelines for the preparation of government accountability. Polinema already made a statement in the form of LAKIP. LAKIP made by each work unit and compiled at the central level by the Planning and Information Systems division.
5. CONCLUSION The models of Performance Based Budgeting are strategic goal from ministry of national education, determine program and activity and measure it with performance indicators, determine the output and outcomes with appropriate efficiency and effectiveness examine output cost with cost standard, examine the implementation of outputs and outcomes with performance evaluation. The process of PBB are planning, implementation, performance measurement and evaluation, and reporting
6. BIBLIOGRAPHY [1] Anonimous 2003, Undang -
Undang No.17 tahun 2003 tentang Keuangan Negara.
[2] Anonimous 2003, SK LAN Nomor: 239/IX/6/8/2003 tentang Pedoman Penyusunan Pelaporan Akuntabilitas Kinerja Instansi Pemerintah.
[3] Anonimous 2004, Undang - Undang No.1 tahun 2004 tentang Perbendaharaan Negara.
[4] Anonimous 2004, Undang-undang No.15 tahun 2004 tentang Pemeriksaan Pengelolaan dan Tanggungjawab Keuangan Negara.
[5] Anonimous 2004, UU No.25 tahun 2004 tentang Sistem Perencanaan Pembangunan Nasional.
[6] Anonimous 2004, Peraturan Pemerintah RI Nomor 20 Tahun 2004 tentang Rencana Kerja Pemerintah (RKP).
[7] Anonimous 2004, Peraturan Pemerintah RI Nomor 21 Tahun 2004 tentang Penyusunan Rencana Kerja dan Anggaran Kementrian Negara/Lembaga(RKAKL).
[8] Anonimous 2008, Peraturan Menteri Keuangan RI No. 102/2008 tentang Petunjuk Penyusunan dan Penelaahan Rencana Kerja dan Anggaran Kementrian Negara/Lembaga(RKA-KL) serta Penyusunan, Penelaahan, Pengesahan dan Pelaksanaan Daftar Isian Pelaksanaan Anggaran (DIPA).
[9] Bambang Sancoko, 2008, “Kajian terhadap Penganggaran Berbasis Kinerja di Indonesia”, Badan Pendidikan dan Pelatihan Keuangan, Departemen Keuangan RI.
[10] Deddi Nordiawan, 2006, Akuntansi Sektor Publik, Penerbit Salemba Empat Jakarta.
[11] Haryanto, Sahmuddin, Arifuddin, 2007, Akuntansi Sektor Publik, Semarang: Badan Penerbit Universitas Diponegoro.
[12] Hou, Yilin., Lunsford, R. S., Sides, K. C., and Jones, K.A, 2010, State Performance-Based Budgeting in Boom and Bust Years: An Analytical Framework and Survey of the States. Public Administration Review, 5/6, 370-388.

ISSN 2302-786X
182 Proceeding of Annual South East Asian International Seminar (ASAIS) 2013
[13] Indra Bastian, 2006, Akuntansi Sektor Publik, Jakarta: Erlangga.
[14] Mardiasmo, 2002, Akuntansi Sektor Publik, Yogyakarta:Andi.
[15] Mirna, Ali, Unti, Pengembangan Sistem Anggaran Dan Akuntansi Bdan Layanan Umum Universitas Brawijaya: Sebuah Studi Interpretif, Universitas Brawijaya.
[16] Moleong, 2007, Metodologi Penelitian Kualitatif, Bandung: Remaja Rosdakarya.
[17] Robinson, M., & Brumby. J, 2005, Does Performance Budgeting Work? An Analytical Review of The Empirical Literature, IMF Working Paper.
[18] Robinson, M., and Last, D, 2009, A Basic Model of Performance-Based Budgeting, IMF Technical Notes and Manuals 09/01, IMF, Washington, DC.
[19] Salvatore Schiavo Campo and Daniel Tommasi, 1999, Managing Goverment Expenditure :Asian Development Bank.
[20] Shah, Anwar and Chunli Shen, 2007, Citizen-Centric
Performance Budgeting at the Local Level, Public Sector and Governance and Accountability Series: Local Budgeting, World Bank.
[21] Sri Rahayu, 2007, “Studi Fenomenologis terhadap Proses Penyusunan Anggaran Daerah (Bukti Empiris dari Satu Satuan Kerja Perangkat Daerah di Propinsi Jambi)”, Simposium Nasional Akuntansi X.
[22] Sugiyono, 2008, Memahami Penelitian Kualitatif, Bandung: Alfabeta.
[23] Widyantoro Ari Eko, Implementasi Performance Based Budgeting: Sebuah Kajian Fenomenologis (Studi Kasus pada Universitas Diponegoro), Universitas Diponegoro.
[24] Young, Richard D, 2003, Performance-Based Budget Systems, Public Policy and Practice, Institude for Public Service and Policy Research, University of South Carolina.

ISSN 2302-786X
Proceeding of Annual South East Asian International Seminar (ASAIS) 2013 183
Studying the Significance of Marketing Category Business Award on Brand Owner Companies in Indonesia: The Implication on
Corporate Reputation and Marketing Performance
Sylvia Rozza State Polytechnic of Jakarta
email : [email protected]
Abstract
Currently, Indonesia is bestowing many kinds of awards, particularly business awards for profit motive companies. Marketing category business award is one of the earliest business awards that has been bestowed. As far as the researcher’s knowledge, academic research on significance of the award on corporate reputation and marketing performance has not yet been conducted. Marketing category business award is a Market-Based Asset (MBA). MBA is an advancement of Resource-Based Theory (RBT). Award is an intangible marketing resource and can generate competitive advantage for a company. Marketing Category Business Award can be a relational and intellectual market-based asset in the MBA context. In relation with Signaling Theory, the award can do the role of an agent that solves the information asymmetry between the company and stakeholders. The significance of award is measured by corporate reputation and customer loyalty in the form of attitudinal and behavioral loyalty as the best measures for investment outcome on marketing resources, and the most used nonfinancial measures in marketing performance. Award is conferred to the superior brands of a company. Award generates corporate reputation. It means that award is an antecedent of corporate reputation. The brand equity of the awarded brands moderates the effect of award on corporate reputation. It also directly influences corporate reputation. Brand equity reflects customer satisfaction and trust in superiority of a brand. Corporate reputation will create customer loyalty either in attitudinal or behavioral loyalty. This research is to close the gap: 1. Nonexistence of research on the impact of marketing category business award as a relational and intellectual market-based asset on corporate reputation and marketing performance of awarded brands. 2. Nonexistence of research on the role of brand equity as a moderating variable and a variable that directly influences the effect of marketing category business award as a relational and intellectual market-based asset on corporate reputation. 3. Nonexistence of research on the role of marketing category business award as a relational and intellectual market-based asset as an agent or communication media between company and stakeholders. Research objectives are to know: 1.How is the influence of marketing category business award as relational and intellectual market-based asset on corporate reputation? 2. How is the influence of marketing category business award as relational and intellectual market-based asset on corporate reputation when moderated by brand equity? 3. How is the influence of brand equity of marketing category business award recipient on corporate reputation? 4. How is the influence of corporate reputation on attitudinal and behavioral loyalty? A Brand awarded by ICSA award (Indonesia Customer Satisfaction Award) from SWA magazine and a brand awarded by TOP Brand award from MARKETING magazine are the unit of analysis. Customers of those brands are the subjects of the research. This research will be conducted by a survey and SEM (Structural Equation Modeling) as a statistics tool in the analysis. Key Words: marketing category business award, relational market-based asset, intellectual market-based asset, brand equity, corporate reputation, marketing performance, attitudinal and behavioral loyalty 1. INTRODUCTION So far, researchers have not found research on the significance of marketing category business award as a relational market-based asset and an intellectual market-based asset for the company's marketing performance of
brand owners in Indonesia. Research on the significance of many business awards made in America and Europe and published in journals is the significance of the quality award, which is generally associated with the award-winning company's financial
ISSN 2302-786X
184 Proceeding of Annual South East Asian International Seminar (ASAIS) 2013
performance (eg Lawrie, and Schulver 2000; Davis and Stading 2005; Hendricks and Singhal 1996; Hansfield, Ghosh, and Fawcett 1998; Jacob, Honey, and Tang, 2004; Balasubramanian, Mathur and Thakur 2005; Dror 2008; Leonard 2006; Levine and Toffel 2010).
Then, this research is to close the theoretical gap which cannot be known before that there was a study measuring how the influence of marketing category business award as relational and intellectual market- based assets on the company's reputation or award as an antecedent of corporate reputation (Taylor, 1997; Miles and Covin 2000; McDonald, et al., 2002; Daniels, 2002; Balasubramanian, et al. 2005; Dror 2008). In other words, research on the impact of this award has not yet been conclusive. Further, this research will measure the effect of corporate reputation on marketing performance in the form of attitudinal and behavioral loyalty.
Award is given to brands that compete in different markets. So the award will be given to brands that have different brand equities. Award will interact with the brand equity in influencing the company's reputation. The researcher suspects that the strength of the effect of award on the company’s reputation is influenced by the brand equity of award recipients. In other words, brand equity is a variable that would moderate the effects of award on the company's reputation. As far as researcher’s knowledge, it has not been yet known how brand equity can distinguish the power of the influence of award on the company's reputation. Strong brand will affect the company's reputation more positively. Brand is the core component and vital to a
company's reputation (Ying Fan, 2005: Smith, et al., 2010). Strong brand equity will create customer satisfaction, increasing customer confidence (trust) to the brand where customer satisfaction and trust are antecedents of company's reputation from the customer point of view (Walsh, et al., 2009). Basdeo, et al., (2006) stated that the corporate reputation is affected by the actions of a company and its competitors such as creating a strong brand for customers. Then, brand equity of award recipients will also be an antecedent of corporate reputation. Only few studies that measure the impact of brand equity on corporate reputation (Ying Fan, 2005).
In addition, this research is to understand the role of the award as a marketing agent that can deliver market information and can be able to meet and satisfy stakeholders in the context of Signaling Theory (Spence, 1973, 1974). Research in this topic has yet to be found. Award in this case serves as a medium of communication that will eliminate asymmetric information. Award can perform signaling or communicating a company's reputation to the key stakeholders (Kiousis, Popescu and Mitrook, 2007). That is, how the award can perform the role of the agent is a theoretical gap.
2. THEORY Market-based asset (MBA) is an advancement of Resource-Based Theory (RBT) (Srivastava et al., 2001; Kozlenkova, et al., 2013; Wernerfelt, 2013). MBA is an off-balance sheet intangible asset, and an intangible organizational attribute that can be owned, created, nurtured, and empowered for the purpose of internal (organizational) and external (market) ( Barney, 1991; Hunt & Morgan,

ISSN 2302-786X
Proceeding of Annual South East Asian International Seminar (ASAIS) 2013 185
1995; Mahoney & Pandian, 1992; Srivastava, Shervani & Fahey, 1998). These assets are the result of company's interaction with stakeholders such as consumers/customers, suppliers or competitors (Srivastava, et al., 2001). There are two types of these assets such as relational market-based asset and intellectual market-based asset (Srivastava et al., 2001; Reibstein, Srivastava and Joshi, 2006). Relational market-based assets are assets as a result of corporate relationships with external stakeholders such as the distribution channels, customers, networks and ecosystems, strategic partners, providers of goods and services, as well as the outsourcing agreement created by marketing activities (Best, 2005; Reibstein et al., 2006; Srivastava et al., 2001). The importance of these relationships for companies in marketing practice has been demonstrated by the establishment of relationship marketing as the dominant focus of the theorists and practitioners of marketing (Sheth & Parvatiyar, 1995). Relational market-based asset is the result of trust and reputation. This intangible asset is difficult to measure. It is only available outside the company and is not owned. Intellectual market-based asset is the type of knowledge of the company either individually or in units in the competitive environment inside and outside the company and how to interact with the customer to get a higher quality market data as well as the knowledge to interconnect parts of process-based capabilities such as customer relationship management (CRM) skills (Best, 2005; Reibstein et al., 2006; Srivastava et al., 1998, 2001).
In accordance with Signaling Theory (ST), when applied in the context of marketing, the award is an agent, media or marketing organization that conveys important information about market, products, or services for customers and/or other parties in the market. This agent or marketing organization uses a particular marketing communication means to expose or give signals about a particular issue, product, or service to the market as a form of market positioning and market segmentation, basically using the principle of Signaling Theory (Hult 2011).
Walsh and Beatty (2007: p. 129) defines corporate reputation from the customer's perspective as: "The customer 's overall evaluation of a firm based on his or her reactions to the firm 's goods, services, communication activities, interaction with the firm and/or its representatives and/or known corporate activities "
Yoo and Donthu, (2001) defines brand equity as the differential responses of consumers towards a good brand compared to the unbranded product when marketing stimuli and both have the same attributes.
Two forms of customer loyalty are attitudinal loyalty and behavioral loyalty (Jacoby and Chestnut, 1978). Attitudinal loyalty and behavioral loyalty are important to know the customer spending behavior in the past and prediction of future expenditures (Dick & Basu, 1994). Customers with attitudinal loyalty will show the level of consumer psychological attachment to a brand/specific product (Chaudhori & Holbrook, 2001). While customers with behavioral loyalty will show

ISSN 2302-786X
186 Proceeding of Annual South East Asian International Seminar (ASAIS) 2013
repeat purchases of the same brand continuously, the proportion of purchase of the brand, purchase order (sequence) and number of brand switching among consumers in the
product category (Palmer, McMahon-Bettie & Beggs, 2000; Shukla, 2004).
Based on theories above, the research model is as follow:
Hypothesis of this research are:
1. Marketing category business award as relational and intellectual market-based asset positively influence corporate reputation.
2. Brand equity moderates the effect of marketing category business award as relational and intellectual market-based asset on corporate reputation.
3. Brand equity positively influences corporate reputation.
4. Corporate reputation positively influences attitudinal and behavioral loyalty.
3. METHODOLOGY This research is a descriptive study aimed to measure the significance of
the marketing category business award as relational and intellectual market-based assets at the brand owner company in Indonesia. This research examines the implications of the award on company's reputation and marketing performance of the brand owner company in the form of attitudinal and behavioral loyalty. Information needed for this research is primary data that will be collected through a survey in a cross sectional study. The population consists of all customers of award-winning product “Rinso” detergent as the winner of ICSA award a marketing category business award from "SWA" magazine and So Klin detergent as the winner of TOP Brand award a marketing category business award from "MARKETING" magazine in Indonesia. "Rinso" detergent is a brand of PT Unilever Indonesia Tbk
Marketing Category Business Award as MBA Marketing
Performance
Control Variable
Name of Award
Award as Relational
Market-Based Asset
Award as Intellectual
Market- Based Asset
Brand equity
Corporate Reputation
behavioral loyalty
attitudinal loyalty
Award duration
ISSN 2302-786X
Proceeding of Annual South East Asian International Seminar (ASAIS) 2013 187
and "So Klin" detergent is a brand of PT. Lion Wings. Both brands have been receiving these awards for a minimum of 7 and 5 years consecutively. Number of subjects as sample will take 220 customers and being customers at least one (1) last
year. Customer is a decider (decision-maker) as one type of roles in the purchase of consumer products (consumer buying decision role). The roles are initiator, influencer, decider, buyer and user (Kotler, Armstrong, 1996). Researcher uses a LISREL 8.8 program with SEM method (Structural Equation Modeling) as a measuring tool.
4. ANALYSIS AND DISCUSSION
Marketing categories business award won by the company, is an intangible marketing resource and one form of market-based assets as an extension of RBT (eg Barney, 1991, 2001; Wernerfelt, 1984, Srivastava, et al., 2001; Wernerfelt, 2013; Koslenkova et al., 2013). This award is also an antecedent that
will create the reputation of the company (Taylor, 1997; Miles and Covin 2000; McDonald et al., 2002; Daniels., 2002; Balasubramanian, et al., 2005; Dror 2008). Marketing category business award can be a relational market-based asset. The brand receives this award is a brand that delivers superior customer satisfaction, as the result of a close relationship (intimate relationship) between the company and stakeholders based on the confidence (trust) and reputation.While marketing category business award as an intellectual market-based asset is held by a brand which was considered superior by customers than rival brands as a result of the company's
knowledge and understanding of the competitive environment (eg. Srivastava et al., 2001). Definition of corporate reputation from the customer perspective by Walsh and Beatty, (2007) is a comprehensive evaluation of a company based on customer reaction to products, services, communication activities, interaction with the representation of the company and/or the company's known activities. Then the award as relational and intellectual market-based assets will positively affect the company's reputation as a result of customer satisfaction and confidence (trust) toward the brand as corporate reputation antecedents (Walsh & Beatty, 2007).
Marketing category business award in conjunction with the Signaling Theory (ST) (Spence, 1973, 1974) is a marketing agent or marketing agency firm that will undertake signaling to deliver or equate information between the company and stakeholders (customers). The award will signal the company's success through specific products with excellence brand. Award also informs good company's reputation as a signal of the ability of an organization to meet the needs of its customers (Boyd et al., 2010).
Brand equity is also an intangible marketing resource in the context of MBA as the advancement of RBT (Barney, 1991; Grant, 1991; Wernerfelt, 1984; Srivastava et al., 2001). The brand equity will interact with the award in influencing corporate reputation (Ying Fan, 2005). So, it will moderate the effect of award as relational and intellectual market-based assets on company's reputation.
Strong brand will affect the company's reputation powerfully.

ISSN 2302-786X
188 Proceeding of Annual South East Asian International Seminar (ASAIS) 2013
Brand is the core component and vital to a company's reputation (Ying Fan, 2005: Smith, et al., 2010). Strong brand equity will create customer satisfaction, increasing customer confidence (trust) to the brand where customer satisfaction and trust are antecedents of company's reputation from the customer perception (Walsh & Beatty, 2007). Basdeo, et al., (2006) stated that the company's reputation is affected by the actions of the company and its competitors such as creating a strong brand for customers. Then, brand equity of the award recipient products will also be antecedents of corporate reputation (Ying Fan, 2005: Smith, et al., 2010; Basdeo, 2006).
Positive attitude towards the company and the occurrence of sustainable repeat purchases, are the key to customer loyalty (Dick and Basu, 1994). Reputable companies strengthen customer confidence in the product/service/specific brand, create customer satisfaction and encourage repeat purchase and loyalty (Davis and Young 1977; Nha Nguyen and Leblanc Gaston 2001). Customers will be willing to pay more for products/services produced by firms with better corporate reputation (Graham and Bansal, 2007). Customer loyalty is the impact of good corporate reputation. Customer loyalty will be higher if there is more positive corporate reputation (Alsop, 2004; Gotsi and Wilson, 2001). Reputation contains elements of trust and commitment (Aurier and N'Goala, 2010) which will create customer loyalty. Two forms of customer loyalty are attitudinal and behavioral loyalty (Jacoby and Chestnut, 1978). Attitudinal loyalty is shown by the level of consumer's psychological attachment to a brand/specific product (Chaudhori, &
Holbrook, 2001) and behavioral loyalty is shown by customer repeat purchase for the same brand continuously, the proportion of the purchase of the brand, and purchase order (sequence) and number of brand switching among consumers in a product category (Palmer, et al., 2000; Shukla, 2004).
5. CONCLUSION Marketing category business award as relational and intellectual market-based assets has a positive effect on the reputation of the company. High brand equity increases the effect of marketing category business award on the company's reputation. Brand equity of award recipient products also influences corporate reputation positively. The company's reputation has a positive effect on attitudinal and behavioral loyalty. A company should continuously do improvement on its brands so that the award recipient brands will have higher brand equities, corporate reputation and customer loyalty.
6. BIBLIOGRAPHY [1] Chaudhuri, Arjun & Holbrook,
Morris B. (2001). The chain ofeffects from brand trust and brand affect to brand performance: The role of brand loyalty. Journal of Marketing, 65(2), 81-93.
[2] Dick, A.S., and Basu, K., (1994), “Customer Loyalty: Toward an Integrated Conceptual Framework,” Journal of the Academy of Marketing Science,22 (2), 99-113.
[3] Hult, G. Thomas, M., (2011), “Toward a theory of the boundary-spinning marketing organization and insights from 31 organization theories,” Journal of

ISSN 2302-786X
Proceeding of Annual South East Asian International Seminar (ASAIS) 2013 189
the Academy of Marketing Science, (39), 509-536.
[4] Jacoby, J., dan Chestnut, R.W., (1978), “Brand Loyalty: Management and Measurement,” New York, John Wiley.
[5] Palmer, Adrian; McMahon-Beattie, Una & Beggs, Rosalind (2000). Influences on loyalty programme effectiveness: A conceptual framework and case study investigation” Journal of Strategic Marketing, 8(1), 47-66.
[6] Spence, M., (1973),“Job Market Signaling,” Quarterly Journal of Economics 87: 355-375.
[7] Srivastava, Liam Fahey dan Kurt Christensen, (2001) “The Resource –Based View and Marketing: The role of Market-Based Assets in Gaining Competitive Advantage,” Journal of Management 27: 777-802.
[8] Walsh, G., Mitchell, W. Vincent, Jackson, R. Paul dan Beatty, R.
Sharon, (2009), “Examining the Antecedents and Consequences of Corporate Reputation: Customer Perspective”, British Journal of Management, Vol. 20, pp. 187-203.
[9] _______, and Beatty, R. Sharon, (2007), “Customer-based corporate reputation of a service firm: scale development and validation”, Journal of the Academy of Marketing Science, 35 (1), pp. 127-143.
[10] Ying Fan, (2005), “Ethical Branding and Corporate Reputation, Corporate Communication,” An International Journal, Vol. 10, No. 4, pp. 341-350.
[11] Yoo, Boonghee dan Donthu, Naveen, (2001), “Developing and validating a multidimensional consumer-based brand equity scale”, Journal of Business Research, 52, pp. 1-14

ISSN 2302-786X
190 Proceeding of Annual South East Asian International Seminar (ASAIS) 2013

ISSN 2302-786X
Proceeding of Annual South East Asian International Seminar (ASAIS) 2013 191
Phenomenology Study Towards Application E-Government Process on Framework Social Coqnitive Theory. (Empirical Study in Satuan Kerja Perangkat Daerah) Local Government in Malang
Siti Amerieska
State Polythecnic of Malang e-mail: [email protected]
Abstract
The main aim of this research is to understand the composition of local government application E-Government in the level of SatuanKerjaPerangkat Daerah (SKPD) . Hence this research is developed based on interpretive paradigm. The approach and technique of phenomenology analysis used to explore comprehensive meaning of composition of local government application E-Gov process. The result of this research are format and technical composition of local government E-Gov process haven’t ready measure,so the idealism performance application E-Gov is not yet achieve. With using social cognitive theory as tool methodology with several element such as behavior, personal factor (kognitif, affective and biological event),eksternal environment. The less effective and less comprehensive socialization becomes one of the cause.In the future a comprehensive and continous socialization need tobeperformed for all government employees and society to improve awareness and understanding on the application E-Gov. Key words: E-Government, phenomenology, social coqnitive theory 1. INTRODUCTION E-Gov has been known in Indonesia since 2001, that was since the emergence of the President Instruction number 6, 2001 at April 24, 2001 about “telematika” (Telecom-munication, Media and Information) stated that the govermentalaparatus should use, ‘telematika’ technology to support a good government and to speed up the democration process. However, in its journey the central government’s initiative does not have any support as well as response from all of people who have some competence need of the government with characterized by using minimal agricultural information.www.transparency.org/cpiIn 2003, in the era of the president Megawati SoekarnoPutri, the Government published the policy which more focused toward the implementation of e-Gov, through the President Instruction that is, “inpress number 3, 2003”. This president instruction containts of the Strategy of the Development e-Gov which was
also supplemented by the various guides about e-Gov such as: The Guide of Portal Development Infrastructure Government; A Guide of Electronic Document System Management of the Government; A Guide of the Local Government Implementor’s Web Sites; etc.
Study about E-government to the adoption and use of information technology has been largely represented in Management Information Sytem research, concentrating ever increasing research efforts. The first theory that started providing evidence in IT adoption cause was the theory of reasoned action. This theory gave birth to one of the most important is grounded theories such as the technology acceptance mode theory, also provided successful insight by providing a complementary view to the IT adoption and use cause SCT has been another insightful and widely used theory in Information system research.(Laudon.2007)
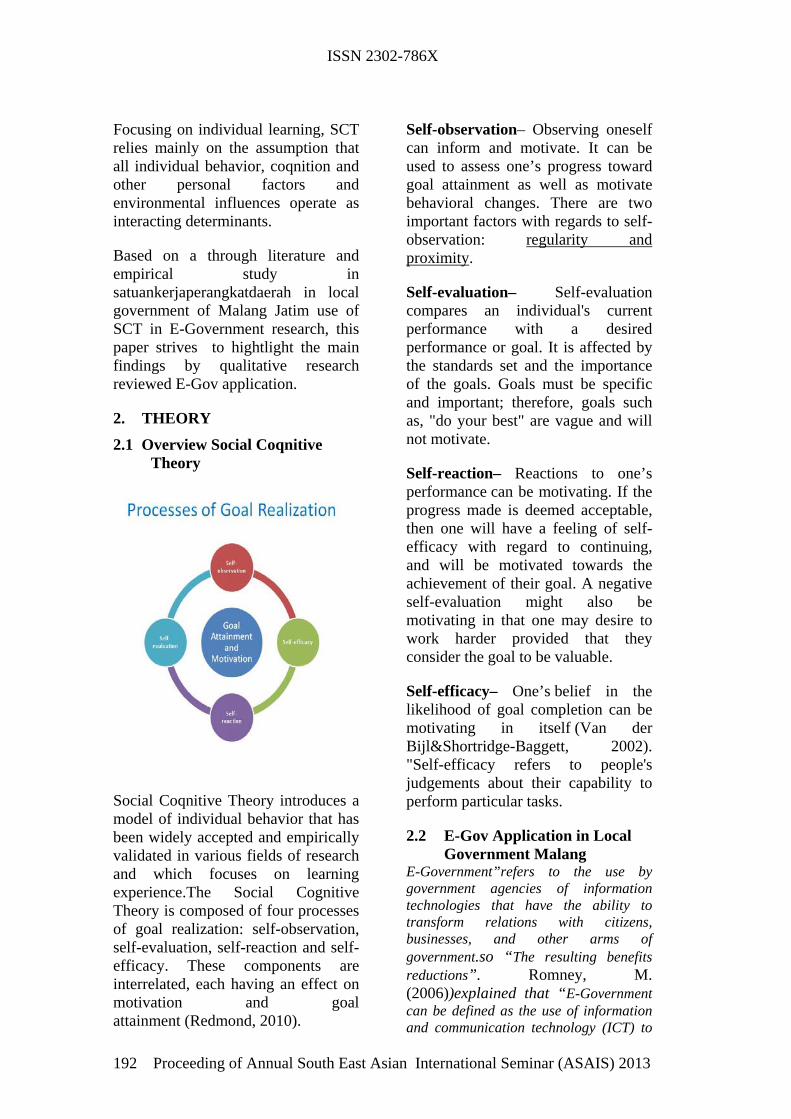
ISSN 2302-786X
192 Proceeding of Annual South East Asian International Seminar (ASAIS) 2013
Focusing on individual learning, SCT relies mainly on the assumption that all individual behavior, coqnition and other personal factors and environmental influences operate as interacting determinants.
Based on a through literature and empirical study in satuankerjaperangkatdaerah in local government of Malang Jatim use of SCT in E-Government research, this paper strives to hightlight the main findings by qualitative research reviewed E-Gov application.
2. THEORY
2.1 Overview Social Coqnitive Theory
Social Coqnitive Theory introduces a model of individual behavior that has been widely accepted and empirically validated in various fields of research and which focuses on learning experience.The Social Cognitive Theory is composed of four processes of goal realization: self-observation, self-evaluation, self-reaction and self-efficacy. These components are interrelated, each having an effect on motivation and goal attainment (Redmond, 2010).
Self-observation– Observing oneself can inform and motivate. It can be used to assess one’s progress toward goal attainment as well as motivate behavioral changes. There are two important factors with regards to self-observation: regularity and proximity.
Self-evaluation– Self-evaluation compares an individual's current performance with a desired performance or goal. It is affected by the standards set and the importance of the goals. Goals must be specific and important; therefore, goals such as, "do your best" are vague and will not motivate.
Self-reaction– Reactions to one’s performance can be motivating. If the progress made is deemed acceptable, then one will have a feeling of self-efficacy with regard to continuing, and will be motivated towards the achievement of their goal. A negative self-evaluation might also be motivating in that one may desire to work harder provided that they consider the goal to be valuable.
Self-efficacy– One’s belief in the likelihood of goal completion can be motivating in itself (Van der Bijl&Shortridge-Baggett, 2002). "Self-efficacy refers to people's judgements about their capability to perform particular tasks.
2.2 E-Gov Application in Local Government Malang
E-Government”refers to the use by government agencies of information technologies that have the ability to transform relations with citizens, businesses, and other arms of government.so “The resulting benefits reductions”. Romney, M. (2006))explained that “E-Government can be defined as the use of information and communication technology (ICT) to

ISSN 2302-786X
Proceeding of Annual South East Asian International Seminar (ASAIS) 2013 193
provide and improve government services by enabling electronic transactions and interactions between citizens, businesses, and other arms of government” danChesher et al. (2003) explain “E-Government strategies worldwide are driven by a desire to improve the efficiency, accessibility and effectiveness of public service delivery”.Almutairi (2005)
E-Government can be defined as a relationship between stakeholder namely:
Picture I: Infrastructure E-Government
1. Government to government (G2G): interaction are connected are concerned to enhance the internal bureaucracies.Example: SILADESKEL ( Sistem Informasi dan Layanan Administrasi Desa dan kelurahan)
2. Government to business (G2B): interaction are reduce the costs to government of buying and selling goods and service from firm.Example: E-Procurement in SKPD.
3. Government to citizen (G2C): interaction involve using the internet to provide public service on transaction online. Example: SINGAMAS (Sistem Informasi Pengaduan Masyarakat via SMS kabupaten Malang)
4. METHODOLOGY This research executes phenomenology as the methodology for the inquiry. The purpose of this research is to explain how the application E-Govaccured develop local government. Hence this research is developed on the interpretive paradigm. The approach and technique use qualitative research methodswere developed in the social sciences to enable researchers to study social and cultural phenomena. Examples of qualitative methods are action research, case study research and ethnography. Qualitative data sources include observation and participant observation (fieldwork), interviews and questionnaires, documents and texts, and the researcher's impressions and reactions(Myers 2009). Population this research are staf insatuankerjaperangkatdaerah especially in Elektronik data Procecing in local government in Malang.
To analyzing data use Social Coqnitive Theory such as self-observation, self-evaluation, self-reaction and self-efficacy. Using interpretive paradigm will observed decision making behavior user which operating EGov application.
3. ANALYSIS
Effects of user self-observation increase productivity
Observing oneself can inform and motivate. It can be used to assess one’s progress toward goal attainment as well as motivate behavioral changes. There are two important factors with regards to self-observation: regularity and proximity. Regularity means the behavior should be continually observed, whereas proximity means the behavior should be observed while

ISSN 2302-786X
194 Proceeding of Annual South East Asian International Seminar (ASAIS) 2013
it occurs, or shortly after. Alone, self-observation is insufficient because motivation depends on one’s expectations of outcomes and efficacy (Zimmerman &Schunk, 2001).
This integration process was done through some means such as application E-gov that was use to promote knowledge sharing and transfer among the staf in SKPD. MrIndra asked:
“We have some information technologies that support the knowledge integration such as internet, intranet and telephone.”
Intranet is a networking facility that was developed by PDE by using AS 20 software.This software has been used in intranet for 12 years and now it has been upgraded three times from 20 software to AS 27 and now 31, said staf data processing. Other E-Gov application instruments that are used to integrated knowledge included telephone and internet.
“We use telephone to discuss a variety issues related operational to our public service. Sometimes we come across a problem when we want to finace our operational and telephone is a good facility to use because we can talk directly with the source.”
If we look at these two comments, in particular the first one, there seems to be some confusion in self observationby user as staf in SKPD, motivate used application E-Gov is the most important to known make easly and effective job.
Self Evaluation as Performance AgainstOther Individuals?
There are two types of self-evaluation standards: absolute and normative.
For example, a grading scale would be an example of a fixed or absolute standard. A social comparison such as evaluating one’s behavior or performance against other individuals is an example of a normative standard (Zimmerman &Schunk, 2001). People gain satisfaction when they achieve goals that they value. When individuals achieve these valued goals, they are more likely to continue to exert a high level of effort, since sub-standard performance will no longer provide satisfaction (Bandura, 1989).
Remembering the concept of self evaluation , we can see that this concept, He asserts,
“We have designed the self-evaluation form to help review and improve the service our offer. It helps our and any assistants or staff to look at how support the E-Gov application performance.We do routine evaluated the morning we start working.The objective of this activity is to refresh our staff for enhance their performance.After that we are requested to give argument realted to our job”
We base our expectations that a self-evaluation assessment system usert achievement on four arguments. User will learn more because (i) self-evaluation will focus user attention on the objectives measured, (ii) the assessment provides user with information they would otherwise lack, (iii) User will pay more attention to the assessment, and (iv) User motivation will be enhanced. As well, self-evaluation is unique in asking user to reflect on their performance. Self-evaluations that elicit information about user effort, persistence, goals orientations, attributions for success and failure,

ISSN 2302-786X
Proceeding of Annual South East Asian International Seminar (ASAIS) 2013 195
and beliefs about their competence, understanding of why user perform as they do.
Self-reaction one’s performance can be motivating.
Self-reaction also allows a person to re-evaluate their goals in conjunction with their attainments (Bandura, 1989). If a person has achieved a goal, they are likely to re-evaluate and raise the standard (goal); whereas, if a person has not achieved the goal, they are likely to re-evaluate and lower the standard (goal) to an achievable goal.
Using application E-Gov such as,SINERIS (SistemInformasiPimpinan SKPD Kabupaten Malang),transferring and sharing knowledge among two groups of user have been done trugh the utilizing those E-Gov. Kasubbag data processing added that using SINERIS is very effective in knowledge integration because staff/user have limitedtime to acquire knowledge from printd document such as guidance books. They prefer to use intranet to share and transfer knowledge among the staff because it is unlimited access and easy.
“Using the intranet for knowledge sharing and transfer is very easy because it uses Indonesian language and we can use it any time. I prefer using intranet and telephone to communicate with other staff because it is very easy.We can access variety of knowledge related to job guidance such as how the staff do their job professionally.”
However, not all staff able to use application E-Go such as intranet and internet.
“ We have problem that some of our staff can not use information technology properly and maximally.”
In efforts to uphold ability staff using E-Govapplication management does not encourage staff to use Application E-Gov for knowledge transfer and sharing, they just let the increase their awareness of the importance of Gov for the knowledge and transfer and sharing process..
Self Efficacy Source of Information.
Self-efficacy beliefs are an important aspect of human motivation and behavior as well as influence the actions that can affect one's life.According to Bandura (1997), two levels of efficacy (low and high) interact with two types of environment (responsive and unresponsive) to produce the following four predictive variables:
1. Success (H, R) - A person with a high level of self-efficacy in a responsive environment will be successful. Their positive attitude toward their abilities coupled with environmental change promotes success and improves long-term motivation.
2. Depression (L, R) - A person with a low level of self-efficacy in a responsive environment may fall into a depressed state. They know the environment will change but their lack of belief in their own abilities stops them from trying and succeeding.
A study by Eden &Aviram (1993) to evaluate the effects of training intended to boost self-efficacy on reemployment. The training provided unemployed workers intensive workshops and job search training, as well as the opportunity to build

ISSN 2302-786X
196 Proceeding of Annual South East Asian International Seminar (ASAIS) 2013
positive performance outcomes. The study found that individuals with low self-efficacy were able to build higher self-efficacy through training. As a result, these individuals were equally successful in finding jobs as the individuals who began the training with high self-efficacy.has been applied staf for using application of E-Gov. All new staff is required to join a training program before and after they applied E-Gov application, Consequently SKPD established training three times a year.
“The training program like SILADASKEL via online have advantages with using all media such as tablet, pc ,laptop.The training programs are oriented at improving competence, skill, attitude, motivation of staff both in term of hardskill and softskill including internalization and transformation knowledge.
According to number of knowledge in SKPD for Data Elektronik Processing is also integrated through seminar and workshop are held regulary.The facilities training were use to integrate knowledge are internet, intranet, telephone, data base, books and e-mail. Meanwhile the mechanisms that were used to supported advance training.
4. CONCLUSION The findings of this study disclose that there is very strong connection between self observation,self evaluation, self reaction and self efficacy make success E Govapplication.Insel observation it can be used to assess one’s progress toward goal attainment as well as motivate behavioral changes. User motivation will be enhanced. As well, self-evaluation is unique in asking user to reflect on their performance. Self-evaluations that elicit
information about user' effort, persistence, goals orientations, attributions for success and failure, and beliefs about their competence, understanding of why user perform as they do.In efforts to uphold ability staff using E-Gov application management does not encourage staff to use Application E-Gov for knowledge transfer and sharing, they just let the increase their awareness of the importance of Gov for the knowledge and transfer and sharing process.Inself efficacyAll new staff is required to join a training program before and after they applied E-Gov application, Consequently SKPD established training three times a year.
There are limitation in the research such as insufficient analysis of the research to represent all, must added with another formula as comparison and revision to this paper.The implication of the research to identify how E-Gov application having potentially afeecting in all environment in Local Government.
5. BIBLIOGRAPHY [1] Almutairi,H.,dan Subramanian
(2005).An Emperical Application of the DeLone and Mclean Model in the Kuwaiti Private Sector. Journal of Computer Information System, 45 (3), 113-122
[2] Axtell, C. & Parker, S. (2003). Promoting role breadth self-efficacy through involvement, work redesign and training.Human Relations, 56, 1.The Tavistock Institute.Sage Publications. Thousand Oaks, CA.
[3] Bandura, A. (1999). Social cognitive theory of personality. In L. A. Pervin& O. P. John (Eds.), Handbook of personality: Theory and research(2nd ed., pp.

ISSN 2302-786X
Proceeding of Annual South East Asian International Seminar (ASAIS) 2013 197
154-196). New York: The Guilford Press. Retrieved fromhttp://books.google.com/books?id=b0yalwi1HDMC
[4] Baraoudi (1986). An EmpericalStudy of the Impact of User Involvement on System Usage and Information Satisfaction.Communications of the ACM,29,232-238.
[5] Bokhari,RH. (2005). The Relationship Between System Usage and User Satisfaction: A Meta Analysis.Journal of Enterprise Information Management, 18, 221
[6] CPI 2010 Table Sources”.Transparency International.www.transparency.org/cpi. Diakses 23 Maret 2013..
[7] “eGovernment: MenujuPelayananPublik Yang LebihBaik”. http://kepriprov.go.id. Diakses 23 Maret 2013.
[8] Laudon K.C, danLaudon J.P.2007 SistemInformasiManajeman(DiterjemahkanolehChriswan S. danMachmuddin E.P.). Jakarta. SalembaEmpat .
[9] Romney, M. (2006).Accounting Information System.10th Edition.New Jersey:Pearson Prentice Hall
[10] Schunk, D. H., & Zimmerman, J. B. (1994).Self-regulation of learning and performance: issues and educational applications. New York: Routledge Taylor & Francis Group. Retrieved fromhttp://books.google.com/books?id=lZZsd75ere4C&lpg=PR1&dq=
[11] Van der Bijl, J. J., &Shortridge-Baggett, L. M. (2002). The theory and measurement of the self-efficacy construct.In E. A. Lentz & L. M. Shortridge-Baggett (Eds.),Self-efficacy in nursing: Research and measurement perspectives(pp. 9-28). New York: Springer. Retrieved fromhttp://books.google.com/books?id=J6ujWyh_4_gC
[12] Zimmerman, B., &Schunk, D. (2001).Self-Regulated Learning and Academic Achievement. (2nded.). Mahwah, NJ: Lawrence Erlbaum Associates, Inc. Retrihttp://www.youtube.com/watch?v=wrzzbaomLmc#t=110eved from

ISSN 2302-786X
198 Proceeding of Annual South East Asian International Seminar (ASAIS) 2013

ISSN 2302-786X
Proceeding of Annual South East Asian International Seminar (ASAIS) 2013 199
Communalland Regulation and Its Relation to Investment Progress in Padang City
YosiSuryani1 and Rudy Rinaldy2
1Administrasi Niaga, Politeknik Negeri Padang, Padang e-mail :[email protected]
2BPBD-PK Kota Padang, Padang e-mail : [email protected]
Abstract
Progress ofprivate sector investmentin the West Sumatra Province before is not soencouraging, butas released by Bappenasin 2011, the private sectoris needed to cover the deficitneeds of investment around Rp. 1.364 Trillion, or about 61% of the total investment required. One reason isthe land tenure system is communal, where the landis not owned by individuals but byclan/tribe, therefore making it difficult for investors to own the landthey need. To facilitate private sector invest but without prejudice to the principle of the utilization of communal land, the West Sumatra Provincial Government made a break through by issuing Local Regulation No. 16 year 2008 on Communal Landand Utilization. As a legal product based on local wisdom, this study aims to assess theeff ectiveness of the implementation of the regulation referred to using secondary data from various related agencies. Based on there search that has been done, it is proven that local regulation in creases investment progress in Padang, even though it has not been too encouraging. As of the end of 2013 the last recorded investment realization by the Public Private Partnerships chemeis 60.80% of the planand there alization of pure investment is 89.10%. While the foreign investmentis still very far from the planth at isonlyat 1.02%. Keywords : Regulation Region in 2008, Investment Progress 1. INTRODUCTION
1.1 The Backgound The ability to explore the potential of an area is an important factor in achieving the success of the marketing potential of the region. The ability to explore these should also be supported by the creation of a conducive climate and supporting investment, such as the guarantee of safety and legal certainty for investment in the region. Local governments should be able to give birth to the regulation can spur the growth of the economy by seizing investors PMA and PMDN simultaneously empower local investors. The success of local Government to manage those factors will be able to encourage increased competitiveness regions in grabbing investors.
In the region of West Sumatra there are lands in the customary law community environmental management, mastery and its utilization based on the provisions of the local customary law. The land is not owned and controlled individually, and all things dealing with the utilization of the land, and subject to applicable law. This condition is allegedly being one of the causes of inhibition private sector investment inflows in West Sumatra Province, making the province of West Sumatra has become a competitive investment destination.
The development of private sector investment is stagnating, encourages the Government of the province of West Sumatra made a breakthrough by publishing Regulation No. 16 Regions in 2008 about the land and its utilization Unalienated. In addition
ISSN 2302-786X
200 Proceeding of Annual South East Asian International Seminar (ASAIS) 2013
intends to penetrate the barrier as a land use basic footing invest, publishing the Regulations intended to make the area of West Sumatra Province to become more competitive in terms of private sector investment. Directly, the enforcement Regulations of the area will affect the development of the private sector investment in the city of Padang, which became the loci in the study, based on data published by the regional development and BPS Padang city up to the year 2010 and 2011.
1.2 Purpose and Objective The limitations of the Government's financial capability that are sourced from the APBN and APBD, Sue organizers of Government innovation to break through the isolation of his close private sector investment, West Sumatra Province is no exception. Therefore the purpose of this study is to compare the value of private sector investment that goes into Padang city before and after the enactment of the Regulation No. 16 Regions in 2008. While the goal was to provide recommendations for improving the effectiveness of utilization of local regulations is to increase the value of investment in Padang city on the days to come.
2. THEORY
2.1 Investment Progress Investment can be defined as investment spending or for the company to buy capital goods and supplies to increase production of goods and services production capacity in the economy. Increase the amount of capital goods allow the economy produce more goods and services in the future. Main factors determining the rate of investment is rates, profitability, prediction a prediction about the economic
condition in the future technological progress, the level of national income ( Sukirno, 2004 ).
Investment in the sense of conceptional is the result of a process that is multi dimensional. Economic development is one of the functions of the investments in terms of capital investment or economic factors the most essential and easily measured quantitatively (McMeer, 2003). However in the real world that an investor that will infuse capital in a specific scope of work will always pay attention to the safety factors of the environment, legal certainty, the status of land investment and Government support (Bachri, A. A., 1994, 2003, 2004).
Investment progress autochthonous condition is multi dimensional and into a consideration for investors in making investments. The government role in connection is very important in investment, any process even local government recommendation is a requirement absolute in appraisement investment in the province who is worthy. It also problems associated with the spatial, disorder environment and public order.
The investment progress is a long-term process that always runs in the same direction with the development effort. The investment climate is not the only consideration in early investment plan, however, is the strategic variables that will determine the success of an investment firm along the walk.
Based on this it can be concluded that the success of the investment depends on the investment progress is determined by the security environment, legal certainty, the status of land investment and

ISSN 2302-786X
Proceeding of Annual South East Asian International Seminar (ASAIS) 2013 201
Government support. The issuance of a special area set up Rules about it, especially the status of land to invest, will be able to interest potential investors in investing because of the certainty of land status, management and legal protection of assets owned in investment.
2.2 The Regional Regulation of West Sumatra No. 16 in 2008
A breakthrough in solving the deadlock private sector investment scheme in West Sumatra Province is with the publication of Perda No. 16 in 2008 about the land and its utilization Unalienated. With the innovation of characterised by presenting the Rules this area, the positive impact with increased interest in investment in Padang city. This will spur The City as the capital of West Sumatra Province to remain investors with a revival of culture and behavior as well as his unique condition. In turn, local regulations No. 16 in 2008 this can also make the city of Padang as areas that deserve to be empowered to be globally competitive.
Regional Regulation No.16 in 2008 About the land and its utilization is composed of Unalienated IX (nine) and Chapter 17 (seventeen) Article. The emphasis of the investment progress according to Rule this area outlined in chapter VI, article 10 and article 11. Article 10 mentions:
1. Investors can take advantage of the communal land by including rulers and customary landowners by agreement of the community as a shareholder, profit sharing and other ways within the time specified in the agreement.
2. Agreement as referred to in paragraph 1 is made in writing
before the official run private land deed / notary.
Whereas article 11 States: If the Treaty of cession of rights or property rights and for the control and management of the enforced by soil as mentioned in article 8, then the status of the control and ownership of the land or return to the original shape. This article emphasizes on land ownership after the agreement ends. Thus both the article explains with certainty about conditions, rules and safeguards for potential investors in investing in Padang city and can be one of the power law for investors in doing in running his business.
3. METHODOLOGY The methods used in this research is qualitative, descriptive methods of research that attempts to describe/illustrate/describes phenomena or relationships between phenomena investigated by systematic, factual and accurate (Kusmayadi, 2000: 29). According to Nazir, descriptive method is a study to find out the facts with the proper exposure (Nazir, 1999: 63). While the types of data collected in this study consists of qualitative data that data in the form of a sentence or description, and quantitative data i.e. data that is expressed in the form of numbers (Nawawi, 2007: 103).
This study uses secondary data, i.e. data source which is a bibliographic and documentation that comes from the material library, either in the form of encyclopedia articles, textbooks, scientific papers and data published by government agencies, which are obtained from indirect sources, or data obtained from official archives and documents (Moleong, 2010: 159). Secondary Data used in the study comes from government agencies that

ISSN 2302-786X
202 Proceeding of Annual South East Asian International Seminar (ASAIS) 2013
deal with the issue of review, namely capital investment and Service Agency Licensing (BPMP2T) the city of Padang, Padang city, BPS Bappeda Padang city and the capital investment Coordination Board of West Sumatra.
A method to analyze the research data that is qualitative, descriptive and interpretive. All the data that is retrieved from various sources, the text is transcribed in the form of writings and his work on this interpretive nature (Moleong, 2010: 114). Data acquisition results, further analyzed qualitatively by interpretatip, with through several processes such as; verification, reduction, and presentation of data, as well as the withdrawal of the conclusion.
4. ANALYSIS The economic conditions of Padang city have experienced tough times after the earthquake disaster-stricken 7.9 SR on September 30, 2009. Economic growth with very positive trend during the period between 2000 to 2008 (6,21% in 2008), shrank to only 5.08% in 2009. (Bappeda Padang city, 2011). The process of recovery Of The disaster was judged a bit slow because the Government set the status of the disaster is not a disaster, but rather a national disaster area. As a result, the Government of the province of West Sumatra, together with the district/city Governments affected, with most of the potential areas that utilize all owned, trying mightily to rise out of the slump.
Although rated slower, but slowly the recovery process of the city of Padang in particular, showed encouraging progress. It is characterized by the return of Padang city on improving economic growth from 2010 up to this time. Padang City economic growth
rose to 5.96% in 2010, and continues to be the rising 6.41% in 2011 (Padang City in Figures, 2011)
GDP growth in Padang city on the basis of Constant Prices, according to the Business Fields by 2011 to reach Rp. 18 billion 12.792 donated by 4 main sectors namely; transport and communication sector (24%), trade, hotels and restaurants (21%), services sector (17%), and industrial processing sectors (15%).
The value of investments that are cultivated in Padang city during the period from 2000 to 2008 on the basis of prevailing prices, in fact shows the development that is good enough. In 2000 recorded the amount of investment in the city of Padang is Rp. 1.616,46 billion. Then increase to Rp 1.793.202,55Billion in 2001. These values continue to increase with the growth of an average of 13,41% up to the year 2007, in which the value of the investment goes to the city of Padang is amounting to Rp. 3.889.936,64 Billion, with distribution as follows; Agriculture, livestock, forestry and fisheries is Rp. 106.935,76Billion (2.75%), mining and quarrying sector amounting to Rp. 26.602, 06 billion (0,68%), industrial processing sector amounting to Rp. 750.795,60 billion (19.30%) , sectors of electricity, gas and drinking water amounting to Rp. 208.334,31Billion (5.35%), building sector amounted to Rp. 52,55,61 Billion 193.695 (4,98%), trade, hotels and restaurants of Rp. 1.025.185,02 billion (26,35%), transport and communication sector amounting to Rp. 897.760,33 billion (23.08%) , the financial sector, corporate services and rentals of Rp. 191.018, 37 billion (4.91%), and the services sector amounted to Rp. 489.609,58Billion (12,59%).

ISSN 2302-786X
Proceeding of Annual South East Asian International Seminar (ASAIS) 2013 203
Growth and development of the investment is calculated prior to the issuance of West Sumatra Provincial Regulation No.. 16 of 2008 on the Communal Land and Utilization. If seen from the distribution in 2007, shows that the sector is the largest contributor to the trade, hotel and restaurant, followed by transport and communications sector. This further proves that the two sectors are the sectors most dominant line of business in Padang city, so that with the implementation of Regulation on communal land is expected to increase the investment value of the two sectors.
In 2008, the magnitude of the investment according to the field of business in the city of Padang is Rp. Rp. 4.656.762,22 Billion or increase of 19,71% when compared to 2007, in which the largest donations come from the sectors of trade, hotels and restaurants of Rp. 1.276.457,85billion (27,41%) and transport sectors and communication amounting to Rp. 1.102.209,36 billion (23,67 %).
Later in 2009, although the city of Padang earthquake disaster-stricken on September 30, the value of the investment in fixed increases even though only a few, that is Rp. 5.156.560,67 Billion, up by only 10,73% if compared to 2008. The biggest donation for investment in 2009 remain the same which was dominated by the trade sector, the hotel and restaurant is Rp. 1.403.083,30 billion (27,21%) and transport and communications sectors amounted to Rp. 1.177.337,28 billion (22,83 %).
So if we look at the investment conditions in 2010, also increased when compared to 2009. The year 2010 was the first year the city of
Padang entered the stage of rehabilitation and reconstruction after the earthquake September 2009. In 2010 this is also being done for the victims of the earthquake relief throughout the community whose homes were damaged and moderately damaged. Early recovery is done against centers vital component of the city such as health centers, schools, electricity substations, taps facilities, roads and bridges, as well as early recovery community mental.In the midst of the recovery effort is doing disegala fields, an investment that goes into Padang city in 2010 increased quite rapidly, amounting to Rp. 5.999.876,07 Billion or ride amounting to Rp. 843.315.4 billion (16.35%) when compared to the year 2009. The biggest contributor comes from both sectors such as in previous years, but in 2010 there is one sector that his contributions are significant sectors of the processing industry. The distribution of the value of the investment in the year 2010 are; trade, hotels and restaurants of Rp. 1.631.178,05 billion (27,19%), transportation and communication sectors of Rp. 1.387.282,53 billion (23,12 %), and industrial processing sector amounting to Rp. 1.123.827,24 Billion (18.73%).
The average growth of investment during the period between the years 2008 - 2010 amounted to 15.60%. Actually, this figure could be higher still if not disaster-stricken city of Padang earthquake in 2009. Investment growth is increased when compared with the period before the enactment of Local Regulation. 16 of 2008 which only amounted to 13, 41%.Can be seen even in a ravaged, fixed investment flows in the city of Padang, mainly dominated by trade, hotels and restaurants, as well as transport and communication sectors,

ISSN 2302-786X
204 Proceeding of Annual South East Asian International Seminar (ASAIS) 2013
and supplemented by a sizable contributor to the sectors of the processing industry. The third sector is typically more dominated by the private sector where the land is a major factor in the movement of its investments. Investment growth in the city of Padang was also strongly affected by the enforcement of local regulations No. 16 in 2008 about the land and its utilization Unalienated.
Accordance with the regulations set out in the question, the landowners do not have to sell their land to investors , and investors also do not need to buy and own the land he wanted . Symbiotic mutualism between the investor and the owner of the land is under the legal umbrella of their land use , has created a positive investment climate for the city of Padang . In addition, issuance of this area was also able to reduce the potential for conflict and resistance that would occur in the region of Padang , in relation to land use . In 2012 , as released by the government of Padang , some big investors have expressed willingness to invest in the city of Padang with an investment value of more than Rp . 1 trillion, the Lippo Superblock development Padang City and Padang Green City Superblock . In addition, there is also the private sector investment that will go with asset utilization system of regional cooperation , namely the construction of District Commercial Centre SimpangHaru with an investment of around Rp.170 billion, and the
transportation sector investments with an investment of around Rp. 100 Billion .
5. CONCLUSION
5.1 Conclusion 1. Issuance of West Sumatra
Provincial Regulation No. 16 of 2008 on communal land and Utilization, gives significant impact on the growth of investment in the city of Padang in particular.
2. The dominant sector for investment flows in the city of Padang is, trade, hotels and restaurants, transport and communications and the processing industries.
5.2 Recommendation The government of Padang city needs to be intensive and sustained socialize Regional Regulation No.16 in 2008 of West Sumatra Province to continue to spur the growth of investment in the city of Padang.
6. BIBLIOGRAPHY [1] BPS Padang City. 2012. Padang
City in Figures in 2012.
[2] Kusmayadi and Endar Sugiarto. In 2000. Research Methodology in the Field of Tourism. Jakarta: Gramedia Pustaka Utama.
[3] Moleong, Lexy J. 2010. Qualitative Research Methodology. Bandung: Rosdakarya
[4] Nawawi, Hadari. 2007. Research Methodology. Jakarta: Rajawali Pres.
[5] Nazir, Mohammad. 1988. Research Methodology. Jakarta: Ghalia Indonesia.
[6] RTRW of Padang City 2010 – 2030.
[7] The Government Provincial of West Sumatera. 2009. The Regional Regulation No. 16 in 2009.

ISSN 2302-786X
Proceeding of Annual South East Asian International Seminar (ASAIS) 2013 205
Performance of Kampuang Bordir Kerancang Bukittinggi Business Center
Willson Gustiawan1, Afifah 2, and Gustina 3
1,2,3Department of Business Administration, Padang State Polytechnic Unand Limau Manis Campus, Padang, West Sumatra, Indonesia
Phone: +62 751 72590 Fax: +62 751 72576 email: [email protected]
Abstract
In economy development in the context of a competitive advantage, Porter introduces the concept of industry cluster. Industry cluster is geographically concentration of interrelated and cooperated businesses. Krugman calls it as geographical economics. The development of industry cluster is associated with the development of business center that supports the cluster. Indonesia developed the business centers with the support of small and medium entrepreneurs (SMEs). Likewise, in West Sumatra, local government develops business centers through specifying “Kampuang Bordir Kerancang” (Kerancang Embroidery Village) in Kelurahan Manggis Ganting and Kelurahan Campago Guguk Bulek in Bukittinggi. This study explores the performance of the Kampuang Bordir Kerancang business center in order to improve embroidery products competitiveness through evaluation of the business center dynamics, cooperation among the center member and competitiveness of products. This descriptive research grab primary data from census of respondents – 64 (sixty-four) entrepreneurs in the center. In general, performance of the business center of Kampuang Bordir Kerancang has run well. In terms of business dynamics, research reveals turnover growth, business unit growth, absorption of labor, and the center stage development; relationship characteristics and network characteristics in term of cooperation; and cost production competitiveness, better quality products, ability to fulfill order in certain time and quantity in term of product competitiveness. Keywords: industry cluster, business center effectiveness, KampuangBordirKerancang
1. INTRODUCTION Each region hascomparative advantage resources that processed to create added value become competitive advantage and then give trickle down effect to other sectors. In this context, Porter (1990) introduced and popularized the concept of industry cluster. Industry cluster can be interpreted as a geographic concentration between the companies that are interrelated and work together,Djamhari (2006). In Krugmann’s terms(1991), it called geographical economics.
One of success application of industriy clusters is One Village One Product (OVOP) in the Green Tourism program in Ajimu City, Oita Prefecture. In Indonesia industriy clusters serve as a national industrial
strategy. This movement was adopted by Basofi Sudirman, East Java Governor period 1993-1998 with Back to the Village Movement (Gerakan Kembali ke Desa/GKD) Wiwit (2008 ).
The development of industry clusters is strongly associated with the development of business centers that support the cluster. Indonesia currently has 1056 centers(smecda.com, June 22, 2013) i.e Kampung Kawalu Embroidery in Tasikmalaya (embroidery industrial district), and West Lombok (pottery centers).
Bukittinggi has a potential embroidered resource to be developed. Embroidery business undertaken by 315 entrepreneurs and is the second most business in

ISSN 2302-786X
206 Proceeding of Annual South East Asian International Seminar (ASAIS) 2013
Bukittinggi (Diskoperindag Bukittinggi, 2011). This business has chance to grow potentially because it is supported by many contributing factors such as human resources and availability of raw materials (Afifah, 2011).
Bukittinggi Municipality Govern-ment (through Diskoperindag/Bureau of Cooperatives, Industry and Trade) established “Kerancang”embroidery business center. The business centerwas established in Kelurahan Manggis Ganting and Kelurahan Campago Guguk Bulek named as Kampuang Bordir Kerancang (Kerancang Embroidery Village) or KBK, it was in accordance with Bukittinggi Major’s Decree No. 188.45.65-2011 (Diskoperindag Bukittinggi, 2011).Determination of the center is certainly in accordance with the criteria such as: there are a lot of businesses within area, has chance to growpotentially, able to absorb the labor of more than 40 people, (Ministry of Cooperatives and SMEs, 2004) .
Since established in 2010, the center’s performancehas not been evaluated scientifically. While KBKis the program of Diskoperindag Bukittinggi to improve embroidery product competitiveness as a regional core competence in the short-term work plan (ADC, 2011). Besides, the business center is also one of the main centers of supporting SME Cluster Fashion newly formed dated May 8, 2013 (Diskoperindag Bukittinggi, 2013). Therefore, research – by applying the scientific method–must be necessary.
Based on the above description, then problem is formulated: how does the performance of KBK business centers in order to improve the
competitiveness of embroidery products.
2. THEORY Small and Medium Enterprises (SMEs) have a role in the growth and development of the economy in many countries, either developed or developing countries. In developed countries such as the USA, the number of SMEs had reached 99 % of all categories of existing business unit Aharoni (1994 ) in Tambunan (2009). SMEs absorb a lot of labor and become national industrial base. Bijmolt and Zwart (1994) in Tambunan (2009) also said that the Netherlands also has a large number of SME which is about 95 % of all categories of other business units. In Indonesia, SMEs are also a larger portion compared toothers. SMEs in 2011,including micro-enterprises were about 55,206,444 units in Indonesia, while the large-scale businesseswere only 4,952 units. SMEs contribute to the country, in terms of employment as well as in income. SMEs are estimated able to absorb workforce of 101.722.458 people and contributed Rp.4.303.571 (billion) in revenues (Kemenkop& UKM 2012) .
BUSINESS CENTER
Definition of business centeris mentioned in Decree of the Minister of Cooperatives and SMEs No: 32/Kep/M.KUKM/IV/2002 dated 17 April 2002. Business center (sentra) is defined as the center of activity in specific locations/areawhere there are SMEs that use the same raw materials or infrastructure, produce the same/similar products and have the prospect to be developed into a cluster, Taufiq (2004). This term become popular Indonesia.In broader scope, group of SMEs in the region or

ISSN 2302-786X
Proceeding of Annual South East Asian International Seminar (ASAIS) 2013 207
geographical economics is known as industry cluster. Both terms of business center and cluster in Indonesia are used. The term center refers to grouping of SMEs with similar business/product, while the term of cluster refers to the grouping of SMEs with different types of businesses but interrelated and mutually supportive. Centers generally develop into clusters, due to several drivenfactors such as :
a. Business activities that are developed in the industrial centers are characterized as having much relevance to sectors or activities .
b. Growing specialization in the business activities of SMEs in order to more efficient .
c. Have broad market prospects both inside and outside the country .
d. Development of related business within the centers .
e. Technically, various related and connected businesses to be in one area.
f. Development of non-business institutions associated with development of centers
In this study, the concept of center refer Indonesian Ministry of
Cooperatives and SMEs. To support the concept is also used scientific articles on geographical economics.
Indicators for Measuring Business Center
SME business centers development have been started by the Government of Indonesia since 2001, Taufiq (2004). Future projection of establishment and development of SMEs is towards formation of clusters. Grouping SMEs in cluster will be more complete, because not only SMEs that produce similar products but also various related products.
Performance of business center can be measured through three dimensions: dynamics, competitiveness and cooperation as used by the Ministry of Cooperatives and SMEs in the study of centre’s performance. In this study, those three dimensions are used to measure performance of KBK Bukittinggi. The concept, dimensions and indicators are described in Table 1.
Table 1The Concept, Dimension and Indicators for Performance of Business Center Evaluation
Concept:
Evaluation of Business Center’s Performance A review of performance of a group of SMEs located in
certain area/location, use the same raw materials/infrastructure, and produce the same/similar products.
Dimensionons:
(1) Dynamics
(2) Competitiveness
(3) Cooperation
Indicators:
a. growth in turnover b. growth of the business
unit c. employment d. center’s stages
a. competitive production costs,
b. better quality products c. ability to fulfill the
order on time and a
a. Characteristics of the relations intensity of relation frequency of interaction the number of resources

ISSN 2302-786X
208 Proceeding of Annual South East Asian International Seminar (ASAIS) 2013
Concept:
Evaluation of Business Center’s Performance A review of performance of a group of SMEs located in
certain area/location, use the same raw materials/infrastructure, and produce the same/similar products.
Dimensionons:
(1) Dynamics
(2) Competitiveness
(3) Cooperation
Indicators:
development specified amount. that are exchanged period of relationship Equality in exchange
and closeness.
b. Characteristics of the networking scope of networks the number of
participants in the network
how far network members deal directly with other members
homogeneity
3. METHODOLOGY This study is considered as quantitative research studies that precisely measure something such as: behavior, knowledge, opinions or habits (Cooper & Schindler, 2008). Measurement results are then interpreted through: describe, decode, translate and a variety of other ways to interpret the phenomena that occur in the social world. In this study, data will be described in the form of graphs and tables then translated through a series of sentences.
This research conducted in Bukittinggi, exactly in the Kelurahan Manggis Ganting and Kelurahan Campago Guguk Bulek. These two villages which is the center for embroidery business, and known as
Kerancang Embroidery Village or Kampuang Bordir Kerancang (KBK). Respondents are entrepreneurs who are involved in the business center, amounted 64 (sixty four) entrepreneurs (Diskoperindag of Bukittinggi, 2012). The entire population of entrepreneurs serve as research respondents .
4. ANALYSIS KBK is the region that produceembroidery products in Bukittinggi. KBK has established in 2011 and became the main center that support Fashion Cluster that has been established in Bukittinggi in 2013. Entrepreneurs in the KBK merge into a smaller business groups, known as the Kelompok Usaha Bersama (KUB). Currently there are 4 KUBs,
ISSN 2302-786X
Proceeding of Annual South East Asian International Seminar (ASAIS) 2013 209
namely: KUB Anggrek and KUB Jam Gadang in Kelurahan manggis Ganting; and KUB Semangat and KUB Maju Bersama in Kelurahan Campago Guguak Bulek.
KUB is chaired by one of the members appointed or agreed on by all members. KUB chairman/chairlady is usually a member who already successed in the embroidery business or person who actively manage the organization in the urban village. Membership in KUB can be divided into two types, based on their ability to manage the business and embroidering. The membership is: (a) member of KUB worker -craftsmen/craftlady-(anak jaik), (b) member of KUB owner (induak samang).
Business Center Dynamics
Dynamics of KBK according to owner can be reviewwith four indicators, namely: turnover growth, business unit growth, employment and stage development. Dynamics of KBK in the side of worker can be seen from three indicators, namely: revenue growth, member growth and stage development.
In owner and worker perspective, the dynamics of KBK can be concluded:
a. The centerleads an increasingof turnover for owner and of revenue for worker.
b. The center stimulate the growth of new embroidery business unit
c. Development of the center had an impact in workforce employment, especially who has embroidering skill
d. The center leads to specialization of Kerancang embroidery products but not yet led to the standardization stage.
Business Center Cooperation
Cooperation created between owners can be viewed from: a) the characteristics of the relationship and b) the characteristics of networks. Characteristics of the relationship is revealed through indicators: relations intensity, interaction frequency, exchange of resources and long-standing relationships. Networking characteristics identified through indicators: networking scope, the number of participants in the network and how far members deal directly with other members, availability and homogeneity.
Cooperation among the worker can be viewed from: a) the characteristics of the relationship and b ) the characteristics of the network. Characteristics of the relationship is revealed through indicators: relations intensity, interaction frequency, exchange of resources and long-standing relationships. Characteristics of networks is viewed through indicators: networkings cope, the number of participants in the network and how far network members deal directly with other members, availability and homogeneity.
Based on this cooperation indicators, it can be concluded that:
a. Characteristics of the relationship between the members of the center are high degree of independence, so that rare resource exchange, interaction quite often although limited, and the members have known each other for a long time.
b. Characteristics of networks between members of the center are: networking is wide scope for co-operation with other ownersfrom different KUB,

ISSN 2302-786X
210 Proceeding of Annual South East Asian International Seminar (ASAIS) 2013
worker, and consumers. However, the number of network members is still small. In a relationship does not require intermediaries and homogeneity of cooperation is not too overlooked. Characteristics of the network to worker is somewhat different compared to owner, network scope is narrow, few members. Cooperation not through intermediaries and cooperation homogeneity is not too important.
Business Center Competitiveness
Competitiveness of the center in owner and worker perspective is observed from production costs, better quality products, the ability to fulfill the order.
Based on description of each indicator of center competitiveness can be concluded:
a. The competitiveness of the center in term of the competitive production cost can not be achieved because of raw materials price and worker wages are quite similar
b. Competitiveness of the center in terms of product quality does not really give a dominant force because center produce the same product (mukena). Product is differentiatedby motif.
The competitiveness of the center in terms of ability to fulfill the order also does not too important, because over order can not be fulfilled for various reasons.
5. CONCLUSION Kerancang Embroidery Village Business Center is the main center for supporting of fashion industry cluster in Bukittinggi. Therefor, it is required evaluation of center performance in
order to improve the competitiveness of products. Evaluation is viewed through three dimensions: dynamics, cooperation and competitiveness .
The center brings dynamism to the economy of embroidery business for members of the center and the surrounding community as well. Dynamics areindicated by the increasing in turnover for the owners and in revenue for workers . Centers can stimulate the growth of new embroidery business units and employment. Sentra has led to specialization in the product but not yet to the stage of standardization .
Cooperation will be well-developed while supported by the characteristics of relationship and network. Relationship among members of the center tends to low intensity because they are independent, rarely to exchange resources, interaction is limited, although members of the center have known each other for a long time.
Networking characteristics have not yetbeen maximum because the broad scope of networking is not supported by many members of the network. However, networks are not require intermediaries and networks homogeneity is not too important .
The center competitiveness is evaluated as weak as yet achieved cost leadership. It is evidenced from the cost of raw materials and wages quite similar with competitors. The productsare dominated by mukena and diversification only on motif. Sentra has not been able to fulfill over order in a certain time and amount .
6. BIBLIOGRAPHY [1] Afifah. 2013. Orientasi Pasar
Usaha Kecil Menegah Bordir

ISSN 2302-786X
Proceeding of Annual South East Asian International Seminar (ASAIS) 2013 211
Bukittinggi. Jurnal Penelitian dan Kajian Ilmiah Menara Ilmu.Vol III No 36 Maret 2013.ISSN 1693-2617.
[2] Anonymous, 2013<http://www.smecda.com/deputi7/menu/sentra.asp>diakses padabulan Juni 2013).
[3] Area Development Consultant (ADC).2011. Penyusunan Peta Panduan (Road Map) IKM border / sulaman di Kota Bukittinggi .Laporan akhir kegiatan.
[4] Cooper,D.R. & Schindler,P.S., 2008. Business Research Methods. New York: Mc Graw- Hill Companies, Inc.
[5] Departemen Koperasi R.I., 2012. Departemen Koperasidan UKM. [Online] Available at: http://www.depkop.go.id/index.php?option=com_phocadownload&view=file&id=318:data-usaha-mikro-kecil-menengah-umkm-dan-usaha-besar-ub-tahun-2010-2011&Itemid=93
[6] Diskoperindag Bukittinggi. 2013. Rencana Aksi Perkuatan Kelembagaan Klaster IKM Fashion Tahun 2013. Laporan Kegiatan Focus Group Discussion
[7] Diskoperindag Kota Bukittinggi. 2011. Pembuatan Blue Print Bordir Kerancang. Laporan Kegiatan
[8] Diskoperindag Kota Bukittinggi. 2012. Perkembangan UKM Kota Bukittinggi Tahun 2012. Laporan
Djamhari, Choirul. 2006. Faktor-Faktor Yang Mempengaruhi
Perkembangan Sentra UKM Menjadi Klaster Dinamis. Infokop Nomor 29 Tahun XXII
[9] Kementerian Koperasidan UKM. 2004. Evaluasi Perkuatan dan Pengembangan Sentra Dalam Meningkatkan Daya Saing Produk Unggulan. Laporan Akhir
[10] Krugman, P. 1991. Geography and Trade. MIT Press
[11] M, Taufiq. 2004. Proyeksi Sentra Menjadi Klaster. Infokop Nomor 25 Tahun XX, 2004
[12] Porter, Michael.E. .1990.The Competitive Advantage of Nations. New York: The Free Press.
[13] Sri, Lestari, HS. 2008. Kajian Efektivitas Model Penumbuhan Klaster Bisnis UKM Berbasis Agribisnis. Jurnal Pengkajian Koperasi Dan UKM. Vol 3 Tahun 2008
[14] Surat Keputusan Menteri Negara Koperasidan UKM No: 32/Kep/M.KUKM/IV/2002
[15] Tulus, T.H. Tambunan. 2009. UMKM Di Indonesia. Ghalia Indonesia. Jakarta.
[16] Wiwit, Kuswidiati. 2008. A Case Study of Participatory Development in the One Village One Product Movement: Green Tourism in AjimuTown.Oita. Japan and Agro Tourism in Pasuruan, East Java. Indonesia. Research Note. Graduate School of Policy Science Ritsumeikan University

ISSN 2302-786X
212 Proceeding of Annual South East Asian International Seminar (ASAIS) 2013

ISSN 2302-786X
Proceeding of Annual South East Asian International Seminar (ASAIS) 2013 213
Implementation Manufacturing Flexibility and Spanning Flexibility to Customer Satisfaction Improvement
Sarwoto
Lecture in Vocational Program Manajemen Bisnis Faculty of Economics Sebelas Maret University, Solo – Indonesia Corespondence : HP. 085 747 757 984, email :
Abstract
This study identify the factors that support in batik industry in order to achieve customer satisfaction from manufacturing and spanning flexibility view. Competence and capabilities of manufacturing flexibility were measured using variables proposed by Zhang et al., (2003), while competence and capabilities of spanning flexibility and customer satisfaction were measured using variables suggested by Zhang et al., (2006). The data was collected through a survey using questionnaire with convenience sampling of 38 firms in Solo. This study applies the PLS to identify important factors that need to be considered. The results showed that there is still a mismatch between the indicators that should be considered with the indicators is considered in Solo batik industry. The indicators that are not appropriate indicators that measuring machine flexibility, material handling flexibility, routing flexibility, volume and mix flexibility, strategy development flexibility, and customer satisfaction. In Batik Industry context, related to competences of spanning flexibility there is compatibility between factors that should be considered and factors considered by batik industry. The same is true of labor flexibility. Further research should be conducted on a large sample and wider area coverage so that results can be used for generalization. Further study also required the measuring of customer satisfaction with customer perceptions. Key Words : Manufacturing Flexibility, Spanning Flexibility, Customer Satisfaction, Batik Industry, Surve 1. INTRODUCTION Uncertainty in business environment, organizations must improve adaptability. Organizational adaptability can be done with the implementation flexibility in organization’s. Flexibility is the organization’s ability to meet an increasing variety of customer expectations without excessive costs, time, organizational disruptions, or performance losses (Zhang et al.,2003). In manufacturing industry context, flexibility can be implemented through manufacturing flexibility. Manufacturing flexibility is the ability organizational to manage resource production and uncertainty to meet the vary customer needs (Zhang et al., 2003). From a customer perspective, the efforts of cross-functional and cross-company is needed to eliminate bottlenecks,
improve responsiveness, and create a level of performance that allows companies to build long lasting competitive advantage. Therefore, value chain flexibility broadly include: flexibility of product development, manufacturing flexibility, logistics flexibility, and spanning flexibility (Day, 1994; Zhang, 2001). The focus of this study is on manufacturing flexibility and spanning flexibility. Spanning flexibility broadly covers the internal dimensions or operational aspects, and external dimensions that directly related to the customer. Flexibility in development strategy is customer-facing capabilities that directly affect customer satisfaction. It is changing the deployment flexibility of supply chain information into actions that benefit the customer (Zhang et al.,2006).
ISSN 2302-786X
214 Proceeding of Annual South East Asian International Seminar (ASAIS) 2013
Based on the description, researcher interested in studying about implementation manufacturing and spanning flexibility to improve customer satisfaction. Selected objek is batik firms in Solo. Batik is a non-oil commodities that contribute to state revenue through domestic and export trade. While Solo is one of city in Central Java that produce batik most in Central Java.
2. THEORY Manufacturing Flexibility
Manufacturing flexibility is the ability of the company in managing manufacturing resources and uncertainty to meet consumer expectations. Upton (1995) proposed the concept of internal flexibility, an enterprise competency which means everything a company can do. While the concept of external flexibility is an enterprise capability, which means everything that can be done by a company, in customers point of view.
Stalk et al., (1992) argue that competence more emphasis on technological expertise and production expertise at specific points along the value chain, while the capability has a wider base and cover the entire value chain. Thus, the ability more easily seen directly by consumers, while internal competencies can not be seen directly by consumers.
Hyun and Ahn (1992) states that manufacturing flexibility competence consists of the flexibility of machinery, labor, raw material handling, and determination pathways by which this manufacturing flexibility competence is to support volume flexibility and mix flexibility.
Spanning Flexibility
Spanning flexibility allows the company to respond to customer needs quickly, by aligning product creation and delivery of product through the flow and storage of information efficiently and effectively throughout the customer value chain (Day, 1994; Teece et al., 1997; Bowersox et al., 1999; Van Hoek, 2001). Coordination between the activities of resource management, manufacturing, and distribution in the company improve its ability to respond to market changes by eliminating redundant activities, and this reduces the response time by facilitating the flow of information demand and supply (Juga, 1996; Krajewski and Wei, 2001). In an integrated value chain, spanning activities extent to the coordination with distributors and suppliers.
Spanning flexibility is a company's ability to provide horizontal information relationships between the parties involved in the supply chain in order to create and deliver products that meet customer needs (Day, 1994). This study focused on the development of information deployment flexibility along the supply chain, which is essential for the collection and dissemination of a variety of data needed in the supply chain, and the ability to create a strategic development flexibility, which converts competence to be a benefit to the customer.
Customer Satisfaction
Customer satisfaction is the degree to which customers perceive that they are getting the products and services of greater value than the price they paid (Tracey, 1996). White (1996) defines several variables that may affect customer satisfaction, including quality, speed of delivery, reliability

ISSN 2302-786X
Proceeding of Annual South East Asian International Seminar (ASAIS) 2013 215
in delivery, cost, flexibility and innovation. Swamidass and Newell (1987) and Slack (1988) used satisfaction measurements based on the perceptions of experienced managers to measure customer satisfaction. This measurement include the retention, the ratio of price to value, quality, product reputation and customer loyalty.
3. METHODOLOGY Data, Population, Sample, and Sampling
This study uses data sources derived from primary data through direct questionnaire surveys, combined with secondary data of Solo batik company profile database.
Population in this research were both large and small batik companies in Solo - Indonesia. Using convinience sampling, samples taken from the batik companies managers in Solo. For small & medium enterprises, the manager allowed concurrently by the owner. The number of samples in this study were as many as 38.
Variables, Definition, and Measurement Endogen Variables
The endogen variables in this study are customer satisfaction, capabilities of manufacturing flexibility, and capabilities of spanning flexibity. The measurement of satisfaction variables were adopted from the measurement used by Zhang et al., (2006) which measures customer satisfaction based on the perception of the company. Assessment of measurement variables uses a Likert scale (1: Strongly Disagree - 5: strongly agree). Capabilities of manufacturing flexibility which includes volume and mix flexibility. Measurement of manufacturing flexibility were
adopted from Zhang et al., (2003) which adapted to the context of the study, while the measurement of capabilities of spanning flexibility were adopted from Zhang et al., (2006). Assessment of measurement variables using Likert scale (1: strongly disagree - 5: strongly agree).
Exogen Variables
The exogen variables in this study are competence of manufacturing flexibility and spanning flexibility. Competence manufacturing flexibility include: machine flexibility, flexibility of labor, raw material handling versatility, and flexibility pathways. While spanning flexibility is explained by supply chain information dissemination flexibility.
Measurement of manufacturing flexibility competencies adopted from measurements proposed by Zhang et al., (2003) which is adapted to the context of the study. The measurement of spanning flexibility competence were adopted from Zhang et al., (2006). Assessment measures of the two variables using Likert scale (1: strongly disagree - 5: strongly agree).
4. ANALYSIS This article is part of main research about customer satisfaction form manufacturing flexibility and spanning flexibility views (Rahardian et al.,2012). Result of main research is competences of manufacturing flexibility has significant effect on capabilities of manufacturing flexibility. Then, capabilities of manufacturing flexibility has no significant effect on customer satisfaction. Competences of Spanning flexibility has significant effect on capabilities of Spanning flexibility. Then, capabilities of Spanning flexibility has positive

ISSN 2302-786X
216 Proceeding of Annual South East Asian International Seminar (ASAIS) 2013
effect on customer satisfaction. This publication discussed about implementation of manufacturing flexibility and spanning flexibility to improve customer satisfaction. Based on the statistical results that show the importance of the indicators that measure variables, so can be seen that
indicators should be considered and indicators are considered.
This is statistical result represented value of outer loading of each indicator measuring variables with PLS program, and value of mean of each indicator measuring variables with MS. Excell.
Table 1. Outer Loading Value and Mean of each Indicator
Variables Indicators* Outer
Loading Mean
Manufactur Flexibility Competence
mf1. mf2. mf3. mf4. mf5. mf6.
lf1. lf2. lf4. lf5.
mh1. mh3. mh4. mh5.
rf1. rf2. rf4. rf5. rf6.
0,805 0,806 0,769 0,507 0,761 0,778
0,690 0,654 0,650 0,340
0,735 0,627 0,775 0,679
0,592 0,652 0,470 0,651 0,549
3,28 3,19 2,97 3,17 3,11 3,47
3,47 3,22 3,25 3,33
3,28 3,36 3,19 3,06
3,11 3,14 2,89 2,83 2,94
Spanning Flexibility Competence
idf1. idf2. idf3. idf4. idf5.
0,849 0,787 0,714 0,879 0,812
3,31 3,31 3,50 3,75 3,47
Manufactur Flexibility Capabilities : Volume Flexibility
vf1. vf2. vf3. vf4. vf5. vf6.
0,840 0,760 0,821 0,856 0,595 0,661
3,25 3,36 3,22 3,36 3,56 3,14
Manufactur Flexibility Capabilities : Mix Flexibility
mixf1. mixf2. mixf3. mixf4. mixf5. mixf6.
0,775 0,799 0,801 0,867 0,827 0,795
3,26 2,97 2,89 2,94 3,33 3,03
Spanning Flexibility Capabilities : Strategy Development Flexibility
sdf1. sdf2 sdf3. sdf4. sdf5. sdf6.
0,859 0,756 0,841 0,833 0,884 0,817
3,61 3,44 3,61 3,75 3,33 3,61
Customer Satisfaction
cs1. cs2. cs3. cs4. cs5. cs6.
0,930 0,783 0,894 0,887 0,848 0,868
3,86 3,83 3,75 3,92 3,97 4,00
Source : Primary data processed, 2012 *) Indicators that are valid both discriminant and convergen
Based on value of outer loading dan mean presented at Table 1 above, shows that there is a difference
between the indicators that should be considered with the indicators that firms consider.

ISSN 2302-786X
Proceeding of Annual South East Asian International Seminar (ASAIS) 2013 217
Indicators Competences of Manufacturing Flexibility
Machine Flexibility Implementation of machine flexibility in batik firms, there is a difference between the indicators that should be considered with indicators is considered. Indicator that should get the most serious emphasis is a typical machine can perform many types of operations, while indicator have serious emphasis is machine set-ups are easy. Related to implementation machine flexibility, Batik firms in Solo more priority to facilitate the conduct of machine setup.
Labor Flexibility Implementation of labor flexibility in batik firms, compliance among indicators that should get priority attention by the firms prioritized indicators. That Indicator is workers can perform many types of operations effectively. Batik firms in Solo conduct employee rotation among division so that all employees can perform a variety of jobs available in the firm. So, production process will not be interrupted when the worker in charge of a job was unable to attend because it can easily be replaced by another worker.
Material Handling Flexibility Same as Implementation of machine flexibility in batik firms, implementation of material handling flexibility also has difference between the indicators that should be considered with indicator is considered. Indicator that should get the most serious emphasis is a typical material handling system can handle different part typesa, while indicator have serious emphasis is material handling system can move different part types through manufacturing facilities. Related to implementation
material handling flexibility, batik firms in Solo intent undertake to handling system can move different part types through manufacturing facilities.
Routing Flexibility Implementation of routing flexibility in batik firms, also has difference between the indicators that should be considered with indicator is considered. Indicator that should get the most serious emphasis is machine visitation sequence can be changed or replaced quickly, while indicator have serious emphasis is a typical part can use many different routes. In batik firms context, they are given priority in order to be flexible production process flow through existing routing.
Indicators Capabilities of Manufacturing Flexibility
Volume Flexibility Implementation of volume flexibility in batik firms, there is a difference between the indicators that should be considered with indicator is considered. Indicator that should get the most serious emphasis is firm can quickly change the quantities for our products produced, while indicator have serious emphasis is firm can vary aggregate output from one period to the next.
Mix Flexibility Implementation of volume flexibility in batik firms, also there is a difference between the indicators that should be considered with indicator is considered. Indicator that should get the most serious emphasis is firm can produce, simultaneously or periodically, multiple products in a steady-state operating mode, while indicator have serious emphasis is firm can vary product combinations from one period to the next.
ISSN 2302-786X
218 Proceeding of Annual South East Asian International Seminar (ASAIS) 2013
Indicators Competences of Spanning Flexibility
Supply Chain Information Dissemination Flexibility Implementation of supply chain information dissemination flexibility in batik firms, compliance among indicators that should get priority attention by the firms prioritized indicators. That Indicator is information flows quickly along the value chain. Information flows along the value chain is a serious concern for batik firms in Solo. That have significant effect on agility batik firms in Solo to meet customer needs.
Indicators Capabilities of Spanning Flexibility
Strategy Developmet Flexibility Implementation of strategy developmet flexibility in batik firms, there is a difference between the indicators that should be considered with indicator is considered. Indicator that should get the most serious emphasis is firm quickly develop strategy based on the coordination and integration of information along the value chain, while indicator have serious emphasis is firm continuously experiment, learn, and improve our practices to improve productivity. Batik firms in Solo tend to focus in internal capabilities to improve their productivity through experiment, learn, and improve their practices.
Indicators Customer Satisfaction
Customer Satisfaction There is difference perception between the indicators that should be considered with indicator is considered about customer satisfaction. Indicator that should get the most serious emphasis is customers keep doing business with
us, while indicator have serious emphasis is customers are loyal to our products. Batik firms in Solo belive if customer loyalty is a manifestation of customer satisfaction.
5. CONCLUSION In the context of corporate batik in Solo, there are many discrepancies in the implementation of manufacturing flexibility and spanning flexibility to improve customer satisfaction. This discrepancies causes ineffectiveness on implementation of manufacturing flexibility and spanning flexibility in firms then less improve customer satisfaction. From nine variables proposed in this study, only two variables appropriate between that indicators should be considered and indicators are considered. That is labor flexibility and supply chain information dissemination flexibility.
6. BIBLIOGRAPHY [1] Barney, J. 1991. Firm Resources
and Sustained Competitive Advantage. Journal of Management, 17 : 99-120.
[2] Bo Rundh. 2011. Linking Flexibility and Entrepreneurship to The Performances of SMEs in Export Markets. Journal of Manufacturing Technology Management. Vol. 22 Iss: 3 pp. 330 – 347.
[3] Bowersox, D., Stank, T. and Daugherty, P. 1999. “Lean launch: managing product introduction risk through response-based logistics”, Journal of Product Innovation Management, Vol. 16, pp. 557-68.
[4] Camisón, César ; Ana Villar López. 2010. An Examination of The Relationship Between Manufacturing Flexibility and Firm Performance: The Mediating

ISSN 2302-786X
Proceeding of Annual South East Asian International Seminar (ASAIS) 2013 219
Role of Innovation. International Journal of Operations & Production Management. Vol. 30 Iss: 8 pp. 853 – 878.
[5] Chapman, Ross L. ; Terry R. Sloan. 1999. Large Firms Versus Small Firms - Do They Implement CI the Same Way?. The TQM Magazine, Vol. 11 Iss: 2 pp. 105 - 110
[6] Day, G.S., 1994. The capabilities of market driven organizations. Journal of Marketing 58, 37–52.
[7] El-Khasawneh, Bashar Sami. 2012. Challenges and remedies of manufacturing enterprises in developing countries : Jordan as a case study. Journal of Manufacturing Technology Management. Vol. 23 No. 3, 2012 pp. 328-350.
[8] Gerwin, D. 1987. An Agenda for Research on The Flexibility of Manufacturing Processes. International Journal Operation & Production Management. Vol: 7, p 38–49.
[9] Gerwin, D. 1993. Manufacturing Flexibility, a Strategic Perspective. Management Science. Vol. 39.No. 4. p 395–410.
[10] Griffin, R.W ; R.J. Ebert. 1996. Business Essentials 5th ed. Prentice Hall
[11] Hair Jr, Joseph F; William C. Black; Barry J. Babin; Rolph E. Anderson. 2010. Multivariate Data Analysis. Pearson Prentice Hall : United States of America
[12] Hyun, J.; Ahn, B.H. 1992. A Unifying Framework for Manufacturing Flexibility. Manufacturing Review. Vol. 5 No. 4. p 251–260.
[13] Jogiyanto. 2004. Metodologi Penelitian Bisnis : Salah Kaprah
dan Pengalaman – Pengalaman. Yogyakarta : BPFE.
[14] Juga, J. (1996), “Organizing for network synergy in logistics: a case study”, International Journal of Physical Distribution & Logistics Management, Vol. 26 No. 2, pp. 51-67.
[15] Koufteros, X.A.; Vonderembse, M.A.; Doll, W.J. 1997. Competitive Capabilities : Measurement and Relationships. In: National Proceedings of Decision Science Institute. 3 November, pp. 1067–1069.
[16] Krajewski, L. and Wei, J. 2001. The Value of Production Schedule Integration in Supply Chains. Decision Sciences, Vol. 32 No. 4, pp. 601-34.
[17] Millar, B, James A ; Wade Bowen. 2011. Small and Large Firm Regulatory Costs: The Case of The Sarbanes-Oxley Act. Corporate Governance. Vol. 11 Iss: 2 pp. 161 – 170.
[18] Nosbusch, Keith D. ; John A. Bernaden. 2011. The Multiplier Effect : There Are More Manufacturing-Related Jobs Than You Think. Manufacturing Executive Leadership Journal.
[19] Olhager, J. 1993. Manufacturing Flexibility and Profitability. International Journal Production Economic. Vol. 30–31, p 67–78.
[20] Parthasarthy, R ; Sethi, S.P. 1993. Relating Strategy and Structure to Flexible Automation: a Test of Fit and Performance Implications. Strategic Management Journal. Vol: 14. No. 7, p 529–549.
[21] Ramasesh, R.V.; Jayakumar, M.D. 1991. Measurement of Manufacturing Flexibility : a Value Based Approach. Journal of

ISSN 2302-786X
220 Proceeding of Annual South East Asian International Seminar (ASAIS) 2013
Operations Management . Vol. 10 No. 4. p 446–468.
[22] Russo, Angeloantonio ; Antonio Tencati. 2009. Formal VS Informal CSR Strategies : Evidence from Italian Micro, Small, Medium-sized, and Large Firms. Journal of Business Ethics. Vol. 85 : 339–353.
[23] Sethi, A ; Sethi, S. 1990. Flexibility in Manufacturing: a Survey. International Journal Flexible Manufacturing System. Vol. 2. p 289–328.
[24] Slack, N. 1988. Manufacturing Systems Flexibility: an Assessment Procedure. Computer Integrated Manufacturing Systems. Vol. 1.No. 1. p 25–31.
[25] Solimun. 2010. Analisis Multivariat Pemodelan Struktural: Metode Partial Least Square (PLS). Malang : CV Citra Malang
[26] Stalk, G.; Evans, P.; Shulman, L. 1992. Competing on Capabilities: The New Rules of Corporate Strategy. Harvard Business Review. March/April. 57–69.
[27] Swamidass, P.M., Newell, W.T., 1987. Manufacturing strategy, environment uncertainty and performance: a path analytical model. Management Science 33 (4), 509–524.
[28] Teece, D.J., Pisano, G., Shuen, A., 1997. Dynamic Capabilities and Strategic Management. Strategic Management Journal 18 (7), 509–533.
[29] Upton, D.M. 1994. The Management of Manufacturing Flexibility. California Management Review. Winter. p 72–89.
[30] Upton, D.M. 1995. What Really Makes Factories Flexible? Harvard Business Review Vol. 73 No. 4. p 74–84.
[31] Upton, D.M. 1997. Process Range in Manufacturing: an Empirical Study of Flexibility. Management Science Vol. 43 No. 8. p 1079–1092.
[32] Van Hoek, R. 2001. The Rediscovery of Postponement a Literature Review and Directions for Research. Journal of Operations Management, Vol. 19, pp. 161-84
[33] Vokurka, R.J ; O’Leary-Kelly, S.W. 2000. Review of Empirical Research on Manufacturing Flexibility. Journal of Operations Management. Vol. 18. p. 485-501.
[34] Wagner, Joachim. 1997. Firm Size and Job Quality: A Survey of the Evidence from Germany. Small Business Economics Vol. 9. p 411–425.
[35] Zhang, Qingyu ; Mark A. Vonderembse ; Jeen-Su Limc. 2003. Manufacturing Fexibility: Defining and Analyzing Relationships Among Competence, Capability, and Customer Satisfaction. Journal of Operations Management. Vol. 21 : 173–191.
[36] Zhang, Qingyu, Mark A. Vonderembse, and Jeen-Su Lim. 2006. Spanning Flexibility : Supply Chain Information Dissemination Drives Strategy Development and Customer Satisfaction. Supply Chain Management : An International Journal, 11(5) : 390–399.