Embed Size (px)
Citation preview
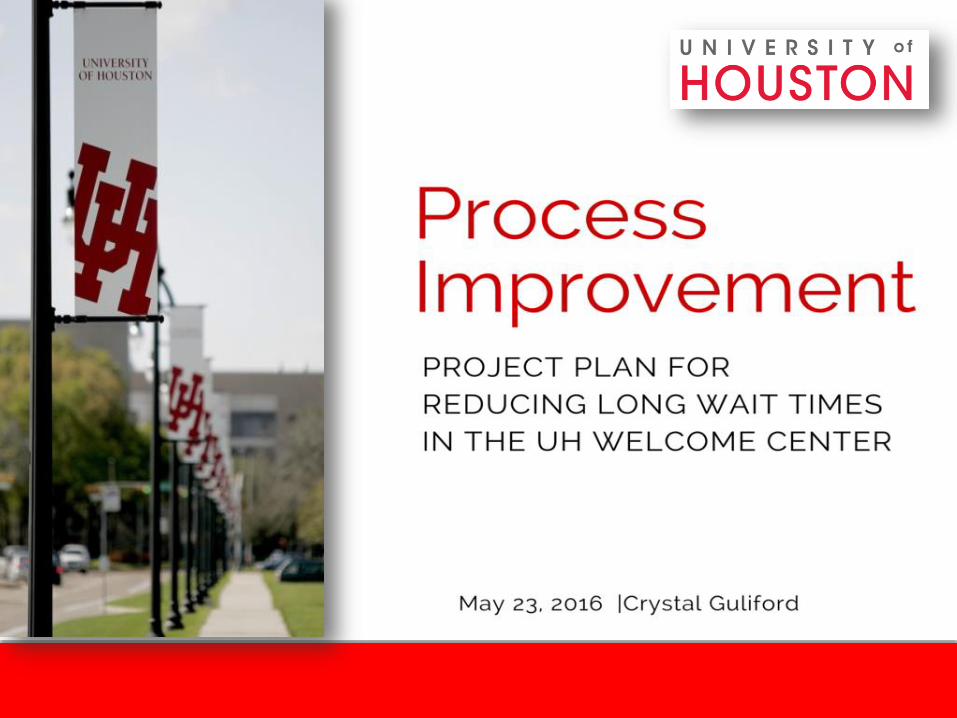
Organization Background
• Office of Enrollment Services Communication and Marketing (ESCM):
• Provides communication and marketing services to all departments within the Enrollment Services suite in order to support operations and initiatives.
• Seeking to develop a check-in and triage system to mitigate long lines and unnecessary wait times.
2
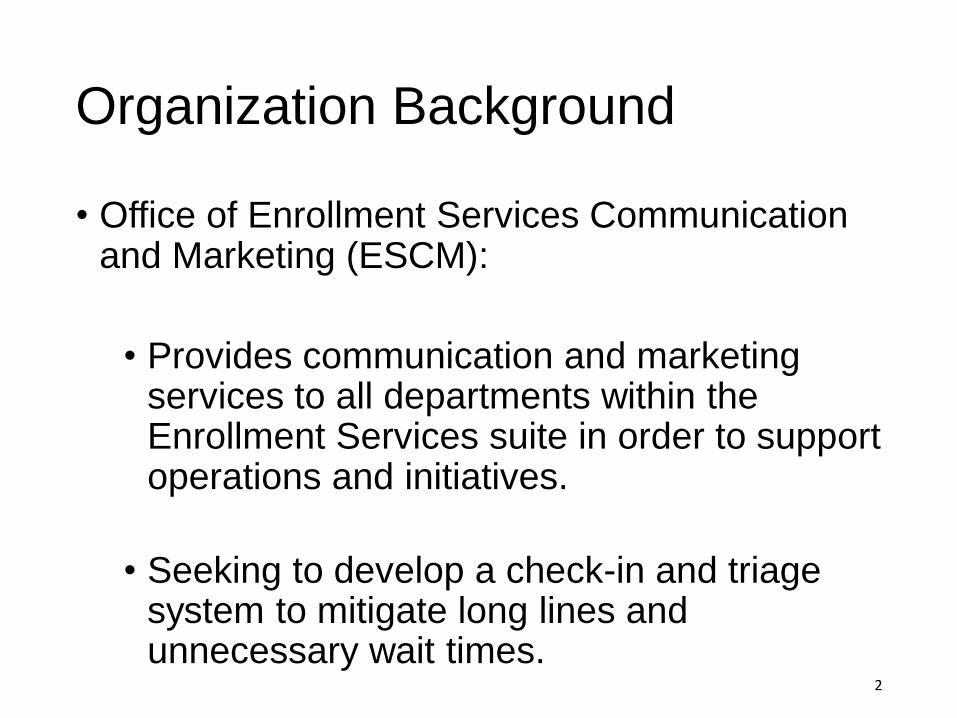
Areas of Responsibility
Admissions
• Undergraduate Admissions
• Freshmen Admissions
• Transfer Admissions
• International Admissions
• Admissions Events
• Graduate Admissions
Business Services
• Tuition and Fees
• Billing Due Dates
• Payment Matters
• Tax Information
• Orientation
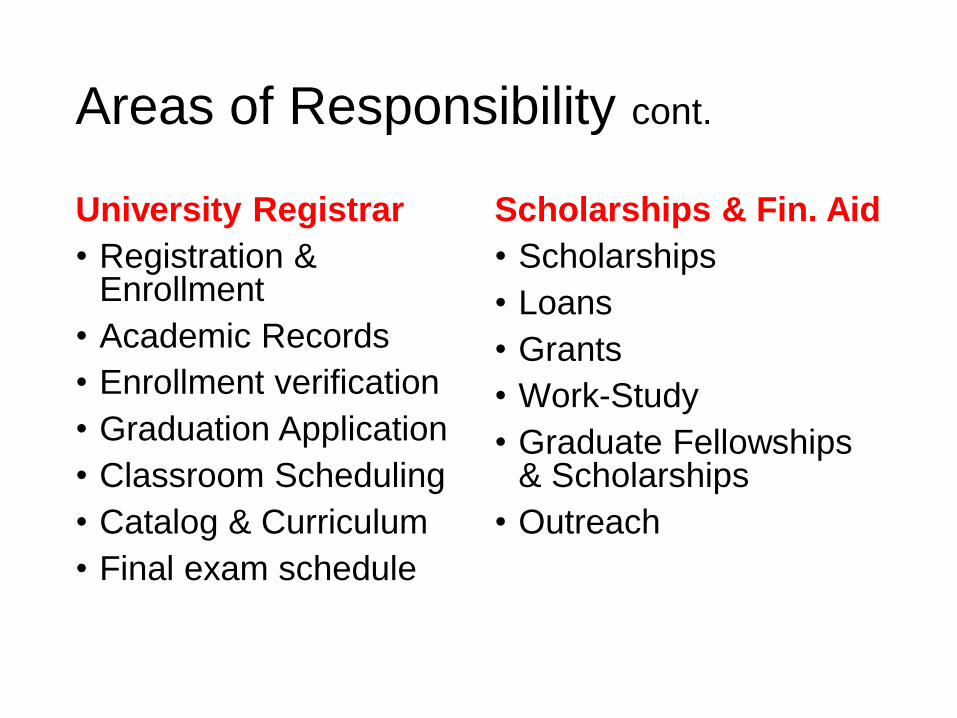
Areas of Responsibility cont.
University Registrar
• Registration & Enrollment
• Academic Records
• Enrollment verification
• Graduation Application
• Classroom Scheduling
• Catalog & Curriculum
• Final exam schedule
Scholarships & Fin. Aid
• Scholarships
• Loans
• Grants
• Work-Study
• Graduate Fellowships & Scholarships
• Outreach
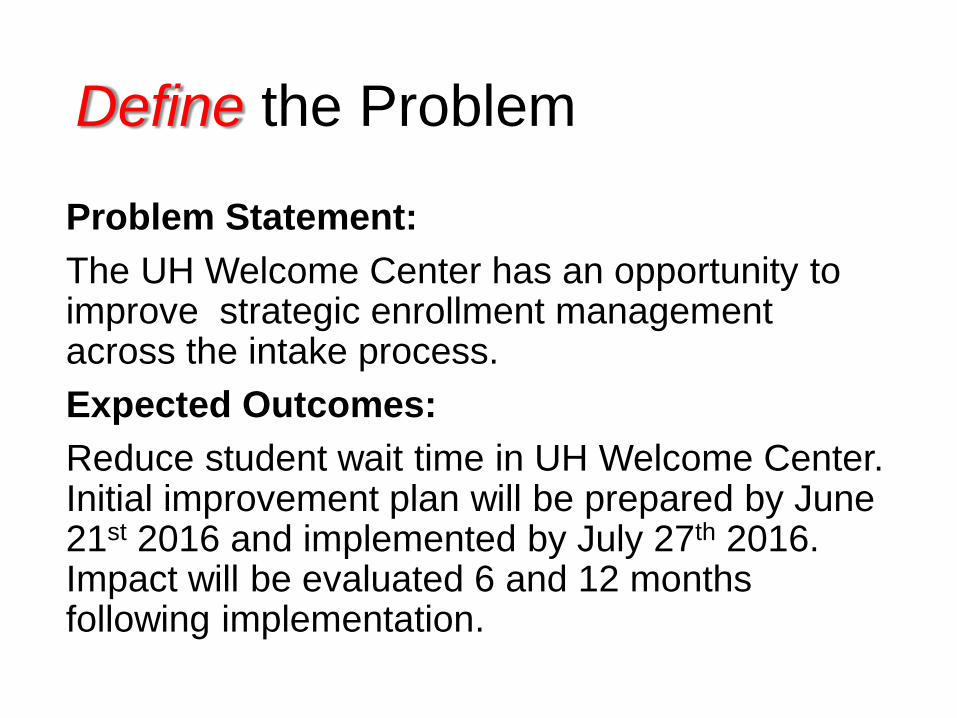
Define the Problem
Problem Statement:
The UH Welcome Center has an opportunity to improve strategic enrollment management across the intake process.
Expected Outcomes:
Reduce student wait time in UH Welcome Center. Initial improvement plan will be prepared by June 21st 2016 and implemented by July 27th 2016. Impact will be evaluated 6 and 12 months following implementation.
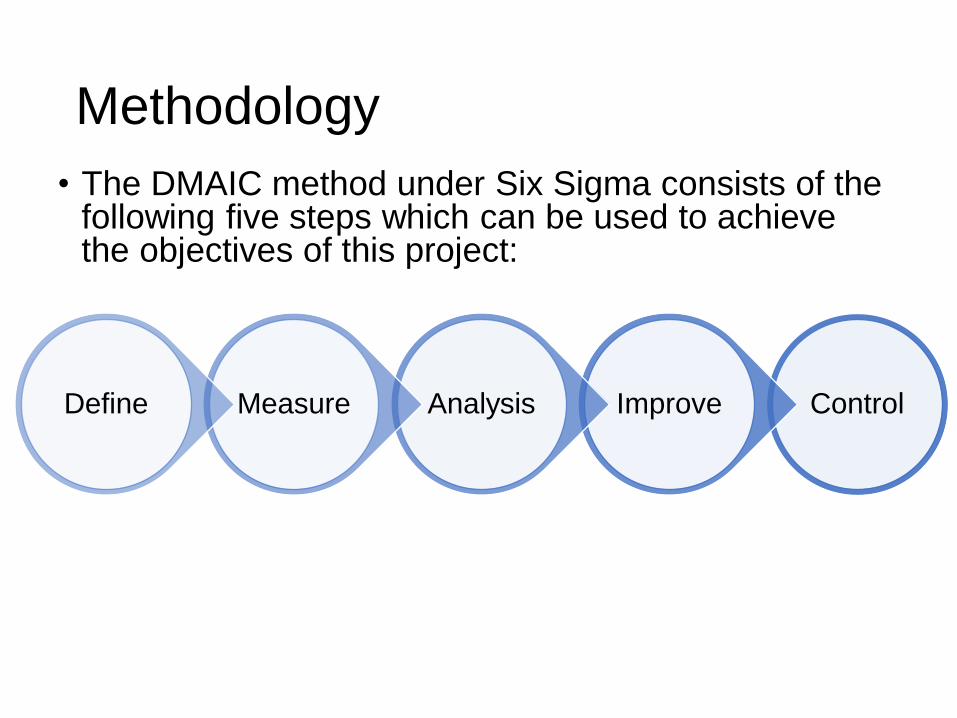
Methodology
• The DMAIC method under Six Sigma consists of the following five steps which can be used to achieve the objectives of this project:
ControlImproveAnalysisMeasureDefine
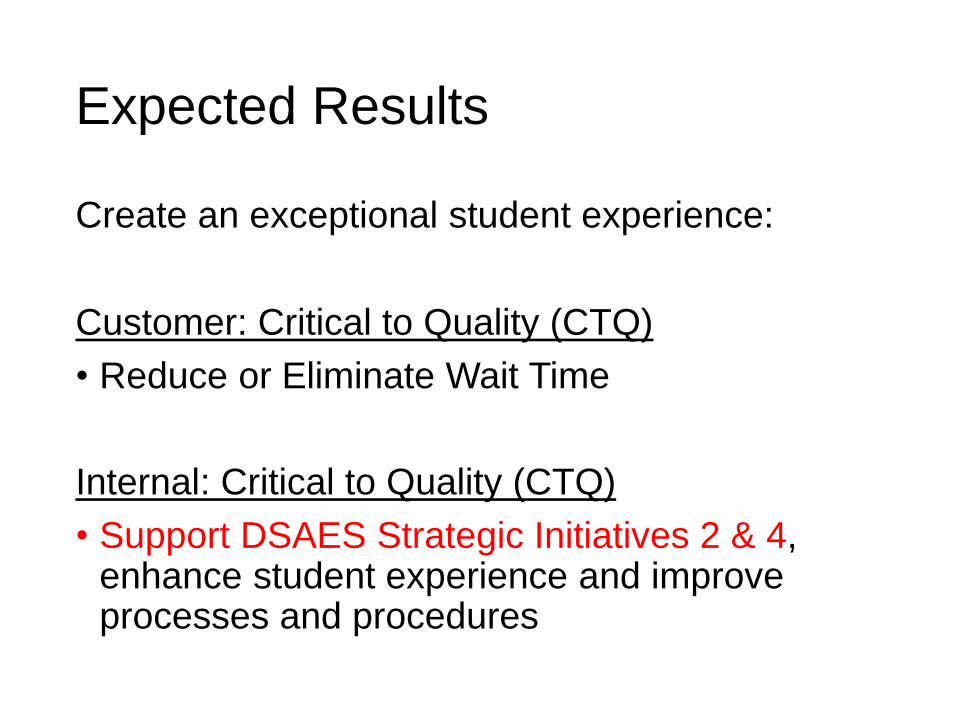
Expected Results
Create an exceptional student experience:
Customer: Critical to Quality (CTQ)
• Reduce or Eliminate Wait Time
Internal: Critical to Quality (CTQ)
• Support DSAES Strategic Initiatives 2 & 4, enhance student experience and improve processes and procedures
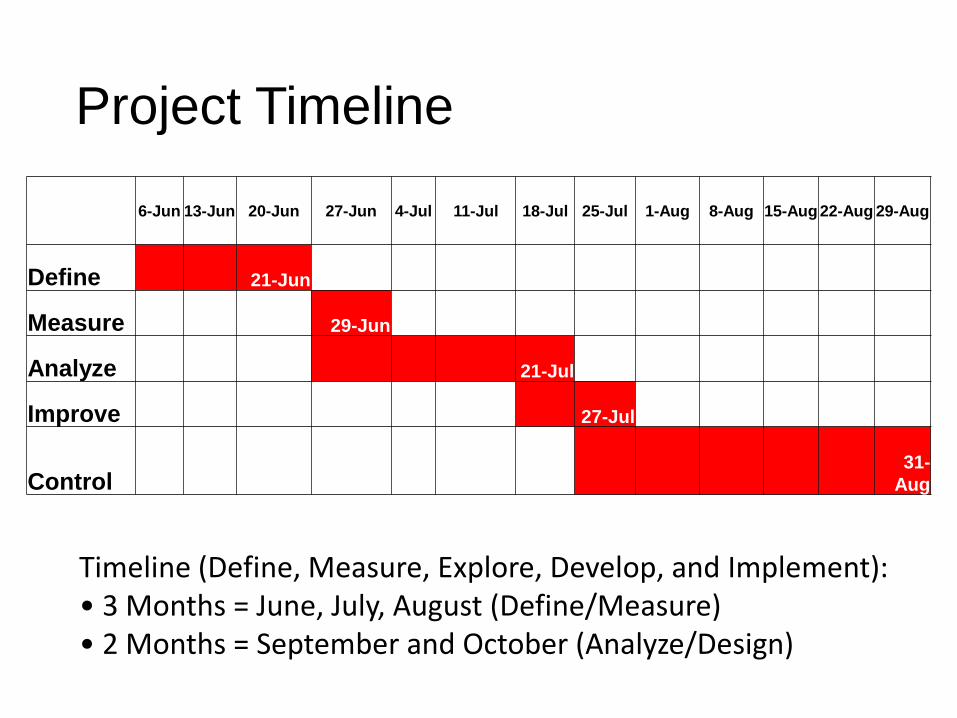
Project Timeline
6-Jun 13-Jun 20-Jun 27-Jun 4-Jul 11-Jul 18-Jul 25-Jul 1-Aug 8-Aug 15-Aug 22-Aug 29-Aug
Define 21-Jun
Measure 29-Jun
Analyze 21-Jul
Improve 27-Jul
Control31-
Aug
Timeline (Define, Measure, Explore, Develop, and Implement):• 3 Months = June, July, August (Define/Measure)• 2 Months = September and October (Analyze/Design)
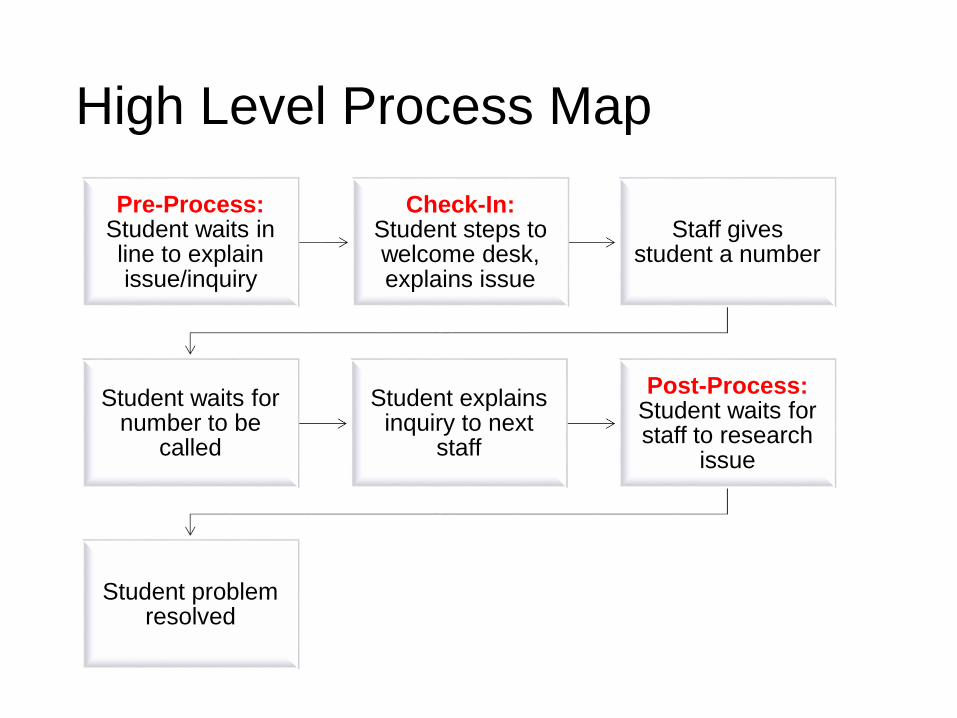
High Level Process Map
Pre-Process:Student waits in line to explain issue/inquiry
Check-In:Student steps to welcome desk, explains issue
Staff gives student a number
Student waits for number to be
called
Student explains inquiry to next
staff
Post-Process: Student waits for staff to research
issue
Student problem resolved
Process Maps
• Advising
• Financial Aid
• Orientation
• Application/Enrollment
• Advising
• Financial Aid
• Orientation
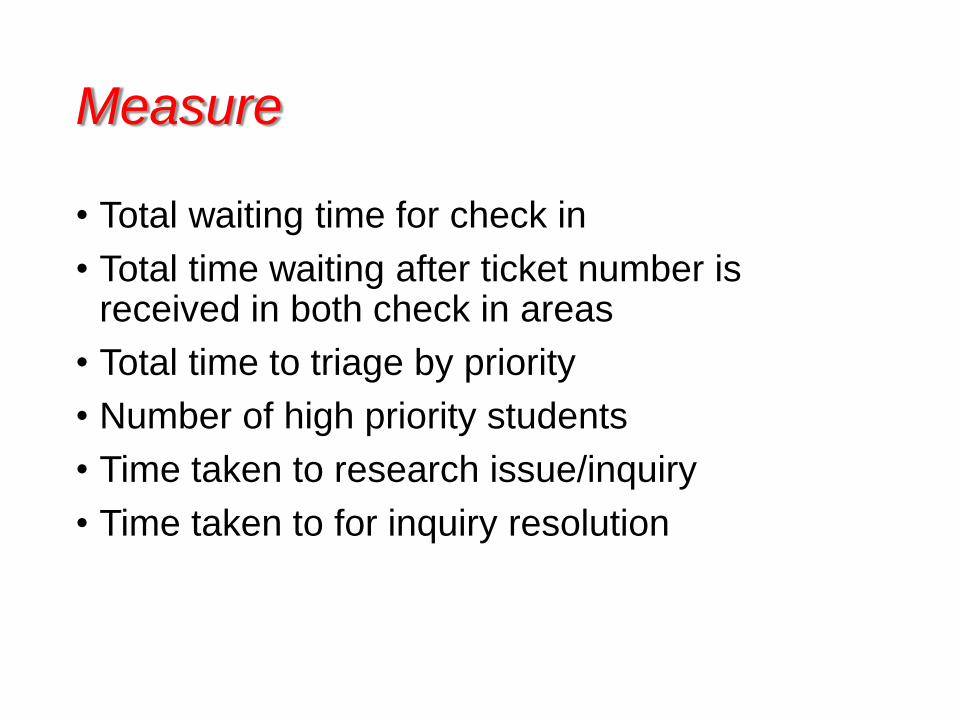
Measure
• Total waiting time for check in
• Total time waiting after ticket number is received in both check in areas
• Total time to triage by priority
• Number of high priority students
• Time taken to research issue/inquiry
• Time taken to for inquiry resolution
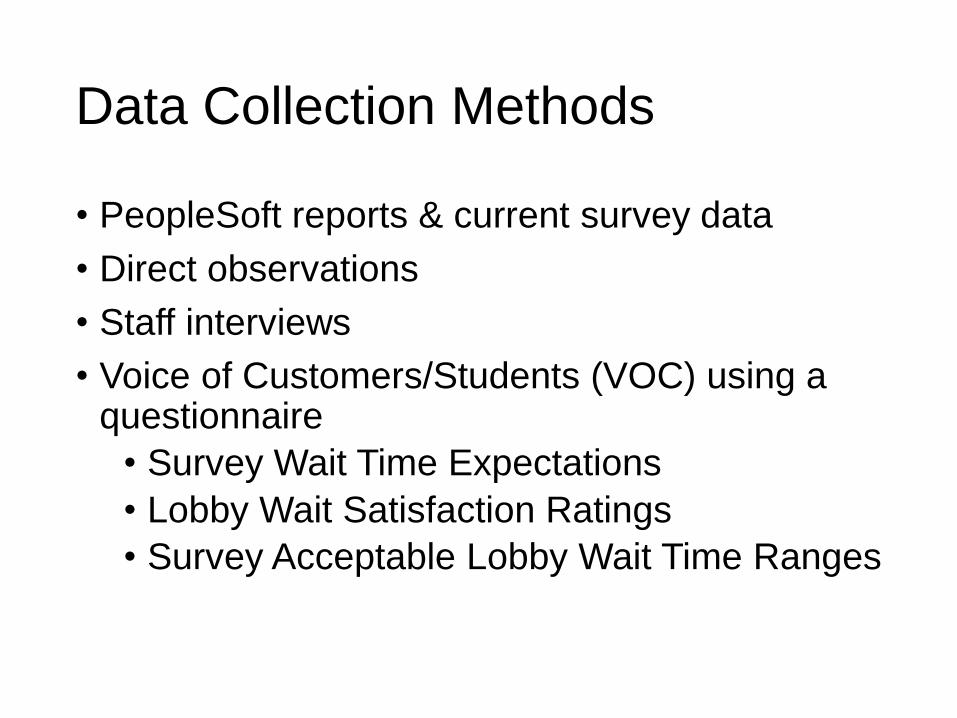
Data Collection Methods
• PeopleSoft reports & current survey data
• Direct observations
• Staff interviews
• Voice of Customers/Students (VOC) using a questionnaire
• Survey Wait Time Expectations
• Lobby Wait Satisfaction Ratings
• Survey Acceptable Lobby Wait Time Ranges
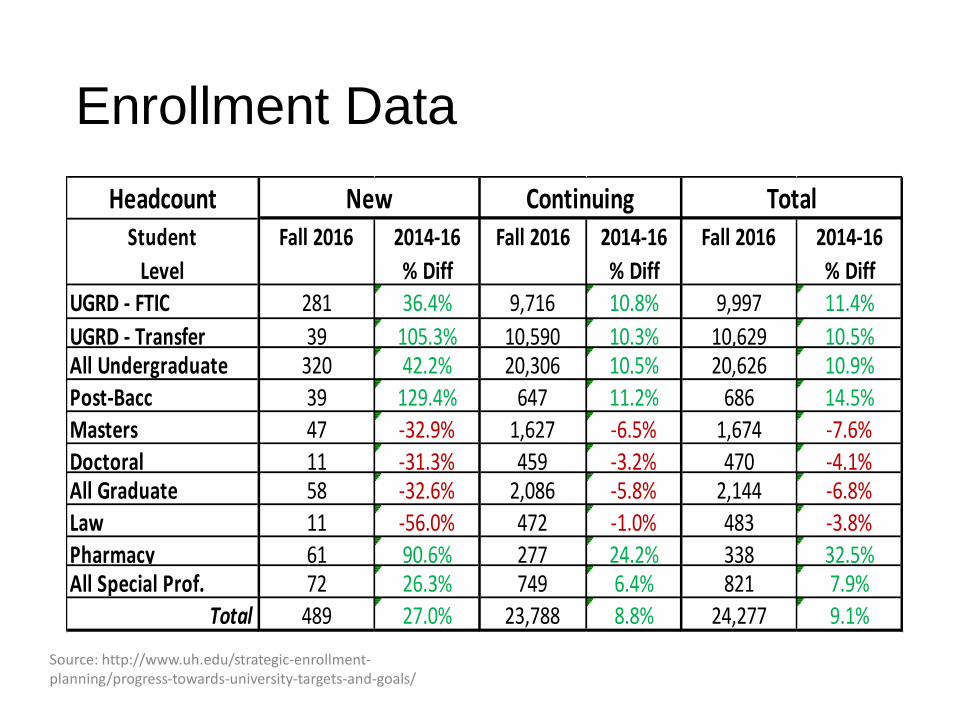
Enrollment Data
Source: http://www.uh.edu/strategic-enrollment-planning/progress-towards-university-targets-and-goals/
HeadcountStudent
Level
Fall 2016 2014-16
% Diff
Fall 2016 2014-16
% Diff
Fall 2016 2014-16
% DiffUGRD - FTIC 281 36.4% 9,716 10.8% 9,997 11.4%
UGRD - Transfer 39 105.3% 10,590 10.3% 10,629 10.5%All Undergraduate 320 42.2% 20,306 10.5% 20,626 10.9%Post-Bacc 39 129.4% 647 11.2% 686 14.5%Masters 47 -32.9% 1,627 -6.5% 1,674 -7.6%Doctoral 11 -31.3% 459 -3.2% 470 -4.1%All Graduate 58 -32.6% 2,086 -5.8% 2,144 -6.8%Law 11 -56.0% 472 -1.0% 483 -3.8%Pharmacy 61 90.6% 277 24.2% 338 32.5%All Special Prof. 72 26.3% 749 6.4% 821 7.9%
Total 489 27.0% 23,788 8.8% 24,277 9.1%
New Continuing Total
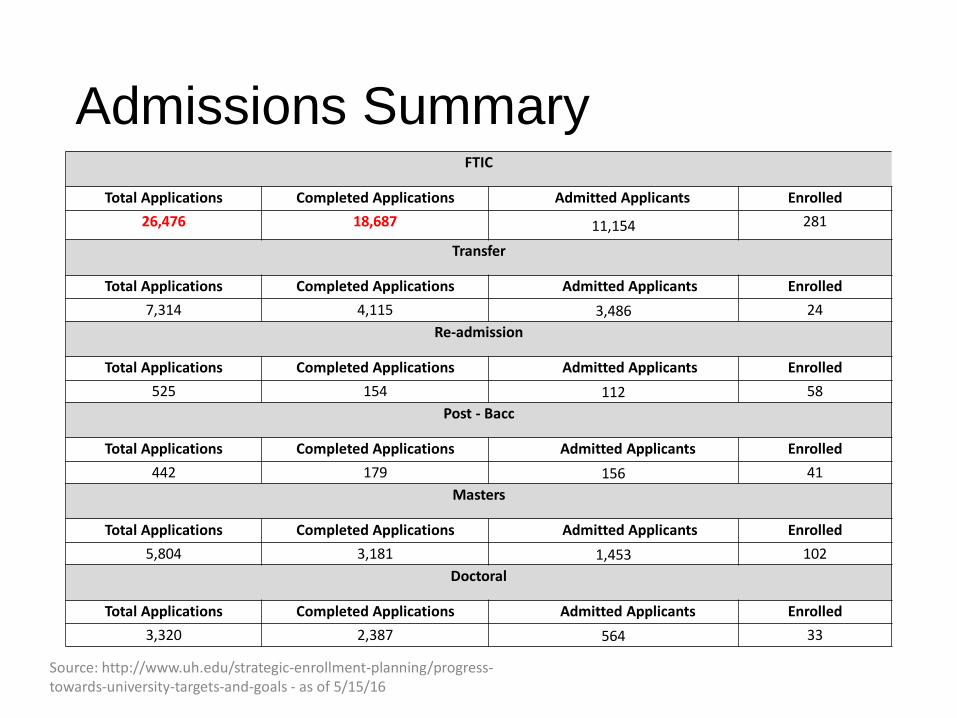
Admissions SummaryFTIC
Total Applications Completed Applications Admitted Applicants Enrolled
26,476 18,687 11,154 281
Transfer
Total Applications Completed Applications Admitted Applicants Enrolled
7,314 4,115 3,486 24
Re-admission
Total Applications Completed Applications Admitted Applicants Enrolled
525 154 112 58
Post - Bacc
Total Applications Completed Applications Admitted Applicants Enrolled
442 179 156 41
Masters
Total Applications Completed Applications Admitted Applicants Enrolled
5,804 3,181 1,453 102
Doctoral
Total Applications Completed Applications Admitted Applicants Enrolled
3,320 2,387 564 33
Source: http://www.uh.edu/strategic-enrollment-planning/progress-towards-university-targets-and-goals - as of 5/15/16
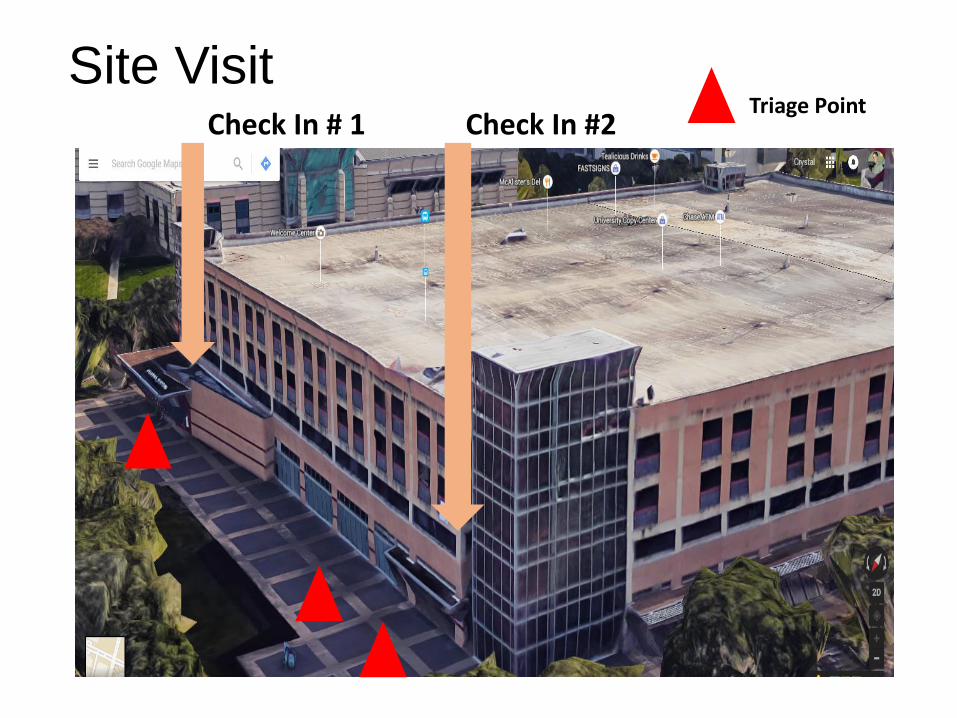
Check In # 1 Check In #2Triage Point
Site Visit
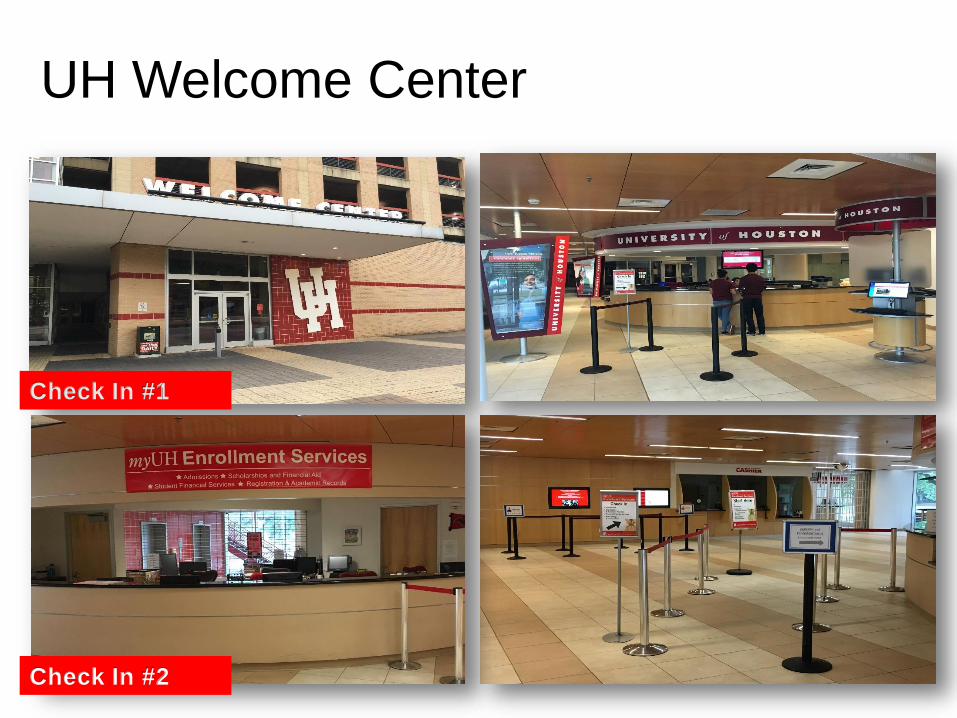
UH Welcome Center
Check In #1
Check In #2
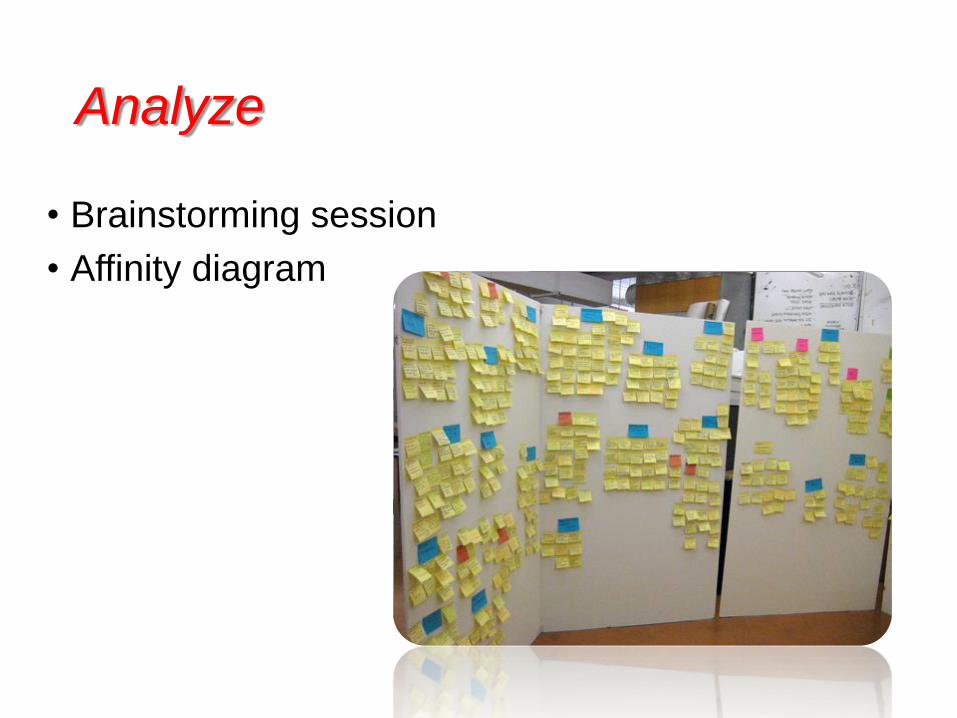
Analyze
• Brainstorming session
• Affinity diagram
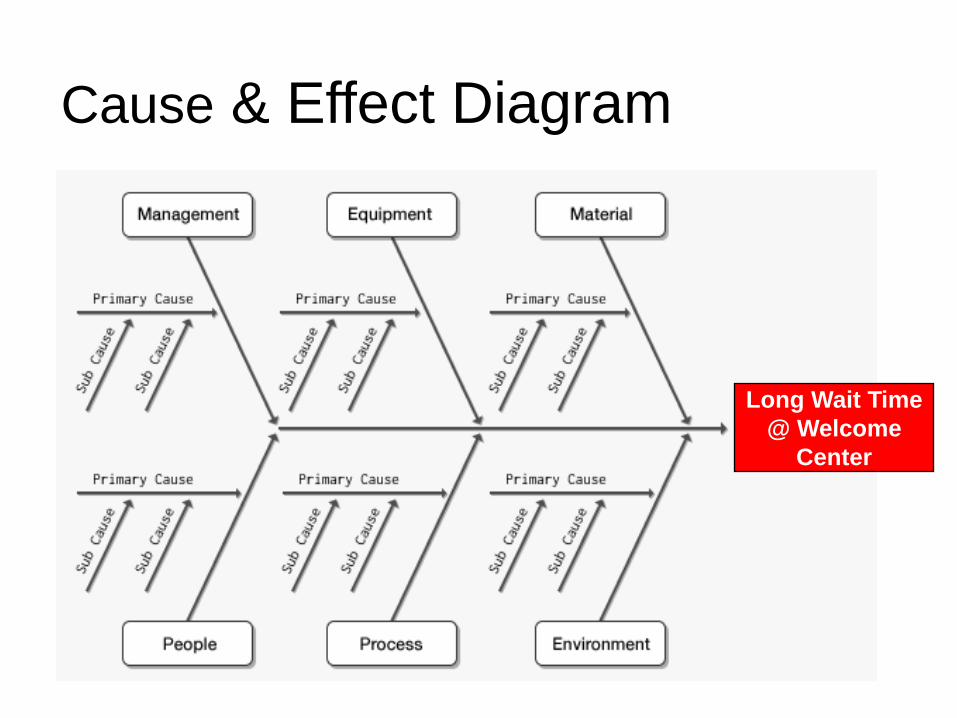
Long Wait Time
@ Welcome
Center
Cause & Effect Diagram
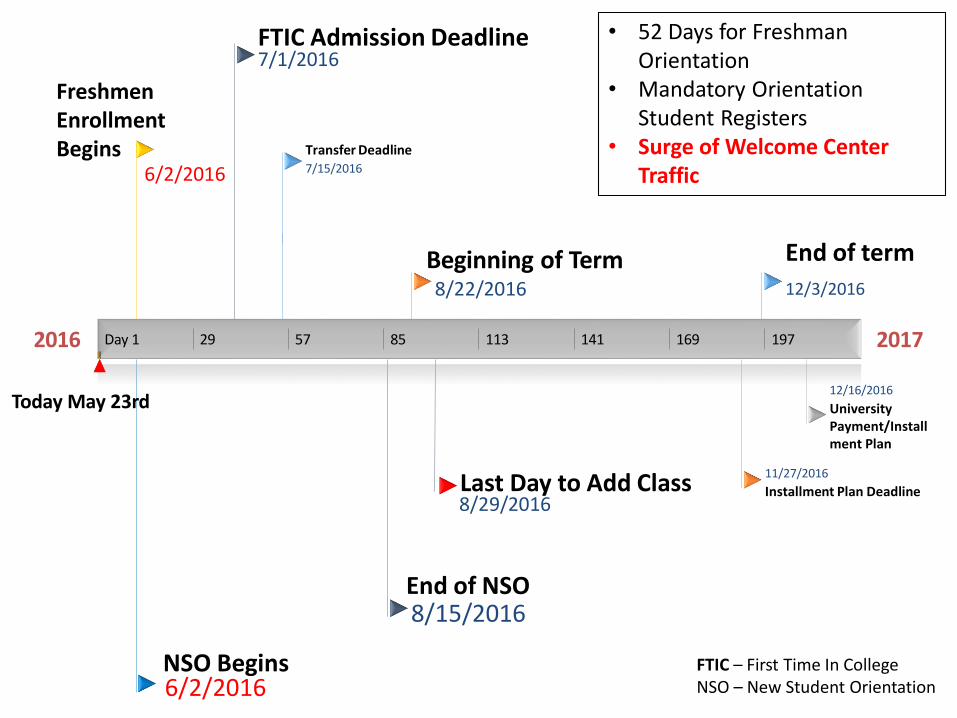
2016 2017
Today May 23rd
Day 1 29 57 85 113 141 169 197
FTIC Admission Deadline7/1/2016
Transfer Deadline7/15/2016
Beginning of Term8/22/2016
End of term
12/3/2016
Freshmen Enrollment Begins
6/2/2016
NSO Begins6/2/2016
End of NSO8/15/2016
Last Day to Add Class8/29/2016
Installment Plan Deadline
11/27/2016
University Payment/Installment Plan
12/16/2016
• 52 Days for Freshman Orientation
• Mandatory Orientation Student Registers
• Surge of Welcome Center Traffic
FTIC – First Time In CollegeNSO – New Student Orientation
Improve
• Brainstorming by project owners and members
• Testing the solutions
• Assessing the outcome of the executed solutions
• Select the best solutions
• Design implementation plan
Possible Solutions
• Iphone App CRM Tools
• Student Flow Facilitator
• Volunteer Team Communication
• Modified Zoning & Triage
• HUGE BIG OLE Communication Board
• Department Protocols
• Stakeholder Support
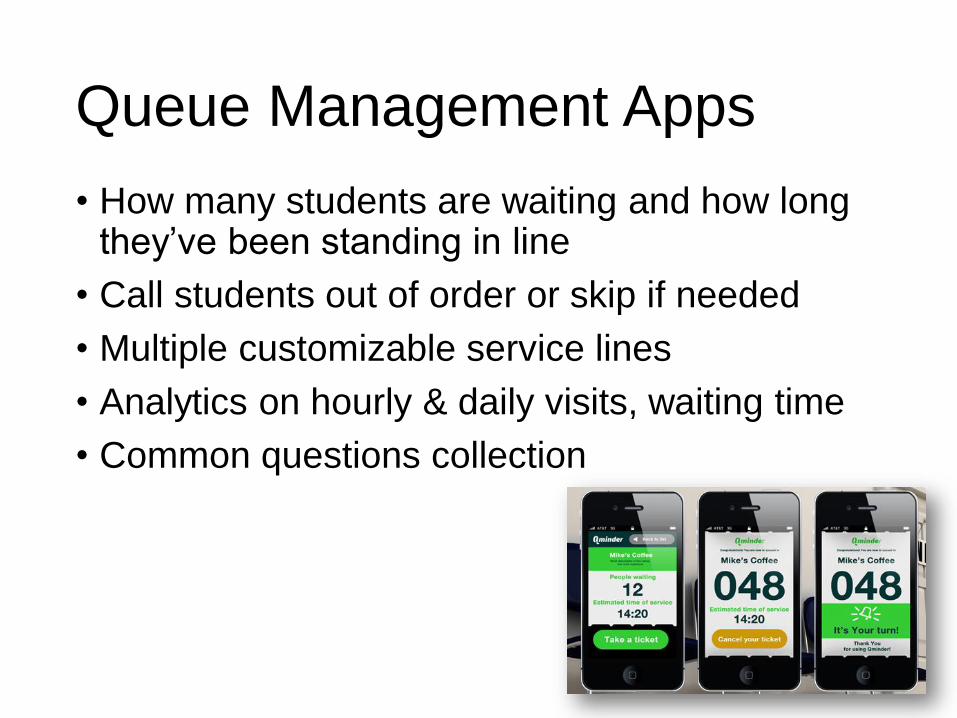
Queue Management Apps
• How many students are waiting and how long they’ve been standing in line
• Call students out of order or skip if needed
• Multiple customizable service lines
• Analytics on hourly & daily visits, waiting time
• Common questions collection
Control
• Guidelines & Assigned Responsibility
• New Standard Operating Procedure
• Data Review, Reporting & Accountability
• Quarterly manual/automated data analysis
• Monthly reports and control charts
• Communication & Recognition
• Incorporation of staff recognition for ongoing positive results
Questions
5/22/2016 24