Embed Size (px)
Citation preview

weii: 6710/10-1 DRILLING FLUIDS PROGRAMField: Nordland VIRig: West Navion
HOLE
SIZE
36"
17 1/2"
12 1/4"
TVDMD
425
840840
10951095
CASING
SIZE
SO'-
TVDMD
425
ia 3/8"
0
834834
00
8 1/2" 22672267
0 00
MUDTYPE
Seawater/Bentonite
MW
[SO]
1.03-1.30
LGS
[KG/m*]
10sec.
[Pa]
10min.
[Pa]
Fann100 rpm
(lba/100*q.ft
38
Fann3 rpm
17
PV
[cP]
6,5
APIFL
[ml]
HTHPFL
[ml]
MBT
[KG/m*]
PH
9,6
FV
[»ec]
109
KCI
(kg/m3)
Glycol
[%]
Total VolumeOld VolumeNew Volume
Usage[ml
3290
329106
Comments: A total of 329 m3 (hivis pills and displacement fluid) - 223 m3 was transferred to next section. The section was drilled with seawater and 5-1 0 m3 hiv s pills every 1 S m. At TO the hole was swept clean with a 30 m3hivis pill and then the well was displaced to 1,3 sg Bentonite/CMC mud before pulling out to run casing. Mining: Due to lack of shearing device, a higher concentration of bentonite was mixed to achieve required specifications.
SW/Bent sweeps
SW/Bent Displacm.fl.
Kill fluid
1.03
1.3
1.7 8 14
37
41
16
16
8
27
9,510469
79
523223300523
Comments: A total of 223 m3 spud mud was transferred from the 36" section. Further 300 m3 were built. Spud mud was diluted with 30 % seawater before pumping.A total of 68 m3 Glydrill mud was weighted up to 1 ,7 sg and used for killmud due to problems with the surge tank while mixing/prehydrating bentonilje mud. The section was drilled with seawater and hivis sweeps of 5-1 0 m3 every 1 5 m.
Glydril 1.25 26 6 7 30 1 1 12 3,5 na 10 8,5 147 5
51424926560
Comments: A total of 249 m3 Glydril mud was received from field. This volume included 235 m3 Glydril Deepwater mud from Fylla - Greenland. KCI premix, Kill mud, Deepwater mud and drillwater was blended and weightedto 1 ,25 sg. This was done to save time and to reduce sulphate content in deepwater mud. Additional viscosifier was added to increase low end rheology once drilling commenced. The mud system was pre-treated with 1 kg/m3Citric Acid and Sodium Bicarbonate prior to drilling cement. Addition of KCI dry salt and viscosifier was mixed as required and additional chemicals added after an incident were 24 m3 of seawater entered the active system due to a openseawater valve on mud pumps. Since shearing the polymers is difficult at surface, the required rheology s first achived after a few circulations. It is therefore reccomended to add Duotec NS as quickly as possible after displacement.Furthermore, maintain a steady volume of polymers by adding directly to active. Due to fine mesh screens - polymers are lost at the shakers.
Glydril 1.25-1.27 14-406
8 - 10 30 1 1 12 3.5 na 10 8.5 147 5
623454169148
Comments: Maintenance of the active system continued as described for the 12 1/4' section. And the Glydril Mud system proved to be very effective n providing good hole cleaning and inhibition. Close inspection of increase in MBTlevels is required] along with control of KCI levels.

STATOIL
Title:
Geochemical evaluation of well 6710/10-1
Document no.:
TEK-F&T2901
Contract no ./project no.: Filing no.:
Classification: Distribution:
Restricted
Distribution date:
March 2001Rev. date: Rev. no.: Copy no.:
Author(s)/Source(s):
John Scotchmer, TEK-F&T
Subjects:
OUEDIREKTORATET2 8 JAN. 2002
Remarks:
See Summary on pageValid from: Updated:
Circulated by:
TEK-F&TAuthority to approve deviations:
TEK-F&T
Techn, responsible:
TEK-F&T
Responsible:
Recommended:
TEK-F&T
Approved:
TEK-F&T
Name:
John Scotchmer
Name:
Name:
Richard Patience
Name:
Frode Fasteland
Date/Signature:2^3'2£W>I /n n /nA)£JLfcc£L
Date/Signature:
Dato/Signature: X/7 / /
ifi/ot&j&faty0**Fot. /e. PAT/É«JC,C.
Date/Signature:
^V^V l~x\^s^SS .

SUMMARY
This report presents the results of a geochemical evaluation of the 6710/10-1 well (Heddastructure), Norwegian Sea. The well section is vertical and was drilled with GLYDRILLwater-based mud.

1 INTRODUCTION
This report presents the results of a geochemical evaluation of the 6710/10-1 well (Heddastructure), Norwegian Sea (Figure 1). The well section is vertical and was drilled withGLYDRILL water-based mud.
The total numbers of analyses carried out during the course of the study are as follows:
AnalysisSample preparationTOC contentRock-Eval pyrolysisVitrinite reflectanceKerogen descriptionSolvent extractionWhole extract GCAsphaltene precipitationMPLC separationSaturates GCSaturates GC-MSCarbon isotopes
Cuttings8787781
Core5252211
swc12712776555432
Mud
331111
Total2516251616181066542
Full details of the analytical programme on a sample-by-sample basis are presented in Table1. The analyses were carried out by Geolab Nor, with the exception of vitrinite reflectanceanalysis, which was carried out by IFE. All analytical work was performed in accordance withthe guidelines given in "The Norwegian Industry Guide to Organic Geochemical Analyses,3rd edition (1993)". The analytical data are presented in Appendix 1.

SampleDepth
SampleType
LithologyDescription
VitriniteReflectance
KerogenDescription
TOCContent *»«-RS52n
Whole Oil/ BulkExtract GC j Composition
SaturateGC
Saturate I CarbonGC-MS | Isotopes
Rock Samples891891926
1096.921101.321109.921121.51217.51286.213801380
1458.541460.23
149815701575
1627.217191719
1749.71816.21901.21965196519982061206121962196
2253.822652265
cutext cut
swcccpccpccpswcswcswccut
ext cutccpccpswcswccutswccut
ext cutswcswcswccut
ext cutswccut
ext cutcut
ext cutswccut
ext cut
X
XXXXX
X
XX
XX
XX
XXX
X
X
XX
X
X
X
XX
X
X
X
XXX
X
X
XX
XX
X
X
X
X
X
X
X
XXX
X
X
X
X
X
X
X
X
X
X
XX
X
XX
X
X
X
X
X
XX
X
X
X
X
X
X
XXX
X
X
X
XX
XXX
XX
XX
-xX
X
X
X
X
X
X
X
XX
X
X
X
X
X
XX
X
X
X
XX
XX
X
X
X
X
X
X
X
X
iI
X X
X
X
X
X
X
X
X
- -b—
X
X
Mud samples105016512267
MudMudMud
25 16 16 16 25
XXX
18
XXX
10
X
6
X
5
X
4 2
Table 1 Geochemical analytical programme

TeroanesDepth
(m RKB)1901.201998.002253.80
1641
SampleType
ClaystoneOSOSMud
22S0.250.570.610.60
TSTM
0.300.740.901.07
TTX
0.070.360.490.50
30D
0.030.040.060.08
30AB-HOP
0.680.900.880.88
28AB
2.910.100.040.20
TRICY
0.061.170.060.29
TETRA
0.070.460.110.27
35H_34H
1.130.810.440.69
29H_30H
0.621 . 1 60.690.97
DEMET
0.090.100.000.20
SteranesDepth
(m RKB)1901.20
19982253.8
1641
SampleType
ClaystoneOSOSMud
HOPST
8.483.3812.733.45
20S
-0.390.430.47
BB
0.230.540.530.59
C27BB
33413941
C28BB
48252625
C29BB
19343534
C30BB
0.000.040.040.05
DI AST
apo0.68
.Mjp __ _I_._O
1-26.1.35
Table 2 Saturated hydrocarbon biomarker ratios

GEOLAB NOR ASPO Box 5740 FossegrendaN-7437 TrondheimNorway
Tel: (47) 73 964000Fax: (47) 73 965974
Tel: (47) 73 96 40 00Fax: (47) 73 96 59 74E-Mail: [email protected]
CLIENT:
STATOIL
REF(S)
John ScotchmerORDER NO: G2000-40CONTRACT NO: DTJ 020215
TITLE
WELL 6710/10-1, HeddaStandard Geochemical Study
AUTHOR(S)
Peter Barry Hall
GEOLAB PROJECT NO.
62558
DATE
28/02/01
PROJECT MANAGER
Peter Barry Hall, Sr. ScientistQA RESPONSIBLE
lan Ferriday, Lab Manager
REPORT NO./FILE PAGE
lof 1

Comments
This data report has been sub-divided into two sections:
1. Rocks: cores and cuttings (all cuttings were washed, uncrushed source rocks cuttingswere also Soxtec-extracted for a short period before analysis).
2. Muds
The following points should be noted:
The well was drilled with a Glycol-based mud. TOC and Rock-Eval analysis was performedon the cuttings samples after picking, crushing and Soxtec extraction. The core and swcsamples were analysed directly (i.e. were not extracted before TOC and Rock-Eval analysiswere performed).

Table 1 Analytical Program for NOCS Well 6710/10-1, Hcdda (rock samples)
d>tr>OCuuaP^
SRSROSSROSOSSRSRSROSSROSSROSSRSROSSRSRSROSSRSROSSR
—
£Æ•4— <0,O)Q<u «•a fE iC3 E_ JSEL^^^Æ.
891 c926 s1096.2 p1101.32 p1109.92 p1121.5 s1217.5 s1286.2 s1380 c1458.54 p1460.23 p1498 s1570 s1575 c1627.2 s1719 c1749.7 s1816.2 s1901.2 s1965 c1998 s2061 c2196 c2253.8 s2265 cTotal
<uT30UJ22"3,03
SSSSSiSMSSiSS^S®!:;U26/0013-2U26/0001-1U26/0021-1U26/0022-1U26/0023-1U26/0002-1U26/0003-2U26/0004-1U26/0014-3U26/0024-1U26/0025-1U26/0005-1U26/0006-1U26/0015-1U26/0007-1U26/0016-3U26/0008-1U26/0009-1U26/0010-1U26/0017-1U26/0011-1U26/0018-1U26/0019-1U26/0012-1U26/0020-1
|D,'5
V)
&>.§"o-SJIIISx'*!-*
X
X
X
X
X
X
X
X
X
X
X
X
X
X
X
X
X
X
X
X
X
XX
X
X
25
60
USto
a00i£•?•:??•::•:•:•:•:•:::•:•
00 C V
eL ^Mi <-<P Bb <L>
lgliilll11111
W3
1 1
111 uH £P ^ Ofri "S H> J5 O o
åiLliji ! !i!:ii §i:§iS?::§iiSS^Si ^Sw i-i
X
X
X
X
X
X
X
X
X
X
X
X
X
X
X
X16
Sample type key c = Cuttings s = SWC p = Conv core/ plug o=oil g= gas m=mud§ isotope analysis on SAT and ARO only
13
!IllX
X
X
X
X
X
X
X
X
X
X
X
X
X
X
X
X
XX
X
X
X
X
X
X
25
1osX
UJ
Is.c iÉ £S oDC >.O £i
§•Z3
8
££M
l(X
X
X
X
X
X
X
X
X
8
00.scx
£•!«•:•>:•:v':X;X:$
SOt/>g
.é,11
§•diX
Waico
IIIX
X
X
X
X
X
X
X
X
XXX
X
X
X
15
=*so"cdX!cx,s(S3H
X
X
X
X
X
5
uo
i•:&:•$
X
X
X
X
X
X
X
7
uoraoJl)"o
fil111
9 11 18 srt J!co <:
plipliiST-X-X-X-yX-X-X's^Sftffi:^:*
X
X
X
X
4
91co2UOrtco
II!
X
X
X
3
91CO
O
fliXvA*X-
eOoM
§•a1<4-lO
Ucxoo
,..#,11
X
X
2Q=quantitative, non-Q = not quantitative
- 1y i1 J.& K>^ U6 iE .s.<.....>.Iplllii
X
X
X
X
X
X
X
X
X
X
X
X
X
X
X
X
16
u00§
54-3
£lilljX&vXvX
X
X
X
X
XX
X
X
X
X
XX
X
X
X
X
16
1gII6 "o £0 g-t/i «_•S OO .2
11
Page 1 GEOIAB!BNOR

GEOIAB!BNOR
NOTEAsterisk marks siltstone and shale samples which were extracted before TOC andRock-Eval analyses

- 1-GEOLAB!É!NOR
Table 3 : Lithology description for well NOCS 6710/10-1Depth unit of measure: mDepth Type Grp Frm Age Trb SampleInt Cvd TOC% % Lithology description
891.00 cut90 S/Sst : gy w, f, crs, l 0013-1L
0 . 5 6 * 10 Sltst : pi gy, s, argill, mic 0013-2L
9 2 6 . 0 0 swc 00011.15 100 Sh/Clst: dsk y brn to brn blk, sit 0001-1L
1 0 9 6 . 9 2 ccp 0021100 S/Sst : pi gy to lt ol gy, carb, sit, 0021-1L
argill, mic
1101.32 ccp 00221 . 6 5 100 Sh/Clst: dsk y brn 0022-1L
1 1 0 9 . 9 2 ccp 0023100 S/Sst : pi gy to lt ol gy, sit, argill, 0023-1L
mic, f, l
1121.50 swc 0002100 S/Sst : gy w, sft 0002-1L
1217.50 swc 00031.77 70 Sh/Clst: dsk y brn to brn blk, carb, pyr, 0003-2L
sr mic30 S/Sst : gy w, sft 0003-1L
1286.20 swc 00041 . 4 9 100 Sh/Clst: dsk y brn to brn blk, carb, pyr, 0004-1L
s, mic

- 2-
Table 3 : Lithology description for well NOCS 6710/10-1Depth unit of measure: mDepth Type Grp Frm AgeInt Cvd TOC% % Lithology description
1380.00 cut75 S/Sst : gy w, lt brn gy, mic, f, cem, 1
1.40* 20 Sh/Clst: lt gn gy, m drk gy, brn gy5 Sltst : pi gy, s, argill, mic
Trb Sample
1458.54 ccp100 S/Sst : gy w, 1
1460.23 ccp1 . 6 3 100 Sh/Clst: dsk y brn to brn blk, mic
1498.00 swc100 S/Sst : gy w, glauc, sft
1570.00 swc1.12 100 Sh/Clst: dsk y brn, mic, sft
1575.00 cut75 S/Sst20 Sh/Clst5 Sltst
gy w, lt brn gy, mic, f, cem, 1lt gn gy, m drk gy, brn gypi gy, s, argill, mic
1627.20 swc0.84 100 Sh/Clst: dsk y gn to brn blk, calc, sft
1719.00 cut90 S/Sst5 Other
1 . 4 6 * 5 Sh/Clstgy w, f, idrk gn, glaucm gy to drk gy, lt gn gy
00140014-1L0014-3L0014-2L
00240024-1L
00250025-1L
00050005-1L
00060006-1L
00150015-1L0015-3L0015-2L
00070007-1L
00160016-1L0016-2L0016-3L

- 3-
Table 3 : Lithology description for well NOCS 6710/10-1Depth unit of measure: mDepth Type Grp Frm Age Trb SampleInt Cvd TOC% % Lithology description
1749.70 swc 0008100 S/Sst : gy w to drk gn gy, glauc, sft 0008-1L
1816.20 swc 00090 . 6 9 100 Sh/Clst: dsk y gn to gn gy, calc, sft 0009-1L
1901.20 swc0 . 9 1 100 Sh/Clst: dsk y gn to brn blk, mic, sft
1 9 6 5 . 0 0 cut1.27 "* 95 Sh/Clst
5 S/Ssttr Ca
m drk gy to brn gy, sit, s, stgy w, mic, f, cembrn gy
1 9 9 8 . 0 0 swc100 S/Sst : gy w, glauc, sft
2061.00 cut
0 . 9 8 * 100 Sh/Clst: m gy to gy brn, calc, sit, mic
2 1 9 6 . 0 0 cut0 . 9 8 * 75 Sh/Clst: m gy to gy brn, calc, sit, mic
25 Ca : gy w, mic, f, cem, 1tr Sh/Clst: lt gn gy
2253.80 swc
2265.00 cut
100 S/Sst : gy w, calc, sft
0 . 9 1 * 85 Sh/Clst: m gy to gy brn, calc, sit, mic15 Ca : gy w, mic, f, cem, 1tr Sh/Clst: lt gn gy
00100010-1L
00170017-1L0017-2L0017-3L
00110011-1L
00180018-1L
00190019-1L0019-2L0019-3L
00120012-1L
00200020-1L0020-2L0020-3L
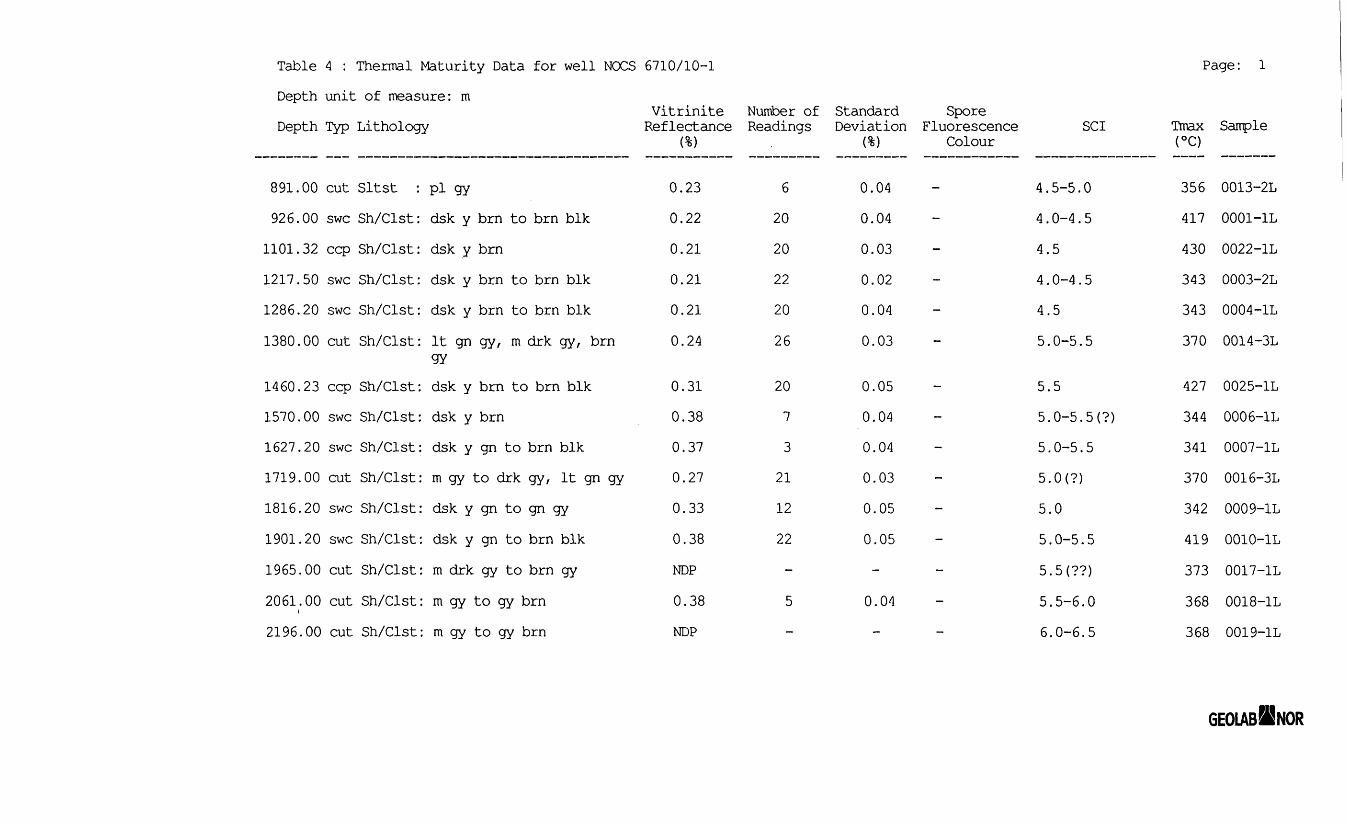
Table 4 : Thermal Maturity Data for well NOGS 6710/10-1Depth unit of measure: mDepth Typ Lithology
Vitrinite Number of Standard SporeReflectance Readings Deviation Fluorescence
(%) , (%) ColourSCI
Page: 1
Tmax Sample
891.00 cut926.00 swc
1101.32 ccp1217.50 swc1286.20 swc1380.00 cut
1460.23 ccp1570.00 swc1627.20 swc1719.00 cut1816.20 swc1901.20 swc1965.00 cut2061.00 cut2196.00 cut
Sltst :Sh/Clst:Sh/Clst:Sh/Clst:Sh/Clst :Sh/Clst:
Sh/Clst:Sh/Clst:Sh/Clst :Sh/Clst:Sh/Clst :Sh/Clst :Sh/Clst :Sh/Clst :Sh/Clst :
pi gydsk ydsk ydsk ydsk ylt gngydsk ydsk ydsk y
brn to brnbrnbrn to brnbrn to brngy, m drk
brn to brnbrngn to brn
m gy to drk gy,dsk ydsk ym drkm gym gy
blk
blkblk
gy, brn
blk
blklt gn gy
gn to gn gygn to brngy to brnto gy brnto gy brn
blkgy
0.230.220.210.210.210.24
0.310.380.370.270.330.38NDP0.38NDP
62020222026
2073211222-5-
0.040.040.030.020.040.03
0.050.040.040.030.050.05-
0.04- -
4 .4 .4 .4.4.5.
5.5.5.5.5.5.5.5.6 .
5-5.00-4.550-4.550-5.5
50 - 5 . 5 ( ? )0-5.50 < ? )00-5.55 ( ? ? )5-6.0, 0 - 6 . 5
356417430343343370
427344341370342419373368368
0013-2L0001-1L0022-1L0003-2L0004-1L0014-3L
0025-1L0006-1L0007-1L0016-3L0009-1L0010-1L0017-1L0018-1L0019-1L
GEOIAB!BNOR

Table 4 : Thermal Maturity Data for well NOGS 6710/10-1 Page: 2Depth unit of measure: m
Vitrinite Number of Standard SporeDepth Typ Lithology Reflectance Readings Deviation Fluorescence SCI Tmax Sample
(%) (%) Colour ( ° C )
2265.00 cut Sh/Clst: m gy to gy brn 0.38 3 0.02 - 6 . 0 - 6 . 5 365 0020-1L
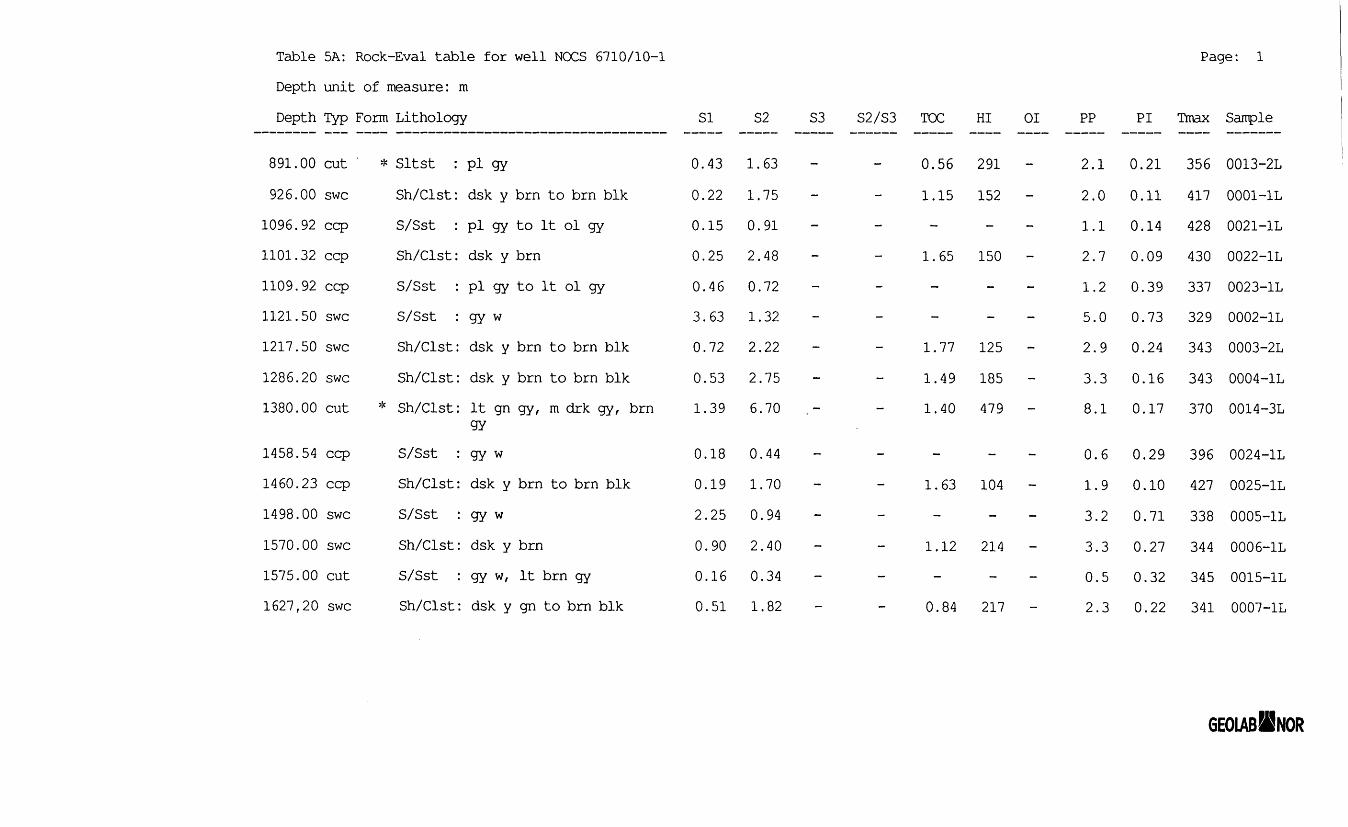
Table 5A: Rock-Eval table for well NOCS 6710/10-1Depth unit of measure: mDepth Typ Form Lithology SI S2 S3 S2/S3 TOC HI Ol PP
Page: 1
PI Tmax Sample
891.00926.00
1096.921101.321109.921121.501217.501286.201380.00
1458.541460.231498.001570.001575.001627 r 20
cutswcccpccpccpswcswcswccut
ccpccpswcswccutswc
* Sltst :Sh/Clst:S/Sst :Sh/Clst :S/Sst :S/Sst :Sh/Clst :Sh/Clst:
* Sh/Clst:
S/Sst :Sh/Clst :S/Sst :Sh/Clst:S/Sst :Sh/Clst:
pi gydsk ypi gydsk ypi gygy wdsk ydsk ylt gngygy wdsk ygy wdsk ygy w,dsk y
brn to brn blkto lt ol gybrnto lt ol gy
brn to brn blkbrn to brn blkgy, m drk gy, brn
brn to brn blk
brnlt brn gygn to brn blk
0.430.220.150.250 . 4 63 . 6 30.720.531 . 3 9
0.180 . 1 92.250 . 9 00.160.51
110201226
010201
. 6 3
.75
. 9 1
.48
.72
.32
.22
.75
.70
.44
.70
. 9 4
.40
.34
.82
0.56 291 - 2.11.15 152 - 2.0
- 1.11 . 6 5 150 - 2.7
- 1.2- 5.0
1.77 125 - 2.91 . 4 9 185 - 3.31.40 479 - 8.1
0 . 61.63 104 - 1.9
3.21.12 214 - 3.3
- 0.50.84 217 - 2.3
0.210.110.140.090.390.730.240.160.17
0.290.100.710.270.320.22
356417428430337329343343370
396427338344345341
0013-2L0001-1L0021-1L0022-1L0023-1L0002-1L0003-2L0004-1L0014-3L
0024-1L0025-1L0005-1L0006-1L0015-1L0007-1L
GEOIAB!E!NOR

Table 5A: Rock-Eval table for well NOCS 6710/10-1Depth unit of measure: mDepth Typ Form Lithology SI S2 S3 S2/S3 TOG HI Ol PP
Page: 2
PI Tmax Sample
1719.00 cut1749.70 swc1816.20 swc1901.20 swc1965.00 cut1998.00 swc2061.00 cut2196.00 cut2253.80 swc2265.00 cut
*Sh/Clst:S/Sst :Sh/Clst :Sh/Clst :
* Sh/Clst :S/Sst :
* Sh/Clst:* Sh/Clst:S/Sst :
* Sh/Clst:
m gy to drkgy w to drkdsk y gn todsk y gn tom drk gy togy wm gy to gym gy to gygy wm gy to gy
gy, lt gn gygn gygn gybrn blkbrn gy
brnbrn
brn
1.131.470.470.120.681.380.750.721. 2 90.40
6.851.601 . 9 21.044.210 . 9 93.813.350. 6 42.78
1 . 4 6-
0 . 6 90 . 9 11.27
-0.980.98
-0.91
469 --278114331 --389 -342 --305 -
8.03.12.41 . 24 . 92 . 44 . 64 . 11 . 93.2
0.140.480.200.100.140.580.160.180.670.13
370340342419373341368368337365
0016-3L0008-1L0009-1L0010-1L0017-1L0011-1L0018-1L0019-1L0012-1L0020-1L

Table 5b Rock-Eval Data on SR-1 standard for 6710/10-1 study
SR1SR1SR1SR1
S11.241.251.251.23
S25.395.485.725.54
Tmax437439440438

Table 7: Visual Kerogen Conposition Data for well NOCS 6710/10-1Depth unit of measure: m
Amorphous Algal/Phytoplankton Herbaceous Woody CoalyDepth Typ Lithology AM% FA HA AP% Cy Ta Bo Di De HE% SP Cu De W0% FL NF De C0% FS De SCI
Page: 1
Sample
891.00 cut Sltst926.00 swc Sh/Clst
1101.32 cqp Sh/Clst1217.50 swc Sh/Clst1286.20 swc Sh/Clst1380.00 cut Sh/Clst1460.23 ccp Sh/Clst1570.00 swc Sh/Clst1627.20 swc Sh/Clst1719.00 cut Sh/Clst1816.20 swc Sh/Clst1901.20 swc Sh/Clst1965.00 cut Sh/Clst2061.00 cut Sh/Clst2196.00 cut Sh/Clst
80 * **40 * **30 *
5 *
20 *75 *50 *65 *5 *85 *TR *TR *85 *65 * *85 *
TR *10 **5 *TR *10 *5 *5 *TR *10 *TR *25 *15 *5 *5 *TR *
* 5 * 7 ** * 15 ** * **
20 ** *15 * ** *
* * 25 ** * ** * 5 ** * *
10 ** * ** * 10 * 9 **,
* * * 25 ** * *** TR * 9 **** * 25 ** * *** * 25 ** * *
* TR * 7 *10 ** * *
5 * *
5 * **
20 * **40 ** *65 * ** *
30 ** *
5 * **
15 * **5 * **35 ** *5 *30 ** *25 ** *5 *10 * **5 *
10 * **15 * **5 ** *15 ** *15 ** *10 * **20 * **20 * **25 ** *10 *20 ** *30 ** *
5 *10 * **5 *
4.5-5.04.0-4.54 . 54.0-4.54.55.0-5.55.55. 0 - 5 . 5 ( 7 )5.0-5.55 . 0 ( 7 )5.05.0-5.55 . 5 ( 7 ? )5.5-6.06 . 0 - 6 . 5
0013-2L0001-1L0022-1L0003-2L0004-1L0014-3L0025-1L0006-1L0007-1L0016-3L0009-1L0010-1L0017-1L0018-1L0019-1L
GEOLAB!E!NOR

Table 7: Visual Kerogen Composition Data for well NOGS 6710/10-1 Page: 2Depth unit of measure: m
Amorphous Algal/Phytoplankton Herbaceous Woody CoalyDepth Typ Lithology AM% FA HA AP% Cy Ta Bo Di De HE% SP Cu De W0% FL NF De C0% FS De SCI Sample
2265.00 cut Sh/Clst 65 * 5 * 10 ** * * 5 * ** 15 * ** 6 . 0 - 6 . 5 0020-1L
GEOLAB!E!NOR

Table 8a: MPLC Bulk Conposition: Weight of EOM and Fraction for well NOCS 6710/10-1Depth unit of measure: m
Page: 1
Depth
891.001109.921121.501380.00
1498.001575.001719.001749.701901.201965.001998.002061.002196.002253.802265.00
Typ
cutccpswccut
swccutcutswcswccutswccutcutswccut
Lithology
Sltst :S/Sst :S/Sst :Sh/Clst:
S/Sst :S/Sst :Sh/Clst :S/Sst :Sh/Clst:Sh/Clst :S/Sst :Sh/Clst:Sh/Clst :S/Sst :Sh/Clst :
pi gypi gy to ltgy wlt gn gy, mgygy w
RockExtracted(g)
ol gy
drk gy, brn
gy w, lt brn gym gy to drkgy w to drkdsk y gn tom drk gy togy wm gy to gym gy to gygy wm gy to gy
gy, lt gn gygn gybrn blkbrn gy
brnbrn
brn
4 .10.7.4.
8.3.1.7.4.5.8.5.6 .4 .6 .
7145
99918245. 2, 6, 0
EOM(mg)
7.32.41.2.
38.5.2.
29.13.2.
30.3.6 .
1 6 .7 .
Sat(mg)
240 0.36
6884 0.59 0.862 0.37j _
, 9 0 . 3, 0
Aro Asph NSO HC Non-HC TOC(e)(mg) (mg) (mg) (mg) (mg) (%)
- - - - - 0.56- - - - - -
0.3 3.7 3 6 . 8 0.5 40.5 0,— — — — — j. ,
_ _ _ _ _ Q
0- - - - - 1
0.8 2.0 2 6 . 1 1.3 28.1 00.6 1.4 11.0 1.5 12.4 0- - - - - 1
0.5 2.1 27.2 0.8 2 9 . 4 0_ _ _ _ _ T
- - - - - 00.3 0.7 1 5 . 6 0.5 1 6 . 4 0
o
.20
.40
.11
. 8 9
.37
.22
. 9 1
.20
.11
.04
. 9 5
.10
. 9 1
Sample
0013-2L0023-1L0002-1L0014-3L
0005-1L0015-1L0016-3L0008-1L0010-1L0017-1L0011-1L0018-1L0019-1L0012-1L0020-1L
GEOLAB!E!NOR
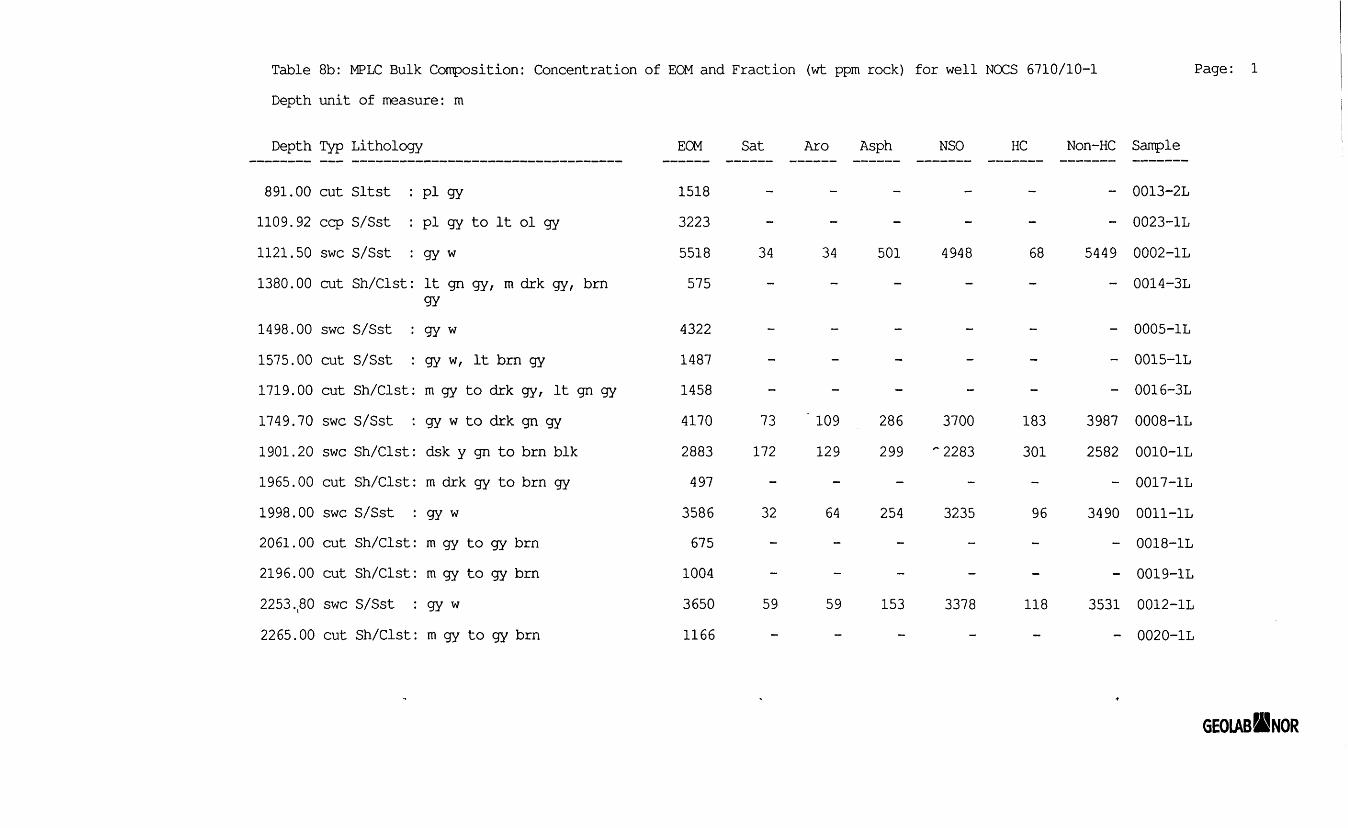
Table 8b: MPLC Bulk Conposition: Concentration of EQM and Fraction (wt ppm rock) for well NOCS 6710/10-1 Page: 1Depth unit of measure: m
Depth Typ Lithology EOM Sat Aro Asph NSO HC Non-HC Sample
891.001109.1121.1380.
1498.1575.1719.1749.1901.1965.1998.2061.2196.2253.2265.
925000
0000007020000000008000
cutccpswccut
swccutcutswcswccutswccutcutswccut
Sltst :S/Sst :S/Sst :Sh/Clst :
S/Sst :S/Sst :Sh/Clst:S/Sst :Sh/Clst:Sh/Clst:S/Sst :Sh/Clst :Sh/Clst :S/Sst :Sh/Clst :
PiPigyitgygygy
gygywgn
ww,
to lt
gy, m
ol gy
drk gy, brn
lt brn gym gy to drkgy w to drkdsk ym drkgy wm gymgym
gywgy
gn to
gy, lt gn gygn gybrn blk
gy to brn gy
to gyto gy
to gy
brnbrn
brn
1518 -3223 -5518 34 34 501 4948D ID — ~~ — —
4322 -1487 -1458 -4170 73 109 286 37002883 172 129 299 "22834973586 32 64 254 3235675
1004 -3650 59 59 153 33781166 -
- 0013-2L- 0023-1L
68 5449 0002-1L- 0014-3L
- 0005-1L- 0015-1L- 0016-3L
183 3987 0008-1L301 2582 0010-1L
- 0017-1L96 3490 0011-1L
- 0018-1L- 0019-1L
118 3531 0012-1L- 0020-1L
GEOIAB!BNOR

Table 8c: MPLC Bulk Composition: Concentration of EQM and Fraction (mg/g TOC(e)) for well NOCS 6710/10-1 Page: 1Depth unit of measure: m
Depth Typ Lithology EQM Sat Aro Asph NSO HC Non-HC Sample
891.1109.1121.1380.
1498.1575.1719.1749.1901.1965.1998.2061.2196.2253.2265.
00925000
0000007020000000008000
cutccpswccut
swccutcutswcswccutswccutcutswccut
Sltst :S/Sst :S/Sst :Sh/Clst:
S/Sst :S/Sst :Sh/Clst:S/Sst :Sh/Clst :Sh/Clst:S/Sst :Sh/Clst:Sh/Clst:S/Sst :Sh/Clst:
PiPigyitgygygy
gygywgn
ww,
m gygy w
to lt ol gy271.-25
2759.08gy
ittoto
r m drk gy, brn
brn gydrkdrk
dsk y gn tomgymm
gy, lt gn gygn gybrn blk
drk gy to brn gywgygy
toto
gygy
brnbrn
gy wm gy to gy brn
41,
3929167106189531641
3260641053650128
, 0 9
.55
.10
.45
.55
. 9 0
.43
. 6 4
. 9 2
.77
.11
.21
- - - - - - 0013-2L- - - - - - 0023-1L
17.06 17.06 250.83 2474.13 34.13 2724.96 0002-1L- - - - - - 0014-3L
- - - - - - 0005-1L- - - - - - 0015-1L- - - - - - 0016-3L
33.31 4 9 . 9 7 130.09 1682.19 83.28 1812.27 0008-1L18.94 14.20 32. 8£ 250.90 33.14 283.77 0010-1L- - - - - - 0017-1L
29.12 58.25 231.72 2941.54 87.37 3173.26 0011-1L- 0018-1L
- - - - - - 0019-1L59.27 59.27 153.37 3378.21 118.53 3531.57 0012-1L
- 0020-1L
GEOLAB!!!NOR

Table 8d: MPLC Bulk Conposition: Material extracted from the rock (%) for well NOCS 6710/10-1Depth unit of measure: mDepth Typ Lithology
Page:
Recov. Recov.Sat Aro Asph NSO Total HC Non-HC MPLC Asph Sample
891.00 cut Sltst :1109.92 ccp S/Sst1121.50 swc S/Sst1380.00 cut Sh/Clst
1498.001575.001719.001749.701901.201965.001998.002061.002196.002253.802265!00
swc S/Sst :cut S/Sst :cut Sh/Clst:swc S/Sst :swc Sh/Clst:cut Sh/Clst:swc S/Sst :cut Sh/Clst:cut Sh/Clst:swc S/Sst :cut Sh/Clst:
pi gypi gy to lt ol gygy wlt gn gy, m drk gy, brngygy wgy w, lt brn gym gy to drk gy, lt gn gygy w to drk gn gydsk y gn to brn blkm drk gy to brn gygy wm gy to gy brnm gy to gy brngy wm gy to gy brn
0 . 6 2 0 . 6 2 9 . 0 9 8 9 . 6 7 100.00 1.24 98. 7 6
1 . 7 6 2 . 6 4 6 . 8 6 88.74 100.00 4 . 3 9 9 5 . 6 15 . 9 8 4.48 10.37 79.17 100.00 10.46 89.54
0013-2L0023-1L
1.20 0 . 9 1 0002-1L0014-3L
0005-1L0015-1L0016-3L
1. 2 6 0 . 9 2 0008-1L1.25 0 . 7 9 0010-1L
0.89 1 . 7 9 7.11 90.21 100.00 2 . 6 8 97.32
1 . 6 2 1 . 6 2 4.20 92.55 100.00 3.25 96 . 7 5
0017-1L1 . 2 6 0 . 9 5 0011-1L
0018-1L0019-1L
1.20 0 . 9 2 0012-1L0020-1L
GEOLABJGNOR

Table 8e: MPLC Bulk Conposition: Ratios for well NOCS 6710/10-1 Page: 1Depth unit of measure: m
Sat HC AspDepth Typ Lithology Aro Non-HC NSO Sanple
891.00 cut Sltst : pi gy - 0013-2L1109.92 ccp S/Sst : pi gy to lt ol gy - - - 0023-1L1121.50 swc S/Sst : gy w 1.00 0.01 0.10 0002-1L1380.00 cut Sh/Clst: lt gn gy, m drk gy, brn - 0014-3Lgy1498.00 swc S/Sst : gy w - 0005-1L1575.00 cut S/Sst : gy w, lt brn gy - - - 0015-1L1719.00 cut Sh/Clst: m gy to drk gy, lt gn gy - - - 0016-3L1749.70 swc S/Sst : gy w to drk gn gy 0 . 6 7 0.05 0.08 0008-1L1901.20 swc Sh/Clst: dsk y gn to brn blk 1.33 0.12 0.13 0010-1L1965.00 cut Sh/Clst: m drk gy to brn gy - 0017-1L1998.00 swc S/Sst : gy w 0.50 0.03 0.08 0011-1L2061.00 cut Sh/Clst: m gy to gy brn - 0018-1L2196.00 cut Sh/Clst: m gy to gy brn - - - 0019-1L2253.80 swc S/Sst : gy w 1.00 0.03 0.05 0012-1L2265.00 cut Sh/Clst: m gy to gy brn - - - 0020-1L
GEOLAB!|!NOR

Table 9a1 Raw Peak Area data for Saturated Hydrocarbon GC of NOCS 6710/10-1 Rocks
Lower depth
1 1 2 1 . 51749.7
19982253.8
Sample type
swcswcswcswc
Desc
sandstone/sandsandstone/sandsandstone/sandsandstone/sand
%Lithology
100100100100
nC15
11440351131923128109
nC16
382621139834646964543
Norpristane
23087664574013837248
nC17
32514118603
64416120200
Pristane
29700887766015790058
nC18
5132412002995337
191600
Phytane
28140761516362963813
nC19
65299146949133326230841
nC20
80297145819117906267221
nC21
581699233875603
277630
nC22
547647273556369
282311
Lower depth
1 1 2 1 . 51749.7
19982253.8
Sample type
swcswcswcswc
Desc
sandstone/sandsandstone/sandsandstone/sandsandstone/sand
nC23
349164732745065
297150
nC24
379303857433664
275317
nC25
274953069225578
271671
nC26
313822507917938
205781
nC27
142833014818752
170880
nC28
01667924442
123856
nC29
02655910831
108603
nC30
0230061557090994
nC31
0178281000675140
nC32
0198251607265882
nC33
099976583
51145
nC34
06894
040842
Sample number
U26/0002-1U26/0008-1U26/0011-1U26/0012-1
GEOLAB!E!NOR

Table 9B: Saturated Hydrocarbon Ratios (peak area) for well NOGS 6710/10-1Depth unit of measure: m
Pristane Pristane Pristane/nC17 Phytane nC17
Page: 1
Depth
1121.501749.701998.002253.80
Typ Lithology
swc S/Sstswc S/Sstswc S/Sstswc S/Sst
: gy w: gy w to drk gn gy: gy w: gy w
nC17
0.0.0.0.
91759375
Phytane Phytane/nC18
1.061.170 . 9 51.41
1112
. 6 7
.18
.40
.25
nC18
0.550 . 6 30.670.33
CPU nC17+nC27
0.971.130.801 . 0 9
0 . 6 90.800.770.41
Sample
0002-1L0008-1L0011-1L0012-1L

GEOLAB!É!NOR
Table 10a: Tabulation of carbon isotope data for EOM/EOM - fractions for well NOGS 6710/10-1Depth unit of measure: mDepth Typ Lithology EOM Saturated Aromatic NSO Asphaltenes Kerogen Sample
Table lOb: Tabulation of cv values from carbon isotope data for well NOGS 6710/10-1Depth unit of measure: mDepth Typ Lithology Saturated Aromatic cv value Sample
1998.00 swc bulk -27.23 -27.26 -3.28 0011-02253.80 swc bulk -28.15 -27.52 -1.52 0012-0
1998.00 swc bulk - -27.23 -27.26 - - - 0011-02253.80 swc bulk - -28.15 -27.52 - - - 0012-0

Table Ila: Variation in Triterpane Distribution (peak height) SIR for Well NOGS 6710/10-1 Page: 1
Depth unit of measure: m
Depth Lithology Ratiol Ratio2 Ratio3 Ratio4 RatioS RatioS Ratio? RatioS Ratio9 Rat.10 Rat.11 Rat.12 Rat.13 Rat.14 Sanple
1901.20 Sh/Clst 3.39 0.77 0.23 0.62 0.38 0.03 2.91 4.68 0.74 0.02 0.68 0.40 0.50 24.91 0010-1
1998.00 S/Sst 1.35 0.57 0.29 1.16 0.54 0.04 0.10 0.09 0.09 0.54 0.90 0.53 0.10 56.85 0011-1
2253.80 S/Sst 1.11 0.53 0.16 0.69 0.41 0.06 0.04 0.06 0.04 0.03 0.88 0.42 0.15 60.58 0012-1
List of Triterpane Distribution Ratios
Ratio 1: 27Tm / 27Ts
Ratio 2: 27Tm / 27Tm+27Ts
Ratio 3: 27Tm / 27Tm+30aJM-30fta
Ratio 4: 29al3 / 30al5
Ratio 5: 29aI3 / 29aiH30aft
Ratio 6: 30d / 30aJ5
Ratio 7: 28afl / 30aI5
Ratio 8: 28al5 / 29al5
Ratio 9: 28ali / 28aJH30aJ5
Ratio 10: 24/3 / 30aii
Ratio 11: 30ai3 / 30aJH30fta
Ratio 12: 29a£+29fia / 29aB+29fta+30aJM-30fta
Ratio 13: 29fia-K30fta / 29aiM-30aft
Ratio 14: 32aBS / 32ai5S+32aiiR (%) GEOIABSBNOR

Table lib: Variation in Sterane Distribution (peak height) SIR for Well NOGS 6710/10-1 Page: 1Depth unit of measure: m
Depth Lithology Ratiol Ratio2 RatioS Ratio4 RatioS RatioG Ratio? RatioS Ratio9 RatiolO Sample
1901.201998.002253.80
Sh/ClstS/SstS/Sst
0 . 1 60.330.52
38.9042.71
3 6 . 9 070.2969.00
0.071.201.31
1.000.750.72
0.310 . 6 20.41
0.130.500.30
0.230.540.53
0 . 6 40.75
0.291 . 9 41.94
0010-1
0011-1
0012-1
List of Sterane Distribution Ratios
Ratio 1: 27dfiS / 27dftS+27aaR
Ratio 2: 29aaS / 29aaS+29aaR (%)
Ratio 3: 2*(29fifiR+29MS) / (29aaS+29aaR + 2
Ratio 4: 27di5S+27dfiR+27daR+27daS / 29dftS+29dliR+29daR+29daS
Ratio 5: 29fifcR+29fiiiS / 29fifcR+29fifiS+29aaS
Ratio 6: 21a+22a / 21a+22a+29aaS+291M5R+29fcfiS+29aaR
Ratio 7: 21a+22a / 21a+22a+28daS+28aaS+29daR+29aaS+29fiBR+29fifiS+29aaR
Ratio 8: 2 9fifiR+2 9JM3S / 29aaS+291iI5R+29MS-f29aaR
Ratio 9: 29aaS / 29aaR
Ratio 10: 2 915BR+2 9iiJ5S / 29aaR
GEOLAB!E!NOR

Table Ile: Raw triterpane data (peak height) m/z 191 SIR for Well NOCS 6710/10-1Depth unit of measure: m
Page: 1
Depth Lithology
1901.20 Sh/Clst
1998.00 S/Sst
2253.80 S/Sst
23/3
29aft
31aJiR
24223443647
14240140833310
58546495323202
.2
.9
.0
.8
.5
.6
.3
.7
.9
24/3
29Ts
32aflS
91.7308.8219.2
6550.72833.52156.9
2978.220955.415820.7
25/3
30d
32a£R
69.395.4
660.7
2280.7512.7
1637.2
1124.35349.1
10292.6
24/4
291ia
33aflS
277.71283.1110.4
5552.71409.51286.8
10662.210870.87902.1
26/3
300
33aflR
40.40.0
207.8
1288.70.0
856.7
1223.00.0
5147.9
27Ts
30aii
34aliS
499.43774.4
69.6
4148.612193.4
707.9
18582.193670.23912.9
27Tm
30fta
34ai5R
1690.51758.3
93.7
5607.21296.3
493.0
20564.312277.1
2359.9
28ali 25nor30al5 Sanple
30G
35afiS
10978.20.0
91.6
1259.00.0
555.3
3823.90.0
1711.8
31aBS
35aI5R
344.823.
92.
1224.4320.
422.
0.33663.
1039.
6 0010-169
1 0011-114
0 0012-107
GEOLAB!E!NOR
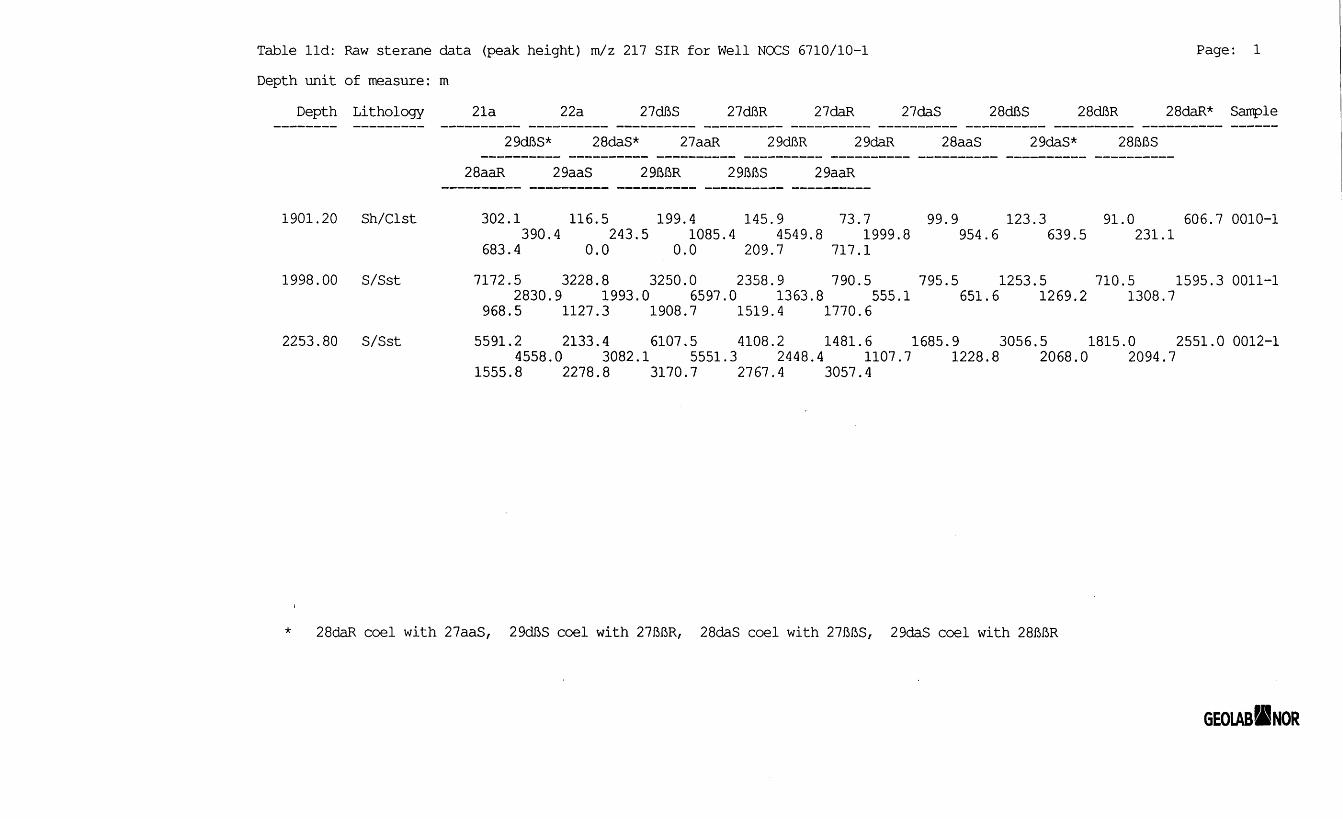
Table lid: Raw sterane data (peak height) m/z 217 SIR for Well NOGS 6710/10-1Depth unit of measure: m
Depth Lithology 21a 22a 27dftS 27dI5R 27daR 27daS 28dfiS 28diiR
Page: 1
28daR* Sample
1901.20 Sh/Clst
1998.00 S/Sst
2253.80 S/Sst
29df5S* 28daS* 27aaR
28aaR 29aaS 291M5R 29filiS
29daR 28aaS 29daS* 28IM5S
29aaR
302.1 116.5 199.4 145.9 73.7 99.9 123.3 91.0 606.7 0010-1390.4 243.5 1085.4 4549.8 1999.8 954.6 639.5 231.1
683.4 0.0 0.0 209.7 717.1
7172.5 3228.8 3250.0 2358.9 790.5 795.5 1253.5 710.5 1595.3 0011-12830.9 1993.0 6597.0 1363.8 555.1 651.6 1269.2 1308.7
968.5 1127.3 1908.7 1519.4 1770.6
5591.2 2133.4 6107.5 4108.2 1481.6 1685.9 3056.5 1815.0 2551.0 0012-14558.0 3082.1 5551.3 2448.4 1107.7 1228.8 2068.0 2094.7
1555.8 2278.8 3170.7 2767.4 3057.4
28daR coel with 27aaS, 29dJbS coel with 27MR, 28daS coel with 27MS, 29daS coel with 28JMiR
GEOLAB!E!NOR

Table Ile: Raw sterane data (peak height) m/z 218 SIR for Well NOGS 6710/10-1
Depth unit of measure: m
Depth Lithology 27MR 27B13S 28I5I5R 28fifiS 29I513R 291M5S 30MR 30fiftS Sample
1901.201998.002253.80
Sh/ClstS/SstS/Sst
399.13706.35536.5
276.82939.34405.8
600.41 9 9 6 . 53249.0
37620433420
.0
. 6
. 2
0.02905.24606.4
396.02539.74397.7
174.3306.3539.8
308.0311.7570.2
0010-10011-10012-1
Table llf: Raw triterpane data (peak height) m/z 177 SIR for Well NOGS 6710/10-1
Depth unit of measure: m
Depth Lithology 25nor28afi 25nor30aft Sample
1901.20 Sh/Clst 0.0 0.0 0010-1
1998.00 S/Sst 1350.0 806.2 0011-1
2253.80 S/Sst 2811.8 0.0 0012-1
GEOIAB!BNOR

1 Introduction
This report gives the result of routine vitrinite reflectance analyses of 16 samples from well6710/10-1 offshore Norway.
2 Material
The material was provided from the client as 9 cuttings samples (DC) and 7 core chips (COCH).Information on stratigraphy in well 6710/10-1 was not provided from the client.
3 Analytical techniques
3.1 Preparation
The sample material was embedded in an epoxy resin to make briquettes, dried and then drygrounded to a flat surface. The sample surface was impregnated with a somewhat thinned epoxy,dried and f ina l ly polished using 0.25 micron diamond paste and magnesium oxide as the two finalsteps.
3.2 Analysis
The analytical equipment being used was a Zeiss MPM 03 photometer microscope equipped withan Epiplan-Neofluar 40/0.90 oil objective. The sensitive measuring spot was kept constant for allmeasurements at about 2.5 micron in diameter. The measurements were made through a greenband pass filter (546 nm) and in oil immersion (refractive index 1.515 at 18°C). The readingswere made without a polarizer and using a stationary stage. This procedure is called measurementof random reflectance (%Rm). The photometer is calibrated daily against a standard of knownreflectance (%Rm= 0.588) and routinely (daily) checked against two other standards ofsignificant different reflectances ( %Rm=0.879 and 1.696). A deviation from these values of lessthan ±0.01 and ±0.02 respectively is considered as acceptable. The calibration is routinelychecked during the course of measurements at least every hour, and a deviation of less than±0.005 is considered as acceptable.

For each sample at least 20 points were measured if possible, and quality ratings are given tovarious important aspects which may affect the measurements. These aspects are abundance ofvitrinite, uncertainties in the identification of indigenous vitrinite, type of vitrinite, particle size,particle surface quality and abundance of pyrite.
3.3 Presentation of results
The raw data from the measurements are presented in appendix for each sample both as tabulateddata and histograms. A true vitrinite population is selected among the readings based onobservations made during the measurements, and arithmetic mean values and standard deviationare calculated for this population and other populations. A quality rating is given to the truepopulation. There is one data sheet with raw data for each sample. The results are listed in table 1.Figure 1 shows a vitrinite reflectance versus depth plot.
4 Results
The samples contained mostly sufficient vitrinite, but there was a severe problem withhydrocarbon staining on the surfaces. Two of the samples were not measurable (see table). Thevitrinite reflectance versus depth plot indicate a maturity trend which must not be weighted toomuch.

Table 1. Vitrinite reflectance data table well 6710/10-1
Analysis type:Well: —
Number of samples:Time period for analysis:Analysis performed by:Analysis ordered by:
Vitrinite reflectance6 7 1 0 / 1 0 - 11 6dec 2000
—
K. Aasgaard, IFEGeolab Nor
: ' • • ' - " ' • " - ' : • : : ' • >;.:i;:: • • : • • - • ' • " ' - • • • ' . ' . , • - . . - • • :...• :.: ';: . . . - ' V ; ' ; ;;if;'. a-''^' , . ,
IFE samplecode
2000241620002417
200024182000241920002420200024212000242220002604
2000260520002606200026072000260820002609200026102000261 120002612
Depth(m)926
1217.51286.21570
1627.21816.21901.2
8911 1 0 1 . 3 2
13801460.23
1 7 1 91965206121962265
SampletypeDC
COCHCOCH
DCCOCHCOCHCOCH
DCCOCH
DCCOCH
DCDCDCDCDC
Lithology
clyst/sstclystclystclystclyst
clyst/sstclyst/sstclyst/sst
clystclystclyst
clyst/sstclystclyst
clyst/sstclyst/sst
Vitr. refl.(%Rm)
0.230.220.220.390.380.330.390.230.210.240.310.27
*
0.38•
0.39
Stand.dev.0.040.020.040.040.040.050.050.040.040.030.050.03
0.04
0.02
Number ofreadings
20222073
12226
20262021
5
3
Sampledescription
OOO-O+
ooooooOOO-O+
-±o--o-±o~o-OO--O
ooo-oo-OO--O
OOO--0
OOO--O
o±o--oooo-oo
-OO-O
-OO-0
Samplequality
MGM
PstPstPM
PstMMPMst
Pstst
Pst
Sampleprep.bulkbulkbulkbulkbulkbulkbulkbulkbulkbulkbulkbulkbulkbulkbulkbulk
Vitrinite present in sample, but no measurable surfaces due to excessive HC staining.

Legend to vitrinite reflectance data table
Lithology code SampleSandstone sst GSiltstone sist MClaystone clyst PShale sh stLimestone 1stCoal coal
qualitygoodmoderatepoorhydrocarbon staining
Sample description and measurement evaluation (- o +)oooooo 1123456 2
3456
Options legend:o+
Abundance of vitriniteIdentification of vitriniteType of vitriniteVitrinite fragment sizeVitrinite surface qualityAbundance of pyrite
Sample preparationHF sample treated with hydrofluoric
acid prior to analysisbulk sample treated as bulk rockDCM sample washed with dichloromethane
Options- o- o +• o +- 0
- oo +
may give too low vitrinite reflectance sample valuereliable vitrinite reflectance sample valuemay give too high vitrinite reflectance sample value

Table 1 Analytical Program for Muds for NOCS well 6710/10-1
0,Olp
eeaco w!!x:$x$x:!;3x; iSi: !$SS:
S.
OUJH"ELSC3
CO
co•acx•eco
SbO
bo ^C w
1!D, gP 60. "M>< |-*s 1
bo
Ja c 'c'cx S op w> 5?MI> oo -OiQ. O 9
O
U
co
a
8
a
CO
m -
G*£ «o 940 g,co iid oO .22
1641 m U32/00012267 mTotalSample type key c = Cuttings s = SWC p = Conv core/ plug o=oil g= gas m=mud
GEOtAgØNOR

Table 8a: MPLC Bulk Conposition: Weight of EOM and Fraction for well 6710/10-1 MUDDepth unit of measure: m
Depth Typ LithologyRock
Extracted EOM Sat Aro Asph NSO(g) (mg) (mg) (mg) (mg) (rog)
HC Non-HC TOC(e)(mg) (mg) (%) Sample
1641.00 mud bulk 78.4 0.4 0.4 0.4 77.1 0 . 9 77.5 0001-OB
Table 8d: MPLC Bulk Composition: Material extracted from the rock (%) for well 6710/10-1 MUDDepth unit of measure: mDepth Typ Lithology Sat Aro
Recov. Recov.Asph NSO Total HC Non-HC MPLC Asph Sairple
1641.00 mud bulk 0.54 0.54 0.51 98.41 100.00 1.08 9 8 . 9 2 1.11 1.00 0001-OB
Table 8e: MPLC Bulk Composition: Ratios for well 6710/10-1 MUDDepth unit of measure: m
Depth
1641.00
Typ
mud
Lithology
bulk
SatAro
1.00
HCNon-HC
0.01
AspNSO
0.01
Sample
0001-OB
GEOLABiliNOR

Table 9a1 Raw Peak Area Data for Saturated Hydrocarbon GC of NOCS 6710/10-1 Mud
Lower depth
1641
Sample type
mud
D esc
bulk fraction
%Lithology nC15
360215
nC16
979671
Norpristane
558637
nC17
654355
Pristane
525577
nC18
189177
Phytane
1 1 3 3 1 6
nC19
123430
nC20
98581
nC21
71917
nC22
56485
nC23
39856
Lower depth
1641
Sample type
mud
nC24
42341
nC25
34341
nC26
19109
nC27
0
nC28
0
nC29
0
nC30
0
nC31
0
nC32
0
nC33
0
nC34
0
Sample number
U32/0001-0

Table 9B: Saturated Hydrocarbon Ratios (peak area) for well 6710/10-1 MUDDepth unit of measure: m
Page: 1
Depth Typ LithologyPristane Pristane Pristane/nC17 Phytane nC17nC17 Phytane Phytane/nC18 nC18 CPU nC17+nC27 Sanple
1641.00 mud bulk 0.80 4 . 6 4 1.34 0. 6 0 1.18 1.00 0001-OB
GEOLAB!E!NOR

Table Ila: Variation in Triterpane Distribution (peak height) SIR for Well 6710/10-1 MUD Page: 1
Depth unit of measure: m
__J^Pth Lithology Ratiol Ratio2 Ratio3 Ratio4 RatioS RatioG Ratio? RatioS Ratio9 Rat.10 Rat.11 Rat.12 Rat.13 Rat.14 Sanple
1641.00 bulk 0.93 0.48 0.26 0.97 0.49 0.08 0.20 0.20 0.16 0.17 0.88 0.50 0.15 59.60 0001-0
List of Triterpane Distribution Ratios
Ratio 1: 27Tm / 27Ts
Ratio 2: 27Tm / 27Tm+27Ts
Ratio 3: 27Tm / 27Tm+30aft+30fta
Ratio 4: 29a£ / 30aft
Ratio 5: 29a£ / 29aii+30al5
Ratio 6: 30d / 30aJ2>
Ratio 7: 28aB / 30aI5
Ratio 8: 28afi / 29al5
Ratio 9: 28aii / 28aJ5+30aii
Ratio 10: 24/3 / 30aJ5
Ratio 11: 30ai5 / 30aib+30iia
Ratio 12: 29afi+29fta / 29aJi+291ia+30ai3+301ia
Ratio 13: 29fta+30fta / 29ali-f30aB
Ratio 14: 32aJiS / 32aI5S+32aiiR (%)GEOLABSBNOR

Table lib: Variation in Sterane Distribution (peak height) SIR for Well 6710/10-1 MUD Page: 1
Depth unit of measure: m
Depth Lithology Ratiol Ratio2 RatioS Ratio4 RatioS Ratio6 Ratio7 Ratio8 Ratio9 RatiolO Sample
1641.00 bulk 0.59 47.34 74.07 0.98 0.75 0.34 0.23 0.59 0.90 2.71 0001-0
List of Sterane Distribution Ratios
Ratio 1: 27dIiS / 27dflS+27aaR
Ratio 2: 29aaS / 29aaS+29aaR (%)
Ratio 3: 2* (291M5R+291M5S) / (29aaS+29aaR + 2* (29J5fiR+29fifiS)) (%)
Ratio 4: 27dliS+27dftR+27daR+27daS / 29dftS+29dftR+29daR+29daS
Ratio 5: 29fifiR+29fifiS / 291M5R+29fiiiS+29aaS
Ratio 6: 21a+22a / 21a+22a+29aaS+29fifiR+29fifiS+29aaR
Ratio 7: 21a+22a / 21a+22a+28daS+28aaS+29daR+29aaS+29BliR+29MS+29aaR
Ratio 8: 29fifiR+29BliS / 29aaS+29151iR+2915BS+29aaR
Ratio 9: 29aaS / 29aaRRatio 10: 29fifiR+29BiiS / 29aaR
GE01ABSBNOR
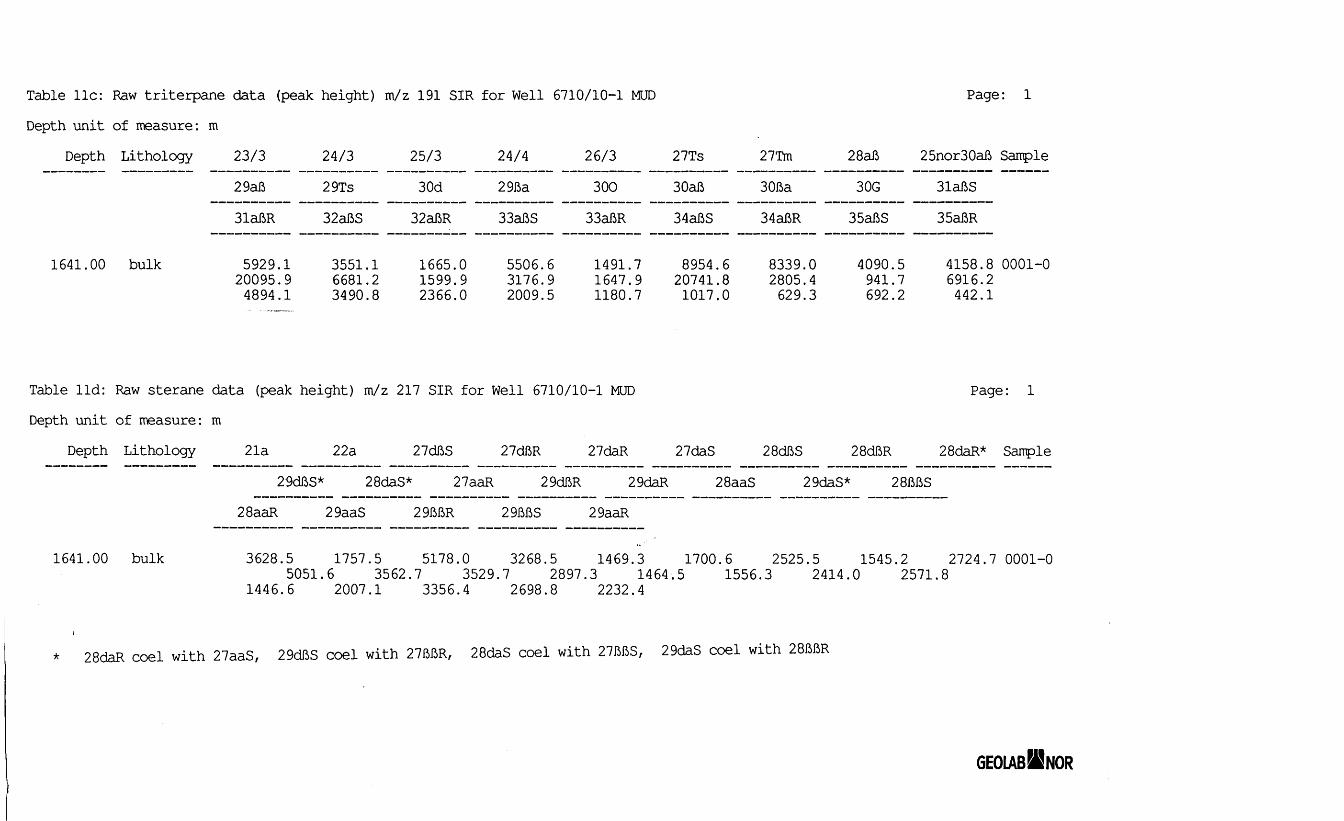
Table Ile: Raw triterpane data (peak height) m/z 191 SIR for Well 6710/10-1 MUDDepth unit of measure: m
Page: 1
Depth Lithology
1641.00 bulk
23/3
29a£
31afiR
5929.20095.
4894.
191
24/3
29Ts
32ai5S
3551.16681.23490.8
25/3
30d
32afiR
1665.01599.92366.0
24/4
29iia
33aflS
5506.63176.92009.5
26/3
300
33aJSR
1491.71647.91180.7
27Ts
30aft
34aflS
8954.620741.81017.0
27Tm
301ia
34aBR
8339.02805.4
629.3
28aii
30G
35aliS
4090.5941.7692.2
25nor30ai5
SlafiS
35aflR
4158.86916.2442.1
Sample
0001-0
Table lid: Raw sterane data (peak height) m/z 217 SIR for Well 6710/10-1 MUDDepth unit of measure: m
Depth Lithology 21a 22a 27dftS 27dftR 27daR 27daS 28dflS 28dBR
Page: 1
28daR* Sample
1641.00 bulk
29dBS* 28daS* 27aaR 29dI5R 29daR 28aaS 29daS*
28aaR 29aaS 29fifiR 29IM5S 29aaR
3628.5 1757.5 5178.0 3268.5 1469.3 1700.6 2525.5 1545.2 2724.7 0001-05051.6 3562.7 3529.7 2897.3 1464.5 1556.3 2414.0 2571.8
1446.6 2007.1 3356.4 2698.8 2232.4
28daR coel with 27aaS, 29dI5S coel with 27IM5R, 28daS coel with 271M5S, 29daS coel with 28fifiR
GEOLABJfiNOR

Table Ile: Raw sterane data (peak height) m/z 218 SIR for Well 6710/10-1 MUD
Depth unit of measure: m
Depth Lithology 27fifiR 27JM5S 28J5fiR 281M5S 29IM5R 29fifiS 30BBR
Page: 1
SOfifiS Sanple
1641.00 bulk 5889.5 4515.6 3127.4 3325.5 4500.4 4109.3 575.0 585.5 0001-0
Table llf: Raw triterpane data (peak height) m/z 177 SIR for Well 6710/10-1 MUDDepth unit of measure: m
Depth Lithology 25nor28afi 25nor30afi> Sample
1641.00 bulk 4146.9 2198.9 0001-0
Page: 1
GEOLABSGNOR