Embed Size (px)
Citation preview

Expert Systems with Applications 42 (2015) 1503–1512
Contents lists available at ScienceDirect
Expert Systems with Applications
journal homepage: www.elsevier .com/locate /eswa
Weight restrictions in Data Envelopment Analysis: A comprehensiveGenetic Algorithm based approach for incorporating value judgments
http://dx.doi.org/10.1016/j.eswa.2014.09.0340957-4174/� 2014 Elsevier Ltd. All rights reserved.
⇑ Corresponding author.E-mail addresses: [email protected] (V. Jain), [email protected]
(A. Kumar), [email protected] (S. Kumar), [email protected](C. Chandra).
Vipul Jain b, Amit Kumar a, Sameer Kumar c,⇑, Charu Chandra d
a Sapient Consulting Private Ltd., Indiab Department of Industrial Engineering and Engineering Management, College of Engineering, University of Sharjah, P. O. Box 27272, Sharjah, United Arab Emiratesc Department of Operations and Supply Chain Management, Opus College of Business, University of St. Thomas, 1000 LaSalle Avenue, Minneapolis, MN 55403-2005, USAd University of Michigan – Dearborn, College of Business Administration, FCS 183, 19000 Hubbard Drive, Dearborn, MI 48126-2638, USA
a r t i c l e i n f o
Article history:Available online 28 September 2014
Keywords:Cross-disciplinary applicationGenetic AlgorithmBusiness processMulti-Criteria Decision MakingProblem structuringBusiness analyticsDecision analysisMethodology and toolEmpirical study
a b s t r a c t
The basic DEA model experiences the weights flexibility problem which is resolved by the method ofweight restrictions. The current research incorporating Decision Makers’ (DMs) preferences into weightrestrictions is subject to serious limitations such as lacking a framework for dual role factors and notincorporating organizational hierarchy in decision-making.
The proposed Genetic Algorithm (GA) based approach for weight restrictions incorporates a dual rolefactor and organizational hierarchy in decision-making. The approach involves finding a set of weightswhich are at a minimum distance from all the DMs’ preferences. The approach is flexible and is able togenerate a common set of weights and Decision Making Unit (DMU) specific weight restrictions simulta-neously.
Results from model validation in a well-known automobile spare parts manufacturer in India indicatethat the majority of suppliers perceived as highly efficient were actually found to be inefficient in the GAbased weight restrictions model.
A major contribution of this study is a robust approach to deal with multiple DMs and DEA weightsflexibility problem. Another key highlight of the research is translating DMs preferences into a distancefunction. Using that as a fitness measure within the proposed Evolutionary Algorithms has been done forthe first time in the presence of multiple DMs.
� 2014 Elsevier Ltd. All rights reserved.
1. Introduction Allen, Athanassopoulos, Dyson, and Thanassoulis (1997) and
Data Envelopment Analysis (DEA) is a non-parametric, linearprogramming based method for measuring the relative efficiencyof a set of DMUs. However, the basic DEA approach proposed byCharnes, Cooper and Rhodes (CCR) suffers from the weights flexi-bility problem (Charnes, Cooper, & Rhodes, 1978). It allows totalflexibility in weight selection for the DMUs in order to achievemaximum efficiency. This flexible choice of weights in CCRapproach can be inconsistent with management views or priorknowledge of inputs and outputs.
Weight restrictions provide the solution to the weight flexibilityproblem in DEA. There are a number of studies on weight restric-tions and how to incorporate value judgments into them.
Thanassoulis, Portela, and Allen (2004) conclude that there is noall purpose method for translating value judgments into DEAweight restrictions. Some of the most prominent weight restrictionmethods such as Cone-Ratio (CR) models and Assurance Region(AR) models incorporate a priori information. Angulo-Meza andLins (2002) point out such value judgments can be biased withideas not being consistent with reality. Similar observations havebeen made by Allen et al. (1997). Approaches like Assurance RegionII (AR II) are known to have feasibility issues (Allen et al., 1997).
The majority of these approaches deal with only a single Deci-sion Maker (DM). There is one approach by Talaue, Diesta, andTapia (2011) which deals with multiple DMs. The approach is notguaranteed to find a solution which would satisfy all DMs. Also,the approach assumes that all DMs are at par with each other.The current organizational structures have a hierarchy whichwould lead to certain DMs being senior to others and thus havingmore weight in decision making.
None of the approaches deal with weight restrictions on dualrole factors in DEA. This is very important for a DEA approach
1504 V. Jain et al. / Expert Systems with Applications 42 (2015) 1503–1512
which deals with certain specific problems such as supplier selec-tion as highlighted in Saen (2010).
Most of these approaches either try to find a common set ofweights or DMU specific weight restrictions, but not both.Premachandra (2001) and Makui, Alinezhad, Mavi, andZohrebandian (2008) suggest approaches for a common set ofweights. Wong, Mariano, and Jian-Bo (2009) and Talaue et al.(2011) present approaches for DMU specific weight restrictions.However, none of these approaches incorporate both types ofweight restrictions.
Some of the latest works in the area of weights restrictions useAssurance Regions (Halkos, Tzeremes, & Kourtidis, 2014; Liu,2014) in a 2-stage DEA model. Another approach by Hosseinpour,Pourmahmoud, and Masrouri (2013) use symmetric weights in aDEA-AHP hybrid to overcome the weights flexibility issue. Mecitand Alp (2013) provide an approach in which weights are definedas correlation between inputs and output variables which providesa more balanced weights distribution. Hajiagha, Hashemi, andMahdiraji (2014) present a Linear Programming based approachto calculate the common set of weights. A key drawback of all theselatest approaches is that none of them attempt to translate the DM’spreferences into weights restriction and hence, lack a frameworkfor industrial application of such approaches. None of these can dealwith multiple DMs which is quite often a case in today’s industrialscenario. In addition, none of the approaches guarantee validity andfeasibility in presence of dual role factor in DEA. A brief review ofthese approaches is presented in the next section.
To sum up, most weights restriction approaches tend to be lack-ing in one or more of the following:
� Managérial Implications – One of the most desirable proper-ties in an approach for translating value judgements would beto offer an ‘‘easy to translate’’ framework which would allowDMs to come forward with a more quantitative view of theirjudgments.� Subjectivity Concerns – Some of the most prominent weight
restriction methods incorporate a priori information whichreduces discrimination in DEA.� Feasibility – Some of these approaches do not guarantee
feasibility.� Multiple DMs – The majority of these approaches deal with
only a single Decision Maker (DM).� Dual Role Factors – None of the approaches deal with weight
restrictions on dual role factors in Data Envelopment Analysis� Comprehensiveness – Most of these approaches either try to
find a common set of weights or DMU specific weight restric-tions, but not both.
Research Goal: This paper proposes a Genetic Algorithm (GA)based approach to overcome all the above limitations. Theapproach takes into account feasibility, and can find a commonset of weights and DMU specific weight restrictions at the sametime. The approach is based on finding a set of weights whichare at a minimum distance from all the DMs’ preferences. Thusthe proposed weight restrictions would be a feasible set whichwould be closest to all of the DMs’ preferences. The GA takes intoaccount dual role factors and ensures feasibility at all times. Thedistance function eliminates the subjectivity concerns and alsoprovides an ‘‘easy to use’’ framework for the DMs.
The GA based approach is applied to the supplier selection pro-cess for a well-known automobile spare parts manufacturer inIndia and the results are presented.
The rest of the paper is structured as follows. Section 2 presentsrelated work and an outline of proposed GA based weightrestrictions approach. Section 3 describes theoretical details associ-ated with GA based weight restrictions approach. Section 4 shows a
practical application of the proposed theoretical approach showingdata and validation of the proposed approach. Section 5 reportsresults, a comparison of the proposed approach with AHP/ANPapproaches and discussion in terms of significance of the resultsfrom the application of GA based approach. Finally, Section 6 pre-sents the conclusions, implications and limitations of the study.
2. Material and methods
There have been numerous research studies on solving theweight flexibility problem in DEA. Weight restrictions were firstimposed by Dyson and Thanassoulis (1988) in an attempt to incor-porate top management perspectives on the relative importance ofthe inputs and outputs used in the assessment. Charnes, Cooper,and Huang (1990) presented the cone ratio approach which isbased on pre-selection of DMUs or favored inputs/outputs. How-ever, pre-selection of DMUs may not be a good approach as pointedout by Thanassoulis, Dyson, and Foster (1987) in their rates depart-ment study.
Thompson, Singleton, Thrall, and Smith (1986) presented theconcept of Assurance Regions (ARs) which was based on imposinghomogeneous linear restrictions. The approach incrementallyrefines an Assurance Region until the efficiency levels are satisfac-tory to the Decision Maker. This type of approach is called AR I. ARII was introduced by Thompson et al. (1986) and used byThanassoulis et al. (2004) which imposed restrictions on the ratiobetween input and output weights.
A review of various weight restriction methodologies and theirevolution is presented in Allen et al. (1997) and Thanassoulis et al.(2004). These two articles present the fallout of the traditionalcone ratio approach and Assurance Region models in terms ofparameter estimation to be used for DEA weight restrictions.
There are number of approaches in literature which use AHPand ANP to translate the DMs’ value judgments into weight restric-tions (Guo, Jia, & Qiu, 2006; Premachandra, 2001; Royendegh &Erol, 2009; Sinuany-Stern, Mehrez, & Hadad, 2000; Zhang, Li, &Liu, 2006). While these approaches are appropriate for weightrestriction, these approaches suffer from various limitations. Forinstance, AHP and ANP centered approaches are based on pair-wisecomparisons which would essentially imply that these approachesare limited to relative weight restrictions only. With multiple DMs,AHP can allow for powerful DMs or outliers in DMs’ judgments toinfluence the decision making process significantly. Palcic and Lalic(2009) observed this behavior in their study.
Hosseinpour et al. (2013) present the symmetric weights baseapproach for an AHP-DEA hybrid. The approach improves on anexisting AHP-DEA hybrid which had the drawback of not preserv-ing rankings. Mecit and Alp (2013) present a DEA weightsapproach in which weights are expressed as input–output ratios.The results demonstrated that such correlation based approachescan achieve a balanced weight distribution unlike other knownDEA models which tend to have a skewed distribution. The numer-ical examples in both the studies are from existing literature andan end-to-end industrial application of the approaches is lacking.
Liu (2014) present the Assurance Region approach for 2-stageDEA in presence of fuzzy input–output data. An example fromnon-life insurance companies in Taiwan is presented to validatethe approach in presence of fuzzy data. Halkos et al. (2014) alsopropose an Assurance Region based approach for 2-stage DEA.The approach is validated across secondary education institutesfrom 65 countries to construct an overall school efficiency index.However, both these approaches do not deal with multiple DMsor provide any insight on translating DMs opinions into weightsrestrictions.
The optimization problem that this study attempts to solve isformulated as below:

V. Jain et al. / Expert Systems with Applications 42 (2015) 1503–1512 1505
Minimize ðaÞ Distance to DMs PreferencesSubject To : ðbÞ Standard DEA Constraints
ðcÞ DMs Preference Constraints
As would be shown in Sections 3.1 and 3.2, the objective func-tion (a) and constraints (c) tend to be non-linear in nature. A stan-dard least squares approach would simply not be applicable in thiscase due to the presence of constraints. The inherent power of GAsto deal with non-linear problems in an effective manner makes GAthe natural choice for our approach. It will also take into accountspecific weight restrictions for each DMU.
2.1. GA based approach
This section explains the GA based approach employed forweight restrictions. This study uses some well known real valuedGA techniques available in literature.
2.1.1. The algorithmThe algorithm is summarized below. Individual steps are
explained in Section 3.
Step 1: Run Basic DEA and calculate Maximum Weight, Mini-mum Weight, Average Weight, and Standard Deviation for eachfactor.Step 2: Generate Initial population, half each from the twomethods described in Section 3.1.Step 3: Incorporate unanimous preferences from DMs into fea-sibility criteria of GA.Step 4: Calculate fitness based on DMs’ preferences.Step 5: Repeat steps 5a to 5c until termination criteria is met:5a. Perform crossover and mutation5b. Calculate Fitness5c. Perform Population SelectionStep 6: Take the solution chromosome and apply as bounds toDEA absolute weights with tolerance.Step 7: Take relative weight restrictions, if any, from solutionand put into bounded DEA model.Step 8: Run the restricted DEA model to get the solution.
3. Theory
In this section details relating to various steps of the proposedGA based weight restrictions algorithm are offered.
3.1. Run basic DEA, encoding, initial population generation andfeasibility criteria (Steps 1, 2 and 3)
The notations for basic DEA approach are outlined below.
Parameters
j ¼ 1; . . . ;n collection of DMUs
r ¼ 1; . . . ; s the set of outputs i ¼ 1; . . . ;m the set of inputs f ¼ 1; . . . ; F the set of dualrole factors
yrj ¼ 1; . . . ; rth output of jthDMU
xij ¼ 1; . . . ; ith input of jthDMUyr0 ¼ rth outputs of DMU0
xi0 ¼ ith inputs of DMU0wfj ¼ f th dual role factor of jthDMU
ci, di, user specified constantsfor weight restrictions
Decision variables
ur = weight of rth output vi = weight of ith input cf = output weight of fth dualrole factor
bf = input weight of fth dualrole factorThe basic unrestricted DEA formulation with dual role factors isas follows:
MAXXs
r¼1
uryr0 þXF
f¼1
cf wf 0 �XF
f¼1
bf wf 0 ð1Þ
Subject toXm
i¼1
v ix0i0 ¼ 1 ð2Þ
Xs
r¼1
ury0rj þXF
f¼1
cf w0fj �
XF
f¼1
bf w0fj �
Xm
i¼1
v ix0ij 6 0 8j ð3Þ
v i P e 8i ur P e 8r cf ; bf P 0 8f ð4Þ
The chromosome would be a real valued chromosome, whereineach gene would correspond to each weight’s variable in the DEAformulation. For example, if a DEA problem has two inputs andtwo outputs then the chromosome would be a four gene chromo-some, with each gene representing the weight of an input or out-put factor. If there are dual role factors (i.e., dual variables fromDEA model), then for each dual role factor, there would be twogenes, one for input weight and one for output weight. Thus, anew set of factors is introduced which is the set of all input, outputand dual role factors combined.
k ¼ 1 . . . T; the set of all factors
The initial population is generated from the Basic DEA asfollows:
3.1.1. Step 1
1. Run basic DEA model with all n DMUs and record the solutionweights for all T factors.
2. For each factor k, calculate the Minimum Weight, MaximumWeight, Average Weight and Standard Deviation from theabove solution.
3.1.2. Step 2
3. The initial population can now be generated in two ways:a. Each gene corresponding to each factor k can be a random
number between the maximum and minimum weight cor-responding to factor k.
b. Each gene can be a random number from a normal distribu-tion with mean and standard deviation corresponding toeach factor k.
It may be noted that Normal Distribution is used to generateinitial population and it bears no statistical relationship with realworld data. This is to ensure that initial GA population has chromo-somes closer to weights obtained by running the basic DEA model.Another important point to note is that the initial weights fromthis technique are only the starting points for GA. The feasibilitycriteria and the GA approach would ensure that the final weightsare closer to DMs preferences. This would be applicable to extremecases as well where certain DMUs in basic DEA are efficient due toone or two extreme weights.
We can get a good initial mix from both the above methods.Experimental results have indicated that an 80:20 mix (80% frommethod a, 20% from method b) gives good convergence on GA.
3.1.3. Step 3All the initial chromosomes generated from the above method
have to be feasible as per basic DEA formulation as well as anyunanimous preferences from DMs in terms of absolute or relativeweight restrictions.

Table 1Interval to ratio scale conversion for DMs’ preferences.
DM Pref_Interval11 thru Pref_Interval15 Pref_Ratio11 thru Pref_Ratio15
1 4 0.262 3 0.33 1 0.384 3 0.3
1506 V. Jain et al. / Expert Systems with Applications 42 (2015) 1503–1512
Incorporating unanimous preferences can be explained with asimple example. Let us say all DMs have a common opinion thatfactor T1 should not have a weight more than factor T2.
The chromosome will be referred to with its variable name CHRin the rest of the paper:
CHRkc : Value of weight factor k in chromosome c:
5 1 0.383.2. Fitness function and selection procedure (Step 4)
At the heart of the GA lies the fitness function which takes theform of a distance function combined with a penalty function. Thefitness function can be altered to take into account all sorts ofweights restrictions including absolute, relative and virtual weightrestrictions.
The DMs’ preferences for various factors comprising input data,shown in Table 2, are taken on an interval scale of 1 to 10. IntervalScale is chosen because it is more intuitive to DMs in terms of easycomparisons between factors and also it satisfies the three manda-tory requirements for interval scale i.e., all factors must be compa-rable and transitive by one common criterion as well as intervalsshould be equally spaced. Since, ratios in interval scale are notallowed; the measurement on interval scale is translated into aratio scale using ratio of differences so that it can be incorporatedinto DEA weights restrictions.
Such rating scales are based on axiomatic approach given byDyer and Sarin (1979) and Dyer and Sarin (1982). Valuations basedon such scales belong to the family of measurable value functionswhich describe values under certainty, and have the properties ofcorrect ranking of preferences as well as measuring strength ofthe preferences.
Pr efkl ¼ Preference of Decision Maker l for factor k
For each factor k, split the interval between maximum weightand minimum weight into t equal intervals and calculate the ratioscale preferences using Eq. (5) below:
Pref Ratiokl ¼ ðt � Prefkl þ 0:5Þ
� ðMaximumWeightk �MinimumWeightkÞt
ð5Þ
where,
t ¼Maximum Preference Scale ðGenerally 10Þ:MaximumWeightk ¼Maximum weight for factor k from basic DEA run:MinimumWeightk ¼Minimum weight for factor k from basic DEA run:
The ratio scale preferences (Pref_Ratiok1) are explained using anexample here. Let us assume that ratio scale preference is calcu-lated for five DMs for one factor. If minimum weight and maximumweight are 0.05 and 0.45, and t is 10, then Eq. (1) for five DMstranslates into column 3 in Table 1.
It may be noted that the factor 1 (k = 1) (‘‘Net Price’’ given inTable 2) is considered in Table 1 and the preferences shown in col-umn 2 are actual DMs’ preferences on interval scale with respect to‘‘Net Price’’.
The distance function can now be calculated as shown in Eq.(6):
Distc ¼XT
k¼1
XL
l¼1
Weightl � ðPref Ratiokl � CHRkcÞ2 ð6Þ
where,
Weightl ¼Weight for DMl in organizational hierarchy:If all DMs are at par; then this would be 1:
The ‘weight’ parameter in Eq. (6) above takes the hierarchy ofan organization into account. Senior DMs at higher level in thehierarchy get higher weights and have more ‘‘Say’’ in thedistance function which is the core component of GA’s fitnessfunction.
The final fitness function can be now stated as Eq. (7):
Fitnessc ¼ Distc þ ðPenalty� ViolationcÞ ð7Þ
where,
Penalty ¼ Fixed penalty for violation of strict constraints:Violationc ¼ Total absolute violation of chromosome c
from all strict constraints:
3.3. Genetic operators and population selection (Step 5)
In this study we have tried two different real valued GAapproaches from the literature for crossover and mutation. Theseare the GENOCOP approach and the differential evolution approach(Chakraborti, 2004; Michalewicz & Janikow, 1991). Although, thereare advanced real valued approaches in literature like GENOCOP IIand GENOCOP III, these all differ in terms of fitness function(Michalewicz & Attia, 1994; Michalewicz & Nazhiyath, 1995). Thegenetic operators are essentially the same.
3.3.1. Genetic operators in GENOCOPThe mutation operator is the non-uniform mutation operator in
GENOCOP (Michalewicz & Janikow, 1991). If CHRkc is selected formutation, then the mutation operation is as per Eq. (8):
CHR0kc ¼CHRkc þ Dðt;MaximumWeightk � CHRkcÞjRND ¼ 0CHRkc � Dðt;CHRkc �MinimumWeightkÞjRND ¼ 1
�ð8Þ
where,
t ¼ Generation Count RND ¼ Random Digit
Dðt; yÞ ¼ y� 1� r 1� tTð Þb
� �ð9Þ
r ¼ Random Number from ½0 . . . 1�T ¼Maximal Generation Numberb ¼ System Parameter determining the degree of non-uniformity
The whole arithmetical crossover defined as the linear combi-nation of two vectors is used as the crossover operator (Gen &Cheng, 1997; Michalewicz & Janikow, 1991). Thus, if CHRc1 andCHRc2 are to be crossed then, the resulting off-springs are calcu-lated as Eqs. (10) and (11):
CHR0kc1 ¼ ða� CHRkc2Þ þ ðð1� aÞ � CHRkc1Þ ð10ÞCHR0kc2 ¼ ða� CHRkc1Þ þ ðð1� aÞ � CHRkc2Þ ð11Þ
where,
a e½0::1�
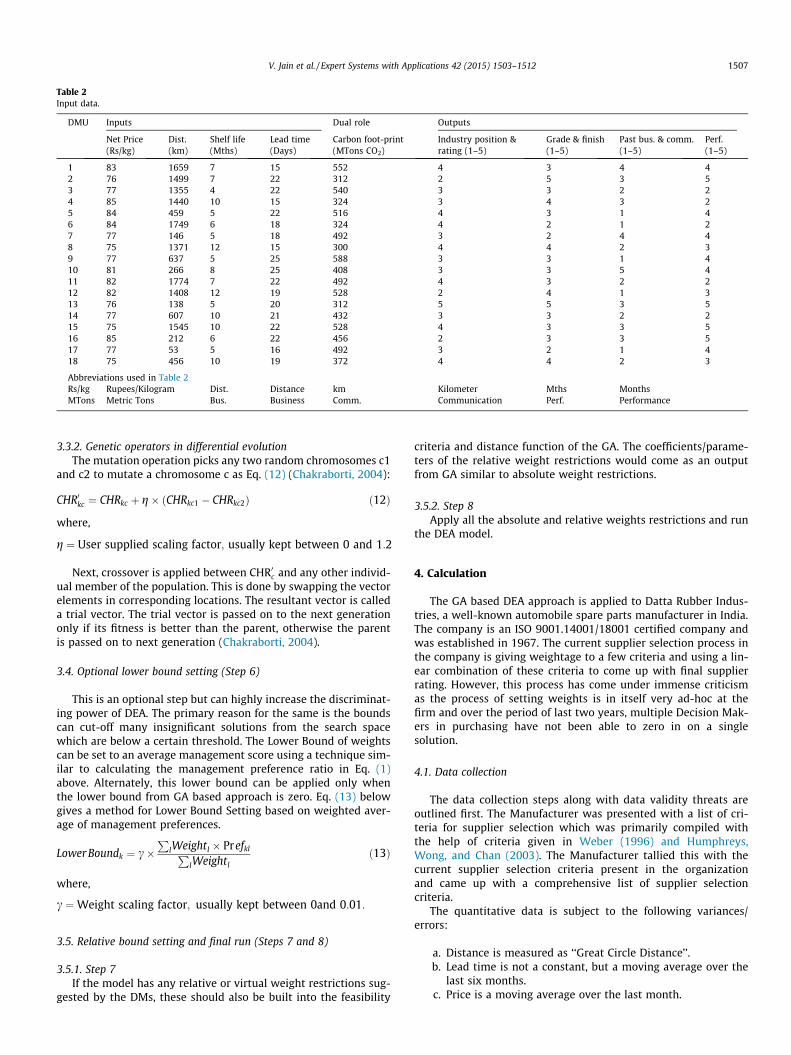
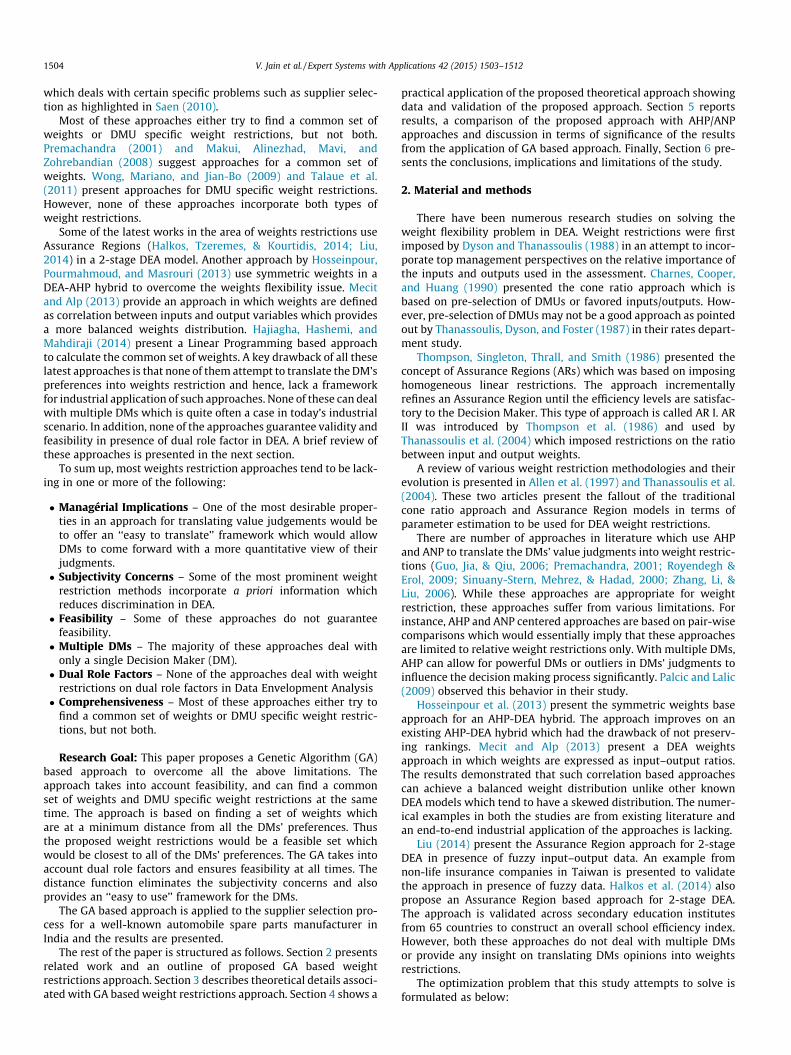
Table 2Input data.
DMU Inputs Dual role Outputs
Net Price(Rs/kg)
Dist.(km)
Shelf life(Mths)
Lead time(Days)
Carbon foot-print(MTons CO2)
Industry position &rating (1–5)
Grade & finish(1–5)
Past bus. & comm.(1–5)
Perf.(1–5)
1 83 1659 7 15 552 4 3 4 42 76 1499 7 22 312 2 5 3 53 77 1355 4 22 540 3 3 2 24 85 1440 10 15 324 3 4 3 25 84 459 5 22 516 4 3 1 46 84 1749 6 18 324 4 2 1 27 77 146 5 18 492 3 2 4 48 75 1371 12 15 300 4 4 2 39 77 637 5 25 588 3 3 1 410 81 266 8 25 408 3 3 5 411 82 1774 7 22 492 4 3 2 212 82 1408 12 19 528 2 4 1 313 76 138 5 20 312 5 5 3 514 77 607 10 21 432 3 3 2 215 75 1545 10 22 528 4 3 3 516 85 212 6 22 456 2 3 3 517 77 53 5 16 492 3 2 1 418 75 456 10 19 372 4 4 2 3
Abbreviations used in Table 2Rs/kg Rupees/Kilogram Dist. Distance km Kilometer Mths MonthsMTons Metric Tons Bus. Business Comm. Communication Perf. Performance
V. Jain et al. / Expert Systems with Applications 42 (2015) 1503–1512 1507
3.3.2. Genetic operators in differential evolutionThe mutation operation picks any two random chromosomes c1
and c2 to mutate a chromosome c as Eq. (12) (Chakraborti, 2004):
CHR0kc ¼ CHRkc þ g� ðCHRkc1 � CHRkc2Þ ð12Þ
where,
g ¼ User supplied scaling factor; usually kept between 0 and 1:2
Next, crossover is applied between CHR0c and any other individ-ual member of the population. This is done by swapping the vectorelements in corresponding locations. The resultant vector is calleda trial vector. The trial vector is passed on to the next generationonly if its fitness is better than the parent, otherwise the parentis passed on to next generation (Chakraborti, 2004).
3.4. Optional lower bound setting (Step 6)
This is an optional step but can highly increase the discriminat-ing power of DEA. The primary reason for the same is the boundscan cut-off many insignificant solutions from the search spacewhich are below a certain threshold. The Lower Bound of weightscan be set to an average management score using a technique sim-ilar to calculating the management preference ratio in Eq. (1)above. Alternately, this lower bound can be applied only whenthe lower bound from GA based approach is zero. Eq. (13) belowgives a method for Lower Bound Setting based on weighted aver-age of management preferences.
Lower Boundk ¼ c�P
lWeightl � PrefklPlWeightl
ð13Þ
where,
c ¼Weight scaling factor; usually kept between 0and 0:01:
3.5. Relative bound setting and final run (Steps 7 and 8)
3.5.1. Step 7If the model has any relative or virtual weight restrictions sug-
gested by the DMs, these should also be built into the feasibility
criteria and distance function of the GA. The coefficients/parame-ters of the relative weight restrictions would come as an outputfrom GA similar to absolute weight restrictions.
3.5.2. Step 8Apply all the absolute and relative weights restrictions and run
the DEA model.
4. Calculation
The GA based DEA approach is applied to Datta Rubber Indus-tries, a well-known automobile spare parts manufacturer in India.The company is an ISO 9001.14001/18001 certified company andwas established in 1967. The current supplier selection process inthe company is giving weightage to a few criteria and using a lin-ear combination of these criteria to come up with final supplierrating. However, this process has come under immense criticismas the process of setting weights is in itself very ad-hoc at thefirm and over the period of last two years, multiple Decision Mak-ers in purchasing have not been able to zero in on a singlesolution.
4.1. Data collection
The data collection steps along with data validity threats areoutlined first. The Manufacturer was presented with a list of cri-teria for supplier selection which was primarily compiled withthe help of criteria given in Weber (1996) and Humphreys,Wong, and Chan (2003). The Manufacturer tallied this with thecurrent supplier selection criteria present in the organizationand came up with a comprehensive list of supplier selectioncriteria.
The quantitative data is subject to the following variances/errors:
a. Distance is measured as ‘‘Great Circle Distance’’.b. Lead time is not a constant, but a moving average over the
last six months.c. Price is a moving average over the last month.
1508 V. Jain et al. / Expert Systems with Applications 42 (2015) 1503–1512
d. Shelf life for the majority of suppliers is generally constant.However, for new suppliers, this value may not be available.The purchasing team does an estimation based on the gradeand quality of steel tubes supplied. This is subject to estima-tion errors.
The qualitative data has been provided by two senior managersin the purchasing division and validated by the purchasing head.The qualitative data are subject to following variances:
a. Industry Position and Rating are widely available and thereare no significant variances.
b. Grade and finishing is also a widely available data item withno significant variances.
c. Past Business and Communication was obtained from histor-ical data.
d. Performance was available only for vendors with which thefirm had done significant business. For the others, perfor-mance estimates were not reliable. These were estimatedby opinion from other partner firms in the same domain.This is again subject to estimation errors.
A reputable consulting firm in the field of climate change wasappointed to undertake the carbon foot-printing process for allsuppliers. The firm was updated with specific guidelines for carbonfoot-printing for supplier selection in setting up the estimationboundaries.
Apart from the variances/errors discussed above, any quantita-tive research is subject to validity threats. When an extraneousvariable systematically varies with the independent variable, theformer becomes a confounding variable. The validity threats ariseprimarily due to confounding variables. The goal of any researchdesign should be to guard against these threats to validity.
Primarily, there are four types of validity:
1. Statistical Conclusion Validity – Concerned with the inferencethat there is a relationship between an independent variableand a dependent variable
2. Internal Validity – Internal validity is the ability to make causalconclusions.
3. External Validity – Concerned with the extent to which astudy’s results can be generalized.
4. Construct Validity – Concerned with the extent to whichhigher-order constructs are represented in a particular study.
A list of threats to all the four types of validation can be foundextensively in literature. Some of the threats that affect the currentresearch are discussed next along with relevant mitigationstrategies:
� Threats to Statistical Conclusion Validity – One threat thatcomes across in this study is the use of a Rank-Sum test to sta-tistically compare two ranking methodologies. The test revealsthat the ranking done by the two different GA techniques isnot the same. However, this is not sufficient for the user to
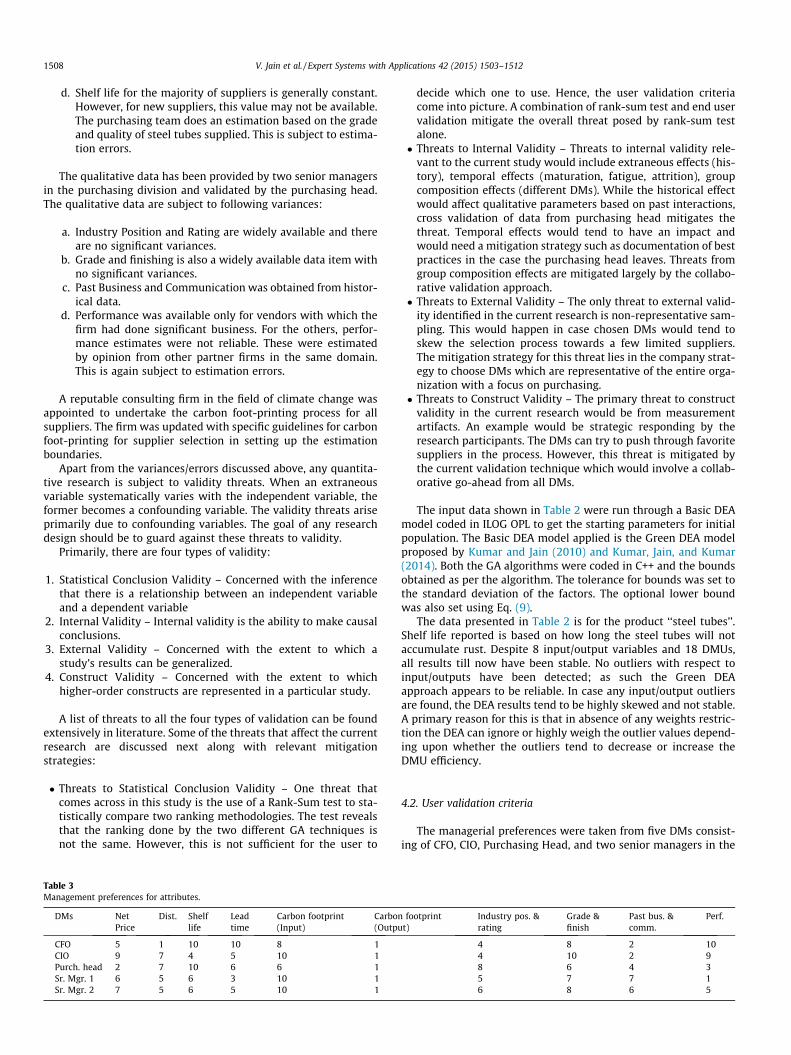
Table 3Management preferences for attributes.
DMs NetPrice
Dist. Shelflife
Leadtime
Carbon footprint(Input)
Carbon(Outpu
CFO 5 1 10 10 8 1CIO 9 7 4 5 10 1Purch. head 2 7 10 6 6 1Sr. Mgr. 1 6 5 6 3 10 1Sr. Mgr. 2 7 5 6 5 10 1
decide which one to use. Hence, the user validation criteriacome into picture. A combination of rank-sum test and end uservalidation mitigate the overall threat posed by rank-sum testalone.� Threats to Internal Validity – Threats to internal validity rele-
vant to the current study would include extraneous effects (his-tory), temporal effects (maturation, fatigue, attrition), groupcomposition effects (different DMs). While the historical effectwould affect qualitative parameters based on past interactions,cross validation of data from purchasing head mitigates thethreat. Temporal effects would tend to have an impact andwould need a mitigation strategy such as documentation of bestpractices in the case the purchasing head leaves. Threats fromgroup composition effects are mitigated largely by the collabo-rative validation approach.� Threats to External Validity – The only threat to external valid-
ity identified in the current research is non-representative sam-pling. This would happen in case chosen DMs would tend toskew the selection process towards a few limited suppliers.The mitigation strategy for this threat lies in the company strat-egy to choose DMs which are representative of the entire orga-nization with a focus on purchasing.� Threats to Construct Validity – The primary threat to construct
validity in the current research would be from measurementartifacts. An example would be strategic responding by theresearch participants. The DMs can try to push through favoritesuppliers in the process. However, this threat is mitigated bythe current validation technique which would involve a collab-orative go-ahead from all DMs.
The input data shown in Table 2 were run through a Basic DEAmodel coded in ILOG OPL to get the starting parameters for initialpopulation. The Basic DEA model applied is the Green DEA modelproposed by Kumar and Jain (2010) and Kumar, Jain, and Kumar(2014). Both the GA algorithms were coded in C++ and the boundsobtained as per the algorithm. The tolerance for bounds was set tothe standard deviation of the factors. The optional lower boundwas also set using Eq. (9).
The data presented in Table 2 is for the product ‘‘steel tubes’’.Shelf life reported is based on how long the steel tubes will notaccumulate rust. Despite 8 input/output variables and 18 DMUs,all results till now have been stable. No outliers with respect toinput/outputs have been detected; as such the Green DEAapproach appears to be reliable. In case any input/output outliersare found, the DEA results tend to be highly skewed and not stable.A primary reason for this is that in absence of any weights restric-tion the DEA can ignore or highly weigh the outlier values depend-ing upon whether the outliers tend to decrease or increase theDMU efficiency.
4.2. User validation criteria
The managerial preferences were taken from five DMs consist-ing of CFO, CIO, Purchasing Head, and two senior managers in the
footprintt)
Industry pos. &rating
Grade &finish
Past bus. &comm.
Perf.
4 8 2 104 10 2 98 6 4 35 7 7 16 8 6 5
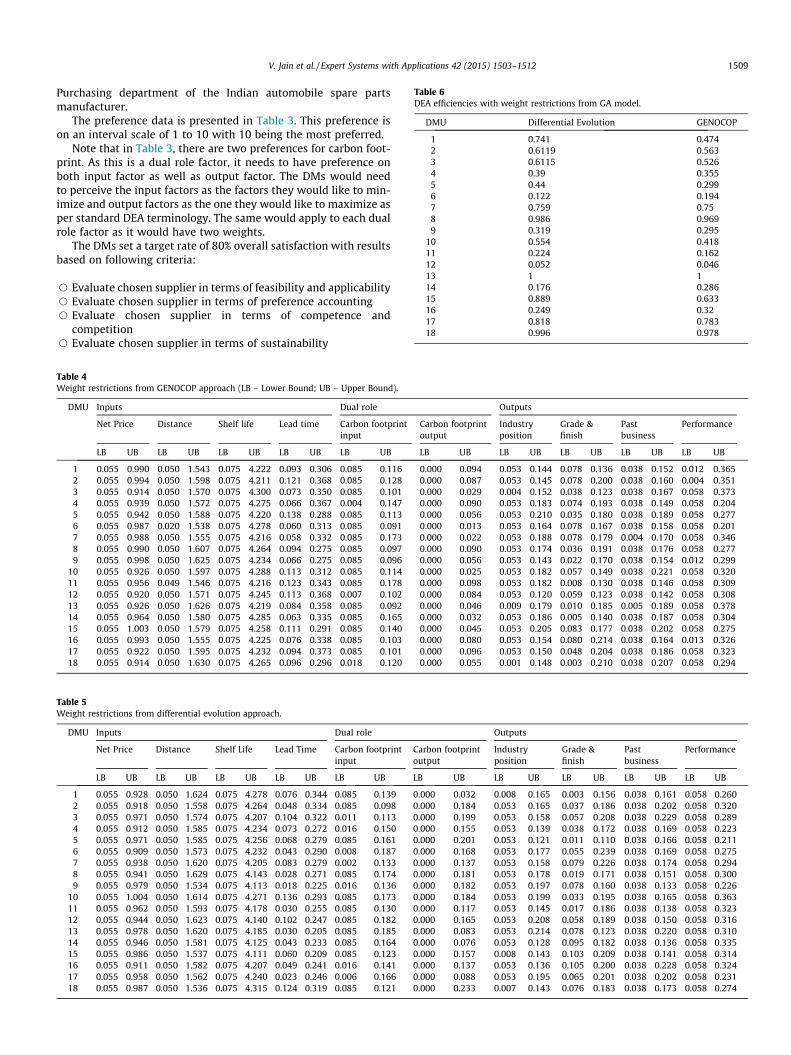
Table 6DEA efficiencies with weight restrictions from GA model.
DMU Differential Evolution GENOCOP
1 0.741 0.4742 0.6119 0.5633 0.6115 0.5264 0.39 0.3555 0.44 0.2996 0.122 0.1947 0.759 0.758 0.986 0.9699 0.319 0.295
10 0.554 0.41811 0.224 0.16212 0.052 0.04613 1 114 0.176 0.28615 0.889 0.63316 0.249 0.3217 0.818 0.78318 0.996 0.978
V. Jain et al. / Expert Systems with Applications 42 (2015) 1503–1512 1509
Purchasing department of the Indian automobile spare partsmanufacturer.
The preference data is presented in Table 3. This preference ison an interval scale of 1 to 10 with 10 being the most preferred.
Note that in Table 3, there are two preferences for carbon foot-print. As this is a dual role factor, it needs to have preference onboth input factor as well as output factor. The DMs would needto perceive the input factors as the factors they would like to min-imize and output factors as the one they would like to maximize asper standard DEA terminology. The same would apply to each dualrole factor as it would have two weights.
The DMs set a target rate of 80% overall satisfaction with resultsbased on following criteria:
s Evaluate chosen supplier in terms of feasibility and applicabilitys Evaluate chosen supplier in terms of preference accountings Evaluate chosen supplier in terms of competence and
competitions Evaluate chosen supplier in terms of sustainability
Table 5Weight restrictions from differential evolution approach.
DMU Inputs Dual role Outputs
Net Price Distance Shelf Life Lead Time Carbon footprintinput
Carbon footprintoutput
Industryposition
Grade &finish
Pastbusiness
Performance
LB UB LB UB LB UB LB UB LB UB LB UB LB UB LB UB LB UB LB UB
1 0.055 0.928 0.050 1.624 0.075 4.278 0.076 0.344 0.085 0.139 0.000 0.032 0.008 0.165 0.003 0.156 0.038 0.161 0.058 0.2602 0.055 0.918 0.050 1.558 0.075 4.264 0.048 0.334 0.085 0.098 0.000 0.184 0.053 0.165 0.037 0.186 0.038 0.202 0.058 0.3203 0.055 0.971 0.050 1.574 0.075 4.207 0.104 0.322 0.011 0.113 0.000 0.199 0.053 0.158 0.057 0.208 0.038 0.229 0.058 0.2894 0.055 0.912 0.050 1.585 0.075 4.234 0.073 0.272 0.016 0.150 0.000 0.155 0.053 0.139 0.038 0.172 0.038 0.169 0.058 0.2235 0.055 0.971 0.050 1.585 0.075 4.256 0.068 0.279 0.085 0.161 0.000 0.201 0.053 0.121 0.011 0.110 0.038 0.166 0.058 0.2116 0.055 0.909 0.050 1.573 0.075 4.232 0.043 0.290 0.008 0.187 0.000 0.168 0.053 0.177 0.055 0.239 0.038 0.169 0.058 0.2757 0.055 0.938 0.050 1.620 0.075 4.205 0.083 0.279 0.002 0.133 0.000 0.137 0.053 0.158 0.079 0.226 0.038 0.174 0.058 0.2948 0.055 0.941 0.050 1.629 0.075 4.143 0.028 0.271 0.085 0.174 0.000 0.181 0.053 0.178 0.019 0.171 0.038 0.151 0.058 0.3009 0.055 0.979 0.050 1.534 0.075 4.113 0.018 0.225 0.016 0.136 0.000 0.182 0.053 0.197 0.078 0.160 0.038 0.133 0.058 0.226
10 0.055 1.004 0.050 1.614 0.075 4.271 0.136 0.293 0.085 0.173 0.000 0.184 0.053 0.199 0.033 0.195 0.038 0.165 0.058 0.36311 0.055 0.962 0.050 1.593 0.075 4.178 0.030 0.255 0.085 0.130 0.000 0.117 0.053 0.145 0.017 0.186 0.038 0.138 0.058 0.32312 0.055 0.944 0.050 1.623 0.075 4.140 0.102 0.247 0.085 0.182 0.000 0.165 0.053 0.208 0.058 0.189 0.038 0.150 0.058 0.31613 0.055 0.978 0.050 1.620 0.075 4.185 0.030 0.205 0.085 0.185 0.000 0.083 0.053 0.214 0.078 0.123 0.038 0.220 0.058 0.31014 0.055 0.946 0.050 1.581 0.075 4.125 0.043 0.233 0.085 0.164 0.000 0.076 0.053 0.128 0.095 0.182 0.038 0.136 0.058 0.33515 0.055 0.986 0.050 1.537 0.075 4.111 0.060 0.209 0.085 0.123 0.000 0.157 0.008 0.143 0.103 0.209 0.038 0.141 0.058 0.31416 0.055 0.911 0.050 1.582 0.075 4.207 0.049 0.241 0.016 0.141 0.000 0.137 0.053 0.136 0.105 0.200 0.038 0.228 0.058 0.32417 0.055 0.958 0.050 1.562 0.075 4.240 0.023 0.246 0.006 0.166 0.000 0.088 0.053 0.195 0.065 0.201 0.038 0.202 0.058 0.23118 0.055 0.987 0.050 1.536 0.075 4.315 0.124 0.319 0.085 0.121 0.000 0.233 0.007 0.143 0.076 0.183 0.038 0.173 0.058 0.274
Table 4Weight restrictions from GENOCOP approach (LB – Lower Bound; UB – Upper Bound).
DMU Inputs Dual role Outputs
Net Price Distance Shelf life Lead time Carbon footprintinput
Carbon footprintoutput
Industryposition
Grade &finish
Pastbusiness
Performance
LB UB LB UB LB UB LB UB LB UB LB UB LB UB LB UB LB UB LB UB
1 0.055 0.990 0.050 1.543 0.075 4.222 0.093 0.306 0.085 0.116 0.000 0.094 0.053 0.144 0.078 0.136 0.038 0.152 0.012 0.3652 0.055 0.994 0.050 1.598 0.075 4.211 0.121 0.368 0.085 0.128 0.000 0.087 0.053 0.145 0.078 0.200 0.038 0.160 0.004 0.3513 0.055 0.914 0.050 1.570 0.075 4.300 0.073 0.350 0.085 0.101 0.000 0.029 0.004 0.152 0.038 0.123 0.038 0.167 0.058 0.3734 0.055 0.939 0.050 1.572 0.075 4.275 0.066 0.367 0.004 0.147 0.000 0.090 0.053 0.183 0.074 0.193 0.038 0.149 0.058 0.2045 0.055 0.942 0.050 1.588 0.075 4.220 0.138 0.288 0.085 0.113 0.000 0.056 0.053 0.210 0.035 0.180 0.038 0.189 0.058 0.2776 0.055 0.987 0.020 1.538 0.075 4.278 0.060 0.313 0.085 0.091 0.000 0.013 0.053 0.164 0.078 0.167 0.038 0.158 0.058 0.2017 0.055 0.988 0.050 1.555 0.075 4.216 0.058 0.332 0.085 0.173 0.000 0.022 0.053 0.188 0.078 0.179 0.004 0.170 0.058 0.3468 0.055 0.990 0.050 1.607 0.075 4.264 0.094 0.275 0.085 0.097 0.000 0.090 0.053 0.174 0.036 0.191 0.038 0.176 0.058 0.2779 0.055 0.998 0.050 1.625 0.075 4.234 0.066 0.275 0.085 0.096 0.000 0.056 0.053 0.143 0.022 0.170 0.038 0.154 0.012 0.299
10 0.055 0.926 0.050 1.597 0.075 4.288 0.113 0.312 0.085 0.114 0.000 0.025 0.053 0.182 0.057 0.149 0.038 0.221 0.058 0.32011 0.055 0.956 0.049 1.546 0.075 4.216 0.123 0.343 0.085 0.178 0.000 0.098 0.053 0.182 0.008 0.130 0.038 0.146 0.058 0.30912 0.055 0.920 0.050 1.571 0.075 4.245 0.113 0.368 0.007 0.102 0.000 0.084 0.053 0.120 0.059 0.123 0.038 0.142 0.058 0.30813 0.055 0.926 0.050 1.626 0.075 4.219 0.084 0.358 0.085 0.092 0.000 0.046 0.009 0.179 0.010 0.185 0.005 0.189 0.058 0.37814 0.055 0.964 0.050 1.580 0.075 4.285 0.063 0.335 0.085 0.165 0.000 0.032 0.053 0.186 0.005 0.140 0.038 0.187 0.058 0.30415 0.055 1.003 0.050 1.579 0.075 4.258 0.111 0.291 0.085 0.140 0.000 0.045 0.053 0.205 0.083 0.177 0.038 0.202 0.058 0.27516 0.055 0.993 0.050 1.555 0.075 4.225 0.076 0.338 0.085 0.103 0.000 0.080 0.053 0.154 0.080 0.214 0.038 0.164 0.013 0.32617 0.055 0.922 0.050 1.595 0.075 4.232 0.094 0.373 0.085 0.101 0.000 0.096 0.053 0.150 0.048 0.204 0.038 0.186 0.058 0.32318 0.055 0.914 0.050 1.630 0.075 4.265 0.096 0.296 0.018 0.120 0.000 0.055 0.001 0.148 0.003 0.210 0.038 0.207 0.058 0.294

Table 7Validation scores from DMs.
Approach Differential evolution GENOCOP
DM1 DM2 DM3 DM4 DM5 DM1 DM2 DM3 DM4 DM5
Feasibility 3 4 4 4 3 4 5 4 3 5Preference Accounting 3 4 3 3 4 4 5 5 4 5Competency 3 3 3 2 3 4 4 3 5 4Sustainability 4 4 3 4 4 4 4 4 4 4Total 13 15 13 13 14 16 18 16 16 18Grand Total 68 84
1510 V. Jain et al. / Expert Systems with Applications 42 (2015) 1503–1512
The DMs were presented with the results and were asked torate the results on a Likert scale (which would be translated to apercentage satisfaction later) on all four criteria listed above(namely, feasibility, preference accounting, competency and sus-tainability). The Likert scale range was 1 to 5; 1 being ‘‘StronglyDisagree’’ and 5 being ‘‘Strongly Agree’’.
5. Results
Weight restrictions obtained by applying both approaches areshown in Tables 4 and 5. Table 6 shows the efficiencies from theDEA run with the bounds obtained from both the GA based mod-els. As can be seen, for some variables, the lower bounds are samefor all DMUs. This is because of the optional lower bound settingstep. All the lower bounds which are same across all DMUs arethe optional lower bounds calculated for that particular input/output.
5.1. Initial observations and statistical inferences
From the results in Table 6, it is evident that a majority of sup-pliers are highly inefficient, when evaluated on comprehensivemanagement criteria. Only supplier 13 stands out as a highly effi-cient supplier on all fronts. Table 2 also shows DMU 13 has ascore of 5 (out of 5) for 3 out of 4 outputs and also has the lowestcarbon footprint which plays a dual role. Clearly a proper scien-tific technique has verified what is quite apparent but it maynot be true in all cases. However, this was a surprising revelationto the firm, as prior to this study, the management consideredsuppliers 1, 2 and 18 as their preferred suppliers because of longterm relationships and the brand value of these suppliers. Theresults from the study show that suppliers 1 and 2 have low effi-ciency ratings. Though supplier 18 has a high efficiency rating itis still behind supplier 13 when evaluated on overall managementpreferences primarily because of distance and environmentalefficiency.
Next, a rank-sum test is performed to establish whether therankings given by different GA models are similar or statisti-cally different. The rank-sum test deals with statistical compar-ison between two groups of efficiency values, i.e., withdifferential evolution GA, and the GENOCOP model. The test isused to identify whether differences between two groups aresignificant.
Using t-statistic, the null hypothesis that the two groups havethe same population at a level of significance a can be checked.In this example, there is t = 0.4588. If a = 0.05 (5%) is chosen, thenit holds that t0.025 = 1.96. Since t = 0.4588 < 1.96 = t0.025, the nullhypothesis at the significance level 5% cannot be rejected. Conse-quently, the differences amongst efficiency scores obtained by boththe models are not statistically significant.
The DMs’ overall scoring for Differential Evolution and GENO-COP approaches is presented in Table 7. The overall score was84% for results from the GENOCOP model and 68% from the Differ-
ential Evolution GA. Hence, it was concluded that the GENOCOPapproach is better suited for GA based weights restrictionsapproach.
5.2. Comparison with AHP/ANP based approach
The approach was benchmarked with AHP/ANP based weightsrestriction approaches as they seem best suited in literature formultiple DMs. The AHP based approach in Premachandra (2001)was used to generate weights restrictions with the current dataset. The automobile spare parts manufacturer’s CFO set the pair-wise priorities very high for Net Price as compared to other criteria.Pair-wise comparisons from other DMs were not skewed as much.As a result supplier 18 secured the highest rating ignoring othercriteria. Consequently, the overall acceptance among DMs waslow. Overall user acceptance score using the validation criteriawas 68%, much less compared to the 84% acceptance of GA basedapproach. This is in line with the limitations for AHP based tech-niques outlined in Palcic and Lalic (2009).
5.3. Discussion
During the pilot project with steel tubes as the raw material inthe scope, some of the observations and conclusions from the DMsand managers were:
1. Ease of use – DMs were not baffled with providing a lot of com-parative input–output restrictions or relative weight restric-tions to synchronize with their priorities.
2. Improved Efficiency – Visibility into trade-offs which the DMswere not considering earlier, allowed them to choose a supplierwhich would add to overall efficiency.
3. Less Infighting – Conflicts within management and DMsreduced allowing for a more smooth and streamlined decisionprocess.
4. Greener Supply Chain – Reduced carbon impact from the sup-plier reduces the overall firm’s carbon footprint.
The results have pointed out the implied benefits from thistype of study. It can be extremely relevant in supplier selectionscenarios where decision making is a collective process, whichis often the case in medium and large scale manufacturing com-panies. The management views of an efficient supplier cannot becoherent across an organization. In case an overall organizationalview is required to judge a supplier, the proposed approach isdesirable.
6. Conclusions, implications and limitations of the study
In this paper we introduced a GA based approach to estimationof weight restrictions in DEA. In comparison with most commonlyused approaches, the GA based approach has the advantage ofdealing with multiple Decision Makers and guarantees feasibilityat all times.

V. Jain et al. / Expert Systems with Applications 42 (2015) 1503–1512 1511
An application of the proposed GA based approach to an auto-mobile spare parts manufacturer in India is presented. The resultswere a revelation to the manufacturer as some of the preferredsuppliers it considered efficient were found to have a low effi-ciency rating. The results were validated by the users based onthe success criteria defined by the users.
The approach developed provides a robust methodology todeal with the weights flexibility problem in DEA and seamlesslytranslate the management’s views into the decision makingstrategy. Translating DMs’ preferences into a distance functionand using that as a fitness measure within Evolutionary Algo-rithms has been done for the first time and which also in thepresence of multiple DMs. This type of study assumes extremerelevance in supplier selection scenarios where decision makingis a collective process. Overall the approach provides a compre-hensive framework for implementing a firm-wide supplier selec-tion policy. Findings from this study indicated that only the mostefficient suppliers are selected in line with the company’s pro-curement policy, while avoiding managerial conflicts within anorganization. It was also shown that the approach can deal withdual role factors such as carbon footprints in the GDEAformulation.
An exciting piece of the puzzle is to translate value judg-ments of Decision Makers (DMs) into weight restrictions in pres-ence of multiple DMs and significant organizational hierarchyamong them. The current study contributes to research an ‘‘easyto use’’ and robust framework for translating DMs’ views intothe decision making process. The approach deals with an impor-tant aspect of the problem that the management views of anefficient supplier cannot be coherent across an organization. Incase an overall organizational view is required to judge a sup-plier, the proposed approaches are desirable. The approach isvalidated in terms of feasibility, applicability and sustainability,as well, which adds further weight to it being a valuableresearch contribution.
There are significant implications of the approach both from apractical and theoretical viewpoint. Practically, it provides an‘‘Easy to Use’’ framework to translate Decision Makers’ (DMs)judgements into the decision making process while incorporatingmultiple DMs. Theoretically; it paves the way for more robustand comprehensive DEA models which can be used across a varietyof Multi Criteria Decision Making problems.
A limitation of the approach would be that user validation uti-lizing an aggregate norm may tend to skew results in case of highvariance. Variance among DMs’ opinions in the validation processis not taken into account. This is primarily because the study isaimed at reducing the overall distance from DMs’ opinions andnot individual distance.
A suggested future research is to examine the proposedapproach by including individual DMs’ variances in the fitnessfunction of GA to reduce the variance across DMs. The currentend user validation process is based on an aggregate norm whichdoes not take skewness into account. Another suggested directionwould be to re-formulate the entire supplier selection problem as abi-objective problem with the twin objective of DEA efficiency andthe distance from DMs opinion and solve it using an appropriatemultiple objective optimization technique. An important extensionof this research would be to modify the approach to account forfuzziness in input–output data and develop a fuzzy based approachto come up with a robust ranking process.
References
Allen, R., Athanassopoulos, A., Dyson, R. G., & Thanassoulis, E. (1997). Weightsrestrictions and value judgments in data envelopment analysis: Evolution,development and future directions. Annals of Operations Research, 73, 13–34.
Angulo-Meza, L., & Lins, M. P. E. (2002). Review of methods for increasingdiscrimination in data envelopment analysis. Annals of Operations Research,116, 224–242.
Chakraborti, N. (2004). Differential evolution: The real-parameter genetic algorithmapplied to materials and metallurgy. An article from Kanpur Genetic AlgorithmsLaboratory.
Charnes, A., Cooper, W. W., & Huang, Z. M. (1990). Polyhedral cone-ratio DEAmodels with an illustrative application to large commercial banks. Journal ofEconometrics, 46(1–2), 73–91.
Charnes, A., Cooper, W. W., & Rhodes, E. (1978). Measuring the efficiency ofdecision making units. European Journal of Operational Research, 2,429–444.
Dyer, J. S., & Sarin, R. K. (1979). Measurable multiattribute utility functions.Operations Research, 27(4), 810–822.
Dyer, J. S., & Sarin, R. K. (1982). Relative risk aversion. Management Science, 28(8),875–886.
Dyson, R. G., & Thanassoulis, E. (1988). Reducing weight flexibility in dataenvelopment analysis. Journal of the Operational Research Society, 39(6),563–576.
Gen, M., & Cheng, R. (1997). Genetic algorithms and engineering design. Wiley Seriesin Engineering Design and Automation.
Guo, J., Jia, L., & Qiu, L. (2006). Research on supply chain performance evaluationbased on DEA/AHP model. In Proceedings of the 2006 IEEE Asia-Pacific conferenceon services computing (APSCC’06) (pp. 609–612).
Hajiagha, S. H. R., Hashemi, S. S., & Mahdiraji, H. A. (2014). DEA with common set ofweights based on a multi objective fractional programming problem.International Journal of Industrial Engineering & Production Research, 25(3),207–214.
Halkos, G. E., Tzeremes, N. G., & Kourtidis, S. A. (2014). Weight assurance region intwo-stage additive efficiency decomposition DEA model: An application toschool data. Journal of the Operational Research Society.
Hosseinpour, S., Pourmahmoud, J., & Masrouri, N. (2013). Using cross efficiency withsymmetric weights for the method DEAHP. Journal of Educational andManagement Studies, 3(4), 384–389.
Humphreys, P. K., Wong, Y. K., & Chan, F. T. S. (2003). Integrating environmentalcriteria into supplier selection process. Journal of Materials ProcessingTechnology, 138, 349–356.
Kumar A., & Jain, V. (2010) a green approach to supplier selection, 2010 AnnualINFORMS Meeting, Austin, Texas.
Kumar A., & Jain, V. (2010). Supplier selection: A green approach with carbonfootprint monitoring. In Proceedings of 8th international conference on supplychain management and information systems (pp. 622–629). Hong Kong.
Kumar, A., Jain, V., & Kumar, S. (2014). A comprehensive environment friendlyapproach for supplier selection. OMEGA, 42, 109–123.
Liu, S. T. (2014). Restricting weight flexibility in fuzzy two-stage DEA. Computers &Industrial Engineering, 74, 149–160.
Makui, A., Alinezhad, A., Mavi, R. K., & Zohrebandian (2008). A goalprogramming method for finding common weights in DEA with animproved discriminating power for efficiency. Journal of Industrial andSystems Engineering, 1(4), 293–303.
Mecit, E., & Alp, I. (2013). A new constrained data envelopment analysis approachwith correlation coefficients for balanced weight distribution. In Proceedings ofthe 11th international conference of DEA, 2013, Samsun, Turkey.
Michalewicz, Z., & Attia, N. (1994). Evolutionary optimization of constrainedproblems. In Proceedings of 3rd annual conference on EP (pp. 98–108). WorldScientific.
Michalewicz, Z., & Janikow, C. Z. (1991). GENOCOP: A genetic algorithm for numericaloptimization problems with linear constraints. Communications of ACM.
Michalewicz, Z., & Nazhiyath, G. (1995). GENOCOP III: A co-evolutionaryalgorithm for numerical optimization problems with nonlinear constraints.Proceedings of IEEE International Conference on Evolutionary Computation, 2,647–651.
Palcic, I., & Lalic, B. (2009). Analytic hierarchy process as a tool for selectingand evaluating projects. International Journal of Simulation Modeling, 8(1),16–26.
Premachandra, I. M. (2001). Controlling factor weights in data envelopmentanalysis by incorporating decision maker’s value judgment: An approachbased on AHP. Information and Management Sciences, 12(2), 67–82.
Royendegh, B. D., & Erol, S. (2009). A DEA-ANP hybrid algorithm approach toevaluate a university’s performance. International Journal of Basic & AppliedSciences, 9(10), 115–129.
Saen, R. F. (2010). Restricting weights in supplier selection decisions in thepresence of dual-role factors. Applied Mathematical Modeling, 34(10),2820–2830.
Sinuany-Stern, Z., Mehrez, A., & Hadad, Y. (2000). An AHP/DEA methodology forranking decision making units. International Transactions in OperationalResearch, 7(2), 109–124.
Talaue, C. O., Diesta, N. A. N., & Tapia, C. G. (2011). Weights Restriction bymultiple decision makers in data envelopment analysis using fuzzyprogramming. In Proceedings of the 11th Philippine computing sciencecongress, Philippines.
Thanassoulis, E., Dyson, R. G., & Foster, M. (1987). Relative efficiency assessmentsusing data envelopment analysis: An application to data on rates departments.Journal of the Operational Research Society, 38, 397–411.
Thanassoulis, E., Portela, Maria Conceição., & Allen, Rachel. (2004). Incorporatingvalue judgments in DEA. In W. W. Cooper, L. M. Seiford, & J. Zhu (Eds.),

1512 V. Jain et al. / Expert Systems with Applications 42 (2015) 1503–1512
Handbook on data envelopment analysis (pp. 99–138). New York, Boston,Dordrecht, London, Moscow: Kluwer Academic Publishers.
Thompson, R. G., Singleton, F. D., Jr., Thrall, R. M., & Smith, B. A. (1986). Comparativesite evaluations for locating a high-energy physics lab in Texas. Interfaces, 16,35–49.
Weber, A. (1996). A data envelopment analysis approach to measuring vendorperformance. Journal of Supply Chain Management, 1(1), 28–39.
Wong, B. Y.-H., Mariano, L., & Jian-Bo, Y. (2009). Using interactive multi-objectivemethods to solve DEA problems with value judgments. Computers andOperations Research, 36(2), 623–636.
Zhang, H., Li, X., & Liu, W. (2006). An AHP/DEA methodology for 3PL vendorselection in 4PLW. In Shen et al. (Eds.), CSCWD 2005, LNCS 3865 (Vol. 2)(pp. 646–655). Berlin Heidelberg: Springer-Verlag.