Embed Size (px)
DESCRIPTION
week tech
Citation preview
August 10, 2015
Weekly Technical
Research AnalystsResearch AnalystsDharmesh Shah [email protected] Kunte, CMT [email protected] Dagha [email protected] Mukherjee [email protected] Parmar vinayak parmar@icicisecurities comVinayak Parmar [email protected]
Benchmark indices settled marginally higher in a choppy trading week even as RBI maintained status quo on policy rates and earnings season peters out. TheSensex closed at 28241, up 126 points while the Nifty gained 31 points to settle at 8564 levels. Broader markets continued their buoyancy as the BSE midcap and
ll i di 2 3% h Th id i d i t tl li t lif hi h fl t t k ifi ti hil i d i b d
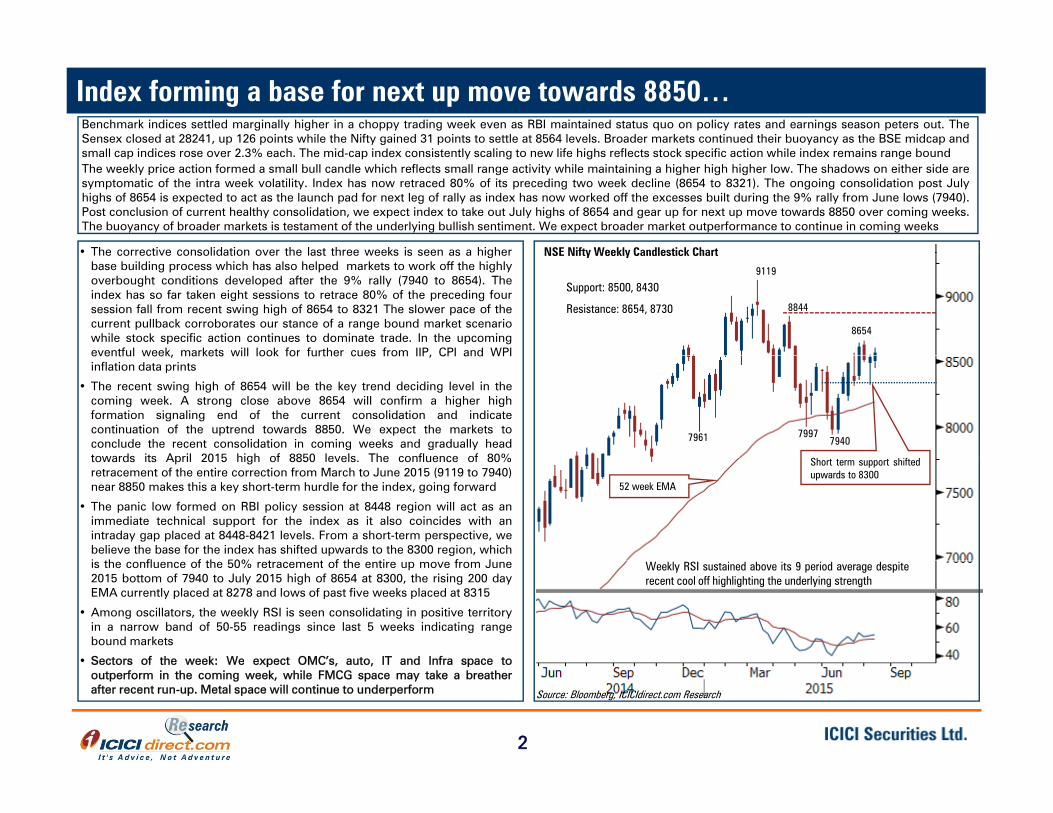
Index forming a base for next up move towards 8850…
small cap indices rose over 2.3% each. The mid-cap index consistently scaling to new life highs reflects stock specific action while index remains range boundThe weekly price action formed a small bull candle which reflects small range activity while maintaining a higher high higher low. The shadows on either side aresymptomatic of the intra week volatility. Index has now retraced 80% of its preceding two week decline (8654 to 8321). The ongoing consolidation post Julyhighs of 8654 is expected to act as the launch pad for next leg of rally as index has now worked off the excesses built during the 9% rally from June lows (7940).Post conclusion of current healthy consolidation, we expect index to take out July highs of 8654 and gear up for next up move towards 8850 over coming weeks.The buoyancy of broader markets is testament of the underlying bullish sentiment. We expect broader market outperformance to continue in coming weeks
NSE Nifty Weekly Candlestick Chart• The corrective consolidation over the last three weeks is seen as a higher NSE Nifty Weekly Candlestick ChartThe corrective consolidation over the last three weeks is seen as a higherbase building process which has also helped markets to work off the highlyoverbought conditions developed after the 9% rally (7940 to 8654). Theindex has so far taken eight sessions to retrace 80% of the preceding foursession fall from recent swing high of 8654 to 8321 The slower pace of thecurrent pullback corroborates our stance of a range bound market scenariowhile stock specific action continues to dominate trade. In the upcomingeventful week, markets will look for further cues from IIP, CPI and WPI
9119
8844
8654
Support: 8500, 8430
Resistance: 8654, 8730
eventful week, markets will look for further cues from IIP, CPI and WPIinflation data prints
• The recent swing high of 8654 will be the key trend deciding level in thecoming week. A strong close above 8654 will confirm a higher highformation signaling end of the current consolidation and indicatecontinuation of the uptrend towards 8850. We expect the markets toconclude the recent consolidation in coming weeks and gradually headtowards its April 2015 high of 8850 levels The confluence of 80%
799779407961
Sh hif dtowards its April 2015 high of 8850 levels. The confluence of 80%retracement of the entire correction from March to June 2015 (9119 to 7940)near 8850 makes this a key short-term hurdle for the index, going forward
• The panic low formed on RBI policy session at 8448 region will act as animmediate technical support for the index as it also coincides with anintraday gap placed at 8448-8421 levels. From a short-term perspective, webelieve the base for the index has shifted upwards to the 8300 region, whichi th fl f th 50% t t f th ti f J
Short term support shiftedupwards to 8300
52 week EMA
is the confluence of the 50% retracement of the entire up move from June2015 bottom of 7940 to July 2015 high of 8654 at 8300, the rising 200 dayEMA currently placed at 8278 and lows of past five weeks placed at 8315
• Among oscillators, the weekly RSI is seen consolidating in positive territoryin a narrow band of 50-55 readings since last 5 weeks indicating rangebound markets
• Sectors of the week: We expect OMC’s auto IT and Infra space to
Weekly RSI sustained above its 9 period average despiterecent cool off highlighting the underlying strength
2
Sectors of the week: We expect OMC s, auto, IT and Infra space tooutperform in the coming week, while FMCG space may take a breatherafter recent run-up. Metal space will continue to underperform Source: Bloomberg, ICICIdirect.com Research
Deal Team – At Your ServiceBank Nifty (18979): Bank Nifty to challenge 19280 levels…
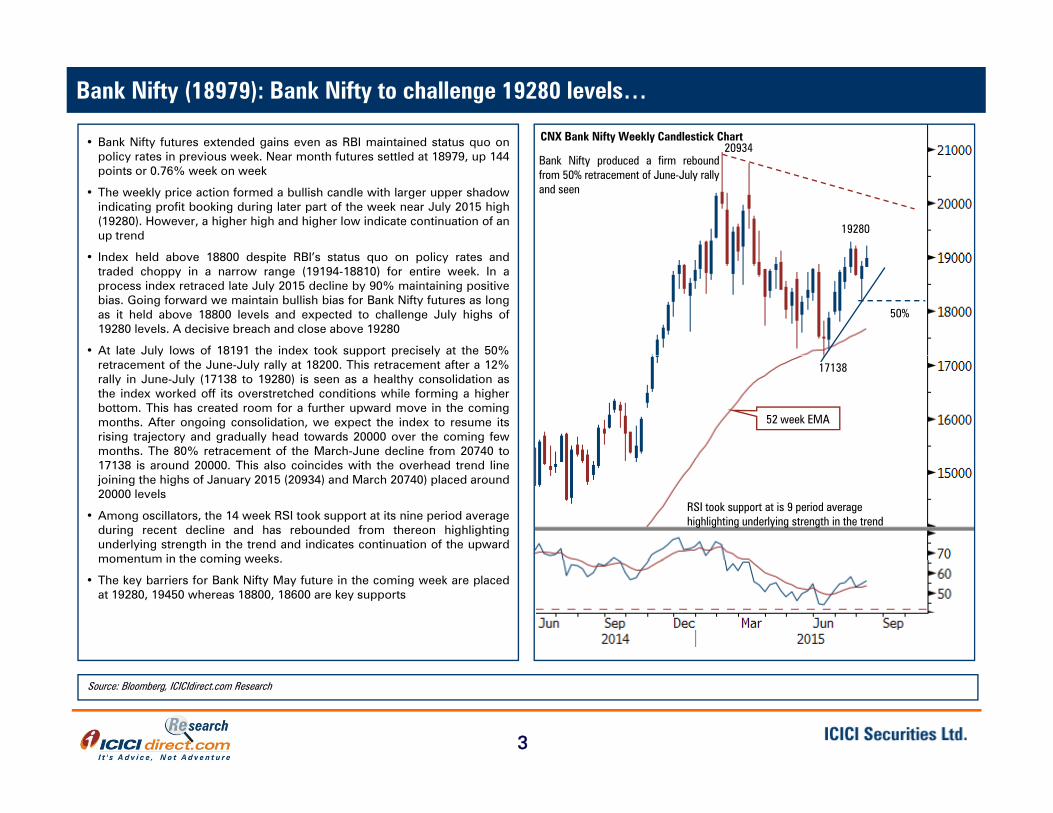
• Bank Nifty futures extended gains even as RBI maintained status quo on CNX Bank Nifty Weekly Candlestick Chart20934
policy rates in previous week. Near month futures settled at 18979, up 144points or 0.76% week on week
• The weekly price action formed a bullish candle with larger upper shadowindicating profit booking during later part of the week near July 2015 high(19280). However, a higher high and higher low indicate continuation of anup trend
I d h ld b 18800 d i RBI’ li d
Bank Nifty produced a firm reboundfrom 50% retracement of June-July rallyand seen
20934
19280
• Index held above 18800 despite RBI’s status quo on policy rates andtraded choppy in a narrow range (19194-18810) for entire week. In aprocess index retraced late July 2015 decline by 90% maintaining positivebias. Going forward we maintain bullish bias for Bank Nifty futures as longas it held above 18800 levels and expected to challenge July highs of19280 levels. A decisive breach and close above 19280
• At late July lows of 18191 the index took support precisely at the 50%
50%
y pp p yretracement of the June-July rally at 18200. This retracement after a 12%rally in June-July (17138 to 19280) is seen as a healthy consolidation asthe index worked off its overstretched conditions while forming a higherbottom. This has created room for a further upward move in the comingmonths. After ongoing consolidation, we expect the index to resume itsrising trajectory and gradually head towards 20000 over the coming fewmonths. The 80% retracement of the March-June decline from 20740 to
52 week EMA
17138
17138 is around 20000. This also coincides with the overhead trend linejoining the highs of January 2015 (20934) and March 20740) placed around20000 levels
• Among oscillators, the 14 week RSI took support at its nine period averageduring recent decline and has rebounded from thereon highlightingunderlying strength in the trend and indicates continuation of the upwardmomentum in the coming weeks
RSI took support at is 9 period average highlighting underlying strength in the trend
momentum in the coming weeks.
• The key barriers for Bank Nifty May future in the coming week are placedat 19280, 19450 whereas 18800, 18600 are key supports
3
Source: Bloomberg, ICICIdirect.com Research
Deal Team – At Your ServiceTrend Scanner
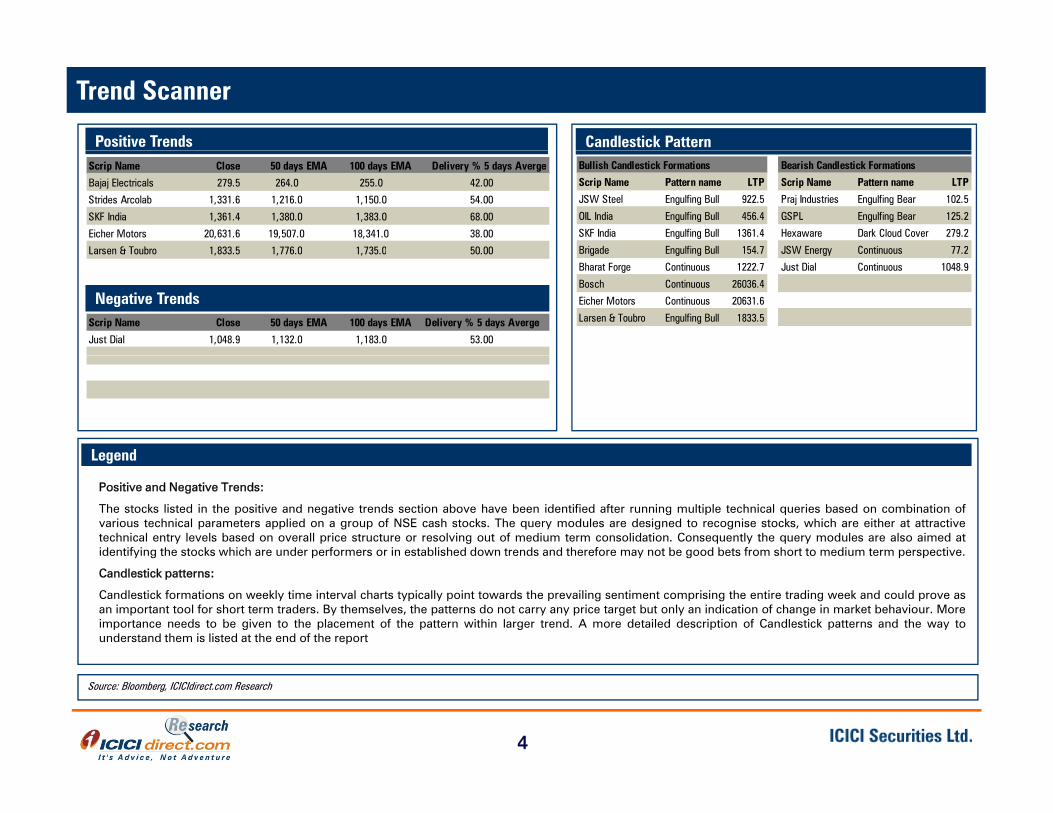
Positive Trends Candlestick PatternScrip Name Close 50 days EMA 100 days EMA Delivery % 5 days Averge
Bajaj Electricals 279.5 264.0 255.0 42.00
Strides Arcolab 1,331.6 1,216.0 1,150.0 54.00
SKF India 1,361.4 1,380.0 1,383.0 68.00
Eicher Motors 20,631.6 19,507.0 18,341.0 38.00
Larsen & Toubro 1 833 5 1 776 0 1 735 0 50 00
Bullish Candlestick Formations Bearish Candlestick Formations
Scrip Name Pattern name LTP Scrip Name Pattern name LTP
JSW Steel Engulfing Bull 922.5 Praj Industries Engulfing Bear 102.5
OIL India Engulfing Bull 456.4 GSPL Engulfing Bear 125.2
SKF India Engulfing Bull 1361.4 Hexaware Dark Cloud Cover 279.2
Brigade Engulfing Bull 154.7 JSW Energy Continuous 77.2
Negative Trends
Larsen & Toubro 1,833.5 1,776.0 1,735.0 50.00
Scrip Name Close 50 days EMA 100 days EMA Delivery % 5 days Averge
Just Dial 1,048.9 1,132.0 1,183.0 53.00
Brigade Engulfing Bull 154.7 JSW Energy Continuous 77.2
Bharat Forge Continuous 1222.7 Just Dial Continuous 1048.9
Bosch Continuous 26036.4
Eicher Motors Continuous 20631.6
Larsen & Toubro Engulfing Bull 1833.5
LegendLegend
Positive and Negative Trends:
The stocks listed in the positive and negative trends section above have been identified after running multiple technical queries based on combination ofvarious technical parameters applied on a group of NSE cash stocks. The query modules are designed to recognise stocks, which are either at attractivetechnical entry levels based on overall price structure or resolving out of medium term consolidation. Consequently the query modules are also aimed atidentifying the stocks which are under performers or in established down trends and therefore may not be good bets from short to medium term perspective.
Candlestick patterns:
Candlestick formations on weekly time interval charts typically point towards the prevailing sentiment comprising the entire trading week and could prove asan important tool for short term traders. By themselves, the patterns do not carry any price target but only an indication of change in market behaviour. Moreimportance needs to be given to the placement of the pattern within larger trend. A more detailed description of Candlestick patterns and the way tounderstand them is listed at the end of the report
4
Source: Bloomberg, ICICIdirect.com Research
Market Activity
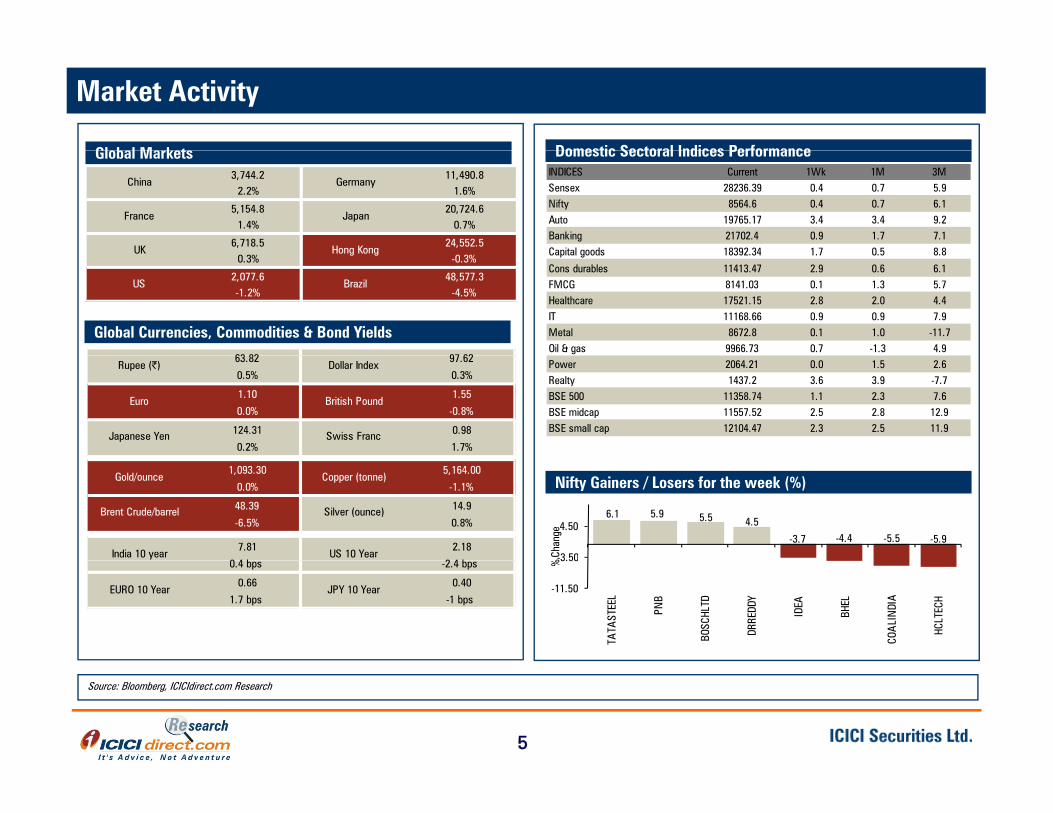
Gl b l M k ts Domestic Sectoral Indices PerformanceGlobal Markets Domestic Sectoral Indices Performance
20,724.6
Hong Kong
Japan
11,490.8
0.7%
1.6%Germany China
5,154.8
3,744.22.2%
France1.4%
UK 6,718.5 24,552.5
INDICES Current 1Wk 1M 3MSensex 28236.39 0.4 0.7 5.9Nifty 8564.6 0.4 0.7 6.1Auto 19765.17 3.4 3.4 9.2Banking 21702.4 0.9 1.7 7.1Capital goods 18392 34 1 7 0 5 8 8
Global Currencies, Commodities & Bond Yields
Hong Kong-0.3%
UK
US -1.2%
2,077.6
0.3%
Brazil -4.5%
48,577.3
Capital goods 18392.34 1.7 0.5 8.8
Cons durables 11413.47 2.9 0.6 6.1FMCG 8141.03 0.1 1.3 5.7Healthcare 17521.15 2.8 2.0 4.4IT 11168.66 0.9 0.9 7.9Metal 8672.8 0.1 1.0 -11.7Oil & gas 9966.73 0.7 -1.3 4.9
63 82 97 62 Power 2064.21 0.0 1.5 2.6Realty 1437.2 3.6 3.9 -7.7BSE 500 11358.74 1.1 2.3 7.6BSE midcap 11557.52 2.5 2.8 12.9BSE small cap 12104.47 2.3 2.5 11.9
Japanese Yen 124.31 Swiss Franc 0.98
0.2% 1.7%
Euro1.10
British Pound1.55
0.0% -0.8%
Rupee (|)63.82
Dollar Index97.62
0.5% 0.3%
Nifty Gainers / Losers for the week (%)
6.1 5.9 5.5 4.5
-3.7 -4.4 -5.5 -5.9
-3.50
4.50
% C
hang
e2.18
2 4 b India 10 year US 10 Year
7.81
0 4 b
Copper (tonne)5,164.00
0.0% -1.1%
Brent Crude/barrel 48.39
Gold/ounce1,093.30
Silver (ounce) 14.9
-6.5% 0.8%
-11.50
3.50
TATA
STEE
L
PNB
BOSC
HLTD
DRRE
DDY
IDEA
BHEL
COA
LIN
DIA
HCLT
ECH
%
0.40
-1 bps
-2.4 bps
EURO 10 Year JPY 10 Year
0.4 bps
0.66
1.7 bps
5
Source: Bloomberg, ICICIdirect.com Research
Deal Team – At Your ServiceMarket ActivityInstitutional flow trends of last 12 months
1
1677
880
4309
3940 92
44
42
28000
29000
30000
9000
14000
19000Series2 Series1 Series3
5103
-117
2
1375
3
2132
1291
9
1147
6
1207
8 1172
-576
8
-334
4
5319
1552
4172
5940 70
37
4177
1032
6 544
-441
25000
26000
27000
-6000
-1000
4000
9000
Weekly market breadth trends
250006000
Sep'
14
Oct'1
4
Nov
'14
Dec'
14
Jan'
15
Feb'
15
Mar
'15
Apr
'15
May
'15
June
'15
July
'15
Aug
'15
% % %% % %
26425 2731627812 28093 27661
28463 28112 28115 28236
26500
28000
29500
40%
60%
80%
cent
age
Advance % Decline % Sensex
44%
58% 53%
55%
54%
57% 51
%
54%
56%
56%
42% 47%
45%
46%
43% 49
%
46%
44%
23500
25000
0%
20%
12-Jun-15 19-Jun-15 26-Jun-15 3-Jul-15 10-Jul-15 17-Jul-15 24-Jul-15 31-Jul-15 7-Aug-15
Perc
Week Ended
66
Source: Bloomberg, ICICIdirect.com Research
Deal Team – At Your ServiceDow Jones (17373): A decisive breach of 17400 will indicate extended profit booking…
Dow Jones Industrials Weekly Bar Chart
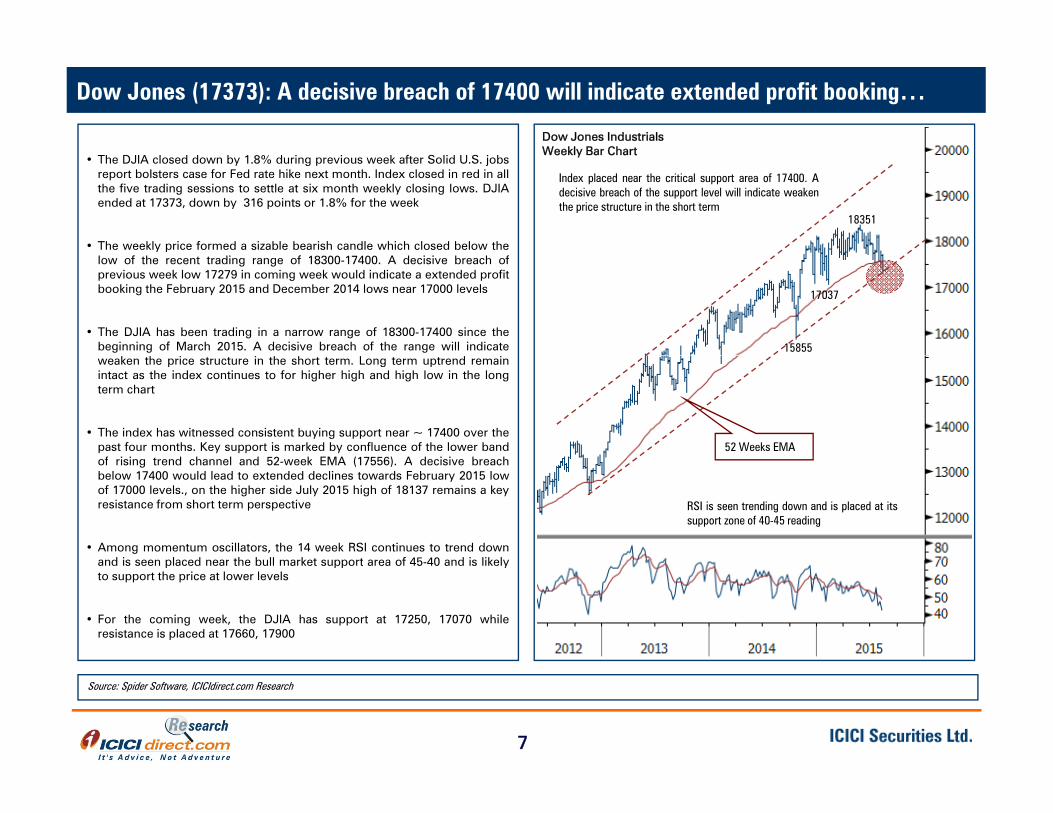
• The DJIA closed down by 1.8% during previous week after Solid U.S. jobsreport bolsters case for Fed rate hike next month. Index closed in red in allthe five trading sessions to settle at six month weekly closing lows. DJIAended at 17373, down by 316 points or 1.8% for the week
• The weekly price formed a sizable bearish candle which closed below the
Weekly Bar Chart
Index placed near the critical support area of 17400. Adecisive breach of the support level will indicate weakenthe price structure in the short term
18351
low of the recent trading range of 18300-17400. A decisive breach ofprevious week low 17279 in coming week would indicate a extended profitbooking the February 2015 and December 2014 lows near 17000 levels
• The DJIA has been trading in a narrow range of 18300-17400 since thebeginning of March 2015. A decisive breach of the range will indicate
17037
15855weaken the price structure in the short term. Long term uptrend remainintact as the index continues to for higher high and high low in the longterm chart
• The index has witnessed consistent buying support near ~ 17400 over thepast four months. Key support is marked by confluence of the lower band
f i i t d h l d 52 k EMA (17556) A d i i b h52 Weeks EMA
of rising trend channel and 52-week EMA (17556). A decisive breachbelow 17400 would lead to extended declines towards February 2015 lowof 17000 levels., on the higher side July 2015 high of 18137 remains a keyresistance from short term perspective
• Among momentum oscillators, the 14 week RSI continues to trend downand is seen placed near the bull market support area of 45 40 and is likely
RSI is seen trending down and is placed at itssupport zone of 40-45 reading
and is seen placed near the bull market support area of 45-40 and is likelyto support the price at lower levels
• For the coming week, the DJIA has support at 17250, 17070 whileresistance is placed at 17660, 17900
7
Source: Spider Software, ICICIdirect.com Research
Deal Team – At Your ServiGerman Dax (11490): Trend remain positive above 11050 mark…
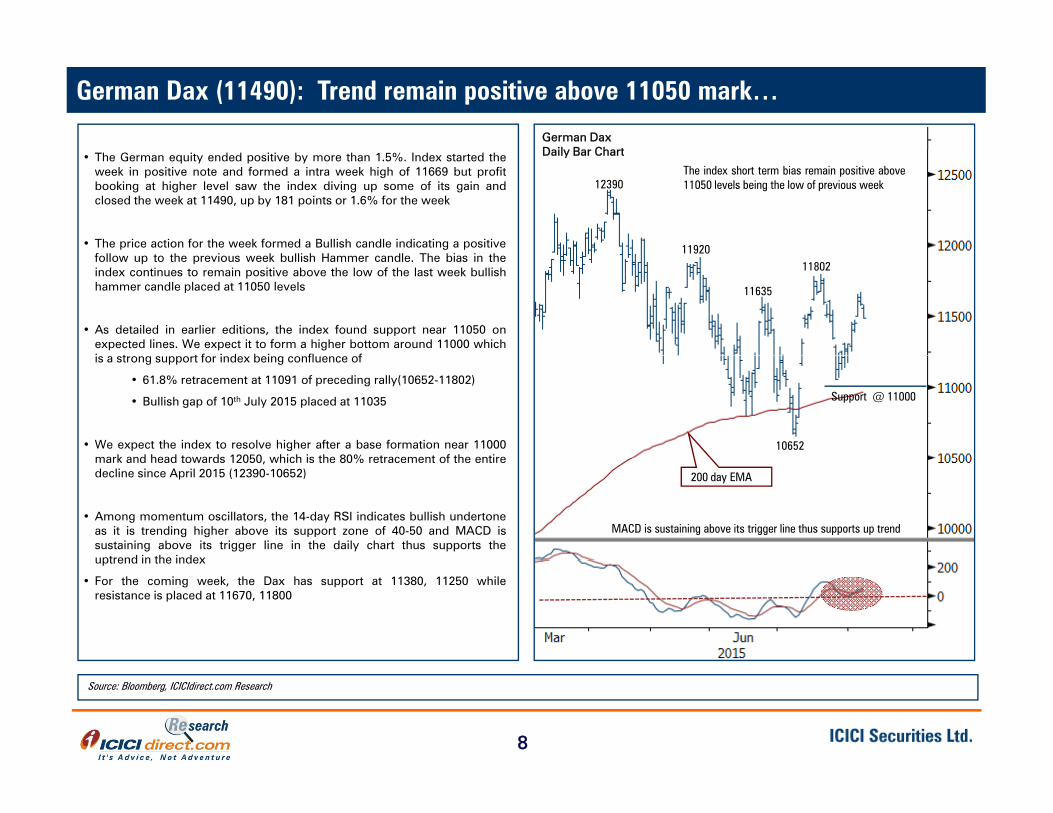
German DaxDaily Bar Chart• The German equity ended positive by more than 1.5%. Index started the
week in positive note and formed a intra week high of 11669 but profitbooking at higher level saw the index diving up some of its gain andclosed the week at 11490, up by 181 points or 1.6% for the week
• The price action for the week formed a Bullish candle indicating a positive
Daily Bar Chart
12390
11920
The index short term bias remain positive above11050 levels being the low of previous week
follow up to the previous week bullish Hammer candle. The bias in theindex continues to remain positive above the low of the last week bullishhammer candle placed at 11050 levels
• As detailed in earlier editions, the index found support near 11050 onexpected lines. We expect it to form a higher bottom around 11000 whichi t t f i d b i fl f
11920
11635
11802
is a strong support for index being confluence of
• 61.8% retracement at 11091 of preceding rally(10652-11802)
• Bullish gap of 10th July 2015 placed at 11035
• We expect the index to resolve higher after a base formation near 11000mark and head towards 12050 which is the 80% retracement of the entire
10652
Support @ 11000
mark and head towards 12050, which is the 80% retracement of the entiredecline since April 2015 (12390-10652)
• Among momentum oscillators, the 14-day RSI indicates bullish undertoneas it is trending higher above its support zone of 40-50 and MACD issustaining above its trigger line in the daily chart thus supports theuptrend in the index
MACD is sustaining above its trigger line thus supports up trend
200 day EMA
uptrend in the index
• For the coming week, the Dax has support at 11380, 11250 whileresistance is placed at 11670, 11800
8
Source: Bloomberg, ICICIdirect.com Research
Deal Team – At Your ServiceUS$-INR (63.81): Consolidation prolongs…
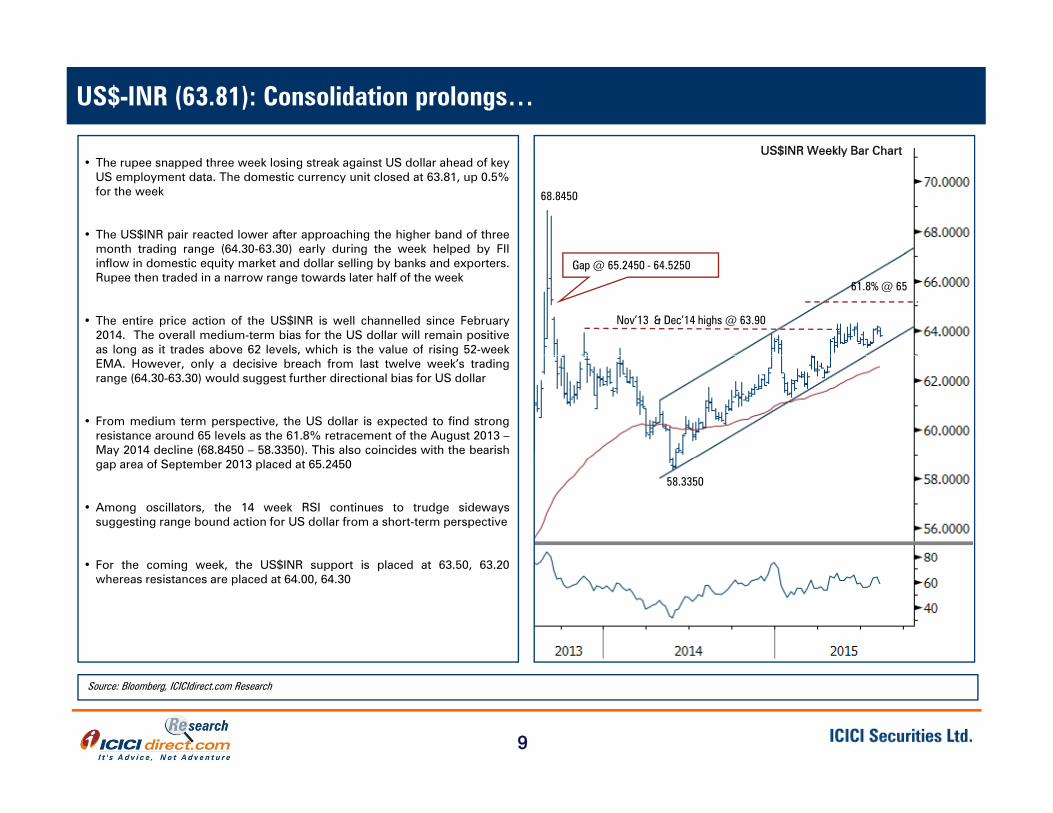
US$INR Weekly Bar Chart• The rupee snapped three week losing streak against US dollar ahead of key
US employment data. The domestic currency unit closed at 63.81, up 0.5%for the week
• The US$INR pair reacted lower after approaching the higher band of threemonth trading range (64.30-63.30) early during the week helped by FII
US$INR Weekly Bar Chart
68.8450
g g ( ) y g p yinflow in domestic equity market and dollar selling by banks and exporters.Rupee then traded in a narrow range towards later half of the week
• The entire price action of the US$INR is well channelled since February2014. The overall medium-term bias for the US dollar will remain positiveas long as it trades above 62 levels, which is the value of rising 52-week
Nov’13 & Dec’14 highs @ 63.90
Gap @ 65.2450 - 64.5250
61.8% @ 65
g gEMA. However, only a decisive breach from last twelve week’s tradingrange (64.30-63.30) would suggest further directional bias for US dollar
• From medium term perspective, the US dollar is expected to find strongresistance around 65 levels as the 61.8% retracement of the August 2013 –May 2014 decline (68.8450 – 58.3350). This also coincides with the bearishgap area of September 2013 placed at 65.2450
• Among oscillators, the 14 week RSI continues to trudge sidewayssuggesting range bound action for US dollar from a short-term perspective
F h i k h US$INR i l d 63 50 63 20
58.3350
• For the coming week, the US$INR support is placed at 63.50, 63.20whereas resistances are placed at 64.00, 64.30
9
Source: Bloomberg, ICICIdirect.com Research
Deal Team – At Your ServiceGold ($1088): Consolidation may continue amid negative bias…Weekly Bar Chart
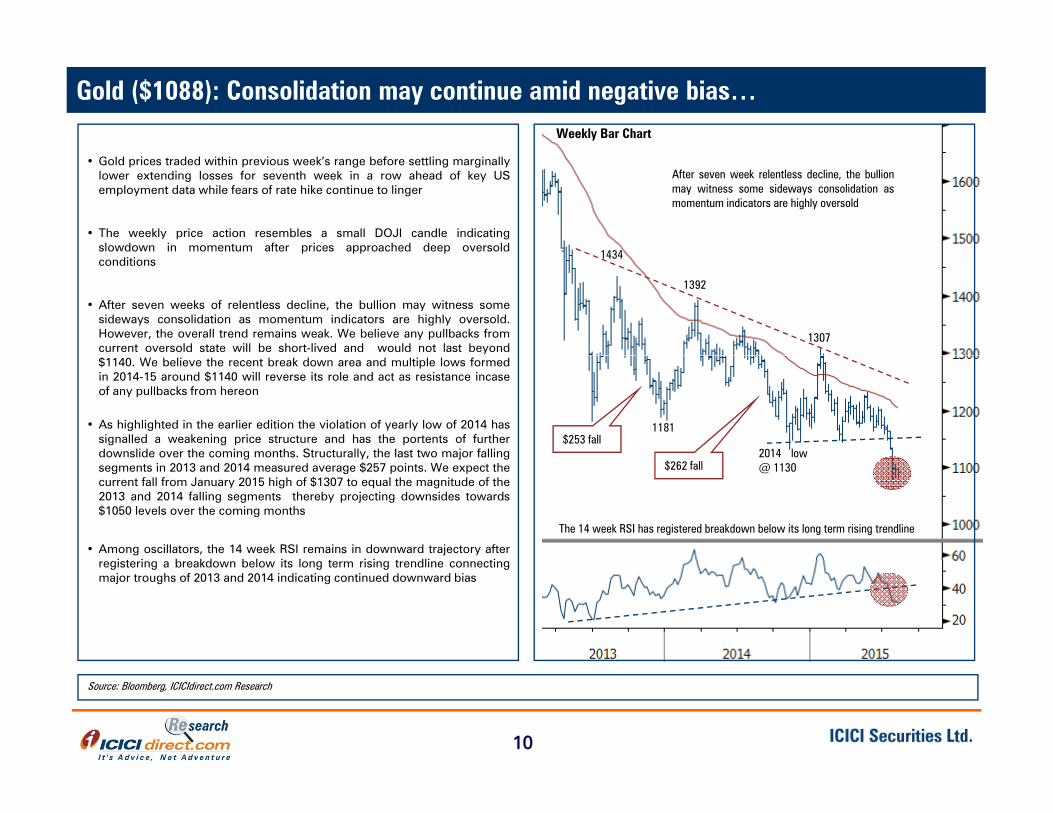
• Gold prices traded within previous week’s range before settling marginallylower extending losses for seventh week in a row ahead of key USemployment data while fears of rate hike continue to linger
• The weekly price action resembles a small DOJI candle indicatingslowdown in momentum after prices approached deep oversold
After seven week relentless decline, the bullionmay witness some sideways consolidation asmomentum indicators are highly oversold
1434p pp p
conditions
• After seven weeks of relentless decline, the bullion may witness somesideways consolidation as momentum indicators are highly oversold.However, the overall trend remains weak. We believe any pullbacks fromcurrent oversold state will be short-lived and would not last beyond
1434
1392
1307
$1140. We believe the recent break down area and multiple lows formedin 2014-15 around $1140 will reverse its role and act as resistance incaseof any pullbacks from hereon
• As highlighted in the earlier edition the violation of yearly low of 2014 hassignalled a weakening price structure and has the portents of furtherdownslide over the coming months. Structurally, the last two major falling 2014 low
1181$253 fall
g y, j gsegments in 2013 and 2014 measured average $257 points. We expect thecurrent fall from January 2015 high of $1307 to equal the magnitude of the2013 and 2014 falling segments thereby projecting downsides towards$1050 levels over the coming months
• Among oscillators, the 14 week RSI remains in downward trajectory afteri t i b kd b l it l t i i t dli ti
@ 1130
The 14 week RSI has registered breakdown below its long term rising trendline
$262 fall
registering a breakdown below its long term rising trendline connectingmajor troughs of 2013 and 2014 indicating continued downward bias
10
Source: Bloomberg, ICICIdirect.com Research
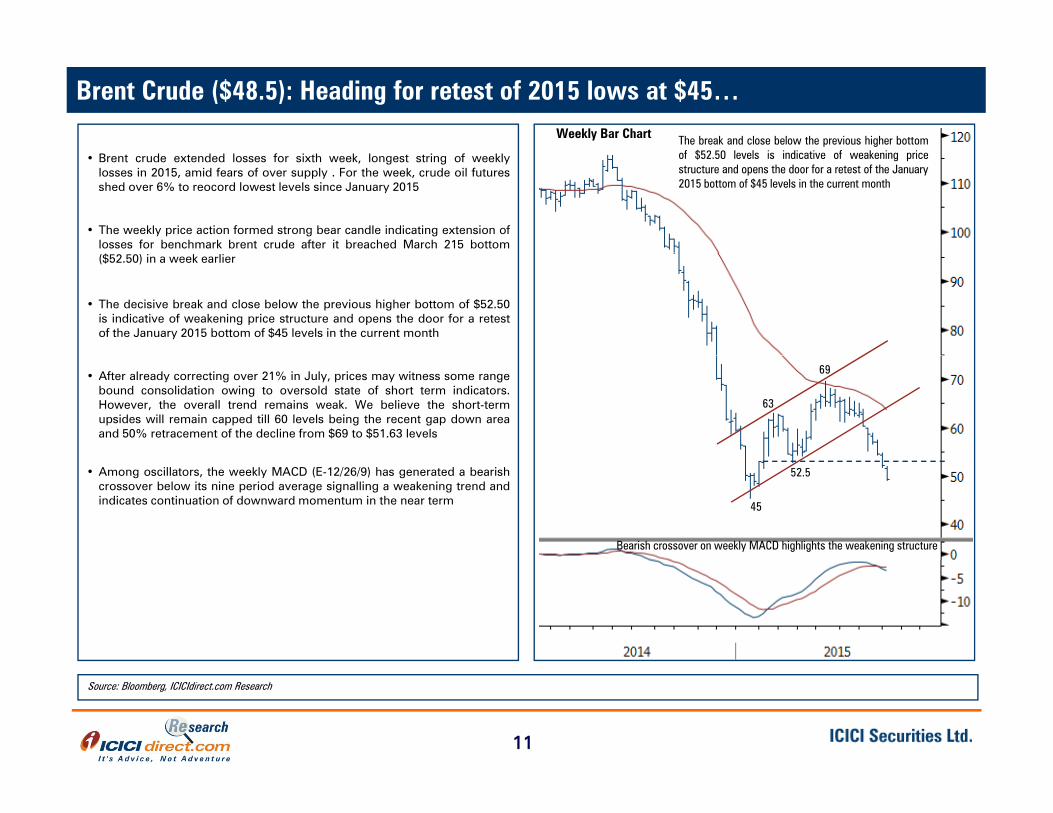
Deal Team – At Your ServiceBrent Crude ($48.5): Heading for retest of 2015 lows at $45…Weekly Bar Chart The break and close below the previous higher bottom
f $ 2 0 l l i i di i f k i i• Brent crude extended losses for sixth week, longest string of weeklylosses in 2015, amid fears of over supply . For the week, crude oil futuresshed over 6% to reocord lowest levels since January 2015
• The weekly price action formed strong bear candle indicating extension oflosses for benchmark brent crude after it breached March 215 bottom
of $52.50 levels is indicative of weakening pricestructure and opens the door for a retest of the January2015 bottom of $45 levels in the current month
($52.50) in a week earlier
• The decisive break and close below the previous higher bottom of $52.50is indicative of weakening price structure and opens the door for a retestof the January 2015 bottom of $45 levels in the current month
• After already correcting over 21% in July, prices may witness some rangebound consolidation owing to oversold state of short term indicators.However, the overall trend remains weak. We believe the short-termupsides will remain capped till 60 levels being the recent gap down areaand 50% retracement of the decline from $69 to $51.63 levels
63
69
• Among oscillators, the weekly MACD (E-12/26/9) has generated a bearishcrossover below its nine period average signalling a weakening trend andindicates continuation of downward momentum in the near term
52.5
Bearish crossover on weekly MACD highlights the weakening structure
45
11
Source: Bloomberg, ICICIdirect.com Research
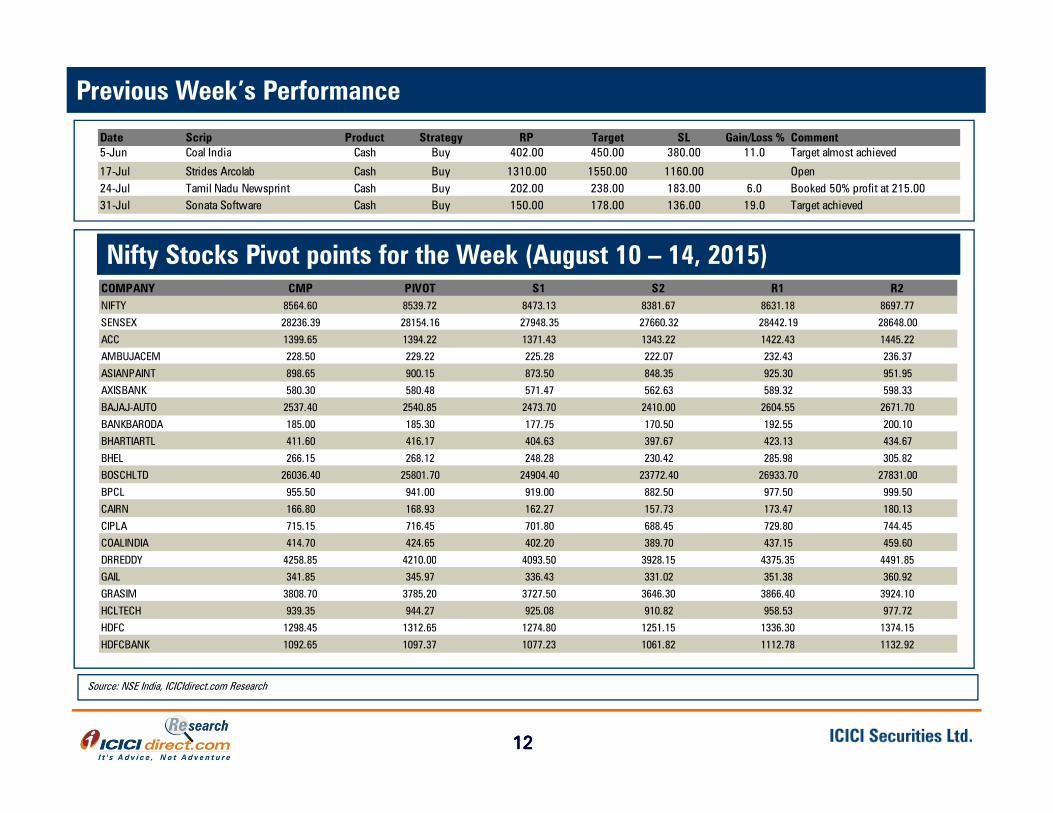
Deal Team – At Your ServicePrevious Week’s Performance
Date Scrip Product Strategy RP Target SL Gain/Loss % Comment5 Jun Coal India Cash Buy 402 00 450 00 380 00 11 0 Target almost achieved
Nifty Stocks Pivot points for the Week (August 10 14 2015)
5-Jun Coal India Cash Buy 402.00 450.00 380.00 11.0 Target almost achieved
17-Jul Strides Arcolab Cash Buy 1310.00 1550.00 1160.00 Open24-Jul Tamil Nadu Newsprint Cash Buy 202.00 238.00 183.00 6.0 Booked 50% profit at 215.0031-Jul Sonata Software Cash Buy 150.00 178.00 136.00 19.0 Target achieved
Nifty Stocks Pivot points for the Week (August 10 – 14, 2015)COMPANY CMP PIVOT S1 S2 R1 R2NIFTY 8564.60 8539.72 8473.13 8381.67 8631.18 8697.77
SENSEX 28236.39 28154.16 27948.35 27660.32 28442.19 28648.00
ACC 1399.65 1394.22 1371.43 1343.22 1422.43 1445.22
AMBUJACEM 228 50 229 22 225 28 222 07 232 43 236 37AMBUJACEM 228.50 229.22 225.28 222.07 232.43 236.37
ASIANPAINT 898.65 900.15 873.50 848.35 925.30 951.95
AXISBANK 580.30 580.48 571.47 562.63 589.32 598.33
BAJAJ-AUTO 2537.40 2540.85 2473.70 2410.00 2604.55 2671.70
BANKBARODA 185.00 185.30 177.75 170.50 192.55 200.10
BHARTIARTL 411.60 416.17 404.63 397.67 423.13 434.67
BHEL 266 15 268 12 248 28 230 42 285 98 305 82BHEL 266.15 268.12 248.28 230.42 285.98 305.82
BOSCHLTD 26036.40 25801.70 24904.40 23772.40 26933.70 27831.00
BPCL 955.50 941.00 919.00 882.50 977.50 999.50
CAIRN 166.80 168.93 162.27 157.73 173.47 180.13
CIPLA 715.15 716.45 701.80 688.45 729.80 744.45
COALINDIA 414.70 424.65 402.20 389.70 437.15 459.60
DRREDDY 4258 85 4210 00 4093 50 3928 15 4375 35 4491 85DRREDDY 4258.85 4210.00 4093.50 3928.15 4375.35 4491.85
GAIL 341.85 345.97 336.43 331.02 351.38 360.92
GRASIM 3808.70 3785.20 3727.50 3646.30 3866.40 3924.10
HCLTECH 939.35 944.27 925.08 910.82 958.53 977.72
HDFC 1298.45 1312.65 1274.80 1251.15 1336.30 1374.15
HDFCBANK 1092.65 1097.37 1077.23 1061.82 1112.78 1132.92
1212
Source: NSE India, ICICIdirect.com Research
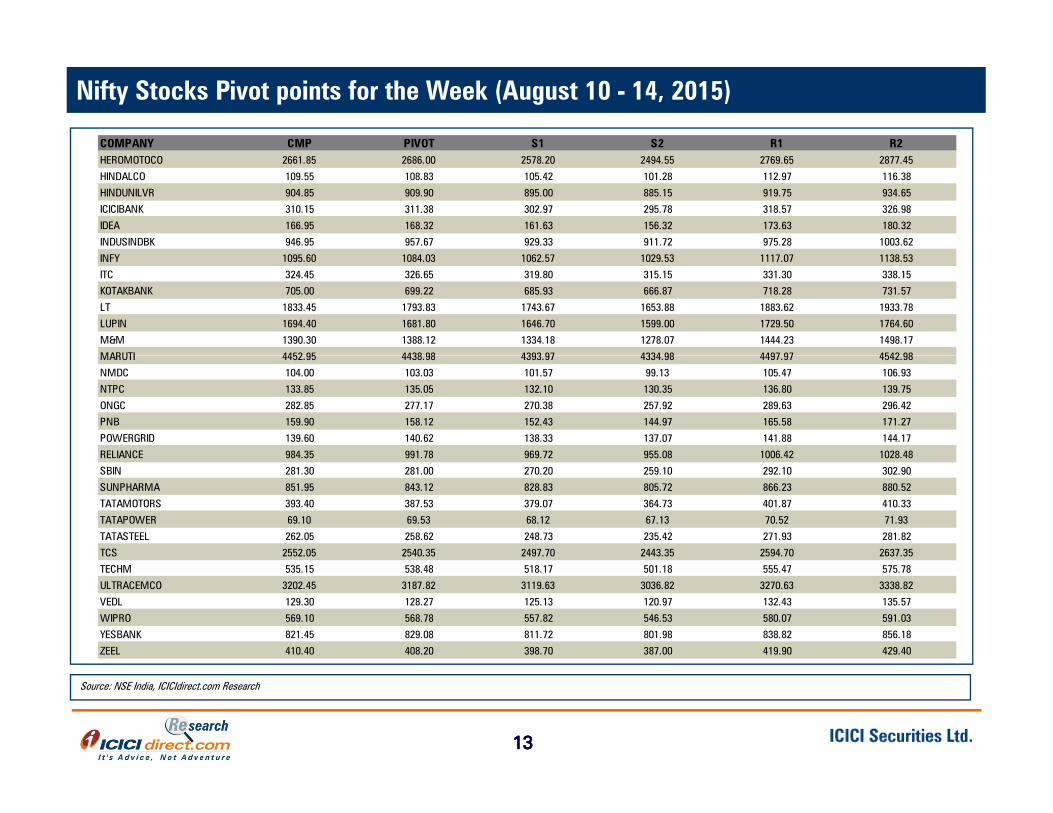
Nifty Stocks Pivot points for the Week (August 10 - 14, 2015)
COMPANY CMP PIVOT S1 S2 R1 R2HEROMOTOCO 2661.85 2686.00 2578.20 2494.55 2769.65 2877.45
HINDALCO 109.55 108.83 105.42 101.28 112.97 116.38
HINDUNILVR 904.85 909.90 895.00 885.15 919.75 934.65
ICICIBANK 310.15 311.38 302.97 295.78 318.57 326.98
IDEA 166.95 168.32 161.63 156.32 173.63 180.32
INDUSINDBK 946.95 957.67 929.33 911.72 975.28 1003.62
INFY 1095.60 1084.03 1062.57 1029.53 1117.07 1138.53
ITC 324.45 326.65 319.80 315.15 331.30 338.15
KOTAKBANK 705.00 699.22 685.93 666.87 718.28 731.57
LT 1833.45 1793.83 1743.67 1653.88 1883.62 1933.78
LUPIN 1694.40 1681.80 1646.70 1599.00 1729.50 1764.60
M&M 1390.30 1388.12 1334.18 1278.07 1444.23 1498.17
MARUTI 4452 95 4438 98 4393 97 4334 98 4497 97 4542 98MARUTI 4452.95 4438.98 4393.97 4334.98 4497.97 4542.98
NMDC 104.00 103.03 101.57 99.13 105.47 106.93
NTPC 133.85 135.05 132.10 130.35 136.80 139.75
ONGC 282.85 277.17 270.38 257.92 289.63 296.42
PNB 159.90 158.12 152.43 144.97 165.58 171.27
POWERGRID 139.60 140.62 138.33 137.07 141.88 144.17
RELIANCE 984.35 991.78 969.72 955.08 1006.42 1028.48RELIANCE 984.35 991.78 969.72 955.08 1006.42 1028.48
SBIN 281.30 281.00 270.20 259.10 292.10 302.90
SUNPHARMA 851.95 843.12 828.83 805.72 866.23 880.52
TATAMOTORS 393.40 387.53 379.07 364.73 401.87 410.33
TATAPOWER 69.10 69.53 68.12 67.13 70.52 71.93
TATASTEEL 262.05 258.62 248.73 235.42 271.93 281.82
TCS 2552.05 2540.35 2497.70 2443.35 2594.70 2637.35
TECHM 535.15 538.48 518.17 501.18 555.47 575.78
ULTRACEMCO 3202.45 3187.82 3119.63 3036.82 3270.63 3338.82
VEDL 129.30 128.27 125.13 120.97 132.43 135.57
WIPRO 569.10 568.78 557.82 546.53 580.07 591.03
YESBANK 821.45 829.08 811.72 801.98 838.82 856.18
ZEEL 410.40 408.20 398.70 387.00 419.90 429.40
1313
Source: NSE India, ICICIdirect.com Research
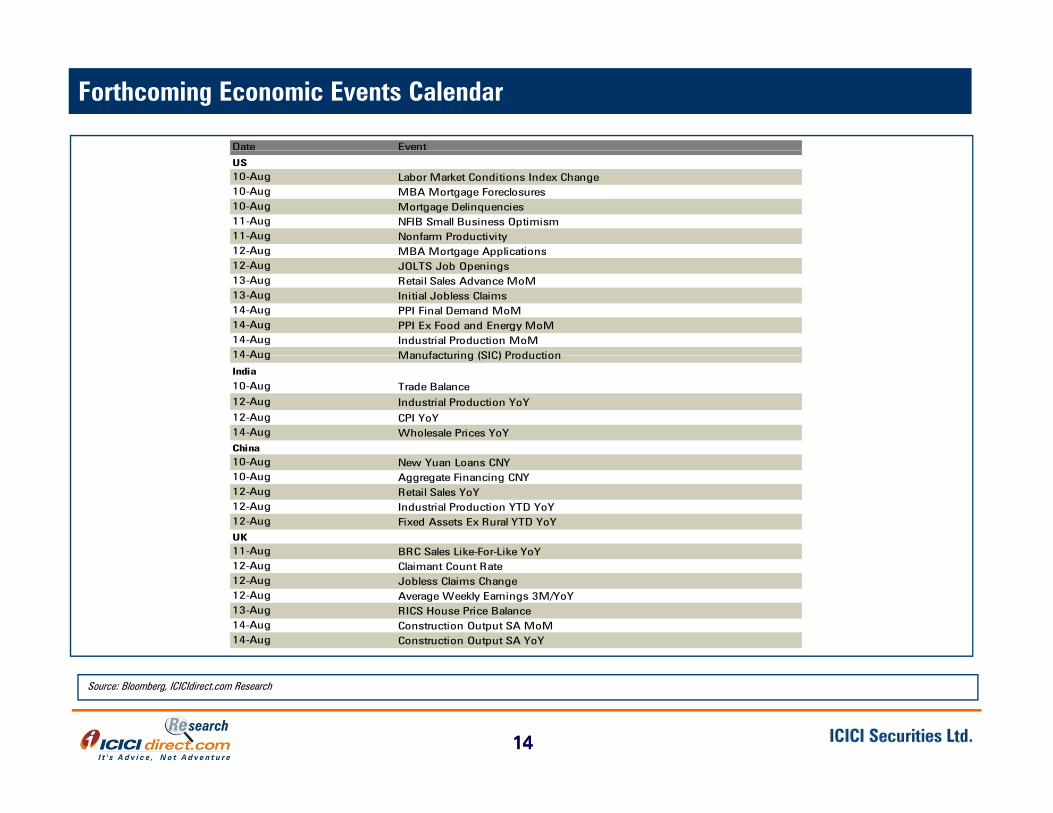
Deal Team – At Your ServiceForthcoming Economic Events Calendar
Date Event
US10-Aug Labor Market Conditions Index Change10-Aug MBA Mortgage Foreclosures10-Aug Mortgage Delinquencies11-Aug NFIB Small Business Optimism11-Aug Nonfarm Productivity12-Aug MBA Mortgage Applications12 Aug MBA Mortgage Applications12-Aug JOLTS Job Openings13-Aug Retail Sales Advance MoM13-Aug Initial Jobless Claims14-Aug PPI Final Demand MoM14-Aug PPI Ex Food and Energy MoM14-Aug Industrial Production MoM14-Aug Manufacturing (SIC) Production14-Aug Manufacturing (SIC) Production
India
10-Aug Trade Balance12-Aug Industrial Production YoY12-Aug CPI YoY14-Aug Wholesale Prices YoYChina10 A10-Aug New Yuan Loans CNY10-Aug Aggregate Financing CNY12-Aug Retail Sales YoY12-Aug Industrial Production YTD YoY12-Aug Fixed Assets Ex Rural YTD YoYUK11-Aug BRC Sales Like-For-Like YoY12-Aug Claimant Count Rate12-Aug Jobless Claims Change12-Aug Average Weekly Earnings 3M/YoY13-Aug RICS House Price Balance14-Aug Construction Output SA MoM14-Aug Construction Output SA YoY
1414
Source: Bloomberg, ICICIdirect.com Research
Deal Team – At Your ServiceNotes
Pl h d i i hi h ib d id d i h • Please execute the recommendation within the prescribed range provided in the report
• Once the recommendation is executed, it is advisable to keep strict stop loss as provided in the report on closing basis
• We adapt a trading strategy of booking 50% profit when the position is in profit by 3-5% and trail stoploss on remaining position to the entry point
• In recommendations where it is advised to buy on declines, if the target price is hit before activation of the call in prescribed range then the recommendation is considered not initiated
• The recommendations are valid only for the week and are to be squared off by the end of the week. In case we intend to carry forward the position, it will be communicated through separate mail
Trading Portfolio allocation
• It is recommended to spread out the trading corpus in a proportionate manner between the various technical research products
• Please avoid allocating the entire trading corpus to a single stock or a single product segment
Withi h d t t it i d i bl t ll t l t t h d ti• Within each product segment it is advisable to allocate equal amount to each recommendation
• For example: The ‘Daily Calls’ product carries 3 to 4 intraday recommendations. It is advisable to allocate equal amount to eachrecommendation
1515
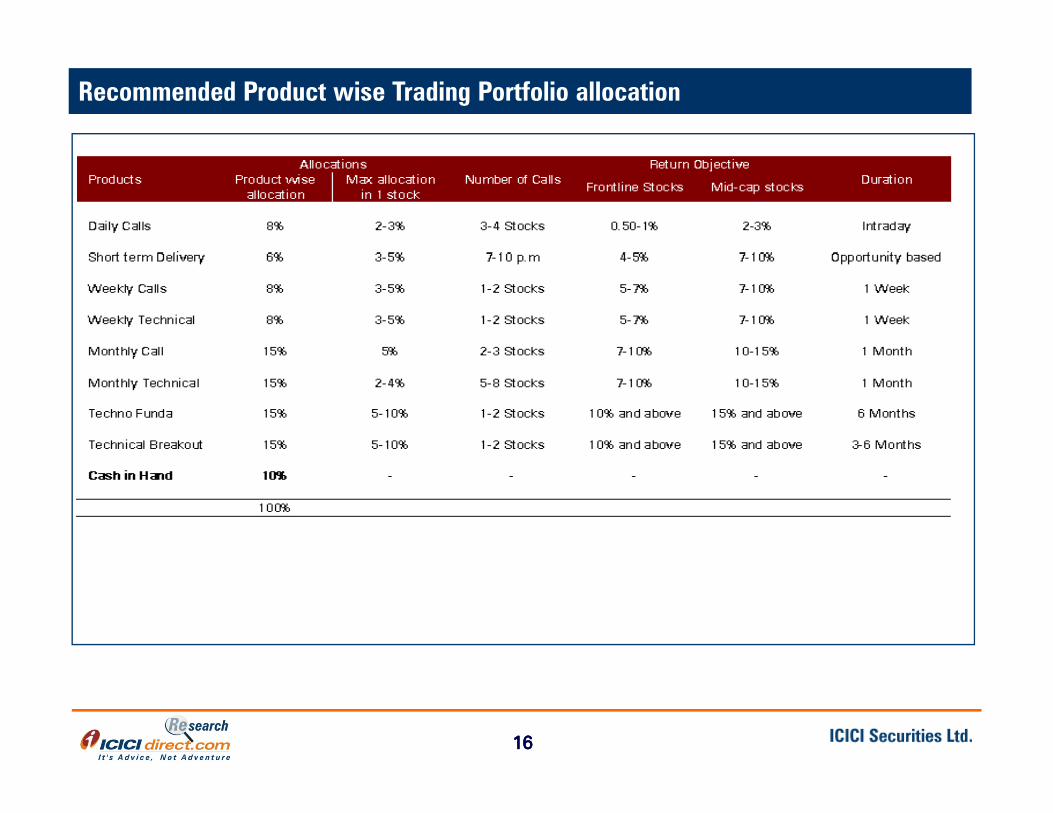
Deal Team – At Your ServiceRecommended Product wise Trading Portfolio allocation
1616
Deal Team – At Your ServiceCandlesticks Glossary:
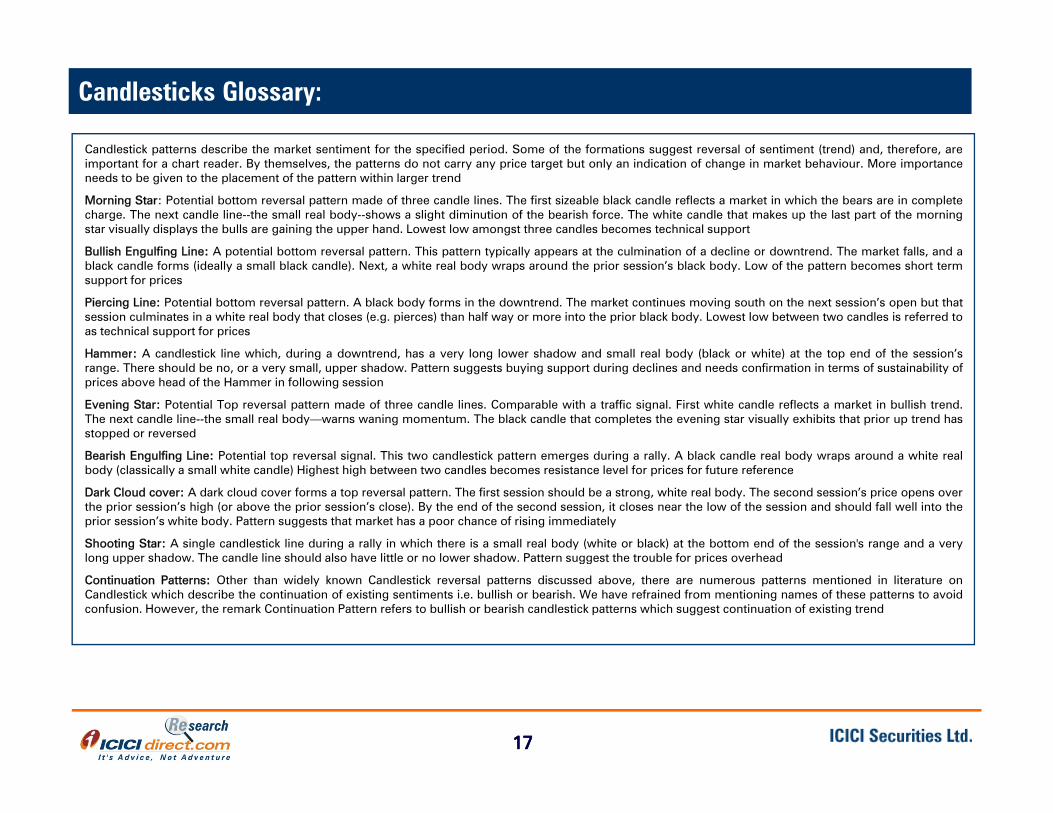
Candlestick patterns describe the market sentiment for the specified period Some of the formations suggest reversal of sentiment (trend) and therefore areCandlestick patterns describe the market sentiment for the specified period. Some of the formations suggest reversal of sentiment (trend) and, therefore, areimportant for a chart reader. By themselves, the patterns do not carry any price target but only an indication of change in market behaviour. More importanceneeds to be given to the placement of the pattern within larger trend
Morning Star: Potential bottom reversal pattern made of three candle lines. The first sizeable black candle reflects a market in which the bears are in completecharge. The next candle line--the small real body--shows a slight diminution of the bearish force. The white candle that makes up the last part of the morningstar visually displays the bulls are gaining the upper hand. Lowest low amongst three candles becomes technical support
Bullish Engulfing Line: A potential bottom reversal pattern This pattern typically appears at the culmination of a decline or downtrend The market falls and aBullish Engulfing Line: A potential bottom reversal pattern. This pattern typically appears at the culmination of a decline or downtrend. The market falls, and ablack candle forms (ideally a small black candle). Next, a white real body wraps around the prior session’s black body. Low of the pattern becomes short termsupport for prices
Piercing Line: Potential bottom reversal pattern. A black body forms in the downtrend. The market continues moving south on the next session’s open but thatsession culminates in a white real body that closes (e.g. pierces) than half way or more into the prior black body. Lowest low between two candles is referred toas technical support for prices
Hammer: A candlestick line which during a downtrend has a very long lower shadow and small real body (black or white) at the top end of the session’sHammer: A candlestick line which, during a downtrend, has a very long lower shadow and small real body (black or white) at the top end of the session srange. There should be no, or a very small, upper shadow. Pattern suggests buying support during declines and needs confirmation in terms of sustainability ofprices above head of the Hammer in following session
Evening Star: Potential Top reversal pattern made of three candle lines. Comparable with a traffic signal. First white candle reflects a market in bullish trend.The next candle line--the small real body—warns waning momentum. The black candle that completes the evening star visually exhibits that prior up trend hasstopped or reversed
Bearish Engulfing Line: Potential top reversal signal This two candlestick pattern emerges during a rally A black candle real body wraps around a white realBearish Engulfing Line: Potential top reversal signal. This two candlestick pattern emerges during a rally. A black candle real body wraps around a white realbody (classically a small white candle) Highest high between two candles becomes resistance level for prices for future reference
Dark Cloud cover: A dark cloud cover forms a top reversal pattern. The first session should be a strong, white real body. The second session’s price opens overthe prior session’s high (or above the prior session’s close). By the end of the second session, it closes near the low of the session and should fall well into theprior session’s white body. Pattern suggests that market has a poor chance of rising immediately
Shooting Star: A single candlestick line during a rally in which there is a small real body (white or black) at the bottom end of the session's range and a verylong upper shadow. The candle line should also have little or no lower shadow. Pattern suggest the trouble for prices overheadlong upper shadow. The candle line should also have little or no lower shadow. Pattern suggest the trouble for prices overhead
Continuation Patterns: Other than widely known Candlestick reversal patterns discussed above, there are numerous patterns mentioned in literature onCandlestick which describe the continuation of existing sentiments i.e. bullish or bearish. We have refrained from mentioning names of these patterns to avoidconfusion. However, the remark Continuation Pattern refers to bullish or bearish candlestick patterns which suggest continuation of existing trend
1717
Pankaj Pandey Head – Research [email protected]
ICICIdirect.com Research Desk,ICICI Securities Limited,1st Floor, Akruti Trade Centre,Road No 7, MIDCAndheri (East)Andheri (East)Mumbai – 400 [email protected]
DisclaimerANALYST CERTIFICATION
We /I Dharmesh Shah Dipesh Dagha Nitin Kunte Pabitro Mukherjee Vinayak Parmar Research Analysts authors and the names subscribed to We /I, Dharmesh Shah, Dipesh Dagha, Nitin Kunte, Pabitro Mukherjee, Vinayak Parmar Research Analysts, authors and the names subscribed to this report, hereby certify that all of the views expressed in this research report accurately reflect our views about the subject issuer(s) or securities. We also certify that no part of our compensation was, is, or will be directly or indirectly related to the specific recommendation(s) or view(s) in this report. Terms & conditions and other disclosures:ICICI Securities Limited (ICICI Securities) is a SEBI registered Research Analyst having registration no. INH000000990. ICICI Securities Limited (ICICI Securities) is a full-service, integrated investment banking and is, inter alia, engaged in the business of stock brokering and distribution of financial products. ICICI Securities is a wholly-owned subsidiary of ICICI Bank which is India’s largest private sector bank and has its various subsidiaries engaged in businesses of housing finance, asset management, life insurance, general insurance, venture capital fund management, etc. (“associates”), the details in respect of which are available on www.icicibank.com.ICICI Securities is one of the leading merchant bankers/ underwriters of securities and participate in virtually all securities trading markets in India. We and our associates might have investment banking and other business relationship with a significant percentage of companies covered by our Investment Research Department. ICICI Securities generally prohibits its analysts, persons reporting to analysts and their relatives from maintaining a financial interest in the securities or derivatives of any companies that the analysts covermaintaining a financial interest in the securities or derivatives of any companies that the analysts cover.The information and opinions in this report have been prepared by ICICI Securities and are subject to change without any notice. The report and information contained herein is strictly confidential and meant solely for the selected recipient and may not be altered in any way, transmitted to, copied or distributed, in part or in whole, to any other person or to the media or reproduced in any form, without prior written consent of ICICI Securities. While we would endeavour to update the information herein on a reasonable basis, ICICI Securities is under no obligation to update or keep the information current. Also, there may be regulatory, compliance or other reasons that may prevent ICICI Securities from doing so. Non-rated securities indicate that rating on a particular security has been suspended temporarily and such suspension is in compliance with applicable g p y p p y p p ppregulations and/or ICICI Securities policies, in circumstances where ICICI Securities might be acting in an advisory capacity to this company, or in certain other circumstances .This report is based on information obtained from public sources and sources believed to be reliable, but no independent verification has been made nor is its accuracy or completeness guaranteed. This report and information herein is solely for informational purpose and shall not be used or considered as an offer document or solicitation of offer to buy or sell or subscribe for securities or other financial instruments. Though disseminated to all the customers simultaneously, not all customers may receive this report at the same time. ICICI Securities will not treat
i i t t b i t f th i i i thi t N thi i thi t tit t i t t l l ti d t d i recipients as customers by virtue of their receiving this report. Nothing in this report constitutes investment, legal, accounting and tax advice or arepresentation that any investment or strategy is suitable or appropriate to your specific circumstances. The securities discussed and opinions expressed in this report may not be suitable for all investors, who must make their own investment decisions, based on their own investment objectives, financial positions and needs of specific recipient. This may not be taken in substitution for the exercise of independent judgment by any recipient. The recipient should independently evaluate the investment risks. The value and return on investment may vary because of changes in interest rates, foreign exchange rates or any other reason.
DisclaimerICICI Securities accepts no liabilities whatsoever for any loss or damage of any kind arising out of the use of this report. Past performance is not
il id t f t f I t d i d t Ri k Di l D t t d t d th i k i t d b f necessarily a guide to future performance. Investors are advised to see Risk Disclosure Document to understand the risks associated before investing in the securities markets. Actual results may differ materially from those set forth in projections. Forward-looking statements are not predictions and may be subject to change without notice.ICICI Securities or its associates might have managed or co-managed public offering of securities for the subject company or might have been mandated by the subject company for any other assignment in the past twelve months. ICICI Securities or its associates might have received any compensation from the companies mentioned in the report during the period preceding twelve months from the date of this report for services in respect of managing or co-managing public offerings, corporate finance, investment twelve months from the date of this report for services in respect of managing or co managing public offerings, corporate finance, investment banking or merchant banking, brokerage services or other advisory service in a merger or specific transaction. ICICI Securities or its associates might have received any compensation for products or services other than investment banking or merchant banking or brokerage services from the companies mentioned in the report in the past twelve months.ICICI Securities encourages independence in research report preparation and strives to minimize conflict in preparation of research report. ICICI Securities or its analysts did not receive any compensation or other benefits from the companies mentioned in the report or third party in connection with preparation of the research report. Accordingly, neither ICICI Securities nor Research Analysts have any material conflict of i h i f bli i f hi interest at the time of publication of this report.It is confirmed that Dharmesh Shah, Dipesh Dagha, Nitin Kunte, Pabitro Mukherjee, Vinayak Parmar Research Analysts of this report have not received any compensation from the companies mentioned in the report in the preceding twelve months. Compensation of our Research Analysts is not based on any specific merchant banking, investment banking or brokerage service transactions. ICICI Securities or its subsidiaries collectively or Research Analysts do not own 1% or more of the equity securities of the Company mentioned in the report as of the last day of the month preceding the publication of the research report. Since associates of ICICI Securities are engaged in various financial service businesses they might have financial interests or beneficial ownership Since associates of ICICI Securities are engaged in various financial service businesses, they might have financial interests or beneficial ownership in various companies including the subject company/companies mentioned in this report.