Embed Size (px)
Citation preview

1
Weekly national Influenza and COVID-19 surveillance report Week 47 report (up to week 46 data) 19 November 2020
Weekly National Influenza & COVID-19 Report: week 47 report (up to week 46 data)
2
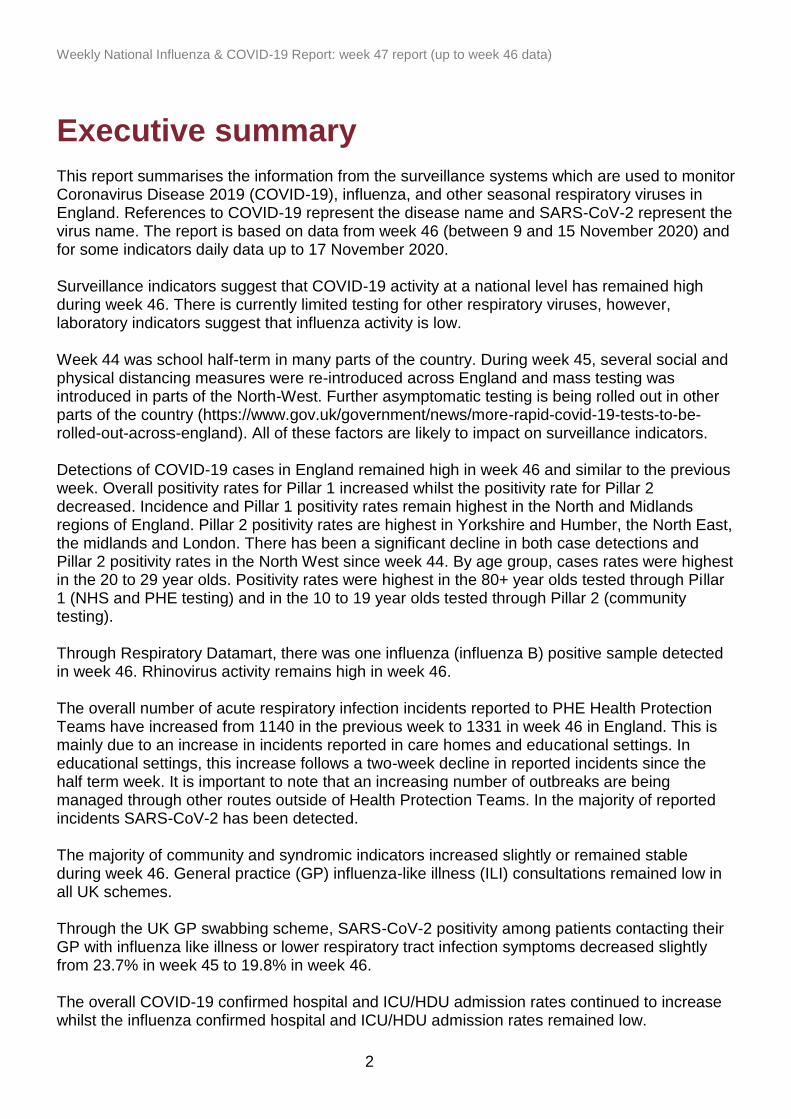
Executive summary
This report summarises the information from the surveillance systems which are used to monitor Coronavirus Disease 2019 (COVID-19), influenza, and other seasonal respiratory viruses in England. References to COVID-19 represent the disease name and SARS-CoV-2 represent the virus name. The report is based on data from week 46 (between 9 and 15 November 2020) and for some indicators daily data up to 17 November 2020. Surveillance indicators suggest that COVID-19 activity at a national level has remained high during week 46. There is currently limited testing for other respiratory viruses, however, laboratory indicators suggest that influenza activity is low. Week 44 was school half-term in many parts of the country. During week 45, several social and physical distancing measures were re-introduced across England and mass testing was introduced in parts of the North-West. Further asymptomatic testing is being rolled out in other parts of the country (https://www.gov.uk/government/news/more-rapid-covid-19-tests-to-be-rolled-out-across-england). All of these factors are likely to impact on surveillance indicators. Detections of COVID-19 cases in England remained high in week 46 and similar to the previous week. Overall positivity rates for Pillar 1 increased whilst the positivity rate for Pillar 2 decreased. Incidence and Pillar 1 positivity rates remain highest in the North and Midlands regions of England. Pillar 2 positivity rates are highest in Yorkshire and Humber, the North East, the midlands and London. There has been a significant decline in both case detections and Pillar 2 positivity rates in the North West since week 44. By age group, cases rates were highest in the 20 to 29 year olds. Positivity rates were highest in the 80+ year olds tested through Pillar 1 (NHS and PHE testing) and in the 10 to 19 year olds tested through Pillar 2 (community testing). Through Respiratory Datamart, there was one influenza (influenza B) positive sample detected in week 46. Rhinovirus activity remains high in week 46. The overall number of acute respiratory infection incidents reported to PHE Health Protection Teams have increased from 1140 in the previous week to 1331 in week 46 in England. This is mainly due to an increase in incidents reported in care homes and educational settings. In educational settings, this increase follows a two-week decline in reported incidents since the half term week. It is important to note that an increasing number of outbreaks are being managed through other routes outside of Health Protection Teams. In the majority of reported incidents SARS-CoV-2 has been detected. The majority of community and syndromic indicators increased slightly or remained stable during week 46. General practice (GP) influenza-like illness (ILI) consultations remained low in all UK schemes. Through the UK GP swabbing scheme, SARS-CoV-2 positivity among patients contacting their GP with influenza like illness or lower respiratory tract infection symptoms decreased slightly from 23.7% in week 45 to 19.8% in week 46. The overall COVID-19 confirmed hospital and ICU/HDU admission rates continued to increase whilst the influenza confirmed hospital and ICU/HDU admission rates remained low.

Weekly National Influenza & COVID-19 Report: week 47 report (up to week 46 data)
3
Emergency department attendances for COVID-19 like diagnosis have increased further in week 46 whilst those for acute respiratory infections remained stable. The number of COVID-19 confirmed deaths decreased compared to the previous week, however more deaths are expected to be registered for week 46. Overall excess all-cause mortality was observed in week 45; by age group in the 75 to 84 year olds and subnationally in the North West, Yorkshire and Humber and the West Midlands. Overall estimated national seroprevalence based on blood donor samples was 5.7% with the highest seroprevalence by region seen in London and by age group in young adults. Influenza vaccine uptake is the highest it has ever been at this point in the season for those aged 65+ and in 2 and 3 year olds. For those in at-risk groups uptake is higher than last season and comparable to seasons before that. For pregnant women uptake is lower than in previous seasons. Weekly vaccine coverage data are provisional. The weekly 2020/21 pregnant women and at-risk denominators are undergoing validation checks and so reported coverage in these groups may be under estimated.

Weekly National Influenza & COVID-19 Report: week 47 report (up to week 46 data)
4
Contents
Executive summary ...................................................................................................................... 2
Contents ....................................................................................................................................... 2
Laboratory surveillance ................................................................................................................ 6
Confirmed COVID-19 cases (England) ..................................................................................... 6
Respiratory DataMart system (England) ................................................................................. 17
Community surveillance ............................................................................................................. 19
Acute respiratory infection incidents ....................................................................................... 19
COVID-19 cases by type of residence .................................................................................... 26
Medical Officers of Schools Association (MOSA) & PHE surveillance scheme ...................... 27
FluSurvey ............................................................................................................................... 28
Google search queries ........................................................................................................... 29
NHS 111 ................................................................................................................................. 30
Primary care surveillance ........................................................................................................... 34
RCGP (England)..................................................................................................................... 34
UK .......................................................................................................................................... 36
GP In Hours, Syndromic Surveillance .................................................................................... 37
GP Out of Hours, Syndromic Surveillance .............................................................................. 39
Sentinel swabbing scheme in the UK ..................................................................................... 41
Secondary care surveillance ...................................................................................................... 42
SARI Watch ............................................................................................................................ 42
Hospitalisations, SARI Watch ................................................................................................. 43
ICU/HDU admissions, SARI Watch ........................................................................................ 47
ECMO, SARI Watch ............................................................................................................... 51
Emergency Department attendances, Syndromic surveillance .............................................. 52
Mortality surveillance ................................................................................................................. 54
Cumulative COVID-19 deaths ................................................................................................ 54
Daily excess all-cause mortality (England) ............................................................................. 59
Microbiological surveillance ....................................................................................................... 62
Virus characterisation ............................................................................................................. 62

Weekly National Influenza & COVID-19 Report: week 47 report (up to week 46 data)
5
Antiviral susceptibility ............................................................................................................. 62
Antimicrobial susceptibility ...................................................................................................... 63
COVID-19 sero-prevalence surveillance .................................................................................... 64
Influenza vaccination ................................................................................................................. 68
Influenza vaccine uptake in GP patients ................................................................................. 68
Influenza vaccine uptake in school age children .................................................................... 70
Influenza vaccine uptake in healthcare workers ..................................................................... 70
International update ................................................................................................................... 71
Global COVID-19 update ........................................................................................................ 71
Global influenza update .......................................................................................................... 73
Other respiratory viruses ........................................................................................................ 75
Related links .............................................................................................................................. 76

Weekly National Influenza & COVID-19 Report: week 47 report (up to week 46 data)
6
Laboratory surveillance
Confirmed COVID-19 cases (England)
As of 09:00 on 17 November 2020, a total of 1,211,951 have been confirmed positive for
COVID-19 in England under Pillars 1 and 2.
Overall case numbers remained high in week 46. Overall positivity Pillar 1 increased
whilst the positivity in Pillar 2 decreased. The decrease noted in Pillar 2 is likely to be
due to the mass testing pilot in the North West. The highest case rates were seen in the
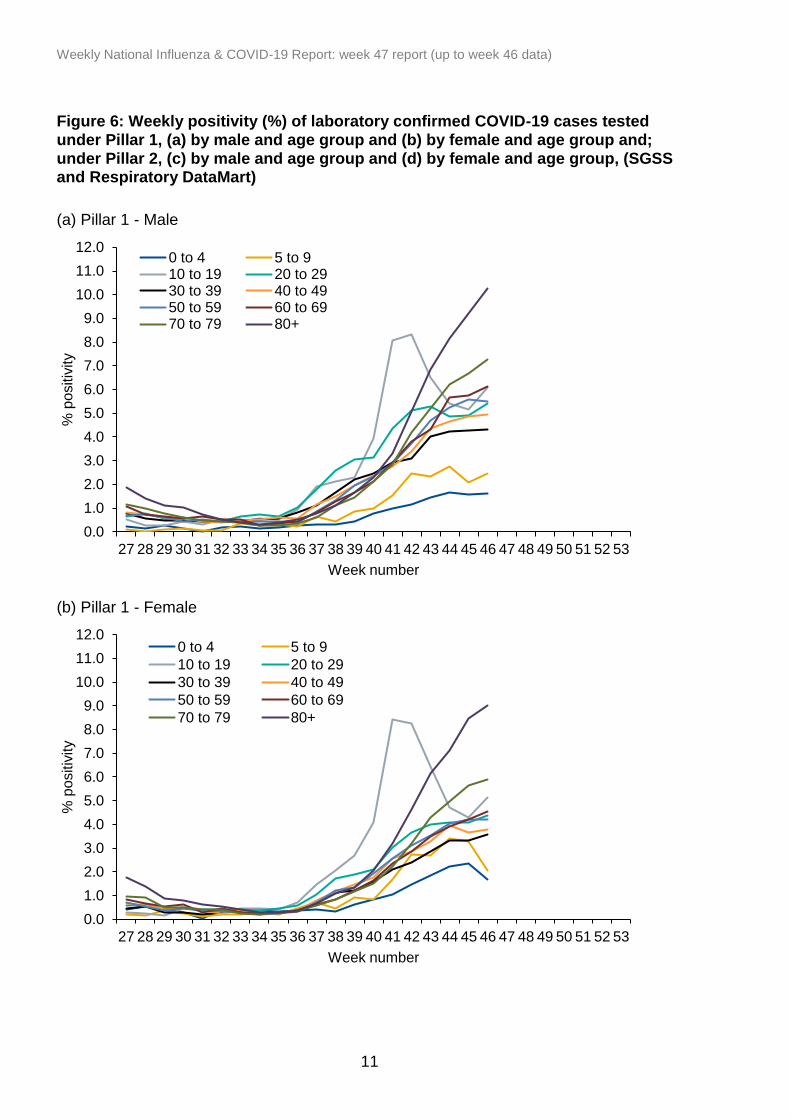
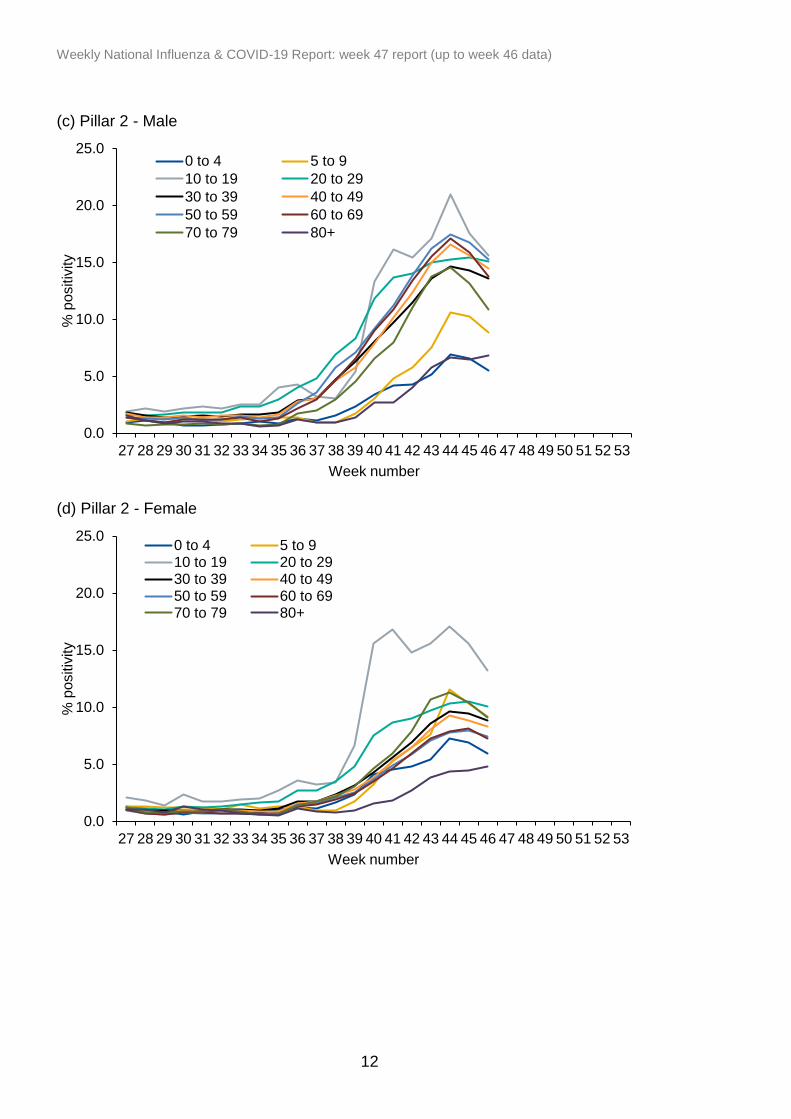
20 to 29 year olds in Pillars 1 and 2. The highest positivity rates were noted in the 80+
year olds in Pillar 1 and in the 10 to 19 year olds in Pillar 2. Cases rates were highest in
the North East.
From the week 42 report onwards, case rates in Figures 3,4,7 and 9 have been
calculated using mid-2019 ONS population estimates.
Figure 1: Laboratory confirmed COVID-19 cases tested under Pillar 1 and Pillar 2, based on sample week with overall weekly positivity for Pillars 1 and 2 (%)
*The data are shown by the week the specimen was taken from the person being tested.
This gives the most accurate analysis of this time progression, however, for the most
recent week results for more samples are expected therefore this should be interpreted
with caution.
0.0
2.0
4.0
6.0
8.0
10.0
12.0
14.0
16.0
18.0
20.0
0
20000
40000
60000
80000
100000
120000
140000
160000
27 28 29 30 31 32 33 34 35 36 37 38 39 40 41 42 43 44 45 46 47 48 49 50 51 52 53
Po
sit
ivit
y (
%)
Nu
mb
er
of
cas
es
Sample week
Pillar 2 cases
Pillar 1 cases
Pillar 1 - positivity %
Pillar 2 - positivity %

Weekly National Influenza & COVID-19 Report: week 47 report (up to week 46 data)
7
*Positivity data was previously deduplicated across the course of the pandemic to
prevent persistent infections being counted as new cases. Since week 40, positivity is
calculated as the number of individuals testing positive during the week divided by the
number of individuals tested during the week. This approach accounts for the increasing
number of individuals who will have been tested multiple times as the pandemic
progresses.
* As of 16 November 2020, the methodology for allocating geographies for cases has
been updated to include alternate postcodes where applicable. This change has been
applied for cases reported since 1 September 2020. Cases reported prior to 1
September 2020 will not be allocated alternate postcode geographies.

Weekly National Influenza & COVID-19 Report: week 47 report (up to week 46 data)
8
Age and sex
Figure 2: Age/sex pyramids for laboratory confirmed COVID-19 cases tested under Pillars 1 and 2 (a) cumulative number since week 27 (n=954,730), and (b) in weeks 45 and 46 (n=289,714)
(a)
(b)
150,000 100,000 50,000 0 50,000 100,000 150,000
<5y
5-9y
10-19y
20-29y
30-39y
40-49y
50-59y
60-69y
70-79y
80+ y
No. of cases
Ag
e g
rou
p
Male Female
35,000 25,000 15,000 5,000 5,000 15,000 25,000 35,000
<5y
5-9y
10-19y
20-29y
30-39y
40-49y
50-59y
60-69y
70-79y
80+ y
No. of cases
Ag
e g
rou
p
Male Female

Weekly National Influenza & COVID-19 Report: week 47 report (up to week 46 data)
9
Figure 3: Weekly laboratory confirmed COVID-19 case rates per 100,000, tested under Pillar 1 and Pillar 2, by sex
Figure 4: Weekly laboratory confirmed COVID-19 case rates per 100,000, tested under Pillar 1 and Pillar 2, by age group
0.0
50.0
100.0
150.0
200.0
250.0
300.0
27 28 29 30 31 32 33 34 35 36 37 38 39 40 41 42 43 44 45 46 47 48 49 50 51 52 53
Ca
se r
ate
per
100
,00
0
Week number
Male Female
0.0
20.0
40.0
60.0
80.0
100.0
120.0
140.0
160.0
180.0
200.0
220.0
240.0
260.0
280.0
300.0
320.0
340.0
360.0
380.0
400.0
27 28 29 30 31 32 33 34 35 36 37 38 39 40 41 42 43 44 45 46 47 48 49 50 51 52 53
Ca
se r
ate
per
100
,00
0
Week number
0 to 4 5 to 910 to 19 20 to 2930 to 39 40 to 4950 to 59 60 to 6970 to 79 80+

Weekly National Influenza & COVID-19 Report: week 47 report (up to week 46 data)
10
Figure 5: Weekly positivity (%) of laboratory confirmed COVID-19 cases tested overall and by sex under (a) Pillar 1 and (b) Pillar 2, (SGSS and Respiratory DataMart)
(a)
(b)
0.0
1.0
2.0
3.0
4.0
5.0
6.0
7.0
8.0
9.0
10.0
27 28 29 30 31 32 33 34 35 36 37 38 39 40 41 42 43 44 45 46 47 48 49 50 51 52 53
Po
sitiv
ity (
%)
Week number
Male Female All
0.0
5.0
10.0
15.0
20.0
27 28 29 30 31 32 33 34 35 36 37 38 39 40 41 42 43 44 45 46 47 48 49 50 51 52 53
Po
sitiv
ity (
%)
Week number
Male Female All
Weekly National Influenza & COVID-19 Report: week 47 report (up to week 46 data)
11
Figure 6: Weekly positivity (%) of laboratory confirmed COVID-19 cases tested under Pillar 1, (a) by male and age group and (b) by female and age group and; under Pillar 2, (c) by male and age group and (d) by female and age group, (SGSS and Respiratory DataMart)
(a) Pillar 1 - Male
(b) Pillar 1 - Female
0.0
1.0
2.0
3.0
4.0
5.0
6.0
7.0
8.0
9.0
10.0
11.0
12.0
27 28 29 30 31 32 33 34 35 36 37 38 39 40 41 42 43 44 45 46 47 48 49 50 51 52 53
% p
ositiv
ity
Week number
0 to 4 5 to 910 to 19 20 to 2930 to 39 40 to 4950 to 59 60 to 6970 to 79 80+
0.0
1.0
2.0
3.0
4.0
5.0
6.0
7.0
8.0
9.0
10.0
11.0
12.0
27 28 29 30 31 32 33 34 35 36 37 38 39 40 41 42 43 44 45 46 47 48 49 50 51 52 53
% p
ositiv
ity
Week number
0 to 4 5 to 9
10 to 19 20 to 29
30 to 39 40 to 49
50 to 59 60 to 69
70 to 79 80+
Weekly National Influenza & COVID-19 Report: week 47 report (up to week 46 data)
12
(c) Pillar 2 - Male
(d) Pillar 2 - Female
0.0
5.0
10.0
15.0
20.0
25.0
27 28 29 30 31 32 33 34 35 36 37 38 39 40 41 42 43 44 45 46 47 48 49 50 51 52 53
% p
ositiv
ity
Week number
0 to 4 5 to 9
10 to 19 20 to 29
30 to 39 40 to 49
50 to 59 60 to 69
70 to 79 80+
0.0
5.0
10.0
15.0
20.0
25.0
27 28 29 30 31 32 33 34 35 36 37 38 39 40 41 42 43 44 45 46 47 48 49 50 51 52 53
% p
ositiv
ity
Week number
0 to 4 5 to 910 to 19 20 to 2930 to 39 40 to 4950 to 59 60 to 6970 to 79 80+

Weekly National Influenza & COVID-19 Report: week 47 report (up to week 46 data)
13
Geography
Table 1: Cumulative number of cases under Pillars 1 and 2 (n=1,194,485) and cumulative number of cases since week 27 under Pillar 1 and 2 (n=959,508)
PHE Centres Cumulative Pillar 1
+ 2 cases
Cumulative since week 27, Pillar 1 +
2 cases
North East 87,617 72,577
North West 280,264 238,006
Yorkshire and Humber 188,254 159,559
West Midlands 137,701 112,549
East Midlands 118,635 97,994
East of England 74,625 50,498
London 133,789 100,141
South East 106,153 73,426
South West 67,447 54,758
Figure 7: Weekly laboratory confirmed COVID-19 case rates per 100,000 population (Pillar 1 and Pillar 2), by PHE Centres and sample week
0.0
50.0
100.0
150.0
200.0
250.0
300.0
350.0
400.0
450.0
500.0
27 28 29 30 31 32 33 34 35 36 37 38 39 40 41 42 43 44 45 46 47 48 49 50 51 52 53
Ra
tes p
er
100
,00
0 p
op
ula
tion
Week number
East Midlands
East of England
London
North East
North West
South East
South West
West Midlands
Yorkshire and Humber

Weekly National Influenza & COVID-19 Report: week 47 report (up to week 46 data)
14
Figure 8: Weekly positivity of laboratory confirmed COVID-19 cases tested under (a) Pillar 1 (%) and (b) Pillar 2 (%), by PHE Centres and sample week, (SGSS and Respiratory DataMart)
(a)
(b)
0.0
1.0
2.0
3.0
4.0
5.0
6.0
7.0
8.0
9.0
10.0
11.0
12.0
13.0
14.0
15.0
27 28 29 30 31 32 33 34 35 36 37 38 39 40 41 42 43 44 45 46 47 48 49 50 51 52 53
% p
ositiv
ity
Week number
East MidlandsEast of EnglandLondonNorth EastNorth WestSouth EastSouth WestWest MidlandsYorkshire and the Humber
0.0
5.0
10.0
15.0
20.0
25.0
27 28 29 30 31 32 33 34 35 36 37 38 39 40 41 42 43 44 45 46 47 48 49 50 51 52 53
% p
ositiv
ity
Week number
East Midlands
East of England
London
North East
North West
South East
South West
West Midlands
Yorkshire and the Humber

Weekly National Influenza & COVID-19 Report: week 47 report (up to week 46 data)
15
Figure 9: Weekly rate of COVID-19 cases per 100,000 population (Pillar 1 and 2), by upper-tier local authority, England (box shows enlarged map of London area)

Weekly National Influenza & COVID-19 Report: week 47 report (up to week 46 data)
16
Ethnicity
Figure 10: Weekly incidence per 100,000 population by ethnicity, England
*the incidence rates on Figure 10 have been calculated using the mid-2018 ONS
population estimates
0.0
100.0
200.0
300.0
400.0
500.0
600.0
700.0
27 28 29 30 31 32 33 34 35 36 37 38 39 40 41 42 43 44 45 46 47 48 49 50 51 52 53
Incid
en
ce r
ate
per
100
,00
0 p
op
ula
tion
Week number
White
Indian (Asian or Asian British)
Black / African / Caribbean / BlackBritishPakistani (Asian or Asian British)
Other Asian / Asian British
Mixed / Multiple ethnic groups
Other ethnic group

Weekly National Influenza & COVID-19 Report: week 47 report (up to week 46 data)
17
Respiratory DataMart system (England)
The Respiratory Datamart system was initiated during the 2009 influenza pandemic to
collate all laboratory testing information in England. It is now used as a sentinel
laboratory surveillance tool, monitoring all major respiratory viruses in England.16
laboratories in England will be reporting data for this season. As this is based on a
sample of labs - SARS-CoV-2 positivity figures quoted here will differ from those quoted
in the Confirmed COVID-19 cases section, however, they are included to facilitate
comparison with data on other respiratory viruses.
In week 46 2020, out of the 103,817 respiratory specimens reported through the
Respiratory DataMart System (based on data received from 16 out of 16 laboratories),
5,514 samples were positive for SARS-CoV-2 with an overall positivity of 5.5%. The
highest positivity was noted in the 65+ year olds at 7.3% in week 46. The overall
influenza positivity was low at 0.1% in week 46, with one sample (1 influenza B) testing
positive for influenza (out of 864 tested) (Figure 11).
Rhinovirus positivity increased slightly at 15.7% in week 46 compared to 14.4% in the
previous week (Figure 12). The highest positivity by age group for rhinovirus was noted
in the less than 5 year olds in week 46 (Figure 13). Respiratory syncytial virus (RSV),
adenovirus, parainfluenza and human metapneumovirus (hMPV) positivity all remained
low at 0.0%, 1.5%, 0.2% and 0.4% respectively in week 46 (Figure 12).
Figure 11: DataMart samples positive for influenza and weekly positivity (%) for influenza and SARS-CoV-2, England
0
10
20
30
40
50
0.0
1.0
2.0
3.0
4.0
5.0
6.0
7.0
8.0
9.0
10.0
27 31 35 39 43 47 51 2 6 10 14 18 22 26
Nu
mb
er
of p
ositiv
e s
pecim
ens
Pro
prt
ion p
ositiv
e (
%)
Week number
Influenza A (n)
Influenza B (n)
Influenza (%)
SARS-CoV-2 (%)

Weekly National Influenza & COVID-19 Report: week 47 report (up to week 46 data)
18
Figure 12: DataMart weekly positivity (%) for other respiratory viruses, England
Figure 13: DataMart weekly positivity (%) for rhinovirus by age, England
0.0
5.0
10.0
15.0
20.0
25.0
27 31 35 39 43 47 51 2 6 10 14 18 22 26
Pro
po
rtio
n p
ositiv
e (
%)
Week number
RSV
Rhinovirus
Parainfluenza
hMPV
Adenovirus
0.0
10.0
20.0
30.0
40.0
50.0
60.0
70.0
27 31 35 39 43 47 51 2 6 10 14 18 22 26
Pro
po
rtio
n p
ositiv
e (
%)
Week number
0 to 4 years
5 to 14 years
15 to 44 years
45 to 64 years
65+ years

Weekly National Influenza & COVID-19 Report: week 47 report (up to week 46 data)
19
Community surveillance
Acute respiratory infection incidents
Information on acute respiratory infection (ARI) incidents is based on situations reported
to PHE Health Protection Teams (HPTs). These include:
• confirmed outbreaks of acute respiratory infections ie two or more laboratory
confirmed cases (SARS-CoV-2, influenza or other respiratory pathogens) linked to a
particular setting
• setting situations where an outbreak is suspected
All suspected outbreaks are further investigated by the HPT in liaison with local partners
and a significant proportion do not meet the criteria of a confirmed outbreak. For
example if suspected cases test negative for COVID19 or other respiratory pathogens,
or cases are subsequently found not to have direct links to the setting. Since Pillar 2
testing became open to everyone during week 21 more incidents of mild disease have
been detected in settings with healthy young populations.
Processes for reporting ARI incidents vary between PHE Centres.
The situations captured on HPZone represent a subset of all ongoing clusters and outbreaks in England rather than an exhaustive listing. A variety of arrangements are in place with local authorities and other stakeholders supporting HPTs, however data are not routinely documented on HPZone. As a result, the number of outbreaks reported for some of the regions are underestimates.
The denominator (the overall number of settings in each category) will differ by the
setting category, for example there are fewer hospitals than workplaces, as will the
propensity to report incidents to PHE. Therefore these data are more useful for
monitoring trends over time than making comparisons across setting categories.
The number of incidents in each setting with at least one laboratory confirmed case of
COVID19 are reported below. A national school helpline started operating on 17
September 2020 and a Universities helpline started operating on 7 October. This is likely
to have had an impact on the number of situations/outbreaks being reported to HPTs in
these settings
1411 new ARI incidents have been reported in week 46 in the UK (Figure 14):
• 511 incidents were from care homes where 386 had at least one linked case that
tested positive for SARS-CoV-2

Weekly National Influenza & COVID-19 Report: week 47 report (up to week 46 data)
20
• 95 incidents were from hospitals where 78 had at least one linked case that tested
positive for SARS-CoV-2
• 339 incidents were from educational settings where 261 had at least one linked case
that tested positive for SARS-CoV-2
• 7 incidents were from prisons where all had at least one linked case that tested
positive for SARS-CoV-2
• 233 incidents were from workplace settings where 156 had at least one linked case
that tested positive for SARS-CoV-2
• 14 incidents were from food outlet/restaurant settings where 10 had at least one
linked case that tested positive for SARS-CoV-2
• 212 incidents were from the other settings category where 142 had at least one linked
case that tested positive for SARS-CoV-2
Figure 14: Number of acute respiratory infection (ARI) incidents by institution, UK
*excludes data from Wales
0
100
200
300
400
500
600
700
800
900
1000
1100
1200
1300
1400
1500
27 29 31 33 35 37 39 41 43 45 47 49 51 1 3 5 7 9 11 13 15 17 19 21 23 25
Nu
mb
er
of
AR
I in
cid
en
ts
Date of report week
Care home Hospital
Educational settings Prison
Workplace settings Food outlet/restaurant
Other

Weekly National Influenza & COVID-19 Report: week 47 report (up to week 46 data)
21
Figure 15: Number of acute respiratory infection (ARI) incidents by institution, England
Figure 16: Number of acute respiratory infection (ARI) incidents in care homes by virus type from week 27, England
0
100
200
300
400
500
600
700
800
900
1000
1100
1200
1300
1400
27 29 31 33 35 37 39 41 43 45 47 49 51 1 3 5 7 9 11 13 15 17 19 21 23 25
Nu
mb
er
of
AR
I in
cid
en
ts
Date of report week
Care home Hospital
Educational settings Prison
Workplace settings Food outlet/restaurant
Other
0
100
200
300
400
500
27 29 31 33 35 37 39 41 43 45 47 49 51 53 2 4 6 8 10 12 14 16 18 20 22 24 26
Nu
mb
er
of
AR
I in
cid
en
ts
Date of report week
Care home
Influenza A
Influenza B
SARS-CoV-2
Rhinovirus
RSV
Other respiratory viruses
No organism reported

Weekly National Influenza & COVID-19 Report: week 47 report (up to week 46 data)
22
Figure 17: Number of acute respiratory infection (ARI) incidents in hospitals by virus type from week 27, England
Figure 18: Number of acute respiratory infection (ARI) incidents in educational settings by virus type from week 27, England
0
25
50
75
100
27 29 31 33 35 37 39 41 43 45 47 49 51 53 2 4 6 8 10 12 14 16 18 20 22 24 26
Nu
mb
er
of
AR
I in
cid
en
ts
Date of report week
Hospital
Influenza A
Influenza B
SARS-CoV-2
Rhinovirus
RSV
Other respiratory viruses
No organism reported
0
100
200
300
400
500
27 29 31 33 35 37 39 41 43 45 47 49 51 53 2 4 6 8 10 12 14 16 18 20 22 24 26
Nu
mb
er
of
AR
I in
cid
en
ts
Date of report week
Educational settings
Influenza A
Influenza B
SARS-CoV-2
Rhinovirus
RSV
Other respiratory viruses
No organism reported

Weekly National Influenza & COVID-19 Report: week 47 report (up to week 46 data)
23
Figure 19: Number of acute respiratory infection (ARI) incidents in prisons by virus type from week 27, England
Figure 20: Number of acute respiratory infection (ARI) incidents in workplace settings by virus type from week 27, England
0
5
10
15
20
27 29 31 33 35 37 39 41 43 45 47 49 51 53 2 4 6 8 10 12 14 16 18 20 22 24 26
Nu
mb
er
of
AR
I in
cid
en
ts
Date of report week
Prisons
Influenza A
Influenza B
SARS-CoV-2
Rhinovirus
RSV
Other respiratory viruses
No organism reported
0
50
100
150
200
250
300
350
400
27 29 31 33 35 37 39 41 43 45 47 49 51 53 2 4 6 8 10 12 14 16 18 20 22 24 26
Nu
mb
er
of
AR
I in
cid
en
ts
Date of report week
Workplace settings
Influenza A
Influenza B
SARS-CoV-2
Rhinovirus
RSV
Other respiratory viruses
No organism reported

Weekly National Influenza & COVID-19 Report: week 47 report (up to week 46 data)
24
Figure 21: Number of acute respiratory infection (ARI) incidents in food outlet/restaurants settings by virus type from week 27, England
Figure 22: Number of acute respiratory infection (ARI) incidents in other settings settings by virus type from week 27, England
0
25
50
75
100
27 29 31 33 35 37 39 41 43 45 47 49 51 53 2 4 6 8 10 12 14 16 18 20 22 24 26
Nu
mb
er
of
AR
I in
cid
en
ts
Date of report week
Food outlet/restaurants
Influenza A
Influenza B
SARS-CoV-2
Rhinovirus
RSV
Other respiratory viruses
No organism reported
0
50
100
150
200
250
300
27 29 31 33 35 37 39 41 43 45 47 49 51 53 2 4 6 8 10 12 14 16 18 20 22 24 26
Nu
mb
er
of
AR
I in
cid
en
ts
Date of report week
Other settings
Influenza A
Influenza B
SARS-CoV-2
Rhinovirus
RSV
Other respiratory viruses
No organism reported

Weekly National Influenza & COVID-19 Report: week 47 report (up to week 46 data)
25
Table 2: Total number of situations/incidents by institution and PHE Centres over the past four weeks with the total number in the last week in brackets
PHE Centres Care home Hospital Educational
settings Prisons
Workplace settings
Food outlet/restaurant
settings
Other settings
Total
East of England 132(46) 18(4) 24(5) 3(2) 39(7) 3(1) 32(9) 251(74)
East Midlands 166(52) 48(13) 155(50) 4(0) 116(25) 2(0) 54(17) 545(157)
London 96(31) 71(16) 177(53) 5(0) 198(28) 20(6) 54(14) 621(148)
North East 102(30) 2(0) 2(0) 0(0) 19(5) 0(0) 62(15) 187(50)
North West 268(92) 17(4) 20(9) 3(0) 89(15) 6(0) 164(23) 567(143)
South East 179(55) 37(10) 296(120) 3(1) 160(44) 22(5) 112(40) 809(275)
South West 195(61) 7(2) 95(23) 2(0) 98(19) 10(0) 60(14) 467(119)
West Midlands 160(49) 85(29) 147(37) 5(3) 241(58) 10(1) 143(28) 791(205)
Yorkshire and Humber 223(55) 11(4) 108(31) 1(1) 155(26) 6(1) 151(42) 655(160)
Total 1521(471) 296(82) 1024(328) 26(7) 1115(227) 79(14) 832(202) 4893(1331)
Weekly National Influenza & COVID-19 Report: week 47 report (up to week 46 data)
26
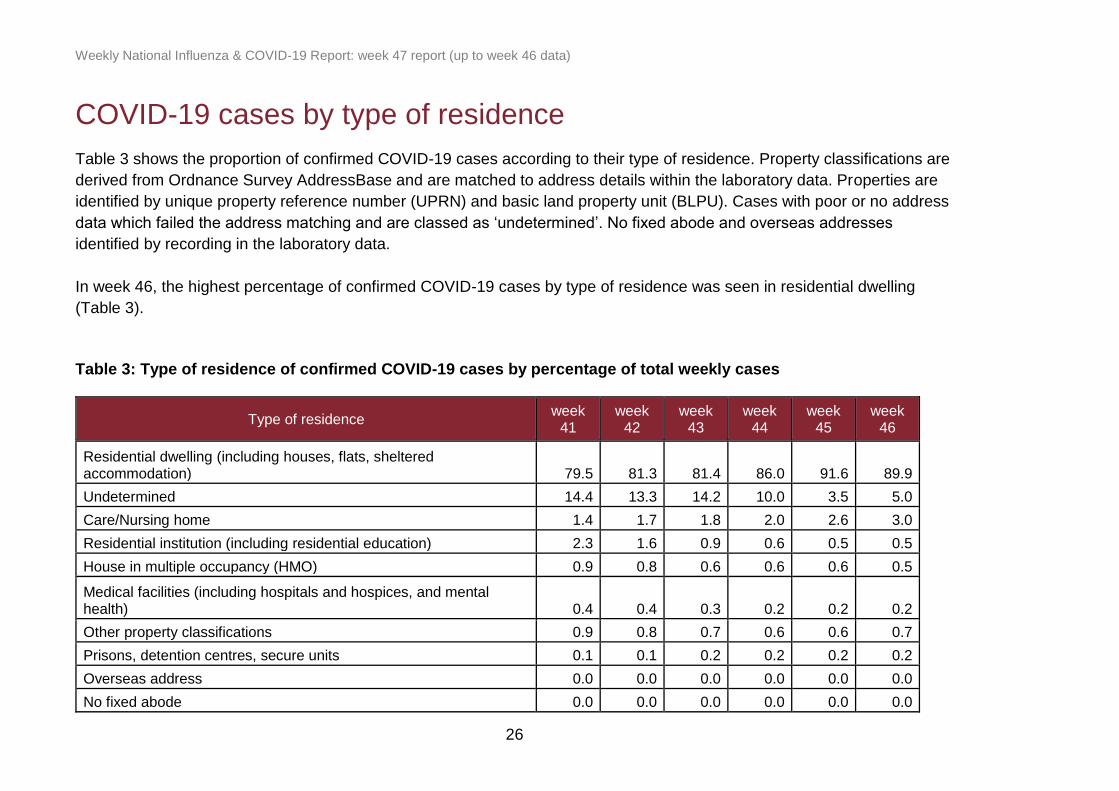
COVID-19 cases by type of residence
Table 3 shows the proportion of confirmed COVID-19 cases according to their type of residence. Property classifications are
derived from Ordnance Survey AddressBase and are matched to address details within the laboratory data. Properties are
identified by unique property reference number (UPRN) and basic land property unit (BLPU). Cases with poor or no address
data which failed the address matching and are classed as ‘undetermined’. No fixed abode and overseas addresses
identified by recording in the laboratory data.
In week 46, the highest percentage of confirmed COVID-19 cases by type of residence was seen in residential dwelling
(Table 3).
Table 3: Type of residence of confirmed COVID-19 cases by percentage of total weekly cases
Type of residence week
41 week
42 week
43 week
44 week
45 week
46
Residential dwelling (including houses, flats, sheltered accommodation) 79.5 81.3 81.4 86.0 91.6 89.9
Undetermined 14.4 13.3 14.2 10.0 3.5 5.0
Care/Nursing home 1.4 1.7 1.8 2.0 2.6 3.0
Residential institution (including residential education) 2.3 1.6 0.9 0.6 0.5 0.5
House in multiple occupancy (HMO) 0.9 0.8 0.6 0.6 0.6 0.5
Medical facilities (including hospitals and hospices, and mental health) 0.4 0.4 0.3 0.2 0.2 0.2
Other property classifications 0.9 0.8 0.7 0.6 0.6 0.7
Prisons, detention centres, secure units 0.1 0.1 0.2 0.2 0.2 0.2
Overseas address 0.0 0.0 0.0 0.0 0.0 0.0
No fixed abode 0.0 0.0 0.0 0.0 0.0 0.0

Weekly National Influenza & COVID-19 Report: week 47 report (up to week 46 data)
27
Medical Officers of Schools Association (MOSA) & PHE surveillance scheme
Boarding schools in England within the MOSA network are recruited each season to
report various respiratory related illnesses including influenza like illnesses (ILI).
For the 2020 to 21 season, 7 MOSA schools have agreed to participate in
the scheme, including a total of 4,783 pupils.
The overall ILI rate (all school years) for week 46 was 0.0 per 1,000 pupils compared to
the same rate in the previous week.
The overall COVID-19 rate (all school years) for week 46 was 2.5 per 1,000 pupils
compared to 0.4 per 1,000 pupils in the previous week.
If you are a MOSA school and would like to participate in this scheme, please email
[email protected] for more information.

Weekly National Influenza & COVID-19 Report: week 47 report (up to week 46 data)
28
FluSurvey
An internet based surveillance system has been developed based on FluSurvey.
FluSurvey is a web tool survey designed to monitor trends of influenza like illness (ILI) in
the community using self-reported respiratory symptoms from registered participants.
The platform has been adapted to capture respiratory symptoms, exposure risk and
healthcare seeking behaviours among registered participants to contribute to national
surveillance of COVID-19 activity as well as influenza activity since week 44.
Note: ILI is defined as sudden onset of symptoms with at least one of fever (chills);
malaise; headache; muscle pain and at least one of cough; sore throat; shortness of
breath.
A total of 3,679 participants completed the weekly COVID-19 surveillance survey in
week 46, of which 130 (3.5%) reported fever or cough and 56 (1.5%) reporting ILI. The
most commonly reported method of access to healthcare services continue to be
through telephoning a GP practice in week 46 (Figure 23).
Figure 23: Rate of contact with different healthcare services among FluSurvey participants reporting fever or cough symptoms, England
0
10
20
30
40
50
60
0
50
100
150
200
250
27 28 29 30 31 32 33 34 35 36 37 38 39 40 41 42 43 44 45 46 47 48 49 50 51 52 53 Rate
(fe
ver
or
cough o
r IL
I) p
er
1,0
00
part
icip
ants
Rate
of
conta
ct
per
1,0
00 p
art
icip
ants
Week number
Visited GP/GP Nurse Visited Hospital(including A&E, Admissions)
Telephoned GP Services Telephoned NHS 111
Fever or Cough ILI
Weekly National Influenza & COVID-19 Report: week 47 report (up to week 46 data)
29
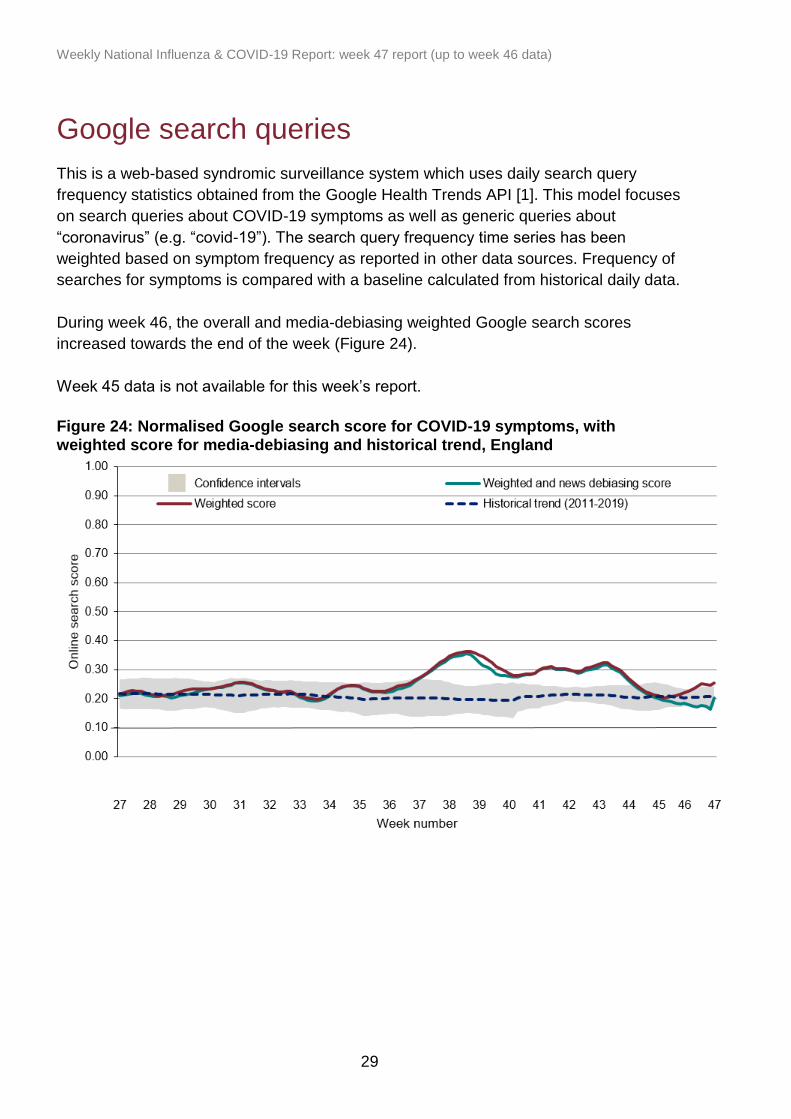
Google search queries
This is a web-based syndromic surveillance system which uses daily search query
frequency statistics obtained from the Google Health Trends API [1]. This model focuses
on search queries about COVID-19 symptoms as well as generic queries about
“coronavirus” (e.g. “covid-19”). The search query frequency time series has been
weighted based on symptom frequency as reported in other data sources. Frequency of
searches for symptoms is compared with a baseline calculated from historical daily data.
During week 46, the overall and media-debiasing weighted Google search scores
increased towards the end of the week (Figure 24).
Week 45 data is not available for this week’s report.
Figure 24: Normalised Google search score for COVID-19 symptoms, with weighted score for media-debiasing and historical trend, England

Weekly National Influenza & COVID-19 Report: week 47 report (up to week 46 data)
30
NHS 111
The NHS 111 service monitors daily trends in phone calls made to the service in
England, to capture trends in infectious diseases such as influenza and norovirus.
Up to 15 November 2020, the daily percentage of NHS 111 ‘potential COVID-19-like’
calls (as a percentage of total NHS 111 calls) and the number of online assessments
remained stable. The daily percentage of cold/flu calls (as a percentage of total NHS
111 calls) and cold/flu completed online assessments remained stable (Figure 25 and
26). The daily percentage of loss of taste or smell calls and online assessments
remained stable.
Please note that NHS 111 callers (from 11 May 2020) and NHS 111 online users (from
11 June 2020), who are assessed as having probable COVID-19 symptoms are now
triaged using symptom specific pathways e.g. cold/flu, which are included in routine
syndromic indicators.
Further information about these caveats is available from the PHE Remote Health
Advice Syndromic Surveillance bulletin.
Figure 25: NHS 111 telephony indicators (and 7-day moving average) for (a) daily potential COVID-19 calls, (b) daily cold/flu calls and (c) daily loss of taste or smell calls, as a percentage of total calls for all ages, England
(a)

Weekly National Influenza & COVID-19 Report: week 47 report (up to week 46 data)
31
(b)
(c)

Weekly National Influenza & COVID-19 Report: week 47 report (up to week 46 data)
32
Figure 26: NHS 111 completed online assessments (and 7-day moving average) for (a) daily potential COVID-19 online assessments, (b) daily cold/flu online assessments and (c) daily loss of taste or smell online assessments, as the number of completed online assessments for all ages, England
(a)
(b)

Weekly National Influenza & COVID-19 Report: week 47 report (up to week 46 data)
33
(c)

Weekly National Influenza & COVID-19 Report: week 47 report (up to week 46 data)
34
Primary care surveillance
RCGP (England)
The weekly ILI consultation rate through the RCGP surveillance was 1.3 per 100,000
registered population in participating GP practices in week 46 compared to the 1.5 per
100,000 in the previous week. This is below the baseline threshold (12.2 per 100,000)
(Figure 27). By age group, the highest rates were seen in the under 1 year olds (2.9 per
100,000) and in the 45 to 64 year olds (2.3 per 100,000). The Lower Respiratory Tract
Infections (LRTI) consultation rate was at 18.7 per 100,000 in week 46, which was
similar to the rate of 19.5 per 100,000 from the previous week. The COVID-19-like
indicator consultation rate increased at 74.4 per 100,000 in week 46 compared to 46.7
per 100,000 in the previous week (Figure 28).
Figure 27: RCGP ILI consultation rates, all ages, England
0.0
10.0
20.0
30.0
40.0
50.0
60.0
70.0
80.0
90.0
100.0
110.0
120.0
130.0
140.0
40 44 48 52 4 8 12 16 20 24 28 32 36
ILI ra
te p
er
100
,00
0
Week number
2010-11
2019-20
2020-21

Weekly National Influenza & COVID-19 Report: week 47 report (up to week 46 data)
35
Figure 28: RCGP ILI, LRTI and COVID-19-like indicator consultation rates, England
0.0
20.0
40.0
60.0
80.0
100.0
120.0
27 31 35 39 43 47 51 3 7 11 15 19 23
Ra
te p
er
100
.00
0
Week number
ILI rate LRTI rate COVID-19-like indicator

Weekly National Influenza & COVID-19 Report: week 47 report (up to week 46 data)
36
UK
Overall, weekly ILI consultations rates were below baseline levels in all UK schemes (Table 4).
By age group, the highest rates were seen in the 45 to 64 year olds in Scotland (1.4 per 100,000), in the 45 to 64 year olds
in Wales (1.9 per 100,000) and in the 65 to 74 year olds in Northern Ireland (3.9 per 100,000).
Table 4: GP ILI consultations in the UK for all ages with MEM thresholds applied
The Moving Epidemic Method (MEM) has been adopted by the European Centre for Disease Prevention and Control to
calculate thresholds for GP ILI consultations for the start of influenza activity (based on 10 seasons excluding 2009/10), in a
standardised approach across Europe. For MEM threshold values for each country, please visit:
https://www.gov.uk/guidance/sources-of-uk-flu-data-influenza-surveillance-in-the-uk#clinical-surveillance-through-primary-
care

Weekly National Influenza & COVID-19 Report: week 47 report (up to week 46 data)
37
GP In Hours, Syndromic Surveillance
The GP In Hours (GPIH) syndromic surveillance system monitors the number of GP
visits during regular hours of known clinical indicators.
Up to 15 November 2020, GPIH consultations for potential COVID-19-like consultations
increased however this was due to a technical error from a GP provider over the
weekend which is currently being rectified. GPIH ILI consultations remained stable
(Figure 29). Please note that the GPIH COVID-19-like indicator presented in this report
is derived from a reduced denominator population, compared to ILI.
Please note GP data should be interpreted with caution due to changes in advice
regarding accessing GP surgeries due to COVID-19. Further information about these
caveats is available from the PHE GP In Hours Syndromic Surveillance bulletin.
Figure 29: GPIH clinical indicators for (a) potential COVID-19 GP consultations and (b) influenza-like illness GP consultations, England
(a)
Weekly National Influenza & COVID-19 Report: week 47 report (up to week 46 data)
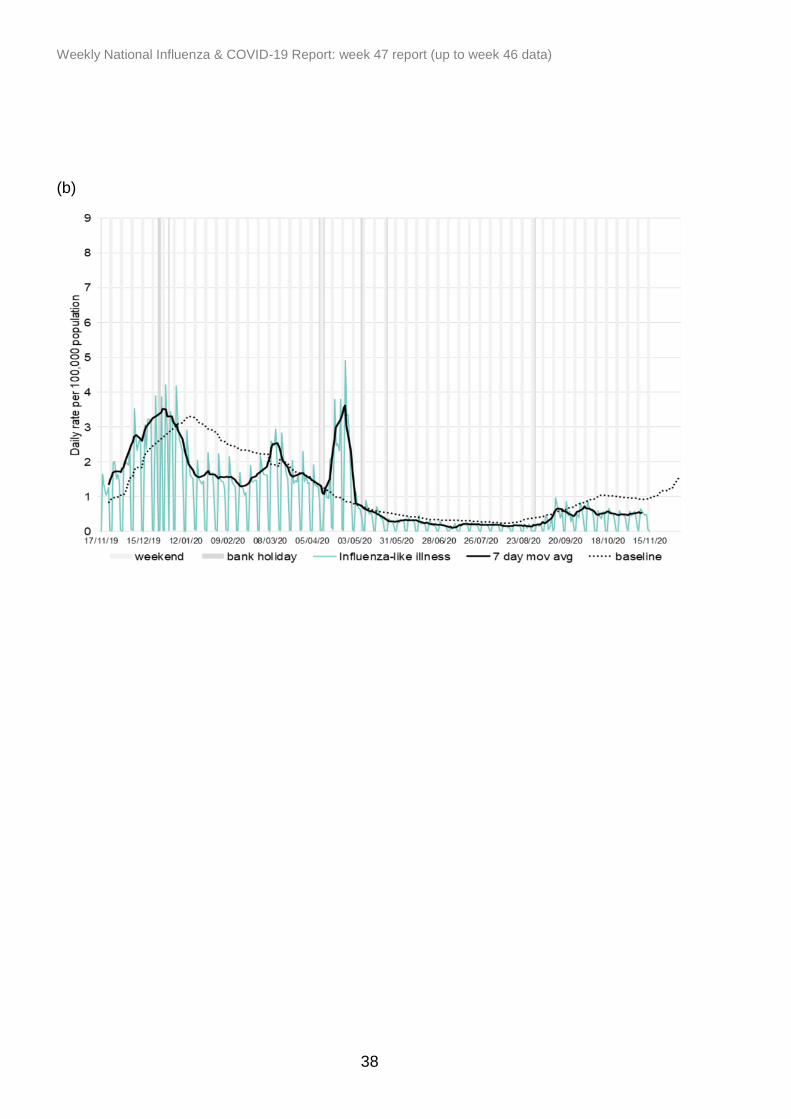
38
(b)

Weekly National Influenza & COVID-19 Report: week 47 report (up to week 46 data)
39
GP Out of Hours, Syndromic Surveillance
The GP Out of Hours (GPOOH) syndromic surveillance system monitors the numbers of daily unscheduled visits and calls to GPs during evenings, overnight, on weekends and on public holidays. Both systems cover around 55% of England’s population.
Up to 15 November 2020, GP out-of-hours and unscheduled care consultations for
acute respiratory infections and influenza-like illness and difficulty
breathing/asthma/wheeze remained stable (Figure 30). Figure 30: GPOOH daily contacts (%) for (a) difficulty breathing/wheeze/asthma, (b) influenza-like illness and (c) acute respiratory infections, England (a)

Weekly National Influenza & COVID-19 Report: week 47 report (up to week 46 data)
40
(b)
(c)

Weekly National Influenza & COVID-19 Report: week 47 report (up to week 46 data)
41
Sentinel swabbing scheme in the UK
In week 46 2020, 45 samples tested positive for SARS-CoV-2 with an overall positivity of
19.8% (45/227) compared to 23.7% (71/299) in the previous week, through the UK GP
sentinel swabbing schemes (Figure 31).
Samples up to week 41 were only tested for SARS-CoV-2.
Figure 31: Number of influenza and COVID-19 positive samples and weekly positivity (%), UK GP sentinel swabbing scheme
*For the most recent week, more samples are expected to be tested therefore the graph
in Figure 31 should be interpreted with caution
*Positivity (%) is not calculated when the total number tested is less than 10
0.0
5.0
10.0
15.0
20.0
25.0
30.0
0
10
20
30
40
50
60
70
80
27 31 35 39 43 47 51 2 6 10 14 18 22 26P
ositiv
ity (
%)
Num
be
r o
f p
ositiv
e s
am
ple
s
Sample week
A(H1N1)
A(H3)
A(unknown)
B
SARS-CoV-2
Influenza positivity (%)
SARS-CoV-2 positivity (%)

Weekly National Influenza & COVID-19 Report: week 47 report (up to week 46 data)
42
Secondary care surveillance
SARI Watch
The Severe Acute Respiratory Infection (SARI) Watch surveillance system was
established in 2020 to report the number of laboratory confirmed influenza and COVID-
19 cases admitted to hospital and critical care units (ICU/HDU) in NHS acute trusts
across England. This has replaced the USISS Mandatory and Sentinel data collections
for influenza surveillance used in previous seasons, and the COVID-19 hospitalisations
in England surveillance system (CHESS) collections for COVID-19 surveillance.
The weekly rate of new admissions of COVID-19 and influenza cases is based on the
trust catchment population of those NHS Trusts who made a new return. This may differ
from other published figures such as the total number of people currently in hospital with
COVID-19.
Trends in hospital and critical care admission rates need to be interpreted in the context
of testing recommendations.

Weekly National Influenza & COVID-19 Report: week 47 report (up to week 46 data)
43
Hospitalisations, SARI Watch
In week 46, the weekly hospital admission rate for COVID-19 increased further whilst the
hospital admission rate remained low for influenza.
The hospitalisation rate for COVID-19 was at 16.74 per 100,000 in week 46 compared to
14.23 per 100,000 in the previous week. The hospitalisation rate for influenza was at
0.00 per 100,000 in week 46 compared to 0.01 per 100,000 in the previous week; and
there were no new confirmed influenza hospital admissions reported.
From the week 46 report, regional observations for SARI Watch will be by PHE Centres.
By PHE centre, the highest hospital admission rate for COVID-19 was observed in
Yorkshire and Humber. By age groups, the highest hospital admission rate for confirmed
COVID-19 was in the 85+ year olds.
Figure 32: Weekly overall hospital admission rates per 100,000 of new COVID-19 and influenza positive cases reported through SARI Watch, England
* influenza hospital admission rate is reported from week 40 2020 onwards
* influenza hospital admission rate based on 30 sentinel NHS trusts for week 46
* COVID-19 hospital admission rate based on 119 NHS trusts for week 46
0.00
2.00
4.00
6.00
8.00
10.00
12.00
14.00
16.00
18.00
20.00
27 29 31 33 35 37 39 41 43 45 47 49 51 53 2 4 6 8 10 12 14 16 18 20 22 24 26
Ad
mis
sio
n r
ate
(p
er
100
,00
0)
Week number
COVID-19 hospital admission rate
Influenza hospital admission rate

Weekly National Influenza & COVID-19 Report: week 47 report (up to week 46 data)
44
Figure 33: Weekly overall influenza hospital admission rates per 100,000 trust catchment population with MEM thresholds, SARI Watch, England
* the MEM thresholds used are those from the 2019/20 season due to the pandemic
Figure 34: Weekly influenza hospital admissions by influenza type, SARI Watch, England
0.0
1.0
2.0
3.0
4.0
5.0
6.0
7.0
8.0
9.0
10.0
11.0
12.0
13.0
14.0
40 42 44 46 48 50 52 1 3 5 7 9 11 13 15 17 19
Ra
te o
f h
os
pit
ali
sati
on
per
100
,00
0
Week number
Influenza hospital admission rate
0
5
10
15
20
25
30
35
40
45
50
4041424344454647484950515253 1 2 3 4 5 6 7 8 9 1011121314151617181920
Nu
mb
er
of
ho
sp
ita
l a
dm
issio
ns
Week number
B A(unknown subtype)
A(H3N2) A(H1N1)pdm09

Weekly National Influenza & COVID-19 Report: week 47 report (up to week 46 data)
45
Figure 35: Weekly hospital admission rate by PHE Centre for new (a) COVID-19 positive cases and (b) influenza reported through SARI Watch
(a)
(b)
0.00
5.00
10.00
15.00
20.00
25.00
30.00
27 29 31 33 35 37 39 41 43 45 47 49 51 53 2 4 6 8 10 12 14 16 18 20 22 24 26
Ho
spita
l a
dm
issio
n r
ate
per
100
,00
0
Week number
East MidlandsEast of EnglandLondonNorth EastNorth WestSouth EastSouth WestWest MidlandsYorkshire and Humber
0.00
0.20
0.40
0.60
0.80
1.00
1.20
1.40
1.60
1.80
2.00
40 42 44 46 48 50 52 1 3 5 7 9 11 13 15 17 19 21 23 25
Ho
spita
l a
dm
issio
n r
ate
per
100
,00
0
Week number
East MidlandsEast of EnglandLondonNorth EastNorth WestSouth EastSouth WestWest Midlands

Weekly National Influenza & COVID-19 Report: week 47 report (up to week 46 data)
46
Figure 36: Weekly hospital admission rate by age group for new (a) COVID-19 positive cases and (b) influenza reported through SARI Watch
(a)
(b)
0.00
20.00
40.00
60.00
80.00
100.00
120.00
140.00
160.00
180.00
200.00
27 29 31 33 35 37 39 41 43 45 47 49 51 53 2 4 6 8 10 12 14 16 18 20 22 24 26
Ho
spita
l a
dm
issio
n r
ate
per
100
,00
0
Week number
0-4 5-14 15-44
45-64 65-74 75-84
85+
0.00
0.20
0.40
0.60
0.80
1.00
1.20
1.40
1.60
1.80
2.00
40 42 44 46 48 50 52 1 3 5 7 9 11 13 15 17 19 21 23 25
Ho
spita
l a
dm
issio
n r
ate
per
100
,00
0
Week number
0-4 5-14 15-44 45-64
65-74 75-84 85+
Weekly National Influenza & COVID-19 Report: week 47 report (up to week 46 data)
47
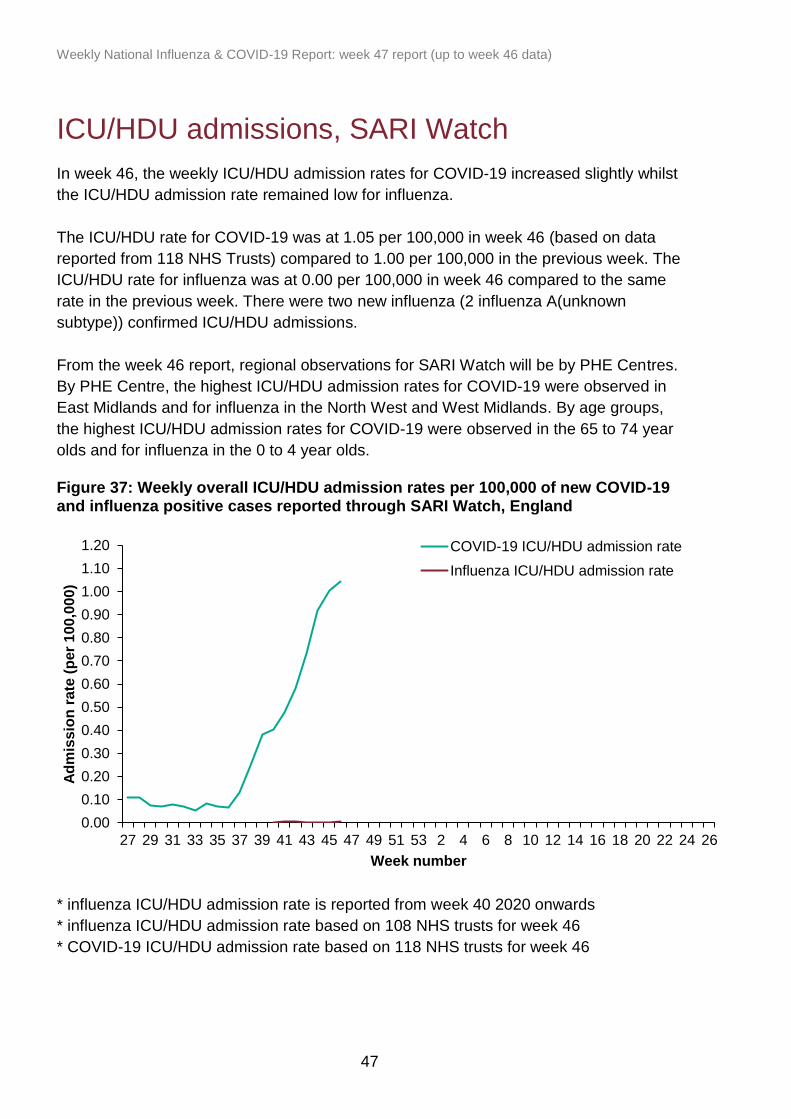
ICU/HDU admissions, SARI Watch
In week 46, the weekly ICU/HDU admission rates for COVID-19 increased slightly whilst
the ICU/HDU admission rate remained low for influenza.
The ICU/HDU rate for COVID-19 was at 1.05 per 100,000 in week 46 (based on data
reported from 118 NHS Trusts) compared to 1.00 per 100,000 in the previous week. The
ICU/HDU rate for influenza was at 0.00 per 100,000 in week 46 compared to the same
rate in the previous week. There were two new influenza (2 influenza A(unknown
subtype)) confirmed ICU/HDU admissions.
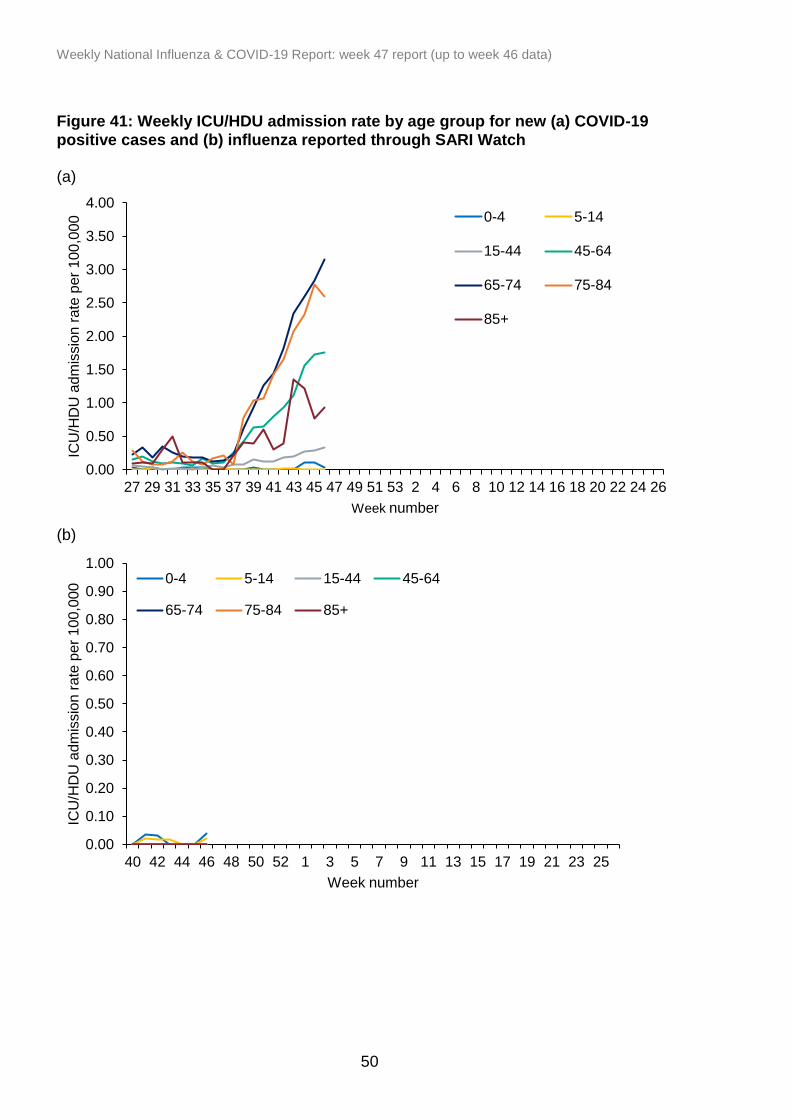
From the week 46 report, regional observations for SARI Watch will be by PHE Centres.
By PHE Centre, the highest ICU/HDU admission rates for COVID-19 were observed in
East Midlands and for influenza in the North West and West Midlands. By age groups,
the highest ICU/HDU admission rates for COVID-19 were observed in the 65 to 74 year
olds and for influenza in the 0 to 4 year olds. Figure 37: Weekly overall ICU/HDU admission rates per 100,000 of new COVID-19 and influenza positive cases reported through SARI Watch, England
* influenza ICU/HDU admission rate is reported from week 40 2020 onwards
* influenza ICU/HDU admission rate based on 108 NHS trusts for week 46
* COVID-19 ICU/HDU admission rate based on 118 NHS trusts for week 46
0.00
0.10
0.20
0.30
0.40
0.50
0.60
0.70
0.80
0.90
1.00
1.10
1.20
27 29 31 33 35 37 39 41 43 45 47 49 51 53 2 4 6 8 10 12 14 16 18 20 22 24 26
Ad
mis
sio
n r
ate
(p
er
100
,00
0)
Week number
COVID-19 ICU/HDU admission rate
Influenza ICU/HDU admission rate

Weekly National Influenza & COVID-19 Report: week 47 report (up to week 46 data)
48
Figure 38: Weekly overall influenza ICU/HDU admission rates per 100,000 trust catchment population with MEM thresholds, SARI Watch, England
Figure 39: Weekly influenza ICU/HDU admissions by influenza type, SARI Watch, England
0.0
0.1
0.2
0.3
0.4
0.5
0.6
0.7
0.8
0.9
1.0
40 42 44 46 48 50 52 1 3 5 7 9 11 13 15 17 19Ra
te o
f IC
U/H
DU
ad
mis
sio
ns
per
100
,00
0
Week number
Influenza ICU/HDU admission rate
0
5
10
15
20
25
30
35
40
45
50
4041424344454647484950515253 1 2 3 4 5 6 7 8 9 1011121314151617181920
Nu
mb
er
of
ICU
/HD
U a
dm
issio
ns
Week number
B A(unknown subtype)
A(H3N2) A(H1N1)pdm09

Weekly National Influenza & COVID-19 Report: week 47 report (up to week 46 data)
49
Figure 40: Weekly ICU/HDU admission rate by PHE Centre for new (a) COVID-19 positive cases and (b) influenza reported through SARI Watch (a)
(b)
0.00
0.10
0.20
0.30
0.40
0.50
0.60
0.70
0.80
0.90
1.00
40 42 44 46 48 50 52 1 3 5 7 9 11 13 15 17 19 21 23 25
ICU
/HD
U a
dm
issio
n r
ate
per
100
,00
0
Week number
East MidlandsEast of EnglandLondonNorth EastNorth WestSouth EastSouth WestWest Midlands
Weekly National Influenza & COVID-19 Report: week 47 report (up to week 46 data)
50
Figure 41: Weekly ICU/HDU admission rate by age group for new (a) COVID-19 positive cases and (b) influenza reported through SARI Watch (a)
(b)
0.00
0.50
1.00
1.50
2.00
2.50
3.00
3.50
4.00
27 29 31 33 35 37 39 41 43 45 47 49 51 53 2 4 6 8 10 12 14 16 18 20 22 24 26
ICU
/HD
U a
dm
issio
n r
ate
per
100
,00
0
Week number
0-4 5-14
15-44 45-64
65-74 75-84
85+
0.00
0.10
0.20
0.30
0.40
0.50
0.60
0.70
0.80
0.90
1.00
40 42 44 46 48 50 52 1 3 5 7 9 11 13 15 17 19 21 23 25
ICU
/HD
U a
dm
issio
n r
ate
per
100
,00
0
Week number
0-4 5-14 15-44 45-64
65-74 75-84 85+

Weekly National Influenza & COVID-19 Report: week 47 report (up to week 46 data)
51
ECMO, SARI Watch
From week 27 2020, a total of 52 laboratory confirmed COVID-19 admissions have been
reported from the 6 Severe Respiratory Failure (SRF) centres in the UK.
There were 8 new laboratory confirmed COVID-19 admissions reported in week 46
(Figure 42). Figure 42: Laboratory confirmed ECMO admissions (COVID-19, influenza and non-COVID-19 confirmed) to Severe Respiratory Failure centres in the UK
*From the week 45 report (this report), data on ECMO admissions is being presented
for the UK (including retrospective data from week 27 onwards).
0
2
4
6
8
10
12
14
16
18
20
27 30 33 36 39 42 45 48 51 1 4 7 10 13 16 19 22 25
Nu
mb
er
of E
CM
O a
dm
issio
ns
Week number
COVID-19 confirmed admissions
Influenza confirmed admissions
Other admissions

Weekly National Influenza & COVID-19 Report: week 47 report (up to week 46 data)
52
Emergency Department attendances, Syndromic surveillance
The Emergency Department Syndromic Surveillance System (EDSSS) monitors the
daily visits in a network of emergency departments across England.
Up to 15 November 2020, the daily number of ED attendances for all ages as reported
by 64 EDs, for COVID-19-like attendances increased while attendances for acute
respiratory infections remained stable (Figure 43).
Please note: the COVID-19-like ED indicator is an underestimation of the number of
COVID-19 attendances as it only includes attendances with a COVID-19-like diagnosis
as their primary diagnosis. The EDSSS COVID-19-like indicator should therefore be
used to monitor trends in ED attendances and not to estimate actual numbers of COVID-
19 ED attendances. Further information about these caveats is available from the PHE
Emergency Department Syndromic Surveillance bulletin.
Figure 43: Daily ED attendances for (a) COVID-19-like and (b) acute respiratory infections, all ages, England
(a)

Weekly National Influenza & COVID-19 Report: week 47 report (up to week 46 data)
53
(b)
Weekly National Influenza & COVID-19 Report: week 47 report (up to week 46 data)
54
Mortality surveillance
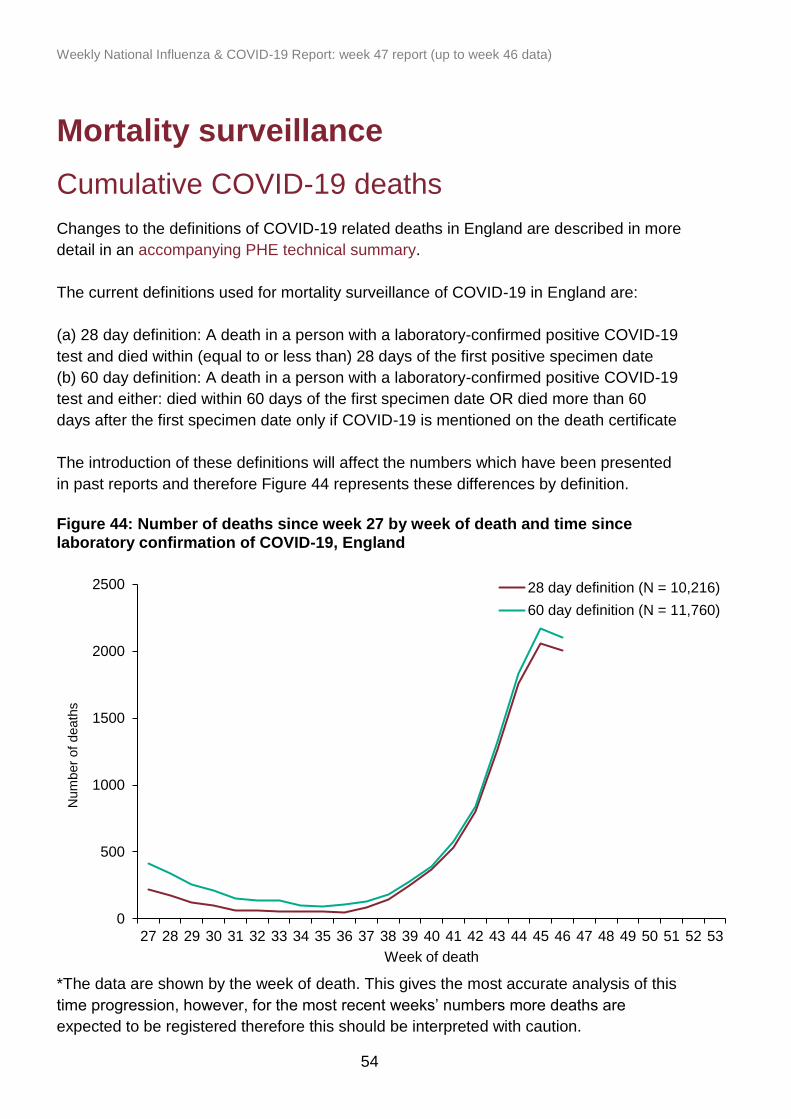
Cumulative COVID-19 deaths
Changes to the definitions of COVID-19 related deaths in England are described in more
detail in an accompanying PHE technical summary.
The current definitions used for mortality surveillance of COVID-19 in England are:
(a) 28 day definition: A death in a person with a laboratory-confirmed positive COVID-19
test and died within (equal to or less than) 28 days of the first positive specimen date
(b) 60 day definition: A death in a person with a laboratory-confirmed positive COVID-19
test and either: died within 60 days of the first specimen date OR died more than 60
days after the first specimen date only if COVID-19 is mentioned on the death certificate
The introduction of these definitions will affect the numbers which have been presented
in past reports and therefore Figure 44 represents these differences by definition.
Figure 44: Number of deaths since week 27 by week of death and time since laboratory confirmation of COVID-19, England
*The data are shown by the week of death. This gives the most accurate analysis of this
time progression, however, for the most recent weeks’ numbers more deaths are
expected to be registered therefore this should be interpreted with caution.
0
500
1000
1500
2000
2500
27 28 29 30 31 32 33 34 35 36 37 38 39 40 41 42 43 44 45 46 47 48 49 50 51 52 53
Num
ber
of
death
s
Week of death
28 day definition (N = 10,216)
60 day definition (N = 11,760)

Weekly National Influenza & COVID-19 Report: week 47 report (up to week 46 data)
55
Figure 45: Age/sex pyramid of laboratory confirmed COVID-19 deaths, since week 27
Table 5: Ethnic group (%) of COVID-19 deaths and time since laboratory confirmation of COVID-19, England
Ethnicity 28 day definition 60 day definition
White 89.0 89.4
Asian / Asian British 8.0 7.6
Black / African / Caribbean / Black British 1.6 1.6
Mixed / Multiple ethnic groups 0.3 0.3
Other ethnic group 1.1 1.1
4,000 3,000 2,000 1,000 0 1,000 2,000 3,000 4,000
<5y
5-9y
10-19y
20-29y
30-39y
40-49y
50-59y
60-69y
70-79y
80+ y
No. of deaths
Ag
e g
rou
p
Female (28 day) Male (28 day) Female (60 day) Male (60 day)

Weekly National Influenza & COVID-19 Report: week 47 report (up to week 46 data)
56
Table 6: Cumulative number of COVID-19 deaths since week 27 and time since laboratory confirmation of COVID-19 by PHE Centres
PHE Centres 28 day definition 60 day definition
North East 896 1,014
North West 3,171 3,570
Yorkshire & Humber 1,689 1,908
West Midlands 1,132 1,321
East Midlands 1,060 1,226
East of England 651 846
London 618 752
South East 766 1,029
South West 386 455

Weekly National Influenza & COVID-19 Report: week 47 report (up to week 46 data)
57
Figure 46: Cumulative mortality rate of COVID-19 cases per 100,000 population tested under Pillars 1 and 2 for the past four weeks by (a) 28 day definition and (b) 60 day definition (a)

Weekly National Influenza & COVID-19 Report: week 47 report (up to week 46 data)
58
(b)
* Figure 46 has been calculated using mid-2019 ONS population estimates

Weekly National Influenza & COVID-19 Report: week 47 report (up to week 46 data)
59
Daily excess all-cause mortality (England)
Deaths occurring from 1 January to 11 November 2020 were assessed to calculate the
daily excess above a baseline using age-group and region specific all cause deaths as
provided daily by the General Register Office (GRO). The deaths were corrected to
allow for delay to registration based on past data on these delays and the baseline was
from the same day of the year in the previous 5 years +/- 7 days with an extrapolated
time trend, and with 2 and 3 standard deviation (SD) limits shown (Figure 47).
Weeks in which at least 2 days exceeded the 3SD threshold are shown in Table 7 and
the daily difference from the baseline by age and region is given in Figure 47. Note that
as these data are by date of death with delay corrections, numbers are subject to
change each week, particularly for more recent days.
Significant excess all-cause mortality was observed in week 45 overall, by age group in
the 75 to 84 year olds and subnationally in the North West, West Midlands and
Yorkshire and Humber. The excess noted in week 33 coincides with a heat wave (Figure
47, 48 and Table 7).
Figure 47: Daily excess all-cause deaths in all ages, England, 1 January 2020 to 11 November 2020
^ based on same day in previous 5 years +/- 1 week with a linear trend projected
* corrected for delay to registration from death

Weekly National Influenza & COVID-19 Report: week 47 report (up to week 46 data)
60
Table 7: Excess all-cause deaths by (a) age group and (b) PHE centres, England
(a)
Age Group Excess detected in week 45
2020? Weeks in excess since week
10 2020
All ✓ 13 to 21, 33,43,45
under 25 x None
25 to 44 x 14 to 16, 32,38
45 to 64 x 12 to 19
65 to 74 x 13 to 19
75 to 84 ✓ 13 to 21, 33,43 to 45
85+ x 13 to 21, 33
(b)
PHE Centres Excess detected in week 45
2020? Weeks in excess since week
10 2020
East of England x 14 to 19,21
East Midlands x 13 to 19
London x 12 to 19,33
North East x 14 to 21
North West ✓ 13 to 19, 33,42 to 45
South East x 13 to 21, 33
South West x 14 to 19, 33
West Midlands ✓ 13 to 20, 45
Yorkshire and Humber ✓ 14 to 21, 23,43 to 45

Weekly National Influenza & COVID-19 Report: week 47 report (up to week 46 data)
61
Figure 48: Daily excess all-cause deaths by (a) age group and (b) PHE centres , England, 1 March 2020 to 11 November 2020
(a)
(b)

Weekly National Influenza & COVID-19 Report: week 47 report (up to week 46 data)
62
Microbiological surveillance
Virus characterisation
PHE characterises the properties of influenza viruses through one or more tests,
including genome sequencing (genetic analysis) and haemagglutination inhibition (HI)
assays (antigenic analysis). These data are used to compare how similar the currently
circulating influenza viruses are to the strains included in seasonal influenza vaccines,
and to monitor for changes in circulating influenza viruses. The interpretation of genetic
and antigenic data sources is complex due to a number of factors, for example, not all
viruses can be cultivated in sufficient quantity for antigenic characterisation, so that
viruses with sequence information may not be able to be antigenically characterised as
well. Occasionally, this can lead to a biased view of the properties of circulating viruses,
as the viruses which can be recovered and analysed antigenically, may not be fully
representative of majority variants, and genetic characterisation data does not always
predict the antigenic characterisation
In week 46, no influenza viruses were characterised by PHE Respiratory Virus Unit
(RVU).
Antiviral susceptibility
Influenza positive samples are screened for mutations in the virus neuraminidase gene
known to confer oseltamivir and/or zanamivir resistance. Additionally, testing of influenza
A(H1N1)pdm09, A(H3N2), and influenza B virus isolates for neuraminidase inhibitor
susceptibility (oseltamivir and zanamivir) is performed at PHE-RVU using a functional
assay. The data summarized below combine the results of both testing methods. The
samples tested are routinely obtained for surveillance purposes, but diagnostic testing of
patients suspected to be infected with neuraminidase inhibitor-resistant virus is also
performed.
In week 46, no influenza viruses were tested for antiviral susceptibility.

Weekly National Influenza & COVID-19 Report: week 47 report (up to week 46 data)
63
Antimicrobial susceptibility
Table 8 shows in the 12 weeks up to week 46 2020, the proportion of all lower
respiratory tract isolates of Streptococcus pneumoniae, Haemophilus influenza,
Staphylococcus aureus, MRSA and MSSA tested and susceptible to antibiotics. These
organisms are the key causes of community-acquired pneumonia (CAP) and the choice
of antibiotics reflects the British Thoracic Society empirical guidelines for management of
CAP in adults.
Table 8: Antimicrobial susceptibility surveillance in lower respiratory tract
Organism Antibiotic Specimens tested
(N) Specimens
susceptible (%)
S. pneumoniae
Penicillin 815 86
Macrolides 877 77
Tetracycline 872 79
H. influenzae
Amoxicillin/ampicillin 3,654 62
Co-amoxiclav 3,989 73
Macrolides 780 5
Tetracycline 4,084 97
S. aureus Methicillin 2,884 94
Macrolides 3,117 70
MRSA Clindamycin 112 37
Tetracycline 148 72
MSSA Clindamycin 1,906 75
Tetracycline 2,611 93
* Macrolides = erythromycin, azithromycin and clarithromycin
Data source: PHE’s SGSS CDR module. Please note that this is different to the data
source used during the 2019/20 influenza season when the SGSS AMR module was
used, and so the results are not directly comparable.
There has been a reduction in the total number of bacterial positive lower respiratory
tract clinical samples reported to PHE since mid-March 2020

Weekly National Influenza & COVID-19 Report: week 47 report (up to week 46 data)
64
COVID-19 sero-prevalence surveillance
The results from testing samples provided by healthy adult blood donors aged 17 years
and older, supplied by the NHS Blood and Transplant (NHS BT collection) between
weeks 17-44 are summarised. This programme has previously involved testing
approximately 1000 donor samples from two different NHS regions each week. In this
week’s report, the data presented reflects a change in the sampling strategy as of week
44, with approximately 250 samples from each geographic NHS region being tested
each week. Since week 26, an exclusion of donors aged 70 years and older donating
throughout lockdown was lifted, and therefore data since then include donors in this
older age group.
Seroprevalence in Adults aged 17 years and older (Blood Donors)
The results presented here are based on testing using the Euroimmun assay for blood
donor samples collected between weeks 17-45. This report presents seropositivity
estimates using a 4-week rolling prevalence for national and regional estimates.
Seroprevalence estimates reported are based on seropositivity which are unadjusted for
the sensitivity and specificity of the assays used. This is because assay sensitivity will
change according to the time since infection in these cohorts due to waning of
antibodies.
National prevalence
Overall population weighted (by age group, sex and NHS region) antibody prevalence
using the Euroimmun assay among blood donors aged 17 years and older in England
was 5.7% (95% CI 5.1% - 6.4%) for the period 14th October– 8th November (weeks 42-
45). Estimates are based on 7424 samples, of which 451 were positive. This compares
with 5.9% (95% CI 4.9% - 7.1%) for the period of 7th October – 1st November (weeks
41-44). Changes in prevalence over time need to take into account demographic
changes in the donor population, with later data including donors aged 70 years and
older who were previously excluded from donating during lockdown. Waning immunity is
also likely to be a contributing factor.
Regional prevalence over time Seropositivity (weighted by age group and sex) vary across the country and over time. Figure 49 shows the overall 4-weekly rolling proportion seropositive in each region over time. Seropositivity estimates are plotted on the mid-point of the 4-weekly period.
In London where estimates have consistently been highest, the 4-weekly rolling
seropositivity increased from 11.9% (week 16-19) to 13.7% (weeks 20-23). From week
24, seropositivity declined and plateaued with estimates at 7.8% in weeks 30-33. This
was then followed by a rise in seropositivity to 10.4% (95% CI 9.1% - 12%) in weeks 34-
37 and has plateaued to 8.2% (95% CI 7.0% - 9.7%) in weeks 42-45. Contributory
factors to this fluctuation are likely to include variability in the precise locations of
sampling within London and changes in exposure of donors. Increases in seropositivity

Weekly National Influenza & COVID-19 Report: week 47 report (up to week 46 data)
65
observed in weeks 34-37 in part may reflect samples being tested from donors who
were likely to be returning to donate having donated in earlier parts of the epidemic
when incidence was high.
Data from the North West show that seropositivity increased from 5.3% (95% CI 4.1 -
6.9%) in weeks 39-42 to 6.9% (95% CI 5.7% - 8.3%) in weeks 42-45.
In the East of England, seropositivity was 4.6% (95% CI 3.6% - 5.8%) in the most recent
data (weeks 42-45) fluctuating between 4.0% (95% Cl 3.0% - 5.3%) in weeks 39-42 and
5.9% (95% CI 4.6% - 7.6%) in weeks 35-38.
Seropositivity in the South East region was 4.0% (95% CI 3.0% - 5.3%) for weeks 42-45
lower than the 5.1% (95% CI 3.3% - 7.7%) observed in weeks 33-36, and higher than
the 3.2% (95% CI 2.2% - 4.7%) observed in weeks 38-41.
Seropositivity in the South West region increased from 3.9% (95% CI 2.7% - 5.6%) in
weeks 41-44 to 4.5% (95% CI 2.5 – 8.0%) in weeks 42-45.
In the North East and Yorkshire NHS region, the seropositivity decreased from 5.8%
(95% CI 3.5%-9.5%) in weeks 41-44 to 4.9% (95% CI 3.3% - 7.2%) in week 42-45.
Data from the Midlands also show a lower proportion seropositive at 6.1% (95% CI 4.3%
- 8.4%) in weeks 42-45. This compares to 6.9% (95% CI 5.3% - 8.8%) in weeks 40-43.
Due to the recent change in sampling strategy, there were relatively fewer samples from
the Midlands included in the previous rolling 4-week window, resulting in a larger
uncertainty for the previous estimate.
The change in proportion seropositive observed in some regions is likely to be driven by
changes in the precise locations of sample collection. However, the most recent
increases observed in the North West and South West regions cannot be fully explained
by this and are likely to reflect increased transmission, consistent with other surveillance
data. Increases in seropositivity reflect transmission occurring at least two to three
weeks previously given the time taken to generate an antibody response following
infection.
Declines in prevalence observed during the summer months can be partially explained
by demographic differences in the donor population as lockdown measures were
relaxed. Examples include a reduction in attendance of regular donors in August and
that donors aged 70 years and above were not allowed to donate during lockdown, but
this exclusion was lifted from week 26. Waning immunity will also be a contributing factor
to the lower prevalence.

Weekly National Influenza & COVID-19 Report: week 47 report (up to week 46 data)
66
Prevalence by age group
Population weighted antibody prevalence (unadjusted) estimates have remained highest
in donors aged 17-29 and has generally declined with age, with lowest prevalence in
donors aged 70-84. Donors aged 70-84 years are only included from week 26 onward
as this age group, who were advised to shield during lockdown, have been able to return
to donor clinics since then (Figure 50).
Prevalence for all age groups for weeks 41-44 has been excluded due to a change in
sampling strategy from week 44 which resulted in a small number of samples from older
age groups in some regions which makes interpretation of trends for this period difficult.
The largest variation over time are observed in those aged 17-29, prevalence has
decreased from 10.8% (95% CI 9.0% - 12.9%) in weeks 19-22 to 8.3% (95% CI 6.6% -
10.4%) in weeks 42-45. Recently there has been a notable increase in prevalence in
donors aged 50-59 from 5.2% (95% CI 4.2% - 6.3%) in weeks 35-38 to 7.3% (95% CI
6.1% - 8.8%) in weeks 42-45 and in donors aged 60-69 from 3.7% (95% CI 2.8% -
5.0%) in weeks 38-41 to 5.4% (95% CI 4.0% - 7.1%).
Figure 49: 4-weekly rolling SARS-CoV-2 antibody seroprevalence (% seropositive) in blood donors by region, using Euroimmun test; error bars show 95% confidence intervals

Weekly National Influenza & COVID-19 Report: week 47 report (up to week 46 data)
67
Figure 50: Population weighted 4-weekly rolling SARS-CoV-2 antibody seroprevalence (% seropositive) in blood donors by age group, using Euroimmun test; error bars show 95% confidence intervals

Weekly National Influenza & COVID-19 Report: week 47 report (up to week 46 data)
68
Influenza vaccination
Influenza vaccine uptake in GP patients
Up to week 46 2020 in 65.0% of GP practices reporting weekly to Immform for the main
collection, the provisional proportion of people in England who had received the 2020/21
influenza vaccine in targeted groups was as follows (Figure 51):
• 37.8% in under 65 years in a clinical risk group
• 30.8% in pregnant women
• 72.9% in 65+ year olds
Figure 51: Cumulative weekly influenza vaccine uptake by target group in England
In 2020/21, all 2 and 3 year olds continue to be eligible for influenza vaccination through
their GPs. Up to week 46 2020, in 94.4% of GP practices reporting weekly to Immform
for the childhood collection, the provisional proportion of children in England who had
received the 2020/21 influenza vaccine in targeted groups was as follows (Figure 52):
• 45.0% in 2 year olds
• 46.8% in 3 year olds
0
10
20
30
40
50
60
70
80
40 42 44 46 48 50 52 2 4
Va
ccin
e u
pta
ke
(%
)
Week number
65+yrs
<65yrs at risk
All pregnant women
2020/21 season indicated by bold lines, 2019/20 season indicated by fainter dashed lines

Weekly National Influenza & COVID-19 Report: week 47 report (up to week 46 data)
69
Figure 52: Cumulative weekly influenza vaccine uptake in 2 and 3 year olds, in England
0
10
20
30
40
50
60
70
80
40 42 44 46 48 50 52 2 4
Va
ccin
e u
pta
ke
(%
)
Week number
2 years
3 years
2020/21 season indicated by bold lines, 2019/20 season indicated by fainter lines

Weekly National Influenza & COVID-19 Report: week 47 report (up to week 46 data)
70
Influenza vaccine uptake in school age children
The first report on influenza vaccine uptake in school age children (Year Reception to Year 7) will be published in November 2020.
Influenza vaccine uptake in healthcare workers
The first report on influenza vaccine uptake in healthcare workers will be published in
November 2020.

Weekly National Influenza & COVID-19 Report: week 47 report (up to week 46 data)
71
International update
Global COVID-19 update
Globally, up to 17 November 2020, a total of 53,890,518 cases of COVID-19 infection
have been reported worldwide, including 1,278,494 COVID-19 related deaths.
For further information on the global COVID-19 situation please see the WHO COVID-19
situation reports.
Figure 53: Global map of cumulative COVID-19 cases

Weekly National Influenza & COVID-19 Report: week 47 report (up to week 46 data)
72
Figure 54: Global map of weekly COVID-19 case incidence rate per 100,000, week 46 2020

Weekly National Influenza & COVID-19 Report: week 47 report (up to week 46 data)
73
Global influenza update
Updated on 11 November 2020 (based on data up to 25 October 2020) (WHO website)
In the temperate zone of the northern hemisphere, influenza activity remained below
inter-seasonal levels, though sporadic detections were reported in some countries. In
the temperate zones of the southern hemisphere, no influenza detections were reported
across countries. Worldwide, of the very low numbers of detections reported, seasonal
influenza A(H3N2) viruses accounted for the majority of detections.
In the countries of North America, influenza activity indicators, including the percent of
tests positive for influenza, were at very low levels.
In Europe, influenza activity remained at inter-seasonal levels though sporadic
detections were reported across reporting countries.
In Central Asia and Northern Africa, there were no influenza updates for this reporting
period.
In Western Asia, sporadic influenza detections were reported in recent weeks.
In East Asia, influenza illness indicators and influenza activity remained at inter-seasonal
levels in most reporting countries
In the Caribbean and Central American countries, sporadic influenza detections were
reported.
In tropical South America, there were no influenza detections across reporting countries.
In tropical Africa, influenza activity was reported in West Africa in Côte d’Ivoire and
Niger, and in East Africa in Kenya.
In Southern Asia, influenza activity of predominately influenza A(H3N2) was reported in
Bangladesh and India in recent weeks.
In South East Asia, influenza detections continued to be reported in Cambodia and Lao
People's Democratic Republic (PDR).
In Oceania, ILI and other influenza activity indicators remained below usual levels for
this time of year in general, despite continued testing.
The WHO GISRS laboratories tested more than 94241 specimens between 12 October
2020 and 25 October 2020. 140 were positive for influenza viruses, of which 80 (57.1%)
Weekly National Influenza & COVID-19 Report: week 47 report (up to week 46 data)
74
were typed as influenza A and 60 (42.9%) as influenza B. Of the sub-typed influenza A
viruses, 2 (5.4%) were influenza A(H1N1pdm09) and 35 (94.6%) were influenza A
(H3N2). Of the characterized B viruses, 1 (6.7%) belonged to the B-Yamagata lineage
and 14 (93.3%) to the B-Victoria lineage.
Influenza in Europe
Updated on 13 November 2020 (Joint ECDC-WHO Europe Influenza weekly update)
For week 45 2020, influenza activity remained at interseasonal levels throughout
Europe.
Of 28 countries and areas that reported on the intensity indicator, 25 reported activity at
baseline levels and 3 reported low intensity (Azerbaijan, Serbia and Slovakia) for week
45 2020. Of 29 countries and areas that reported on geographic spread, 23 reported no
activity and 6 reported sporadic spread (in eastern, northern and western areas) for
week 45/2020.
For week 45 2020, of 615 sentinel specimens tested for influenza viruses, none were
positive.
There were no hospitalized laboratory-confirmed influenza cases in ICUs for week 45
2020 and since the start of the season.
There were no laboratory-confirmed influenza cases in wards outside ICUs for week 45
2020 and since the start of the season.
Influenza in the Northern Hemisphere
Influenza activity remains low in the United States of America and in Canada.
For further information on influenza in the United States of America please see the
Centre for Disease Control weekly influenza surveillance report.
For further information on influenza in Canada please see the Public Health Agency
weekly influenza report.

Weekly National Influenza & COVID-19 Report: week 47 report (up to week 46 data)
75
Other respiratory viruses
Avian influenza
Latest update on 9 November 2020 (WHO website)
Influenza A(H5) viruses:
According to reports received by the World Organisation for Animal Health (OIE),
various influenza A(H5) subtypes continue to be detected in birds in Africa, Europe and
Asia.
Influenza A(H7N9) viruses:
There have been no publicly available reports from animal health authorities in China or
other countries on influenza A(H7N9) virus detections in animals in recent months.
Influenza A(H9N2) viruses:
Since the last update on 10 July 2020, one new laboratory-confirmed human case of
influenza A(H9N2) virus infection was reported from China to WHO on 28 August 2020.
Middle East respiratory syndrome coronavirus (MERS-CoV)
Latest update on 17 November 2020 (WHO website)
Up to 17 November 2020, a total of five cases of Middle East respiratory syndrome
coronavirus, MERS-CoV, (three imported and two linked cases) have been confirmed in
the UK. On-going surveillance has identified 1,926 suspected cases in the UK since
September 2012 that have been investigated for MERS-CoV and tested negative.
From 1 April to 31 May 2020, the National IHR Focal Point of Saudi Arabia reported 9
new cases of MERS-CoV infection, including five deaths.
Globally, since September 2012, WHO has been notified of 2,562 laboratory-confirmed
cases of infection with MERS-CoV, including 881 related deaths. Further information on
management and guidance of possible cases is available online. The latest ECDC
MERS-CoV risk assessment can be found here, where it is highlighted that risk of
widespread transmission of MERS-CoV remains very low.

Weekly National Influenza & COVID-19 Report: week 47 report (up to week 46 data)
76
Related links
Previous national COVID-19 reports
Previous weekly influenza reports
Annual influenza reports
Sources of influenza surveillance data
Sources of COVID-19 surveillance data
PHE has delegated authority, on behalf of the Secretary of State, to process Patient
Confidential Data under Regulation 3 The Health Service (Control of Patient Information)
Regulations 2002 http://www.legislation.gov.uk/uksi/2002/1438/regulation/3/made.
Regulation 3 makes provision for the processing of patient information for the
recognition, control and prevention of communicable disease and other risks to public
health.

77
www.gov.uk/phe
Twitter: @PHE_uk
www.facebook.com/PublicHealthEngland
© Crown copyright 2020
Prepared by: The Immunisation and Countermeasures Division, National Infection Service
For queries relating to this document, please contact: [email protected]