Embed Size (px)
Citation preview

Morbidity and Mortality Weekly Report
Weekly May 28, 2004 / Vol. 53 / No. 20
depardepardepardepardepartment of health and human sertment of health and human sertment of health and human sertment of health and human sertment of health and human servicesvicesvicesvicesvicesCenters for Disease Control and PreventionCenters for Disease Control and PreventionCenters for Disease Control and PreventionCenters for Disease Control and PreventionCenters for Disease Control and Prevention
INSIDE
431 Immunization Registry Progress — United States,January–December 2002
433 Wild Poliovirus Importations — West and Central Africa,January 2003–March 2004
435 Notices to Readers
World No Tobacco Day —May 31, 2004
“Up in Smoke: Tobacco’s Cost to the Family” is theU.S. theme of this year’s World No Tobacco Day, May 31.Tobacco use is responsible for nearly one in 10 adult deathsworldwide and five million deaths each year (1).
In the United States, on average, men and women whosmoke have their lives cut short by 13.2 and 14.5 years,respectively (2). Each year, secondhand smoke is associ-ated with thousands of new cases of asthma, bronchitis,and pneumonia among children and an increased risk forsudden infant death syndrome (2). The economic toll forsmoking exceeds $150 billion (i.e., $3,400 per smoker)per year (3). In 1994, smoking-related Social SecuritySurvivors Insurance payments cost the nation about $1.4billion (4). The poorest socioeconomic groups suffer theconsequences of tobacco use the most (5), because ofadverse health effects and having less money to spend onbasic items such as food, education, and health care (6).Additional information is available at http://www.who.int/tobacco/en.References1. World Bank. Curbing the epidemic: governments and the econom-
ics of tobacco control, 1999. Available at http://www1.worldbank.org/tobacco/reports.htm.
2. U.S. Department of Health and Human Services. The health con-sequences of smoking: a report of the Surgeon General. Atlanta,Georgia: U.S. Department of Health and Human Services, CDC, 2004.
3. CDC. Annual smoking-attributable mortality, years of potentiallife lost, and economic costs—United States, 1995–1999. MMWR2002;51:300–3.
4. Leistikow BN, Martin DC, Milano CE. Estimates of smoking-attributable deaths at ages 15–54, motherless or fatherless youths,and resulting social security costs in the United States in 1994.Prev Med 2000;30:353–60.
5. Jha P, Chaloupka F. Tobacco control in developing countries.Oxford, England: Oxford University Press, 2000.
6. De Beyer J, Lovelace C, Yurekli A. Poverty and tobacco. TobControl 2001;10:210–1.
Cigarette Smoking Among Adults —United States, 2002
One of the national health objectives for 2010 is to reducethe prevalence of cigarette smoking among adults to <12%(objective 27.1a) (1). To assess progress toward this objective,CDC analyzed self-reported data from the 2002 NationalHealth Interview Survey (NHIS) sample adult core question-naire. This report summarizes the results of that analysis, whichindicated that, in 2002, approximately 22.5% of adults werecurrent smokers. Although this prevalence is slightly lowerthan the 22.8% prevalence among U.S. adults in 2001 andsubstantially lower than the 24.1% prevalence in 1998, therate of decline has not been at a sufficient pace to achieve the2010 national health objective. During 1983–2002, adultswith household incomes below the poverty level and thosewith less than some college education consistently had highersmoking prevalence. A comprehensive approach to smokingcessation that comprises educational, economic, clinical, andregulatory strategies and emphasizes reducing disparities isrequired to reduce further the prevalence of smoking (2).
The 2002 NHIS adult core questionnaire was administeredby personal interview to a nationally representative sample(n = 31,044) of the U.S. civilian, noninstitutionalized popu-lation aged >18 years; the overall survey response rate was74.3%. Respondents were asked, “Have you smoked at least100 cigarettes in your entire life?” and “Do you now smokecigarettes every day, some days, or not at all?” Ever smokerswere defined as those who reported having smoked >100 ciga-rettes during their lifetimes. Current smokers were defined as

428 MMWR May 28, 2004
SUGGESTED CITATIONCenters for Disease Control and Prevention. [Article Title].MMWR 2004;53:[inclusive page numbers].
The MMWR series of publications is published by theEpidemiology Program Office, Centers for Disease Controland Prevention (CDC), U.S. Department of Health andHuman Services, Atlanta, GA 30333.
Centers for Disease Control and Prevention
Julie L. Gerberding, M.D., M.P.H.Director
Dixie E. Snider, M.D., M.P.H.(Acting) Deputy Director for Public Health Science
Tanja Popovic, M.D., Ph.D.(Acting) Associate Director for Science
Epidemiology Program Office
Stephen B. Thacker, M.D., M.Sc.Director
Office of Scientific and Health Communications
John W. Ward, M.D.Director
Editor, MMWR Series
Suzanne M. Hewitt, M.P.A.Managing Editor, MMWR Series
Douglas W. Weatherwax(Acting) Lead Technical Writer/Editor
Jude C. RutledgeTeresa F. Rutledge
Writers/Editors
Lynda G. CupellMalbea A. LaPete
Visual Information Specialists
Kim L. Bright, M.B.A.Quang M. Doan, M.B.A.
Erica R. ShaverInformation Technology Specialists
Division of Public Health Surveillanceand Informatics
Notifiable Disease Morbidity and 122 Cities Mortality DataRobert F. Fagan
Deborah A. AdamsFelicia J. ConnorLateka Dammond
Rosaline DharaDonna Edwards
Patsy A. HallPearl C. Sharp
those who reported both having smoked >100 cigarettes dur-ing their lifetimes and currently smoking every day or somedays. Former smokers were defined as ever smokers who cur-rently did not smoke. Data were adjusted for nonresponsesand weighted to provide national estimates of cigarette smok-ing prevalence. Confidence intervals (CIs) were calculated byusing SUDAAN to account for the multistage probabilitysample.
In 2002, an estimated 45.8 million adults (22.5%; 95%CI = ±0.6) were current smokers; of these, an estimated 37.5million (81.8%) smoked every day, and 8.3 million (18.2%)smoked some days. Among those who smoked every day, anestimated 15.4 million (41.2%; 95% CI = ±1.5) reported thatthey had stopped smoking for >1 day during the preceding12 months because they were trying to quit. In 2002, an esti-mated 46.0 million adults were former smokers, representing50.1% (95% CI = ±1.1) of adults who had ever smoked; 2002was the first year that more than half of ever smokers wereformer smokers.
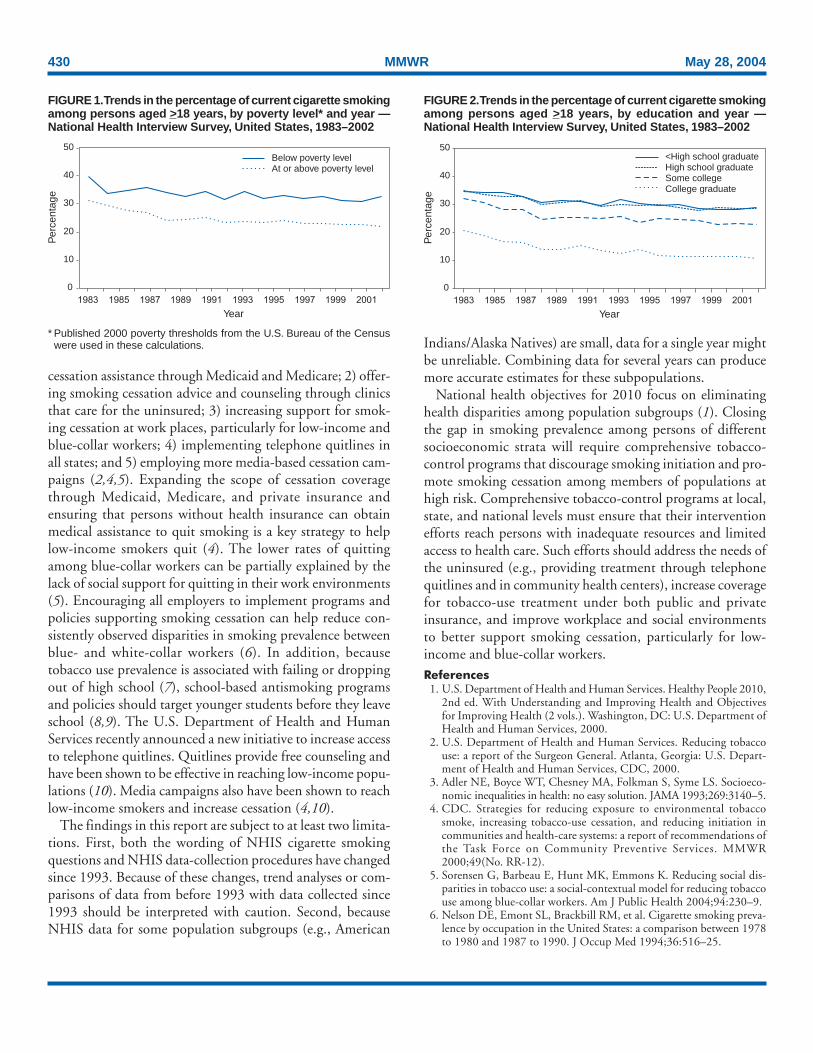
Cigarette smoking prevalence rates varied substantially acrosspopulation subgroups (Table). The prevalence of smoking washigher among men (25.2%) than women (20.0%) andinversely related to age, from 28.5% for those aged 18–24years to 9.3% for those aged >65 years. Among racial/ethnicgroups, Asians (13.3%) and Hispanics (16.7%) had the low-est prevalence, and American Indians/Alaska Natives had thehighest (40.8%). Current smoking prevalence also was higheramong adults living below the poverty level* (32.9%) thanamong those at or above the poverty level (22.2%). During1983–2002, the gap in smoking prevalence between those liv-ing below the poverty line and those living at or above itincreased from 8.7 percentage points to 10.7 percentage points(Figure 1). In addition, the percentage of ever smokers whohad quit was higher for persons at or above the poverty levelthan for those below the poverty line. As with current smok-ing prevalence, this gap was larger in 2002 than in 1983 (20.0percentage points versus 18.7 percentage points).
Educational attainment has been associated consistently withadult smoking prevalence since 1983 (Figure 2). By educa-tion level, smoking prevalence was highest among adults whohad earned a General Educational Development diploma(42.3%) and lowest among those with graduate degrees(7.2%). Women with undergraduate (10.5%) or graduatedegrees (6.4%) and men with graduate degrees (7.8%) alsohad smoking prevalence rates below the overall U.S. 2010objective. During 1983–2002, the largest decreases in smok-ing prevalence occurred among adults with a college degree
* Published 2000 poverty thresholds from the U.S. Bureau of the Census wereused in these calculations.

Vol. 53 / No. 20 MMWR 429
(10.0 percentage points) and those with some college educa-tion (9.3 percentage points); those with a high school diploma(6.6 percentage points) and those with less than a high schooleducation (5.8 percentage points) showed the smallestdecreases. During this period, the gap in smoking prevalencebetween adults who had graduated from college and thosewith less than a high school education increased from 14.0percentage points in 1983 to 18.2 percentage points in 2002(Figure 2). Similar patterns occurred in the percentage of eversmokers who had quit among different educational groups.The percentage of ever smokers who had quit was highest forthose with college degrees, followed by persons with somecollege education. High school graduates and those with lessthan high school education had the lowest percentage of eversmokers who had quit. The gap between adults with a collegedegree and those with less than a high school education
increased from 19.0 percentage points in 1983 to 25.9percentage points in 2002.Reported by: C Husten, MD, K Jackson, MSPH, Office on Smokingand Health, National Center for Chronic Disease Prevention and HealthPromotion; C Lee, PhD, EIS Officer, CDC.
Editorial Note: The findings in this report indicate that 1) thesocioeconomic status of U.S. adults is inversely related to theirlikelihood of smoking and 2) during 1983–2002, the gap insmoking prevalence by socioeconomic status did not narrowand might have widened. These findings underscore the needfor targeted interventions that can better reach persons of lowersocioeconomic status.
Persons of low socioeconomic status have less access to healthcare than those of high socioeconomic status (3). Specificefforts to reduce socioeconomic disparities in smoking preva-lence could include 1) offering comprehensive smoking
TABLE. Percentage of persons aged >18 years who were current smokers*, by selected characteristics — National HealthInterview Survey, United States, 2002
Men Women Total(n = 13,332) (n = 17,374) (n = 30,706)
Characteristic % (95% CI†) % (95% CI) % (95% CI)
Race/Ethnicity§
White, non-Hispanic 25.5 (±1.1) 21.8 (±1.0) 23.6 (±0.8)Black, non-Hispanic 27.1 (±2.4) 18.7 (±1.8) 22.4 (±1.6)Hispanic 22.7 (±2.2) 10.8 (±1.3) 16.7 (±1.2)American Indian/Alaska Native¶ 40.5 (±13.9) 40.9 (±12.8) 40.8 (±9.8)Asian** 19.0 (±4.0) 6.5 (±2.2) 13.3 (±2.4)
Education††
0–12 yrs (no diploma) 32.0 (±2.2) 23.8 (±1.8) 27.6 (±1.4)<8 yrs 25.4 (±3.2) 13.5 (±2.2) 19.3 (±2.0)
9–11 yrs 38.1 (±3.7) 30.9 (±2.9) 34.1 (±2.1)12 yrs (no diploma) 32.3 (±6.8) 29.7 (±6.1) 31.0 (±4.4)
GED (diploma)§§ 47.4 (±5.6) 37.2 (±5.0) 42.3 (±3.7)12 yrs (diploma) 29.8 (±2.0) 22.1 (±1.5) 25.6 (±1.3)Associate degree 24.1 (±2.9) 19.6 (±2.2) 21.5 (±1.7)Some college (no degree) 24.8 (±2.2) 21.6 (±1.6) 23.1 (±1.4)Undergraduate degree 13.6 (±1.7) 10.5 (±1.4) 12.1 (±1.1)Graduate degree 7.8 (±1.6) 6.4 (±1.5) 7.2 (±1.1)
Age group (yrs)18–24 32.4 (±2.8) 24.6 (±2.5) 28.5 (±2.0)25–44 28.7 (±1.4) 22.8 (±1.3) 25.7 (±1.0)45–64 24.5 (±1.4) 21.1 (±1.2) 22.7 (±0.9)
>65 10.1 (±1.4) 8.6 (±1.1) 9.3 (±0.8)
Poverty level¶¶
At or above 24.8 (±1.1) 19.7 (±0.9) 22.2 (±0.7)Below 36.9 (±3.3) 30.1 (±2.8) 32.9 (±2.3)Unknown 23.0 (±1.8) 16.9 (±1.3) 19.7 (±1.1)
Total 25.2 (±0.9) 20.0 (±0.8) 22.5 (±0.6)
* Persons who reported smoking >100 cigarettes during their lifetimes and who reported at the time of interview smoking every day or some days. Excludes338 respondents whose smoking status was unknown.
† Confidence interval.§ Excludes 343 respondents of unknown, multiple, and other racial/ethnic categories.¶ Wide variances among estimates reflect small sample sizes.
** Does not include native Hawaiians or other Pacific Islanders.†† Persons aged >25 years. Excludes 369 persons with unknown years of education.§§ General Educational Development.¶¶ Published 2000 poverty thresholds from the U.S. Bureau of the Census were used in these calculations.
430 MMWR May 28, 2004
cessation assistance through Medicaid and Medicare; 2) offer-ing smoking cessation advice and counseling through clinicsthat care for the uninsured; 3) increasing support for smok-ing cessation at work places, particularly for low-income andblue-collar workers; 4) implementing telephone quitlines inall states; and 5) employing more media-based cessation cam-paigns (2,4,5). Expanding the scope of cessation coveragethrough Medicaid, Medicare, and private insurance andensuring that persons without health insurance can obtainmedical assistance to quit smoking is a key strategy to helplow-income smokers quit (4). The lower rates of quittingamong blue-collar workers can be partially explained by thelack of social support for quitting in their work environments(5). Encouraging all employers to implement programs andpolicies supporting smoking cessation can help reduce con-sistently observed disparities in smoking prevalence betweenblue- and white-collar workers (6). In addition, becausetobacco use prevalence is associated with failing or droppingout of high school (7), school-based antismoking programsand policies should target younger students before they leaveschool (8,9). The U.S. Department of Health and HumanServices recently announced a new initiative to increase accessto telephone quitlines. Quitlines provide free counseling andhave been shown to be effective in reaching low-income popu-lations (10). Media campaigns also have been shown to reachlow-income smokers and increase cessation (4,10).
The findings in this report are subject to at least two limita-tions. First, both the wording of NHIS cigarette smokingquestions and NHIS data-collection procedures have changedsince 1993. Because of these changes, trend analyses or com-parisons of data from before 1993 with data collected since1993 should be interpreted with caution. Second, becauseNHIS data for some population subgroups (e.g., American
Indians/Alaska Natives) are small, data for a single year mightbe unreliable. Combining data for several years can producemore accurate estimates for these subpopulations.
National health objectives for 2010 focus on eliminatinghealth disparities among population subgroups (1). Closingthe gap in smoking prevalence among persons of differentsocioeconomic strata will require comprehensive tobacco-control programs that discourage smoking initiation and pro-mote smoking cessation among members of populations athigh risk. Comprehensive tobacco-control programs at local,state, and national levels must ensure that their interventionefforts reach persons with inadequate resources and limitedaccess to health care. Such efforts should address the needs ofthe uninsured (e.g., providing treatment through telephonequitlines and in community health centers), increase coveragefor tobacco-use treatment under both public and privateinsurance, and improve workplace and social environmentsto better support smoking cessation, particularly for low-income and blue-collar workers.References1. U.S. Department of Health and Human Services. Healthy People 2010,
2nd ed. With Understanding and Improving Health and Objectivesfor Improving Health (2 vols.). Washington, DC: U.S. Department ofHealth and Human Services, 2000.
2. U.S. Department of Health and Human Services. Reducing tobaccouse: a report of the Surgeon General. Atlanta, Georgia: U.S. Depart-ment of Health and Human Services, CDC, 2000.
3. Adler NE, Boyce WT, Chesney MA, Folkman S, Syme LS. Socioeco-nomic inequalities in health: no easy solution. JAMA 1993;269:3140–5.
4. CDC. Strategies for reducing exposure to environmental tobaccosmoke, increasing tobacco-use cessation, and reducing initiation incommunities and health-care systems: a report of recommendations ofthe Task Force on Community Preventive Services. MMWR2000;49(No. RR-12).
5. Sorensen G, Barbeau E, Hunt MK, Emmons K. Reducing social dis-parities in tobacco use: a social-contextual model for reducing tobaccouse among blue-collar workers. Am J Public Health 2004;94:230–9.
6. Nelson DE, Emont SL, Brackbill RM, et al. Cigarette smoking preva-lence by occupation in the United States: a comparison between 1978to 1980 and 1987 to 1990. J Occup Med 1994;36:516–25.
FIGURE 2. Trends in the percentage of current cigarette smokingamong persons aged >18 years, by education and year —National Health Interview Survey, United States, 1983–2002
0
10
20
30
40
50<High school graduateHigh school graduateSome collegeCollege graduate
Per
cent
age
Year1983 1985 1987 1989 1991 1993 1995 1997 1999 2001
FIGURE 1. Trends in the percentage of current cigarette smokingamong persons aged >18 years, by poverty level* and year —National Health Interview Survey, United States, 1983–2002
0
10
20
30
40
50Below poverty levelAt or above poverty level
Year
Per
cent
age
1983 1985 1987 1989 1991 1993 1995 1997 1999 2001
* Published 2000 poverty thresholds from the U.S. Bureau of the Censuswere used in these calculations.

Vol. 53 / No. 20 MMWR 431
7. CDC. Youth risk behavior surveillance—National Alternative HighSchool Youth Risk Behavior Survey, United States, 1998. In: CDCSurveillance Summaries (October 29). MMWR 1999;48(No. SS-7).
8. CDC. Best practices for comprehensive tobacco control programs.Atlanta, Georgia: U.S. Department of Health and Human Services,CDC, 1999.
9. National Association of County and City Health Officials. Programand funding guidelines for comprehensive local tobacco control pro-grams. Washington, DC: National Association of County and CityHealth Officials, 2000.
10. Haviland L, Thornton AH, Carothers S, et al. Giving infants a GreatStart: launching a national smoking cessation program for pregnantwomen. Nicotine and Tobacco Research 2004;6:S181–8.
Immunization Registry Progress —United States,
January–December 2002Immunization registries are confidential, computerized
information systems that collect vaccination data within a geo-graphic area (1). By consolidating vaccination records frommultiple health-care providers, generating reminder andrecall notifications, and assessing clinic and vaccination cov-erage, registries serve as key tools to increase and sustain highvaccination coverage (2). One of the national health objec-tives for 2010 is to increase to 95% the proportion of chil-dren aged <6 years who participate (i.e., have two or morevaccinations recorded) in fully operational, population-basedimmunization registries (objective 14.26) (3). This report sum-marizes data from CDC’s 2002 Immunization Registry An-nual Report (2002 IRAR), a survey of registry activity amongimmunization programs in the 50 states and the District ofColumbia (DC) that receive grant funding under section 317bof the Public Health Service Act. These data indicate thatapproximately 43% of children aged <6 years are enrolled in aregistry; achieving the national health objective will requireincreased implementation of functional standards to improvedata quality.
The 2002 IRAR, a self-administered questionnaire, was dis-tributed to immunization program managers as part of theannual reporting requirement. Respondents were asked aboutthe number of children aged <6 years with two or more vacci-nations recorded in an immunization registry and progresstoward implementing the 12 functional standards consideredessential for immunization registry operation (4).
A total of 37 (72%) states* reported operating registries thattarget their entire geographic areas. Seven (14%) other states(California, Georgia, Indiana, Massachusetts, Maryland,Minnesota, and New York) reported operating registries that
target only regions or counties within their geographic areas,and the remaining seven (14%) states (Colorado, Kansas,Kentucky, Nebraska, New Mexico, Vermont, and Wyoming)reported no regional registry activity but were planning orpiloting a statewide system. Nationwide, approximately 43%of U.S. children aged <6 years had two or more vaccinationsrecorded in a grantee registry†. Four (8%) states (Arizona,Mississippi, North Dakota, and South Dakota) reported that>95% of children aged <6 years participated in an immuniza-tion registry (Figure). In the 44 states that operate registriesregionally or statewide, an average of 75% of public vaccina-tion providers and 31% of private providers submitted datato a registry during the last 6 months of 2002. Seven (16%)states (Arkansas, Connecticut, DC, Mississippi, North Dakota,Oregon, and South Dakota) reported that >75% of privatevaccination providers submitted data to a registry.
All 51 immunization programs reported efforts to imple-ment key elements of the 12 functional standards establishedfor immunization registries (Table). Four (8%) states (Ohio,West Virginia, Wisconsin, and Wyoming) reported imple-menting all elements of the 12 functional standards. Seven(14%) other states (Alaska, Arkansas, Delaware, Idaho, Indi-ana, Louisiana, and Minnesota) implemented all elements ofthe functional standards except for exchanging data using theHealth Level 7 (HL7) standard or establishing an immuniza-tion registry record within 6 weeks of birth.Reported by: DL Bartlett, MPH, Immunization Svcs Div, NationalImmunization Program, CDC.
* For this report, DC is considered a state when summary data are presented.
† Estimates of the number of children aged <6 years in the 50 states and DC arebased on 2002 U.S. Census birth estimates.
0%–33%34%–66%67%–94%95%–100%
FIGURE. Percentage of children aged <6 years with two ormore vaccinations recorded in a Public Health Service Act§ 317b immunization registry — United States, 2002

432 MMWR May 28, 2004
Editorial Note: Immunization registries have made progresstoward implementing the 12 immunization registry functionalstandards and enrolling more children and health-care pro-viders in their systems. In 2002, only three functional stan-dards (i.e., receive and process vaccination data within 30 daysof vaccination, access information from the registry at the timeof patient encounter, and produce reminder and recall notifi-cations) reflected no increase in implementation at the statelevel, compared with six standards from the 2001 IRAR (5).In 2002, a total of 36 (71%) states included birth data intheir registries, compared with 32 (63%) states in 2000 (6).
The findings in this report are subject to at least one limita-tion. Data from the 2002 IRAR are self-reported and mightresult in reporting bias, although site visits to certain immu-nization registries have shown high concordance with IRARdata (5).
Because 2002 IRAR data are self-reported by immuniza-tion program managers, efforts are under way to validateresponses using data from the National Immunization Survey(NIS), a random-digit–dialed telephone survey of vaccine pro-viders for children aged 19–35 months that estimates vacci-nation coverage for all 50 states and 28 urban areas (7,8).Although NIS focuses on a narrower age group, it can provideexternal validation to registry data and indicate areas forimproving data quality. NIS also validates child participationin registries because it asks vaccine providers whether theysubmitted any child vaccination information to communityor state immunization registries. In 2002, NIS data for 21,317U.S. children, weighted to represent the U.S. population,indicated that 44% of children aged 19–35 months had theirvaccination records reported to a community or state immu-nization registry, similar to the 43% reported in the 2002 IRARfor children aged <6 years.
NIS data also can be used to assess the completeness of reg-istry data. Three months of 2002 NIS data were comparedwith data from four registries in three states and one cityduring the same period (9,10); the unweighted percentage ofchildren with provider-verified NIS data who had two or morevaccinations logged in the registry ranged from 60% to 88%(9). In all cases, vaccination coverage estimates based on NISprovider-validated data were higher than registry-based data;approximately 40% of children had missing or incompleteregistry information on doses of vaccine (10).
This level of data completeness indicates that registries needto improve data quality so that state and local health authori-ties can reliably calculate vaccination coverage and measureparticipation in immunization registries. Efforts are under wayto develop additional tools to improve data quality; in 2002,CDC provided a tool to assess computer algorithms that pre-vent duplicate records in registry databases. For the 2002IRAR, eight states and New York City reported performingthis data quality test.
Registries also must improve functional and technicalcapacity to provide reliable evaluations and encourage datause by health-care providers and public health managers. In2002, the National Immunization Program’s Technical Work-ing Group created Immunization Registry Certification guide-lines for validating improvements to immunization registryfunctional standards and identifying registries with accept-able levels of technical capability. Additional information isavailable at http://www.cdc.gov/nip/registry; by telephone,800-799-7062; or by e-mail, [email protected]. National Vaccine Advisory Committee. Development of community
and state-based immunization registries: report of the National Vac-cine Advisory Committee (NVAC). Atlanta, Georgia: U.S. Depart-ment of Health and Human Services, CDC, 1999. Available athttp://www.cdc.gov/nip/registry/nvac.htm.
TABLE. Number and percentage of 51 grantee immunization registries that implemented key elements of the 12 functionalstandards, by standard — United States, 2002
Registries meeting Registries meeting atall key elements least two key elements
Functional standard No. (%) No. (%)
Electronically store data on all National Vaccine Advisory Committee–approved core data elements 32 (63) 47 (92)Establish a registry record within 6 weeks of birth for each newborn child born in the catchment area 31 (61) 31 (61)Enable access to vaccine information from the registry at the time of encounter 43 (84) 43 (84)Receive and process information within 30 days of vaccine administration 41 (80) 41 (80)Protect the confidentiality of medical information 27 (53) 36 (71)Ensure the security of medical information 26 (51) 30 (59)Exchange vaccination records by using Health Level 7 standards 11 (22) 11 (22)Automatically determine the vaccination(s) needed when a person is seen for a scheduled vaccination 40 (78) 40 (78)Automatically identify persons due or late for vaccinations to enable the production of reminder andrecall notifications 37 (73) 37 (73)
Automatically produce vaccination coverage reports by providers, age groups, and geographic areas 34 (67) 39 (76)Produce authorized vaccination records 41 (80) 41 (80)Promote accuracy and completeness of registry data 42 (82) 42 (82)
Vol. 53 / No. 20 MMWR 433
2. Linkins RW. Immunization registries: progress and challenges in reach-ing the 2010 national objective. J Public Health Management Practice2001;7:67–74.
3. U.S. Department of Health and Human Services. Healthy People 2010,2nd ed. With Understanding and Improving Health and Objectivesfor Improving Health (2 vols.). Washington, DC: U.S. Department ofHealth and Human Services, 2000.
4. CDC. Immunization registry minimum functional standards. Avail-able at http://www.cdc.gov/nip/registry/min-funct-stds2001.htm.
5. CDC. Immunization registry progress—United States, 2002. MMWR2002;51:760–2.
6. CDC. Immunization registry use and progress—United States, 2001.MMWR 2002;51:53–6.
7. Zell ER, Ezzati-Rice TM, Battaglia MP, Wright RA. National Immu-nization Survey: the methodology of an immunization surveillance sys-tem. Public Health Rep 2000;115:65–77.
8. Smith PJ, Battaglia MP, Huggins VJ, et al. Overview of the samplingdesign and statistical methods used in the National ImmunizationSurvey. Am J Prev Med 2001;40:17–24.
9. Barker L. The National Immunization Survey/registry data compari-son. Presented at the 2003 Immunization Registry Conference, Atlanta,Georgia, October 27–29, 2003.
10. Khare M, Piccinino L, Battaglia MP, Linkins R. Immunization regis-tries as supplemental sources of data for improving vaccination cover-age estimates in the U.S. Presented at the 2003 Immunization RegistryConference, Atlanta, Georgia, October 27–29, 2003.
Wild Poliovirus Importations —West and Central Africa,
January 2003–March 2004Since the 1988 World Health Assembly resolution to eradi-
cate poliomyelitis (1), three World Health Organization(WHO) regions (Americas, European, and Western Pacific)have been certified polio-free, and the number of countrieswith endemic polio has decreased from 125 in 1988 to six in2003 (Afghanistan, Egypt, India, Niger, Nigeria, and Paki-stan). During January 2003–March 2004, importations of wildpoliovirus (WPV) occurred in eight countries that were pre-viously polio-free: five in the West African block* (Benin,Burkina Faso, Côte d’Ivoire, Ghana, and Togo) and three inthe Central African block (Cameroon, Central AfricanRepublic, and Chad), resulting in 63 polio cases (2,3). Thisreport summarizes the 1) investigation and response to theseWPV importations and 2) progress toward polio eradicationin West and Central Africa.
Routine and Supplementary ImmunizationIn 2002, reported routine coverage with 3 doses of oral
poliovirus vaccine (OPV) varied from 13% to 93% for coun-tries in West and Central Africa, excluding Ghana†. All Westand Central African countries conducted supplementaryimmunization activities (SIAs) annually during 1999–2002.In 2002, all except Algeria conducted National Immuniza-tion Days (NIDs)§, vaccinating approximately 30.6 millionchildren aged <5 years with >2 doses of OPV.
Acute Flaccid Paralysis (AFP) SurveillanceAFP surveillance quality is evaluated by two key indicators:
1) annual reporting rate (target: nonpolio AFP rate of morethan one case per 100,000 children aged <15 years) and2) completeness of specimen collection (target: two adequatestool specimens from >80% of all persons with AFP). In 2002,these targets were met by all but six West and Central Africancountries (Algeria, Cape Verde, Chad, Equatorial Guinea,Gambia, and Sao Tome and Principe). In 2003, the numberof countries not meeting the targets increased to eight (Alge-ria, Cameroon, Cape Verde, Chad, Ghana, Liberia, Niger, andSao Tome and Principe).
WPV Importation and SpreadDuring January 2003–March 2004, a total of 63 cases of
polio resulted from importation of WPV into the previouslypolio-free countries of West and Central Africa (Table). Allimported viruses were type 1 and could be traced to commonancestral strains that circulate in endemic reservoirs shared bynorthern Nigeria and southern Niger (Figure). During thissame period, Nigeria and Niger have reported 497 cases ofinfection with WPV type 1 or type 3, with cross-border trans-mission of both serotypes between the two countries. Of the63 polio cases resulting from importation of WPV, 48 (76%)occurred during June–December 2003, coinciding with thepeak transmission of indigenous WPV type 1 in Nigeria andNiger.
East of Nigeria, the first importation occurred in Chad inAugust 2003 from northeastern Nigeria, leading to anoutbreak of 29 cases¶. The outbreak spread to the adjacentcountries of Cameroon (two cases) and the Central AfricanRepublic (one case) during October–December. The contin-ued circulation of virus after importation suggests that Chad
* The African regional office of WHO has divided its member states into fourblocks (East, Central, South, and West) plus Angola, Democratic Republic ofthe Congo, Ethiopia, and Nigeria. The Central African countries are as follows:Cameroon, Central African Republic, Chad, Congo, Equatorial Guinea, Gabon,and Sao Tome and Principe. The West African countries are as follows: Algeria,Benin, Burkina Faso, Cape Verde, Côte d’Ivoire, Gambia, Ghana, Guinea,Guinea-Bissau, Liberia, Mali, Mauritania, Niger, Senegal, Sierra Leone, andTogo.
† Ghana reported 120% coverage.§ Nationwide mass campaigns during a short period (usually a few days) in which
2 doses of OPV are administered to all children (usually aged <5 years), regardlessof previous vaccination history, with an interval of 4–6 weeks between doses.
¶ As of May 4, 2004.
434 MMWR May 28, 2004
is at high risk for reestablishment of endemic poliovirus trans-mission.
West of Nigeria, three independent importations into Benin(five cases) occurred from different parts of Nigeria from late2003 to early 2004. In addition, genetic sequencing dataindicated that after a 2002 importation into Burkina Faso, inearly 2003, WPV spread to Ghana. In 2003, closely relatedstrains continued to circulate in Ghana (eight cases) and, dur-ing 2003–2004, in Burkina Faso (13 cases). The WPV strainsisolated in Côte d’Ivoire (four cases) and Togo (one case) werelinked genetically to the strains circulating in Burkina Fasoand Ghana, indicating spread of poliovirus from Burkina Fasoand possibly Ghana. These data suggest that independent
circulation of WPV might have been reestablished in BurkinaFaso during 2003 and early 2004.
Among the 63 patients with WPV, 13% were aged<12 months, 21% were aged 12–23 months, 49% were aged24–59 months, and 17% were aged >59 months. Of the52 patients with known vaccination status, 16 (31%) had neverreceived OPV, 26 (50%) had received 1–2 OPV doses, and10 (19%) had received >3 OPV doses.
Response to WPV ImportationInvestigations were initiated within 2 days of identifying
the index patients in four of the eight countries (median:4 days; range: 1–22 days). Clinical and epidemiologic infor-mation was verified, stool specimens were collected fromimmediate contacts, and the search for unreported AFP caseswas intensified. Two of the eight index patients in the eightcountries had traveled recently to a country with endemicpolio, whereas the remaining six patients had no relevant travelhistory or immediate contact with persons who traveled to acountry where polio is endemic. All index patients lived nearcommercial centers with substantial foreign trade withcountries where polio is endemic.
All eight countries implemented SIAs in response to detec-tion of imported WPV. The median duration from onset ofparalysis to the start of SIAs was 12.5 weeks (range: 6–17weeks). The magnitude of the response varied; four countriesconducted NIDs, two countries conducted subnationalimmunization days** (SNIDs), and two countries conductedboth SNIDs and NIDs. These campaigns provided approxi-mately 21.7 million children aged <5 years with >2 doses ofOPV.
Reported vaccination coverage exceeded 90% for all SIAsconducted; reported coverage at district level ranged from48% to >100%. To determine the proportion of previously
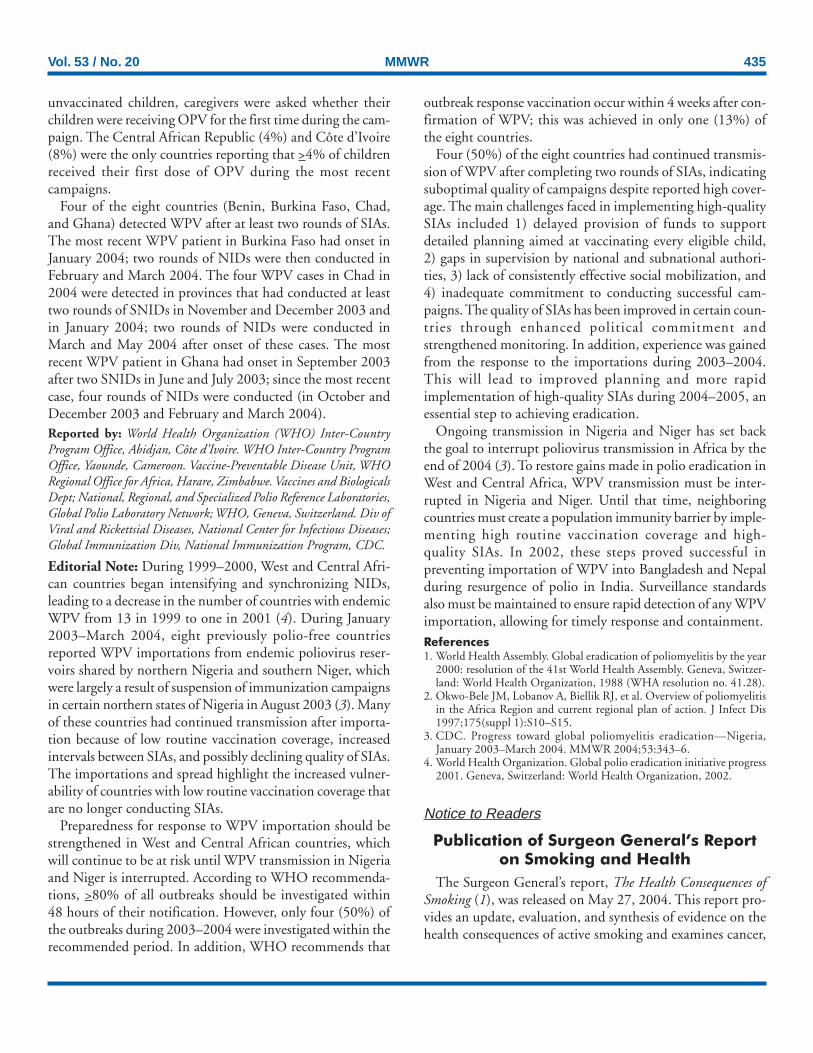
FIGURE. Endemic wild poliovirus (WPV) type 1 and type 3 inNigeria and Niger and spread* of WPV type 1 to eightneighboring countries, January 2003–March 2004
* During 2001–2002, WPV spread from southern Niger to Burkina Faso, fromwhere, in 2003, it later spread to Ghana, Togo, and Côte d’Ivoire. In 2003,genetically distinct WPV spread from northeastern Nigeria into Chad, andthen into Cameroon and the Central African Republic. WPV from two areasin northern Nigeria was independently introduced into Benin during 2003–2004.
Case related to importationEndemic case
Côte d’Ivoire Ghana Togo
Ben
in
Burkina Faso
Nigeria
Cameroon
Central AfricaRepublic
Chad
Niger
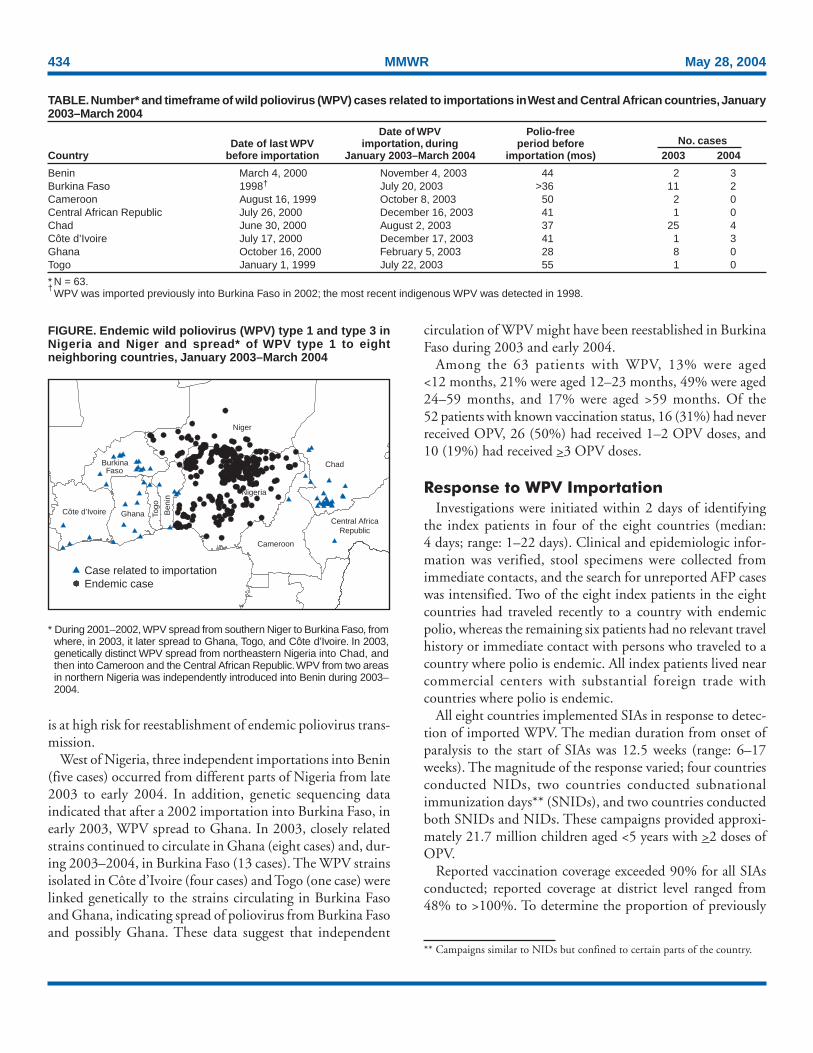
TABLE. Number* and timeframe of wild poliovirus (WPV) cases related to importations in West and Central African countries, January2003–March 2004
Date of WPV Polio-freeDate of last WPV importation, during period before No. cases
Country before importation January 2003–March 2004 importation (mos) 2003 2004
Benin March 4, 2000 November 4, 2003 44 2 3Burkina Faso 1998† July 20, 2003 >36 11 2Cameroon August 16, 1999 October 8, 2003 50 2 0Central African Republic July 26, 2000 December 16, 2003 41 1 0Chad June 30, 2000 August 2, 2003 37 25 4Côte d’Ivoire July 17, 2000 December 17, 2003 41 1 3Ghana October 16, 2000 February 5, 2003 28 8 0Togo January 1, 1999 July 22, 2003 55 1 0
* N = 63.†
WPV was imported previously into Burkina Faso in 2002; the most recent indigenous WPV was detected in 1998.
** Campaigns similar to NIDs but confined to certain parts of the country.
Vol. 53 / No. 20 MMWR 435
unvaccinated children, caregivers were asked whether theirchildren were receiving OPV for the first time during the cam-paign. The Central African Republic (4%) and Côte d’Ivoire(8%) were the only countries reporting that >4% of childrenreceived their first dose of OPV during the most recentcampaigns.
Four of the eight countries (Benin, Burkina Faso, Chad,and Ghana) detected WPV after at least two rounds of SIAs.The most recent WPV patient in Burkina Faso had onset inJanuary 2004; two rounds of NIDs were then conducted inFebruary and March 2004. The four WPV cases in Chad in2004 were detected in provinces that had conducted at leasttwo rounds of SNIDs in November and December 2003 andin January 2004; two rounds of NIDs were conducted inMarch and May 2004 after onset of these cases. The mostrecent WPV patient in Ghana had onset in September 2003after two SNIDs in June and July 2003; since the most recentcase, four rounds of NIDs were conducted (in October andDecember 2003 and February and March 2004).Reported by: World Health Organization (WHO) Inter-CountryProgram Office, Abidjan, Côte d’Ivoire. WHO Inter-Country ProgramOffice, Yaounde, Cameroon. Vaccine-Preventable Disease Unit, WHORegional Office for Africa, Harare, Zimbabwe. Vaccines and BiologicalsDept; National, Regional, and Specialized Polio Reference Laboratories,Global Polio Laboratory Network; WHO, Geneva, Switzerland. Div ofViral and Rickettsial Diseases, National Center for Infectious Diseases;Global Immunization Div, National Immunization Program, CDC.
Editorial Note: During 1999–2000, West and Central Afri-can countries began intensifying and synchronizing NIDs,leading to a decrease in the number of countries with endemicWPV from 13 in 1999 to one in 2001 (4). During January2003–March 2004, eight previously polio-free countriesreported WPV importations from endemic poliovirus reser-voirs shared by northern Nigeria and southern Niger, whichwere largely a result of suspension of immunization campaignsin certain northern states of Nigeria in August 2003 (3). Manyof these countries had continued transmission after importa-tion because of low routine vaccination coverage, increasedintervals between SIAs, and possibly declining quality of SIAs.The importations and spread highlight the increased vulner-ability of countries with low routine vaccination coverage thatare no longer conducting SIAs.
Preparedness for response to WPV importation should bestrengthened in West and Central African countries, whichwill continue to be at risk until WPV transmission in Nigeriaand Niger is interrupted. According to WHO recommenda-tions, >80% of all outbreaks should be investigated within48 hours of their notification. However, only four (50%) ofthe outbreaks during 2003–2004 were investigated within therecommended period. In addition, WHO recommends that
outbreak response vaccination occur within 4 weeks after con-firmation of WPV; this was achieved in only one (13%) ofthe eight countries.
Four (50%) of the eight countries had continued transmis-sion of WPV after completing two rounds of SIAs, indicatingsuboptimal quality of campaigns despite reported high cover-age. The main challenges faced in implementing high-qualitySIAs included 1) delayed provision of funds to supportdetailed planning aimed at vaccinating every eligible child,2) gaps in supervision by national and subnational authori-ties, 3) lack of consistently effective social mobilization, and4) inadequate commitment to conducting successful cam-paigns. The quality of SIAs has been improved in certain coun-tries through enhanced political commitment andstrengthened monitoring. In addition, experience was gainedfrom the response to the importations during 2003–2004.This will lead to improved planning and more rapidimplementation of high-quality SIAs during 2004–2005, anessential step to achieving eradication.
Ongoing transmission in Nigeria and Niger has set backthe goal to interrupt poliovirus transmission in Africa by theend of 2004 (3). To restore gains made in polio eradication inWest and Central Africa, WPV transmission must be inter-rupted in Nigeria and Niger. Until that time, neighboringcountries must create a population immunity barrier by imple-menting high routine vaccination coverage and high-quality SIAs. In 2002, these steps proved successful inpreventing importation of WPV into Bangladesh and Nepalduring resurgence of polio in India. Surveillance standardsalso must be maintained to ensure rapid detection of any WPVimportation, allowing for timely response and containment.References1. World Health Assembly. Global eradication of poliomyelitis by the year
2000: resolution of the 41st World Health Assembly. Geneva, Switzer-land: World Health Organization, 1988 (WHA resolution no. 41.28).
2. Okwo-Bele JM, Lobanov A, Biellik RJ, et al. Overview of poliomyelitisin the Africa Region and current regional plan of action. J Infect Dis1997;175(suppl 1):S10–S15.
3. CDC. Progress toward global poliomyelitis eradication—Nigeria,January 2003–March 2004. MMWR 2004;53:343–6.
4. World Health Organization. Global polio eradication initiative progress2001. Geneva, Switzerland: World Health Organization, 2002.
Notice to Readers
Publication of Surgeon General’s Reporton Smoking and Health
The Surgeon General’s report, The Health Consequences ofSmoking (1), was released on May 27, 2004. This report pro-vides an update, evaluation, and synthesis of evidence on thehealth consequences of active smoking and examines cancer,

436 MMWR May 28, 2004
cardiovascular diseases, respiratory diseases, and adversereproductive and other effects.
The four major conclusions of the report are 1) smokingharms nearly every organ of the body, causing many diseasesand reducing the health of smokers in general; 2) quittingsmoking has immediate as well as long-term benefits, reduc-ing risks for diseases caused by smoking and improving healthin general; 3) smoking cigarettes with lower machine-measured yields of tar and nicotine provides no clear benefitto health; and 4) the list of diseases caused by smoking hasbeen expanded to include abdominal aortic aneurysm, acutemyeloid leukemia, cataract, cervical cancer, kidney cancer,pancreatic cancer, pneumonia, periodontitis, and stomachcancer.
Additional information about the Surgeon General’s reportand a free copy of the executive summary are available fromCDC’s Office on Smoking and Health, National Center forChronic Disease Prevention and Health Promotion at mailstopK-50, 4770 Buford Highway, N.E., Atlanta, Georgia 30341-3724 or by telephone, 770-488-5705 (press “3” for a publi-cations specialist). Copies of the full report (stock no.017-023-00211-2) can be purchased from the Superinten-dent of Documents, U.S. Government Printing Office, P.O.Box 371954, Pittsburgh, Pennsylvania 15250-7954; by toll-free telephone, 866-512-1800; or at http://bookstore.gpo.gov.The full report, executive summary, and the consumer-oriented publication, The Health Consequences of Smoking —What It Means To You, can also be downloaded from http://www.cdc.gov/tobacco.Reference1. U.S. Department of Health and Human Services. The health conse-
quences of smoking: a report of the Surgeon General. Atlanta, Georgia:U.S. Department of Health and Human Services, CDC, National Cen-ter for Chronic Disease Prevention and Health Promotion, Office onSmoking and Health, 2004.
Notice to Readers
Buckle Up America! Week, May 24–31, 2004
Motor-vehicle crashes are a leading cause of death overalland the most common cause of death among children andyoung adults in the United States. During 2002, a total of
42,815 persons died in motor-vehicle crashes; of these, morethan half were not wearing safety belts (1). Enactment andenforcement of safety-belt laws are the most effective meansof reducing crash-related deaths and serious injuries, savingan estimated 14,000 lives in 2002.
Age is a key predictor of safety-belt use. In 2002, prevalenceof safety-seat or safety-belt restraint use was 99% for infants,94% for toddlers, 83% for children aged 4–7 years, 82%among youths aged 8–15 years, and 69% among persons aged16–24 years (2). The national rate of usage overall increasedto 79% in 2003, an improvement of 4% since the precedingyear (3). Greater safety-belt use has potential for saving lives,preventing injuries, and reducing economic costs associatedwith traffic crashes.
Buckle Up America! Week includes efforts to promote properuse of safety belts and child safety seats in the United Statesand move toward the National Highway Traffic SafetyAdministration’s goal of 90% usage by 2005 (4) and thenational health objective of 92% usage by 2010 (5). Safety-belt use is the most effective means of reducing fatal and non-fatal injuries in motor-vehicle crashes. Information aboutmotor-vehicle injury prevention is available from CDC’sNational Center for Injury Prevention and Control at http://www.cdc.gov/ncipc. Information regarding Buckle UpAmerica! Week activities is available at http://www.buckleupamerica.org.References1. National Highway Traffic Safety Administration. Traffic safety facts 2002:
a compilation of motor vehicle crash data from the Fatality AnalysisReporting System and the General Estimates System. Washington, DC:U.S. Department of Transportation, 2004; publication no. DOT-HS-809-620. Available at http://www-nrd.nhtsa.dot.gov/pdf/nrd-30/ncsa/tsfann/tsf2002final.pdf.
2. National Highway Traffic Safety Administration. Traffic safety facts 2002:children. Washington, DC: U.S. Department of Transportation, 2004;publication no. DOT-HS-809-607.
3. National Highway Traffic Safety Administration. Safety belt use in 2003.Washington, DC: U.S. Department of Transportation, 2004; publica-tion no. DOT-HS-809-646.
4. National Highway Traffic Safety Administration. Presidential initiativefor increasing seat belt use nationwide: recommendations from the Sec-retary of Transportation. Washington, DC: U.S Department of Trans-portation, 1997; publication no. DOT-HS-808-576.
5. U.S. Department of Health and Human Services. Healthy People 2010(conference ed., 2 vols.). Washington, DC: U.S. Department of Healthand Human Services, 2000.

Vol. 53 / No. 20 MMWR 437
* No rubella cases were reported for the current 4-week period yielding a ratio for week 20 of zero (0).† Ratio of current 4-week total to mean of 15 4-week totals (from previous, comparable, and subsequent 4-week periods for the past 5 years). The point where the hatched area
begins is based on the mean and two standard deviations of these 4-week totals.
-: No reported cases.* Incidence data for reporting years 2003 and 2004 are provisional and cumulative (year-to-date).†
Not notifiable in all states.§
Updated monthly from reports to the Division of HIV/AIDS Prevention — Surveillance and Epidemiology, National Center for HIV, STD, and TB Prevention.Last update March 26, 2004.
¶Of nine cases reported, five were indigenous, and four were imported from another country.
** Of 22 cases reported, 16 were indigenous, and six were imported from another country.††
Updated weekly from reports to the Division of Viral and Rickettsial Diseases, National Center for Infectious Diseases (notifiable as of July 2003).§§
Not previously notifiable.
TABLE I. Summary of provisional cases of selected notifiable diseases, United States, cumulative, week ending May 22, 2004 (20th Week)*
Cum. Cum. Cum. Cum.2004 2003 2004 2003
Anthrax - - Hemolytic uremic syndrome, postdiarrheal† 25 42Botulism: - - HIV infection, pediatric†§ 52 86
foodborne 6 6 Measles, total 9¶ 22**infant 23 29 Mumps 65 81other (wound & unspecified 4 7 Plague - -
Brucellosis† 30 33 Poliomyelitis, paralytic - -Chancroid 11 25 Psittacosis† 2 5Cholera 2 1 Q fever† 12 27Cyclosporiasis† 42 14 Rabies, human 1 -Diphtheria - - Rubella 10 4Ehrlichiosis: - - Rubella, congenital syndrome - 1
human granulocytic (HGE)† 19 25 SARS-associated coronavirus disease† †† - 5human monocytic (HME)† 17 22 Smallpox† §§ - NAhuman, other and unspecified - 5 Staphylococcus aureus: - -
Encephalitis/Meningitis: - - Vancomycin-intermediate (VISA)† §§ 4 NACalifornia serogroup viral† 1 - Vancomycin-resistant (VRSA)† §§ - 1eastern equine† - - Streptococcal toxic-shock syndrome† 41 87Powassan† - - Tetanus 3 3St. Louis† 1 1 Toxic-shock syndrome 44 57western equine† - - Trichinosis 4 -
Hansen disease (leprosy)† 27 31 Tularemia† 11 5Hantavirus pulmonary syndrome† 4 6 Yellow fever - -
FIGURE I. Selected notifiable disease reports, United States, comparison of provisional 4-week totals May 22, 2004, with historicaldata
DISEASE DECREASE INCREASECASES CURRENT
4 WEEKS
Ratio (Log scale)†
Beyond historical limits
4210.50.250.125
218
294
39
39
1
57
11
412
0
Hepatitis A, acute
Hepatitis B, acute
Hepatitis C, acute
Legionellosis
Measles, total
Mumps
Pertussis
Rubella
Meningococcal disease
0.06250.03125
*

438 MMWR May 28, 2004
N: Not notifiable. U: Unavailable. -: No reported cases. C.N.M.I.: Commonwealth of Northern Mariana Islands.* Incidence data for reporting years 2003 and 2004 are provisional and cumulative (year-to-date).† Chlamydia refers to genital infections caused by C. trachomatis.§ Updated monthly from reports to the Division of HIV/AIDS Prevention — Surveillance and Epidemiology, National Center for HIV, STD, and TB Prevention. Last update
March 26, 2004.¶ Contains data reported through National Electronic Disease Surveillance System (NEDSS).
TABLE II. Provisional cases of selected notifiable diseases, United States, weeks ending May 22, 2004, and May 17, 2003(20th Week)*
Encephalitis/MeningitisAIDS Chlamydia† Coccidiodomycosis Cryptosporidiosis West Nile
Cum. Cum. Cum. Cum. Cum. Cum. Cum. Cum. Cum. Cum.Reporting area 2004§ 2003 2004 2003 2004 2003 2004 2003 2004 2003
UNITED STATES 8,989 15,309 311,294 330,202 1,803 1,259 838 729 4 -
NEW ENGLAND 312 499 10,559 10,599 - - 52 46 - -Maine 5 23 690 731 N N 9 3 - -N.H. 11 12 593 599 - - 14 7 - -Vt. 8 6 373 393 - - 6 7 - -Mass. 84 226 5,350 3,998 - - 16 22 - -R.I. 32 38 1,295 1,235 - - 1 5 - -Conn. 172 194 2,258 3,643 N N 6 2 - -
MID. ATLANTIC 1,286 3,333 42,320 39,990 - - 136 110 - -Upstate N.Y. 134 182 8,480 7,210 N N 31 25 - -N.Y. City 380 1,627 11,794 13,551 - - 29 42 - -N.J. 387 595 5,121 5,745 - - 9 4 - -Pa. 385 929 16,925 13,484 N N 67 39 - -
E.N. CENTRAL 809 1,390 52,329 61,269 5 3 193 178 - -Ohio 231 228 11,628 16,742 - - 53 23 - -Ind. 118 224 6,929 6,486 N N 30 16 - -Ill. 279 595 13,584 19,034 - - 13 30 - -Mich. 132 277 15,261 12,405 5 3 47 33 - -Wis. 49 66 4,927 6,602 - - 50 76 - -
W.N. CENTRAL 228 288 18,271 18,945 4 2 95 68 1 -Minn. 48 56 3,358 4,181 N N 40 34 - -Iowa 11 34 1,087 1,957 N N 14 10 - -Mo. 107 139 7,473 6,912 3 1 17 6 1 -N. Dak. 10 - 555 528 N N - 2 - -S. Dak. - 6 944 922 - - 10 12 - -Nebr.¶ 6 22 1,967 1,753 1 1 3 3 - -Kans. 46 31 2,887 2,692 N N 11 1 - -
S. ATLANTIC 3,515 4,482 58,393 61,143 - 1 169 98 2 -Del. 42 80 1,141 2,392 N N - 1 - -Md. 343 411 7,346 6,274 - 1 9 8 - -D.C. 149 476 1,389 1,305 - - 2 - - -Va. 141 421 8,749 6,927 - - 22 11 - -W. Va. 30 32 1,080 985 N N 2 - - -N.C. 243 504 10,639 9,092 N N 31 12 - -S.C.¶ 205 311 6,579 5,139 - - 7 2 2 -Ga. 509 609 5,925 12,993 - - 51 36 - -Fla. 1,853 1,638 15,545 16,036 N N 45 28 - -
E.S. CENTRAL 448 621 19,715 21,246 N N 36 45 - -Ky. 42 67 2,121 3,197 N N 9 9 - -Tenn. 189 269 8,594 7,362 N N 12 13 - -Ala. 127 144 4,138 5,752 - - 9 20 - -Miss. 90 141 4,862 4,935 N N 6 3 - -
W.S. CENTRAL 1,309 1,634 40,133 40,783 2 - 23 16 1 -Ark. 43 47 2,951 2,751 1 - 8 2 - -La. 281 192 10,049 7,416 1 - - 1 1 -Okla. 37 74 3,832 3,947 N N 7 3 - -Tex. 948 1,321 23,301 26,669 - - 8 10 - -
MOUNTAIN 259 586 15,849 19,840 1,161 855 42 34 - -Mont. - 8 749 934 N N 4 7 - -Idaho 2 10 1,191 953 N N 4 6 - -Wyo. 2 4 425 397 - - 2 1 - -Colo. 48 127 2,924 5,008 N N 23 6 - -N. Mex. 20 42 2,298 2,827 9 2 1 1 - -Ariz. 109 274 5,660 6,027 1,118 835 6 2 - -Utah 19 29 845 1,376 12 3 1 8 - -Nev. 59 92 1,757 2,318 22 15 1 3 - -
PACIFIC 823 2,476 53,725 56,387 629 397 92 134 - -Wash. 127 178 6,608 6,050 N N 9 12 - -Oreg. 53 108 2,069 2,978 - - 11 15 - -Calif. 604 2,148 42,863 43,829 629 397 71 107 - -Alaska 8 9 1,434 1,446 - - - - - -Hawaii 31 33 751 2,084 - - 1 - - -
Guam 1 1 - - - - - - - -P.R. 143 437 594 824 N N N N - -V.I. 2 13 20 127 - - - - - -Amer. Samoa U U U U U U U U U UC.N.M.I. 2 U 32 U - U - U - U

Vol. 53 / No. 20 MMWR 439
N: Not notifiable. U: Unavailable. - : No reported cases.* Incidence data for reporting years 2003 and 2004 are provisional and cumulative (year-to-date).
TABLE II. (Continued) Provisional cases of selected notifiable diseases, United States, weeks ending May 22, 2004, and May 17, 2003(20th Week)*
Escherichia coli, Enterohemorrhagic (EHEC)Shiga toxin positive, Shiga toxin positive,
O157:H7 serogroup non-O157 not serogrouped Giardiasis GonorrheaCum. Cum. Cum. Cum. Cum. Cum. Cum. Cum. Cum. Cum.
Reporting area 2004 2003 2004 2003 2004 2003 2004 2003 2004 2003
UNITED STATES 393 407 55 76 46 32 5,305 5,794 107,450 122,648
NEW ENGLAND 27 24 16 13 6 2 470 434 2,467 2,657Maine - 3 - - - - 47 43 100 81N.H. 4 6 2 1 - - 13 19 51 47Vt. - - - - - - 39 33 29 33Mass. 10 6 2 5 6 2 253 213 1,245 995R.I. 2 1 - - - - 37 42 349 365Conn. 11 8 12 7 - - 81 84 693 1,136
MID. ATLANTIC 31 48 2 6 12 10 1,213 1,214 13,405 15,528Upstate N.Y. 10 16 1 3 4 5 382 292 2,800 2,674N.Y. City 4 3 - - - - 372 460 3,761 5,128N.J. 5 5 1 - 4 - 119 172 2,048 3,460Pa. 12 24 - 3 4 5 340 290 4,796 4,266
E.N. CENTRAL 68 107 12 16 4 6 651 1,045 20,799 26,410Ohio 19 24 1 9 4 6 271 304 5,541 8,592Ind. 8 12 - - - - - - 2,385 2,454Ill. 14 20 - 1 - - 84 315 5,661 8,140Mich. 12 20 2 - - - 196 248 5,873 4,979Wis. 15 31 9 6 - - 100 178 1,339 2,245
W.N. CENTRAL 67 54 7 7 9 6 630 570 5,869 6,242Minn. 25 20 3 6 2 - 205 190 1,205 1,014Iowa 11 7 - - - - 94 80 160 414Mo. 10 17 4 1 2 - 175 170 2,984 3,185N. Dak. 2 1 - - 3 1 11 16 50 25S. Dak. 2 2 - - - - 19 17 100 64Nebr. 8 4 - - - - 53 49 392 578Kans. 9 3 - - 2 5 73 48 978 962
S. ATLANTIC 35 28 13 22 7 1 817 863 25,936 29,810Del. - - N N N N 20 15 364 934Md. 4 1 - - 1 1 34 44 3,110 2,903D.C. 1 1 - - - - 25 14 950 938Va. 1 8 6 1 - - 138 98 3,517 3,234W. Va. 1 1 - - - - 12 10 323 323N.C. - - 4 10 - - N N 5,559 5,152S.C. 1 - - - - - 17 45 3,003 2,994Ga. 11 6 1 2 - - 192 280 2,712 6,261Fla. 16 11 2 9 6 - 379 357 6,398 7,071
E.S. CENTRAL 17 21 1 - 6 4 112 115 8,559 10,348Ky. 8 8 1 - 4 4 N N 897 1,335Tenn. 3 9 - - 2 - 52 51 3,049 3,039Ala. 2 3 - - - - 60 64 2,407 3,449Miss. 4 1 - - - - - - 2,206 2,525
W.S. CENTRAL 20 18 - 2 1 - 98 91 14,891 16,294Ark. 4 2 - - - - 44 49 1,382 1,438La. - 1 - - - - 12 6 4,551 4,147Okla. 4 2 - - - - 42 36 1,647 1,525Tex. 12 13 - 2 1 - - - 7,311 9,184
MOUNTAIN 63 42 3 8 1 3 454 454 3,737 4,153Mont. 2 1 - - - - 15 22 30 55Idaho 12 12 1 4 - - 64 58 34 30Wyo. - 1 - - - - 5 6 22 19Colo. 25 14 1 1 1 3 151 128 948 1,130N. Mex. 4 1 - 3 - - 21 18 267 466Ariz. 7 9 N N N N 72 80 1,598 1,585Utah 8 3 - - - - 91 97 102 138Nev. 5 1 1 - - - 35 45 736 730
PACIFIC 65 65 1 2 - - 860 1,008 11,787 11,206Wash. 19 19 - 1 - - 99 86 979 1,119Oreg. 11 8 1 1 - - 150 119 265 368Calif. 29 37 - - - - 554 735 10,133 9,111Alaska 1 1 - - - - 25 31 240 201Hawaii 5 - - - - - 32 37 170 407
Guam N N - - - - - - - -P.R. - 1 - - - - 8 43 57 92V.I. - - - - - - - - 4 37Amer. Samoa U U U U U U U U U UC.N.M.I. - U - U - U - U 3 U

440 MMWR May 28, 2004
N: Not notifiable. U: Unavailable. -: No reported cases.* Incidence data for reporting years 2003 and 2004 are provisional and cumulative (year-to-date).
TABLE II. (Continued) Provisional cases of selected notifiable diseases, United States, weeks ending May 22, 2004, and May 17, 2003(20th Week)*
Haemophilus influenzae, invasive Hepatitis
All ages Age <5 years (viral, acute), by type
All serotypes Serotype b Non-serotype b Unknown serotype ACum. Cum. Cum. Cum. Cum. Cum. Cum. Cum. Cum. Cum.
Reporting area 2004 2003 2004 2003 2004 2003 2004 2003 2004 2003
UNITED STATES 797 721 7 10 42 54 92 87 2,047 2,393
NEW ENGLAND 72 51 1 1 4 4 3 3 357 98Maine 7 2 - - - - - 1 8 1N.H. 12 5 - - 2 - - - 7 6Vt. 5 6 - - - - 1 - 5 4Mass. 30 25 1 1 - 4 2 1 302 50R.I. 2 2 - - - - - 1 6 10Conn. 16 11 - - 2 - - - 29 27
MID. ATLANTIC 161 124 - - 3 1 24 18 240 506Upstate N.Y. 58 37 - - 3 1 3 4 33 38N.Y. City 32 22 - - - - 7 5 80 187N.J. 25 27 - - - - 2 3 51 84Pa. 46 38 - - - - 12 6 76 197
E.N. CENTRAL 118 126 - 1 10 4 17 24 186 228Ohio 58 34 - - 2 - 10 7 22 37Ind. 20 21 - - 4 2 1 - 15 15Ill. 19 52 - - - - 5 14 69 75Mich. 9 7 - 1 4 2 - - 63 75Wis. 12 12 - - - - 1 3 17 26
W.N. CENTRAL 42 46 1 - 2 5 3 5 64 63Minn. 14 18 - - 2 5 - - 10 14Iowa 1 - 1 - - - - - 19 13Mo. 14 18 - - - - 2 5 19 19N. Dak. 3 1 - - - - - - 1 -S. Dak. - 1 - - - - - - 2 -Nebr. 5 - - - - - - - 7 4Kans. 5 8 - - - - 1 - 6 13
S. ATLANTIC 191 146 - - 9 6 16 9 375 556Del. 7 - - - - - 2 - 3 4Md. 35 35 - - 2 4 - - 59 52D.C. - - - - - - - - 3 17Va. 17 15 - - - - 1 3 33 35W. Va. 8 3 - - - - 3 - 2 6N.C. 24 10 - - 3 - - - 25 26S.C. 2 2 - - - - - - 13 22Ga. 47 31 - - - - 10 4 141 224Fla. 51 50 - - 4 2 - 2 96 170
E.S. CENTRAL 28 41 - 1 - 2 7 4 67 66Ky. - 3 - - - 1 - - 9 11Tenn. 19 22 - - - 1 5 3 40 35Ala. 9 16 - 1 - - 2 1 6 9Miss. - - - - - - - - 12 11
W.S. CENTRAL 31 39 1 - 3 6 1 3 151 231Ark. 1 4 - - - 1 - - 32 12La. 4 13 - - - 2 1 3 5 21Okla. 25 22 - - 3 3 - - 16 4Tex. 1 - 1 - - - - - 98 194
MOUNTAIN 120 87 2 5 11 13 17 11 200 156Mont. - - - - - - - - 3 2Idaho 4 1 - - - - 2 1 10 7Wyo. - - - - - - - - 1 1Colo. 34 15 - - - - 6 4 28 22N. Mex. 20 12 - - 3 3 3 1 5 8Ariz. 46 48 - 5 7 6 1 3 125 87Utah 9 7 2 - - 2 3 2 23 12Nev. 7 4 - - 1 2 2 - 5 17
PACIFIC 34 61 2 2 - 13 4 10 407 489Wash. 3 3 2 - - 2 1 1 26 26Oreg. 21 20 - - - - - 2 29 28Calif. 3 33 - 2 - 11 2 7 342 427Alaska 2 - - - - - 1 - 3 5Hawaii 5 5 - - - - - - 7 3
Guam - - - - - - - - - -P.R. - - - - - - - - 7 32V.I. - - - - - - - - - -Amer. Samoa U U U U U U U U U UC.N.M.I. - U - U - U - U - U
Vol. 53 / No. 20 MMWR 441
N: Not notifiable. U: Unavailable. -: No reported cases.* Incidence data for reporting years 2003 and 2004 are provisional and cumulative (year-to-date).
TABLE II. (Continued) Provisional cases of selected notifiable diseases, United States, weeks ending May 22, 2004, and May 17, 2003(20th Week)*
Hepatitis (viral, acute), by typeB C Legionellosis Listeriosis Lyme disease
Cum. Cum. Cum. Cum. Cum. Cum. Cum. Cum. Cum. Cum.Reporting area 2004 2003 2004 2003 2004 2003 2004 2003 2004 2003UNITED STATES 2,262 2,474 452 417 355 373 153 181 2,743 3,059
NEW ENGLAND 88 127 1 1 8 14 10 7 252 359Maine 1 - - - - - 2 - 31 -N.H. 20 5 - - - 2 1 2 13 5Vt. 1 1 1 1 - 1 - - 9 4Mass. 63 93 - - 3 6 2 3 91 188R.I. 1 3 - - 1 1 1 - 28 80Conn. 2 25 U U 4 4 4 2 80 82
MID. ATLANTIC 345 335 47 46 84 78 34 37 2,131 2,248Upstate N.Y. 41 28 4 7 18 25 12 7 756 720N.Y. City 34 115 - - 3 8 3 10 - 3N.J. 158 90 - - 22 5 8 7 489 550Pa. 112 102 43 39 41 40 11 13 886 975
E.N. CENTRAL 173 183 25 65 79 85 21 22 34 94Ohio 61 57 2 4 39 35 9 3 28 11Ind. 8 10 2 - 7 4 4 1 - 5Ill. - - 2 11 2 13 - 7 - 2Mich. 104 94 19 47 29 26 7 7 - -Wis. - 22 - 3 2 7 1 4 6 76
W.N. CENTRAL 157 111 183 89 8 14 4 5 38 31Minn. 12 13 1 1 - 2 2 2 12 17Iowa 6 4 - - 2 4 1 - 5 4Mo. 122 74 182 87 4 5 1 1 16 7N. Dak. 1 - - - 1 1 - - - -S. Dak. - 1 - - 1 - - - - -Nebr. 9 12 - 1 - 1 - 2 2 1Kans. 7 7 - - - 1 - - 3 2
S. ATLANTIC 679 638 69 69 86 104 24 39 237 238Del. 12 3 - - 3 - N N 24 45Md. 59 43 6 5 13 17 4 4 142 150D.C. 12 1 1 - 1 1 - - 2 3Va. 75 40 10 1 7 6 3 4 10 10W. Va. 2 7 8 1 2 - 1 1 1 -N.C. 57 53 6 3 8 9 4 8 34 17S.C. 37 60 1 17 1 4 - 2 1 1Ga. 218 202 6 6 4 10 4 10 1 5Fla. 207 229 31 36 47 57 8 10 22 7
E.S. CENTRAL 286 159 37 37 15 15 7 6 9 15Ky. 21 34 12 7 4 3 2 - 5 2Tenn. 69 53 11 7 9 7 4 1 2 6Ala. 24 31 - 4 2 3 1 3 - -Miss. 172 41 14 19 - 2 - 2 2 7
W.S. CENTRAL 61 418 48 76 24 22 13 22 4 39Ark. 17 38 - 3 - - - - - -La. 23 61 25 43 1 1 1 1 - 4Okla. 16 18 2 - 2 2 - 1 - -Tex. 5 301 21 30 21 19 12 20 4 35
MOUNTAIN 193 222 20 12 25 19 6 11 8 3Mont. - 8 2 1 - - - 1 - -Idaho 6 2 - 1 1 2 1 - 2 1Wyo. 3 9 - - 4 1 - - 1 -Colo. 27 34 4 4 4 3 1 4 - -N. Mex. 5 17 3 - - 2 - 2 - -Ariz. 101 112 2 3 5 6 - 4 1 -Utah 20 14 1 - 9 3 - - 4 1Nev. 31 26 8 3 2 2 4 - - 1
PACIFIC 280 281 22 22 26 22 34 32 30 32Wash. 22 29 7 9 5 2 5 3 3 -Oreg. 41 - 4 4 N N 4 1 11 8Calif. 202 243 9 8 21 20 25 28 16 23Alaska 12 3 - - - - - - - 1Hawaii 3 6 2 1 - - - - N N
Guam - - - - - - - - - -P.R. 9 57 - - 1 - - - N NV.I. - - - - - - - - - -Amer. Samoa U U U U U U U U U UC.N.M.I. - U - U - U - U - U

442 MMWR May 28, 2004
N: Not notifiable. U: Unavailable. - : No reported cases.* Incidence data for reporting years 2003 and 2004 are provisional and cumulative (year-to-date).
TABLE II. (Continued) Provisional cases of selected notifiable diseases, United States, weeks ending May 22, 2004, and May 17, 2003(20th Week)*
Meningococcal Rocky MountainMalaria disease Pertussis Rabies, animal spotted fever
Cum. Cum. Cum. Cum. Cum. Cum. Cum. Cum. Cum. Cum.Reporting area 2004 2003 2004 2003 2004 2003 2004 2003 2004 2003
UNITED STATES 356 363 639 793 3,072 2,474 1,407 2,657 182 119
NEW ENGLAND 29 8 29 38 665 251 182 172 9 -Maine 2 1 7 5 - 2 18 14 - -N.H. - 2 3 3 20 14 6 9 - -Vt. 1 - 1 - 30 27 6 10 - -Mass. 17 5 18 23 597 189 79 65 9 -R.I. 2 - - 2 9 4 10 22 - -Conn. 7 - - 5 9 15 63 52 - -
MID. ATLANTIC 74 86 81 90 811 231 152 318 16 11Upstate N.Y. 13 17 19 14 613 88 119 114 1 -N.Y. City 29 45 14 21 - 27 4 2 2 4N.J. 16 10 19 12 72 39 - 62 5 4Pa. 16 14 29 43 126 77 29 140 8 3
E.N. CENTRAL 23 39 91 124 370 174 10 16 10 4Ohio 8 6 37 32 163 87 5 5 6 2Ind. - - 10 19 23 24 2 2 1 -Ill. 2 18 9 36 - - 2 1 - 1Mich. 8 12 29 22 36 17 1 8 3 1Wis. 5 3 6 15 148 46 - - - -
W.N. CENTRAL 22 14 37 57 164 113 174 250 7 4Minn. 9 8 9 13 40 33 18 11 - -Iowa 1 2 9 10 21 33 21 28 - 1Mo. 3 1 9 24 80 24 6 2 7 3N. Dak. 2 - 1 - 6 2 23 24 - -S. Dak. 1 - 1 1 7 2 10 51 - -Nebr. 1 - 1 5 - 1 53 48 - -Kans. 5 3 7 4 10 18 43 86 - -
S. ATLANTIC 106 92 116 143 171 169 668 1,078 91 88Del. 2 - 1 8 3 1 9 18 - -Md. 26 24 6 12 36 20 50 147 7 15D.C. 5 5 4 1 1 - - - - -Va. 10 7 7 9 46 33 176 205 - 1W. Va. - 2 3 1 2 3 27 28 - -N.C. 5 6 18 16 33 62 249 280 78 47S.C. 5 1 10 11 17 8 56 67 2 8Ga. 12 18 6 18 8 17 99 145 1 13Fla. 41 29 61 67 25 25 2 188 3 4
E.S. CENTRAL 12 9 26 33 40 47 52 81 27 10Ky. 1 1 3 3 7 11 11 11 - -Tenn. 2 4 9 8 21 22 17 61 15 6Ala. 7 2 6 10 6 9 21 8 4 -Miss. 2 2 8 12 6 5 3 1 8 4
W.S. CENTRAL 32 43 58 104 120 141 74 634 16 1Ark. 2 3 12 9 7 8 23 25 - -La. 2 2 14 30 2 4 - - 3 -Okla. 1 2 3 8 13 14 51 100 13 -Tex. 27 36 29 57 98 115 - 509 - 1
MOUNTAIN 14 11 33 37 387 424 38 35 2 1Mont. - - 1 2 11 - 5 5 - -Idaho 1 1 4 2 17 9 - 1 1 -Wyo. - - 2 2 3 119 - - - 1Colo. 6 8 14 7 209 159 4 1 1 -N. Mex. 1 - 4 4 46 22 - 2 - -Ariz. 1 1 5 16 65 75 29 25 - -Utah 3 1 3 - 27 30 - 1 - -Nev. 2 - - 4 9 10 - - - -
PACIFIC 44 61 168 167 344 924 57 73 4 -Wash. 2 8 17 15 171 152 - - - -Oreg. 8 5 36 29 125 130 - 1 2 -Calif. 33 46 110 114 35 639 49 67 2 -Alaska - - 1 2 8 - 8 5 - -Hawaii 1 2 4 7 5 3 - - - -
Guam - - - - - - - - - -P.R. - - 2 5 1 - 17 25 N NV.I. - - - - - - - - - -Amer. Samoa U U U U U U U U U UC.N.M.I. - U - U - U - U - U
Vol. 53 / No. 20 MMWR 443
N: Not notifiable. U: Unavailable. - : No reported cases.* Incidence data for reporting years 2003 and 2004 are provisional and cumulative (year-to-date).
TABLE II. (Continued) Provisional cases of selected notifiable diseases, United States, weeks ending May 22, 2004, and May 17, 2003(20th Week)*
Streptococcus pneumoniae, invasiveStreptococcal disease, Drug resistant,
Salmonellosis Shigellosis invasive, group A all ages Age <5 yearsCum. Cum. Cum. Cum. Cum. Cum. Cum. Cum. Cum. Cum.
Reporting area 2004 2003 2004 2003 2004 2003 2004 2003 2004 2003
UNITED STATES 9,244 10,210 3,583 7,813 2,057 2,922 1,099 1,118 214 262
NEW ENGLAND 456 509 84 107 97 284 13 48 4 1Maine 29 32 1 4 3 14 1 - - -N.H. 27 35 3 3 11 15 - - N NVt. 18 15 2 3 4 14 6 5 1 1Mass. 243 298 53 70 63 130 N N N NR.I. 32 25 4 3 16 4 6 - 3 -Conn. 107 104 21 24 - 107 - 43 U U
MID. ATLANTIC 1,235 1,299 435 709 327 502 81 64 51 45Upstate N.Y. 312 264 195 120 113 183 38 29 37 32N.Y. City 331 382 123 150 43 71 U U U UN.J. 202 211 68 157 58 105 N N N NPa. 390 442 49 282 113 143 43 35 14 13
E.N. CENTRAL 1,278 1,452 265 634 371 733 253 235 70 98Ohio 342 409 67 99 131 158 192 155 47 52Ind. 132 152 47 44 44 63 61 80 16 18Ill. 321 477 87 354 35 205 - - - -Mich. 252 210 34 87 149 209 N N N NWis. 231 204 30 50 12 98 N N 7 28
W.N. CENTRAL 669 563 136 256 161 184 112 93 21 20Minn. 167 154 17 34 73 87 - - 18 17Iowa 135 114 29 20 N N N N N NMo. 184 145 50 105 39 39 5 6 3 1N. Dak. 13 13 1 3 6 8 - 3 - 2S. Dak. 23 25 6 8 8 14 1 - - -Nebr. 47 49 7 58 8 19 - - N NKans. 100 63 26 28 27 17 106 84 N N
S. ATLANTIC 2,039 2,343 1,013 2,459 414 450 504 538 5 5Del. 15 27 3 120 2 5 3 1 N NMd. 189 241 42 210 94 132 - 4 - -D.C. 14 12 20 24 4 4 3 - 3 -Va. 234 235 32 105 38 45 N N N NW. Va. 46 23 - - 12 19 55 28 2 5N.C. 247 350 129 273 56 36 N N U US.C. 125 129 143 130 28 16 41 80 N NGa. 289 325 206 521 79 96 109 138 N NFla. 880 1,001 438 1,076 101 97 293 287 N N
E.S. CENTRAL 517 609 206 392 104 92 62 76 - -Ky. 99 108 31 46 36 22 17 6 N NTenn. 148 205 84 135 68 70 45 70 N NAla. 153 166 68 132 - - - - N NMiss. 117 130 23 79 - - - - - -
W.S. CENTRAL 712 1,063 710 2,058 112 143 28 47 53 61Ark. 102 109 19 26 5 3 5 17 5 4La. 79 179 65 186 1 1 23 30 7 13Okla. 95 82 166 274 31 42 N N 24 26Tex. 436 693 460 1,572 75 97 N N 17 18
MOUNTAIN 776 670 275 329 279 247 15 15 10 32Mont. 52 36 3 2 - 1 - - - -Idaho 56 70 5 8 4 11 N N N NWyo. 20 32 1 1 5 - 4 2 - -Colo. 186 181 59 52 87 71 - - 8 30N. Mex. 68 58 38 68 42 64 5 13 - -Ariz. 253 177 134 165 117 95 - - N NUtah 77 64 16 17 23 4 4 - 2 2Nev. 64 52 19 16 1 1 2 - - -
PACIFIC 1,562 1,702 459 869 192 287 31 2 - -Wash. 135 182 29 77 24 26 - - N NOreg. 111 152 19 31 N N N N N NCalif. 1,171 1,267 393 746 134 217 N N N NAlaska 32 34 3 4 - - - - N NHawaii 113 67 15 11 34 44 31 2 - -
Guam - - - - - - - - - -P.R. 40 241 1 4 N N N N N NV.I. - - - - - - - - - -Amer. Samoa U U U U U U U U U UC.N.M.I. 3 U - U - U - U - U

444 MMWR May 28, 2004
N: Not notifiable. U: Unavailable. - : No reported cases.* Incidence data for reporting years 2003 and 2004 are provisional and cumulative (year-to-date).
TABLE II. (Continued) Provisional cases of selected notifiable diseases, United States, weeks ending May 22, 2004, and May 17, 2003(20th Week)*
Syphilis VaricellaPrimary & secondary Congenital Tuberculosis Typhoid fever (Chickenpox)Cum. Cum. Cum. Cum. Cum. Cum. Cum. Cum. Cum. Cum.
Reporting area 2004 2003 2004 2003 2004 2003 2004 2003 2004 2003UNITED STATES 2,561 2,699 84 184 2,982 4,445 88 118 7,090 7,410
NEW ENGLAND 57 75 1 - 102 132 8 9 356 1,663Maine - 3 - - - 4 - - 43 490N.H. 1 9 - - 6 6 - - - -Vt. - - - - - 3 - - 313 367Mass. 42 51 - - 76 62 8 4 - 85R.I. 6 4 - - 10 17 - 2 - 2Conn. 8 8 1 - 10 40 - 3 - 719
MID. ATLANTIC 369 305 10 31 708 778 20 21 28 9Upstate N.Y. 34 8 1 2 79 86 2 3 - -N.Y. City 168 168 6 19 369 420 5 11 - -N.J. 70 66 3 10 146 141 9 6 - -Pa. 97 63 - - 114 131 4 1 28 9
E.N. CENTRAL 289 367 27 35 359 363 4 15 3,063 2,789Ohio 92 82 1 2 64 58 1 - 867 625Ind. 21 16 7 6 19 47 - 4 - -Ill. 90 140 1 11 180 176 - 5 - -Mich. 78 119 18 16 72 61 2 6 2,084 1,734Wis. 8 10 - - 24 21 1 - 112 430
W.N. CENTRAL 50 77 - 3 135 171 2 2 109 20Minn. 7 22 - - 57 63 1 1 - -Iowa 2 6 - - 13 10 - 1 N NMo. 24 27 - 3 31 52 1 - 2 -N. Dak. - - - - 3 - - - 67 20S. Dak. - - - - 4 9 - - 40 -Nebr. 4 2 - - 6 7 - - - -Kans. 13 20 - - 21 30 - - - -
S. ATLANTIC 699 703 11 37 631 774 16 25 1,117 1,082Del. 2 8 - - - - - - 4 8Md. 136 106 2 6 81 78 2 7 - -D.C. 30 15 - - - - - - 17 7Va. 25 32 1 1 74 78 2 10 317 265W. Va. 2 1 - - 10 7 - - 620 701N.C. 54 64 1 9 71 79 2 4 - -S.C. 44 46 - 4 68 53 - - 159 101Ga. 115 174 - 7 11 192 8 2 - -Fla. 291 257 7 10 316 287 2 2 - -
E.S. CENTRAL 133 131 4 7 176 258 4 2 2 -Ky. 22 20 - 1 29 42 2 - - -Tenn. 53 52 1 1 46 83 2 1 - -Ala. 47 49 2 4 68 99 - 1 - -Miss. 11 10 1 1 33 34 - - 2 -
W.S. CENTRAL 405 315 16 26 177 712 6 5 1,058 1,694Ark. 16 13 - 1 52 41 - - - -La. 83 41 - - - - - - 5 8Okla. 9 19 2 - 50 49 - - - -Tex. 297 242 14 25 75 622 6 5 1,053 1,686
MOUNTAIN 138 116 12 19 132 122 6 4 1,357 153Mont. - - - - - - - - - -Idaho 10 4 - - - 1 - - - -Wyo. 1 - - - 1 2 - - 16 21Colo. 8 15 - 3 36 36 3 3 1,039 -N. Mex. 25 22 1 5 - 6 - - 29 -Ariz. 84 69 11 11 80 59 1 1 - 2Utah 3 1 - - 15 9 1 - 273 130Nev. 7 5 - - - 9 1 - - -
PACIFIC 421 610 3 26 562 1,135 22 35 - -Wash. 32 26 - - 77 91 1 2 - -Oreg. 9 16 - - 28 34 1 1 - -Calif. 378 562 3 26 406 948 15 32 - -Alaska - - - - 9 23 - - - -Hawaii 2 6 - - 42 39 5 - - -
Guam - - - - - - - - - -P.R. 45 73 - 8 14 33 - - 98 246V.I. - 1 - - - - - - - -Amer. Samoa U U U U U U U U U UC.N.M.I. 2 U - U 10 U - U - U
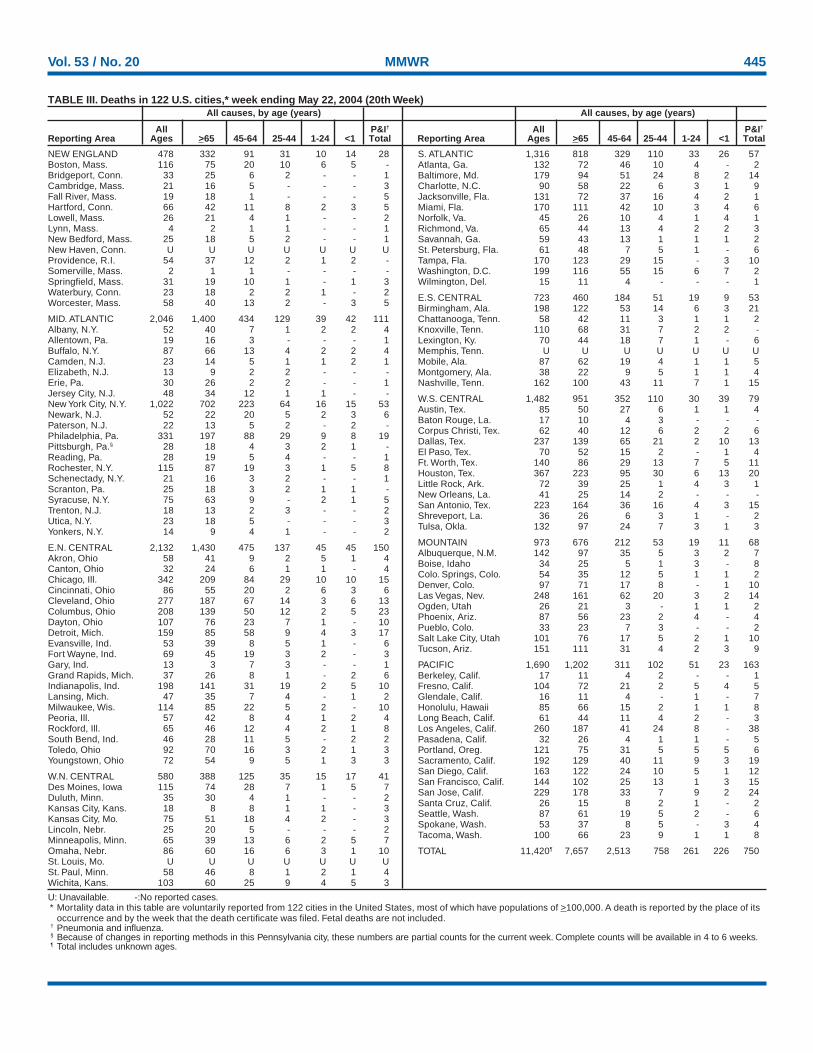
Vol. 53 / No. 20 MMWR 445
U: Unavailable. -:No reported cases.* Mortality data in this table are voluntarily reported from 122 cities in the United States, most of which have populations of >100,000. A death is reported by the place of its
occurrence and by the week that the death certificate was filed. Fetal deaths are not included.† Pneumonia and influenza.§ Because of changes in reporting methods in this Pennsylvania city, these numbers are partial counts for the current week. Complete counts will be available in 4 to 6 weeks.¶ Total includes unknown ages.
NEW ENGLAND 478 332 91 31 10 14 28Boston, Mass. 116 75 20 10 6 5 -Bridgeport, Conn. 33 25 6 2 - - 1Cambridge, Mass. 21 16 5 - - - 3Fall River, Mass. 19 18 1 - - - 5Hartford, Conn. 66 42 11 8 2 3 5Lowell, Mass. 26 21 4 1 - - 2Lynn, Mass. 4 2 1 1 - - 1New Bedford, Mass. 25 18 5 2 - - 1New Haven, Conn. U U U U U U UProvidence, R.I. 54 37 12 2 1 2 -Somerville, Mass. 2 1 1 - - - -Springfield, Mass. 31 19 10 1 - 1 3Waterbury, Conn. 23 18 2 2 1 - 2Worcester, Mass. 58 40 13 2 - 3 5
MID. ATLANTIC 2,046 1,400 434 129 39 42 111Albany, N.Y. 52 40 7 1 2 2 4Allentown, Pa. 19 16 3 - - - 1Buffalo, N.Y. 87 66 13 4 2 2 4Camden, N.J. 23 14 5 1 1 2 1Elizabeth, N.J. 13 9 2 2 - - -Erie, Pa. 30 26 2 2 - - 1Jersey City, N.J. 48 34 12 1 1 - -New York City, N.Y. 1,022 702 223 64 16 15 53Newark, N.J. 52 22 20 5 2 3 6Paterson, N.J. 22 13 5 2 - 2 -Philadelphia, Pa. 331 197 88 29 9 8 19Pittsburgh, Pa.§ 28 18 4 3 2 1 -Reading, Pa. 28 19 5 4 - - 1Rochester, N.Y. 115 87 19 3 1 5 8Schenectady, N.Y. 21 16 3 2 - - 1Scranton, Pa. 25 18 3 2 1 1 -Syracuse, N.Y. 75 63 9 - 2 1 5Trenton, N.J. 18 13 2 3 - - 2Utica, N.Y. 23 18 5 - - - 3Yonkers, N.Y. 14 9 4 1 - - 2
E.N. CENTRAL 2,132 1,430 475 137 45 45 150Akron, Ohio 58 41 9 2 5 1 4Canton, Ohio 32 24 6 1 1 - 4Chicago, Ill. 342 209 84 29 10 10 15Cincinnati, Ohio 86 55 20 2 6 3 6Cleveland, Ohio 277 187 67 14 3 6 13Columbus, Ohio 208 139 50 12 2 5 23Dayton, Ohio 107 76 23 7 1 - 10Detroit, Mich. 159 85 58 9 4 3 17Evansville, Ind. 53 39 8 5 1 - 6Fort Wayne, Ind. 69 45 19 3 2 - 3Gary, Ind. 13 3 7 3 - - 1Grand Rapids, Mich. 37 26 8 1 - 2 6Indianapolis, Ind. 198 141 31 19 2 5 10Lansing, Mich. 47 35 7 4 - 1 2Milwaukee, Wis. 114 85 22 5 2 - 10Peoria, Ill. 57 42 8 4 1 2 4Rockford, Ill. 65 46 12 4 2 1 8South Bend, Ind. 46 28 11 5 - 2 2Toledo, Ohio 92 70 16 3 2 1 3Youngstown, Ohio 72 54 9 5 1 3 3
W.N. CENTRAL 580 388 125 35 15 17 41Des Moines, Iowa 115 74 28 7 1 5 7Duluth, Minn. 35 30 4 1 - - 2Kansas City, Kans. 18 8 8 1 1 - 3Kansas City, Mo. 75 51 18 4 2 - 3Lincoln, Nebr. 25 20 5 - - - 2Minneapolis, Minn. 65 39 13 6 2 5 7Omaha, Nebr. 86 60 16 6 3 1 10St. Louis, Mo. U U U U U U USt. Paul, Minn. 58 46 8 1 2 1 4Wichita, Kans. 103 60 25 9 4 5 3
S. ATLANTIC 1,316 818 329 110 33 26 57Atlanta, Ga. 132 72 46 10 4 - 2Baltimore, Md. 179 94 51 24 8 2 14Charlotte, N.C. 90 58 22 6 3 1 9Jacksonville, Fla. 131 72 37 16 4 2 1Miami, Fla. 170 111 42 10 3 4 6Norfolk, Va. 45 26 10 4 1 4 1Richmond, Va. 65 44 13 4 2 2 3Savannah, Ga. 59 43 13 1 1 1 2St. Petersburg, Fla. 61 48 7 5 1 - 6Tampa, Fla. 170 123 29 15 - 3 10Washington, D.C. 199 116 55 15 6 7 2Wilmington, Del. 15 11 4 - - - 1
E.S. CENTRAL 723 460 184 51 19 9 53Birmingham, Ala. 198 122 53 14 6 3 21Chattanooga, Tenn. 58 42 11 3 1 1 2Knoxville, Tenn. 110 68 31 7 2 2 -Lexington, Ky. 70 44 18 7 1 - 6Memphis, Tenn. U U U U U U UMobile, Ala. 87 62 19 4 1 1 5Montgomery, Ala. 38 22 9 5 1 1 4Nashville, Tenn. 162 100 43 11 7 1 15
W.S. CENTRAL 1,482 951 352 110 30 39 79Austin, Tex. 85 50 27 6 1 1 4Baton Rouge, La. 17 10 4 3 - - -Corpus Christi, Tex. 62 40 12 6 2 2 6Dallas, Tex. 237 139 65 21 2 10 13El Paso, Tex. 70 52 15 2 - 1 4Ft. Worth, Tex. 140 86 29 13 7 5 11Houston, Tex. 367 223 95 30 6 13 20Little Rock, Ark. 72 39 25 1 4 3 1New Orleans, La. 41 25 14 2 - - -San Antonio, Tex. 223 164 36 16 4 3 15Shreveport, La. 36 26 6 3 1 - 2Tulsa, Okla. 132 97 24 7 3 1 3
MOUNTAIN 973 676 212 53 19 11 68Albuquerque, N.M. 142 97 35 5 3 2 7Boise, Idaho 34 25 5 1 3 - 8Colo. Springs, Colo. 54 35 12 5 1 1 2Denver, Colo. 97 71 17 8 - 1 10Las Vegas, Nev. 248 161 62 20 3 2 14Ogden, Utah 26 21 3 - 1 1 2Phoenix, Ariz. 87 56 23 2 4 - 4Pueblo, Colo. 33 23 7 3 - - 2Salt Lake City, Utah 101 76 17 5 2 1 10Tucson, Ariz. 151 111 31 4 2 3 9
PACIFIC 1,690 1,202 311 102 51 23 163Berkeley, Calif. 17 11 4 2 - - 1Fresno, Calif. 104 72 21 2 5 4 5Glendale, Calif. 16 11 4 - 1 - 7Honolulu, Hawaii 85 66 15 2 1 1 8Long Beach, Calif. 61 44 11 4 2 - 3Los Angeles, Calif. 260 187 41 24 8 - 38Pasadena, Calif. 32 26 4 1 1 - 5Portland, Oreg. 121 75 31 5 5 5 6Sacramento, Calif. 192 129 40 11 9 3 19San Diego, Calif. 163 122 24 10 5 1 12San Francisco, Calif. 144 102 25 13 1 3 15San Jose, Calif. 229 178 33 7 9 2 24Santa Cruz, Calif. 26 15 8 2 1 - 2Seattle, Wash. 87 61 19 5 2 - 6Spokane, Wash. 53 37 8 5 - 3 4Tacoma, Wash. 100 66 23 9 1 1 8
TOTAL 11,420¶ 7,657 2,513 758 261 226 750
TABLE III. Deaths in 122 U.S. cities,* week ending May 22, 2004 (20th Week)All causes, by age (years) All causes, by age (years)
All P&I† All P&I†
Reporting Area Ages >65 45-64 25-44 1-24 <1 Total Reporting Area Ages >65 45-64 25-44 1-24 <1 Total

MMWR
The Morbidity and Mortality Weekly Report (MMWR) Series is prepared by the Centers for Disease Control and Prevention (CDC) and is available free of chargein electronic format and on a paid subscription basis for paper copy. To receive an electronic copy each week, send an e-mail message to [email protected]. Thebody content should read SUBscribe mmwr-toc. Electronic copy also is available from CDC’s World-Wide Web server at http://www.cdc.gov/mmwr or from CDC’sfile transfer protocol server at ftp://ftp.cdc.gov/pub/publications/mmwr. To subscribe for paper copy, contact Superintendent of Documents, U.S. GovernmentPrinting Office, Washington, DC 20402; telephone 202-512-1800.
Data in the weekly MMWR are provisional, based on weekly reports to CDC by state health departments. The reporting week concludes at close of business onFriday; compiled data on a national basis are officially released to the public on the following Friday. Address inquiries about the MMWR Series, including materialto be considered for publication, to Editor, MMWR Series, Mailstop C-08, CDC, 1600 Clifton Rd., N.E., Atlanta, GA 30333; telephone 888-232-3228.
All material in the MMWR Series is in the public domain and may be used and reprinted without permission; citation as to source, however, is appreciated.
All MMWR references are available on the Internet at http://www.cdc.gov/mmwr. Use the search function to find specific articles.
Use of trade names and commercial sources is for identification only and does not imply endorsement by the U.S. Department of Health and Human Services.
References to non-CDC sites on the Internet are provided as a service to MMWR readers and do not constitute or imply endorsement of these organizations ortheir programs by CDC or the U.S. Department of Health and Human Services. CDC is not responsible for the content of these sites. URL addresses listed inMMWR were current as of the date of publication.
✩ U.S. Government Printing Office: 2004-633-140/00016 Region IV ISSN: 0149-2195
446 May 28, 2004
![2004 10:53:53 PM] - web.stanford.eduweb.stanford.edu/class/sbio228/public/lectures/Lecture5/SB228_Lec… · [2/5/2004 10:53:54 PM]](https://img.pdfslide.us/doc/110x75/5f06d37e7e708231d419edbb/2004-105353-pm-web-252004-105354-pm.jpg)