Embed Size (px)
Citation preview

EconomicResearchUnitCreditLibanaisHeadquarters
AdliehBeirut,[email protected]
CREDIT LIBANAIS S.A.L.
WeeklyMarketWatch
IssueNo.583
January13th–January19th2018

LLEEBBAANNOONN NEWS
ECONOMIC INSIGHTS
> MOODY’S PUBLISHES ITS 2018 OUTLOOK ON SOVEREIGNS- LEVANT & NORTH AFRICA 1
> LEBANON POORLY PREPARED TO BENEFIT FROM TECHNOLOGICAL CHANGES IN PRODUCTION AS PER WEF 2
> LEBANON RANKS 3RD IN THE ARAB WORLD IN TERMS OF FREEDOM IN 2017 3
> BEIRUT 3RD MOST EXPENSIVE ARAB CITY IN 2018 WHEN BENCHMARKED TO NEW YORK CITY 4
> BEIRUT RANKS 153RD IN THE WORLD IN THE 2018 QUALITY OF LIFE INDEX 5
> LEBANESE INSURANCE SECTOR’S NET PROFITS AT $139.64 MILLION IN 2016 6
> VALUE OF REAL ESTATE SALE TRANSACTIONS UP BY 17.36% IN 2017 7 > CONSTRUCTION PERMITS AREA AT 9.27 MILLION SQM IN 2017 8 > COMMERCIAL BANKS’ ASSETS AT $216.21 BILLION AT END OF
NOVEMBER 2017 9 > GROSS PUBLIC DEBT AT $79.36 BILLION BY NOVEMBER 2017 10 > CLEARED CHECKS VOLUME AT 12.23 MILLION IN 2017 11 > BALANCE OF TRADE DEFICIT WIDENS TO $14.71 BILLION BY NOVEMBER
2017 12 > RESERVES AT BDL REACH $54.92 BILLION AS AT MID-JANUARY 2018 13 > CEMENT DELIVERIES DOWN BY 5% Y-O-Y BY NOVEMBER 2017 14 > THE COINCIDENT INDICATOR UP BY 4% Y-O-Y IN NOVEMBER 2017 14 > NEW CAR SALES SETTLE 2.47% HIGHER IN 2017 15 CORPORATE NEWS
> VALUE OF KAFALAT LOANS AT $66.45 MILLION IN 2017 16 MONETARY PERFORMANCE
> MONETARY AGGREGATES 17 > MONEY MARKETS 17
LEBANESE EQUITIES
> LEBANESE EQUITIES & CREDIT LIBANAIS INDICES 18
LEBANON'S ECONOMIC & FINANCIAL SECTOR INDICATORS 20 LEBANON'S RATINGS 21
MOODY’S PUBLISHES ITS 2018 OUTLOOK ON SOVEREIGNS- LEVANT & NORTH AFRICA
Moody’s Investors Service projected Lebanon’s economic growth to pick up from 2.5% in 2017 to 2.8% in 2018 as a result of the anticipated and long-awaited public investment projects estimated at $16 billion spanning over a 10-year period. LEBANON POORLY PREPARED TO BENEFIT FROM TECHNOLOGICAL CHANGES IN PRODUCTION AS PER WEF
Lebanon ranked 68th globally and 7th regionally in the Structure of Production component of the World Economic Forum’s Future of Production Readiness benchmark for 2018, and 71st globally and 10th regionally in the Drivers of Production component. LEBANON RANKS 3RD IN THE ARAB WORLD IN TERMS OF FREEDOM IN 2017
According to Freedom House, Lebanon ranked third in the region in terms of freedom, attaining a status of “partly free” with an aggregate score that stood at 43 (out of 100) and a general rating that leveled at 5.0 (out of 7) in the year 2017. LEBANESE INSURANCE SECTOR’S NET PROFITS AT $139.64 MILLION IN 2016
The Lebanese insurance sector recorded some 8.47% annual increase in net profits to just above $139.64 million in the year 2016, from $128.74 million in 2015.
TABLE OF CONTENTS
Weekly Market Watch
ECONOMIC RESEARCH UNIT - ADLIEH, BEIRUT LEBANON - TEL: 01-608000 FAX: 01-608231
"BDL" Banque Du Liban "ABL" Association of Banks in Lebanon "MOF" The Lebanese Ministry of
Finance "BOP" Balance of Payment "IMF" The International Monetary Fund "Moody's" Moody's Investors Service "BSE" Beirut Stock Exchange "GDRs" Global Depositary Receipts "M1" Currency in Circulation + Demand
Deposits in LBP "M2" M1 + Other Deposits in LBP "M3" M2 + Deposits in Foreign Currencies "M4" M3+ Treasury Bills Held by Non-Banking System Including
Accrued Interests "CPI" Consumer Price Index "PPI" Producer Price Index "CLASI" Credit Libanais Aggregate Stock Index "CLFI" Credit Libanais Financial Sector Stock Index
"CLCI" Credit Libanais Construction Sector Stock Index “EIU” Economist Intelligence Unit “EOY” End of Year "P/E" Price to Earnings Multiple "P/BV" Price to Book Multiple "YTD" Year to Date "YTD Price Performance" Yield to Date Price Appreciation "LBP" The Lebanese Pound "USD" The United States Dollar "Y-O-Y" Year-on-Year "GDP" Gross Domestic Product "MENA" Middle East and North Africa
SYNOPSIS OF TERMS
Weekly Market Watch
ECONOMIC RESEARCH UNIT - ADLIEH, BEIRUT LEBANON - TEL: 01-608000 FAX: 01-608231
LEBANON NEWS
Weekly Market Watch
SOURCE: MOODY’S INVESTORS SERVICE, CREDIT LIBANAIS ECONOMIC RESEARCH UNIT 1
MOODY’S PUBLISHES ITS 2018 OUTLOOK ON SOVEREIGNS - LEVANT & NORTH AFRICA
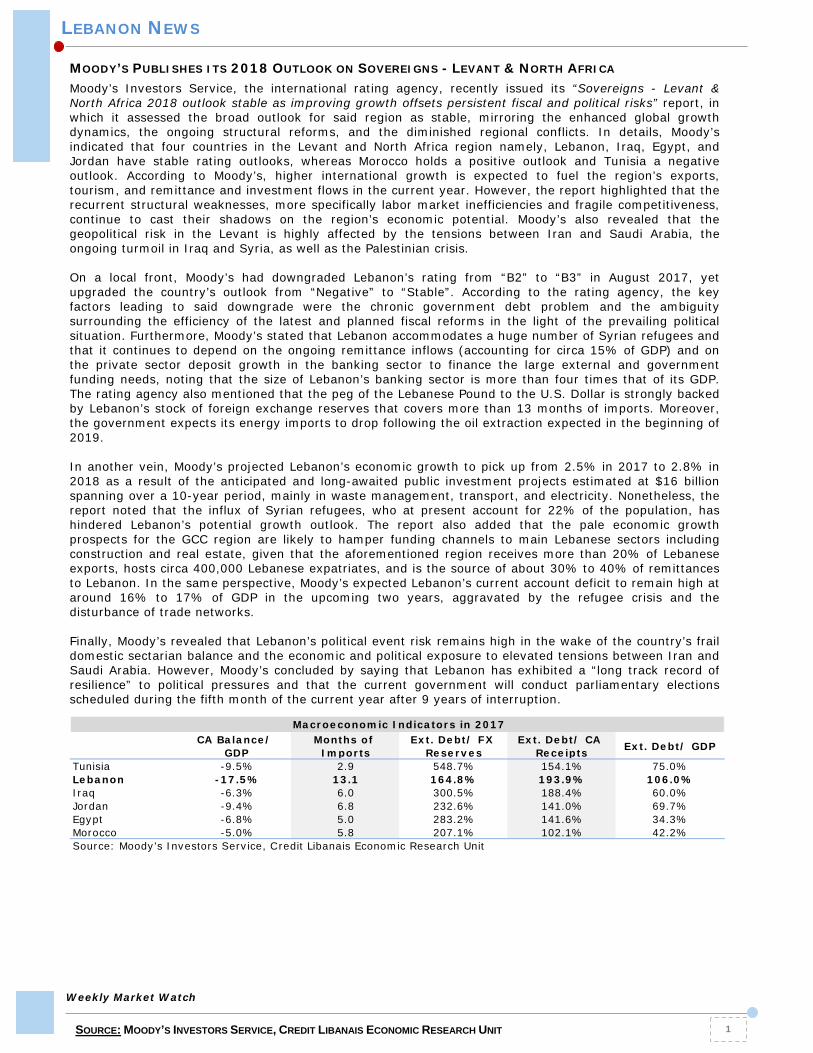
Moody’s Investors Service, the international rating agency, recently issued its “Sovereigns - Levant & North Africa 2018 outlook stable as improving growth offsets persistent fiscal and political risks” report, in which it assessed the broad outlook for said region as stable, mirroring the enhanced global growth dynamics, the ongoing structural reforms, and the diminished regional conflicts. In details, Moody’s indicated that four countries in the Levant and North Africa region namely, Lebanon, Iraq, Egypt, and Jordan have stable rating outlooks, whereas Morocco holds a positive outlook and Tunisia a negative outlook. According to Moody’s, higher international growth is expected to fuel the region’s exports, tourism, and remittance and investment flows in the current year. However, the report highlighted that the recurrent structural weaknesses, more specifically labor market inefficiencies and fragile competitiveness, continue to cast their shadows on the region’s economic potential. Moody’s also revealed that the geopolitical risk in the Levant is highly affected by the tensions between Iran and Saudi Arabia, the ongoing turmoil in Iraq and Syria, as well as the Palestinian crisis. On a local front, Moody’s had downgraded Lebanon’s rating from “B2” to “B3” in August 2017, yet upgraded the country’s outlook from “Negative” to “Stable”. According to the rating agency, the key factors leading to said downgrade were the chronic government debt problem and the ambiguity surrounding the efficiency of the latest and planned fiscal reforms in the light of the prevailing political situation. Furthermore, Moody’s stated that Lebanon accommodates a huge number of Syrian refugees and that it continues to depend on the ongoing remittance inflows (accounting for circa 15% of GDP) and on the private sector deposit growth in the banking sector to finance the large external and government funding needs, noting that the size of Lebanon’s banking sector is more than four times that of its GDP. The rating agency also mentioned that the peg of the Lebanese Pound to the U.S. Dollar is strongly backed by Lebanon’s stock of foreign exchange reserves that covers more than 13 months of imports. Moreover, the government expects its energy imports to drop following the oil extraction expected in the beginning of 2019. In another vein, Moody’s projected Lebanon’s economic growth to pick up from 2.5% in 2017 to 2.8% in 2018 as a result of the anticipated and long-awaited public investment projects estimated at $16 billion spanning over a 10-year period, mainly in waste management, transport, and electricity. Nonetheless, the report noted that the influx of Syrian refugees, who at present account for 22% of the population, has hindered Lebanon’s potential growth outlook. The report also added that the pale economic growth prospects for the GCC region are likely to hamper funding channels to main Lebanese sectors including construction and real estate, given that the aforementioned region receives more than 20% of Lebanese exports, hosts circa 400,000 Lebanese expatriates, and is the source of about 30% to 40% of remittances to Lebanon. In the same perspective, Moody’s expected Lebanon’s current account deficit to remain high at around 16% to 17% of GDP in the upcoming two years, aggravated by the refugee crisis and the disturbance of trade networks. Finally, Moody’s revealed that Lebanon’s political event risk remains high in the wake of the country’s frail domestic sectarian balance and the economic and political exposure to elevated tensions between Iran and Saudi Arabia. However, Moody’s concluded by saying that Lebanon has exhibited a “long track record of resilience” to political pressures and that the current government will conduct parliamentary elections scheduled during the fifth month of the current year after 9 years of interruption.
CA Balance/ GDP
Months of Imports
Ext. Debt/ FX Reserves
Ext. Debt/ CA Receipts Ext. Debt/ GDP
Tunisia -9.5% 2.9 548.7% 154.1% 75.0%Lebanon -17.5% 13.1 164.8% 193.9% 106.0%Iraq -6.3% 6.0 300.5% 188.4% 60.0%Jordan -9.4% 6.8 232.6% 141.0% 69.7%Egypt -6.8% 5.0 283.2% 141.6% 34.3%Morocco -5.0% 5.8 207.1% 102.1% 42.2%Source: Moody's Investors Service, Credit Libanais Economic Research Unit
Macroeconomic Indicators in 2017

LEBANON NEWS
Weekly Market Watch
SOURCE: WORLD ECONOMIC FORUM, CREDIT LIBANAIS ECONOMIC RESEARCH UNIT 2
LEBANON POORLY PREPARED TO BENEFIT FROM TECHNOLOGICAL CHANGES IN PRODUCTION AS PER WEF
The World Economic Forum (WEF) released this week its first edition of the “Readiness for the Future of Production (FOP) Report 2018”, which features a set of components and indicators that measure how well-positioned are 100 countries to benefit “from the changing nature of production through the adoption of emerging technology”. In details, the report features two main components, namely Structure of Production (composed of the complexity and scale indicators) and Drivers of Production (composed of the technology & innovation, human capital, global trade & investment, institutional framework, sustainable resources, and demand environment indicators), with scores ranging between 0 (worst) and 10 (best). According to their scores on the aforementioned indicators, countries are classified into four categories, namely leading (“strong current base and well-positioned for the future”), high-potential (“limited current base and well-positioned for the future”), legacy (“strong current base and at risk for the future”), and nascent (“limited current base and at risk for the future”). The bulk (58%) of countries was classified as nascent countries, followed by leading countries (25%), legacy countries (10%), and high-potential countries (7%).
On the rankings front, Japan (leading country) came in first in the Structure of Production component with a score of 8.99, followed by South Korea (leading country, score of 8.85) and Germany (leading country, score of 8.68). As far as the Drivers of Production component is concerned, the U.S.A. (leading country) ranked first with a score of 8.16, followed by Singapore (leading country, score of 7.96) and Switzerland (leading country, score of 7.92). Regionally, Turkey (legacy country, score of 5.87, international rank of 32) occupied the first place in terms of the Structure of Production component, whereas the U.A.E. (high-potential country, score of 6.76, international rank of 19) outperformed other MENA countries in terms of the Drivers of Production component.
Locally, Lebanon ranked 68th globally and 7th regionally in the Structure of Production component with a score of 4.02, and 71st globally and 10th regionally in the Drivers of Production component with a score of 4.43. Due to its lackluster performance, Lebanon was categorized amongst nascent countries according to the report. As far as the indicators are concerned, Lebanon fared best in the human capital (score of 5.58 and a global rank of 39) and global trade & investment (score of 5.47 and a global rank of 48) indicators, whilst performing poorly in the institutional framework (score of 3.30 and a global rank of 96) and technology & innovation (score of 3.28 and a global rank of 84) indicators. This is further depicted in the tables below:
Country Rank ScoreU.S.A. 1 8.16Singapore 2 7.96Switzerland 3 7.92U.A.E. 19 6.76Qatar 29 5.96Saudi Arabia 36 5.44Bahrain 41 5.31Oman 45 5.13Jordan 55 4.91Turkey 57 4.90Kuwait 63 4.65Egypt 68 4.46Lebanon 71 4.43Tunisia 72 4.41Morocco 73 4.35Algeria 87 3.70
FOP Readiness Rankings 2018 - Drivers of Production
Source: World Economic Forum, Credit Libanais Economic Research Unit
Indicator Rank Score Indicator Rank ScoreComplexity 60 4.93 Technology & Innovation 84 3.28Scale 78 2.65 Human Capital 39 5.58
Global Trade & Investment 48 5.47Institutional Framework 96 3.30Sustainable Resources 71 5.44Demand Environment 65 4.20
Lebanon's Performance Across Different Indicators
Source: World Economic Forum, Credit Libanais Economic Research Unit
Structure of Production Drivers of Production
Country Rank ScoreJapan 1 8.99South Korea 2 8.85Germany 3 8.68Turkey 32 5.87Saudi Arabia 44 5.16Egypt 46 4.99Tunisia 51 4.83Bahrain 54 4.78U.A.E. 57 4.53Lebanon 68 4.02Oman 70 4.00Jordan 69 4.00Qatar 72 3.89Morocco 77 3.67Kuwait 82 3.56Algeria 90 2.83
FOP Readiness Rankings 2018 - Structure of Production
Source: World Economic Forum, Credit Libanais Economic Research Unit

LEBANON NEWS
Weekly Market Watch
SOURCE: FREEDOM HOUSE, CREDIT LIBANAIS ECONOMIC RESEARCH UNIT 3
LEBANON RANKS 3RD IN THE ARAB WORLD IN TERMS OF FREEDOM IN 2017
Freedom House, the Washington-based non-profit research organization, released this week its latest report titled “Freedom in the World 2018: Democracy in Crisis”, which evaluates the state of freedom in 195 countries and 14 territories. The report unveiled a decline in global freedom for the twelfth consecutive year whereby year 2017 saw all major tenets of democracy, particularly guarantees of free and fair elections, the rights of minorities, freedom of the press, and the rule of law, violated and disrespected. In detail, the report stated that while the world’s major democracies were busy with their internal social, economic, demographic, and security issues, authoritarian regimes were seizing the opportunity not only to maximize internal repression, but also to export their negative influence and practices to other countries. For instance, while Russian and Chinese leaders have managed to expand their powers and control over the nations they rule, Turkey and Hungary were sliding more rapidly into authoritarian rule and the military in Myanmar was executing a horrific campaign of ethnic cleansing against the Rohingya Muslim minority in the country. With respect to the results of the report, it is worth noting first that each evaluated country or territory is assigned a score ranging between 0 and 4 on 25 key indicators (so that countries can reach an aggregate score of 100; 0: least free – 100: most free). Moreover, said scores are used to determine two numerical ratings, ranging between 1 and 7, for two main indicators of freedom, namely political rights and civil liberties (1: most free - 7: least free). The average rating of the two equally-weighted indicators thus determines a country or territory’s overall status of “free” (rating: [1, 3]), “partly free” (rating: ]3, 5]), and “not free” (rating: ]5, 7]). On a global level, out of the 195 assessed countries representing a population of 7.4 billion, 88 countries (45% of all included countries) with a total population of 2.9 billion (39% of the covered population) emerged as “free”, 58 countries (30%) home to 1.8 billion people (24%) were classified as “partly free”, and 49 countries (25%) including a population of 2.7 billion (37%) were considered “not free”. Moreover, twenty countries saw a drop in their aggregate 2017 freedom score when compared to their scores in 2016, with Gabon (-9), Tunisia (-8), and Congo (-6) witnessing the sharpest declines, while six nations saw an improvement, with The Gambia (+21) leading the list, followed by Timor-Leste (+4) and Uzbekistan (+4). Overall, and as far as global rankings are concerned, three Scandinavian countries, namely Finland, Norway, and Sweden, topped the list of countries in terms of freedom in the year 2017, each scoring 100 and receiving a general rating of 1.0, entitling them to classify as “free”. Regionally, Tunisia was the top performer when it comes to freedom in Arab countries in 2017, emerging as the only “free” Arab nation with an aggregate score of 70 and a general rating of 2.5. Comoros came second in the region with a status of “partly free”, an aggregate score of 55, and a general rating of 3.5. Lebanon followed in the regional rankings, attaining a status of “partly free” with an aggregate score that stood at 43 and a general rating that leveled at 5.0 (scoring 6 on the political rights front and 4 in civil liberties). The report further elaborated that the country, home to 6.2 million people and having a GDP per capita of $8,453, had its political rights rating worsening from 5 to 6, a fact that Freedom House attributed to the further extension of the incumbent parliament’s mandate and the legislation of a new electoral law that, always according to the report, reinforces the sectarian political system and guards the position of ruling parties.
Country Status Score (0-100 pts)
Rating (0-7 pts)
Regional Rank
Political Rights
(0-7 pts)
Civil Liberties (0-7 pts)
Finland Free 100 1.0 - 1 1
Norway Free 100 1.0 - 1 1
Sweden Free 100 1.0 - 1 1
Tunisia Free 70 2.5 1 2 3
Comoros Partly Free 55 3.5 2 3 4
Lebanon Partly Free 43 5.0 3 6 4Morocco Partly Free 39 5.0 4 5 5
Jordan Partly Free 37 5.0 5 5 5
Kuwait Partly Free 36 5.0 6 5 5
Algeria Not Free 35 5.5 7 6 5
Iraq Not Free 31 5.5 8 5 6
Mauritania Not Free 30 5.5 9 6 5
West Bank Not Free 28 6.0 10 7 5
Djibouti Not Free 26 5.5 11 6 5
Egypt Not Free 26 6.0 12 6 6
Qatar Not Free 24 5.5 13 6 5
Oman Not Free 23 5.5 14 6 5
United Arab Emirates Not Free 17 6.5 15 7 6
Yemen Not Free 13 6.5 16 7 6
Bahrain Not Free 12 6.5 17 7 6
Gaza Strip Not Free 12 6.5 18 7 6
Libya Not Free 9 6.5 19 7 6
Sudan Not Free 8 7.0 20 7 7
Saudi Arabia Not Free 7 7.0 21 7 7
Syria Not Free -1 7.0 22 7 7
Source: Freedom House, Credit Libanais Economic Research Unit
Freedom in the World 2018 Indicators Ratings

LEBANON NEWS
Weekly Market Watch
SOURCE: NUMBEO.COM, CREDIT LIBANAIS ECONOMIC RESEARCH UNIT 4
BEIRUT 3RD MOST EXPENSIVE ARAB CITY IN 2018 WHEN BENCHMARKED TO NEW YORK CITY
Numbeo.com, a global statistics website, recently released its global cost of living index (CoLI) in which it compares cities worldwide based on their scores in said index when benchmarked to New York City. It also sketches the values of four other indices, namely the Rent Index, the Groceries Price Index, the Restaurant Price Index, and the Local Purchasing Power Index for each city, always when benchmarked to the city of New York. According to January 2018 statistics, Hamilton, Bermuda emerged as the most expensive city in the world in the year 2018, with a CoLI value of 145.43, implying that prices in Hamilton are 45.43% more expensive than those in New York City. Hamilton was trailed by Zurich, Switzerland (CoLI of 141.25) and Geneva, Switzerland (CoLI of 134.83). Regionally, Dubai, UAE ranked as the most expensive Arab city with a CoLI value of 72.58 (ranking 210th globally), followed by Doha, Qatar (CoLI value of 66.12 and global rank 288) and Beirut, Lebanon (CoLI value of 65.03 and global rank of 299). Consequently, the Numbeo index revealed that prices in Beirut are 34.97% less expensive than those in New York City, with Beirut scoring 34.98 in the Rent Price Index, 47.46 in the Groceries Price Index, 66.58 in the Restaurant Price Index, and 52.68 in the Local Purchasing Power Index. The historical evolution of the CoLI and accompanying indices for Beirut shows that prices in Beirut have relatively decreased over the last couple of years, with CoLI values dropping from 73.62 in 2014 to 69.86 in 2015, 66.73 in 2016, and 64.27 in 2017, before slightly rebounding to 65.03 in 2018. In fact, and overall, the Rent Index, the Groceries Price Index, and the Restaurant Price Index values in Beirut have fallen over the covered period, while the Local Purchasing Power Index registered a rise from 40.45 in 2014 to 52.68 as revealed by the index measurements in 2018.
Beirut (Indices Relative to New York City)
Cost of Living
Index 2014
Cost of Living
Index 2015
Cost of Living
Index 2016
Cost of Living
Index 2017
Cost of Living
Index 2018
Cost of Living Index 73.62 69.86 66.73 64.27 65.03
Rent Index 36.08 33.89 42.84 36.72 34.98
Groceries Index 57.40 53.94 49.10 47.99 47.46
Restaurant Price Index 75.15 73.54 68.66 60.93 66.58
Local Purchasing Power Index 40.45 46.77 65.42 51.84 52.68Source: Numbeo, Credit Libanais Economic Research Unit
City Cost of Living Index Global Rank Regional
Rank Rent Index Groceries Price Index
Restaurant Price Index
Local Purchasing Power Index
Hamilton, Bermuda 145.43 1 - 110.87 143.47 158.75 112.26
Zurich, Switzerland 141.25 2 - 66.14 149.86 135.76 142.70
Geneva, Switzerland 134.83 3 - 71.70 138.98 129.74 130.96
New York, USA 100.00 14 - 100.00 100.00 100.00 100.00
Dubai, UAE 72.58 210 1 66.88 61.71 67.23 123.73
Doha, Qatar 66.12 288 2 66.84 57.95 65.81 120.86
Beirut, Lebanon 65.03 299 3 34.98 47.46 66.58 52.68
Abu Dhabi, UAE 64.97 300 4 64.25 54.30 65.93 131.24
Sharjah, UAE 59.38 324 5 29.86 50.37 43.99 123.32
Manama, Bahrain 59.00 326 6 30.65 57.63 54.83 67.56
Amman, Jordan 58.47 328 7 14.58 49.55 55.56 41.83
Muscat, Oman 51.20 365 8 25.41 46.81 51.63 103.55
Jeddah, Saudi Arabia 51.00 367 9 14.41 43.21 34.15 113.18
Al Khobar, Saudi Arabia 50.18 375 10 15.67 44.86 33.74 124.32
Irbil, Iraq 49.08 385 11 13.91 41.62 43.07 49.20
Ad Dammam, Saudi Arabia 48.87 388 12 12.68 42.33 32.19 141.35
Riyadh, Saudi Arabia 48.21 391 13 16.46 41.46 35.41 129.20
Rabat, Morocco 41.62 434 14 13.47 37.31 27.57 45.29
Algiers, Algeria 37.13 473 15 8.61 38.43 22.86 33.38
Tunis, Tunisia 30.06 506 16 7.39 29.49 18.19 34.32
Cairo, Egypt 26.49 525 17 5.43 23.23 22.55 25.27
Cost of Living Index for the Year 2018
Source: Numbeo, Credit Libanais Economic Research Unit

LEBANON NEWS
Weekly Market Watch
SOURCE: NUMBEO.COM, CREDIT LIBANAIS ECONOMIC RESEARCH UNIT 5
BEIRUT RANKS 153RD IN THE WORLD IN THE 2018 QUALITY OF LIFE INDEX
Numbeo.com, a global statistics website, released its Quality of Life Index 2018 in which it ranked 184 cities across the globe based on their respective index scores. It also sketched the values of eight other sub-indices which shape the quality of life in a city, namely the Purchasing Power Index, the Safety Index, the Healthcare Index, the Cost of Living Index, the Property Price to Income Ratio (which reflects the affordability of housing), the Traffic Commute Time Index, the Pollution Index, and the Climate Index. Ideally, a city should have a higher score in the Purchasing Power Index, Safety Index, Healthcare Index, and Climate Index, versus a lower score in each of the Pollution Index, House Price to Income Ratio, Cost of Living Index, and Traffic Commute Time Index to enjoy a better quality of life index score. According to Numbeo.com, Canberra, Australia appeared to offer its citizens the best quality of life in the world, registering a Quality of Life Index score of 221.32, followed by Wellington, New Zealand (208.39) and Raleigh, NC, United States (208.38). Regionally, Muscat, Oman enjoyed the highest quality of life across Western Asia with an index score of 175.31 (global rank: 42), trailed very closely by Abu Dhabi, United Arab Emirates (index score: 175.14; global rank: 43) and Dubai, United Arab Emirates (index score: 165.59; global rank: 65). On the local front, Beirut ranked 153rd in the world in Numbeo’s 2018 Quality of Life Index, with a score of 104.39. In details, Beirut scored 52.68 in the Purchasing Power Index, 90.30 in the Pollution Index, 17.43 in the House Price to Income Ratio, and 65.03 in the Cost of Living Index. Concurrently, the Lebanese capital reported a score of 50.09 in the Safety Index, 69.42 in the Healthcare Index, 33.33 in the Traffic Commute Time Index, and 93.94 in the Climate Index. It is worth noting that the quality of life in Beirut has deteriorated according to Numbeo’s index when benchmarked to the year 2017 at a time when it recorded an index score of 104.16 and ranked 142nd in the world.
0 50 100 150 200
Muscat
Abu Dhabi
Dubai
Doha
Riyadh
Jeddah
Amman
Beirut
175.31
175.14
165.59
158.50
152.06
134.04
110.12
104.39
Quality of Life Index 2018 in Selected Cities in Western Asia
Source: Numbeo.com, Credit Libanais Economic Research Unit
Beirut's Quality of Life Metrics 2018 Score 2017 ScorePurchasing Power Index 52.68 51.84Safety Index 50.09 50.82Healthcare Index 69.42 67.72Cost of Living Index 65.03 64.27Property Price to Income Ratio 17.43 15.05Traffic Commute Time Index 33.33 35.21Pollution Index 90.30 87.37Climate Index 93.94 69.39Quality of Life Index 104.39 104.16Source: Numbeo.com, Credit Libanais Economic Research Unit

LEBANESE INSURANCE SECTOR’S NET PROFITS AT $139.64 MILLION IN 2016
According to the “Insurance Sector’s 2016 Annual Report” published by the Insurance Control Commission at the Ministry of Economy and Trade, the Lebanese insurance sector recorded some 8.47% annual increase in net profits to just above $139.64 million in the year 2016, from $128.74 million in 2015. The Compounded Annual Growth Rate (CAGR) in the sector’s profitability stood at 18.41% over the 2008-2016 period. The aforementioned annual expansion in profits in 2016 was mainly fueled by a 3.00% rise in written premiums to $1.57 billion. The top 5 companies accounted for 61.78% of the sector’s combined profits, led by ALICO ($25.17 million), Arope ($18.14 million), and Bancassurance ($16.51 million). On the balance sheet front, the consolidated assets of the Lebanese insurance sector widened by 4.59% in 2016 to just over $4.59 billion, posting as such a 9.90% CAGR over the 2008-2016 period. This increase in assets was accompanied by a 5.05% expansion in total technical reserves on the liabilities front to around $3.01 billion. In addition, the equity of the Lebanese insurance sector rose by 8.82% y-o-y to around $1.09 billion in 2016, thanks to some 4.05% increase in paid-up capital to around $400 million. Profitability-wise, the sector’s return on average assets and return on average equity ratios firmed at 3.11% and 13.38% respectively in the year 2016, in comparison with 2.97% and 12.57% a year before.
LEBANON NEWS
Weekly Market Watch
SOURCE: INSURANCE CONTROL COMMISSION, CREDIT LIBANAIS ECONOMIC RESEARCH UNIT 6
$36,123
$75,095
$88,714
$112,337
$126,113$112,042
$137,664
$128,736
$139,642
1.8%
3.1% 3.1% 3.5% 3.5%2.9%
3.3% 3.0% 3.1%
7.8%
12.8%12.5%
14.7% 14.6%
11.7%
13.6%
12.6%13.4%
0.00%
2.00%
4.00%
6.00%
8.00%
10.00%
12.00%
14.00%
16.00%
$0
$20,000
$40,000
$60,000
$80,000
$100,000
$120,000
$140,000
$160,000
2008 2009 2010 2011 2012 2013 2014 2015 2016
Evolution of the Lebanese Insurance Sector's Profitability
Total Net Profits Return on Average Assets Return on Average Equity
Source: Ministry of Economy &Trade,Insurance Control Commission, Credit Libanais Economic Research Unit
in 000
Company Year 2016 Profits ($ 000)
As a % of the Sector's Profits
ALICO 25,167 18.02%Arope 18,142 12.99%Bancassurance 16,513 11.83%LIA 13,270 9.50%ADIR 13,179 9.44%
Source: Ministry of Economy and Trade, ICC, Credit Libanais Economic Research Unit
Key Indicators 2008 2009 2010 2011 2012 2013 2014 2015 2016 CAGRIncome Statement Components (in 000)
Total Written Premiums $898,785 $1,024,174 $1,151,822 $1,249,656 $1,319,103 $1,415,999 $1,474,948 $1,525,479 $1,571,268 7.23% o/w Non-Life $614,758 $728,306 $815,780 $885,331 $938,808 $1,007,311 $1,048,724 $1,065,987 $1,088,452 7.40% o/w Life $284,027 $295,869 $336,042 $364,326 $380,295 $408,687 $426,223 $459,491 $482,815 6.86%Total Claims Paid $373,262 $461,238 $503,554 $608,413 $662,666 $733,845 $763,319 $828,851 $894,096 11.54% o/w Non-Life $299,002 $355,067 $426,694 $493,303 $505,386 $557,270 $566,100 $575,348 $637,373 9.92% o/w Life $74,260 $106,171 $76,860 $115,110 $157,280 $176,575 $197,219 $253,503 $256,722 16.77%Total Ceded Premiums $170,419 $183,037 $216,673 $233,534 $257,562 $271,784 $266,559 $282,513 $294,482 7.08% o/w Non-Life $133,667 $142,212 $162,154 $179,397 $204,675 $213,965 $206,183 $217,736 $229,794 7.01% o/w Life $36,752 $40,825 $54,519 $54,138 $52,887 $57,819 $60,376 $64,777 $64,687 7.32%Total Net Profits $36,123 $75,095 $88,714 $112,337 $126,113 $112,042 $137,664 $128,736 $139,642 18.41%Balance Sheet Components (in 000)Total Assets $2,158,475 $2,685,607 $3,079,995 $3,385,156 $3,731,287 $4,013,802 $4,288,021 $4,391,726 $4,593,455 9.90%Total Technical Reserves $1,327,863 $1,645,075 $1,965,185 $2,179,857 $2,368,210 $2,577,144 $2,769,384 $2,869,357 $3,014,196 10.79%Total Owners' Equity $482,525 $693,932 $730,288 $797,063 $927,774 $980,947 $1,048,718 $999,394 $1,087,492 10.69%Paid-up Capital $311,566 $349,792 $373,459 $381,162 $381,221 $404,048 $409,362 $383,972 $399,538 3.16%Profitability RatiosReturn on Average Assets 1.78% 3.10% 3.08% 3.48% 3.54% 2.89% 3.32% 2.97% 3.11%Return on Average Equity 7.77% 12.77% 12.46% 14.71% 14.62% 11.74% 13.57% 12.57% 13.38%
Lebanese Insurance Sector Key Indicators
Source: Ministry of Economy and Trade, Insurance Control Commission, Credit Libanais Economic Research Unit

VALUE OF REAL ESTATE SALE TRANSACTIONS UP BY 17.36% IN 2017
Real estate activity flourished during the last month of 2017 as investors flocked to register their properties before year-end in fear of an appreciation in their properties’ rental values and possibly higher registration fees in the subsequent year. In detail, the number of transactions rose by 14.57% in December to 7,083, up from 6,182 transactions in the previous month. Concurrently, the value of real estate transactions expanded by 9.50% to $0.94 billion, from $0.86 billion in November. As a result, the average value per transaction fell by 4.43% month-on-month to $132,795, from $138,943 in November. Similarly, and on a cumulative basis, the number of real estate transactions soared by 14.46% in the year 2017 to 73,541 from 64,248 transactions during the year 2016, with the value of transactions rallying by 17.36% from $8.48 billion to $9.95 billion in 2017. The average value per transaction also increased by 2.53% y-o-y to $135,356 by year-end 2017, up from $132,016 in 2016. The share of sales to foreigners appreciated to 1.85% in 2017 from 1.75% in 2016. From a geographical standpoint, the average value per real estate transaction in each of Beirut and Baabda region dropped by 0.69% and 6.36% respectively to $516,485 and $137,093 in 2017, down from $520,076 and $146,400 at year-end 2016. Conversely, the average value per transaction in each of the Metn and Kesserwan regions hiked by 1.42% and 7.72% respectively to $216,337 and $136,965, up from $213,312 and $127,144 as at end of 2016.
LEBANON NEWS
Weekly Market Watch
SOURCE: GDLRC, CREDIT LIBANAIS ECONOMIC RESEARCH UNIT 7
Real Estate TransactionsFor the Month of November
2017
For the Month of December
2017
Monthly % Change 2016 2017 Y-O-Y %
Change
Number of Sale Transactions 6,182 7,083 14.57% 64,248 73,541 14.46%
Value of Transactions (USD Billion) 0.86 0.94 9.50% 8.48 9.95 17.36%
Average Value per Transaction (USD) 138,943 132,795 -4.43% 132,016 135,356 2.53%Source: General Directorate o f Land Registry and Cadastre, Credit Libanais Economic Research Unit
Source: GDLRC, Credit Libanais Economic Research Unit
6.79
9.48 8.84 9.18 8.71 8.958.01 8.48
9.95
83,62294,320
82,98474,569
69,198 70,72163,386 64,248
73,541
0.00
2.00
4.00
6.00
8.00
10.00
12.00
010,00020,00030,00040,00050,00060,00070,00080,00090,000
100,000
2009 2010 2011 2012 2013 2014 2015 2016 2017
$ Billion
Evolution of Value & Volume of Real Estate Transactions
Value of Transactions ($ Billion) Number of Transactions
2.53%
2.04%1.84% 1.86% 1.85%
1.69%
2.20%
1.75%
1.85%
0.00%
0.50%
1.00%
1.50%
2.00%
2.50%
3.00%
2009 2010 2011 2012 2013 2014 2015 2016 2017
Sales to Foreigners as a Percentage of Total Sales
Source: GDLRC, Credit Libanais Economic Research Unit
$314,941
$369,696
$456,136
$524,277
$499,948
$567,233
$509,841
$520,076
$516,485
$118,546
$153,064
$170,953
$182,797
$213,584
$210,955
$205,516
$213,312
$216,337
$84,290
$94,325
$97,487
$117,596
$124,664
$139,612
$140,169
$127,144
$136,965
$78,245
$103,397
$100,712
$108,028
$120,983
$138,644
$134,728
$146,400
$137,093
$0 $100,000 $200,000 $300,000 $400,000 $500,000 $600,000
2009
2010
2011
2012
2013
2014
2015
2016
2017
Historical Evolution of Average Value per Transaction Across Different Lebanese Regions
Baabda Kesserwan Metn Beirut
Source: GDLRC, Credit Libanais Economic Research Unit

CONSTRUCTION PERMITS AREA AT 9.27 MILLION SQM IN 2017
The surface area of construction permits in Lebanon, which reflects the level of future supply in the real estate sector, widened to 592,722 sqm during the month of December 2017, up from 585,923 sqm in the previous month. On a cumulative basis, moreover, the surface area of construction permits rose by 3.83% y-o-y to 9,270,702 sqm in the year 2017, compared to 8,929,031 sqm in 2016. As far as the geographical distribution of construction permits is concerned, the Mount Lebanon region continued to control the lion’s share of the total surface area of issued permits (4,695,782 sqm <50.65%>), followed by the South (1,599,018 sqm <17.25%>), Bekaa (1,123,247 sqm <12.12%>), Nabatieh (1,020,194 sqm <11.00%>), and Beirut (712,257 sqm <7.68%) regions. It is worth noting that figures for the North governorate are underestimated since they exclude permits issued by the North Order of Engineers.
The Beirut governorate enjoyed the highest exploitation coefficient, which stood at 942 sqm per construction permit in 2017, followed by the Mount Lebanon (806 sqm/transaction), Bekaa (747 sqm/transaction), North (657 sqm/transaction), South (542 sqm/transaction), and Nabatieh (469 sqm/transaction) governorates.
LEBANON NEWS
Weekly Market Watch
SOURCE: ORDER OF ENGINEERS, CREDIT LIBANAIS ECONOMIC RESEARCH UNIT 8
2011 13,889,806
2012 12,361,736
2013 10,526,939
2014 11,159,392
2015 10,294,346
2016 8,929,031
2017 9,270,702Source: Order o f Engineers, Credit Libanais Economic Research Unit
Evolution of Construction Permit Areas (Sqm) During the Year
0
2,000,000
4,000,000
6,000,000
8,000,000
10,000,000
12,000,000
14,000,000
2011 2012 2013 2014 2015 2016 2017
13,889,806
12,361,736
10,526,93911,159,392
10,294,346
8,929,031 9,270,702
Evolution of Construction Permit Areas (Sqm)
Beirut7.68%
Mount Lebanon50.65%
North*1.30%
Bekaa12.12%
South17.25%
Nabatieh11.00%
Geographical Breakdown of Construction Permit Areas in 2017
Source: Order of Engineers, Credit Libanais Economic Research Unit
SqmNo. of
TransactionsAverage
Sqm/Trans.Beirut 712,257 756 942
Mount Lebanon 4,695,782 5,823 806
North* 120,204 183 657
Bekaa 1,123,247 1,504 747
South 1,599,018 2,949 542
Nabatieh 1,020,194 2,173 469
Total 9,270,702 13,388 692* Figures for the North Governorate are underestimated since they exclude
permits issued by the North Order of Engineers
Source: Order of Engineers, Credit Libanais Economic Research Unit
Geographical Breakdown of Construction Permitsin 2017
0 200 400 600 800 1000
Beirut
Mount Lebanon
Bekaa
North*
South
Nabatieh
942
806
747
657
542
469
Average Sqm/Construction Permit per Region in 2017
Source: Order of Engineers, Credit Libanais Economic Research Unit

COMMERCIAL BANKS’ ASSETS AT $216.21 BILLION AT END OF NOVEMBER 2017
The combined balance sheet of commercial banks operating in Lebanon widened by 5.82% (LBP 17,935 billion) during the eleven-month period ended November 2017 to LBP 325,934 billion ($216.21 billion), up from LBP 307,999 billion ($204.31 billion) at end of year 2016. On an annual basis, the combined assets of the banking sector came in 7.59% higher than the LBP 302,938 billion ($200.95 billion) level reported at end of November 2016. The sector remains highly liquid, enjoying a primary liquidity ratio of 84.25%, compared to 81.46% in the same period in 2016. On the funding side of the balance sheet, customer deposits (private and public sector) rose by 2.74% (LBP 6,871 billion) YTD November to LBP 257,788 billion ($171.00 billion), up from LBP 250,917 billion ($166.45 billion) at year-end 2016. Said rise came as a result of the 3.04% (LBP 5,892 billion) increase in deposits from the resident private sector to LBP 199,657 billion ($132.44 billion), accompanied by a 1.20% (LBP 612 billion) expansion in deposits from the non-resident private sector to LBP 51,808 billion ($34.37 billion). The resignation of PM Hariri in early November led to some $2.51 billion (1.45%) contraction in customer deposits at Lebanese banks during the month of November. Said resignation, which was short-lived, also had a detrimental effect on the deposit dollarization rate which spiked from 67.27% in October to 68.51% in November, bearing in mind that this ratio stood at 65.82% at end of year 2016 and 65.30% in November 2016. On an annual basis, customer deposits increased by 4.96% from LBP 245,616 billion ($162.93 billion) in November 2016. On the lending front, loans to the private sector (residents and non-residents) notched 4.14% (LBP 3,570 billion) higher YTD November 2017 to LBP 89,769 billion ($59.55 billion), up from LBP 86,199 billion ($57.18 billion) in December 2016. The loans portfolio rose by 4.53% annually, propelling the net loans to customer deposits ratio to 34.82% from 34.35% in December of the previous year. More specifically, the ratio of LBP-denominated private sector loans to LBP deposits advanced to 31.25% in November 2017, from 26.32% at year-end 2016 and 26.28% in November 2016. On the other hand, the ratio of foreign currency-denominated private sector loans to foreign currency deposits dropped to 36.59% in November 2017, down from 38.82% at year-end 2016 and 39.89% in November 2016. The consolidated capital accounts of commercial banks operating in Lebanon reached LBP 28,027 billion ($18.66 billion) at end of November 2017, compared to LBP 27,497 billion ($18.24 billion) at end of 2016 and LBP 26,761 billion ($17.75 billion) in November 2016. This can be explained by banks’ continuous reinforcement of their capital base in order to meet BDL’s solvency requirements.
LEBANON NEWS
Weekly Market Watch
SOURCE: ABL, CREDIT LIBANAIS ECONOMIC RESEARCH UNIT 9
USD Billion 2012 2013 2014 2015 Nov-2016 2016 Nov-2017
Total Assets 151.88 164.82 175.70 185.99 200.95 204.31 216.21
Loans to the Private Sector 43.45 47.38 50.90 54.52 56.97 57.18 59.55
Customer Deposits, o/w: 127.66 139.17 147.64 154.95 162.93 166.45 171.00
- Resident Private Sector Deposits 100.91 107.73 114.12 119.73 126.10 128.53 132.44
- Non-Resident Private Sector Deposits 24.09 28.48 30.30 31.86 33.09 33.96 34.37
- Public Sector Deposits 2.66 2.96 3.21 3.37 3.73 3.95 4.19
Capital Accounts 12.64 14.20 15.73 16.67 17.75 18.24 18.66
Dollarization Rate 64.82% 66.14% 65.71% 64.88% 65.30% 65.82% 68.51%
Private Sector Loans/Deposits Ratio 34.04% 34.05% 34.48% 35.19% 34.96% 34.35% 34.82%
- LBP Private Sector Loans/LBP Deposits 20.84% 22.65% 23.58% 24.11% 26.28% 26.32% 31.25%
- FC Private Sector Loans/FC Deposits 41.63% 40.26% 40.53% 41.55% 39.89% 38.82% 36.59%
Source: The Association of Banks in Lebanon, Credit Libanais Economic Research Unit
100.00
150.00
200.00
250.00
2012 2013 2014 2015 2016 Nov-2017
151.88164.82
175.70185.99
204.31216.21
USD Billion
Evolution of Commercial Banks' Consolidated Assets
Source: ABL, Credit Libanais Economic Research Unit

LEBANON NEWS
Weekly Market Watch
SOURCE: ABL, CREDIT LIBANAIS ECONOMIC RESEARCH UNIT 10
GROSS PUBLIC DEBT AT $79.36 BILLION BY NOVEMBER 2017
Lebanon’s gross public debt widened by $889.55 million during the month of November 2017 to $79.36 billion, up from $78.47 billion in October. On an annual basis, gross public debt rose by $4.82 billion from $74.55 billion at end of November 2016. The share of the Lebanese banking sector of gross public debt fell to 41.41% in November, down from 42.50% in October. As far as debt in local currency is concerned, the latter fell by 1.11% month-on-month, yet soared by 5.54% year-on-year to $48.93 billion. On the other hand, debt in foreign currency expanded by 4.97% compared to the previous month and by 7.97% on a yearly basis to $30.43 billion. The share of debt in local currency narrowed to 61.65% of gross public debt by November 2017 (from 63.05% in October), while that in foreign currency increased to 38.35% (from 36.95% in October). Net public debt, which factors out public sector deposits, came in 7.11% higher y-o-y at $69.77 billion, with public sector deposits increasing by 2.00% to $9.59 billion. The chart below captures the annual evolution of Lebanon’s public debt since November 2010, resulting in a 6.49% compounded annual growth in net debt over the concerned period.
Nov-2016 Nov-2017 Y-O-Y % Change
Gross Public Debt 74.55 79.36 6.46% Debt in LBP 46.36 48.93 5.54% Debt in Foreign Currency 28.19 30.43 7.97%Public Sector Deposits 9.40 9.59 2.00%
Net Public Debt 65.14 69.77 7.11%
Public Debt (USD Billion)
Source: The Association of Banks in Lebanon, Credit Libanais Economic Research Unit
Debt in LBP
61.65%
Debt in Foreign
Currency38.35%
Composition of Gross Public Debt by November 2017
Source: ABL, Credit Libanais Economic Research Unit
0.00
10.00
20.00
30.00
40.00
50.00
60.00
70.00
Nov-2010 Nov-2011 Nov-2012 Nov-2013 Nov-2014 Nov-2015 Nov-2016 Nov-2017
44.92 46.1148.87
52.7556.71
60.9465.14
69.77Billions of USD
Evolution of Net Public Debt
Source: ABL, Credit Libanais Economic Research Unit

LEBANON NEWS
Weekly Market Watch
SOURCE: ABL, CREDIT LIBANAIS ECONOMIC RESEARCH UNIT 11
CLEARED CHECKS VOLUME AT 12.23 MILLION IN 2017
According to ABL statistics, the value of cleared checks inched higher to LBP 102,893 billion (distributed over 12,225,233 checks) during the year 2017, in comparison with LBP 102,586 billion (allocated over 12,319,126 checks) in 2016. Of the total value of cleared checks, 68.24% was denominated in foreign currency, versus 70.77% a year before. Similarly, the value of returned checks fell by LBP 46 billion (2.09%) on an annual basis to LBP 2,154 billion in 2017, while the number of returned checks rose by 2.88% y-o-y to 234,333 This is further illustrated in the section below: The number of returned checks expressed as a percentage of the total number of cleared checks inched slightly upwards to 1.92% in 2017, while the value of returned checks calculated as a percentage of the total cleared checks value dropped to 2.09%, down from 2.14% in 2016.
Billion Number Billion Number Value Volume
Cleared Checks-LBP Denominated LBP 29,985 4,285,793 LBP 32,674 4,591,483 8.97% 7.13% Returned Checks-LBP Denominated LBP 546 67,874 LBP 536 79,111 -1.83% 16.56%Cleared Checks-Foreign Currency Denominated $48.14 8,033,333 $46.56 7,633,750 -3.29% -4.97%
Returned Checks-Foreign Currency Denominated $1.10 159,892 $1.07 155,222 -2.36% -2.92%Total Cleared Checks LBP 102,586 12,319,126 LBP 102,893 12,225,233 0.30% -0.76%
Total Returned Checks LBP 2,200 227,766 LBP 2,154 234,333 -2.09% 2.88%
Source: Association of Banks in Lebanon, Credit Libanais Economic Research Unit
Cumulative Check Clearing Activity 2016 2017 Y-O-Y % Change
LBP-Denominated,
31.76%
Foreign Currency-
Denominated, 68.24%
Breakdown of Clearing Activity by Value
Source: ABL, Credit Libanais Economic Research Unit
LBP-Denominated
37.56%Foreign
Currency-Denominated
62.44%
Breakdown of Clearing Activity by Volume
Source: ABL, Credit Libanais Economic Research Unit
2.14%
1.82%
2.28%2.09%
1.64%
2.31%
0.00%
0.50%
1.00%
1.50%
2.00%
2.50%
Total LBP FC
Returned Checks as a Percentage of Cleared Checks (Value)
2016 2017
Source: ABL, Credit Libanais Economic Research Unit
1.85%1.58%
1.99%1.92%1.72%
2.03%
0.00%
0.50%
1.00%
1.50%
2.00%
2.50%
Total LBP FC
Returned Checks as a Percentage of Cleared Checks (Number)
2016 2017
Source: ABL, Credit Libanais Economic Research Unit

LEBANON NEWS
Weekly Market Watch
SOURCE: HIGHER CUSTOMS COUNCIL, CREDIT LIBANAIS ECONOMIC RESEARCH UNIT 12
BALANCE OF TRADE DEFICIT WIDENS TO $14.71 BILLION BY NOVEMBER 2017
On the current account side of the balance of payments, Lebanon’s balance of trade deficit widened by $273 million on an annual basis to just below $14.71 billion during the eleven-month period ending November 2017, up from around $14.44 billion during that same period in 2016, according to statistics published by Lebanon’s Higher Customs Council. Said increase in the deficit was triggered by a $135 million y-o-y rise in imports to $17.30 billion, coupled with a $138 million contraction in exports to around $2.60 billion. China topped the list of countries exporting to Lebanon, with its exports bill reaching almost $1.72 billion (9.93% of Lebanon’s imports). South Africa, on the other hand, led the list of countries importing from Lebanon, with its imports invoice aggregating to $293 million (11.29% of Lebanon’s exports). This is further elaborated in the tables below: Exports of “pearls, precious or semi-precious stones, and metals” accounted alone for 20.62% ($535 million) of total Lebanese exports by November 2017, followed by “prepared foodstuffs, beverages, and tobacco” ($418 million <16.11%>), “base metals and articles of base metal” ($305 million <11.75%>), and “chemical products” ($293 million <11.29%>). On the other hand, “mineral products” constituted the lion’s share of imported goods ($3.38 billion <19.54%>), trailed, and by far, by “chemical products” ($1.94 billion <11.19%>), “machinery & mechanical appliances and electrical equipment” ($1.77 billion <10.23%>), and “vehicles, aircraft, vessels, and associated transport equipment” ($1.71 billion <9.91%>).
South Africa 293 11.29%UAE 229 8.82%Syria 228 8.79%Saudi Arabia 217 8.36%Iraq 159 6.13%Source: Higher Customs Council, Credit Libanais Economic Research Unit
Major Export Destinations (in USD Million)
Balance of Trade Y-O-Y(US$ Million) Nov-2016 Nov-2017 % ChangeExports 2,733 2,595 -5.05%Imports 17,169 17,304 0.79%Trade Balance (14,436) (14,709) 1.89%
For the Eleven-Month Period Ending
Source: Higher Customs Council, Credit Libanais Economic Research Unit
-20,000
-15,000
-10,000
-5,000
0
5,000
10,000
15,000
Nov-2016 Nov-2017
USD Million
Cumulative Balance of Trade Deficit
Exports Imports Deficit
Source: Higher Customs Council, Credit Libanais Economic Research Unit
China 1,718 9.93%Italy 1,625 9.39%Greece 1,256 7.26%Germany 1,123 6.49%U.S.A 1,048 6.06%Source: Higher Customs Council, Credit Libanais Economic Research Unit
Major Import Sources (in USD Million)
Product Value ($ Million)
% ofTotal
Pearls, Precious or Semi-Precious Stones, and Metals 535 20.62%
Prepared Foodstuffs, Beverages, and Tobacco
418 16.11%
Base Metals & Articles of Base Metal 305 11.75%Chemical Products 293 11.29%Others 1,044 40.23%Total Exports 2,595 100%
Breakdown of Exports by Product YTD November 2017
Source: Higher Customs Council, Credit Libanais Economic Research Unit
Product Value ($ Million)
% ofTotal
Mineral Products 3,381 19.54%Chemical Products 1,937 11.19%Machinery & Mechanical Appliances and Electrical Equipment 1,771 10.23%
Vehicles, Aircraft, Vessels, and Associated Transport Equipment 1,714 9.91%
Others 8,501 49.13%Total Imports 17,304 100%
Breakdown of Imports by Product YTD November 2017
Source: Higher Customs Council, Credit Libanais Economic Research Unit
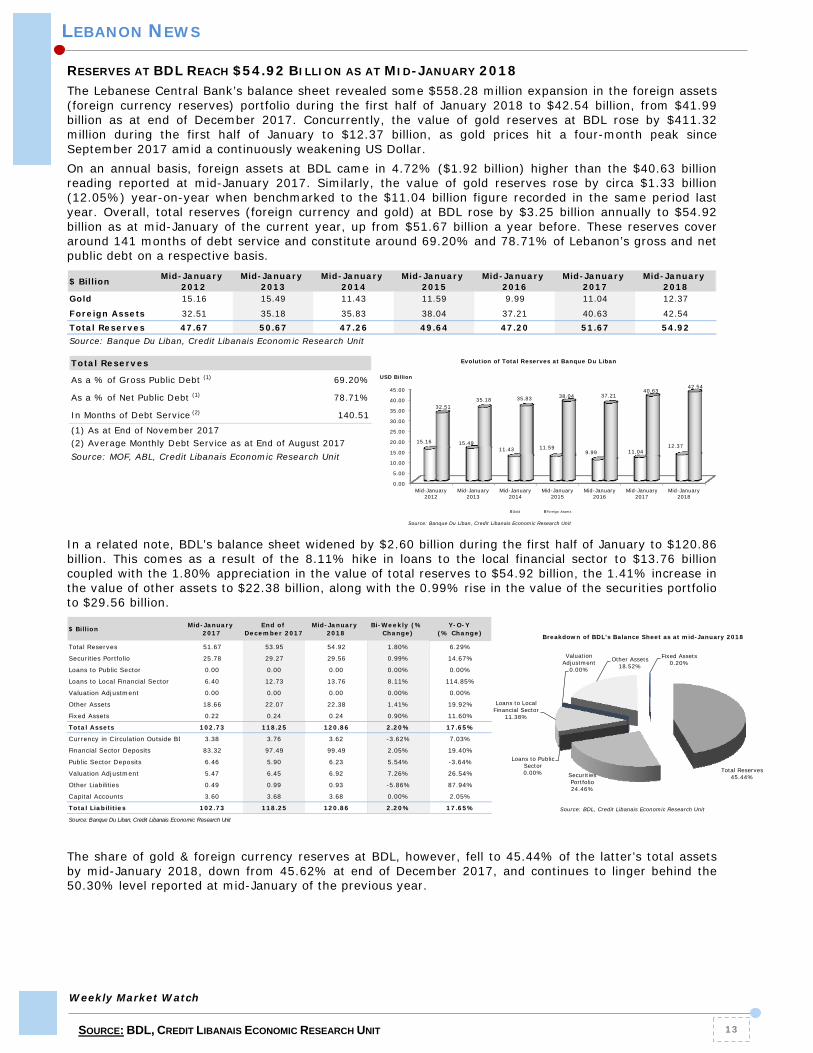
RESERVES AT BDL REACH $54.92 BILLION AS AT MID-JANUARY 2018
The Lebanese Central Bank’s balance sheet revealed some $558.28 million expansion in the foreign assets (foreign currency reserves) portfolio during the first half of January 2018 to $42.54 billion, from $41.99 billion as at end of December 2017. Concurrently, the value of gold reserves at BDL rose by $411.32 million during the first half of January to $12.37 billion, as gold prices hit a four-month peak since September 2017 amid a continuously weakening US Dollar.
On an annual basis, foreign assets at BDL came in 4.72% ($1.92 billion) higher than the $40.63 billion reading reported at mid-January 2017. Similarly, the value of gold reserves rose by circa $1.33 billion (12.05%) year-on-year when benchmarked to the $11.04 billion figure recorded in the same period last year. Overall, total reserves (foreign currency and gold) at BDL rose by $3.25 billion annually to $54.92 billion as at mid-January of the current year, up from $51.67 billion a year before. These reserves cover around 141 months of debt service and constitute around 69.20% and 78.71% of Lebanon’s gross and net public debt on a respective basis.
In a related note, BDL’s balance sheet widened by $2.60 billion during the first half of January to $120.86 billion. This comes as a result of the 8.11% hike in loans to the local financial sector to $13.76 billion coupled with the 1.80% appreciation in the value of total reserves to $54.92 billion, the 1.41% increase in the value of other assets to $22.38 billion, along with the 0.99% rise in the value of the securities portfolio to $29.56 billion. The share of gold & foreign currency reserves at BDL, however, fell to 45.44% of the latter’s total assets by mid-January 2018, down from 45.62% at end of December 2017, and continues to linger behind the 50.30% level reported at mid-January of the previous year.
Weekly Market Watch
SOURCE: BDL, CREDIT LIBANAIS ECONOMIC RESEARCH UNIT 13
LEBANON NEWS
$ Billion Mid-January 2012
Mid-January 2013
Mid-January 2014
Mid-January 2015
Mid-January 2016
Mid-January 2017
Mid-January 2018
Gold 15.16 15.49 11.43 11.59 9.99 11.04 12.37
Foreign Assets 32.51 35.18 35.83 38.04 37.21 40.63 42.54Total Reserves 47.67 50.67 47.26 49.64 47.20 51.67 54.92Source: Banque Du Liban, Credit Libanais Economic Research Unit
0.00
5.00
10.00
15.00
20.00
25.00
30.00
35.00
40.00
45.00
Mid-January2012
Mid-January2013
Mid-January2014
Mid-January2015
Mid-January2016
Mid-January2017
Mid-January2018
15.16 15.4911.43 11.59
9.99 11.0412.37
32.5135.18 35.83 38.04 37.21
40.6342.54
Evolution of Total Reserves at Banque Du Liban
Gold Foreign Assets
Source: Banque Du Liban, Credit Libanais Economic Research Unit
USD Billion
$ Billion Mid-January 2017
End of December 2017
Mid-January 2018
Bi-Weekly (% Change)
Y-O-Y (% Change)
Total Reserves 51.67 53.95 54.92 1.80% 6.29%
Securities Portfolio 25.78 29.27 29.56 0.99% 14.67%
Loans to Public Sector 0.00 0.00 0.00 0.00% 0.00%
Loans to Local Financial Sector 6.40 12.73 13.76 8.11% 114.85%
Valuation Adjustment 0.00 0.00 0.00 0.00% 0.00%
Other Assets 18.66 22.07 22.38 1.41% 19.92%
Fixed Assets 0.22 0.24 0.24 0.90% 11.60%
Total Assets 102.73 118.25 120.86 2.20% 17.65%
Currency in Circulation Outside BD 3.38 3.76 3.62 -3.62% 7.03%
Financial Sector Deposits 83.32 97.49 99.49 2.05% 19.40%
Public Sector Deposits 6.46 5.90 6.23 5.54% -3.64%
Valuation Adjustment 5.47 6.45 6.92 7.26% 26.54%
Other Liabilities 0.49 0.99 0.93 -5.86% 87.94%
Capital Accounts 3.60 3.68 3.68 0.00% 2.05%
Total Liabilities 102.73 118.25 120.86 2.20% 17.65%
Source: Banque Du Liban, Credit Libanais Economic Research Unit
Total Reserves45.44%Securities
Portfolio24.46%
Loans to Public Sector0.00%
Loans to Local Financial Sector
11.38%
Valuation Adjustment
0.00%
Other Assets18.52%
Fixed Assets0.20%
Breakdown of BDL's Balance Sheet as at mid-January 2018
Source: BDL, Credit Libanais Economic Research Unit
Total Reserves
As a % of Gross Public Debt (1) 69.20%
As a % of Net Public Debt (1) 78.71%
In Months of Debt Service (2) 140.51
Source: MOF, ABL, Credit Libanais Economic Research Unit (2) Average Monthly Debt Service as at End of August 2017(1) As at End of November 2017

LEBANON NEWS
CEMENT DELIVERIES DOWN BY 5% Y-O-Y BY NOVEMBER 2017
Cement deliveries, the coincident indicator of construction activity, plunged by 8.39% during the month of November 2017 to 446,775 tons, down from 487,708 tons in October. On a cumulative basis, cement deliveries also fell by 4.96% y-o-y to 4,722,072 tons in the first eleven months of 2017, compared to 4,968,592 tons a year before. Cement deliveries registered a negative compounded annual growth rate (CAGR) of 0.31% over the November 2010 – November 2017 period, mirroring the lackluster activity of Lebanon’s construction sector amidst the pale economic situation. THE COINCIDENT INDICATOR UP BY 4% Y-O-Y IN NOVEMBER 2017
Banque Du Liban’s coincident indicator rose by 5.85% during the month of November 2017 to 323.9, up from 306.0 in October, registering as well a 3.95% annual increase from 311.6 in November 2016. The average monthly growth in the coincident indicator stood at 1.01% during the eleven-month period ended November 2017, compared to an average monthly growth of 0.39% a year before, portraying some improvement in Lebanon’s overall economic activity. It is worth noting that the coincident indicator is a gauge used to measure Lebanon’s macroeconomic activity and comprises the import of petroleum derivatives, electricity production, check clearing activity, cement deliveries, foreign passengers, foreign trade, and the M3 monetary aggregate.
Weekly Market Watch
SOURCE: BDL, CREDIT LIBANAIS ECONOMIC RESEARCH UNIT 14
Nov-2010 4,827,000
Nov-2011 5,103,934
Nov-2012 4,941,516
Nov-2013 5,454,534
Nov-2014 5,071,901
Nov-2015 4,595,143
Nov-2016 4,968,592
Nov-2017 4,722,072
Evolution of Cumulative Cement Deliveries (Tons)
Source: BDL, Credit Libanais Economic Research Unit
01,000,0002,000,0003,000,0004,000,0005,000,0006,000,000 4,827,000
5,103,9344,941,516
5,454,5345,071,901
4,595,1434,968,592 4,722,072
Yearly Evolution of Cumulative Cement Deliveries
Source: BDL, Credit Libanais Economic Research Unit
Tons
270
280
290
300
310
320
330
Nov-16 Jan-17 Mar-17 May-17 Jul-17 Sep-17 Nov-17
311.6
292.2297.2
305.3 306.2
317.6
308.6
290.1
304.0302.0
291.2
306.0
323.9
Evolution of Lebanon's Coincident Indicator
Source: BDL, Credit Libanais Economic Research Unit

LEBANON NEWS
NEW CAR SALES SETTLE 2.47% HIGHER IN 2017
According to the monthly statistics published by the Automobile Importers Association (AIA), new car sales in Lebanon reached 3,226 vehicles during the month of December, compared to 2,672 vehicles in November and 2,713 in December of the preceding year. On a cumulative basis, new car sales edged 2.47% higher year-on-year to 37,222 cars in the full-year 2017, up from 36,326 cars in 2016. This comes as a result of the 2.02% annual increase in the sales of Japanese cars to 13,719 vehicles coupled with the 1.33% improvement in the sales of Korean cars to 12,610 vehicles, the 13.83% rise in the sales of American cars to 2,963 vehicles, and the 82.12% rally in Chinese car sales to 499 cars which outweighed the 1.67% drop in European car sales to 7,431 cars. In the same vein, Japanese cars controlled the lion’s share of new car sales in Lebanon, amassing alone 36.86% of total volume sales in 2017, followed by Korean (33.88%), European (19.96%), American (7.96%), and Chinese (1.34%) cars.
The Korean “KIA” brand recorded total unit sales of 7,610 cars during the year 2017, enjoying the highest market share of 20.44%, followed by the Korean “Hyundai” (4,962 cars <13.33%>) and Japanese “Toyota” (4,269 cars <11.47%>) brands, only to name a few.
Weekly Market Watch
SOURCE: AIA, CREDIT LIBANAIS ECONOMIC RESEARCH UNIT 15
Japanese, 36.86%
European , 19.96%
Korean, 33.88%
American, 7.96%
Chinese, 1.34%
Breakdown of New Car Sales in 2017
- 1,000 2,000 3,000 4,000 5,000 6,000 7,000 8,000
KIA
Hyundai
Toyota
Nissan
Suzuki
Chevrolet
Renault
Mitsubishi
Mazda
Mercedes
7,610
4,962
4,269
3,426
1,954
1,820
1,803
1,124
1,006
983
Top 10 New Car Sales Brands in 2017
Source: AIA, Credit Libanais Economic Research Unit
2016 2017 % ChangeJapanese 13,447 13,719 2.02%European 7,557 7,431 -1.67%Korean 12,445 12,610 1.33%American 2,603 2,963 13.83%Chinese 274 499 82.12%Total 36,326 37,222 2.47%
New Car Sales During the Year
Source: AIA, Credit Libanais Economic Research Unit

Weekly Market Watch
SOURCE: KAFALAT, CREDIT LIBANAIS ECONOMIC RESEARCH UNIT 16
VALUE OF KAFALAT LOANS AT $66.45 MILLION IN 2017
The number of guarantees issued by the government-subsidized program “KAFALAT” fell by 24.02% during the year 2017 to 541, down from 712 a year before. Concurrently, the face value of guarantees plunged by 28.48% y-o-y to just below LBP 100.17 billion ($66.45 million), from LBP 140.06 billion ($92.91 million) in 2016. Consequently, the average value per guarantee shed 5.88% in 2017 to around LBP 185.15 million ($122.82 thousand), compared to LBP 196.71 million ($130.49 thousand) a year earlier. The agricultural sector amassed yet again the bulk (38.82%) of issued Kafalat loans, followed by the industrial (33.64%) and tourism (21.63%) sectors. The “Mount Lebanon” region continued to be the largest beneficiary of Kafalat financing, detaining alone a 40.48% stake of issued Kafalat loans, followed by the “Bekaa” (19.04%), “South” (13.86%), and “Nabatieh” (9.80%) regions.
CORPORATE NEWS
2016 2017 Y-O-Y % Change
Agriculture 328 210 -35.98%
Industry 220 182 -17.27%
Tourism 122 117 -4.10%
Others 42 32 -23.81%
Total 712 541 -24.02%
Value of Guarantees($ Million) 92.91 66.45 -28.48%
Average Value per Guarantee ($000) 130.49 122.82 -5.88%
Kafalat Loans by Sector in the Year
Source: Kafalat, Credit Libanais Economic Research Unit
Agriculture38.82%
Industry33.64%
Tourism21.63%
Others5.91%
Breakdown of Kafalat Loans by Sector in 2017
Source: Kafalat, Credit Libanais Economic Research Unit
2016 2017 Y-O-Y % Change
Beirut 36 40 11.11%
Mount Lebanon 307 219 -28.66%South 87 75 -13.79%Nabatieh 54 53 -1.85%Bekaa 149 103 -30.87%
North 79 51 -35.44%
Total 712 541 -24.02%Source: Kafalat, Credit Libanais Economic Research Unit
Kafalat Loans by Region in the Year
Beirut 7.39%
Mount Lebanon40.48%
South13.86%
Nabatieh9.80%
Bekaa19.04%
North9.43%
Breakdown of Kafalat Loans by Region in 2017
Source: Kafalat, Credit Libanais Economic Research Unit

MONETARY AGGREGATES
All monetary aggregates ended the first week of the year 2018 on a negative note. In fact, the overall money supply, “M4”, narrowed by LBP 59.62 billion on a weekly basis, yet soared by 3.69% on an annual basis to LBP 218,771 billion, notwithstanding the LBP 86 billion increase in the non-banking sector’s Treasury bills portfolio.
Similarly, Lebanese-Pound denominated deposits and currency in circulation, “M1”, fell by LBP 118.35 billion week-on-week to LBP 10,287 billion on the back of some LBP 121 billion drop in demand deposits, which outweighed the LBP 3 billion expansion in money in circulation. On a yearly basis, however, “M1” grew by 1.69%. Concurrently, local currency term deposits, “M2”, shed LBP 51.78 billion on a weekly basis and plunged by 4.27% year-on-year to settle at LBP 78,873 billion.
Consequently, private sector term and saving deposits denominated in LBP (“M2-M1”) gained some LBP 66.56 billion (0.10%) during the week of January 4 to LBP 68,586 billion, while deposits denominated in foreign currencies (“M3-M2”) receded by LBP 93.93 billion (0.07%) to LBP 129,071 billion. MONEY MARKETS
The January 11th Treasury bill auction raised LBP 477.324 billion ($316.63 million), compared to LBP 577.615 billion ($383.16 million) in the auction of the previous week.
The majority of subscriptions (51.52%) was concentrated in the one-year to maturity T-bills, followed by the five-year (31.51%) and three-month (16.97%) tenure treasury securities.
Consequently, the weighted average yield on Lebanese Pound Treasury bills stood at 5.63% in the auction of January 11. The yields on the three-month, one-year, and five-year to maturity Treasury securities remained flat at 4.44%, 5.35%, and 6.74% respectively.
MONETARY PERFORMANCE
Weekly Market Watch
SOURCE: BDL, REUTERS, CREDIT LIBANAIS ECONOMIC RESEARCH UNIT 17
Lebanese Treasury Bills 3 Months 6 Months 12 Months 24 Months 36 Months 60 Months 84 Months 120 MonthsTreasury Yield 4.44% 4.99% 5.35% 5.84% 6.50% 6.74% 7.08% 7.46%
3 Months
6 Months
12 Months
24 Months
36 Months60 Months
84 Months
120 Months
3.00%
3.50%
4.00%
4.50%
5.00%
5.50%
6.00%
6.50%
7.00%
7.50%
8.00%
0 1 2 3 4 5 6 7 8 9
On The Run Yield Curve
Mone y Supply
LBP Billion
M1 10,405 10,287 - 1.14%
M2 78,925 78,873 - 0.07%
M3 208,090 207,944 - 0.07%
M4 218,831 218,771 - 0.03%
M2 - M1 6 8 ,5 2 0 6 8 ,5 8 6 0 .10 %M3 - M2 12 9 ,16 5 12 9 ,0 7 1 - 0 .0 7 %Source: Banque Du Liban, Credit Libanais Economic Research Unit
De c e mbe r 2 8 , 2 0 17 Ja nua ry 4 , 2 0 18 % Cha nge
150,000
200,000
250,000
December 28,2017
January 4,2018
218,831 218,771208,090 207,944
Money Supply - LBP Billion -
M4 M3
Source: BDL, Credit Libanais Economic Research Unit
Lebanese Treasury Bills
Yield (%)Face Value (in billions
of LBP)
% of Total Face Value
3 Months 4.44% 81.022 16.97%12 Months 5.35% 245.916 51.52%60 Months 6.74% 150.386 31.51% Total 477.324 100.00%Source: Reuters, Credit Libanais Economic Research Unit
January 11, 2018
LEBANESE EQUITIES
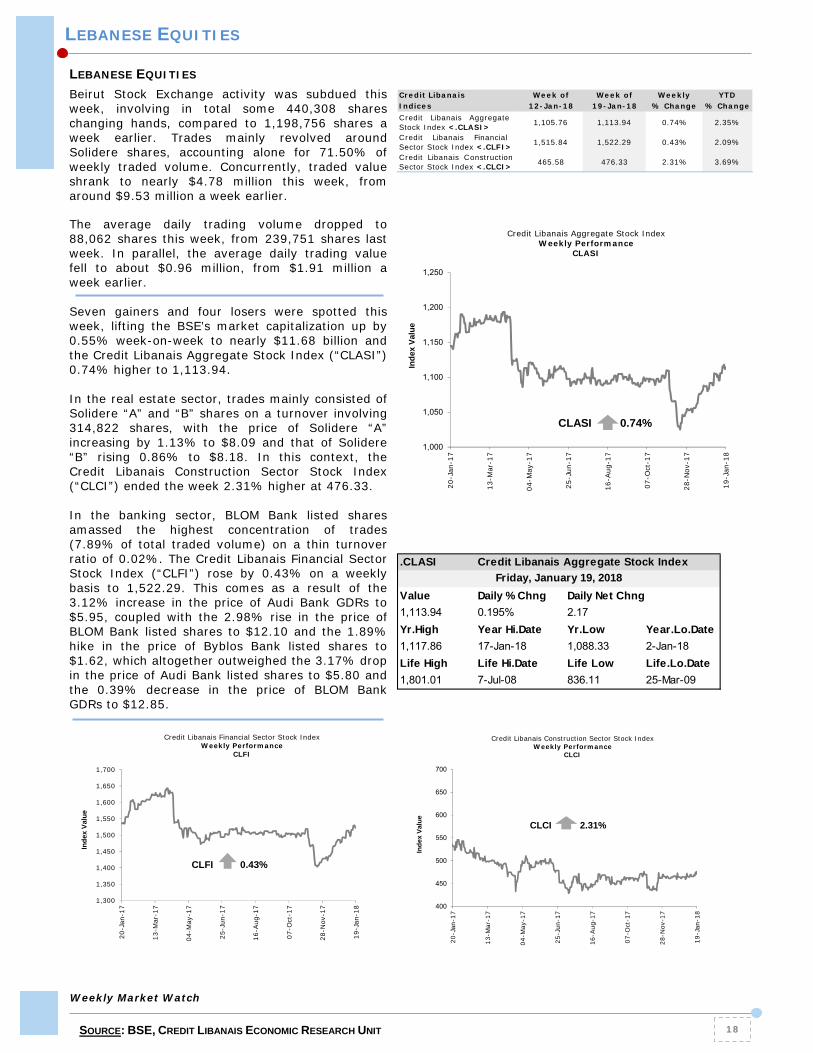
Beirut Stock Exchange activity was subdued this week, involving in total some 440,308 shares changing hands, compared to 1,198,756 shares a week earlier. Trades mainly revolved around Solidere shares, accounting alone for 71.50% of weekly traded volume. Concurrently, traded value shrank to nearly $4.78 million this week, from around $9.53 million a week earlier. The average daily trading volume dropped to 88,062 shares this week, from 239,751 shares last week. In parallel, the average daily trading value fell to about $0.96 million, from $1.91 million a week earlier. Seven gainers and four losers were spotted this week, lifting the BSE’s market capitalization up by 0.55% week-on-week to nearly $11.68 billion and the Credit Libanais Aggregate Stock Index (“CLASI”) 0.74% higher to 1,113.94. In the real estate sector, trades mainly consisted of Solidere “A” and “B” shares on a turnover involving 314,822 shares, with the price of Solidere “A” increasing by 1.13% to $8.09 and that of Solidere “B” rising 0.86% to $8.18. In this context, the Credit Libanais Construction Sector Stock Index (“CLCI”) ended the week 2.31% higher at 476.33. In the banking sector, BLOM Bank listed shares amassed the highest concentration of trades (7.89% of total traded volume) on a thin turnover ratio of 0.02%. The Credit Libanais Financial Sector Stock Index (“CLFI”) rose by 0.43% on a weekly basis to 1,522.29. This comes as a result of the 3.12% increase in the price of Audi Bank GDRs to $5.95, coupled with the 2.98% rise in the price of BLOM Bank listed shares to $12.10 and the 1.89% hike in the price of Byblos Bank listed shares to $1.62, which altogether outweighed the 3.17% drop in the price of Audi Bank listed shares to $5.80 and the 0.39% decrease in the price of BLOM Bank GDRs to $12.85.
LEBANESE EQUITIES
Weekly Market Watch
SOURCE: BSE, CREDIT LIBANAIS ECONOMIC RESEARCH UNIT 18
Credit Libanais Week of Week of Weekly YTDIndices 12-Jan-18 19-Jan-18 % Change % ChangeCredit Libanais AggregateStock Index <.CLASI> 1,105.76 1,113.94 0.74% 2.35%
Credit Libanais FinancialSector Stock Index <.CLFI> 1,515.84 1,522.29 0.43% 2.09%
Credit Libanais ConstructionSector Stock Index <.CLCI> 465.58 476.33 2.31% 3.69%
1,000
1,050
1,100
1,150
1,200
1,250
20-J
an-1
7
13-M
ar-1
7
04-M
ay-1
7
25-J
un-1
7
16-A
ug-1
7
07-O
ct-1
7
28-N
ov-1
7
19-J
an-1
8
Ind
ex V
alu
e
Credit Libanais Aggregate Stock IndexWeekly Performance
CLASI
CLASI 0.74%
.CLASI Credit Libanais Aggregate Stock Index
Value Daily % Chng Daily Net Chng
1,113.94 0.195% 2.17
Yr.High Year Hi.Date Yr.Low Year.Lo.Date
1,117.86 17-Jan-18 1,088.33 2-Jan-18
Life High Life Hi.Date Life Low Life.Lo.Date
1,801.01 7-Jul-08 836.11 25-Mar-09
Friday, January 19, 2018
1,300
1,350
1,400
1,450
1,500
1,550
1,600
1,650
1,700
20-J
an-1
7
13-M
ar-1
7
04-M
ay-1
7
25-J
un-1
7
16-A
ug-1
7
07-O
ct-1
7
28-N
ov-1
7
19-J
an-1
8
Ind
ex V
alu
e
Credit Libanais Financial Sector Stock IndexWeekly Performance
CLFI
CLFI 0.43%
400
450
500
550
600
650
700
20-J
an-1
7
13-M
ar-1
7
04-M
ay-1
7
25-J
un-1
7
16-A
ug-1
7
07-O
ct-1
7
28-N
ov-1
7
19-J
an-1
8
Ind
ex V
alu
e
Credit Libanais Construction Sector Stock IndexWeekly Performance
CLCI
CLCI 2.31%

The market-cap weighted average price to earnings (P/E) and price to book value (P/BV) multiples of listed stocks ended the third week of January higher at 7.836x and 0.846x respectively based on the closing prices of Friday’s session.
LEBANESE EQUITIES
Weekly Market Watch
SOURCE: BSE, CREDIT LIBANAIS ECONOMIC RESEARCH UNIT 19
P/E P/BV
Solidere A $8.09 1.13% 281,796 64.00% $2,246,061 47.03% 100,000,000 809,000 17.59 0.66 1.00%Solidere B $8.18 0.86% 33,026 7.50% $264,988 5.55% 65,000,000 531,700 17.78 0.67 2.51%BLC Bank $0.93 0.00% - - - - 71,033,333 66,061 4.89 0.52 0.00%BLC Bank Preferred Class "B" $100.00 0.00% - - - - 550,000 55,000 n.a n.a 0.00%BLC Bank Preferred Class "C" $100.00 0.00% - - - - 350,000 35,000 n.a n.a 0.00%BLC Bank Preferred Class "D" $101.00 1.00% - - - - 750,000 75,750 n.a n.a 1.00%Bank Audi - Listed Shares $5.80 -3.17% 1,957 0.44% $11,351 0.24% 399,749,204 2,318,545 5.74 0.78 0.87%Bank Audi GDR $5.95 3.12% 25,000 5.68% $148,750 3.11% 119,924,761 713,552 5.89 0.80 1.88%Bank Audi Preferred "G" $100.30 0.00% 500 0.11% $50,150 1.05% 1,500,000 150,450 n.a n.a 0.00%Bank Audi Preferred "H" $100.00 0.00% 1,000 0.23% $100,000 2.09% 750,000 75,000 n.a n.a -0.60%Bank Audi Preferred "I" $100.00 0.00% - - - - 2,500,000 250,000 n.a n.a 0.05%Bank Audi Preferred "J" $100.00 0.00% - - - - 2,750,000 275,000 n.a n.a 0.05%Bank Of Beirut - Listed Shares $18.80 0.00% - - - - 17,746,417 333,633 9.35 1.07 0.00%Bank Of Beirut Priority Shares 2014 $21.00 0.00% - - - - 4,762,000 100,002 10.45 1.20 0.00%Bank Of Beirut Preferred "H" $25.90 0.00% 1,200 0.27% $31,080 0.65% 5,400,000 139,860 n.a n.a 0.00%Bank Of Beirut Preferred "I" $25.85 0.00% 12,666 2.88% $327,416 6.86% 5,000,000 129,250 n.a n.a 1.37%Bank Of Beirut Preferred "J" $25.85 0.00% - - - - 3,000,000 77,550 n.a n.a 0.78%Bank Of Beirut Preferred "K" $25.75 0.00% - - - - 4,000,000 103,000 n.a n.a 1.58%Byblos Bank - Listed Shares $1.62 1.89% 4,515 1.03% $7,313 0.15% 565,515,040 916,134 7.71 0.66 1.25%Byblos Bank Preferred Class 2008 $102.10 -2.67% 750 0.17% $76,575 1.60% 2,000,000 204,200 n.a n.a 0.49%Byblos Bank Preferred Class 2009 $103.90 -0.95% 2,965 0.67% $307,388 6.44% 2,000,000 207,800 n.a n.a 2.87%Byblos Bank GDR $77.70 0.00% 3,541 0.80% $275,136 5.76% 1,309,078 101,715 7.40 0.63 0.00%BEMO Bank - Listed Shares $1.30 0.00% - - - - 51,400,000 66,820 5.20 0.60 0.00%BEMO Bank Preferred Class 2013 $103.30 0.00% - - - - 350,000 36,155 n.a n.a 0.00%BLOM Bank GDR $12.85 -0.39% 20,393 4.63% $262,019 5.49% 73,896,010 949,564 6.00 0.98 1.18%BLOM Bank Listed Shares $12.10 2.98% 34,750 7.89% $418,000 8.75% 215,000,000 2,601,500 5.65 0.92 3.95%RYMCO Class "B" $3.25 0.00% - - - - 10,920,000 35,490 14.77 1.67 0.00%Holcim Liban $15.48 8.63% 16,250 3.69% $249,610 5.23% 19,516,040 302,108 7.94 1.50 7.05%Ciment Blancs Nominal $2.27 0.00% - - - - 9,000,000 20,430 5.97 0.99 0.89%
ClosingWeekly
%Change
Weekly Volume Traded
% of Weekly Volume Traded
% of Weekly Value Traded
Total Listed Shares
Lebanese Equities
Source: Beirut Stock Exchange, Credit Libanais Economic Research Unit
YTD Price Perf.
Note: n.a stands for not applicable
Market Capitalisation
($000)BEIRUT STOCK EXCHANGE
Weekly Value Traded
Previous Last % ChangeValue Traded ($) 9,531,024 4,775,836 -49.89%Volume Traded 1,198,756 440,308 -63.27%Average Daily Trading Value ($) 1,906,205 955,167 -49.89%Average Daily Trading Volume 239,751 88,062 -63.27%Market Cap - BSE ($) 11,616,160,615 11,680,270,104 0.55%Weighted Average P/E 7.765 7.836 0.92%Weighted Average P/BV 0.837 0.846 1.11%Source: Beirut Stock Exchange, Credit Libanais Economic Research Unit
Activity Analysis
Source: BSE, Credit Libanais Economic Research Unit
0
2
4
6
8
Jan 12, 2018 Jan 19, 2018
7.765 7.836
0.837 0.846
Evolution of Beirut Bourse Comparable Benchmarks
P/E P/BV

Weekly Market Watch
SOURCE: CREDIT LIBANAIS ECONOMIC RESEARCH UNIT 20
LEBANON’S MAIN INDICATORS
2 0 11 2 0 12 2 0 13 2 0 14 2 0 15 2 0 16 2 0 17 2 0 18
MACROECONOMIC INDICATORS
GDP (Current Prices) ($ Billion) 40.08 43.87 46.01 47.83 49.46 50.46 52.70* 55.02*
Real GDP Growth Rate 0.92% 2.80% 2.64% 2.00% 0.82% 1.00% 1.50%* 2.00%*
GDP per Capita (Current Prices) ($) 9,144 9,914 10,399 10,810 11,178 11,295 11,684* 12,082*
Foreign Direct Investment Inflows ($ Billion) 3.14 3.11 2.66 2.91 2.35 2.56
FDI/GDP Ratio 7.84% 7.09% 5.78% 5.84% 4.71% 5.13%
INDUSTRY
Industrial Exports ($ Million) 3,530 3,567 3,384 3,150 2,956 2,527 1,822.2 (3)
Import of Industrial Machinery ($ Million) 239 288 300 269 234 236 194.1 (3)
TOURISM
Total Number of Tourists 1,655,051 1,365,845 1,274,362 1,354,647 1,517,927 1,688,357 1,449,517 (3)
Growth in Tax- Free Spending 10% - 6% 4% 8% 2% - 9% 5% (5)
REAL ESTATE
Value of Real Estate Transactions ($ Million) 8,841 9,175 8,708 8,952 8,006 8,482 9,954 (5)
Number of Real Estate Sales Transactions 82,984 74,569 69,198 70,721 63,386 64,248 73,541 (5)
Construction Permits (000 sqm) 13,890 12,362 10,527 11,159 10,294 9,935 9,271 (5)
Cement Delivery (000 tons) 5,550 5,309 5,831 5,517 5,043 5,265 4,722 (4)
TRANSPORTATION
Beirut Port: Freight Activity (000 Tons) 6,677 7,225 8,268 8,281 7,240 8,737 8,629 (5)
Beirut Airport: Number of Passengers (million) 5.65 5.96 6.26 6.57 8.22 7.61 7.61 (4)
FOREIGN TRADE
Imports ($ Million) 20,158 21,280 21,228 20,494 18,069 18,705 17,304 (4)
Exports ($ Million) 4,265 4,483 3,936 3,313 2,952 2,977 2,595 (4)
Trade Balance ($ Million) (15,893) (16,797) (17,292) (17,181) (15,117) (15,729) (14،709) (4)
BALANCE OF PAYMENTS
Net Foreign Assets at the Financial Sector ($ Million) (1,996) (1,537) (1,127) (1,407) (3,354) 1,238 (1,010) (4)
Foreign Assets at BDL ($ Billion) 32.24 35.74 35.29 37.86 37.09 40.71 41.99 42.54 (7)
Gold Reserves at BDL ($ Billion) 14.40 15.31 11.10 10.95 9.85 10.71 11.96 12.37 (7)
PUBLIC FINANCE
Government Expenditures ($ Million) 11,675 13,321 13,640 13,952 13,528 14,867 9,248 (2)
Government Revenues ($ Million) 9,333 9,396 9,420 10,879 9,576 9,923 7,860 (2)
Budget Primary Defic it / Surplus ($ Million) 1,662 (110) (240) 1,307 724 21 1,739 (2)
Total Defic it ($ Million) (2,342) (3,925) (4,220) (3,073) (3,952) (4,944) (1,388) (2)
Defic it / GDP Ratio 5.84% 8.95% 9.17% 6.16% 7.78% 9.54%
Debt Service / GDP Ratio 9.99% 8.25% 8.24% 8.78% 9.21% 9.58%
Net Public Debt ($ Billion) 46.35 49.12 53.18 57.30 61.54 65.42 69.77 (4)
Gross Public Debt/GDP Ratio 133.89% 131.49% 137.95% 139.16% 142.18% 148.72%* 152.29%*
MONETARY AGGREGATES & INFLATION
M4 ($ Billion) 103.50 110.00 117.41 124.53 131.17 139.20 145.16 145.12 (6)
(M2- M1) ($ Billion) 35.82 39.32 40.56 43.27 46.25 47.95 45.45 45.50 (6)
Monetization Level (M2/GDP Ratio) 99.32% 99.97% 98.97% 97.40% 102.46% 105.06%
Change in CPI (%) 4.27% 4.68% 2.05% - 1.66% - 3.40% 3.14% 4.79% (4)
BANKING SYSTEM
Number of Commercial Banks 54 54 56 55 53 50 49 (1)
Number of Branches 948 962 985 1,020 1,039 1,056 1,057 (1)
Total Assets ($ Million) 140,576 151,883 164,821 175,697 185,989 204,311 216,208 (4)
Total Deposits ($ Million) 117,703 127,657 139,166 147,637 154,951 166,446 171,004 (4)
Loans to the Private Sector ($ Million) 39,375 43,452 47,381 50,899 54,224 57,180 59,548 (4)
Customer Loans/ Deposits 33.45% 34.04% 34.05% 34.48% 34.99% 34.35% 34.82% (4)
Dollarization Rate 65.92% 64.82% 66.14% 65.71% 64.88% 65.82% 68.51% (4)
Exchange Rate (LBP to USD) 1,507.50 1,507.50 1,507.50 1,507.50 1,507.50 1,507.50 1,507.50 1,507.50
Recap of Lebanon's Major Indicators
(1) As at End of June, 2017, (2) As at End of August, 2017, (3) As at End of September, 2017, (4) As at End of November, 2017, (5) As at End of December, 2017, (6) As at 4 January, 2018, (7) As at M id-January, 2018
* Figures Reflect IM F Estimates

LEBANON’S RATINGS
Rating Agency Tenor Rating
Long- Te rm B-
Short- Te rm B
Moody's Inve stors Se rvic e Long- Te rm B3
Long- Te rm B-
Short- Te rm B
Source: Fitch Ratings, M oody's Investors Service, S&P Global Ratings
Sta ble
Republic Of Lebanon Sovereign Ratings
Outlook
Sta nda rd & Poor's Globa l Ra tings
Fitc h Ra tings
Sta ble
Sta ble
Rated Banks
Long Term Foreign Currency
Outlook Long Term
IDR
Outlook Long-Term Counterparty Credit Rating
Short-Term Counterparty Credit Rating
Outlook
Bank Audi B3 Stable B- Stable B- C Stable
BLOM Bank B3 Stable - - B- - Stable
Byblos Bank B3 Stable B- Stable - - -
BankMed - - - - B- C Stable
Moody's Investors Service Fitch Ratings
Source: Fitch Ratings, M oody's Investors Service, S&P Global Ratings
S&P Global Ratings
Lebanese Banks' Latest Ratings
Weekly Market Watch
SOURCE: FITCH, MOODY’S, S&P RATINGS, CREDIT LIBANAIS ECONOMIC RESEARCH UNIT 21

CONTACTS
RESEARCH
Fadlo I. Choueiri, CFA
961-1-608 000 EXT: 1280 Jad Abi Haidar, CFA [email protected] 961-1-608 000 EXT. 1283
Joelle Samaha [email protected] 961-1-608 000 EXT. 1281 Mayda Zaarour [email protected] 961-1-608 000 EXT. 1282
Nagham Abdel Ahad [email protected] 961-1-608 000 EXT. 1284
MONEY MARKETS DESK
Robert Araman
961-1-608 000 EXT. 0760
This document is being furnished to you solely for your information and may not be reproduced or redistributed to any other person. This document does not constitute an offer or invitation to subscribe to or purchase any security, and neither this document nor anything contained herein shall form the basis of any contract or commitment whatsoever. Reasonable care has been taken to ensure that the facts stated herein are accurate and the estimates, opinions and expectations contained herein are fair and reliable.
Weekly Market Watch
ECONOMIC RESEARCH UNIT - ADLIEH, BEIRUT LEBANON - TEL: 01-608000 FAX: 01-608231 22