Embed Size (px)
Citation preview
9/6/2011
GG711, Fall 2011 1
Map of the global mid-ocean ridge system.
Southeast Indian Ridge
Pacif ic A n tarctic
Ridge
S outhw
e stIndian
R idge
Carlsber gRidge
CentralIndianRidge
RedSea
Chile
Rise
MidAtla ntic
Rid
ge(M
A R)
Eas t
Pac
ific R
ise
Juan
de
Fuca
Ri d
ge
Gorda
Rid
ge
Galapa
gos
Week 2 - Ocean Ridge Volcanism
outline:
Ridge structure and terminology. segmentation
Locus of volcanism
width of neovolcanic zone
fissure vs point source constructs
volcanic/tectonic histories
Eruptions
frequency, style and size
along axis variations
Magma chamber depth
brief mention of lava chemistry
more about Submarine forms and Effusion rate

9/6/2011
GG711, Fall 2011 2
www.divediscover.whoi.edu/ridge/
Slow-Spreading Mid-Ocean RidgeSlow spreading ridges like the Mid-Atlantic Ridge can have vertical relief of up to a 1000m at the axial valley.
Fast-Spreading Mid-Ocean Ridgelike the EPR. The axial trough is 10s of m deep, as are the fault scarps.
Macdonald et al. 2001, Fig 2

9/6/2011
GG711, Fall 2011 3
Clipperton FZ
Lamont Seamounts
9 ° 30’ N OSC
9° 03’ N OSC
East Pacific Rise at 9° to 10° N

9/6/2011
GG711, Fall 2011 4
First-order segments are hundreds of kilometers long, persist for millions to tens of millions of years and are bounded by relatively permanent, rigid-plate transform faults. The underlying processes differ somewhat in fast- and slow-spreading centers.
These segments are sub-divided into several second- or third-order segments, bounded by a variety of non-rigid discontinuities. These smaller segments lengthen, shorten, or even disappear in 10 million to 100,000 years, respectively.
At the finest scale, fourth-order segments, about 10 kilometers long, may survive for only 100 to 10,000 years. These segments are the products of dike intrusion events, the fundamental units of crustal creation.
Exploring The Global Mid-Ocean Ridge, Oceanus, 1998
The segmented architecture of Mid-ocean ridges.

9/6/2011
GG711, Fall 2011 5
Segment boundaries and Mid-ocean ridge axis depth
crustal magmatic processes associated with ridge segmentation
● Transform fault effect
● Rift propagation effects
Dec
reas
ing
mag
ma
tem
per
atu
re

9/6/2011
GG711, Fall 2011 6

9/6/2011
GG711, Fall 2011 7
discontinuities
Sea floor
Sea floor
Magma chamber top
discontinuities
Zone of volcanic construction at ridges is more inflated at most segment centers (shallower depth, wider)
incr
easi
ng
mag
ma
tem
per
atu
re
Macdonald 2001

9/6/2011
GG711, Fall 2011 8
FAST SLOW
Macdonald 2001
wrong
Macdonald 2001

9/6/2011
GG711, Fall 2011 9
magma differentiation signaturesRubin and Sinton, 2007
cold hot
Spreading rate
morphological signaturesSmall, 1998
Each data point is a ridge section mean of 50-1000 points
11000+ MORB glasses (major elements)2100 glasses + whole rocks (majors/traces/isotopes)Mostly from PetDB plus some literature not yet there
Data manipulation basics:• 37 ridge “sections” – 50 to 500 samples in each• No hot spot influenced MORB• No off axis lavas (4% of PetDB)• Rejection of bad data (1.6%)
Global variations in MORB composition (away from hot spots)
Spreading rate is a proxy for time averaged melt-supply
Hot spotinfluence
Perfit and Chadwick, 1998, Fig 5
Backscatter maps:
A. “Rough” topography common at slow spreading (i.e. low melt supply)
B. and C.Rough and smooth examples at intermediate spreading rate
D. Smooth crust at fast spreading rate
A
C
B
D

9/6/2011
GG711, Fall 2011 10
Global distribution of submarine hydrothermal vent sites (above) and areas of survey coverage (right), Baker and German, 2004.
Neovolcanic zone (NVZ):
Most active volcanism occurs here.
Width increases as spreading rate decreases
Volcanic style transitions from fissure fed to more point source as width increases
Crustal textures vary appropriately
9/6/2011
GG711, Fall 2011 11
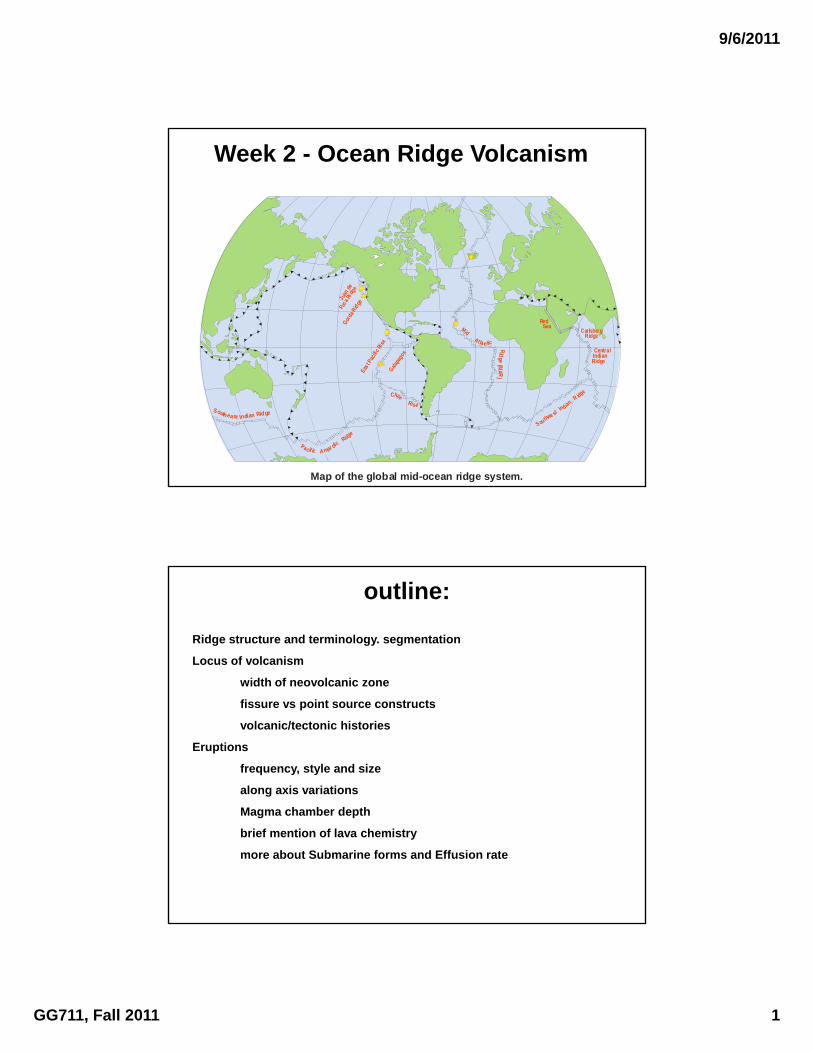
Perfit and Chadwick, 1998, Plate 1
Slow.more point source constructs and wider NeoVolcanic Zone
Fast.more continuous volcanic source and rarer point-source constructs in the NVZ
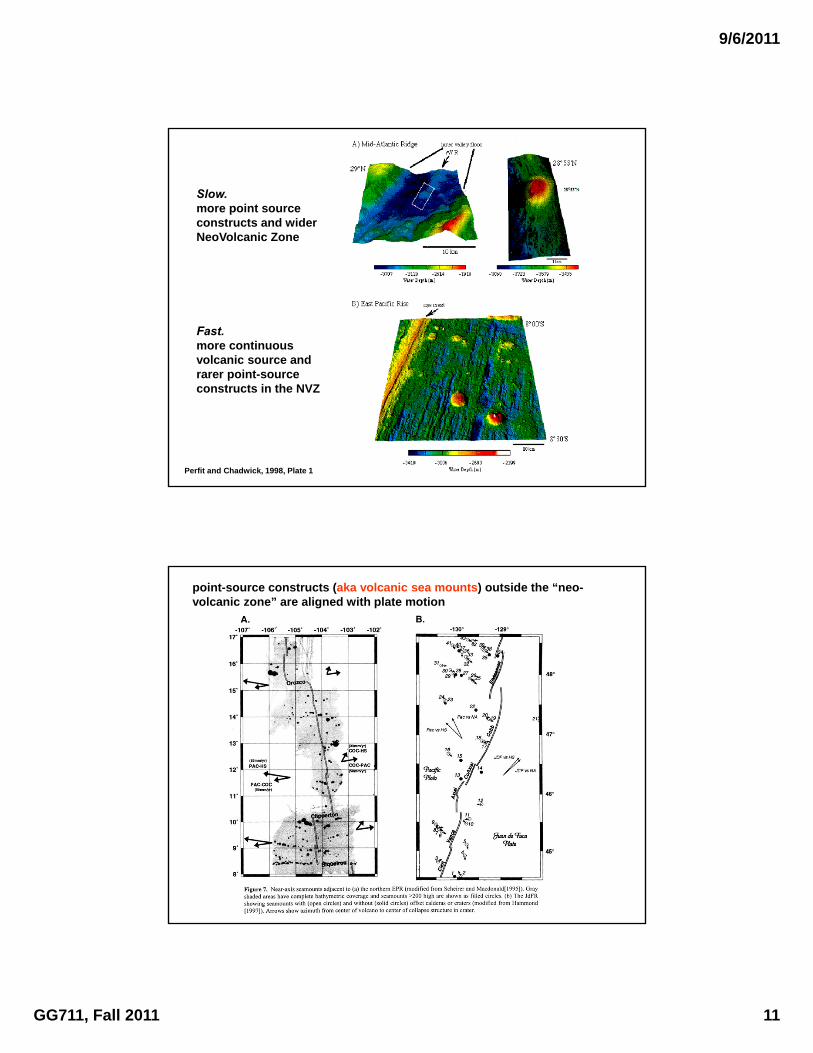
point-source constructs (aka volcanic sea mounts) outside the “neo-volcanic zone” are aligned with plate motion

9/6/2011
GG711, Fall 2011 12
Deeper magma bodies at slower spreading.Also, no steady state melt lens in magma chambers at low spreading rate but yes at faster rates (Sinton and Detrick, 1992)
Shallower = more differentiated
Deeper = less differentiated
Magma supply variations cause predictable links between magma chamber depth and magma chemistry
Rubin and Sinton 2007; Rubin et al., 2009

9/6/2011
GG711, Fall 2011 13
Shallower = more differentiated
Deeper = less differentiated
more magma chamber depth and magma chemistry
Spreading rate
Shallow
Deep
Magma Temp.
HOTTER(less differentiated)
COOLER(more differentiated)
AM
C D
epth
AM
C d
epth
Spreading rate
HOTTER
COOLER
Mag
ma
Tem
p.
+
=
High Magma Supply (e.g., faster spreading) = shallower chamber

9/6/2011
GG711, Fall 2011 14
Petrologic Model for Crustal Formation On the East Pacific Rise 9°- 10° N
Modified from Perfit et al. (1994)
Melt lens
EPR 9°- 10° N SEISMIC MODEL (Dunn et al. 2000)

9/6/2011
GG711, Fall 2011 15
Passive Flow Model for Melt Delivery to the Northern East Pacific Rise
Schematic Geology of the EPR

9/6/2011
GG711, Fall 2011 16
Nested
Surveys
Increasinglyhigher resolution
What can mapping tell us?
Topography
Lava Flow Surface types
Faulting
Axial collapse Troughs in Young Volcanic Terrain
Sheet and Lobate lava flows
No Rift ValleyShallow Fault Scarps
Off-axis Pillow Mounds
Abyssal Hill Formation2-3 km from Axis
Focused Venting
9°-10° N Ridge Crest Characteristics

9/6/2011
GG711, Fall 2011 17
Tectonomagmatic Model for AST Development
Volcanic-tectonic cycles:
periodicity and relative intensity vary throughout the ridge system as a rough function of magma supply and spreading rate
Volcanic and Tectonic Interpretation of DSL-120A Sidescan Data
(Fornari, Soule, Escartin et al., work in progress)

9/6/2011
GG711, Fall 2011 18
Subaerial lava channel issuing from a small vent
Off-axis lava channel complex

9/6/2011
GG711, Fall 2011 19
(Fornari, Soule, Escartin et al., work in progress)

9/6/2011
GG711, Fall 2011 20
Integrating sidescan interpretation, detailed mapping and sampling, with geochemistry and petrology.
From Soule et al. 2005 G3
Crustal and MagmaticEvolution
lava composition distribution. We’ll discuss this more later.
Some questions for now:
Are variations spatial or temporal or both?
What causes the variations in chemistry:
Surficial processes: flow differentiation? Vapor contamination
Magma chamber processes? Crustal plumbing? melt lens segmentation?
Different mantle sources? Depleted vs Enriched
Variable extents/depths of melting?

9/6/2011
GG711, Fall 2011 21
K/TiMgO
We learn a lot about volcanic crustal accretion by studying volcanic deposits from individual eruptions
We’ll return to this topic to discuss some of these later in the semester, but here are a few generalizations

9/6/2011
GG711, Fall 2011 22
Lava flow morphology
Perfit and Chadwick, 1998, Fig 8
Generally higher effusion rate
Generally lower effusion rate

9/6/2011
GG711, Fall 2011 23
Sinton et al., 2002, JGR
-Some trends with magma supply (spreading rate), but the relationships are not likely not statistically significant
-at the present rate of progress it will probably take a few centuries before the data are sufficient to be truly meaningful
he
tero
gen
eity
ind
ex
1
2
3
4
0 20 40 60
1996 N. Gorda
ODP
N. Cleft
1993 CoAxial
Serocki
BBQ
> 11 analyses per flow except "ODP" flow (8 analyses).
Almost all BBQ and Cleft Mounds heterogeneity is on LLDs
Most Gorda and Serocki flow heterogeneity is in parental magmas
flow volume (10 m )6 3
Heterogeneities of some MORB flows/flow sequencesRubin, Smith, Perfit, Sacks, Christie (1998) Deep Sea Res. II, 45
Cleft Mounds

9/6/2011
GG711, Fall 2011 24
1
2
3
4
20 40 60 80 100 120 140 160
Compositional Heterogeneity and
Spreading Rate
More heterogeneity atslower spreading.
more compositional heterogeneity in largevolume lava flows.
Also recall the previous slide showing
Both are consistent with:
10-2
10-3
10-4
10-1
100
0 6020 40
Perfit & Chadwick (1998)
MAR
JdF/Gorda
100
N-EPR
80
Full Spreading Rate (mm/yr)
he
tero
ge
nei
ty i
nd
ex
Eru
pte
d V
olu
me
(km
3 )(Rubin et al., 2001, EPSL)
Small, early data set, but generally larger eruptions at slower spreading rate …and generally more compositionally variable eruptions at slower spreading rate