Embed Size (px)
Citation preview

Whilst every care has been taken in the production of this study, no liability can be accepted for any loss incurred in any way whatsoever by any person who may seek to rely on the information contained herein. All information is supplied in good faith and Charles R. Weber Company, Inc. accepts no responsibility for any and all errors
and omissions contained within this study.
WEEK 23 – 10 JUNE 2016 ISSUE 23 – 2016 Rallyless summer for USG MR rates?
A summer rally in July has occurred consistently since large‐scale PADD 3 CPP exports commenced with the startup of Motiva’s 320,000 b/d expansion of its company’s Port Arthur, TX, refinery in 2013 amid improved overall PADD 3 refining economics accompanying the US’ shale revolution.
The prevailing sour MR environment would appear as a significant challenge to a seasonal upturn, given that USG‐UKC rates are approaching YTD lows last reached in January and USG‐POZOS rates stand at a multiple‐year low. Indeed, compared with historical lows/highs for this time of year, rates presently fall below ranges that include both 2013 to 2015 and 2011 to 2015. Lower bunker prices partly offset the lower prevailing rates from an earnings perspective – as does the onward trade environment in the UKC market; triangulated USG‐UKC/UKC‐USAC/USG TCEs presently at ~$10,200/day match levels observed during June 2014 – but are above the record low since 2013 of ~$8,400/day (May 2014). Moreover, whereas 2Q14 marked the worst quarter since 2013, a seasonal rally did follow and July 2014’s triangulated TCE average was ~$17,218/day while USG‐UKC rates rose to a weekly average of the equivalent of ws190 (basis 2016 flat rates) during the week of 14 July.
So, while this year’s rate trend appears to be resembling the years prior to 2013’s USG CPP export jump, which were characterized by a seasonal downturn during the summer due to an influx of units servicing the US’ summer gasoline imports, it also appears to be following that of 2014 (when June’s poor rate environment also caused participants to question the likelihood of a summer rally).
Prevailing MR availability levels are not excessively high. Last week ended with 38 units available on a two‐week forward basis; this compares with an average of 37 units since we commenced the time series at the start of 2014. Incidentally, last week’s 38 units compares with 53 units during the same week in 2014. Our time series shows a record high of 63 units – or 66% more than at present. Participants have noted that a number of units are presently bound for Mexico’s East Coast and will quickly repopulate USG position lists, but comparing fixtures, AIS data and position lists, we note that those units presently on voyages to ECMex and not included on position lists totals nine units – which would boost the two‐week forward availability view to 47. Currently, units freeing on the US East Coast are almost exclusively ballasting to Europe given more supportive rates there, but even including all USAC positions as USG available units, the USG availability count rises to 56 – thus still shy of the 63 units available around this time during 2014.
On the demand side, fixtures remain elevated. The four‐week moving average of USG fixtures stood at 32 last week. This compares with a weekly average of 29 since 2013. High PADD 3 distillate inventories, strong regional refinery utilization rates and modest refining capacity gains all imply strong prospects for exports. The recent strikes in France have curtailed diesel arbitrage activities as uncertainty prevails over the ability to move diesel inland from terminals. Once the labor unrest is resolved, we expect that the arbitrage window will open and boost export cargoes to Europe
2016 2015
VLCC TCE AG-USG / CBS-SPORE/AG¹
MTD Average ~$55,903/Day
Month y/y -33%
S’MAX TCE 130k WAF-UKC
MTD Average ~$23,974/Day
Month y/y -37%
A’MAX TCE 70k CBS-USG
MTD Average ~$17,059/Day
Month y/y -62%
P’MAX TCE 50k CBS-USG
MTD Average ~$8,057/Day
Month y/y -77%
MR TCE USG-UKC/ UKC-USAC/USG
MTD Average ~$9,590/Day
Month y/y -70%
s

Whilst every care has been taken in the production of this study, no liability can be accepted for any loss incurred in any way whatsoever by any person who may seek to rely on the information contained herein. All information is supplied in good faith and Charles R. Weber Company, Inc. accepts no responsibility for any and all errors
and omissions contained within this study.
which will see the exit of tonnage from the USG market. Moreover, the stronger US gasoline demand which has contributed, in part, to the higher availability of MRs in the USG market should decline modestly on both the recent trend for those units to return to Europe and the reduction of recent fixtures to the US due to French strike action which has complicated some trans‐Atlantic gasoline movements.
A significant near‐term obstacle to positive USG MR rate progression is the availability of a high number of LR units. However, rebounding LR2 and LR1 rates in alternative markets could prompt some to ballast away from the market while the reopening of arbitrage opportunities to Europe and/or Asia should quickly consume these units, allowing MRs to commend stronger rates in their absence.
On this basis, we remain guardedly optimistic that MRs will bounce from current lows in the coming weeks and observe gains which, while less pronounced than during 2015, will represent a seasonal rally. Will 2016 resemble 2011‐2012?
…or 2014?
US Crude Stocks (EIA)
Last Week 532.5 MnBbls
Week y/y +13.2%
US Gasoline Demand (EIA)
Last week 9.568 MnB/d
Week y/y -0.2%
2016 2015
Whilst every care has been taken in the production of this study, no liability can be accepted for any loss incurred in any way whatsoever by any person who may seek to rely on the information contained herein. All information is supplied in good faith and Charles R. Weber Company, Inc. accepts no responsibility for any and all errors
and omissions contained within this study.
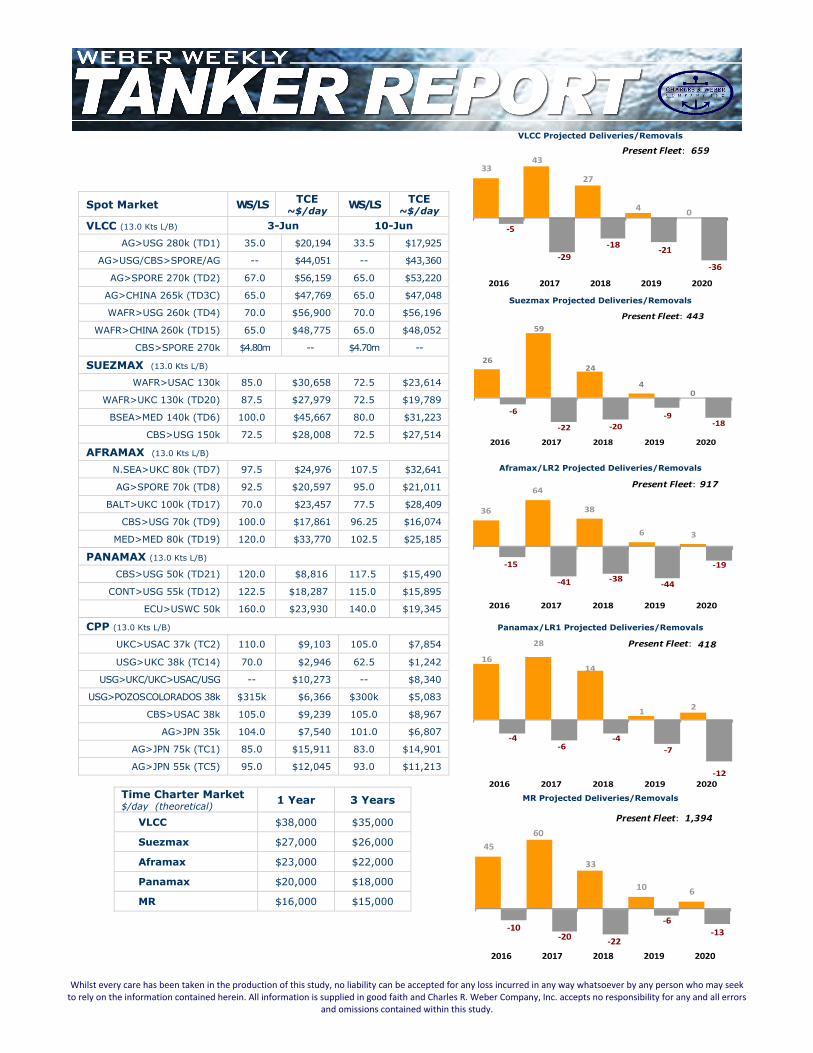
Spot Market WS/LS TCE ~$/day WS/LS TCE
~$/day VLCC (13.0 Kts L/B) 3-Jun 10-Jun
AG>USG 280k (TD1) 35.0 $20,194 33.5 $17,925
AG>USG/CBS>SPORE/AG -- $44,051 -- $43,360
AG>SPORE 270k (TD2) 67.0 $56,159 65.0 $53,220
AG>CHINA 265k (TD3C) 65.0 $47,769 65.0 $47,048
WAFR>USG 260k (TD4) 70.0 $56,900 70.0 $56,196
WAFR>CHINA 260k (TD15) 65.0 $48,775 65.0 $48,052
CBS>SPORE 270k $4.80m -- $4.70m --
SUEZMAX (13.0 Kts L/B) WAFR>USAC 130k 85.0 $30,658 72.5 $23,614
WAFR>UKC 130k (TD20) 87.5 $27,979 72.5 $19,789
BSEA>MED 140k (TD6) 100.0 $45,667 80.0 $31,223
CBS>USG 150k 72.5 $28,008 72.5 $27,514
AFRAMAX (13.0 Kts L/B) N.SEA>UKC 80k (TD7) 97.5 $24,976 107.5 $32,641
AG>SPORE 70k (TD8) 92.5 $20,597 95.0 $21,011
BALT>UKC 100k (TD17) 70.0 $23,457 77.5 $28,409
CBS>USG 70k (TD9) 100.0 $17,861 96.25 $16,074
MED>MED 80k (TD19) 120.0 $33,770 102.5 $25,185
PANAMAX (13.0 Kts L/B) CBS>USG 50k (TD21) 120.0 $8,816 117.5 $15,490
CONT>USG 55k (TD12) 122.5 $18,287 115.0 $15,895
ECU>USWC 50k 160.0 $23,930 140.0 $19,345
CPP (13.0 Kts L/B) UKC>USAC 37k (TC2) 110.0 $9,103 105.0 $7,854
USG>UKC 38k (TC14) 70.0 $2,946 62.5 $1,242
USG>UKC/UKC>USAC/USG -- $10,273 -- $8,340
USG>POZOS COLORADOS 38k $315k $6,366 $300k $5,083
CBS>USAC 38k 105.0 $9,239 105.0 $8,967
AG>JPN 35k 104.0 $7,540 101.0 $6,807
AG>JPN 75k (TC1) 85.0 $15,911 83.0 $14,901
AG>JPN 55k (TC5) 95.0 $12,045 93.0 $11,213
Time Charter Market $/day (theoretical) 1 Year 3 Years
VLCC $38,000 $35,000
Suezmax $27,000 $26,000
Aframax $23,000 $22,000
Panamax $20,000 $18,000
MR $16,000 $15,000
VLCC Projected Deliveries/Removals
3343
27
40
‐5
‐29
‐18‐21
‐36
2016 2017 2018 2019 2020
Present Fleet: 659
Suezmax Projected Deliveries/Removals
26
59
24
40
‐6
‐22 ‐20
‐9‐18
2016 2017 2018 2019 2020
443Present Fleet:
Aframax/LR2 Projected Deliveries/Removals
36
64
38
6 3
‐15
‐41 ‐38‐44
‐19
2016 2017 2018 2019 2020
Present Fleet: 917
Panamax/LR1 Projected Deliveries/Removals
16
28
14
12
‐4‐6
‐4
‐7
‐122016 2017 2018 2019 2020
Present Fleet: 418
MR Projected Deliveries/Removals
45
60
33
10 6
‐10‐20
‐22
‐6
‐13
2016 2017 2018 2019 2020
Present Fleet: 1,394

Whilst every care has been taken in the production of this study, no liability can be accepted for any loss incurred in any way whatsoever by any person who may seek to rely on the information contained herein. All information is supplied in good faith and Charles R. Weber Company, Inc. accepts no responsibility for any and all errors
and omissions contained within this study.
SPOT MARKET SUMMARY
VLCC VLCC chartering activity moderated this week with the Middle East fixture tally off by four as compared with last week to 27 and the West Africa market adding one fixture to a total of five. The distribution of the week’s activity around the start saw owners initially resist last done levels but softer demand levels thereafter ultimately saw rates trade largely unchanged. The AG‐FEAST benchmark concluded modestly above its week‐ago level having added 2.5 points to ws67.5.
Near‐term rate progression appears likely to be negative, despite a sustained improved supply/demand positioning due to the expected lag between the Middle East market’s June program conclusion and the commencement of July stems. We note that with 123 June cargoes covered thus far, there are a further ten estimated to remain. Against this, there are 22 units available through the end of the month, from which seven are likely to be drawn to the West Africa market, implying an end‐June Middle East surplus of just five units. Though representing low surplus, the upcoming week will likely see charterers cover remaining June cargoes but pause thereafter ahead of their July cargo confirmations. This inactivity – and the fact that West Africa draws could be distributed over more than a week – implies a likely weakening of sentiment due to the psychology of limited demand.
Middle East Rates to the Far East added 2.5 points to conclude at ws67.5 with corresponding TCEs rising by 3% to ~$49,541/day. Rates to the USG via the Cape were off by one point to ws34. Triangulated Westbound trade earnings at present AG‐USG and CBS‐SPORE assessments stand at ~$52,674/day, representing a w/w loss of 4%.
Atlantic Basin The West Africa market continued to lag the Middle East. Rates on the WAFR‐FEAST route added 4.5 points to conclude at ws65 with corresponding TCEs rising by 11% to ~$47,991/day. The Caribbean market remained quiet, causing regional rates to observe fresh losses on fresh testing. The CBS‐SPORE route was off by $100k to $4.7m lump sum.
Suezmax Chartering demand in the West Africa Suezmax market was stronger this week with the fixture tally rising by a third to 12. However, with delays – and the specter thereof – due to strike action in France declining, rates were softer in the Black Sea market, extending negative pressure to the West Africa market as well. The WAFR‐UKC benchmark dropped 15 points to conclude at ws72.5. Though charterers will likely start working early July West Africa cargoes during the upcoming week, early Suezmax demand could be muted as buying interest has been light (and reports indicate unsold June cargoes) amid the uncertain security situation facing Nigeria’s energy infrastructure. The resultant negative pressure on differentials to Brent could stoke later purchases of regional grades and support rates at that time, but modest demand during the upcoming week will likely prevent any rebounding of rates.
Aframax Demand in the Caribbean Aframax market rose by 21% w/w to a four‐week high of 17 fixtures. Though rates appeared poised to post fresh gains thanks to the demand gains – which were largely concentrated at the start of the week – a trailing of fresh inquiry from mid‐week saw a negative trend prevail and rates eased incrementally thereafter. Ultimately, the CBS‐USG route lost 3.75 points to conclude at ws96.25. Rates should stabilize during the upcoming week failing a pronounced change on the demand side.
Panamax An expanding of availability coinciding with charterers’ progression into the month’s second decade in the Caribbean market saw rates weaken early during the week. Thereafter, the disappearance of a small number of units from position lists saw the trend reverse as the regional position list tightened. The CBS‐USG route concluded off by 2.5 points at ws117.5, having earlier dropped to as low as ws115.
Projected OECD Oil Demand
44.0
45.0
46.0
47.0
48.0
OPEC OECD IEA OECD EIA OECD
Projected World Oil Demand
85.0
87.0
89.0
91.0
93.0
95.0
97.0
OPEC World IEA World EIA World

Whilst every care has been taken in the production of this study, no liability can be accepted for any loss incurred in any way whatsoever by any person who may seek to rely on the information contained herein. All information is supplied in good faith and Charles R. Weber Company, Inc. accepts no responsibility for any and all errors
and omissions contained within this study.
MR The USG MR market remained weak this week with rates on the USG‐UKC route testing fresh YTD lows and intraregional rates sank further into multiple‐year low territories. Activity levels were off modestly on a w/w basis; a total of 30 fixtures were reported this week vs. 31 last week. Of this week’s tally, 6 were bound for points in Europe (+50% w/w), 18 were bound for points in Latin America and the Caribbean (unchanged w/w) and six were yet to be determined or bound for alternative areas. Though demand in the European market was light, rates there were stable which continues to attract USAC positions (and three were fixed with PADD 1 product exports). This, combined with the sustained elevated demand USG demand levels of recent weeks, trimmed USG availability levels. The number of units on position lists at the close of the week dropped 26 % w/w to a five‐week low of 28 units. The lower availability rates coinciding with a potential reopening of distillate arbitrage opportunities driven by declining strike actions in France could help to halt the pace of rate erosion during the upcoming week.
ws 40
ws 60
ws 80
ws 100
ws 120
ws 140
ws 160
ws 180
ws 200
‐
5
10
15
20
25
30
35
40
45
50
1 '15
4 7 10 13 16 19 22 25 28 31 34 37 40 43 46 49 52 2 5 8 11 14 17 20 23
Weekly Ex‐USG MR Fixtures vs. 38 kMT USG‐UKC Rates
Europe Latin America Caribbean Other USG‐TA ('16 WS)Charles R. Weber Company

Whilst every care has been taken in the production of this study, no liability can be accepted for any loss incurred in any way whatsoever by any person who may seek to rely on the information contained herein. All information is supplied in good faith and Charles R. Weber Company, Inc. accepts no responsibility for any and all errors
and omissions contained within this study.
REPORTED TANKER SALES
“Isis” 116,093/07 – Universal Tsuneishi – DH ‐Sold for $26.45m to undisclosed Greek buyers. “Batissa” 51,506/08 – STX Jinhae – DH – IMO III “Bursa” 51,463/08 – STX Jinhae – DH – IMO III ‐Sold en bloc for $44.0m to undisclosed buyers. “Front Avon” 50,800/13 – STX Jinhae – DH “Front Esk” 49,526/14 – STX Jinhae – DH “Front Dee” 49,494/14 – STX Jinhae – DH “Front Clyde” 49,478/14 – STX Jinhae – DH “Front Arrow” 49,452/14 – STX Jinhae – DH “Front Mersey” 49,420/14 – STX Jinhae – DH ‐Sold en bloc for $172.5m to Irish buyers (Ardmore). “Atlantic Hope” 47,128/08 – Hyundai Mipo – DH – IMO III ‐Sold for $22.0m to undisclosed buyers. “Golden Pacific” 18,041/12 – Zhejiang Hangchang – DH ‐Sold for $12.0m to undisclosed Greek buyers. Unit laid‐up since 09/2015. “Ipsilantis” 3,645/06 – Nakatani – DH ‐Sold for $6.7m to Philippine buyers (Chelsea Shipping Corp).
REPORTED TANKER DEMOLITION SALES
There are no reported tanker demolition sales for week 23.
$100
$150
$200
$250
$300
$350
$400
$450
Bangladesh China India Pakistan
Tanker Demolition Values ($/ldt)52‐Week Trend
¹Monthly triangulated VLCC AG‐USG/CBS‐SPORE/AG TCE averages based on aveage CBS‐SPORE assessments and prior‐month AG‐USG assessments to reflect earnings reality for units engaged in this trade.
Charles R. Weber Company, Inc.
George P. Los Senior Market Analyst Charles R. Weber Research
Greenwich Office Park Three, Greenwich, CT 06831 Tel: +1 203 629‐2300 Fax: +1 203 629‐9103
www.crweber.com
1001 McKinney Street, Suite 475
Houston, TX 77002 Tel: +1 713 568‐7233 Fax: +1 713 337‐6486