Embed Size (px)
Citation preview

Linux on System z
WebSphere on IBM System z 64-bit and31-bit studies with J2EE workloads
���

Linux on System z
WebSphere on IBM System z 64-bit and31-bit studies with J2EE workloads
���

NoteBefore using this information and the product it supports, read the information in “Notices” on page 49.
Contents
Figures . . . . . . . . . . . . . . . v
Tables . . . . . . . . . . . . . . . vii
About this publication . . . . . . . . ix
Chapter 1. Introduction . . . . . . . . 1
Chapter 2. Hardware and softwareconfiguration . . . . . . . . . . . . 5Server hardware and software - LPAR . . . . . . 5Client hardware and software . . . . . . . . 6
Chapter 3. System setup . . . . . . . 7Environment . . . . . . . . . . . . . . 7Network setup. . . . . . . . . . . . . . 8Workload generator systems . . . . . . . . . 9
Chapter 4. Linux kernel settings . . . . 11WebSphere Application Server Linux kernel settings 11
Enabling 31-bit WebSphere Application Server onIBM System z to use 1 GB JVM . . . . . . . 11Setting swappiness parameter to zero. . . . . 11
Linux kernel settings for the workload generatorsystems. . . . . . . . . . . . . . . . 12Linux kernel settings for the DB2 UniversalDatabase system. . . . . . . . . . . . . 13
Chapter 5. Setting up WebSphere andDB2 Universal Database . . . . . . . 15WebSphere V6.1.0 configuration . . . . . . . 15
Java DataBase Connectivity connection pools . . 15
Java DataBase Connectivity data sourceproperties . . . . . . . . . . . . . . 16Object Request Broker thread pool. . . . . . 17WebContainer thread pool . . . . . . . . 17Default thread pool. . . . . . . . . . . 18HTTP transport settings . . . . . . . . . 18Enterprise Java Beans cache settings . . . . . 20Tune the Java Virtual Machine properties . . . 20Other Java Virtual Machine arguments . . . . 22Transaction service properties . . . . . . . 23Disable Java 2 security. . . . . . . . . . 23
DB2 V9.5 configuration . . . . . . . . . . 24Initial database setup . . . . . . . . . . 24Tuning the populated database . . . . . . . 24DB2 autoconfigure command . . . . . . . 25
Chapter 6. Workload description. . . . 27
Chapter 7. Results . . . . . . . . . . 29Heapsize for the 64-bit Java Virtual Machine . . . 29Comparing 64-bit WebSphere versus 31-bitWebSphere . . . . . . . . . . . . . . 31CPU scaling study . . . . . . . . . . . . 35Database LPAR analysis . . . . . . . . . . 39Network study – 1 Gb Ethernet versus 10 GbEthernet . . . . . . . . . . . . . . . 42
Appendix. Configuration, tuning, andperformance scripts . . . . . . . . . 47
Notices . . . . . . . . . . . . . . 49Trademarks . . . . . . . . . . . . . . 51Terms and conditions . . . . . . . . . . . 52
© Copyright IBM Corp. 2009 iii

iv WebSphere on IBM System z 64-bit and 31-bit studies with J2EE workloads
Figures
1. System configuration for the customer workload 82. Setting JDBC connection pools . . . . . . 163. JDBC data source configuration . . . . . . 174. Thread pool . . . . . . . . . . . . 185. HTTP transport settings . . . . . . . . 196. EJB cache settings . . . . . . . . . . 207. Java Virtual Machine settings . . . . . . 228. Heap size studies of 64-bit WebSphere:
throughput and CPU load at workloadsubmission rate 300 and 500, and differentJVM heap percentages of total availablememory. . . . . . . . . . . . . . 30
9. CPU utilization and corresponding averageresponse times at different JVM heappercentages . . . . . . . . . . . . 31
10. 64-bit and 31-bit WebSphere comparison: CPUutilization and throughput . . . . . . . 34
11. 64-bit and 31-bit WebSphere comparison:Response time (in milliseconds) . . . . . . 34
12. CPU scaling study: Workload transaction rateswith 31-bit and 64-bit WebSphere . . . . . 37
13. CPU scaling study: CPU utilization with 31-bitand 64-bit WebSphere . . . . . . . . . 38
14. CPU scaling study: Response times with 31-bitand 64-bit WebSphere . . . . . . . . . 38
15. Database LPAR analysis: Database transactionrate for scaling WebSphere Application ServerCPUs and workload submission rate. . . . . 40
16. Database LPAR analysis: CPU utilization onDatabase LPAR . . . . . . . . . . . 41
17. Database LPAR analysis: Normalized internalSQL transaction rate . . . . . . . . . 41
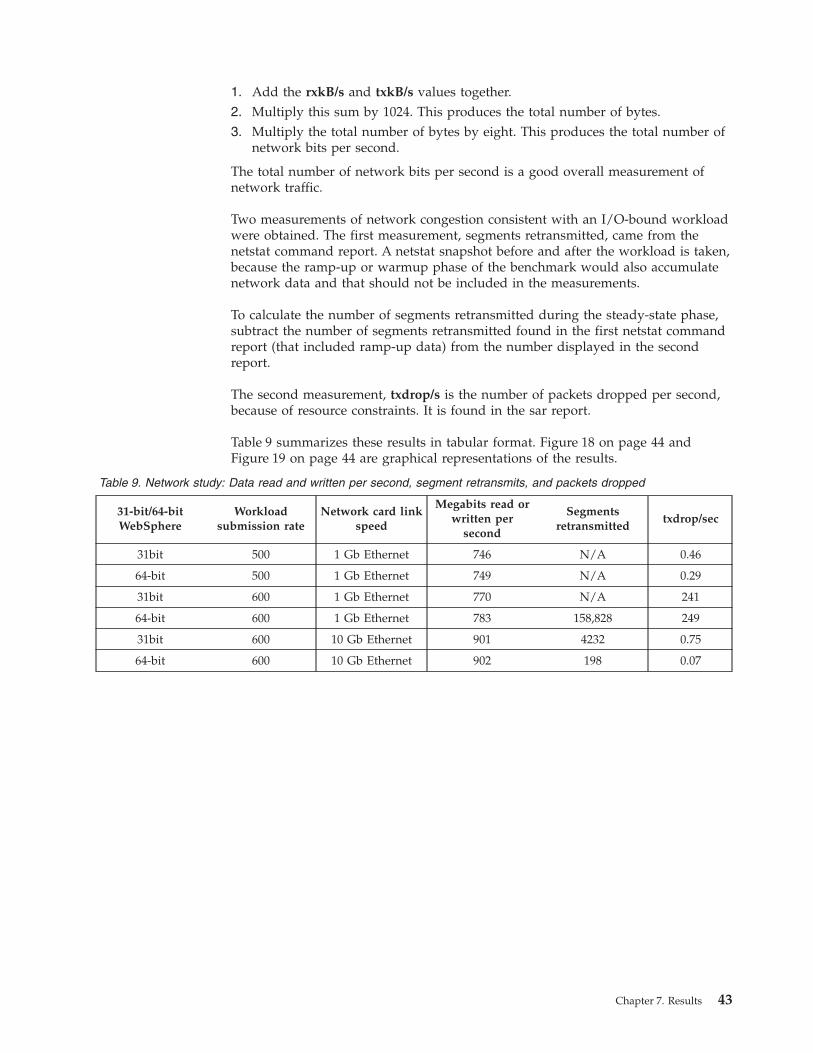
18. Network study: Utilization of the 1 Gb OSAcard from the WebSphere Application Serverfrom the traffic to the clients . . . . . . . 44
19. Network study: Utilization of the 10 Gb OSAcard from the WebSphere Application Serverfrom the traffic to the clients . . . . . . . 44
© Copyright IBM Corp. 2009 v

vi WebSphere on IBM System z 64-bit and 31-bit studies with J2EE workloads
Tables
1. Server hardware . . . . . . . . . . . 52. Server storage . . . . . . . . . . . . 53. Server software . . . . . . . . . . . 64. Client software . . . . . . . . . . . . 65. Heapsize studies of 64-bit WebSphere:
throughput, CPU load, and response timeusing workload submission rate 300 and 500,and different JVM heap percentages of totalavailable memory . . . . . . . . . . 29
6. 64-bit and 31-bit WebSphere comparison: CPUutilization, workload throughput, and responsetime measurements . . . . . . . . . . 33
7. CPU scaling study: WebSphere V6.1 CPUScaling results for one, two, four, and eightCPUs at high CPU utilization . . . . . . 37
8. Database LPAR analysis: DB2 UDB CPUutilization and throughput . . . . . . . 40
9. Network study: Data read and written persecond, segment retransmits, and packetsdropped . . . . . . . . . . . . . 43
© Copyright IBM Corp. 2009 vii

viii WebSphere on IBM System z 64-bit and 31-bit studies with J2EE workloads
About this publication
Authors
Dr. Juergen Doelle
Paul V. Sutera
Acknowledgements
Thank you to these people for their contributions to this project:Eugene OngRobert Wisniewski
The benchmarks were performed at the IBM System z World Wide BenchmarkCenter in Poughkeepsie, NY.
How to send your comments
Your feedback is important in helping to provide the most accurate and highestquality information. If you have any comments about this publication, send yourcomments using IBM Resource Link at http://www.ibm.com/servers/resourcelink.Click Feedback on the navigation pane. Be sure to include the name of thedocument and the specific location of the text you are commenting on (forexample, a page number or table number).
© Copyright IBM Corp. 2009 ix

x WebSphere on IBM System z 64-bit and 31-bit studies with J2EE workloads
Chapter 1. Introduction
This study measures performance and throughput for the WebSphere® ApplicationServer (both 64-bit and 31-bit) on Linux® for IBM® System z® with Java™ 2Platform, Enterprise Edition (J2EE) workloads.¹
There are many customer workloads based on Web applications, including thosethat use Web servers, J2EE-based middleware, and backend databases. For thesetests, a workload that heavily exercises all the major J2EE components, but doesnot make heavy use of resources on the backend database, was chosen. Using thisworkload, various performance studies of IBM WebSphere 6.1.0.15 on Linux forIBM System z with a DB2® database using Java-based clients, including servletsand Java Server Pages (JSPs), were conducted.
The advantage of 64-bit WebSphere is its ability to make use of a much larger JavaVirtual Machine (JVM) heap than the 31-bit version. In theory, a 64-bit machine canaddress up to 16 exabytes of storage, millions of times more than the physicalmemory typically found on most computers. Of the available memory dedicated toa Linux system, a JVM heap can occupy a large percentage of that memory, but notall of the memory. Even on a system that only runs WebSphere and Java, there arestill memory requirements outside of the heap for thread-level program stackallocation.1
Objectives
The objective of these tests was to use a representative workload to test differentWebSphere Application Server environments and settings for a Java-basedapplication on Linux for IBM System z. The environment was three-tiered,consisting of:v Up to three J2EE clientsv A WebSphere Application Server in 31-bit or 64-bit mode, both running on 64-bit
Linux for IBM System zv An IBM DB2 Universal Database™ (UDB) on Linux for IBM System z
The objectives include:v Study JVM heap size in 64-bit mode.v Compare 64-bit versus 31-bit performance on WebSphere 6.1.0.v Study Central Processing Unit (CPU) scaling.
This information will help IT architects design and choose the correct size formiddleware and database resources for Web-based J2EE applications that makeheavy use of J2EE middleware components such as:v Servletsv Java Server Pages (JSPs)v Enterprise Java Beans (EJBs)
1. This paper is intended to provide information regarding performance of environments using WebSphere Application Server 6.1. Itdiscusses findings based on configurations that were created and tested under laboratory conditions. These findings may not berealized in all customer environments, and implementation in such environments may require additional steps, configurations,and performance analysis. The information herein is provided ’AS IS’ with no warranties, express or implied. This informationdoes not constitute a specification or form part of the warranty for any IBM products.
© Copyright IBM Corporation © IBM 2009 1
v EJB Container Managed Persistencev Java Messaging Services (JMS)v Transactionsv Database connections
Executive summary
This study explores the performance of a WebSphere Application Server 6.1 systemunder a customer-like J2EE application workload. This study includes a verydetailed description of how the test environment was set up and how the systemswere configured. The difference in performance behavior of the 31-bit and the64-bit WebSphere versions was compared, and the impact of heap size and garbagecollection was analyzed.
CPU scaling studies explored the maximum workloads using one, two, four, andeight Central Processing Units (CPUs) and showed a very good linear scaling,making it easy for a system administrator to plan the resources needed for scalingthis workload.
Results show that with a special scenario at the highest workload level, whichused eight CPUs, the 64-bit WebSphere version with a large heap produced thebest results. With the high computing power of the IBM System z10™, the networkbandwidth becomes a critical factor. At the highest workload submission rate (therate that workload transactions are sent to WebSphere), a 10 Gb Ethernet card wasneeded to manage the traffic from the workload generating clients.
The results show also that the bandwidth of the interconnect between WebSphereand the database has a significant impact on performance. The HiperSockets™
connection under LPAR is a very appropriate connectivity type for this.
Summary
The IBM WebSphere Application Server helps drive business agility by providingdevelopers and IT architects with an innovative, performance-based foundation tobuild, reuse, run, integrate, and manage Service Oriented Architecture (SOA)applications and services. IBM DB2 Universal Database (UDB) provides a databasemanagement system for mission-critical enterprise data. WebSphere as an interfaceto DB2 provides a means for the Web-enablement of data and business logic.WebSphere introduced support for 64-bit platforms early in Version 6, whilecontinuing to provide a 31-bit WebSphere able to run in compatibility mode.
Java Virtual Machines (JVMs) in 64-bit mode have provided key advantages,including a significantly larger Java heap size, as well as Java code optimizations.The IBM System z 31-bit WebSphere provides a maximum heap size ofapproximately 1 GB, while the 64-bit WebSphere heap can address as much as 256TB, far exceeding the available physical memory of the current platforms.
This study set up and used a system that provides a high throughput for aworkload using all major J2EE components on the WebSphere Application Server.The characteristics of the workload used in this study are that throughput dependsprimarily on the submission rate selected when installing the workload. Whensufficient resources are available to support a certain submission rate, moreresources do not increase the throughput. The first indicators of processorover-utilization are increasing response times and increasing CPU utilization.
2 WebSphere on IBM System z 64-bit and 31-bit studies with J2EE workloads
While there are advantages of running on a 64-bit JVM WebSphere, there are alsodisadvantages, including 8-byte pointers and a greater memory requirementoverall. This study showed that 64-bit WebSphere could equal or exceed theperformance of 31-bit WebSphere with a more conventional middleware-intensiveworkload. However, in some tests, 64-bit WebSphere showed a slightly degradedperformance when compared to 31-bit WebSphere.
While throughput data from this workload is fairly identical across botharchitectures, Central Processing Unit (CPU) percent-busy statistics showed that64-bit WebSphere is, in scenarios with high workloads, able to use its much largerheap size to provide efficiencies of scale at the higher workload submission rates.
At lower submission-rate workloads, 31-bit WebSphere still had a performanceadvantage in terms of shorter response times, because the number of stored objects(EJBs, JSPs) was smaller and fit comfortably in the 31-bit 1 GB (1024 MB) heap.Garbage collection durations were short, even if frequent. The comparison studieswere prepared by first studying the optimal heap size for the 64-bit WebSphereJVM. It was found that for the workload used in this study, a Java heap sizeranging between 70% and 75% of the system memory resulted in the best trade-offbetween maximum throughput, short response times, and low CPU utilization.
A CPU utilization rate greater than 90% was not observed for the higherworkloads, indicating an unidentified bottleneck. This bottleneck might be theHiperSockets connection between the WebSphere Application Server and thedatabase. Additional investigation would be required. The high CPU utilizationrate of 97% for the run with one CPU on 64-bit WebSphere becomes a criticalthreshold for a system running with HiperSockets. This high utilization is verylikely the reason for the high response times observed on the run with one CPU.
The CPU load of the DB2 LPAR is generally quite light for the transactionworkload. A full CPU is rarely used unless there are already eight CPUs used onthe WebSphere system. The workload generally uses short data records and doesnot use complex SQL statements, so the backend database load is expected to belight. The higher cost on the 64-bit WebSphere at a submission rate of 110 stronglysuggests that the WebSphere CPU load is too high for the HiperSockets connection,because missing CPU resources on the middleware will cause overhead on thedatabase.
The workload also shows good linear scaling until the highest workload. At thehighest workload, throughput declines, falling away from a linear relationship.Here, the 64-bit version performs better than the 31-bit version. The poor responsetimes at the highest workload are an indication of resource contention. It isassumed that the critical resource here is again the interconnect to the database.The database shows a decline in throughput and CPU at a fixed ratio (that is, theCPU cost per transaction stays the same), indicating that the database waits toreceive requests from the application sever. Because there is no contention for CPU,this strongly suggests that the interconnect is the cause of the bottleneck.
The high response times with the workload submission rate of 600 in LPAR modecould be easily attributed to network I/O traffic from the clients reaching the limitof the 1 Gb Ethernet from the WebSphere system being tested. In this study, thelimiting factor was the amount of packages, where the number of 80 000 packagescould be considered as close to the upper limits of a 1 Gb Ethernet interface orcard. Using a 10 Gb Ethernet card improved that situation.
Chapter 1. Introduction 3

4 WebSphere on IBM System z 64-bit and 31-bit studies with J2EE workloads
Chapter 2. Hardware and software configuration
To perform the 64-bit and 31-bit WebSphere study with J2EE workloads, acustomer-like environment was created.
Server hardware and software - LPARThe server side of the 64-bit and 31-bit WebSphere study with J2EE workloadsused two LPARs, one for the WebSphere application server and one for the DB2database server.
IBM WebSphere Version 6.1 host and IBM DB2 UniversalDatabase host
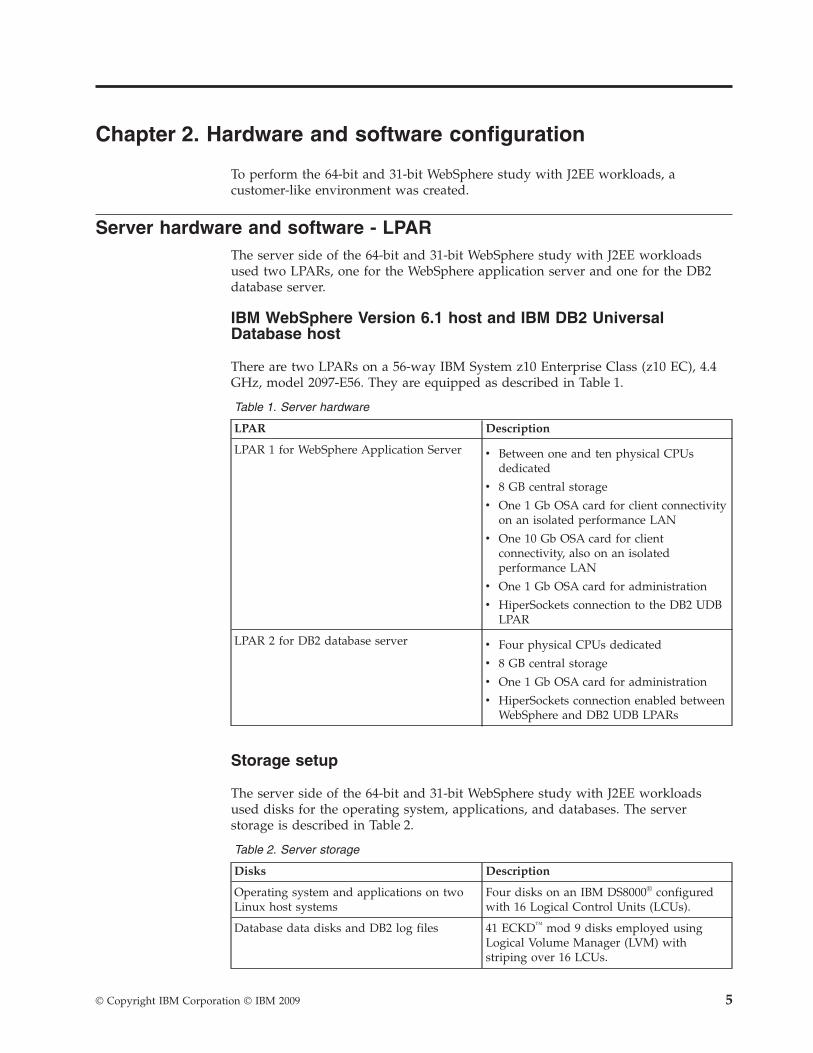
There are two LPARs on a 56-way IBM System z10 Enterprise Class (z10 EC), 4.4GHz, model 2097-E56. They are equipped as described in Table 1.
Table 1. Server hardware
LPAR Description
LPAR 1 for WebSphere Application Server v Between one and ten physical CPUsdedicated
v 8 GB central storage
v One 1 Gb OSA card for client connectivityon an isolated performance LAN
v One 10 Gb OSA card for clientconnectivity, also on an isolatedperformance LAN
v One 1 Gb OSA card for administration
v HiperSockets connection to the DB2 UDBLPAR
LPAR 2 for DB2 database server v Four physical CPUs dedicated
v 8 GB central storage
v One 1 Gb OSA card for administration
v HiperSockets connection enabled betweenWebSphere and DB2 UDB LPARs
Storage setup
The server side of the 64-bit and 31-bit WebSphere study with J2EE workloadsused disks for the operating system, applications, and databases. The serverstorage is described in Table 2.
Table 2. Server storage
Disks Description
Operating system and applications on twoLinux host systems
Four disks on an IBM DS8000® configuredwith 16 Logical Control Units (LCUs).
Database data disks and DB2 log files 41 ECKD™ mod 9 disks employed usingLogical Volume Manager (LVM) withstriping over 16 LCUs.
© Copyright IBM Corporation © IBM 2009 5
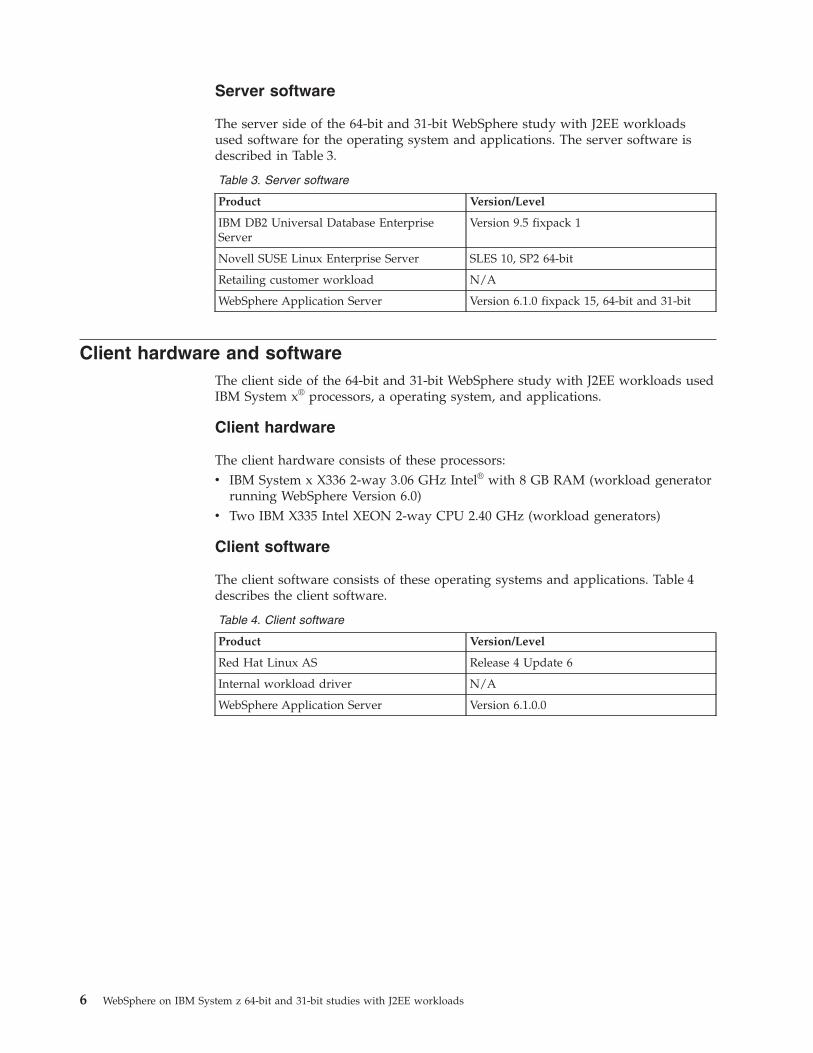
Server software
The server side of the 64-bit and 31-bit WebSphere study with J2EE workloadsused software for the operating system and applications. The server software isdescribed in Table 3.
Table 3. Server software
Product Version/Level
IBM DB2 Universal Database EnterpriseServer
Version 9.5 fixpack 1
Novell SUSE Linux Enterprise Server SLES 10, SP2 64-bit
Retailing customer workload N/A
WebSphere Application Server Version 6.1.0 fixpack 15, 64-bit and 31-bit
Client hardware and softwareThe client side of the 64-bit and 31-bit WebSphere study with J2EE workloads usedIBM System x® processors, a operating system, and applications.
Client hardware
The client hardware consists of these processors:v IBM System x X336 2-way 3.06 GHz Intel® with 8 GB RAM (workload generator
running WebSphere Version 6.0)v Two IBM X335 Intel XEON 2-way CPU 2.40 GHz (workload generators)
Client software
The client software consists of these operating systems and applications. Table 4describes the client software.
Table 4. Client software
Product Version/Level
Red Hat Linux AS Release 4 Update 6
Internal workload driver N/A
WebSphere Application Server Version 6.1.0.0
6 WebSphere on IBM System z 64-bit and 31-bit studies with J2EE workloads
Chapter 3. System setup
A detailed system setup for the 64-bit and 31-bit WebSphere study with J2EEworkloads is described.
EnvironmentA customer-like environment was used for the 64-bit and 31-bit WebSphere studywith J2EE workloads.
To emulate a customer environment, these components are used:v A workload driver that emulates a retail and manufacturing workloadv A single WebSphere V 6.1 Application Server to host the applicationv A DB2 UDB V9.5 database
Figure 1 on page 8 shows the configuration used for the testing.
© Copyright IBM Corp. 2009 7
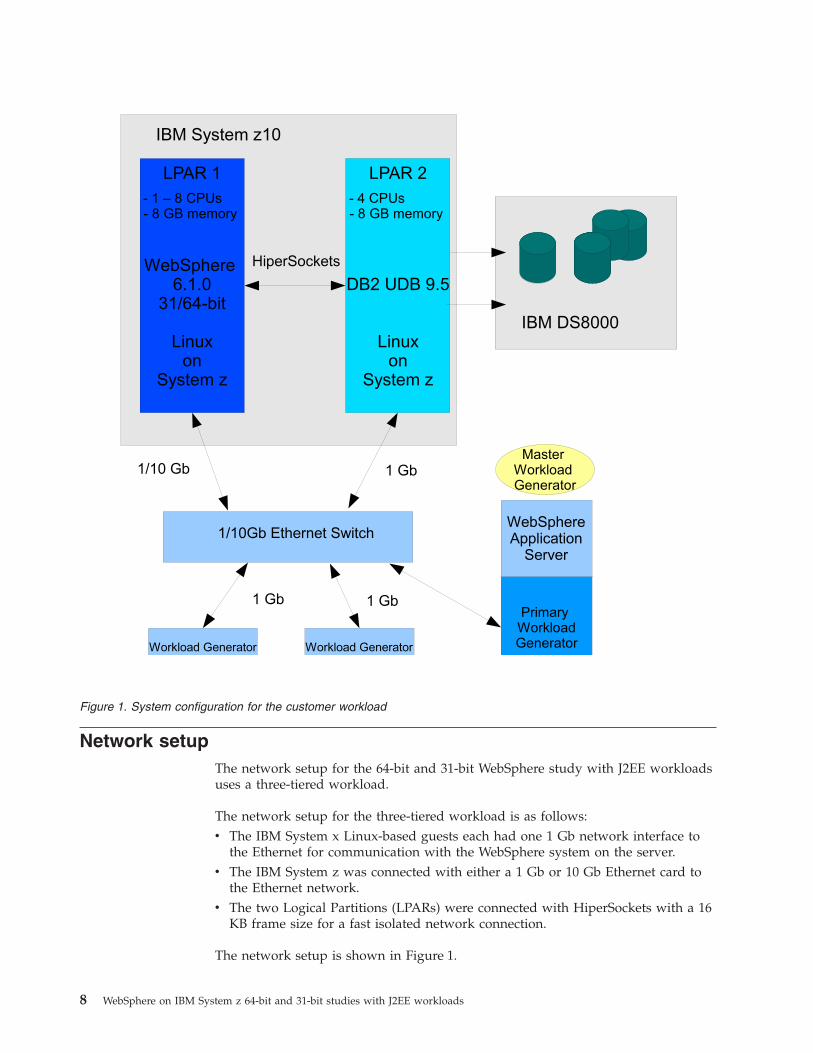
Network setupThe network setup for the 64-bit and 31-bit WebSphere study with J2EE workloadsuses a three-tiered workload.
The network setup for the three-tiered workload is as follows:v The IBM System x Linux-based guests each had one 1 Gb network interface to
the Ethernet for communication with the WebSphere system on the server.v The IBM System z was connected with either a 1 Gb or 10 Gb Ethernet card to
the Ethernet network.v The two Logical Partitions (LPARs) were connected with HiperSockets with a 16
KB frame size for a fast isolated network connection.
The network setup is shown in Figure 1.
Figure 1. System configuration for the customer workload
8 WebSphere on IBM System z 64-bit and 31-bit studies with J2EE workloads
Workload generator systemsUp to three IBM System x systems are used to generate the workload for the 64-bitand 31-bit WebSphere study with J2EE workloads.
A WebSphere Application Server is present on the master workload generator, butnot on the helper machines. These helpers only need a working Java RuntimeEnvironment (JRE).
A workload generator consisting of multithreaded independent Java processes wasalso used. These processes run on all the clients, including the master client.
At workload submission rates greater than 500, two additional client systems areneeded to create the workload.
Chapter 3. System setup 9

10 WebSphere on IBM System z 64-bit and 31-bit studies with J2EE workloads
Chapter 4. Linux kernel settings
Different Linux kernel settings were used to optimize performance on theWebSphere Application Server, workload generator, and the DB2 UniversalDatabase systems.
WebSphere Application Server Linux kernel settingsTo specify the Linux kernel settings for the WebSphere Application Server, enablethe use of a 1 GB JVM, and set the swappiness parameter to zero.
To configure the WebSphere Application Server kernel settings, perform thesetasks:v “Enabling 31-bit WebSphere Application Server on IBM System z to use 1 GB
JVM”v “Setting swappiness parameter to zero”
Enabling 31-bit WebSphere Application Server on IBM Systemz to use 1 GB JVM
A 31-bit WebSphere Application Server on IBM System z must be changed to use a1 GB Java Virtual Machine (JVM), in order to improve performance.
Normally, you cannot define more than 768 MB of JVM heap on a 31-bitdistribution of WebSphere Application Server. However, with Linux, you can usethe mapped_base support to enable your system to have up to 1 GB of heap.Unpredictable results occur if you exceed the 1 GB value. To enable this capability,place this line into the startServer.sh startup script:echo 268435456 >/proc/self/mapped_base
The startServer.sh script now looks like this (bold is added for emphasis only):nwas3:/opt/IBM/WebSphere/AppServer/profiles/AppSrv01/bin # cat startServer.sh#!/bin/shecho 268435456 >/proc/self/mapped_baseWAS_USER_SCRIPT=/opt/IBM/WebSphere/AppServer/profiles/AppSrv01/bin/setupCmdLine.shexport WAS_USER_SCRIPT/opt/IBM/WebSphere/AppServer/bin/startServer.sh "$@"
Setting swappiness parameter to zeroSetting the swappiness parameter to zero ensures that application pages will not bemoved to swap space.
The swappiness parameter influences the kernel preference to move memory pagesfrom applications to swap page, versus reclaiming memory from the cache. Aftersystem restart, set the swappiness parameter to zero. This ensures that if memoryis constrained, the page cache is reduced in an attempt to recover memory beforeapplication pages are moved to swap space:echo 0 >/proc/sys/vm/swappiness
This setting might improve or degrade the performance of an application. Becausethere is adequate memory already dedicated to this workload, large amounts of
© Copyright IBM Corp. 2009 11
memory would not need to be swapped to disk. Because precautionary (early)swapping is now avoided, the study results are free of the effects of this kind ofswapping.
Linux kernel settings for the workload generator systemsSome Linux kernel settings must be permanently increased to run the driverworkload.
To change the Linux kernel settings, add a shell script named performance.sh todirectory /etc/profile.d. The processing of /etc/profile calls any shell scripts inthe /etc/profile.d directory.
Shell script performance.sh should have these lines:echo "20000" > /proc/sys/net/core/netdev_max_backlogecho "20000" > /proc/sys/net/core/somaxconnecho "30" > /proc/sys/net/ipv4/tcp_fin_timeoutecho "20" > /proc/sys/net/ipv4/tcp_syn_retriesecho "20" > /proc/sys/net/ipv4/tcp_synack_retriesecho "3" >/proc/sys/net/ipv4/conf/all/arp_ignoreecho "2" >/proc/sys/net/ipv4/conf/all/arp_announce
ulimit -n 50000
The ulimit -n 50000 command sets the maximum number of open file descriptors(and therefore the maximum number of open files) to 50000. The default value is30000.
The echo commands establish the network settings that produce the largestthroughput without excessive time outs or retries. These are the echo commandarguments:
netdev_max_backlogSpecifies the maximum number of incoming packets that can be enqueuedfor upper-layer processing. This is a global variable.
somaxconnSpecifies the maximum number of pending connection requests queued forany listening socket. These are set to high values that reflect theexpectation of a high initial and high sustained number of bothconnections and incoming packets.
tcp_fin_timeoutSpecifies how long to keep sockets in the state FIN-WAIT-2 if the socket isbeing closed. A longer timeout means that socket structures are held inmemory longer, while the current timeout value of 30 seconds assumesreasonable completion times and conserves memory.
tcp_syn_retriesSpecifies how many times to try to retransmit the initial SYN packet for anactive TCP connection attempt. The current setting is 20, which means thatthere are 20 retransmission attempts before the connection times out. Thiscan take several minutes, depending on the length of the retransmissionattempt.
tcp_synack_retriesSpecifies how many times to try to establish a passive TCP connection thatwas started by another host. This parameter is also set to a fairly smallvalue for the same reasons that the tcp_syn_retries parameter was set to afairly small value.
12 WebSphere on IBM System z 64-bit and 31-bit studies with J2EE workloads
arp_ignoreDefines different modes for sending replies in response to received ARPrequests that resolve local target IP addresses. An arp_ignore value of 3means to not reply for local addresses configured within the host, but toreply only for global and link addresses.
arp_announceDefines different restriction levels for announcing the local source IPaddress from IP packets in ARP requests sent on interface. Anarp_announce value of 2 means to always use the best local address forthis target, even if it means ignoring the source IP address and choosingthe preferred IP address for the destination host.
Linux kernel settings for the DB2 Universal Database systemThese are the DB2 Universal Database (UDB) Linux kernel settings.
The kernel semaphore settings recommended for DB2 are used. To use thesesettings, the kernel.sem setting is placed in the file /etc/sysctl.conf.kernel.sem=”250 32000 32 4096”
The values in this line are:v The first value is the number of semaphores per array: 250.v The second value is the maximum number of semaphores system wide: 32000.v The third value is the maximum number of operations per semop call: 32.v The fourth value is the maximum number of semaphore arrays: 4096.
The use of these values also implies a maximum number of system-widesemaphores, which is calculated by multiplying the maximum number ofsemaphore arrays by the number of semaphores per array (4096 multiplied by250). In this case, the value for system wide semaphores was capped at 32 000.
This setting is activated automatically at system start time when the boot.sysctlservice is enabled, or at run time by issuing this command:sysctl -p /etc/sysctl.conf
Also, the kernel swappiness parameter is set to zero, as described in “Settingswappiness parameter to zero” on page 11.
Chapter 4. Linux kernel settings 13

14 WebSphere on IBM System z 64-bit and 31-bit studies with J2EE workloads
Chapter 5. Setting up WebSphere and DB2 UniversalDatabase
To optimize the performance of WebSphere and DB2, tuning scripts are definedand used.
The scripts included in “Configuration, tuning, and performance scripts,” on page47 were used to tune WebSphere and DB2 Universal Database (UDB) for theworkload. The WebSphere scripts are jacl-based and run only one time. The DB2tuning scripts are run each time that the database is created. Adapting the bufferpools and configuration settings improves DB2 performance. Modifications of theWebSphere settings are needed in addition to the jacl scripts, as well as changes tosettings that are part of the tests.
WebSphere V6.1.0 configurationSettings are chosen to improve the performance of WebSphere when running thisworkload. While many of these settings are applicable to other workloads, thesettings and their chosen values might not be appropriate for productionenvironments.
Java DataBase Connectivity connection poolsJDBC connection pools are established to allow multithreaded applications torequest resources from a backend database without having to incur the connectand disconnect overhead on every database request.
Using larger Java DataBase Connectivity connection pools has the advantage ofholding previously-used connections active in the pool, so that applications andapplication threads can share (or pool) their backend database connections.Subsequent requests by different threads can use an existing connection and avoidthe overhead of new connection creation and teardown, as well as the overhead ofbeing queued.
Increasing the size of the connection pool increases the memory requirements onWebSphere and DB2. Therefore, the connection pool requirements must bebalanced against available server memory. Users from Web-based applicationsoften issue short-lived transactions, where reducing connect and disconnect timescan provide greatly improved response times.
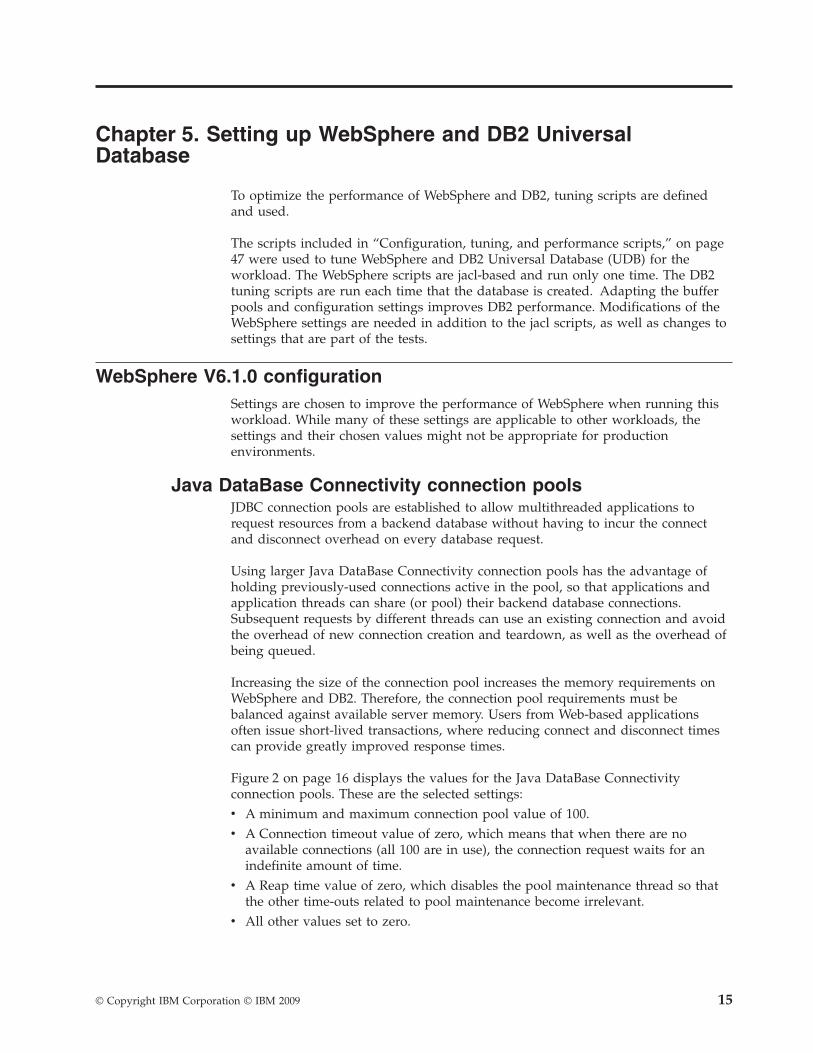
Figure 2 on page 16 displays the values for the Java DataBase Connectivityconnection pools. These are the selected settings:v A minimum and maximum connection pool value of 100.v A Connection timeout value of zero, which means that when there are no
available connections (all 100 are in use), the connection request waits for anindefinite amount of time.
v A Reap time value of zero, which disables the pool maintenance thread so thatthe other time-outs related to pool maintenance become irrelevant.
v All other values set to zero.
© Copyright IBM Corporation © IBM 2009 15
Java DataBase Connectivity data source propertiesThe settings used to configure the Java DataBase Connectivity (JDBC) data sourceproperties were chosen to maximize performance.
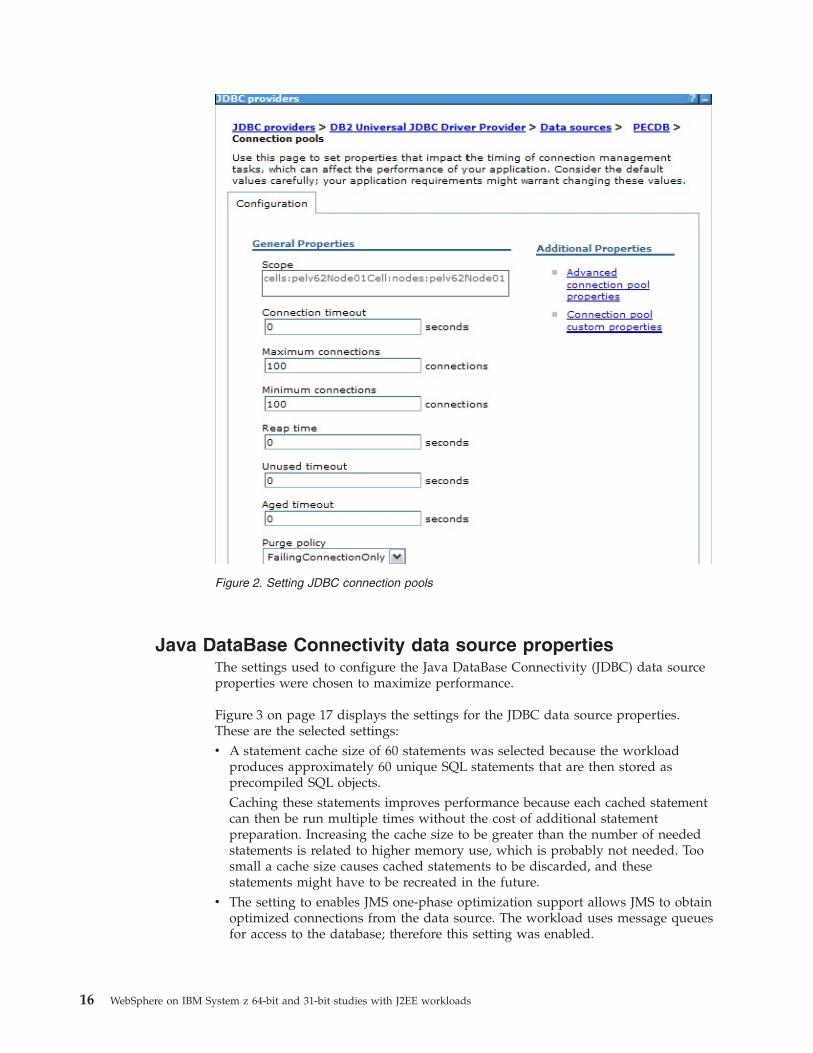
Figure 3 on page 17 displays the settings for the JDBC data source properties.These are the selected settings:v A statement cache size of 60 statements was selected because the workload
produces approximately 60 unique SQL statements that are then stored asprecompiled SQL objects.Caching these statements improves performance because each cached statementcan then be run multiple times without the cost of additional statementpreparation. Increasing the cache size to be greater than the number of neededstatements is related to higher memory use, which is probably not needed. Toosmall a cache size causes cached statements to be discarded, and thesestatements might have to be recreated in the future.
v The setting to enables JMS one-phase optimization support allows JMS to obtainoptimized connections from the data source. The workload uses message queuesfor access to the database; therefore this setting was enabled.
Figure 2. Setting JDBC connection pools
16 WebSphere on IBM System z 64-bit and 31-bit studies with J2EE workloads
Object Request Broker thread poolThe Object Request Broker (ORB) is a service that handles requests from clientsover the Remote Method Invocation/Internet Inter-ORB Protocol (RMI/IIOP). Onepart of the workload driver connects to the workload application using itsEnterprise Java Beans (EJBs) with Remote Method Invocation of Java methods(RMI) using RMI/IIOP.
The ORB thread pool values are adapted to the expected amount of RMI/IIOPtraffic. Figure 4 on page 18 displays the setting for the ORB thread pool. These arethe selected settings:v The size of the ORB pool is set to 15 for the minimum and maximum number of
threads.v The thread inactivity timeout is set to 3500 milliseconds.
WebContainer thread poolThe WebContainer thread pools are used for HTTP requests that come from theclient.
Figure 3. JDBC data source configuration
Chapter 5. Setting up WebSphere and DB2 Universal Database 17
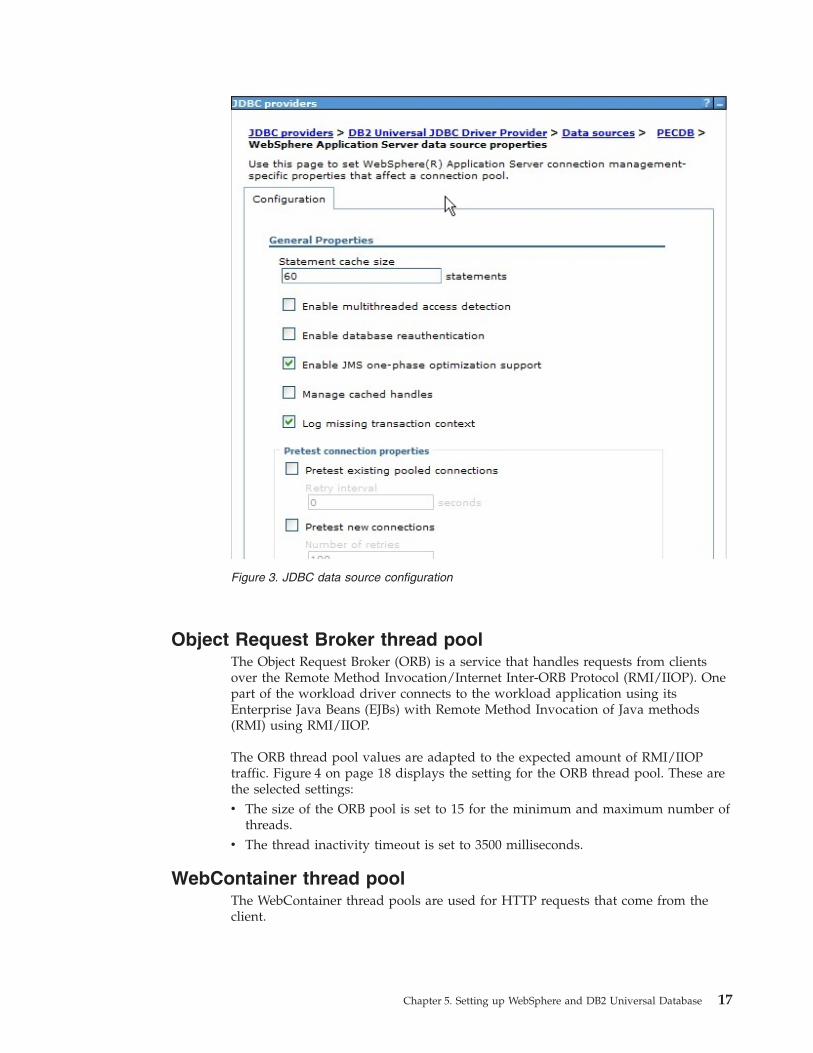
Figure 4 displays the WebContainer thread pools settings. These settings werechosen due to the high HTTP traffic generated by the workload, to preventrequests from being queued in the transport chain when all threads are busy. Theseare the selected settings:v The size for the WebContainer pool is set to 35 minimum and 35 maximum
threads.v A timeout value is set to 3500 milliseconds.
Default thread poolThe parameters associated with the default thread pool are modified to reusethreads instead of creating new ones.
Figure 4 displays the default thread pools settings. These are the selected settings:v The size for the default thread pool is set to 10 minimum and 10 maximum
threads.v A timeout value is set to 3500 milliseconds.
HTTP transport settingsThe default values for the HTTP transport channels associated with a transportchain are modified to improve performance.
Figure 4. Thread pool
18 WebSphere on IBM System z 64-bit and 31-bit studies with J2EE workloads
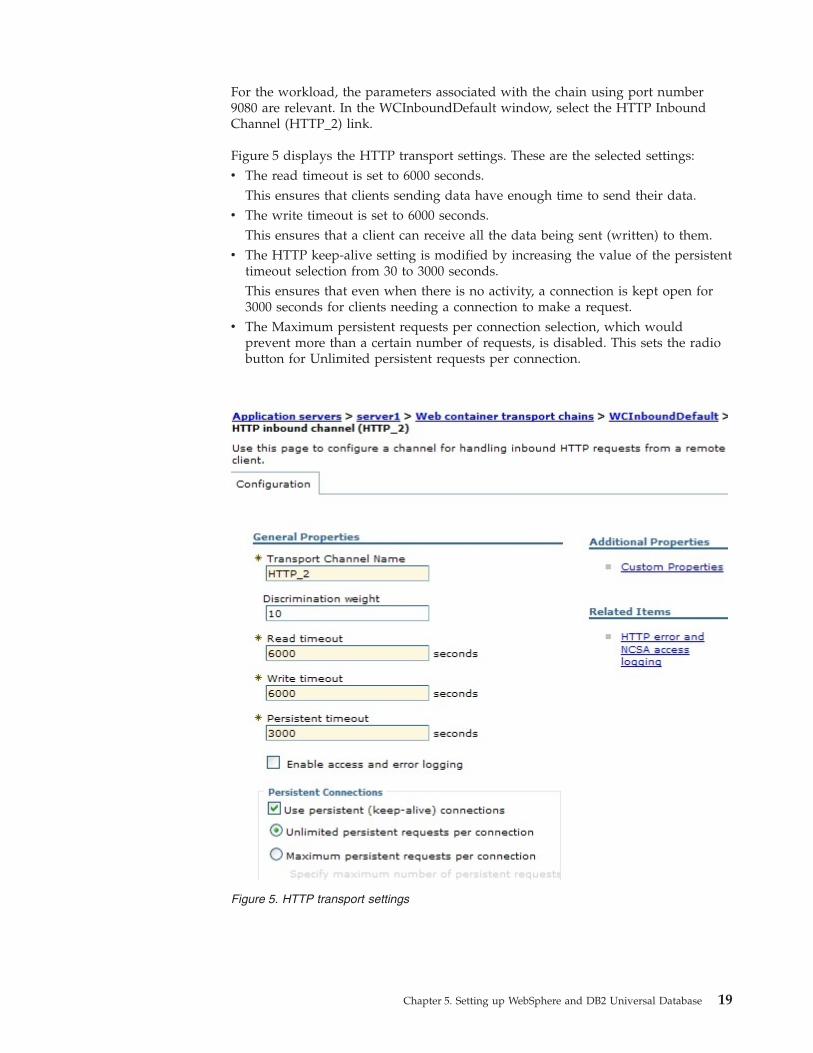
For the workload, the parameters associated with the chain using port number9080 are relevant. In the WCInboundDefault window, select the HTTP InboundChannel (HTTP_2) link.
Figure 5 displays the HTTP transport settings. These are the selected settings:v The read timeout is set to 6000 seconds.
This ensures that clients sending data have enough time to send their data.v The write timeout is set to 6000 seconds.
This ensures that a client can receive all the data being sent (written) to them.v The HTTP keep-alive setting is modified by increasing the value of the persistent
timeout selection from 30 to 3000 seconds.This ensures that even when there is no activity, a connection is kept open for3000 seconds for clients needing a connection to make a request.
v The Maximum persistent requests per connection selection, which wouldprevent more than a certain number of requests, is disabled. This sets the radiobutton for Unlimited persistent requests per connection.
Figure 5. HTTP transport settings
Chapter 5. Setting up WebSphere and DB2 Universal Database 19
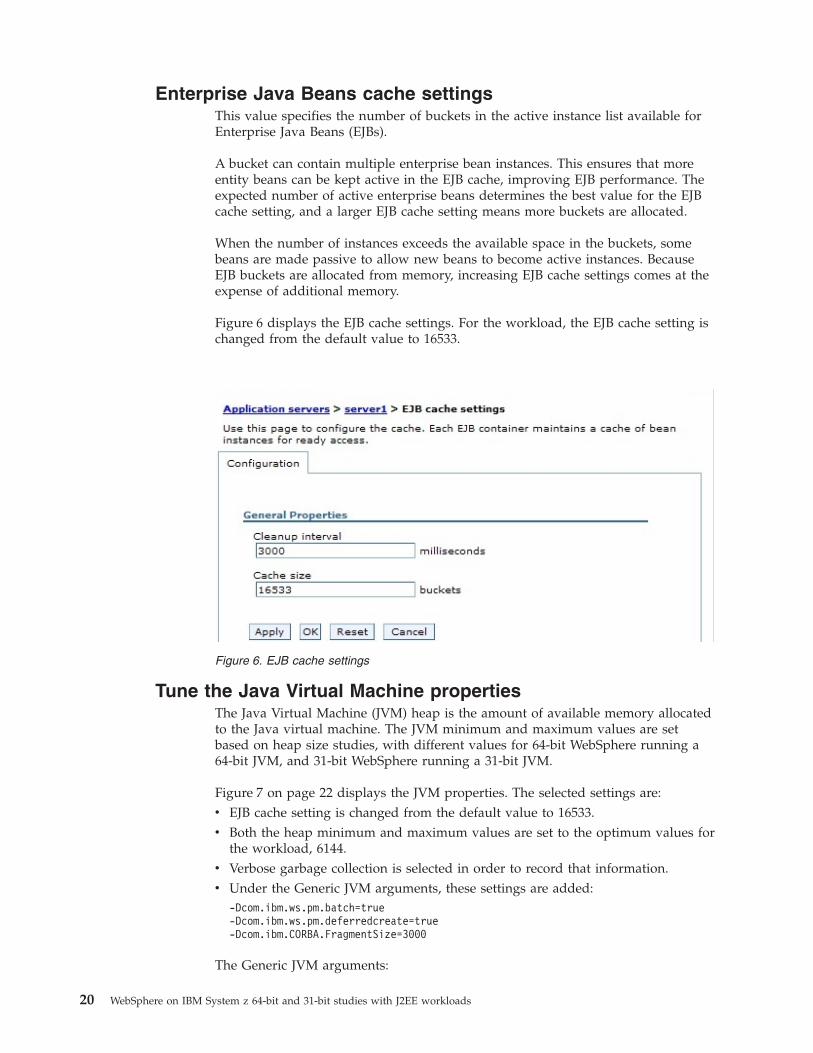
Enterprise Java Beans cache settingsThis value specifies the number of buckets in the active instance list available forEnterprise Java Beans (EJBs).
A bucket can contain multiple enterprise bean instances. This ensures that moreentity beans can be kept active in the EJB cache, improving EJB performance. Theexpected number of active enterprise beans determines the best value for the EJBcache setting, and a larger EJB cache setting means more buckets are allocated.
When the number of instances exceeds the available space in the buckets, somebeans are made passive to allow new beans to become active instances. BecauseEJB buckets are allocated from memory, increasing EJB cache settings comes at theexpense of additional memory.
Figure 6 displays the EJB cache settings. For the workload, the EJB cache setting ischanged from the default value to 16533.
Tune the Java Virtual Machine propertiesThe Java Virtual Machine (JVM) heap is the amount of available memory allocatedto the Java virtual machine. The JVM minimum and maximum values are setbased on heap size studies, with different values for 64-bit WebSphere running a64-bit JVM, and 31-bit WebSphere running a 31-bit JVM.
Figure 7 on page 22 displays the JVM properties. The selected settings are:v EJB cache setting is changed from the default value to 16533.v Both the heap minimum and maximum values are set to the optimum values for
the workload, 6144.v Verbose garbage collection is selected in order to record that information.v Under the Generic JVM arguments, these settings are added:
-Dcom.ibm.ws.pm.batch=true-Dcom.ibm.ws.pm.deferredcreate=true-Dcom.ibm.CORBA.FragmentSize=3000
The Generic JVM arguments:
Figure 6. EJB cache settings
20 WebSphere on IBM System z 64-bit and 31-bit studies with J2EE workloads
com.ibm.ws.pm.batch=trueThe flag is used when an application updates multiple container-managedpersistence (CMP) beans inside of a single transaction. This flag can beused to allow batching of the update so that one transaction containingboth update transactions is presented to the database instead of two ormore transactions. This flag is used only when the database supportsbatching of update operations, and the application regularly accessesmultiple CMP beans for update. This saves round trips to the database,improving performance on these operations.
com.ibm.ws.pm.deferredcreate=trueThe flag also provides a performance benefit on an ejbCreate() method call.The default behavior is to immediately insert an empty row into thedatabase with only the primary key. Most transactions then modify fieldswithin the bean, so the insertion of the row into the database can bedeferred until the data in the rows is actually present, saving a databasecall.
com.ibm.CORBA.FragmentSize=3000The setting makes the size of the Object Request Broker (ORB) fragment3000 bytes. The ORB separates messages into fragments to send over theORB connection. The 3000 byte size was calculated to be a good size forthis workload.
Chapter 5. Setting up WebSphere and DB2 Universal Database 21
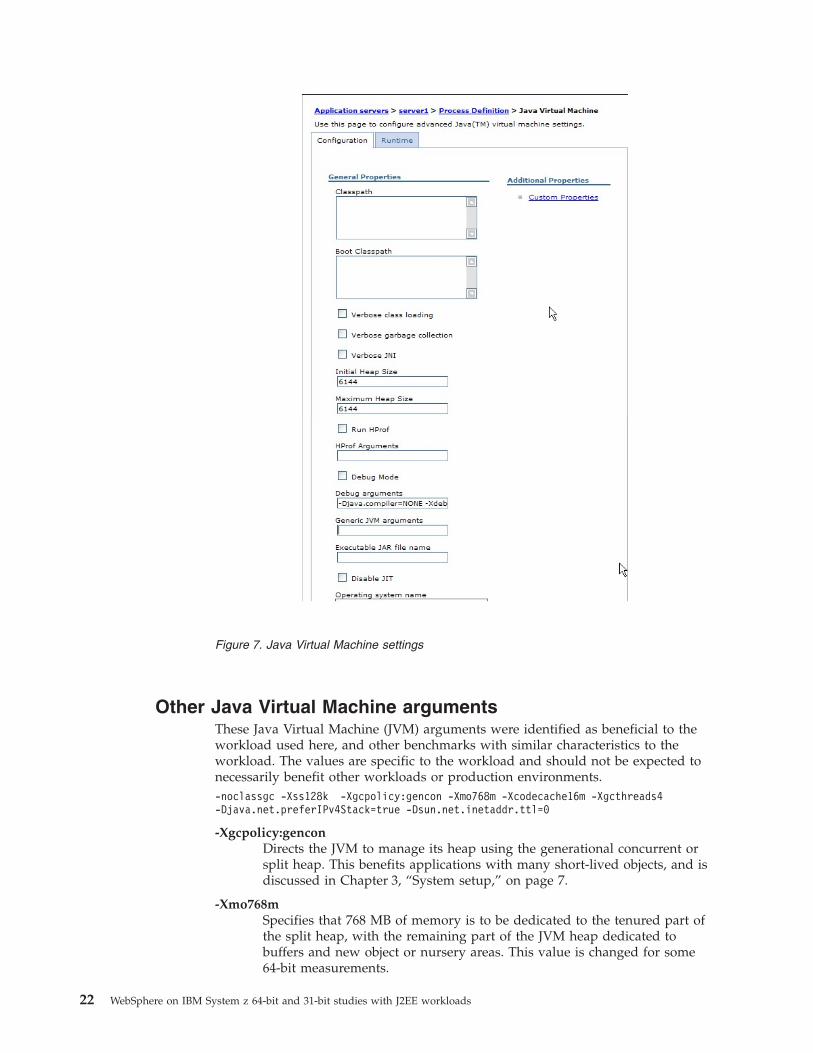
Other Java Virtual Machine argumentsThese Java Virtual Machine (JVM) arguments were identified as beneficial to theworkload used here, and other benchmarks with similar characteristics to theworkload. The values are specific to the workload and should not be expected tonecessarily benefit other workloads or production environments.-noclassgc -Xss128k -Xgcpolicy:gencon -Xmo768m -Xcodecache16m -Xgcthreads4-Djava.net.preferIPv4Stack=true -Dsun.net.inetaddr.ttl=0
-Xgcpolicy:genconDirects the JVM to manage its heap using the generational concurrent orsplit heap. This benefits applications with many short-lived objects, and isdiscussed in Chapter 3, “System setup,” on page 7.
-Xmo768mSpecifies that 768 MB of memory is to be dedicated to the tenured part ofthe split heap, with the remaining part of the JVM heap dedicated tobuffers and new object or nursery areas. This value is changed for some64-bit measurements.
Figure 7. Java Virtual Machine settings
22 WebSphere on IBM System z 64-bit and 31-bit studies with J2EE workloads
-XnoclassgcDirects the JVM to not perform garbage collection on the classes that residein the permanent or tenured space in the split heap.
Unloading of these classes means that future references require a costlyload from the file system, instead of an efficient memory load. This is acommonly used setting for workloads with repetitive use of the sameclasses.
-Xgcthreads4Instructs the JVM to start four threads for garbage collection. The defaultvalue is to have as many garbage collection threads as there are availableprocessors.
-Xss128kAllocates 128 KB of memory for the native stack area of each thread. Thenative stack area is used for native library loads by Java from the C/C++environment, which is the native layer.
-Xcodecache16mSets the size of each block of memory that is allocated to store native codeof compiled Java methods to 16 MB. By default, this size is selectedinternally according to the CPU architecture and the capacity of yoursystem.
Transaction service propertiesThe values of the total transaction lifetime timeout and the client inactivity timeoutare set to zero.
Total transaction lifetime timeoutSets the number of seconds that a transaction can remain inactive before itis ended by the transaction service. A value of 0 indicates that there is notimeout limit.
Client inactivity timeoutSets the number of seconds for which a transaction started by, orpropagated into, this application server can run before it is ended by thetransaction service. A value of 0 indicates that there is no timeout limit.
To set these parameters on the WebSphere Administration console, where server1stands for the name of the application server:1. Click Application Servers → server1 → Container Settings → Container Services.2. Click Transaction Service link.3. Set Total transaction lifetime timeout to 0.4. Set Client inactivity timeout to 0.
Disable Java 2 securityJava 2 security is disabled because security policy files are not available for theworkload.
Note: This is not recommended for production environments.
To reset these parameters on the WebSphere Administration Console:1. Click Security → Global security. The Global security panel is displayed2. Clear the Enforce Java 2 security option.
Chapter 5. Setting up WebSphere and DB2 Universal Database 23
DB2 V9.5 configurationSettings for DB2 Version 9.5 used in the 64-bit and 31-bit WebSphere study withJ2EE workloads include settings for the kernel, log files, and buffer pools.
These settings are illustrated in the script contained in “Initial database setup.”
Kernel settings
The recommended kernel semaphore settings are used, as described in “Linuxkernel settings for the DB2 Universal Database system” on page 13.
Log files
Before creating a new database, scripts are run to define the DB2 log files and anappropriate buffer pool. The first three commands in “Initial database setup”specify these options:v DB2 logs will each have 65 MB of spacev A value of 40 logs, for a total of 2.6 GB of log file spacev The /db2log directory contains these 40 log files
Restarting DB2 causes the logs to be put to use, so the available space in thenewlogpath directory then decreases, which reflects the allocation and use of theDB2 logs.
Buffer pools
The size of the default buffer pool is dependent on available memory, and is laterreadjusted by the DB2 autoconfigure commands. The size of the default buffer poolis set initially to 975 MB. This size then changes dynamically during execution,increasing or decreasing depending on the workload.
Initial database setupThe initial database setup specifies details about log files and buffer pools.
Use this script for the initial setup of the database used in the 64-bit and 31-bitWebSphere study with J2EE workloads.db2 update db cfg for <dbname> using logfilsiz 65535db2 update db cfg for <dbname> using logprimary 40db2 update db cfg for <dbname> using newlogpath /db2logdb2 connect to <dbname>db2 -v alter bufferpool ibmdefaultbp size 975000 automaticdb2 connect resetdb2stop;db2startdb2 connect to <dbname>db2 connect reset
Tuning the populated databaseAfter the initial setup, the database is populated using a DB2 restore operation.
Before the database is used, it is tuned with these commands:db2 connect to <dbname>db2 autoconfigure using mem_percent 80 workload_type simple num_stmts 60 tpm 2000is_populated yes num_local_apps 0 num_remote_apps 100 isolation rs bp_resizeable yesapply db and dbm
24 WebSphere on IBM System z 64-bit and 31-bit studies with J2EE workloads
db2 terminatedb2 connect to <dbname>db2 reorgchk update statistics on table alldb2 terminate
See “DB2 autoconfigure command” for a detailed explanation of each argument.
DB2 autoconfigure commandThese are the arguments for the DB2 autoconfigure command used to optimizedatabase performance.
These arguments are specified on the DB2 autoconfigure command displayed in“Tuning the populated database” on page 24.
mem_percent 80Allocates 80% of the memory as a buffer pool.
num_stmts 60Indicates that there are approximately 60 unique SQL statements with thisworkload.
workload_type simpleIndicates that the workload uses simple SQL statements, those mostcommonly used by WebSphere.
tpm 2000Indicates the maximum expected number of transactions per minute,which is estimated at 2000.
num_remote_apps 100Specifies the number of connections to the database from WebSphere,which is set in this WebSphere configuration.
rs Indicates an isolation level of read stability, which is required by most ofthe Java beans. Isolation level rs means that database rows that are read byone activation bean are only read when they are not being updated byanother bean. However, subsequent reads can reflect intervening updatesby different beans.
bp_resizeable yesTells DB2 to use its autoconfiguration capabilities to adjust the size of thebuffer pool from its original size during future database operations, in adynamic manner.
The reorgchk update statistics on table all command updates the statisticsinformation from the catalog table to find the best plan to access table data. It isimportant that this information is current for the optimizer to be able to make theright decisions here. The reorgchk command runs a RUNSTATs operation on everytable, which improves the query performance for each DB2 table.
Chapter 5. Setting up WebSphere and DB2 Universal Database 25

26 WebSphere on IBM System z 64-bit and 31-bit studies with J2EE workloads
Chapter 6. Workload description
A benchmark emulating a customer-like workload was used for the 64-bit and31-bit WebSphere study with J2EE workloads.
The workload was chosen to stress the middleware and J2EE components using anend-to-end Web application. The applications are a collection ofv Java classesv Java Servletsv Java Server Pagesv Web Servicesv Enterprise Java Beans (EJBs) built to open J2EE APIs
All major components of J2EE technologies are exercised, including:v The Web container (servlets and JSPs)v The EJB containerv EJB 2.0 Container Managed Persistencev Java Messaging Service (JMS)v Message Driven Beans (MDBs)v Transaction managementv Database connectivity
The workload exercises all parts of the infrastructure, such as hardware, JVMsoftware, database software, Java DataBase Connectivity (JDBC) drivers and thesystem network. The workload implements a Web layer and makes extensive useof JMS and MDB technology.
The workload is a retail and manufacturing application implementing a set of userservices such as login and logout, stores, buying, selling, account details, and soon, using standards-based HTTP and Web services protocols. In addition to theretail domain, a manufacturing work order domain is also simulated to drive otherhigh-volume transactions. The retail domain uses Web layer connections to accessthe applications, with the manufacturing domain connecting to the applicationwith the EJBs with the RMI protocol using RMI/IIOP.
These server connection modes are used:
EJB Database access uses EJB 2.1 methods to drive retail and manufacturingoperations.
Direct Database and messaging access using direct JDBC and JMS code.
Type 4 JDBC connectors are used with EJB containers.
The workload is driven by the workload generator machines at a certainsubmission rate. Data must be present in the database before running thecustomer’s workload simulation. The number of retailers, number of customers,and manufacturing data varies with the intended submission rate.
Scripts to load the database use an argument representing the amount of data toload. For submission rates greater than 100, they are a multiple of 100. For
© Copyright IBM Corporation © IBM 2009 27

example, at submission rate 110 the database scripts are given an argument of 200.The database size is therefore roughly correlated with the submission rate.
28 WebSphere on IBM System z 64-bit and 31-bit studies with J2EE workloads
Chapter 7. Results
The results of the 64-bit and 31-bit WebSphere study with J2EE workloads arepresented, along with observations and conclusions.
Results are observed and analyzed according to these categories:v “Heapsize for the 64-bit Java Virtual Machine”v “Comparing 64-bit WebSphere versus 31-bit WebSphere” on page 31v “CPU scaling study” on page 35v “Database LPAR analysis” on page 39v “Network study – 1 Gb Ethernet versus 10 Gb Ethernet” on page 42
Heapsize for the 64-bit Java Virtual MachineTo compare the performance of 64-bit WebSphere to 31-bit WebSphere, an attemptwas made to identify the optimal percentage of available memory to dedicate tothe JVM heap for the workload.
A starting value of 50% of available memory was used, and the value wasincreased to 80%. Throughput, workload operations per second, and CPUutilization are recorded. Response times are also recorded as another possiblemeasure of optimization.
The data is collected at two different workload submission rates, 300 and 500, witheither four or eight CPUs, and with either 4 GB or 8 GB of memory configured onthe WebSphere LPAR. Within each submission rate, WebSphere’s JVM minimumand maximum heap settings are set to identical values corresponding to differentpercentages of the LPAR’s configured memory.
To analyze the results, two comparisons were done:v “Throughput and CPU utilization”v “CPU utilization and response times” on page 31
Throughput and CPU utilization
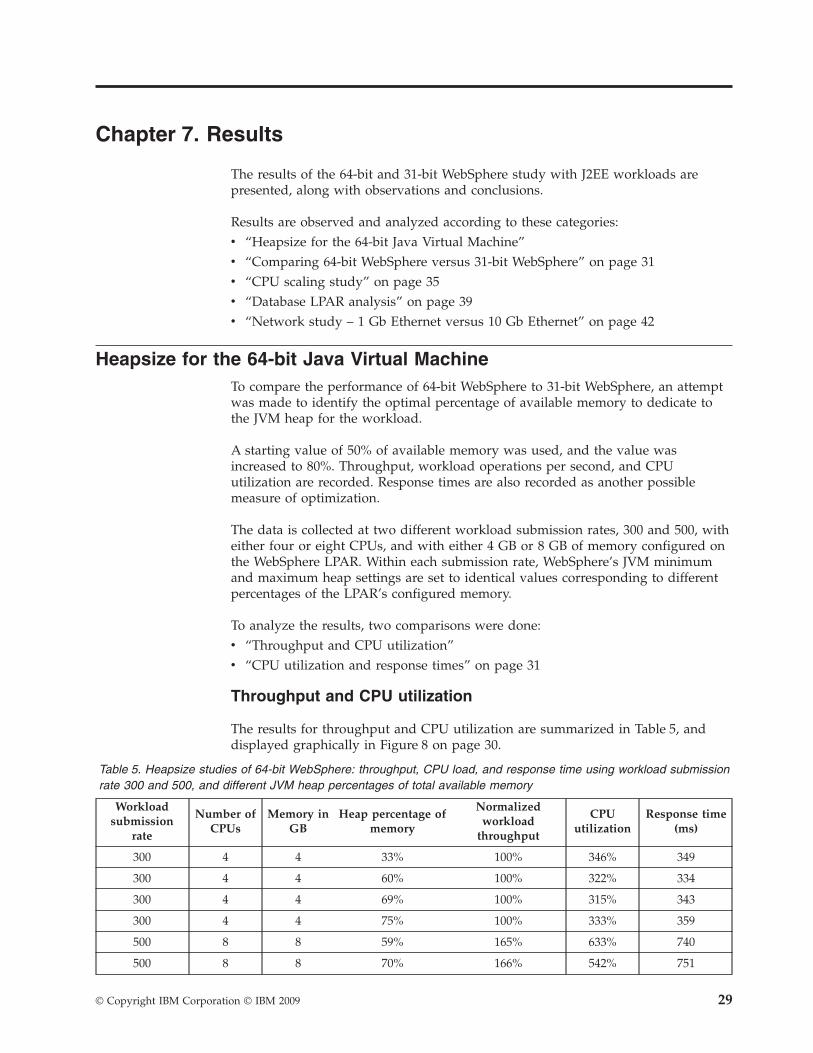
The results for throughput and CPU utilization are summarized in Table 5, anddisplayed graphically in Figure 8 on page 30.
Table 5. Heapsize studies of 64-bit WebSphere: throughput, CPU load, and response time using workload submissionrate 300 and 500, and different JVM heap percentages of total available memory
Workloadsubmission
rate
Number ofCPUs
Memory inGB
Heap percentage ofmemory
Normalizedworkload
throughput
CPUutilization
Response time(ms)
300 4 4 33% 100% 346% 349
300 4 4 60% 100% 322% 334
300 4 4 69% 100% 315% 343
300 4 4 75% 100% 333% 359
500 8 8 59% 165% 633% 740
500 8 8 70% 166% 542% 751
© Copyright IBM Corporation © IBM 2009 29
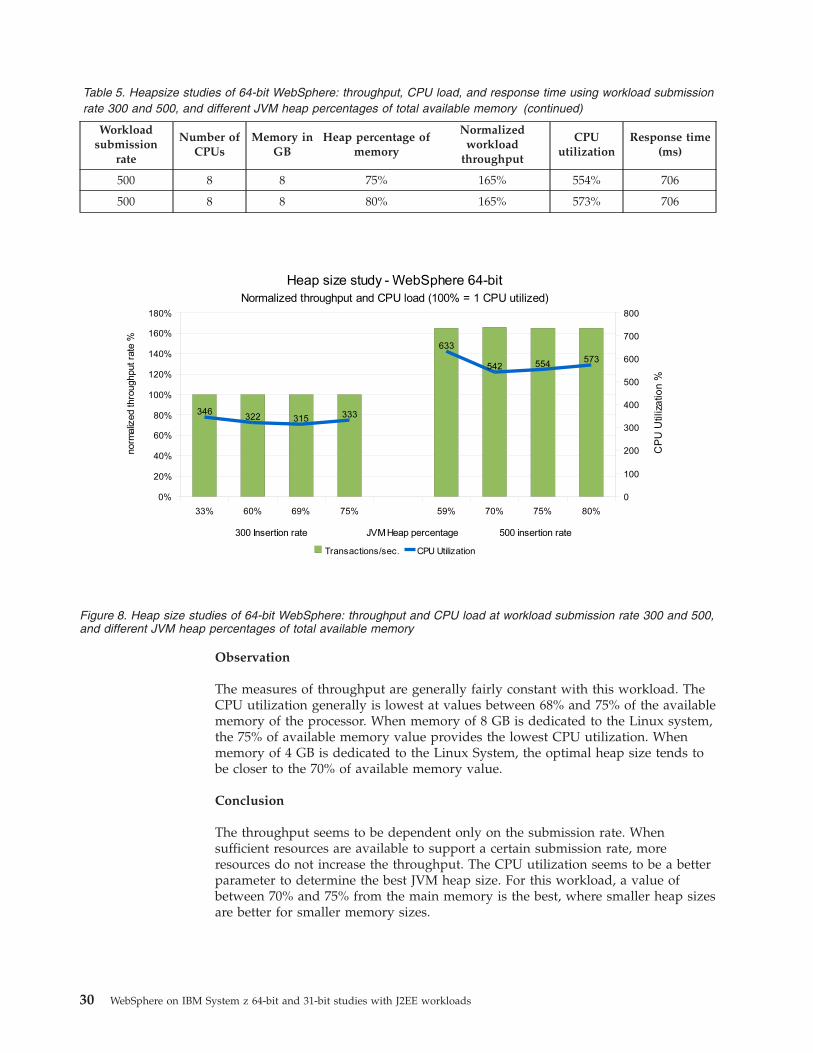
Table 5. Heapsize studies of 64-bit WebSphere: throughput, CPU load, and response time using workload submissionrate 300 and 500, and different JVM heap percentages of total available memory (continued)
Workloadsubmission
rate
Number ofCPUs
Memory inGB
Heap percentage ofmemory
Normalizedworkload
throughput
CPUutilization
Response time(ms)
500 8 8 75% 165% 554% 706
500 8 8 80% 165% 573% 706
Observation
The measures of throughput are generally fairly constant with this workload. TheCPU utilization generally is lowest at values between 68% and 75% of the availablememory of the processor. When memory of 8 GB is dedicated to the Linux system,the 75% of available memory value provides the lowest CPU utilization. Whenmemory of 4 GB is dedicated to the Linux System, the optimal heap size tends tobe closer to the 70% of available memory value.
Conclusion
The throughput seems to be dependent only on the submission rate. Whensufficient resources are available to support a certain submission rate, moreresources do not increase the throughput. The CPU utilization seems to be a betterparameter to determine the best JVM heap size. For this workload, a value ofbetween 70% and 75% from the main memory is the best, where smaller heap sizesare better for smaller memory sizes.
Figure 8. Heap size studies of 64-bit WebSphere: throughput and CPU load at workload submission rate 300 and 500,and different JVM heap percentages of total available memory
30 WebSphere on IBM System z 64-bit and 31-bit studies with J2EE workloads
CPU utilization and response times
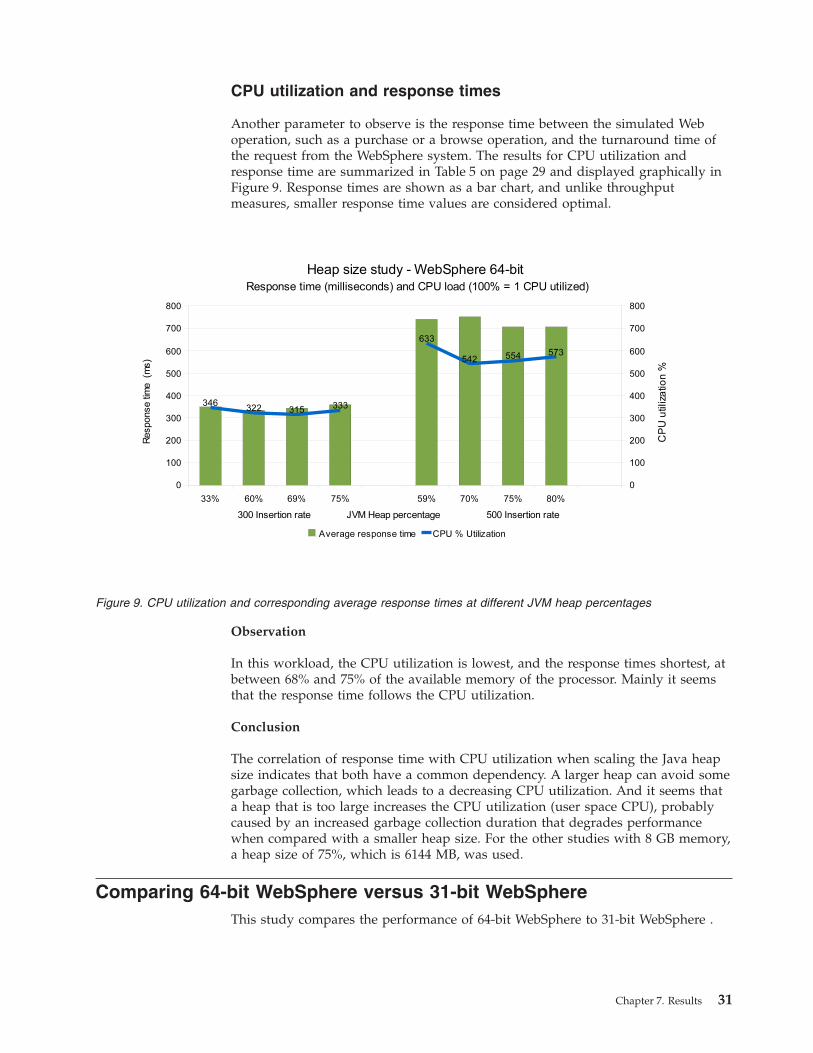
Another parameter to observe is the response time between the simulated Weboperation, such as a purchase or a browse operation, and the turnaround time ofthe request from the WebSphere system. The results for CPU utilization andresponse time are summarized in Table 5 on page 29 and displayed graphically inFigure 9. Response times are shown as a bar chart, and unlike throughputmeasures, smaller response time values are considered optimal.
Observation
In this workload, the CPU utilization is lowest, and the response times shortest, atbetween 68% and 75% of the available memory of the processor. Mainly it seemsthat the response time follows the CPU utilization.
Conclusion
The correlation of response time with CPU utilization when scaling the Java heapsize indicates that both have a common dependency. A larger heap can avoid somegarbage collection, which leads to a decreasing CPU utilization. And it seems thata heap that is too large increases the CPU utilization (user space CPU), probablycaused by an increased garbage collection duration that degrades performancewhen compared with a smaller heap size. For the other studies with 8 GB memory,a heap size of 75%, which is 6144 MB, was used.
Comparing 64-bit WebSphere versus 31-bit WebSphereThis study compares the performance of 64-bit WebSphere to 31-bit WebSphere .
Figure 9. CPU utilization and corresponding average response times at different JVM heap percentages
Chapter 7. Results 31
Performance of 64-bit WebSphere
The workload stresses all of the major J2EE components in the middleware layer,but does not stress the database or client software layers. The intent was to explorehow deploying on a WebSphere Application Server running the 64-bit JVM versusdeploying on the 31-bit version affected performance. This workload uses most ofthe J2EE components, including some components that other applications are onlybeginning to exploit, such as message queues and the service oriented architecture(SOA). Here data points are used where expected CPU utilization would not bemaximized as it was in the CPU scaling studies, so CPU usage is not a limitingresource.
Costs and advantages of using 64-bit WebSphere
Significant performance gains are expected in applications capable of takingadvantage of 64-bit WebSphere features. For example, reducing database requestsby leveraging a large heap space to cache database data can provide significantgains. However, there is also a disadvantage for 64-bit WebSphere applications. Alladdress references are 64-bits wide, roughly double the size of address referencesin 31-bit deployments. This results in an increased memory footprint and canreduce hardware cache efficiency. Therefore, applications might actually see aperformance loss. The 64-bit processors also provide hardware support fordouble-precision numbers and wider 64-bit integers.
Heapsize and other factors
As with other studies, a 75% heap size value is chosen for all variations of the64-bit WebSphere test, and used the 1024 MB (1 GB) heap size variation of the31-bit WebSphere test. For 31-bit WebSphere, a mapped_base kernel setting is usedto reduce the kernel memory footprint and provide more space for the 1 GB heapto live inside the 2 GB 31-bit address space.
At a workload submission rate of 600, the response times were unacceptably long.Reports generated by the sar command show that the network traffic between theclient systems and the WebSphere system was exceeding the capacity of thenetwork card on the WebSphere Application Server LPAR. Therefore, the 1 GbOSA card is replaced with a 10 Gb OSA card for the test cases with a workloadsubmission rate of 600. The network issue is discussed in detail in “Network study– 1 Gb Ethernet versus 10 Gb Ethernet” on page 42.
Garbage collection
The -Xgcpolicy:gencon garbage collection option specifies a choice of either SplitHeap or Generational Concurrent garbage collection mode. The heap is split intotwo areas: the tenured area for long-lived objects, and a nursery area, where newand recently used objects are stored. This garbage collection features a movementof longer-lived objects (ones that have survived between five and ten scavengergarbage collections) to the tenured heap. The global garbage collection is a garbagecollection of the tenured area with the longest-lived objects. This global garbagecollection is associated with pause times, during which objects managed by theJVM are held exclusively (locked) and not available to the application. TheGenerational Concurrent option was chosen for this workload due to the existenceof very short-lived objects coexisting with longer-lived J2EE objects that survivebeyond the transactional commit phase.
32 WebSphere on IBM System z 64-bit and 31-bit studies with J2EE workloads
The tenured heap size is set with the -Xmo<sizeM> JVM option. For example,-Xmo768m defines a 768 MB tenured area. The remainder of the heap is thendedicated to a nursery area. The -Xmo2048m option was chosen for the tenuredarea on the 64-bit runs using 8 GB of memory. The option -Xmo768m was chosenfor the 31-bit JVM because the total heap for the JVM is only 1024 MB. It ispossible to increase the tenured area to an even larger size on 64-bit WebSphere,but at the value of 2048m for the tenured area, only one global garbage collectionoccurs during the 10 minute steady-state interval, and that frequency of tenuredarea maintenance is considered acceptable. For more information about theseoptions, see “Other Java Virtual Machine arguments” on page 22.
Methodology
CPU utilization, workload throughput, and response times were measured duringthe steady-state phase with workload submission rates of 300, 500 and 600. For the300 workload submission rate, four dedicated CPUs were assigned to the systembeing tested. For the 500 and 600 workload submission rates, eight dedicated CPUswere used. The DB2 image continued to run with four CPUs and 8 GBs ofmemory. The submission rates reflect a high but not fully-utilized CPU load.
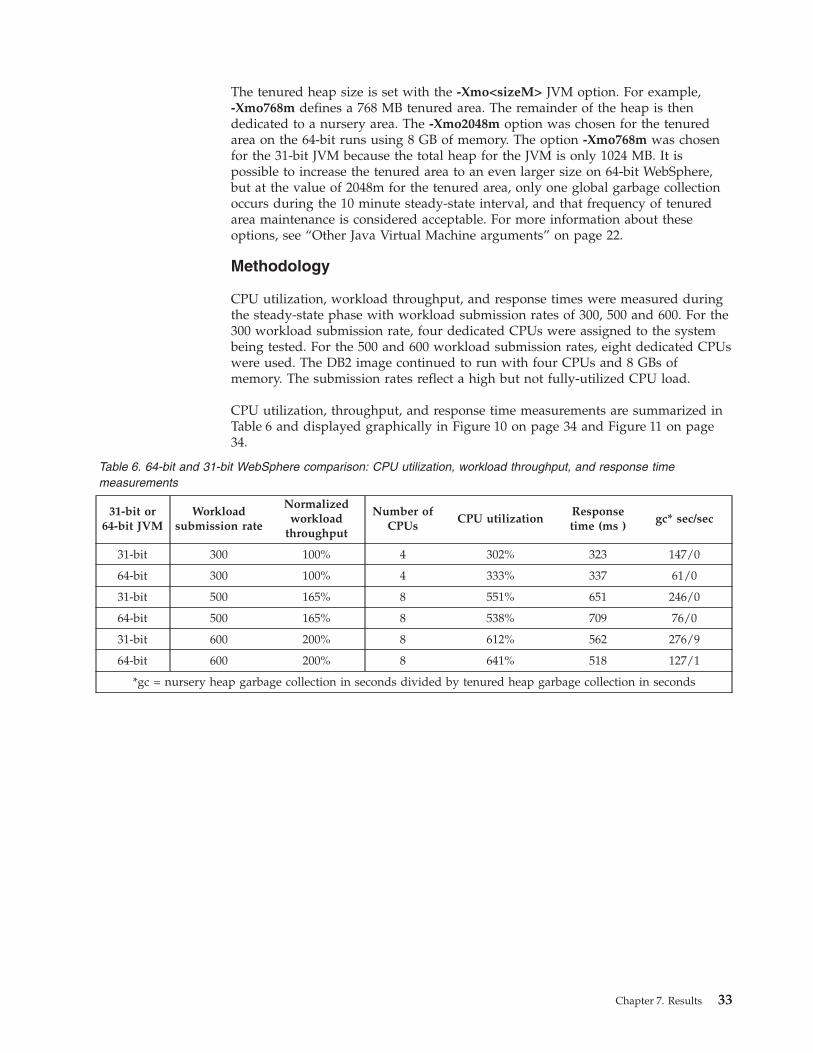
CPU utilization, throughput, and response time measurements are summarized inTable 6 and displayed graphically in Figure 10 on page 34 and Figure 11 on page34.
Table 6. 64-bit and 31-bit WebSphere comparison: CPU utilization, workload throughput, and response timemeasurements
31-bit or64-bit JVM
Workloadsubmission rate
Normalizedworkload
throughput
Number ofCPUs
CPU utilizationResponsetime (ms )
gc* sec/sec
31-bit 300 100% 4 302% 323 147/0
64-bit 300 100% 4 333% 337 61/0
31-bit 500 165% 8 551% 651 246/0
64-bit 500 165% 8 538% 709 76/0
31-bit 600 200% 8 612% 562 276/9
64-bit 600 200% 8 641% 518 127/1
*gc = nursery heap garbage collection in seconds divided by tenured heap garbage collection in seconds
Chapter 7. Results 33
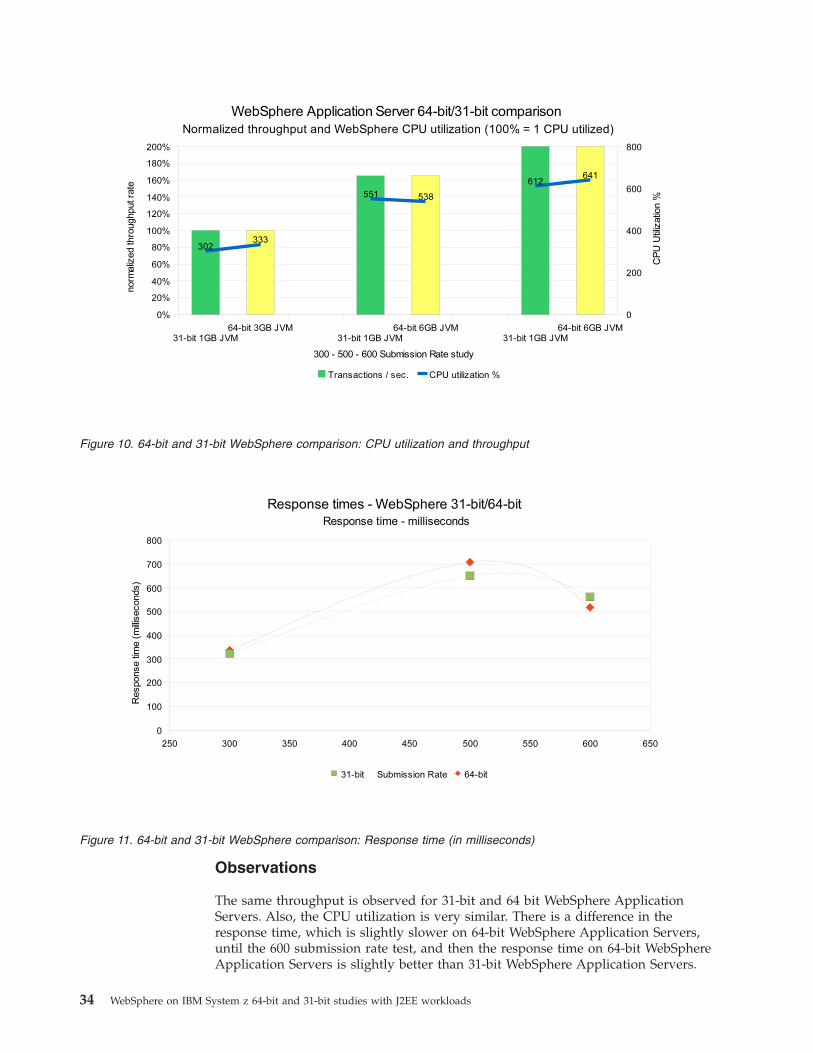
Observations
The same throughput is observed for 31-bit and 64 bit WebSphere ApplicationServers. Also, the CPU utilization is very similar. There is a difference in theresponse time, which is slightly slower on 64-bit WebSphere Application Servers,until the 600 submission rate test, and then the response time on 64-bit WebSphereApplication Servers is slightly better than 31-bit WebSphere Application Servers.
Figure 10. 64-bit and 31-bit WebSphere comparison: CPU utilization and throughput
Figure 11. 64-bit and 31-bit WebSphere comparison: Response time (in milliseconds)
34 WebSphere on IBM System z 64-bit and 31-bit studies with J2EE workloads
The Java garbage collection statistics were added to show the effect of the largerheap sizes of 64-bit WebSphere on the total amount of time spent in garbagecollection. More total time spent in garbage collection is observed on the 31-bitWebSphere than on the 64-bit version. On 31-bit, the average duration of garbagecollection intervals is much shorter, but the frequency of garbage collection is muchhigher than on 64-bit. The total garbage collection time is used, which takes intoaccount both garbage collection frequency and duration.
Using total garbage collection time, the time spent in garbage collection on 64-bitWebSphere was, approximately between 30% and 46% of the garbage collectiontime spent on the 31-bit version, significantly lower. At the highest workloadsubmission rate of 600, the garbage collection time of the tenured heap area(Global garbage collection) was up to ten times longer on 31-bit WebSphere thanon 64-bit WebSphere.
Conclusions
Under this workload, the behavior of the WebSphere Application Server is verysimilar for both 31-bit and 64-bit versions. With the larger workload, the 64-bitWebSphere Application Server has better response time, probably because garbagecollection behaves differently. The -Xgcpolicy:gencon option was specified on theJVM command line for 64-bit WebSphere as well as the 31-bit WebSphereinstallation. The design of Generational Concurrent garbage collection is tominimize the time spent in global garbage collection of the tenured heap area bydoing some concurrent cleanup of new object areas called nurseries.
Although pause times from exclusive locks held by global garbage collection areminimized by the JVM, they still consumed 9 seconds of total time on 31-bitWebSphere versus 1 second of total time on 64-bit WebSphere. This is oneparameter that causes the slightly better response times observed on 64-bitWebSphere at the higher workloads with the larger 6 GB JVM heap. The largertenured area (2048 MB versus 768 MB) on 64-bit WebSphere showed that fewerstop the world global garbage collections of the tenured area are needed on 64-bitWebSphere. Another reason for better response time is that the large nursery areaafforded by the large 64-bit heap allows for the storage of more short-lived objectsin memory for longer durations of time, resulting in fewer scavenger garbagecollections and fewer memory allocation failures in the nursery area of the splitheap.
These differences should result in improved performance on 64-bit WebSphere.However, this improvement is probably offset by the generally higher CPUrequirements of 64-bit WebSphere observed for the workload.
CPU scaling studyThis study shows how the workload scales when workload submission rates areincreased while available dedicated Central Processing Units (CPUs) are scaled.
Introduction to CPU Scaling
CPU scaling is a measure of how much workload can be driven when the CPUresources are increased. An increase of workload can occur when the number oftotal transactions or the transaction rate are increased. For this workload, theworkload submission rate (the rate at which work is submitted to the J2EEmiddleware layer), has to be increased. However, increased workload in this studyalso requires a larger database, which means that not only the workload must be
Chapter 7. Results 35
scaled, but the whole environment. Scaling the whole environment might haveother effects on the performance than just doing more work with the same data.
Maximizing CPU utilization
To determine the performance characteristics of the workload, measurements aretaken using one, two, four, and eight dedicated CPUs on the WebSphere system. Aworkload entry rate is chosen that is high enough to drive the CPUs to near fullutilization. The results can be used to gain a better understanding of the scalabilityof the workload, and can be used as a way to measure differences in theperformance of the same workload on 64-bit WebSphere versus 31-bit WebSphere.
In all 64-bit WebSphere measurements, the heap settings for the JVM are set to 75%of the 8 GB available memory. This is the optimum percentage derived from thestudy “Heapsize for the 64-bit Java Virtual Machine” on page 29. That worked outto a 64-bit WebSphere JVM heap settings of -Xms6144m -Xmx6144m. A memorysize of 8 GB is also configured for the DB2 LPAR, which runs with four configuredCPUs for all of the tests.
10 Gb Ethernet chosen for highest workload
The workload submission rate of 600 was found to exceed the capacity of the 1 GbEthernet network. This causes network saturation, dampening throughput andproviding additional work for error handling. The 600 workload submission ratetests are therefore run using a 10 Gb Ethernet, to remove the effects of a networkbottleneck on the results. A submission rate higher than 600 would have required alarger restructuring of the environment, because of the higher resource usage fromthe clients to WebSphere and up to the database. This would have exceeded thescope of the study.
CPU Scaling
Dedicated CPUs are assigned to the WebSphere System being tested. Theexperiments use one, two, four, or eight dedicated CPUs. The workload is thenvaried until a CPU utilization close to or greater than 90% is observed. Theworkload is adjusted by changing the workload submission rate. When eight CPUsare dedicated to the WebSphere image, only approximately 80% total CPUutilization at a workload submission rate of 600 was observed. This is because, asexplained in “10 Gb Ethernet chosen for highest workload,” different WebSphere orclient tuning values would have been needed for a submission rate greater than600.
Transaction scaling and response time measurements
The transaction rate is the throughput as reported by the client-side summaryreports. Response time measured is the observed response time of a simulated Weboperation (such as an online Web purchase or a Web browse operation) and theturnaround of the Web request from the WebSphere system after the completion ofsome business logic. These response times are averaged with response times formanufacturing operations. The performance of the DB2 subsystem is alsorepresented in this data. Table 7 on page 37 summarizes these results in tabularformat. Figure 12 on page 37, Figure 13 on page 38, and Figure 14 on page 38 aregraphical representations of the results.
36 WebSphere on IBM System z 64-bit and 31-bit studies with J2EE workloads
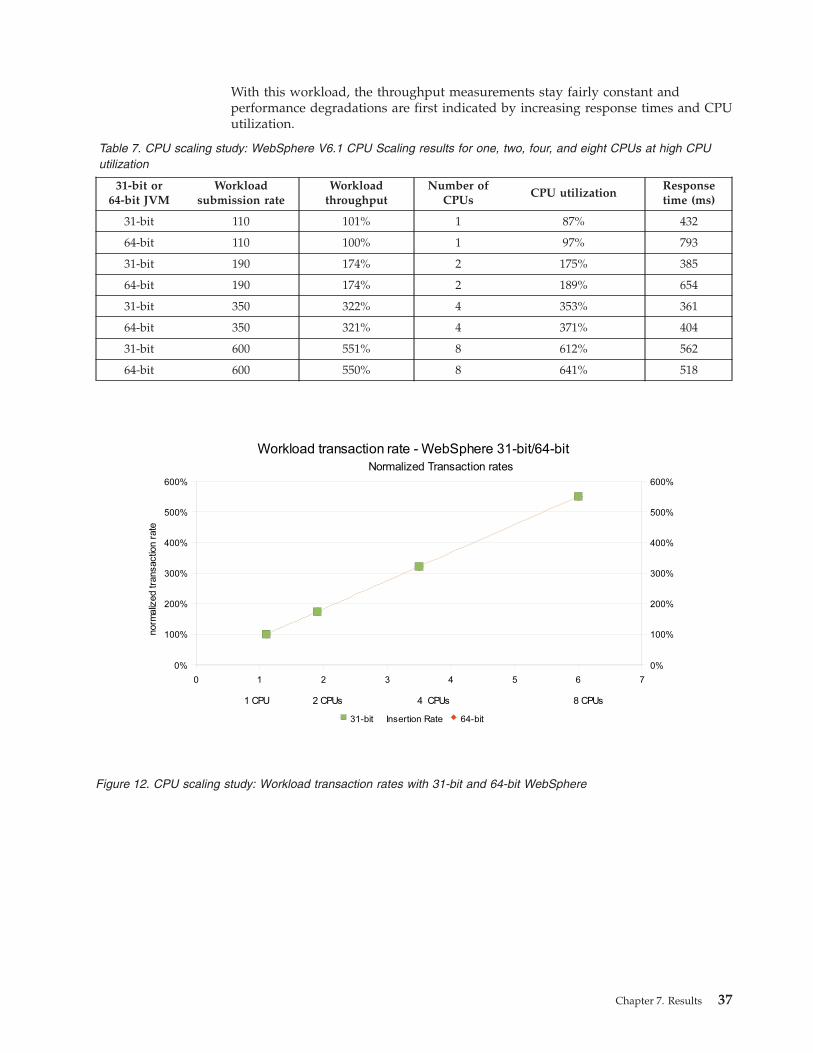
With this workload, the throughput measurements stay fairly constant andperformance degradations are first indicated by increasing response times and CPUutilization.
Table 7. CPU scaling study: WebSphere V6.1 CPU Scaling results for one, two, four, and eight CPUs at high CPUutilization
31-bit or64-bit JVM
Workloadsubmission rate
Workloadthroughput
Number ofCPUs
CPU utilizationResponsetime (ms)
31-bit 110 101% 1 87% 432
64-bit 110 100% 1 97% 793
31-bit 190 174% 2 175% 385
64-bit 190 174% 2 189% 654
31-bit 350 322% 4 353% 361
64-bit 350 321% 4 371% 404
31-bit 600 551% 8 612% 562
64-bit 600 550% 8 641% 518
Figure 12. CPU scaling study: Workload transaction rates with 31-bit and 64-bit WebSphere
Chapter 7. Results 37
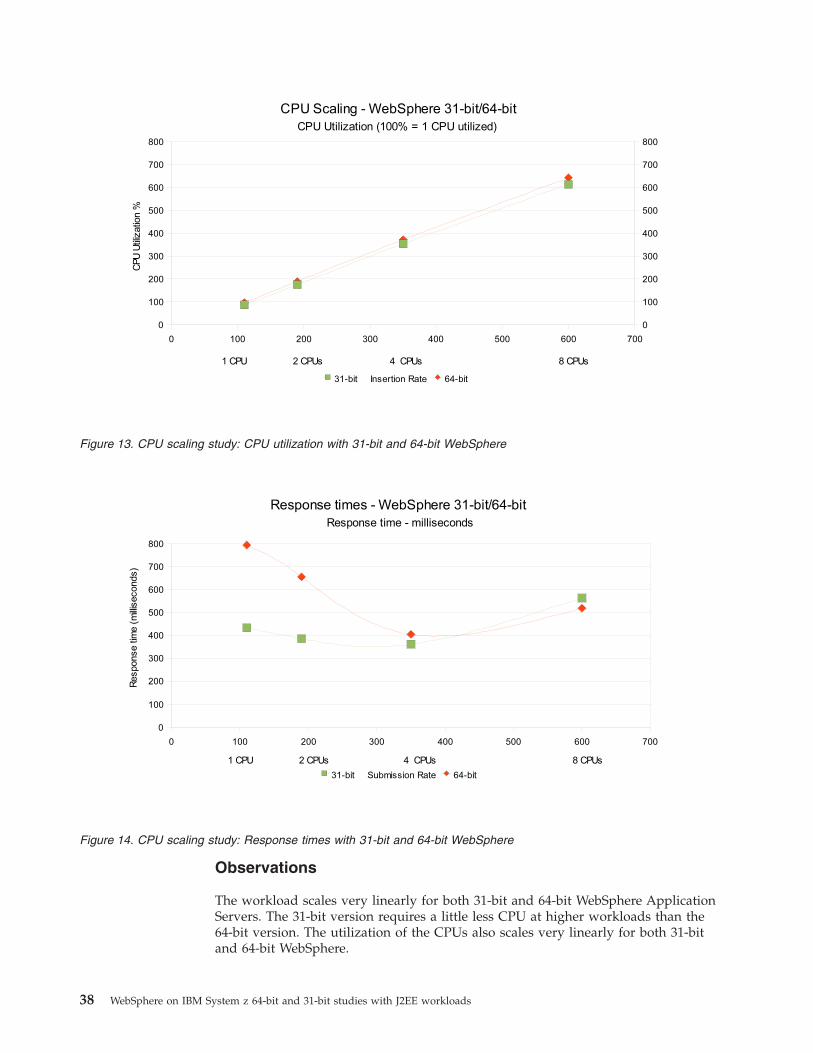
Observations
The workload scales very linearly for both 31-bit and 64-bit WebSphere ApplicationServers. The 31-bit version requires a little less CPU at higher workloads than the64-bit version. The utilization of the CPUs also scales very linearly for both 31-bitand 64-bit WebSphere.
Figure 13. CPU scaling study: CPU utilization with 31-bit and 64-bit WebSphere
Figure 14. CPU scaling study: Response times with 31-bit and 64-bit WebSphere
38 WebSphere on IBM System z 64-bit and 31-bit studies with J2EE workloads
An unexpected behavior is shown by the response time. The response timebecomes shorter with the higher workloads when using a larger number of CPUs,and increases again on the last scaling step with the highest workload. Here, the31-bit WebSphere Application Server differs significantly from the 64-bitWebSphere Application Server; the response time with one CPU is much shorter,but the gap decreases with the scaling. At a submission rate of 600 with eightCPUs, the 64-bit WebSphere Application Server’s response time becomes shorter.
Conclusions
The very good linear scaling in throughput and CPU utilization makes scaling ofthis workload easy for a system administrator. The difference between the 31-bitWebSphere and the 64-bit WebSphere is small. The more efficient garbagecollection of the 64-bit version seems to compensate for the drawback of the largermemory addresses, as seen in other studies. See http://download.boulder.ibm.com/ibmdl/pub/software/dw/linux390/perf/ZSW03030-USEN-00.pdf.
At higher workload submission rates, the advantages of a larger heap on 64-bitWebSphere result in an improving response time curve. A more detailed analysis ofgarbage collection can be found in “Comparing 64-bit WebSphere versus 31-bitWebSphere” on page 31.
A CPU utilization greater than 90% was not observed for the higher workloads,indicating an unidentified bottleneck, which might be the HiperSockets connectionbetween the WebSphere Application Server and the database. Additionalinvestigation would be required to determine the cause of this bottleneck. The highCPU utilization of 97% of the one CPU run with the 64-bit WebSphere becomescritical for a system running with HiperSockets, and is very likely the reason forthe high response times there.
Large heaps provide more space for both long-lived and newly-created objects. Itseems that the Generational Concurrent garbage collection option works veryefficiently, even for this workload, which was designed to have a high load andresource utilization on the WebSphere Application Server.
Database LPAR analysisThis study measures the effect on the DB2 relational database of scaling theworkload and the CPUs on the WebSphere system.
Even though the transactional workload stresses the DB2 backend database systemonly slightly, this stress shows the effects resulting from scaling the workload andthe CPUs on the WebSphere system.
Methodology
The DB2 snapshot tool is used to collect database snapshot data before and afterthe steady state portion of the workload. The Dynamic SQL statements attemptedduring the 10 minute steady state were added to the static SQL statements, and aDB2 workload throughput rate is established. CPU utilization data was alsoobtained. The CPU cost per unit is calculated as sql/sec/CPU * 100, meaning thatthe number of transactions driven with 100% CPU (== 1 Integrated Facility forLinux (IFL)). This is the value shown in the sql/sec/CPU * 100 column. It is ameasurement of the throughput that takes into account the CPU cost.
Chapter 7. Results 39
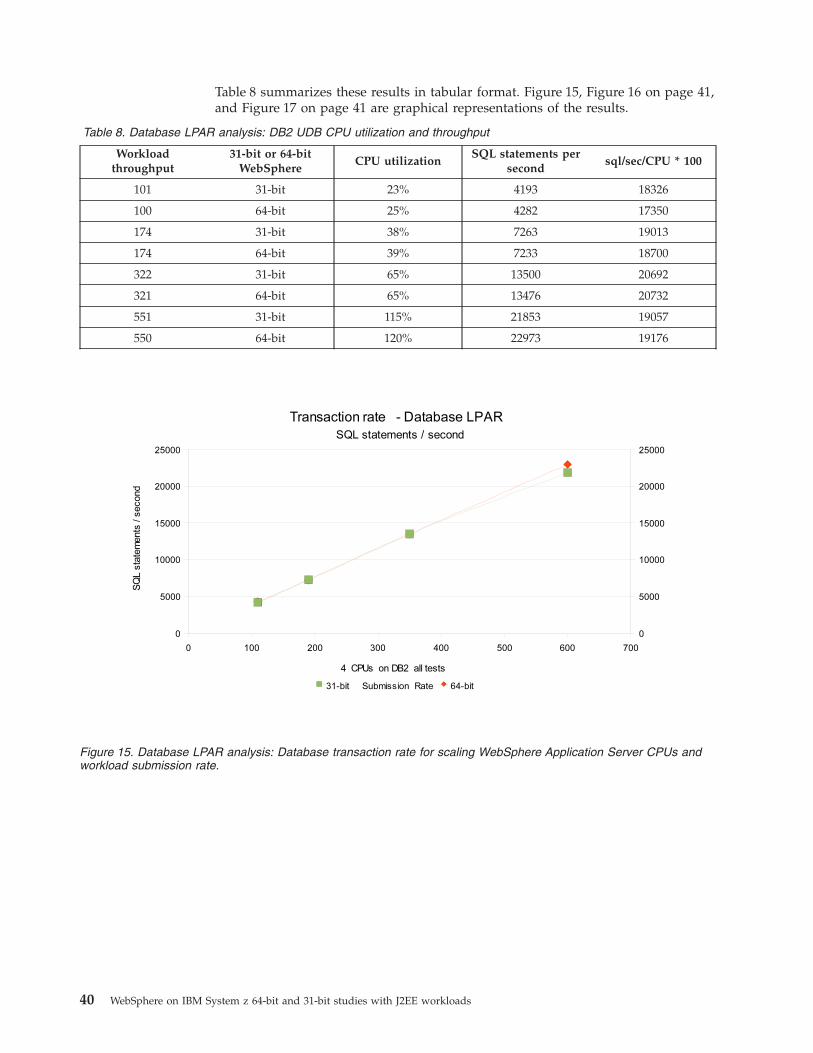
Table 8 summarizes these results in tabular format. Figure 15, Figure 16 on page 41,and Figure 17 on page 41 are graphical representations of the results.
Table 8. Database LPAR analysis: DB2 UDB CPU utilization and throughput
Workloadthroughput
31-bit or 64-bitWebSphere
CPU utilizationSQL statements per
secondsql/sec/CPU * 100
101 31-bit 23% 4193 18326
100 64-bit 25% 4282 17350
174 31-bit 38% 7263 19013
174 64-bit 39% 7233 18700
322 31-bit 65% 13500 20692
321 64-bit 65% 13476 20732
551 31-bit 115% 21853 19057
550 64-bit 120% 22973 19176
Figure 15. Database LPAR analysis: Database transaction rate for scaling WebSphere Application Server CPUs andworkload submission rate.
40 WebSphere on IBM System z 64-bit and 31-bit studies with J2EE workloads
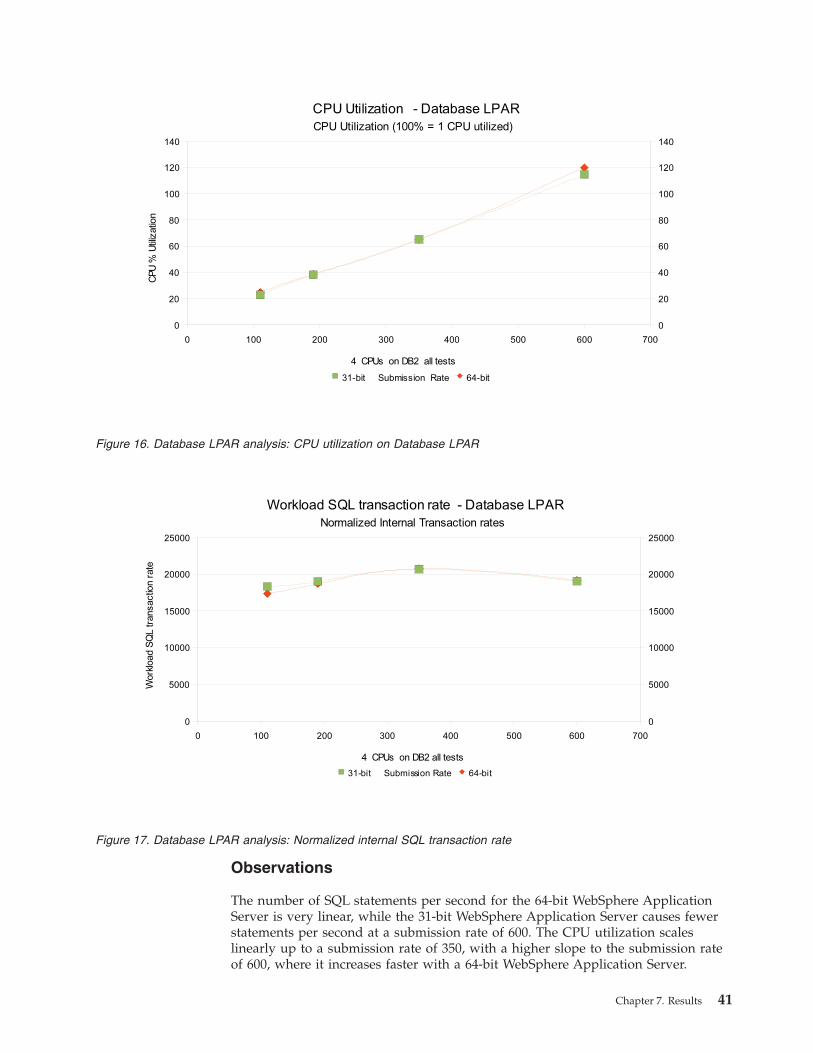
Observations
The number of SQL statements per second for the 64-bit WebSphere ApplicationServer is very linear, while the 31-bit WebSphere Application Server causes fewerstatements per second at a submission rate of 600. The CPU utilization scaleslinearly up to a submission rate of 350, with a higher slope to the submission rateof 600, where it increases faster with a 64-bit WebSphere Application Server.
Figure 16. Database LPAR analysis: CPU utilization on Database LPAR
Figure 17. Database LPAR analysis: Normalized internal SQL transaction rate
Chapter 7. Results 41
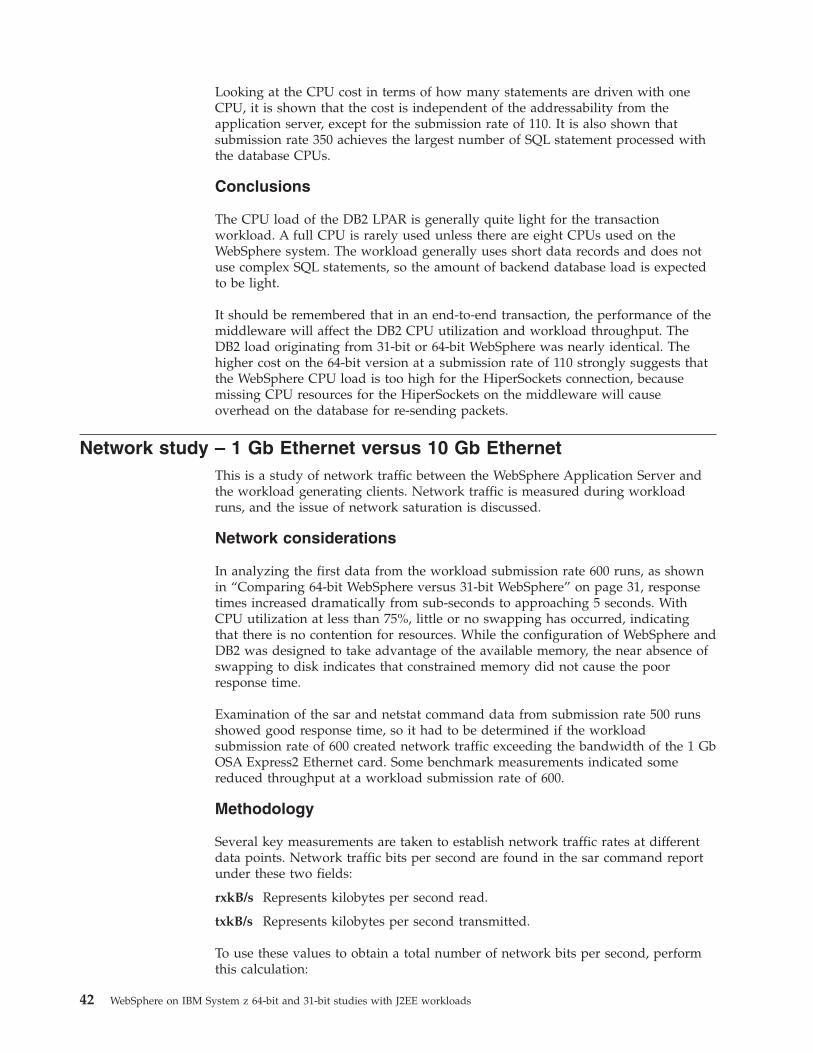
Looking at the CPU cost in terms of how many statements are driven with oneCPU, it is shown that the cost is independent of the addressability from theapplication server, except for the submission rate of 110. It is also shown thatsubmission rate 350 achieves the largest number of SQL statement processed withthe database CPUs.
Conclusions
The CPU load of the DB2 LPAR is generally quite light for the transactionworkload. A full CPU is rarely used unless there are eight CPUs used on theWebSphere system. The workload generally uses short data records and does notuse complex SQL statements, so the amount of backend database load is expectedto be light.
It should be remembered that in an end-to-end transaction, the performance of themiddleware will affect the DB2 CPU utilization and workload throughput. TheDB2 load originating from 31-bit or 64-bit WebSphere was nearly identical. Thehigher cost on the 64-bit version at a submission rate of 110 strongly suggests thatthe WebSphere CPU load is too high for the HiperSockets connection, becausemissing CPU resources for the HiperSockets on the middleware will causeoverhead on the database for re-sending packets.
Network study – 1 Gb Ethernet versus 10 Gb EthernetThis is a study of network traffic between the WebSphere Application Server andthe workload generating clients. Network traffic is measured during workloadruns, and the issue of network saturation is discussed.
Network considerations
In analyzing the first data from the workload submission rate 600 runs, as shownin “Comparing 64-bit WebSphere versus 31-bit WebSphere” on page 31, responsetimes increased dramatically from sub-seconds to approaching 5 seconds. WithCPU utilization at less than 75%, little or no swapping has occurred, indicatingthat there is no contention for resources. While the configuration of WebSphere andDB2 was designed to take advantage of the available memory, the near absence ofswapping to disk indicates that constrained memory did not cause the poorresponse time.
Examination of the sar and netstat command data from submission rate 500 runsshowed good response time, so it had to be determined if the workloadsubmission rate of 600 created network traffic exceeding the bandwidth of the 1 GbOSA Express2 Ethernet card. Some benchmark measurements indicated somereduced throughput at a workload submission rate of 600.
Methodology
Several key measurements are taken to establish network traffic rates at differentdata points. Network traffic bits per second are found in the sar command reportunder these two fields:
rxkB/s Represents kilobytes per second read.
txkB/s Represents kilobytes per second transmitted.
To use these values to obtain a total number of network bits per second, performthis calculation:
42 WebSphere on IBM System z 64-bit and 31-bit studies with J2EE workloads
1. Add the rxkB/s and txkB/s values together.2. Multiply this sum by 1024. This produces the total number of bytes.3. Multiply the total number of bytes by eight. This produces the total number of
network bits per second.
The total number of network bits per second is a good overall measurement ofnetwork traffic.
Two measurements of network congestion consistent with an I/O-bound workloadwere obtained. The first measurement, segments retransmitted, came from thenetstat command report. A netstat snapshot before and after the workload is taken,because the ramp-up or warmup phase of the benchmark would also accumulatenetwork data and that should not be included in the measurements.
To calculate the number of segments retransmitted during the steady-state phase,subtract the number of segments retransmitted found in the first netstat commandreport (that included ramp-up data) from the number displayed in the secondreport.
The second measurement, txdrop/s is the number of packets dropped per second,because of resource constraints. It is found in the sar report.
Table 9 summarizes these results in tabular format. Figure 18 on page 44 andFigure 19 on page 44 are graphical representations of the results.
Table 9. Network study: Data read and written per second, segment retransmits, and packets dropped
31-bit/64-bitWebSphere
Workloadsubmission rate
Network card linkspeed
Megabits read orwritten per
second
Segmentsretransmitted
txdrop/sec
31bit 500 1 Gb Ethernet 746 N/A 0.46
64-bit 500 1 Gb Ethernet 749 N/A 0.29
31bit 600 1 Gb Ethernet 770 N/A 241
64-bit 600 1 Gb Ethernet 783 158,828 249
31bit 600 10 Gb Ethernet 901 4232 0.75
64-bit 600 10 Gb Ethernet 902 198 0.07
Chapter 7. Results 43
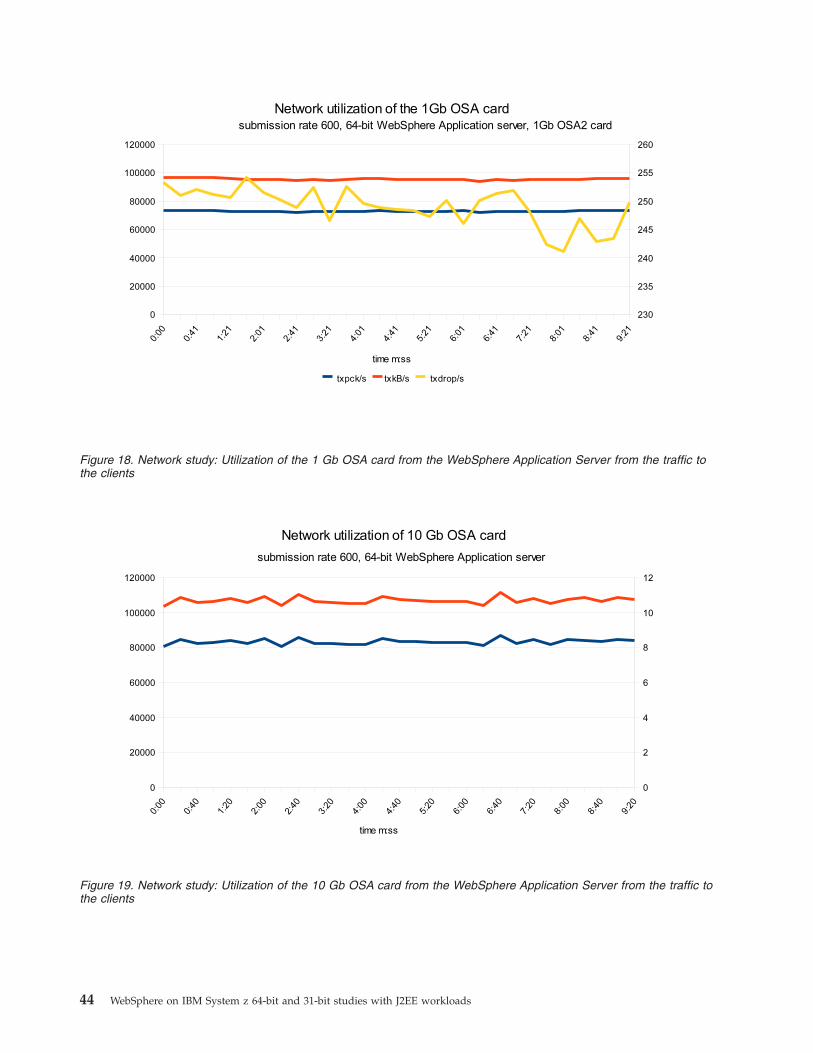
Figure 18. Network study: Utilization of the 1 Gb OSA card from the WebSphere Application Server from the traffic tothe clients
Figure 19. Network study: Utilization of the 10 Gb OSA card from the WebSphere Application Server from the traffic tothe clients
44 WebSphere on IBM System z 64-bit and 31-bit studies with J2EE workloads
Observations
The number of packets dropped per second was a high value (greater than 240) forboth 64-bit and 31-bit WebSphere. Related to these same high drop rates is a highnumber of segment retransmits, which additionally increase the load on thenetwork card. With the 10 Gb Ethernet card, the total throughput increased by12%, and the amount of packages increased by 14%.
Conclusions
The poor response times with the workload submission rate of 600 could be easilyattributed to network I/O traffic reaching the limit of the 1 Gb Ethernet on theWebSphere system being tested. The results also show that for this workload, thepractical limit for good response time on a 1 Gb Ethernet might be approximately780 Mb per second, which indicates that the throughput itself is not the majorlimiting factor.
Another factor is the number of packages, where the number of 80 000 packages ormore could be considered as close to the upper limits. There is seen, on average, avery small package size here (less than 100 bytes). In these cases, the maximumthroughput will not be reached because the high number of I/O requests persecond are the limiting factor. This might also reach limits on other resources suchas the network switch.
Chapter 7. Results 45

46 WebSphere on IBM System z 64-bit and 31-bit studies with J2EE workloads
Appendix. Configuration, tuning, and performance scripts
These configuration, tuning, and performance scripts were used in the 64-bit and31-bit WebSphere study with J2EE workloads.
Script for first time database creation run before database loaddb2 update db cfg for mydb using logfilsiz 65535db2 update db cfg for mydb using logprimary 40db2 update db cfg for mydb using newlogpath /db2logdb2 connect to mydbdb2 -v alter bufferpool ibmdefaultbp size 675000 automaticdb2 connect resetdb2stop;db2startdb2 connect to mydbdb2 connect reset
Tuning script for DB2 after database load# DB2 Auto Configurator Example## Using this command can help you tune DB2 automatically for your environment## 1. Manually adjust your log file locations# 2. Specify the values that is needed for DB2 Auto Configurator### Example:## db2 autoconfigure using mem_percent 80 workload_type simple num_stmts 60tpm 2000 is_populated yes# num_local_apps 0 num_remote_apps 65 isolation rs bp_resizeableyes apply db and dbm## mem_percent - the percentage of system memory you would like to use forbufferpool memory.## Workload_type - for our purpose, WebSphere generally uses simple SQLs.## num_stmts - number of statements involved in the workload## tpm - estminate the transaction per minute that you want DB2 to handle## is_populated - is the database populated with data?## num_local_apps - number of applications connecting locally.If you setup is a two tier config with WebSphere on a separate machine,then enter '0'## num_remote_app - number of applications that will connect to DB2 remotely.This number should be the summation of all the connection pool sizes fromWebSphere. For our workload, it is the size of Connection Pool size of the DB.If it is a WebSphere cluster, multiply it by the number of WebSphere nodes.## isolation - specify the highlest isolation level your Application demands.## bp_resizable - bufferpool resizable or not. Generally is 'yes'## apply db and dbm - apply the settings on your behalf.## I have a dedicated DB2 machine that is in a 2-tier setup separated from theWebSphere machine.# - use 80% of the memory as my buffer pool.
© Copyright IBM Corporation © IBM 2009 47
# - workload has about 60 statements,# - simple workload,# - tpm is dictated by workload rate, so my guess it will hit 2000 maxfor my work on this machine.# - Data is already loaded. I have 65 connections coming in from Websphere,# - most of the beans require isolation level rs.
db2 connect to mydbdb2 autoconfigure using mem_percent 80 workload_type simple num_stmts 60tpm 2000 is_populated yes num_local_apps 0 num_remote_apps 100 isolationrs bp_resizeable yes apply db and dbm#Run the following db2 terminate or else the changes won't take.db2 terminatedb2 connect to mydbdb2 reorgchk update statistics on table alldb2 terminate
Shell script to capture DB2 performance statistics#invocation: ./startgatherDB2 testnamedb2 -v connect to mydbdb2 -v update monitor switches using bufferpool ondb2 -v get snapshot for database on MYDB >snapA$1.outdb2 -v get snapshot for tablespaces on MYDB >tablesnapA$1.outdb2 -v get snapshot for all applications >appsnapA$1.outdb2 -v get snapshot for all bufferpools >buffersnapA$1.outdate >>snapA$1.out############## Beginning of steady state – sleep through the whole thing!sleep 600db2 -v get snapshot for database on MYDB >snapC$1.outdate >>snapC$1.outdb2 -v get snapshot for all applications >appsnapC$1.out#############db2 -v reset monitor all
Gather performance statistics on WebSphere and DB2echo 'in startmeas'mkdir $1cd $1#First argument is Directory off the current directory#Second argument is total seconds to run - choose 600 for 10#Third argument is seconds between sadc snapshots - typically 20let totsamps=$2/$3echo "created directory /results/$1"echo "Running for a total of $2 seconds"echo "Total sar snapshots is $totsamps"/usr/lib/sa/sadc $3 $totsamps sadc.out.$HOSTNAME &netstat -as >netstat.$1.out1.$HOSTNAMEsleep $2netstat -as >netstat.$1.out2.$HOSTNAME
48 WebSphere on IBM System z 64-bit and 31-bit studies with J2EE workloads
Notices
This information was developed for products and services offered in the U.S.A.
IBM may not offer the products, services, or features discussed in this document inother countries. Consult your local IBM representative for information on theproducts and services currently available in your area. Any reference to an IBMproduct, program, or service is not intended to state or imply that only that IBMproduct, program, or service may be used. Any functionally equivalent product,program, or service that does not infringe any IBM intellectual property right maybe used instead. However, it is the user’s responsibility to evaluate and verify theoperation of any non-IBM product, program, or service.
IBM may have patents or pending patent applications covering subject matterdescribed in this document. The furnishing of this document does not grant youany license to these patents. You can send license inquiries, in writing, to:
IBM Director of LicensingIBM CorporationNorth Castle DriveArmonk, NY 10504-1785U.S.A.
For license inquiries regarding double-byte (DBCS) information, contact the IBMIntellectual Property Department in your country or send inquiries, in writing, to:
IBM World Trade Asia CorporationLicensing 2-31 Roppongi 3-chome, Minato-kuTokyo 106-0032, Japan
The following paragraph does not apply to the United Kingdom or any othercountry where such provisions are inconsistent with local law:INTERNATIONAL BUSINESS MACHINES CORPORATION PROVIDES THISPUBLICATION “AS IS” WITHOUT WARRANTY OF ANY KIND, EITHEREXPRESS OR IMPLIED, INCLUDING, BUT NOT LIMITED TO, THE IMPLIEDWARRANTIES OF NON-INFRINGEMENT, MERCHANTABILITY OR FITNESSFOR A PARTICULAR PURPOSE. Some states do not allow disclaimer of express orimplied warranties in certain transactions, therefore, this statement may not applyto you.
This information could include technical inaccuracies or typographical errors.Changes are periodically made to the information herein; these changes will beincorporated in new editions of the publication. IBM may make improvementsand/or changes in the product(s) and/or the program(s) described in thispublication at any time without notice.
Any references in this information to non-IBM Web sites are provided forconvenience only and do not in any manner serve as an endorsement of those Websites. The materials at those Web sites are not part of the materials for this IBMproduct and use of those Web sites is at your own risk.
IBM may use or distribute any of the information you supply in any way itbelieves appropriate without incurring any obligation to you.
© Copyright IBM Corp. 2009 49
Licensees of this program who wish to have information about it for the purposeof enabling: (i) the exchange of information between independently createdprograms and other programs (including this one) and (ii) the mutual use of theinformation which has been exchanged, should contact:
IBM CorporationSoftware Interoperability Coordinator, Department 49XA3605 Highway 52 NRochester, MN 55901U.S.A.
Such information may be available, subject to appropriate terms and conditions,including in some cases, payment of a fee.
The licensed program described in this information and all licensed materialavailable for it are provided by IBM under terms of the IBM Customer Agreement,IBM International Program License Agreement, or any equivalent agreementbetween us.
Any performance data contained herein was determined in a controlledenvironment. Therefore, the results obtained in other operating environments mayvary significantly. Some measurements may have been made on development-levelsystems and there is no guarantee that these measurements will be the same ongenerally available systems. Furthermore, some measurements may have beenestimated through extrapolation. Actual results may vary. Users of this documentshould verify the applicable data for their specific environment.
Information concerning non-IBM products was obtained from the suppliers ofthose products, their published announcements or other publicly available sources.IBM has not tested those products and cannot confirm the accuracy ofperformance, compatibility or any other claims related to non-IBM products.Questions on the capabilities of non-IBM products should be addressed to thesuppliers of those products.
All statements regarding IBM’s future direction or intent are subject to change orwithdrawal without notice, and represent goals and objectives only.
All IBM prices shown are IBM’s suggested retail prices, are current and are subjectto change without notice. Dealer prices may vary.
This information is for planning purposes only. The information herein is subject tochange before the products described become available.
This information contains examples of data and reports used in daily businessoperations. To illustrate them as completely as possible, the examples include thenames of individuals, companies, brands, and products. All of these names arefictitious and any similarity to the names and addresses used by an actual businessenterprise is entirely coincidental.
COPYRIGHT LICENSE:
This information contains sample application programs in source language, whichillustrate programming techniques on various operating platforms. You may copy,modify, and distribute these sample programs in any form without payment toIBM, for the purposes of developing, using, marketing or distributing applicationprograms conforming to the application programming interface for the operating
50 WebSphere on IBM System z 64-bit and 31-bit studies with J2EE workloads
platform for which the sample programs are written. These examples have notbeen thoroughly tested under all conditions. IBM, therefore, cannot guarantee orimply reliability, serviceability, or function of these programs.
Each copy or any portion of these sample programs or any derivative work, mustinclude a copyright notice as follows:
© (your company name) (year). Portions of this code are derived from IBM Corp.Sample Programs. © Copyright IBM Corp. _enter the year or years_. All rightsreserved.
If you are viewing this information in softcopy, the photographs and colorillustrations may not appear.
Edition notices
© Copyright International Business Machines Corporation 2009. All rightsreserved.
U.S. Government Users Restricted Rights — Use, duplication, or disclosurerestricted by GSA ADP Schedule Contract with IBM Corp.
TrademarksIBM, the IBM logo, ibm.com®, DB2, DB2 Universal Database, DS8000, ECKD,HiperSockets, Resource Link™, System x, System z, System z10, and WebSphere aretrademarks or registered trademarks of International Business MachinesCorporation in the United States, other countries, or both. These and other IBMtrademarked terms are marked on their first occurrence in this information withthe appropriate symbol (® or ™), indicating US registered or common lawtrademarks owned by IBM at the time this information was published. Suchtrademarks may also be registered or common law trademarks in other countries.A complete and current list of IBM trademarks is available on the Web athttp://www.ibm.com/legal/copytrade.shtml
Adobe®, the Adobe logo, PostScript®, and the PostScript logo are either registeredtrademarks or trademarks of Adobe Systems Incorporated in the United States,and/or other countries.
Cell Broadband Engine™ is a trademark of Sony Computer Entertainment, Inc. inthe United States, other countries, or both and is used under license therefrom.
Intel, Intel logo, Intel Inside®, Intel Inside logo, Intel® Centrino®, Intel Centrinologo, Celeron®, Intel® Xeon®, Intel SpeedStep®, Itanium®, and Pentium® aretrademarks or registered trademarks of Intel Corporation or its subsidiaries in theUnited States and other countries.
Java and all Java-based trademarks and logos are trademarks of Sun Microsystems,Inc. in the United States, other countries, or both.
Linux is a registered trademark of Linus Torvalds in the United States, othercountries, or both.
Other company, product, or service names may be trademarks or service marks ofothers.
Notices 51
Terms and conditionsPermissions for the use of these publications is granted subject to the followingterms and conditions.
Personal Use: You may reproduce these publications for your personal,noncommercial use provided that all proprietary notices are preserved. You maynot distribute, display or make derivative works of these publications, or anyportion thereof, without the express consent of the manufacturer.
Commercial Use: You may reproduce, distribute and display these publicationssolely within your enterprise provided that all proprietary notices are preserved.You may not make derivative works of these publications, or reproduce, distributeor display these publications or any portion thereof outside your enterprise,without the express consent of the manufacturer.
Except as expressly granted in this permission, no other permissions, licenses orrights are granted, either express or implied, to the publications or any data,software or other intellectual property contained therein.
The manufacturer reserves the right to withdraw the permissions granted hereinwhenever, in its discretion, the use of the publications is detrimental to its interestor, as determined by the manufacturer, the above instructions are not beingproperly followed.
You may not download, export or re-export this information except in fullcompliance with all applicable laws and regulations, including all United Statesexport laws and regulations.
THE MANUFACTURER MAKES NO GUARANTEE ABOUT THE CONTENT OFTHESE PUBLICATIONS. THESE PUBLICATIONS ARE PROVIDED ″AS-IS″ ANDWITHOUT WARRANTY OF ANY KIND, EITHER EXPRESSED OR IMPLIED,INCLUDING BUT NOT LIMITED TO IMPLIED WARRANTIES OFMERCHANTABILITY, NON-INFRINGEMENT, AND FITNESS FOR APARTICULAR PURPOSE.
52 WebSphere on IBM System z 64-bit and 31-bit studies with J2EE workloads


����
Printed in USA


![A High-Speed 64-Bit Binary Comparator€¦ · A high-speed 64-bit binary comparator 39 | Page III. EXISTING 64-BIT BINARY COMPARATOR DESIGN 64-bit comparator in reference [8], [9],](https://img.pdfslide.us/doc/110x75/5eac1a458d19873e777698b4/a-high-speed-64-bit-binary-comparator-a-high-speed-64-bit-binary-comparator-39-.jpg)