Embed Size (px)
Citation preview
Survey of Space Nuclear Power Technology
22.902 Final Design Report
Fall 2003
Pete Yarsky
Acknowledgements:
The author would like to thank Dr. Kadak, for his assistance in completing the this work.
Table of Contents
1.0 Introduction.............................................................................................................51.1 Background..........................................................................................................51.2 Power Conversion Technology............................................................................61.3 Reactor Technology.............................................................................................7
2.0 Argon Brayton Cycle...............................................................................................92.1 Abstract................................................................................................................92.2 Introduction..........................................................................................................92.3 Methodology........................................................................................................92.4 Theory................................................................................................................102.5 Results................................................................................................................132.6 Discussion..........................................................................................................142.7 References..........................................................................................................16
3.0 Thermionic Power Conversion..............................................................................173.1 Introduction........................................................................................................173.2 Single Layer Design..........................................................................................173.3 Dual Layer Design.............................................................................................193.4 Direct Contact Single Layer..............................................................................203.5 Comparisons......................................................................................................223.6 Conclusions........................................................................................................223.7 References..........................................................................................................23
4.0 Sodium Rankine Cycle.........................................................................................244.1 Introduction........................................................................................................244.2 Simple Rankine Cycle Specifications................................................................244.3 Ideal Analysis....................................................................................................244.4 Real Analysis.....................................................................................................284.5 High Temperature Cycle....................................................................................294.6 Discussion..........................................................................................................294.7 References..........................................................................................................30
5.0 Radioisotope Doping to Prevent Coolant Freezing...............................................315.1 Introduction........................................................................................................315.2 Radioisotopes.....................................................................................................315.3 Analysis.............................................................................................................315.4 Calculations.......................................................................................................335.5 Conclusions........................................................................................................345.6 References..........................................................................................................35
6.0 Highly Enriched Uranium Fueled Ultra High Power Density Core......................366.1 Introduction........................................................................................................366.2 Design Changes.................................................................................................366.3 Core Size............................................................................................................376.4 Core Life Studies...............................................................................................386.5 Control Mechanism...........................................................................................396.6 Void Reactivity..................................................................................................396.7 Conclusions........................................................................................................406.8 References..........................................................................................................41
2
7.0 Summary, Conclusions and Recommended Future Work.....................................427.1 Summary............................................................................................................427.2 Conclusions........................................................................................................427.3 Future Work.......................................................................................................43
3
List of Figures and Tables
Figure. 2.3.1. Brayton Cycle Schematic............................................................................10Figure. 2.5.1. Net useful work as a function of minimum cycle temperature...................13Table II.V.I. Cycle Characteristics....................................................................................14Table II.V.II. Sensitivity Analysis.....................................................................................14Figure. 3.2.1. Diagram of the Single Layer Thermionic Conversion Power Package......18Figure. 3.4.1. Conceptual Fuel Plate for Single Layer, Direct Contact TIC....................21Figure. 4.3.1. Sodium Saturation Properties......................................................................25Figure. 4.3.2. Exit Quality vs. Outlet Pressure..................................................................26Figure. 4.3.3. Net Work vs. Outlet Pressure......................................................................27Table IV.IV.I. Performance Map.......................................................................................28Table V.IV.I. Coolant Properties......................................................................................33Figure 6.1.1. UHPDC layout.............................................................................................36Figure 6.3.1. Core Multiplication Factor as a Function of Core Dimension.....................37Figure 6.4.1. Reactivity History for the HEU UHPDC.....................................................38Figure 6.3.1. Effect of Control Device on BOL Eigenvalue.............................................39Table VI.VII.I. RGP and HEU comparison.......................................................................40Table VII.I.I. Power Conversion Technology Comparison...............................................42
4
1.0 Introduction
1.1 Background
As part of a design course at MIT, an ultra high power density plutonium fueled nuclear reactor core was developed for use in an electric powered propulsion system. The reactor was cooled with molten salt, which was passed through an internal radiator. The power conversion unit was based on next generation thermo-photovoltaic (TPV) technology. The core lifetime was approximately 600 EFPD and the system produced 4 MW of electric power.
For several reasons, this technology will not be implemented in the short term for space exploration. Firstly, it requires TPV to operate at temperatures > 100 K than what they have been demonstrated to operate at on earth, and they must operate at higher efficiencies, requiring very high coolant temperatures; being such, the corrosive aspects of the molten salt would require development of next generation structural materials for the radiator.
To facilitate the mission to Mars initiative, a lower power system based on more conventional or state of the art technologies is desired. The scope of the current body of work examines the use of more traditional power conversion technologies to achieve a mid-range power system for short-term space exploration applications that are scalable to high power operations with incremental improvements.
This report examines both the thermal hydraulic and physics aspects of designing a nuclear electric power system for space applications. In the physics area, work was done to design a highly enriched uranium (HEU) fueled ultra-high-power-density core (UHPDC). In the area of thermal-hydraulics, the primary thrust of the current work has been to evaluate alternative power conversion schemes. Gas and liquid metal coolants were evaluated in a matrix of power conversion options. Based on simplified analyses, the most promising power conversion strategies were identified.
In any space application, minimizing reactor mass is an ever present objective. However, mass is not the only concern. The motivations behind designing the plutonium core were twofold. Plutonium has a lower critical mass than uranium, and therefore, allows for a smaller core. Reactor Grade Plutonium (RGP), or the spent fuel plutonium from LWR, was the proposed fuel material, in the form of PuC. RGP is comprised primarily of Pu239, Pu240, and Pu241. Pu239 and Pu241 have very large fission cross sections at both thermal and fast neutron energies. Pu240, while fissionable in a fast spectrum, is also a fertile material. The RGP core had a relatively shallow reactivity swing through life because uneventful capture in the plutonium isotopes did not reduce the effective inventory of “fissionable” materials.
With HEU fuel, the BOL core must be loaded with excess reactivity to accommodate for the burnup of fissionable U235, and though this is also the case with RGP fuel, the excess reactivity required is greater. This is because U235 capture produces U236, which is not
5
as likely to fission as the fertile plutonium isotopes. The greater BOL reactivity complicates the control mechanism design. The design of the HEU core will focus on core dimension requirements, lifetime studies, and design of the reactivity control mechanisms.
The thermal-hydraulic analyses conducted were simplified. Comparisons of potential power cycles were carried out. Previous work has looked a plethora of different options. Static and dynamic power conversion alternatives were explored.
Static conversion refers to power conversion units (PCU) without moving parts. These include thermionic converters (TIC) and thermo-photo-voltaics (TPV). Aside from being simpler, these PCU options also generate DC power.
Dynamic conversion refers to PCUs with moving parts. The primary examples are Stirling, Rankine, and Brayton cycles, which convert the working fluid heat to mechanical energy, which is then converted to AC power.
Since most devices rely on DC power, and moving parts typically reduce system reliability, space reactors will most likely rely on some form of static, direct power conversion technologies. However, static conversion technology is not very mature. TIC have been demonstrated to operate at ~15% efficiency at temperatures of ~1200 K, whereas TPV converters have shown ~20% efficiency at much lower temperatures. In either case the efficiency is heavily dependent on temperature.
For high power applications it is not certain that low efficiency static conversion systems will work, or that the space power system can operate in the required temperature regimes. Therefore, dynamic options such as those listed above must be considered.
The overall objective was to design a nuclear space power “package.” The package is the reactor and the PCU. The reactor is a HEU fueled UHPDC similar to the RGP fueled UHPDC designed previously at MIT. The PCU options were compared and a promising technology was selected for application in a package capable of producing at least 400 kWe with the ability to be scaled to the multi-megawatt regime.
The scalability of the different power packages was assessed and future research goals established based on the transformational nature of the more promising technologies.
1.2 Power Conversion Technology
Three power conversion technologies were evaluated and their properties are discussed in this report. TPV technology was already employed in a space reactor design conducted at MIT. TIC is similar to TPV in that TIC is also static and direct. Therefore the tradeoffs between TIC and TPV were evaluated to understand the range of applicability for TIC.
6
Dynamic power conversion approaches were also evaluated. A reference Brayton cycle (argon working fluid) and a reference Rankine cycle (sodium working fluid) were compared. These two cycles in particular were examined because of their scalability. Each of these dynamic cycles offers potential for multi-megawatt power as the temperature and pressure of the cycles are increased.
This report will describe the simple argon Brayton cycle, as well as power regimes where the cycle is competitive. The scalability of the cycle is assessed by determining the work that can attained from the cycle with temperatures of the order of 1200 K. Higher temperatures require research into materials development to assure systems reliability. The cycle temperatures required to attained approximately 3 or 4 MW are also assessed. For the argon Brayton cycle, analysis has shown that temperatures of the order of 2200 K are required to reach the multi-megawatt regime.
The simple sodium Rankine cycle is a more promising alternative in terms of dynamic power conversion. Analysis of this cycle shows very promising results at low temperature and pressure (as much as 1 MW can be achieved in the 1200 K temperature range). The distinctive properties of sodium allow for easily scaling the power to 3 – 4 MW with coolant temperatures on the order of 1500 K at ~ 10 atm of pressure.
The body of this report will describe the argon Brayton cycle in Chapter 2. The Brayton cycle is the proposed power conversion technology employed for the SAFE 400 program. Secondly TIC is described with respective to novel approaches for implementation in Chapter 3. Thirdly, the sodium Rankine cycle is examined in Chapter 4. The promising results of the sodium Rankine cycle analysis motivate work on enabling technologies to avert problems with liquid/vapor metal coolants with regards to reactor startup.
Particularly, coolant freezing was identified as a potential concern with regards to reactor startup. The reactor must be launched to achieve a “nuclear safe” orbit before operation can begin. A “nuclear safe” orbit is defined as an orbit where the orbit will not degrade. The reactor should be not operational, thus not producing radioactive fission products, until it is a sufficient distance from the Earth to ensure that the system will not reenter the atmosphere.
In delivering a liquid metal cooled system to this orbit, and assembling the power package with other components, steps must be taken to ensure that the coolant does not freeze before the reactor can be started. The novel approach of radioisotope doping was considered and evaluated to assess the applicability to the sodium Rankine cycle as well as its applicability to other liquid metal cooled systems. The associated analysis for radioisotope doping is contained in Chapter 5.
1.3 Reactor Technology
The UHPDC is considered for use with any of these systems. Though in the case for next-generation TIC the core will undergo major design changes, it is worthwhile to examine the reference core. RGP is already radioactive, as higher isotopes of plutonium
7
undergo spontaneous fission, therefore, the reactor fuel poses a safety concern prior to launch.
Analyses conducted at MIT confirm that the radiotoxicity hazard of the UHPDC is comparable to the Cassini Radioisotope Thermoelectric Generator (RTG) powered probe. However, if highly enriched uranium (HEU) can be used as an alternative fuel form with little or no penalty in performance and mass, then it is worthwhile to use HEU fuel.
Chapter 6 discusses the design changes made to the UHPDC core with sodium coolant to facilitate operation and control with HEU fuel as opposed to RGP fuel. Along with the design changes, there are details as to the changes made to the ex-core control mechanism. As a result of the design changes, the benefits of using RGP fuel can be assessed numerically in terms of mass, radiotoxicity, and simplicity of reactor control.
8
2.0 Argon Brayton Cycle
2.1 Abstract
A simple model was developed to explore the applicability of argon gas Brayton cycles for space reactor applications. Simple analyses were conducted to explore the power limitations for the cycle and establish power regimes were the cycle has competitive advantages verses direct energy conversion schemes.
2.2 Introduction
Midrange power reactor applications are of current interest for supporting the Mission to Mars initiative. To support these applications, the current work examines the applicability of a simple argon Brayton cycle for space reactor power conversion. Midrange refers to power levels between 200 kWe to 1 MWe.
Brayton cycles are of particular interest because of the possibility of operating at very high temperature. Cycle heat rejection is limited to radiation losses, and therefore, higher fluid temperatures on the cold leg are preferred to maximize the useful work.
Ultimately, any cycle is limited by the Carnot efficiency, and therefore, cycles that operate at high cold leg temperatures relative to the hot leg will operate at low efficiencies. Cycle analysis, therefore, is aimed at arriving at maximum net work, which is often far from optimum efficiency. Additionally, to ensure lightweight and high system reliability, simple cycles are preferred.
2.3 Methodology
The argon simple Brayton cycle is analyzed based on a list of simplifying assumptions. Firstly, no consideration is current given to the size or mass of components. In most space reactor applications the radiator and associated armor accounts for a large fraction of the total PCU mass. Secondly, an ideal gas approximation is used to determine the fluid thermodynamic properties.
To give a basis for the heat rejection limitations for the cycle, a radiator surface area of 180 m2 is assumed, and the armor emissivity is assumed to be 0.85. The cycle contains both a compressor and a turbine, in Brayton cycles the overall efficiency is fairly sensitive to these component efficiencies, each of these components is assumed to have an efficiency of 0.90.
Further assumptions are made to simplify the thermodynamic analysis, firstly, an ideal gas approximation is used. Secondly, constant specific heat is assumed. Fluid properties (k = 1.68 and cp = 520.5 J/kgK) at taken at a temperature of 700 K, though the fluid will likely be at temperatures in excess of 1400 K in the hot leg of the cycle. Since this analysis is meant to explore the applicability of the argon Brayton cycle, such simplifying
9
assumptions will yield results that, while not being completely accurate, give an order of magnitude for achievable net work.
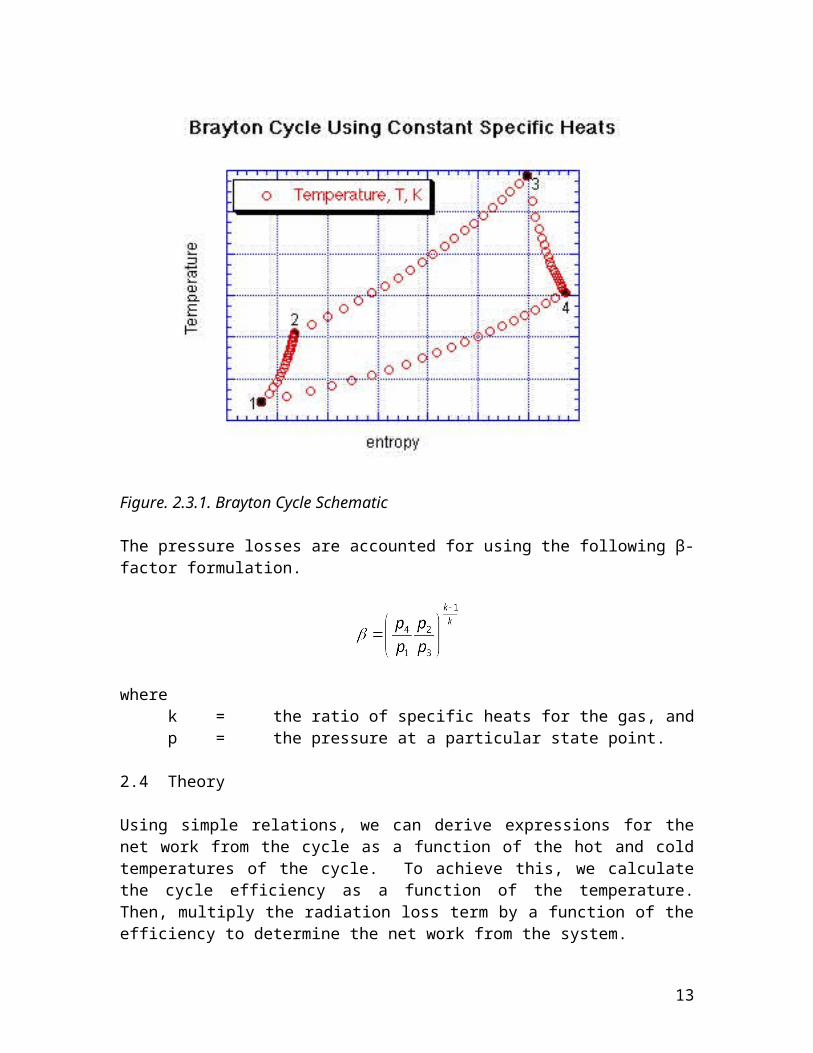
Pressure losses are also dealt with approximately using a β-factor approach. In this case β is assumed to be 1.05, though in a compact system with high velocity flows, this is likely to be somewhat higher. The simple Brayton cycle with losses is shown in Figure 2.3.1. Reference points are labeled 1-4.
Figure. 2.3.1. Brayton Cycle Schematic
The pressure losses are accounted for using the following β-factor formulation.
wherek = the ratio of specific heats for the gas, andp = the pressure at a particular state point.
2.4 Theory
Using simple relations, we can derive expressions for the net work from the cycle as a function of the hot and cold temperatures of the cycle. To achieve this, we calculate the
10
cycle efficiency as a function of the temperature. Then, multiply the radiation loss term by a function of the efficiency to determine the net work from the system.
A hot temperature (T3) is then specified. By differentiating the net work equation, one can find the cold temperature (T1) where the maximum net work is produced.
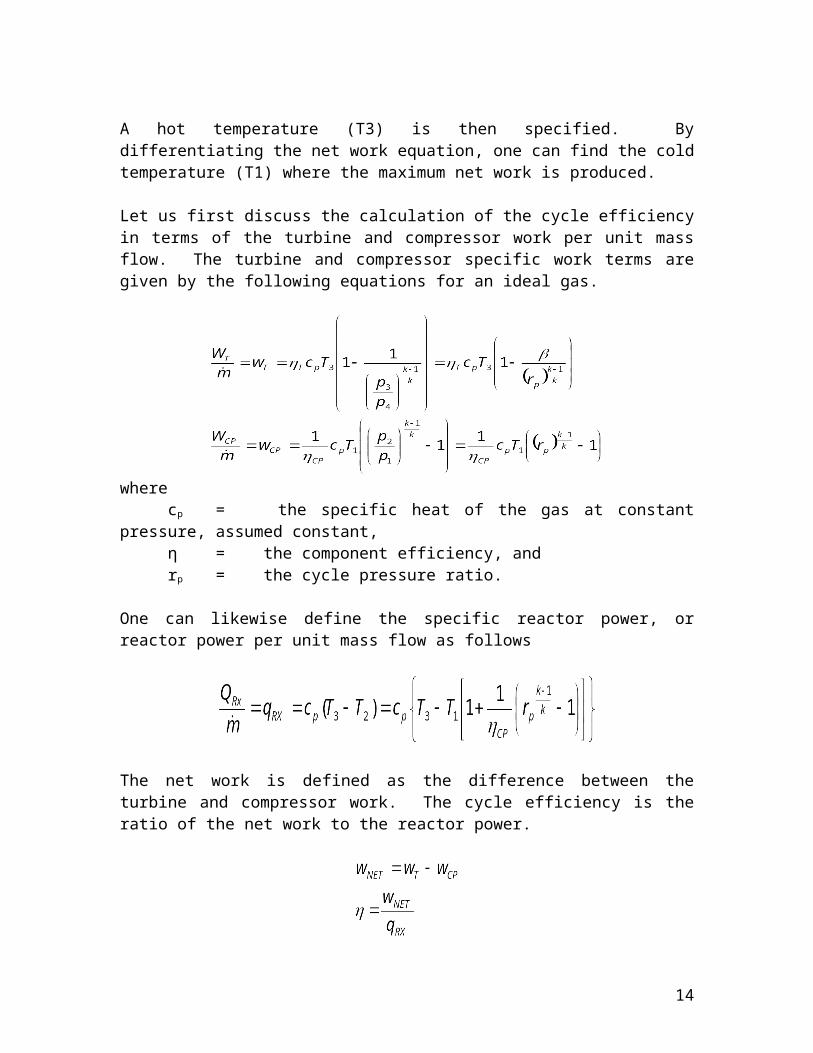
Let us first discuss the calculation of the cycle efficiency in terms of the turbine and compressor work per unit mass flow. The turbine and compressor specific work terms are given by the following equations for an ideal gas.
wherecp = the specific heat of the gas at constant pressure, assumed constant,η = the component efficiency, andrp = the cycle pressure ratio.
One can likewise define the specific reactor power, or reactor power per unit mass flow as follows
The net work is defined as the difference between the turbine and compressor work. The cycle efficiency is the ratio of the net work to the reactor power.
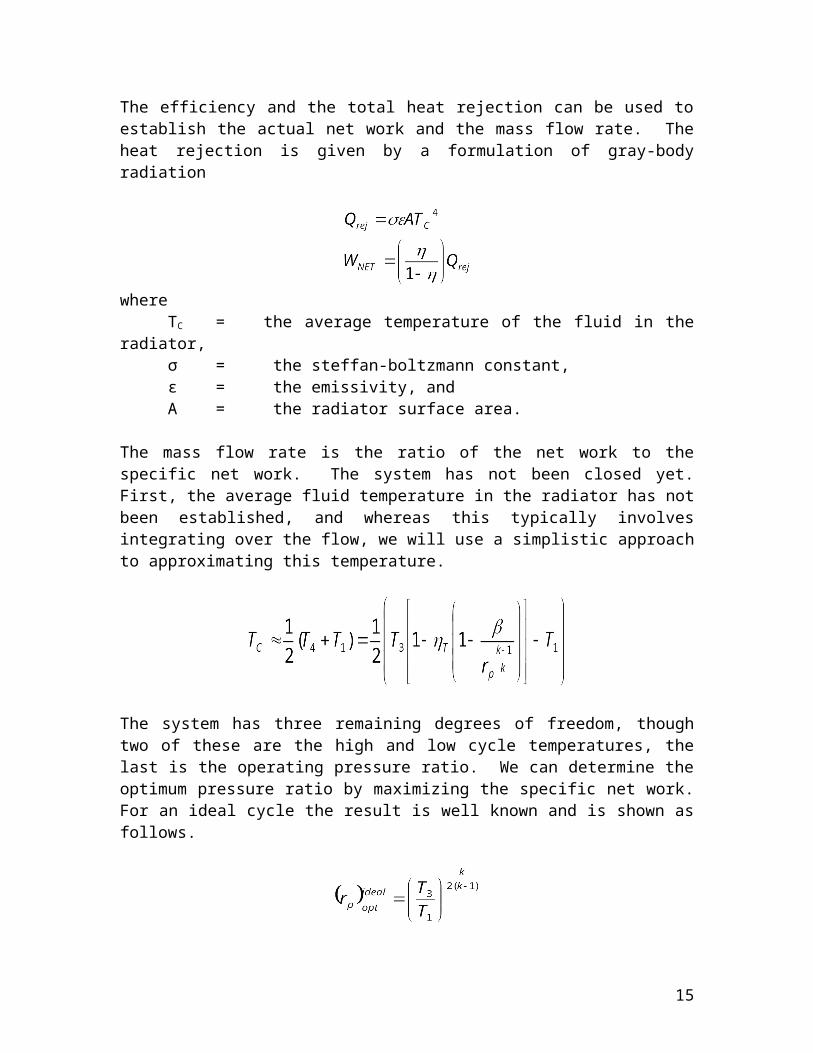
The efficiency and the total heat rejection can be used to establish the actual net work and the mass flow rate. The heat rejection is given by a formulation of gray-body radiation
whereTC = the average temperature of the fluid in the radiator,σ = the steffan-boltzmann constant,ε = the emissivity, and
11
A = the radiator surface area.
The mass flow rate is the ratio of the net work to the specific net work. The system has not been closed yet. First, the average fluid temperature in the radiator has not been established, and whereas this typically involves integrating over the flow, we will use a simplistic approach to approximating this temperature.
The system has three remaining degrees of freedom, though two of these are the high and low cycle temperatures, the last is the operating pressure ratio. We can determine the optimum pressure ratio by maximizing the specific net work. For an ideal cycle the result is well known and is shown as follows.
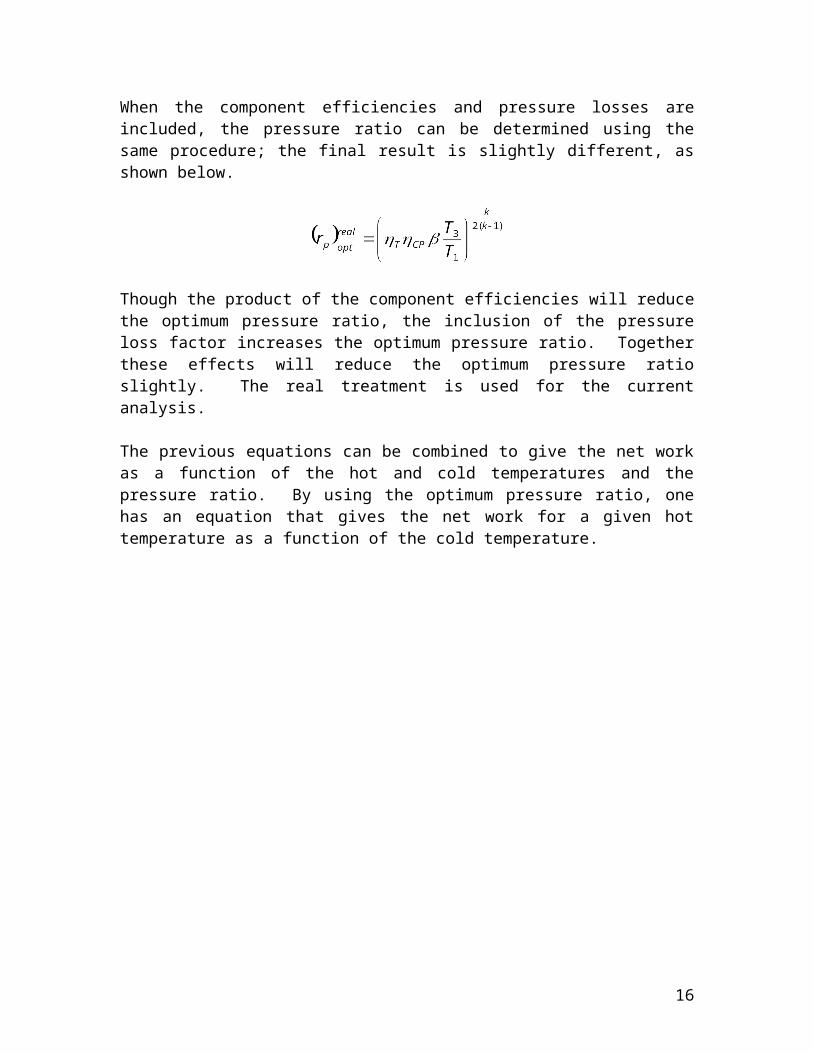
When the component efficiencies and pressure losses are included, the pressure ratio can be determined using the same procedure; the final result is slightly different, as shown below.
Though the product of the component efficiencies will reduce the optimum pressure ratio, the inclusion of the pressure loss factor increases the optimum pressure ratio. Together these effects will reduce the optimum pressure ratio slightly. The real treatment is used for the current analysis.
The previous equations can be combined to give the net work as a function of the hot and cold temperatures and the pressure ratio. By using the optimum pressure ratio, one has an equation that gives the net work for a given hot temperature as a function of the cold temperature.
12
2.5 Results
A computer is used to solve the system of equations numerically. Though one can manipulate the formulas to achieve a single closed form equation eliminating all variables besides the temperature limits and the net work, this approach allows one to simultaneously calculate a host of other parameters of interest.
The approach also allows for quick sensitivity analyses by changing temperatures and other input parameters. Ideally, the cycle should be relatively insensitive to small perturbations in the input parameters. The susceptibility of the net work is of particular interest once temperature limits are established.
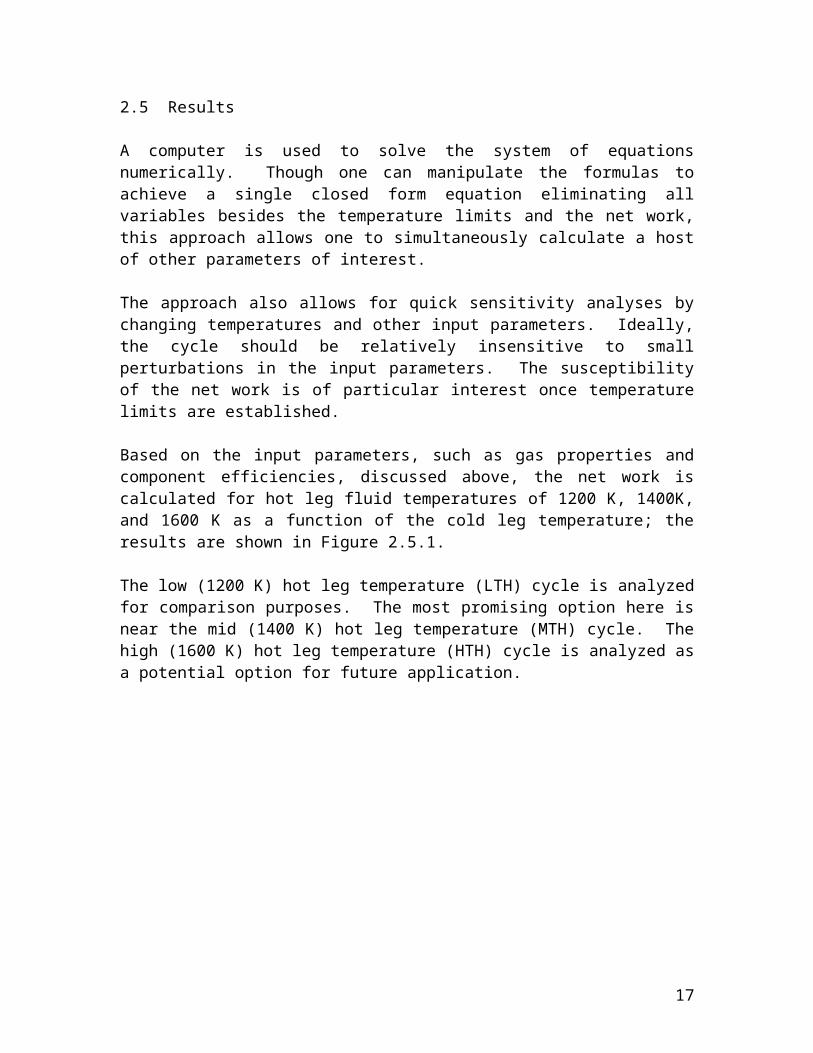
Based on the input parameters, such as gas properties and component efficiencies, discussed above, the net work is calculated for hot leg fluid temperatures of 1200 K, 1400K, and 1600 K as a function of the cold leg temperature; the results are shown in Figure 2.5.1.
The low (1200 K) hot leg temperature (LTH) cycle is analyzed for comparison purposes. The most promising option here is near the mid (1400 K) hot leg temperature (MTH) cycle. The high (1600 K) hot leg temperature (HTH) cycle is analyzed as a potential option for future application.
Figure. 2.5.1. Net useful work as a function of minimum cycle temperature.
13
The figure clearly summarizes the achievable power for each temperature limit. For the LTH cycle, the maximum useful work is approximately 300 kW; for the MTH cycle, 550 kW; and for the HTH cycle, 950 kW.
The cycle characteristics for each of the proposed temperature limits are summarized in table II.V.I.
LTH MTH HTHT1 (low) 400 K 473 K 533 KT2 665 K 780 K 890 KT3 (high) 1200 K 1400 K 1600 KT4 830 K 970 K 1100 KNet Work 300 kW 560 kW 950 kWThermal Efficiency 0.20 0.19 0.20Mass Flow Rate 5.5 kg/s 9.1 kg/s 13 kg/sReactor Power 1.5 MW 3.0 MW 4.9 MWPressure Ratio 3.18 3.13 3.18
Table II.V.I. Cycle Characteristics
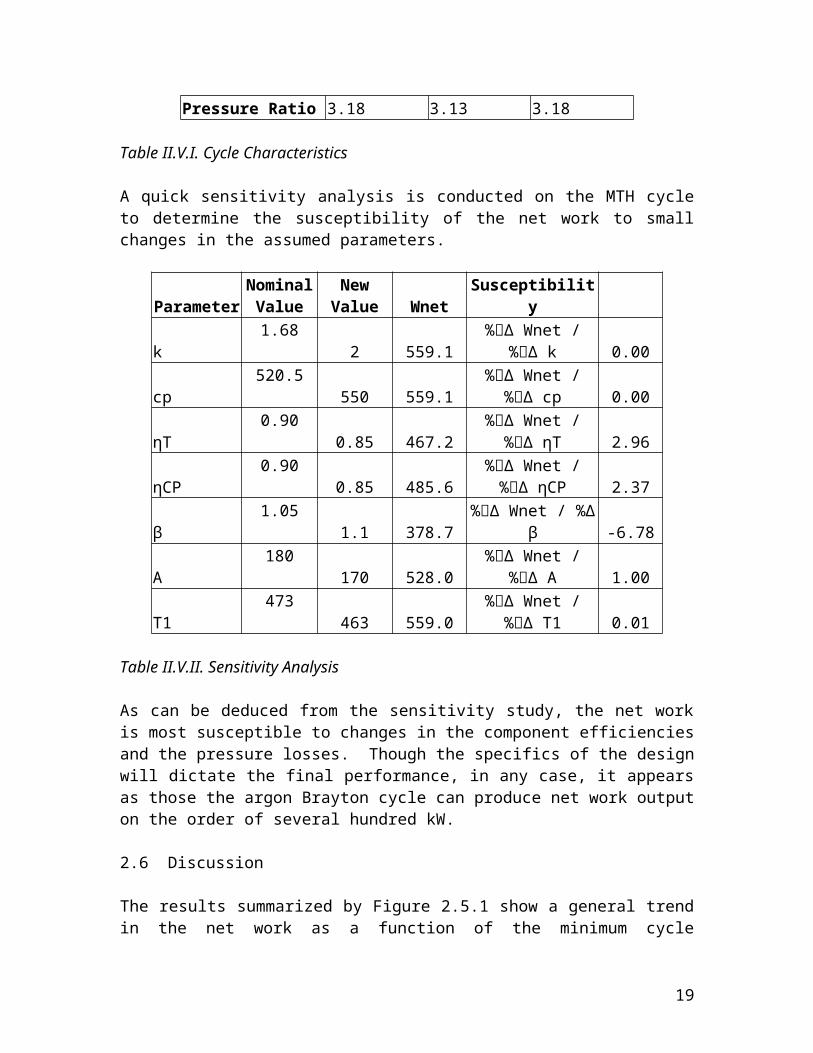
A quick sensitivity analysis is conducted on the MTH cycle to determine the susceptibility of the net work to small changes in the assumed parameters.
ParameterNominal
ValueNew
Value Wnet Susceptibility
k1.68
2 559.1%Δ Wnet / %Δ
k 0.00
cp520.5
550 559.1%Δ Wnet / %Δ
cp 0.00
ηT0.90
0.85 467.2%Δ Wnet / %Δ
ηT 2.96
ηCP0.90
0.85 485.6%Δ Wnet / %Δ
ηCP 2.37β 1.05 1.1 378.7 %Δ Wnet / %Δ β -6.78
A180
170 528.0%Δ Wnet / %Δ
A 1.00
T1473
463 559.0%Δ Wnet / %Δ
T1 0.01
Table II.V.II. Sensitivity Analysis
As can be deduced from the sensitivity study, the net work is most susceptible to changes in the component efficiencies and the pressure losses. Though the specifics of the design will dictate the final performance, in any case, it appears as those the argon Brayton cycle can produce net work output on the order of several hundred kW.
14
2.6 Discussion
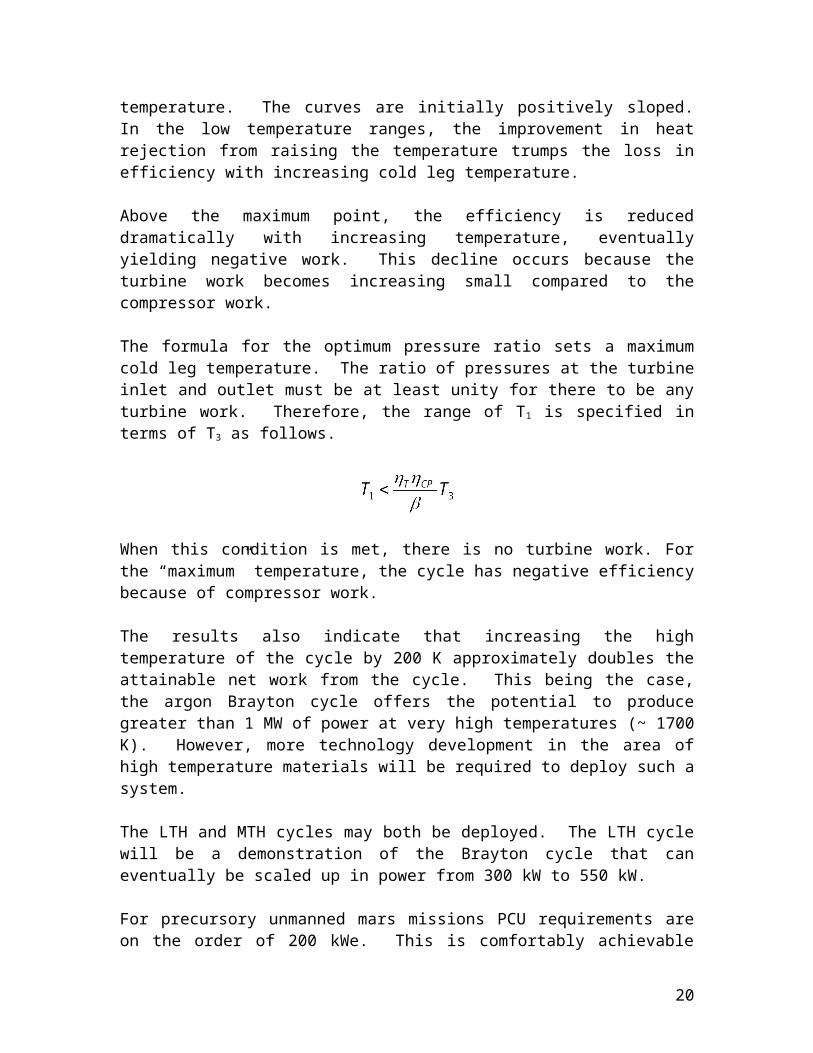
The results summarized by Figure 2.5.1 show a general trend in the net work as a function of the minimum cycle temperature. The curves are initially positively sloped. In the low temperature ranges, the improvement in heat rejection from raising the temperature trumps the loss in efficiency with increasing cold leg temperature.
Above the maximum point, the efficiency is reduced dramatically with increasing temperature, eventually yielding negative work. This decline occurs because the turbine work becomes increasing small compared to the compressor work.
The formula for the optimum pressure ratio sets a maximum cold leg temperature. The ratio of pressures at the turbine inlet and outlet must be at least unity for there to be any turbine work. Therefore, the range of T1 is specified in terms of T3 as follows.
When this condition is met, there is no turbine work. For the “maximum” temperature, the cycle has negative efficiency because of compressor work.
The results also indicate that increasing the high temperature of the cycle by 200 K approximately doubles the attainable net work from the cycle. This being the case, the argon Brayton cycle offers the potential to produce greater than 1 MW of power at very high temperatures (~ 1700 K). However, more technology development in the area of high temperature materials will be required to deploy such a system.
The LTH and MTH cycles may both be deployed. The LTH cycle will be a demonstration of the Brayton cycle that can eventually be scaled up in power from 300 kW to 550 kW.
For precursory unmanned mars missions PCU requirements are on the order of 200 kWe. This is comfortably achievable with the LTH cycle, at potentially even lower temperatures. For future mission plans, if the argon Brayton cycle is adopted as the key power conversion option, improvements must be made in materials research such that the cycle temperature can be increased dramatically without loss of structural integrity.
To achieve net work on the order of 3 to 4 MW, the high temperature of the cycle must be greater than 2000 K. With a high temperature of 2200 K, the maximum net work is 3.4 MW with a low cycle temperature of 740 K and 19% thermal efficiency.
Based on the sensitivity analysis, component efficiencies on the order of 90% are required and fractional pressure losses must be kept to a minimum. This motivates the use of a high pressure cycle.
15
2.7 References
1. Hodgman, C. ed.: Handbook of Chemistry and Physics, Chemical Rubber Publishing Company. 44th ed. Cleveland, OH, 1962.
2. Todreas, N., Kazimi, M.: Nuclear Systems I Thermal Hydraulic Fundamentals, Taylor and Francis. New York, 1993.
3. Dostal, V., Gezelius, K., Horng, J., Koser, J., Palaia, J., Shwageraus, E., Yarsky,P.: “Mission to Mars: How to get people there and back with Nuclear Energy” May 2003.
16
3.0 Thermionic Power Conversion
3.1 Introduction
Thermionics refers to the direct conversion of heat to electric current. Thermionic converters (TIC) work by using a high temperature source to liberate electrons from an emitter, which then preferentially flow towards a cooler collector. Though these devices operate at relatively low efficiencies up to temperatures near 1200 K, the potential to achieve efficiency on the order of 25% seems reasonable at emitter temperatures on the order 2200 K.
Previous analysis of a simple Brayton cycle for potential deployment with space reactors shows that 2200 K is the hot leg temperature required to generate 3 – 4 MW of electric power. Thermionics are compared with the Brayton cycle to establish the limits of useful work. Two scenarios are evaluated. A small power unit using a liquid metal cooled reactor is proposed. The first system will operate with a single layer thermionic power conversion system. A second, larger power unit is proposed, though without giving thought to the coolant, as thermionics can be utilized with direct contact with the fuel cladding. The second system makes use of a dual layer thermionic converters where the collector of the first layer heats the emitter of the second layer.
The first system will operate between temperatures of 1200 K and 750 K. For these temperature ranges, lead efficiencies of 12.4% or higher have been demonstrated experimentally using closed space cesium converters.1 For higher emitter temperatures (2200 K) barium-cesium converters have been demonstrated to operate in excess of 12% efficiency at a collector temperature on the order of 1200 K.1 The second scheme layers the converters so that the barium-cesium collector acts as the heat source for the emitter for a closed space cesium converter.
In either case the heat rejection for a given radiator surface area will be the same. Therefore, the useful work of the dual layer system will be approximately 2.5 times the useful work from the single layer system. Since two designs are being proposed, they will be discussed separately, extrapolating the results from the single layer design to a dual layer design.
3.2 Single Layer Design
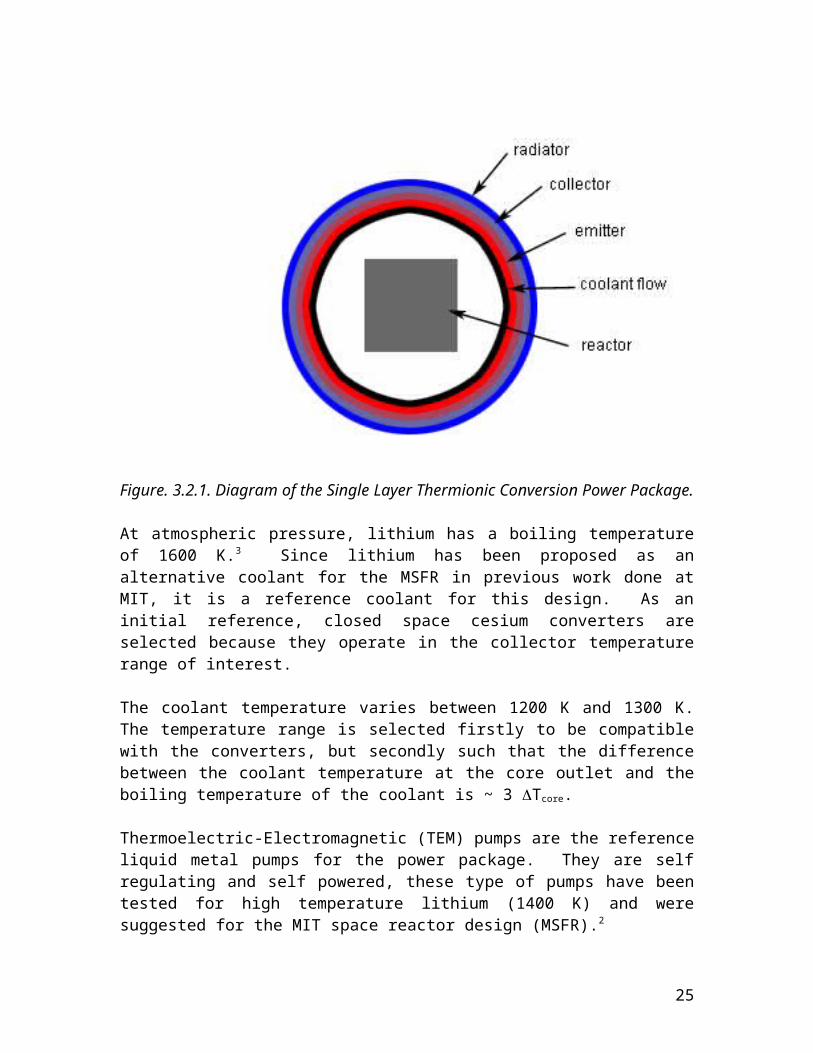
The single layer design uses a liquid metal cooled fast reactor to act as a heat source for a thermionic emitter. The hot coolant at the reactor outlet will flow through an inner annulus near the periphery of a cylindrical power package.
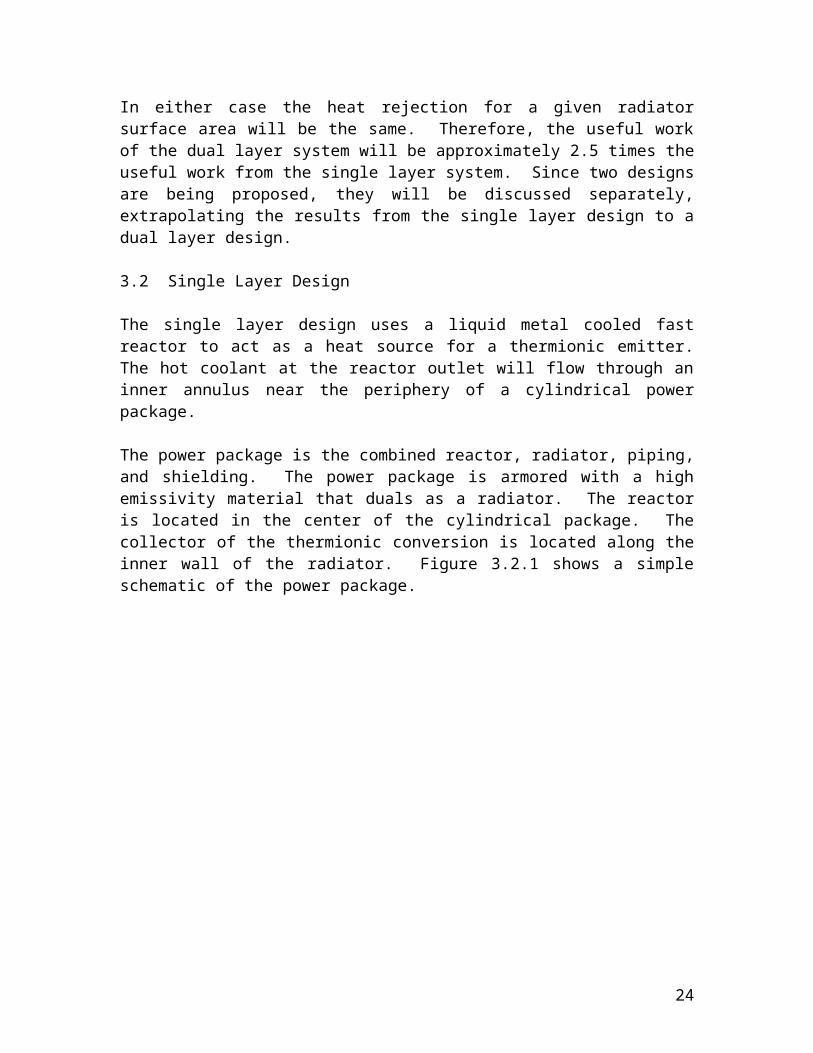
The power package is the combined reactor, radiator, piping, and shielding. The power package is armored with a high emissivity material that duals as a radiator. The reactor is located in the center of the cylindrical package. The collector of the thermionic conversion is located along the inner wall of the radiator. Figure 3.2.1 shows a simple schematic of the power package.
17
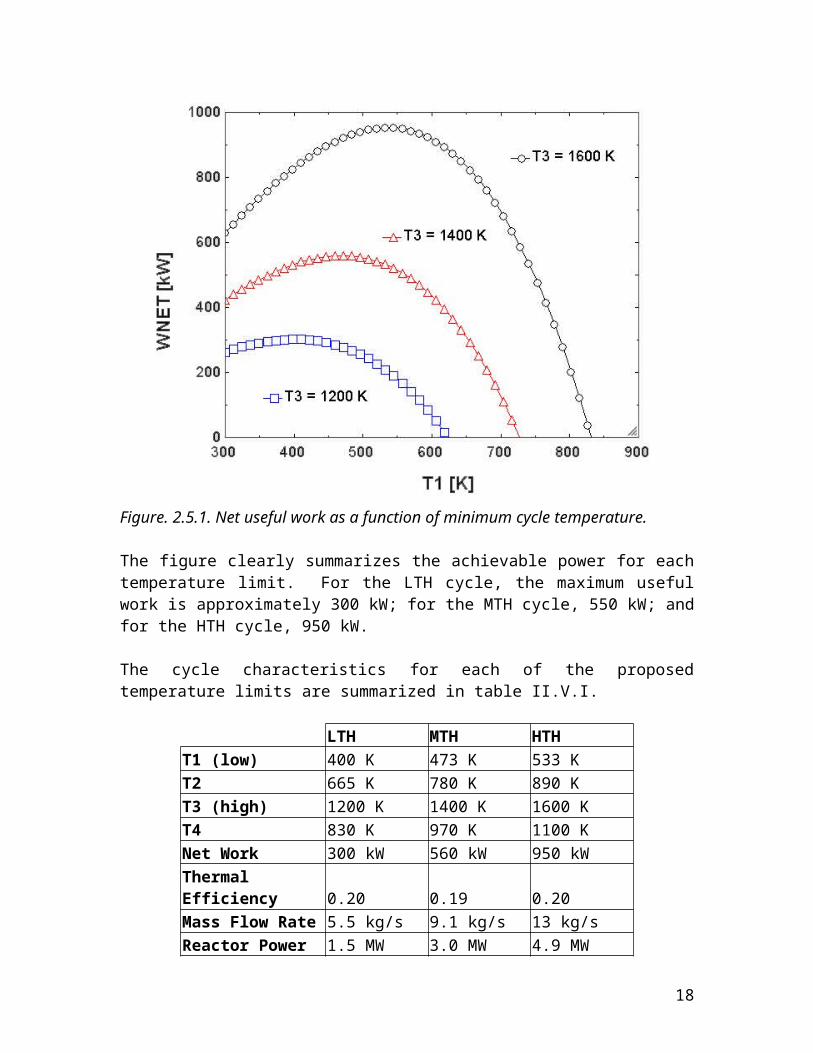
Figure. 3.2.1. Diagram of the Single Layer Thermionic Conversion Power Package.
At atmospheric pressure, lithium has a boiling temperature of 1600 K.3 Since lithium has been proposed as an alternative coolant for the MSFR in previous work done at MIT, it is a reference coolant for this design. As an initial reference, closed space cesium converters are selected because they operate in the collector temperature range of interest.
The coolant temperature varies between 1200 K and 1300 K. The temperature range is selected firstly to be compatible with the converters, but secondly such that the difference between the coolant temperature at the core outlet and the boiling temperature of the coolant is ~ 3 Tcore.
Thermoelectric-Electromagnetic (TEM) pumps are the reference liquid metal pumps for the power package. They are self regulating and self powered, these type of pumps have been tested for high temperature lithium (1400 K) and were suggested for the MIT space reactor design (MSFR).2
Assuming negligible losses to pumping power, we can use the lead efficiency as the conversion efficiency. The assumption is reasonable because increasing the coolant temperature slightly will not compromise the relatively large margin, and the pumps operate directly from the heat in the molten metal flow. Therefore, increasing the temperature at the outlet will compensate for pumping losses.
We can calculate the radiated heat based on the assumed radiator surface area, which is the same as proposed for the argon Brayton cycle (180 m2). The emissivity is assumed at
18
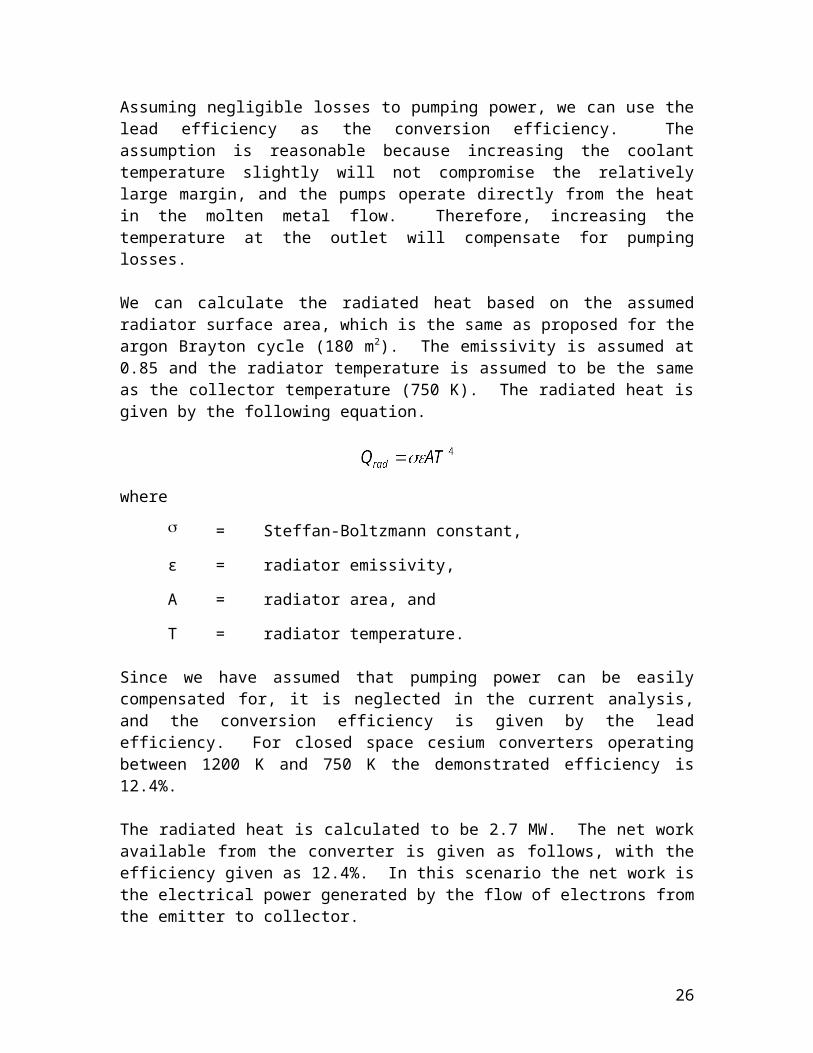
0.85 and the radiator temperature is assumed to be the same as the collector temperature (750 K). The radiated heat is given by the following equation.
where
= Steffan-Boltzmann constant,
ε = radiator emissivity,
A = radiator area, and
T = radiator temperature.
Since we have assumed that pumping power can be easily compensated for, it is neglected in the current analysis, and the conversion efficiency is given by the lead efficiency. For closed space cesium converters operating between 1200 K and 750 K the demonstrated efficiency is 12.4%.
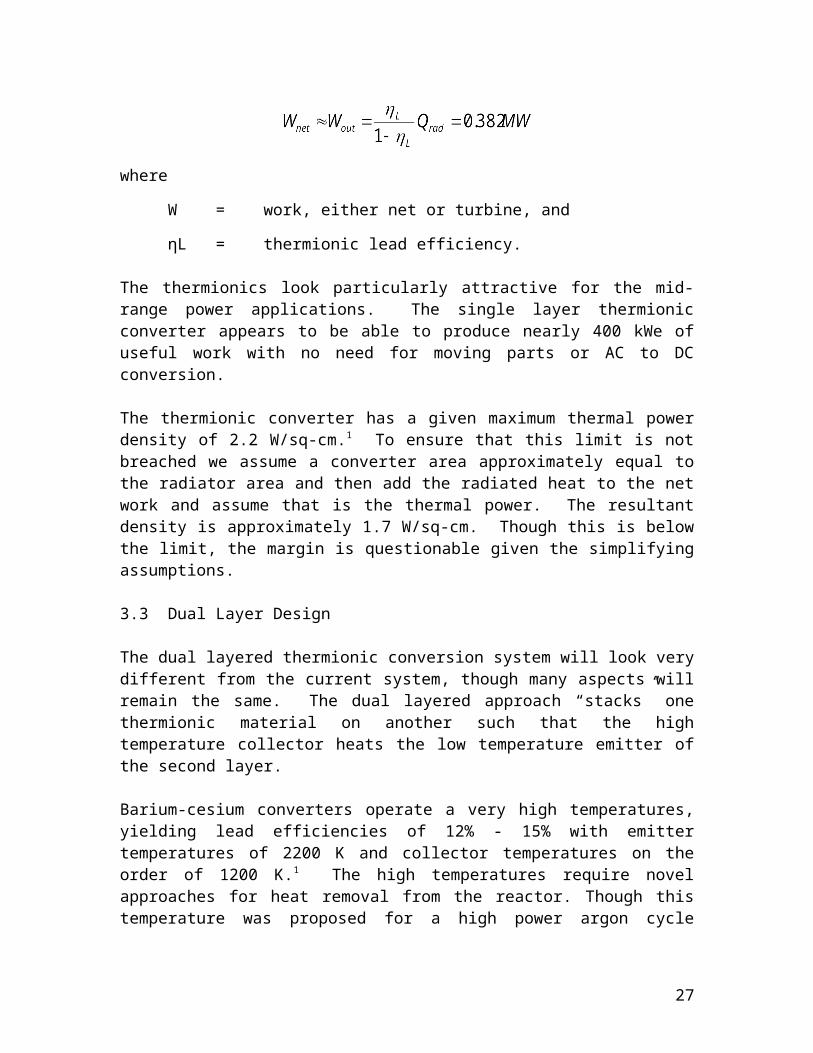
The radiated heat is calculated to be 2.7 MW. The net work available from the converter is given as follows, with the efficiency given as 12.4%. In this scenario the net work is the electrical power generated by the flow of electrons from the emitter to collector.
where
W = work, either net or turbine, and
ηL = thermionic lead efficiency.
The thermionics look particularly attractive for the mid-range power applications. The single layer thermionic converter appears to be able to produce nearly 400 kWe of useful work with no need for moving parts or AC to DC conversion.
The thermionic converter has a given maximum thermal power density of 2.2 W/sq-cm.1
To ensure that this limit is not breached we assume a converter area approximately equal to the radiator area and then add the radiated heat to the net work and assume that is the thermal power. The resultant density is approximately 1.7 W/sq-cm. Though this is below the limit, the margin is questionable given the simplifying assumptions.
3.3 Dual Layer Design
The dual layered thermionic conversion system will look very different from the current system, though many aspects will remain the same. The dual layered approach “stacks” one thermionic material on another such that the high temperature collector heats the low temperature emitter of the second layer.
19
Barium-cesium converters operate a very high temperatures, yielding lead efficiencies of 12% - 15% with emitter temperatures of 2200 K and collector temperatures on the order of 1200 K.1 The high temperatures require novel approaches for heat removal from the reactor. Though this temperature was proposed for a high power argon cycle application, the need for ultra-high temperature materials may preclude the use of either scheme in the near future.
However, the high temperature collector of the barium-cesium can be near direct contact with the fuel inside the core. In that case, the fuel will exceed temperatures of 2200 K, however most ceramic fuel forms, UC in particular, have melting temperatures greater than 2600 K.3
Pu-UC is the reference fuel form from the MSFR design, however, fuels with less egregious swelling properties are preferred in this application, so US and UN are proposed as alternatives.
The fuel heats the high temperature emitter directly, the rejected heat from the collector then heats the emitter for a low temperature layered converter. In this scenario, effective lead efficiencies of 25% are achievable, approximately double the efficiency in the single layered design.
Though the core and structures will be very different between the two designs, the radiator surface area limit still applies. Fuel elements will need to be designed to ensure that thermal power density limits of the barium-cesium and closed space cesium converters are not exceeded, additionally, fuel elements should be smaller to keep the fuel centerline temperature below the melting point with some margin.
A liquid metal coolant, most likely, will be used to cool the collector of the closed-space cesium converter. The coolant will then flow through a radiator. Ideally, the liquid metal will be near the liquid / vapor transition so that heat may be radiated with a near constant temperature.
Mercury, with a boiling temperature of 630 K at atmospheric pressure, should be considered as a heat rejection media.3 The liquid mercury coolant can enter the reactor core near the saturation temperature. Remove heat from the collectors at near constant temperature, and then radiate the heat through a standard radiator similar to the one described for the single layered design. However, to maintain collector temperatures near 750 K, the mercury coolant will most likely be pressurized.
If we are limited to the same radiator area and temperature, the radiated heat will be the same, however, since the efficiency has at least doubled, the useful power increases from 400 kWe to 900 kWe.
3.4 Direct Contact Single Layer
20
Since the work output is intimately related to the radiated heat, and the radiated heat is heavily dependent on the temperature of the heat rejection, a single layer, direct contact TIC may also prove useful. To this end, we analyze a single barium-cesium converter in direct contact with the fuel cladding. In doing so, if a coolant with a phase transition near 1200 K (sodium near atmospheric pressure) could be used, then the effective temperature of the heat rejection would be 1200 K. The heat rejected becomes 18 MW. The efficiency drops to ~12 – 15%. If we assume 15 lead efficiency and neglect pumping losses, the net cycle work can be approximated by the equation given below.
If a lead efficiency of 12% is assumed, the work output drops from roughly 3 MW to 2.5 MW. This indicates that the direct contact, single layered concept can yield multi-megawatt work.
The core must be redesigned to fit these specifications. A honeycomb fuel design may prove impossible to couple with this concept. Therefore, the core will most likely be an array of plates with the cladding of each plate coated with TIC. The collectors of the TIC layers form the channel walls for coolant flow.
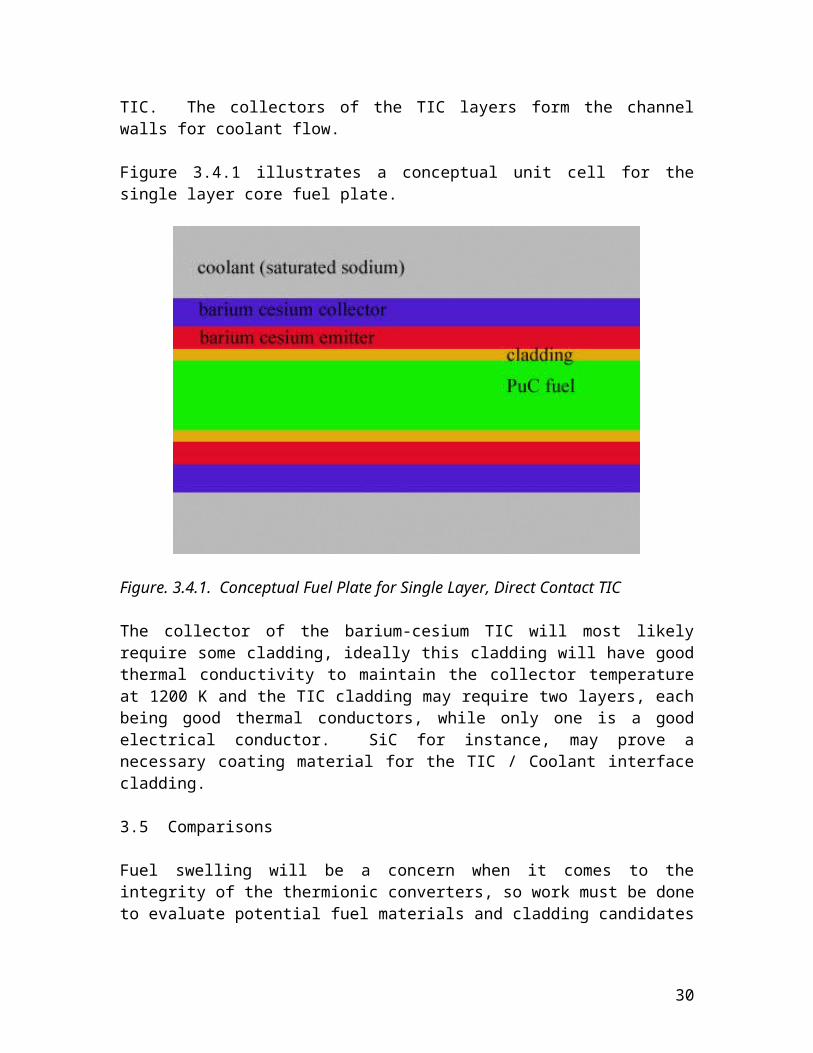
Figure 3.4.1 illustrates a conceptual unit cell for the single layer core fuel plate.
Figure. 3.4.1. Conceptual Fuel Plate for Single Layer, Direct Contact TIC
The collector of the barium-cesium TIC will most likely require some cladding, ideally this cladding will have good thermal conductivity to maintain the collector temperature at
21
1200 K and the TIC cladding may require two layers, each being good thermal conductors, while only one is a good electrical conductor. SiC for instance, may prove a necessary coating material for the TIC / Coolant interface cladding.
3.5 Comparisons
Fuel swelling will be a concern when it comes to the integrity of the thermionic converters, so work must be done to evaluate potential fuel materials and cladding candidates if thermionic conversion is to be pursued for higher power applications.
Compared with the Brayton cycle, the work output is higher for a comparable coolant temperature, however, there are concerns about the direct contact with the fuel, and the required fuel operating conditions. There is also a concern about the TIC efficiency after irradiation. The heat flux limit on the TIC materials means, particularly for a UHPDC, the TIC will be distributed through the core, in most likely a plate or pin configuration. The materials are therefore exposed to a hard neutron flux.
Additionally, some attention must be paid to the temperature profile in the radiator and along the collector of the TIC. In core, the power profile is relatively flat, and the TIC emitter will most likely have a relatively flat temperature profile axially. The collector of the TIC at the core outlet may have an increased temperature that inhibits its operation.
3.6 Conclusions
In the mid-range power applications thermionics are competitive with Brayton cycles. The thermionic conversion schemes have the benefit of no moving parts and direct energy conversion. Whereas coolant freezing may pose a concern for a liquid metal cooled or liquid/vapor metal cooled reactor, Brayton cycle startup for the power package may prove to be a complicated procedure.
In the mid-power range, either system is limited by the temperature of materials. At gas temperatures of 2200 K, the argon Brayton cycle appears capable of producing useful work in the multi-megawatt range. However, little consideration was given to the heat removal aspects of high temperature gas coolant in the MIT UHPDC concept.2 The thermionic dual layered concept, while requiring similar fuel temperatures, does not appear to pose an insurmountable core design problem.
The single layered, direct contact, high temperature scheme, though less efficient than the dual layered concept appears to be able to produce power in the multi-megawatt range. This is an initially unexpected phenomenon. If the heat rejection temperature is roughly isothermal throughout the radiator, as may be the case for a coolant at saturation, then this concept seems very promising. Sodium may be employed as a potential coolant in this case, Sodium has a saturation temperature of nearly 1200 K at approximately 1.05 atm.
22
3.7 References
1. Fitzpatrick, G.O., Allen, D.T. “Cascaded Thermionic Converters” Nuclear Power Engineering in Space, Conference Proceedings, 2 (Oct 1991)
2. Dostal, V., Gezelius, K., Horng, J., Koser, J., Palaia, J., Shwageraus, E., Yarsky,P.: “Mission to Mars: How to get people there and back with Nuclear Energy” May 2003.
3. Hodgman, C. ed.: Handbook of Chemistry and Physics, Chemical Rubber Publishing Company. 44th ed. Cleveland, OH, 1962.
23
4.0 Sodium Rankine Cycle
4.1 Introduction
Sodium Rankine cycles are proposed for advanced space power applications. Particularly, sodium is useful because of the high boiling temperature at low system pressure, its neutronic inertness, and its heat removal properties.
For midrange power applications (several hundred kilowatts), it is advantageous to utilize the phase transition temperature in the radiator. If rejecting heat a constant temperature, one makes the highest use of the radiator area. Metals, historically, have been proposed for Rankine cycles for power conversion units in space applications. Both sodium-potassium eutectic (NKE) and mercury cycles have been proposed as early as 19501.
This analysis is meant to form a basis for comparison with Brayton and thermionic power conversion options and establish the limiting amount useful work based on simple assumptions about the space power package.
4.2 Simple Rankine Cycle Specifications
The upper pressure limit is set such that sodium bulk boiling will occur near 1100 K. This pressure is slightly greater than atmospheric pressure2, the lower pressure in the cycle will be established by the analysis, particularly given a limit to the turbine exit quality.
The turbine is assumed to have a component efficiency of 0.85 and the pumps are not explicitly treated in the analysis of the efficiency. For sodium, TEM pumps or a similar variation may be employed that will draw heat directly from the flow. At the current stage, no consideration is given to the exact design of these components.
Heat is rejected via a radiator with a high emissivity coating (0.85) and a surface area of 180 m2. The temperature of the surface at steady state is assumed to be approximately equal to the saturation temperature of the sodium coolant at the low pressure end of the cycle.
Calculations will be performed for an ideal turbine, then the effect of real components will be assessed by varying the turbine efficiency between 0.95 and 0.80. Though 0.85 is the assumed efficiency for the design, the susceptibility of the design reference to this parameter is of key interest.
4.3 Ideal Analysis
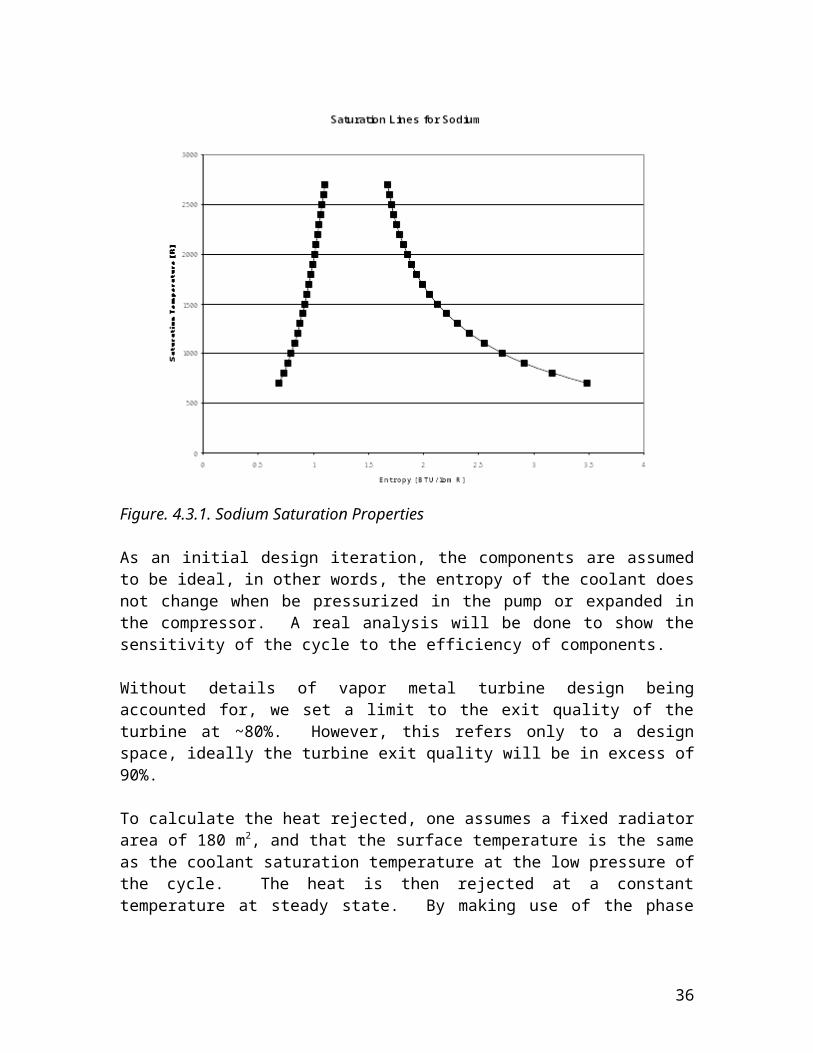
Sodium saturation properties are plotted in Figure 4.3.1. The range of interest is the temperature range below 2100 R (1167 K). Some simplifications are made in the calculation of the net work. Firstly, we assume that only a small fraction of the net work is used for pumping, therefore, the reactor inlet enthalpy is assumed to be the same as the
24
radiator exit enthalpy. Calculations of the pumping power will be used to justify this assumption, though for liquid metals pumping power tends to be in small.
Figure. 4.3.1. Sodium Saturation Properties
As an initial design iteration, the components are assumed to be ideal, in other words, the entropy of the coolant does not change when be pressurized in the pump or expanded in the compressor. A real analysis will be done to show the sensitivity of the cycle to the efficiency of components.
Without details of vapor metal turbine design being accounted for, we set a limit to the exit quality of the turbine at ~80%. However, this refers only to a design space, ideally the turbine exit quality will be in excess of 90%.
To calculate the heat rejected, one assumes a fixed radiator area of 180 m2, and that the surface temperature is the same as the coolant saturation temperature at the low pressure of the cycle. The heat is then rejected at a constant temperature at steady state. By making use of the phase transition in the radiator, one makes the fullest use of the area of the radiator.
The heat rejected is therefore a function of the low pressure of the cycle, and likewise the exit enthalpy of the turbine. The limit on the exit enthalpy sets a limit for the minimum pressure and likewise on the saturation temperature. The expression below gives the equation for the heat rejected from the cycle.
25
where
= Steffan-Boltzmann constant,
ε = radiator emissivity,
A = radiator area, and
T = temperature.Here the LP denotes the low pressure of the cycle, and SAT denotes saturation.
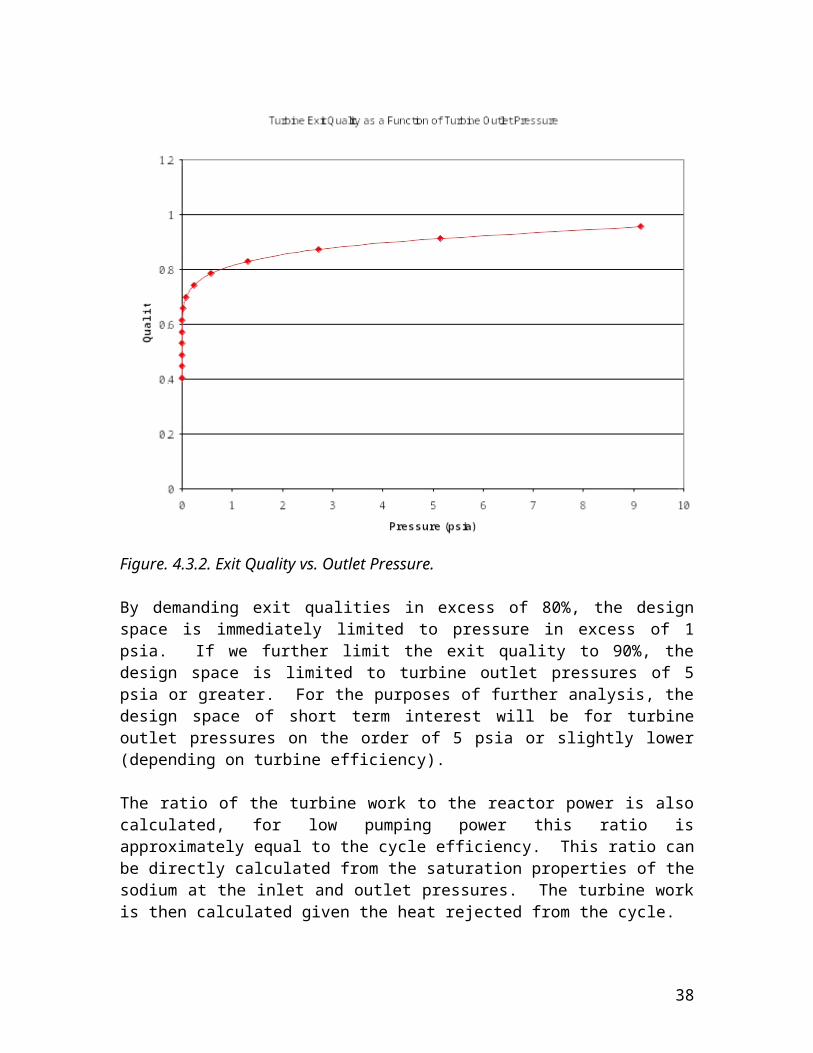
Figure 4.3.2 shows a plot of the turbine exit quality for a turbine inlet pressure of 15 psia as a function of the turbine outlet pressure.
Figure. 4.3.2. Exit Quality vs. Outlet Pressure.
By demanding exit qualities in excess of 80%, the design space is immediately limited to pressure in excess of 1 psia. If we further limit the exit quality to 90%, the design space is limited to turbine outlet pressures of 5 psia or greater. For the purposes of further
26
analysis, the design space of short term interest will be for turbine outlet pressures on the order of 5 psia or slightly lower (depending on turbine efficiency).
The ratio of the turbine work to the reactor power is also calculated, for low pumping power this ratio is approximately equal to the cycle efficiency. This ratio can be directly calculated from the saturation properties of the sodium at the inlet and outlet pressures. The turbine work is then calculated given the heat rejected from the cycle.
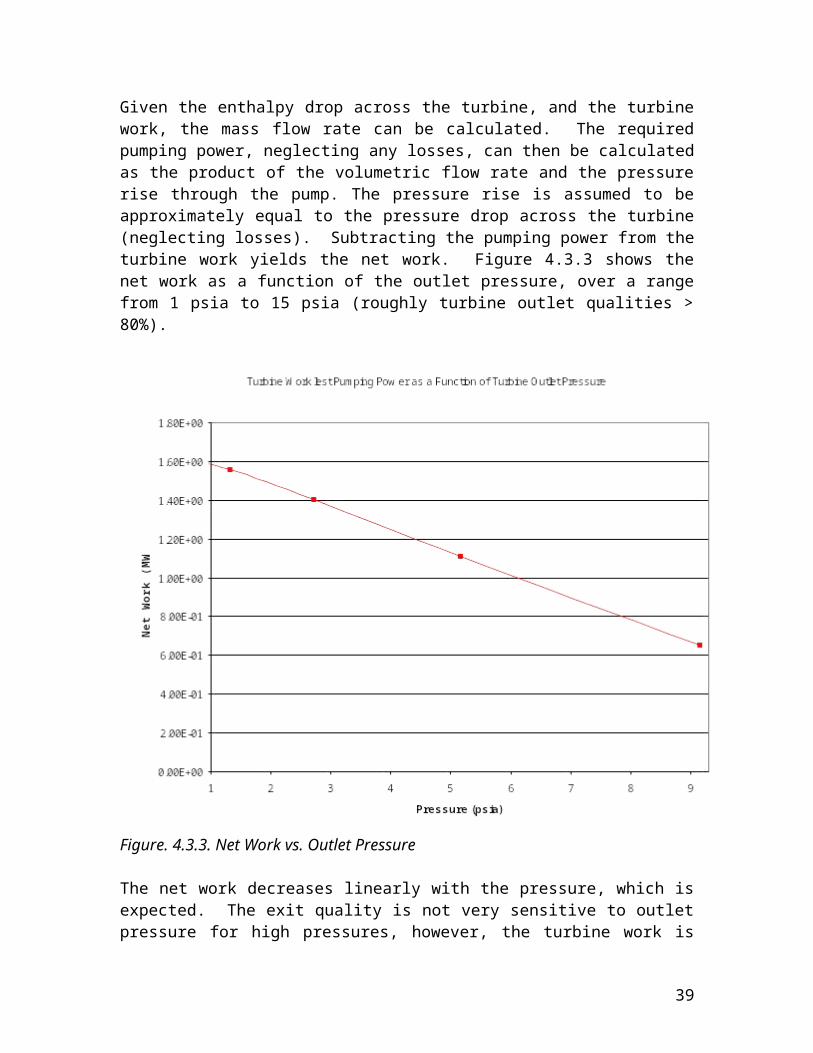
Given the enthalpy drop across the turbine, and the turbine work, the mass flow rate can be calculated. The required pumping power, neglecting any losses, can then be calculated as the product of the volumetric flow rate and the pressure rise through the pump. The pressure rise is assumed to be approximately equal to the pressure drop across the turbine (neglecting losses). Subtracting the pumping power from the turbine work yields the net work. Figure 4.3.3 shows the net work as a function of the outlet pressure, over a range from 1 psia to 15 psia (roughly turbine outlet qualities > 80%).
Figure. 4.3.3. Net Work vs. Outlet Pressure
The net work decreases linearly with the pressure, which is expected. The exit quality is not very sensitive to outlet pressure for high pressures, however, the turbine work is
27
incredibly sensitive; therefore, we define the minimum pressure acceptable given a limit by the turbo-machinery. Therefore, two potential cycles are proposed: a dry and a wet cycle. The dry cycle exit quality is taken at ~ 91% and the wet cycle exit quality is taken at ~ 78%.
For this scenario (the dry cycle) the cycle has a relatively small efficiency of only 9%, the net work is 1.1 MW, the turbine outlet pressure is 5.15 psia and the pumping power accounts for only 200 W (0.02% of the turbine work). The pumping power is calculated as the product of the saturated liquid specific volume, the pressure rise, and the mass flow rate. The radiator rejects approximately 10 MW of heat at a temperature of 1055 K. The core power is therefore approximately 11 – 12 MWth.
If the limit of the exit quality is relaxed to slightly lower than 80%, the wet cycle may be employed. The efficiency of the wet cycle is approximately 22%, and the net work is 1.6 MW. The radiator rejects 5.4 MW of heat at 890 K and the reactor power is reduced to 7 MWth. In the real analysis, accounting for turbine efficiencies, the exit quality will be higher than calculated for the ideal turbine. Therefore, the limits given by the wet cycle establish an expected range of values for the work attainable from the real cycle.
The saturated vapor line on the T-s diagram is relatively steeply sloping, so given a limit on the turbine exit quality, increasing the system pressure can give an increase in the work. If the system temperature can be increased above the artificially imposed limit of 1167 K the attainable work can be increased with little concern to the turbine exit quality limit.
4.4 Real Analysis
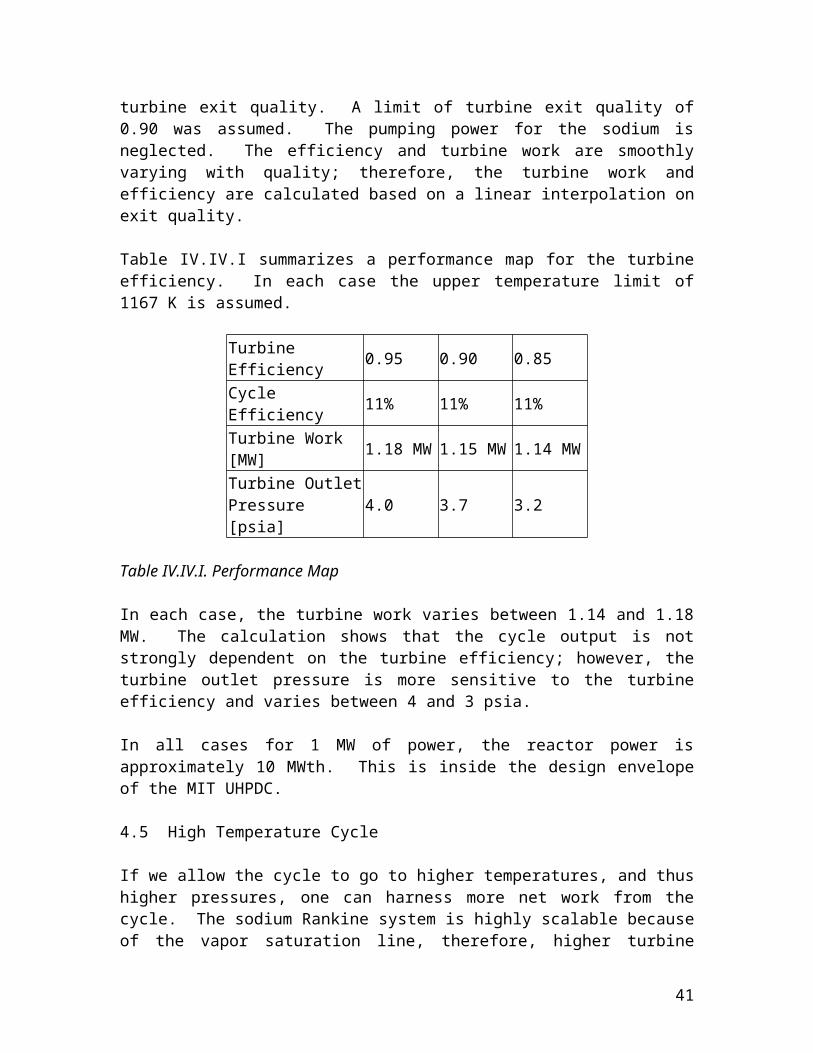
Turbine efficiencies between 0.85 and 0.95 were tested. Comparisons were carried out on the basis of constant turbine exit quality. A limit of turbine exit quality of 0.90 was assumed. The pumping power for the sodium is neglected. The efficiency and turbine work are smoothly varying with quality; therefore, the turbine work and efficiency are calculated based on a linear interpolation on exit quality.
Table IV.IV.I summarizes a performance map for the turbine efficiency. In each case the upper temperature limit of 1167 K is assumed.
Turbine Efficiency 0.95 0.90 0.85
Cycle Efficiency 11% 11% 11%
Turbine Work [MW] 1.18 MW 1.15 MW 1.14 MW
Turbine Outlet Pressure [psia] 4.0 3.7 3.2
Table IV.IV.I. Performance Map
28
In each case, the turbine work varies between 1.14 and 1.18 MW. The calculation shows that the cycle output is not strongly dependent on the turbine efficiency; however, the turbine outlet pressure is more sensitive to the turbine efficiency and varies between 4 and 3 psia.
In all cases for 1 MW of power, the reactor power is approximately 10 MWth. This is inside the design envelope of the MIT UHPDC.
4.5 High Temperature Cycle
If we allow the cycle to go to higher temperatures, and thus higher pressures, one can harness more net work from the cycle. The sodium Rankine system is highly scalable because of the vapor saturation line, therefore, higher turbine inlet temperatures can be used with greater pressure drops and still maintain the turbine exit quality above 0.90.
A simple case is taken with the turbine inlet temperature equal to 1500 K (saturated) and the turbine efficiency is 0.90. If one expands from 150 psia (~10 atm) to 56 psia (~4 atm) in the turbine, the saturation temperature of sodium at the turbine outlet is approximately 1300 K. The exit quality in this case is 89.7%. The turbine work is 3.4 MW.
The high temperature cycle efficiency is 12.8%. This is better than the TIC single layer, direct contact scheme. The temperature of heat rejection is higher, and the efficiency is comparable.
4.6 Discussion
Additional problems must be addressed before applying the sodium-cooled reactor. Sodium has a violent exothermic reaction with water; therefore special attention must be paid to H2O immersion accidents. Previous work at MIT showed that H2O immersion for the UHPDC had a positive reactivity effect, and coupled with the potential for a sodium-water chemical reaction, this accident may have implications that preclude the use of this cycle.
If the power package and armor are designed to mitigate this particular accident then, the sodium Rankine cycle appears at least on par with the argon Brayton cycle. Though the two seem to be competitive at relatively low temperature (1200 K), the liquid metal coolant more easily facilitates the use of a UHPDC type reactor, because of the superior heat removal properties of the liquid / vapor metal.
In the higher temperature regime (1500 K), the sodium cycle outperforms the high temperature TIC concept. However, this margin benefit may not outweigh the TIC advantage in terms of system reliability. The TIC concept requires neither moving parts nor AC to DC power conversion.
29
4.7 References
1. Deickamp, H.: Nuclear Space Power systems, Atomics International. Canoga Park, CA, 1967
2. Todreas, N., Kazimi, M.: Nuclear Systems I Thermal Hydraulic Fundamentals, Taylor and Francis. New York, 1993.
3. Dostal, V., Gezelius, K., Horng, J., Koser, J., Palaia, J., Shwageraus, E., Yarsky,P.: “Mission to Mars: How to get people there and back with Nuclear Energy” May 2003.
30
5.0 Radioisotope Doping to Prevent Coolant Freezing
5.1 Introduction
One of the transformational technologies identified for space nuclear power conversion is a liquid/vapor metal Rankine cycle. A potential difficulty with deployment of such a technology is the startup of the reactor where the coolant may be frozen. To this end, a potential approach for averting coolant freezing is explored. A proposed solution to this problem is radioisotope doping, whereby the liquid metal coolant is mixed with radioactive isotopes to concentrations on the order of a few percent. The heat released by the decay of these isotopes may be sufficient to ensure the coolant does not freeze for a given time in space.
Specific examples are explored using simple analyses to determine if such a preventive measure is practical. Two types of metal coolants are examined, first lead or lead-bismuth eutectic (LBE) and secondly Sodium or sodium-potassium eutectic (NKE).
5.2 Radioisotopes
For internal heating from radioactive decay, either b+ or a emitters are preferred. These two decay products will deposit most of their energy directly in the coolant. The isotopes that decay by means of b+ emission may be less effective than a emitters; however, in metal coolants the electron density is relatively high and an effective fraction may still be deposited. Furthermore, a emitters typically release more energy per decay than b+ emitters and have longer half lives.
For lead cooled reactors, polonium 210 (210Po) is of particular interest for three reasons. First, it has relatively long half life (139 days) Second it emits a high energy a (5.3 MeV), and third, the decay product is 206Pb2.
Several isotopes of bismuth decay through b+ emission. Bismuth isotopes may be of particular use in doping lead or LBE coolant. 206Bi and 205Bi are both of interest. Each emits positrons with 0.98 MeV of energy. The half lives are 6.243 days and 15.31 days, respectively2.
For sodium-cooled reactors, magnesium 23 (23Mg) is of interest. This isotope of magnesium b+ decays to 23Na with a half life of 11.3 seconds. The b+ energy is 3.1MeV2.
5.3 Analysis
To evaluate the effectiveness of a particular isotope, a heat balance is established where the radioisotope heating exactly balances radiation losses when the coolant is at the melting temperature. From this relationship, the break-even concentration of the doping radioisotope can be established..
31
The initial concentration of the radioisotope can then be inferred as a function of the time to freezing. In other words, if a time window is set, then the initial concentration of the radioisotope can be calculated.
The radiation losses are calculated the same as before assuming that the temperature of the radiator is the melting temperature at atmospheric pressure for either coolant, and a given radiator size of 180 m2. This condition is true at the onset of freezing. Atmospheric melting temperatures are used because liquid metal cooled systems tend to operate at pressures near atmospheric.
where
= Steffan-Boltzmann constant,
ε = radiator emissivity,
A = radiator area, and
Tm = melting temperature.
The heat added by the decay of the radioisotope can be calculated based on the particle energy, the decay constant, the number density, and the coolant volume as follows1.
,
where
E = particle energy,
λ = decay constant,
N = number density, and
V = coolant volume.
At breakeven these two quantities are the same. The number density of the radioisotope at breakeven is easily calculated.
However, the doping fraction, which is the ratio of the number density of the radioisotope to the number density of the nominal coolant, is the quantity of interest.
32
where
ρ = Density,
M = Atomic Mass, and
Nav = Avagadro’s number
The volume of the coolant is not yet known. However, we can establish an upper bound of the break-even doping fraction by assuming that the coolant volume is as much as 50% of the volume bound by the cylindrical radiator.
where
R = Radiator Radius,
We will assume that the radiator radius is 3 m. The parenthetical term in the expression is constant, and the second term contains all of the coolant properties. The first term is calculated to be 0.107 x 10⁻³⁰ W/m3/K4. If the doping fraction is higher than the limit specified in the equation above, then coolant freezing will not occur.
The time to the onset of freezing and the initial doping concentration are related by the breakeven limit and the radioisotope decay constant.
where
t = the time window to freezing,
f = the breakeven doping fraction
f0 = the doping fraction at the time of launch
5.4 Calculations
Table V.IV.I includes the properties for lead and sodium (and associated radioisotopes)2,3. The LBE and SPE coolants are options where the results are roughly applicable. However, the doping fraction is highly sensitive to the melting temperature, so calculations are meant only to indicate a proof of principle.
Lead LBE Sodium
33
Density (g/cc) 11.35 11 0.971Atomic Mass (amu) 207.2 208 23Tmelt (K) 600 400 370
210Po 206Bi 23MgHalf Life (sec) 12009600 539395.2 11.35Decay Constant (sec-1) 5.77161E-08 1.28505E-06 0.061070236
Energy (pJ) 0.848 0.157 0.496
Table V.IV.I. Coolant Properties
The limiting doping fraction can be calculated based on these properties. For the lead coolant, the doping fraction limit was calculated to be 5.16; since the fraction is greater than unity this system does not appear feasible. Even if LBE is considered, the melting temperature drops from 600 to 400 K with a doping fraction of 1.02. This consideration is still not feasible.
Sodium appears more promising; however, the margin to freezing will never be large because the half-life of 23Mg is quite small. The limiting doping fraction of the coolant is 1.56 x 10⁻⁶. If the initial doping fraction is twice the break-even limit, the system can remain in space for only 11.32 seconds before the onset of freezing. If we limit the initial doping to 10%, the margin to freezing can be calculated. The concentration ratio is approximately (1/2)22. Therefore, the margin we purchase through doping is only 4 minutes, roughly. This time is so small that the radioisotope will have completely decayed before the system is launched from Earth.
LBE with radioactive Bismuth is considered as well. This is a prime candidate for the radioisotope doping approach. The 206Bi positron decay has a half life of 6.243 days and decays to 206Pb. The limiting break-even doping fraction is approximately 25%. If an initial concentration of 50% 206Bi is assumed, the melting temperature of the LBE is approximately 400 K. The system can remain in space for a few days before the onset of freezing, although the exact margin is not known because the melting temperature is sensitive to the bismuth fraction. If we assume that a 25% bismuth / 75% lead eutectic has the same melting temperature as a 50% bismuth / 50% lead eutectic, then the system can remain in space for as long as 6 days before the onset of freezing. However, the melting temperature will probably increase as the bismuth decays, thus reducing the temporal freezing margin.
5.5 Conclusions
Though applicable in some cases, radioisotope doping does not appear to be a feasible solution to liquid metal freezing in many cases. The largest barrier is the relatively large doping fractions required to sustain the system above the melting temperature for a period of time on the order of a few days.
There are other concerns with this approach that will limit its use. Firstly, it is difficult to acquire large quantities of these radioisotopes. The coolant would be incredibly
34
expensive, and it is not certain that the materials can be acquired in any large amounts. Another concern is launching the radioactive material. Though RTGs are routinely launched, RTGs and this approach differ in that the radioactive doping agent in the coolant is distributed through the entire reactor coolant system. The distributed nature of the radioactive material may be of concern for anticipated launch accidents.
Though radioisotope doping may appear as a feasible solution in some cases, there are a plethora of practical concerns that preclude its use. Radioisotope coolant doping was found only to be applicable in the case of LBE cooled reactors. Since sodium is of primary concern based on performance of the sodium Rankine cycle, further study of radioisotope doping is not recommended, as it does not appear to be a feasible approach for averting sodium freezing.
5.6 References
1. Quantum Physics of Atoms, Molecules, Solids, Nuclei, and Particles , Robert Eisberg and Robert Resnick. 2nd Ed. Copyright 1985 John Wiley & Sons, Inc. Ch.15-17. Hamilton Publishing Co. New York, NY
2. Chart of the Nuclides, ed. Parrington, J., Knox, H. , Brenneman, S., Baum, E., and Feiner, F. 15th Ed rev. 1996. Knolls Atomic Power Laboratory. Schenectady, NY
3. Hodgman, C. ed.: Handbook of Chemistry and Physics, Chemical Rubber Publishing Company. 44th ed. Cleveland, OH, 1962.
35
6.0 Highly Enriched Uranium Fueled Ultra High Power Density Core
6.1 Introduction
The Reactor Grade Plutonium (RGP) Ultra High Power Density Core (UHPDC) was redesigned for use with Highly Enriched Uranium (HEU) fuel. The fuel form is UC in plates. The plates are clad with niobium refractory metal. Several design changes were made to improve performance for the HEU system and reduce the reactor mass.
After making substitutions for materials in the core, the core size was evaluated to assess the minimum core size necessary to meet comparable performance standards set by the RGP UHPDC. Afterwards, the same control mechanism (direct leakage) for the RGP UHPDC was evaluated for the HEU UHPDC. Lastly, void reactivity worth was evaluated to ensure that in the case of an accident the control mechanism could still shut down the reactor.
Figure 6.1.1 shows a layout of the UHPDC with honeycomb plate type fuel.
Figure 6.1.1. UHPDC layout
6.2 Design Changes
The reference UHPDC used lithium or molten salt coolant. The redesigned HEU core uses sodium coolant. This is to more accurately reflect the neutronic behavior of the system when coupled directly with the sodium Rankine cycle, sodium heat pipes, or even the TIC direct fuel contact concept where the secondary side of the TIC is cooled with sodium.
36
Another change is in the reflector material. In the reference case Zr3Si2 was used as an axial and radial reflector. Zr3Si2 is a relatively high albedo reflector that does not contribute heavily to neutron slowing down. The neutron yield for plutonium and the capture to fission ratio are sensitive to the spectrum; therefore the reflector was chosen for the RGP core to mitigate spectrum softening from the return current. HEU is not as sensitive, and therefore a reflector with a higher albedo can be used even if that reflector softens the spectrum. Therefore, the HEU UHPDC uses a BeO reflector.
6.3 Core Size
A BOL study was done with 90% enriched UC fuel. The core is modeled as a smear of homogenous fuel, clad, and coolant in a cube of varying dimension. The BOL reactivity was calculated using MCNP. Based on preliminary screening, a core dimension of 25 cm was selected. Figure 6.3.1 shows a plot of the BOL eigenvalue (keff) as a function of the core dimension. In each case the minimum reflector thickness is 6 cm.
20 22 24 26 28 30
0.90
0.95
1.00
1.05
1.10
1.15
1.20
BO
L k ef
f
Core Dimension (cm)
Figure 6.3.1. Core Multiplication Factor as a Function of Core Dimension
The RGP UHPDC has a BOL eigenvalue of 1.1. In this case the leakage is reduced and 1.08 is sufficient to reach reasonable burnup. The core dimension is 25 cm. The target burnup is approximately 40 MWD/kgHM (4.25 a/o), which corresponds to 380 EFPD (2 round trips) at 10 MW of thermal power and 1 MWe.
37
The RGP UHPDC was designed for 11 MW. When the core dimension is increased to 25 cm from 20 cm, the core volume roughly doubles, therefore, the HEU UHPDC will be able to produce ~20 MW of thermal power at the same power density.
For the high temperature sodium Rankine cycle PCU, a reactor thermal power of 27 MW is required to produce 3.4 MWe. The high power may require increasing the core dimension because of power density constraints. However, if a single reactor with core dimension of 25 cm is used to produce 27 MW of thermal power, the required burnup for 190 EFPD (1 round trip) is approximately 55 MWD/kgHM (5.7 a/o).
6.4 Core Life Studies
Burnup calculations were performed on the core model using MCODE, which is a code that couples MCNP and ORIGEN. The HEU UHPDC dimension is 25 cm. The reactivity is plotted as a function of burnup for 10 MW of thermal power. The burnup behavior will not be heavily dependent on the power density because of the hard neutron spectrum and consequently relatively small fission product absorption cross sections. A plot of the HEU UHPDC reactivity as a function of burnup is shown in Figure 6.4.1.
0 10 20 30 40 500.01
0.02
0.03
0.04
0.05
0.06
0.07
0.08
HE
U U
HP
DC
Rea
ctiv
ity
Burnup (MWD/kgHM)
Figure 6.4.1. Reactivity History for the HEU UHPDC.
For the low power system (10 MWth) the desired burnup is 40 MWD/kgHM. This is easily achievable with the current design. In pushing the reactor system to 27 MWth, an effective full power life of 190 EFPD (or 55 MWD/kgHM burnup) seems achievable with minor or no changes to the design.
38
6.5 Control Mechanism
The RGP UHPDC uses direct leakage for reactivity control. The control mechanism is a series of rotating reflector plates that change the effective density of the reflector by as much as 50%. The reflector density in the BOL core model for the HEU UHPDC is varied between 100% and 50% to see the effect of the control device on the core reactivity. The core is most reactive at the BOL, and therefore, if the core can be brought to subcritical conditions at BOL, the control mechanism will be capable of fully controlling the reactivity swing through the life of the core.
Figure 6.5.1 shows the HEU UHPDC eigenvalue as a function of the reflector density. The dramatic drop in reactivity is expected because the small core has a very high leakage probability.
50 60 70 80 90 1000.90
0.92
0.94
0.96
0.98
1.00
1.02
1.04
1.06
1.08
1.10
HE
U U
HP
DC
BO
L E
igen
valu
e
Effective Reflector Density [%]
Figure 6.3.1. Effect of Control Device on BOL Eigenvalue
There is every confidence based on this BOL criticality behavior that direct leakage control will be sufficient to control the reactivity swing with the HEU UHPDC through burnup.
6.6 Void Reactivity
Void reactivity worth was evaluated for the HEU UHPDC. The worst case for voiding is when the coolant in the core is voided, but sequesters liquid coolant in the axial
39
reflectors. This case was evaluated at BOL using the MCNP model. The reflector density is set to a minimum to ensure that the control device can shut the reactor down in this case.
With the minimum reflector effective density and core coolant voiding the reactivity is still negative. The eigenvalue for the voided core is 0.954(12).
6.7 Conclusions
The HEU UHPDC core characteristics are tabulated in Table VI.VII.I and compared with parameters from the RGP UHPDC. The HEU UHPDC appears to be a reasonable alternative. The core size was increased from 20 cm to 25 cm, or roughly doubling the volume.
RGP HEUPower 11 MWth 10 MWthCore Dimensions 20x20x20cm 25x25x25cm
Total mass 185 kg 320 kgReflector thickness 6 cm 6 cm
Reflector material Zr3Si2 BeO
Coolant (50:50 NaF-ZrF4) molten salt
Na
Coolant volume fraction 40v/o 40v/o
Fuel RG Pu carbide 90% enriched U carbide
Fuel volume fraction 55 v/o 55 v/o
Fuel element geometry plates, arranged in honeycomb
grid
plates, arranged in honeycomb
grid
Cladding Nb based refractory alloy
Nb based refractory alloy
k-eff BOL 1.1 1.08EOL fuel burnup 12 a/o 4.3 a/o
Core lifetime 570 EFPD 380 EFPD
Table VI.VII.I. RGP and HEU comparison
40
The RGP UHPDC reflector is much more dense than the HEU UHPDC reflector, and therefore the difference in mass is not as dramatic as initially expected, however, the HEU UHPDC mass is more than 70% higher than that of the RGP UHPDC.
Though the RGP UHPDC out performs the HEU UHPDC, there is every assurance that an HEU UHPDC will still meet the minimum needs of a manned mission to Mars program.
6.8 References
1. Dostal, V., Gezelius, K., Horng, J., Koser, J., Palaia, J., Shwageraus, E., Yarsky,P.: “Mission to Mars: How to get people there and back with Nuclear Energy” May 2003.
41
7.0 Summary, Conclusions and Recommended Future Work
7.1 Summary
The current body of work has analyzed several power conversion technologies in terms of their likelihood for meeting the stringent demands of a Mars exploration program. Though the results of these studies are applicable to enabling a manned mission to Mars, the results are universal for any space nuclear power program. The scope of the work includes both reactor and power conversion unit design.
The sodium Rankine cycle in combination with a highly enriched uranium fueled ultra high power density core (HEU UHPDC) may be sufficient to meet the power needs for future space exploration or other space applications. The issues related to coolant freezing, however, have yet to solved.
7.2 Conclusions
Table VII.I.I below summarizes briefly the results of analyses conducted on a variety of power conversion technologies. The highlighted options are for high power applications.
T(hot) T(rej) Work EfficiencyTIC 1 (low T) 1200 K 750 K 0.4 MW 12% 2 (high T) 2200 K 750 K 0.9 MW 25% 1 (high T) 2200 K 1200 K 2.5 MW 12%Ar Brayton 1600 K 850 K 0.95 MW 20%Na Rankine low T 1200 K 1000 K 1.1 MW 11% high T 1500 K 1300 K 3.4 MW 13%TPV (MSFR) 1400 K 900 K 4 MW 40% **
Table VII.I.I. Power Conversion Technology Comparison
In addition to surveying several technology options for power conversion, the MIT RGP UHPDC was redesigned for HEU fuel. The trade offs between the two fuel forms can be established in an extensive cost-benefit analysis based on figures tabulated here as well as in previous work done at MIT concerning the radiotoxicity of the RGP at launch. There are many benefits to RGP including a much smaller and longer life system. However, an HEU UHPDC will still meet the needs for the Mars initiative.
The sodium Rankine cycle and thermionic conversion appear as likely candidates for future research initiatives in the area of space nuclear power. For a manned mission to mars nuclear power systems must be capable of producing power in the mulit-megawatt range. In either case, research must be done to assure the practicality of these systems and testing must be done to assure their performance. For high power application, the reactor will likely be sodium cooled and radioisotope doping will not be sufficient avert sodium coolant freezing.
42

7.3 Future Work
Sodium Rankine cycle technology will require, particularly, research in the area of vapor metal turbines that can sustain relatively high exit quality. It is as of yet, unclear how such a turbine would be manufactured, or how large such a turbine would be. Additionally, the issues related to sodium freezing before the reactor is operational is another area of concern where future work is warranted.
TIC is another candidate for high power applications. Though the power levels are not as high as for the sodium Rankine cycle, TICs produce direct current without the need for moving parts in the system. To this end they reduce system complexity and increase system reliability. The largest hurdles in the implementation of the direct contact approach are the impact of fast fluence on TIC performance and the need for collector cladding.
43