Embed Size (px)
DESCRIPTION
weblogic faqs
Citation preview
1.What is file name to install weblogic in Linux ? and How to install ?
The file Name is server103_linux32.bin
In Windows server103_win32.cmd
From the VPN using the putty tool
2.What is domain in WLS? How to create domain in WLS?
A WebLogic Server administration domain is a logically related group of WebLogic Server resources. Domains include a special WebLogic Server instance called the Administration Server, which is the central point from which you configure and manage all resources in the domain. Usually, you configure a domain to include additional WebLogic Server instances called Managed Servers. You deploy Web applications, EJBs, Web services, and other resources onto the Managed Servers and use the Administration Server for configuration and management purposes only.
The Domain Configuration Wizard is located below WL_HOME/common/bin, where WL_HOME is BEA_HOME/weblogic81. Start it by running the config.cmd.
The Domain Configuration Wizard is located below C:\bea\wlserver_10.3\common\bin, in 10.3 version
How many ways to create a domain
Using domain configuration wizard
Using domain configuration template
Using weblogic.Admin command
Using WLST scripts
Fortunately, many different ways to create and configure a domain are available. The most common way to create a domain is through the Domain Configuration Wizard and the most common way to configure the domain is by using the WebLogic Console
Domain creation procedure in windows through graphical mode
The Domain Configuration Wizard is located below C:\bea\wlserver_10.3\common\bin, in 10.3 version
Open the command prompt goto
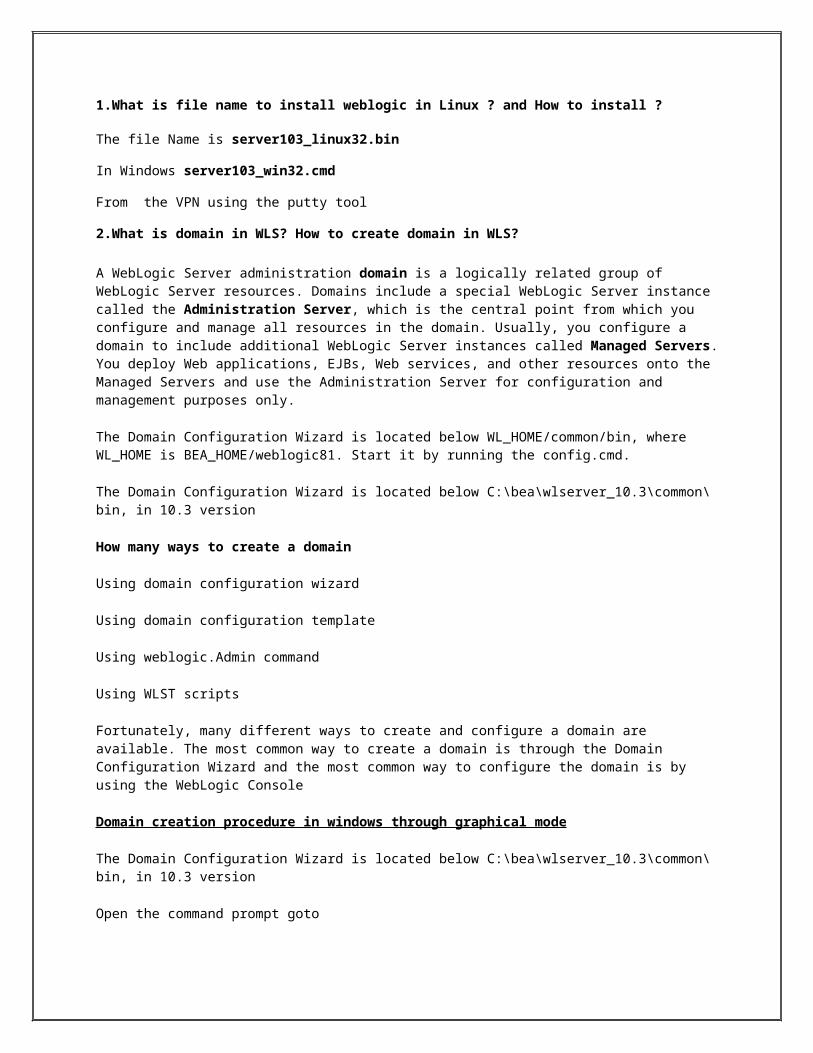
C:\bea\wlserver_10.3\common\bin and run the script
Config.cmd and press Enter
Config.cmd -mode=console the domain create in console prompt
Double click on config script then it follows
Click on Next
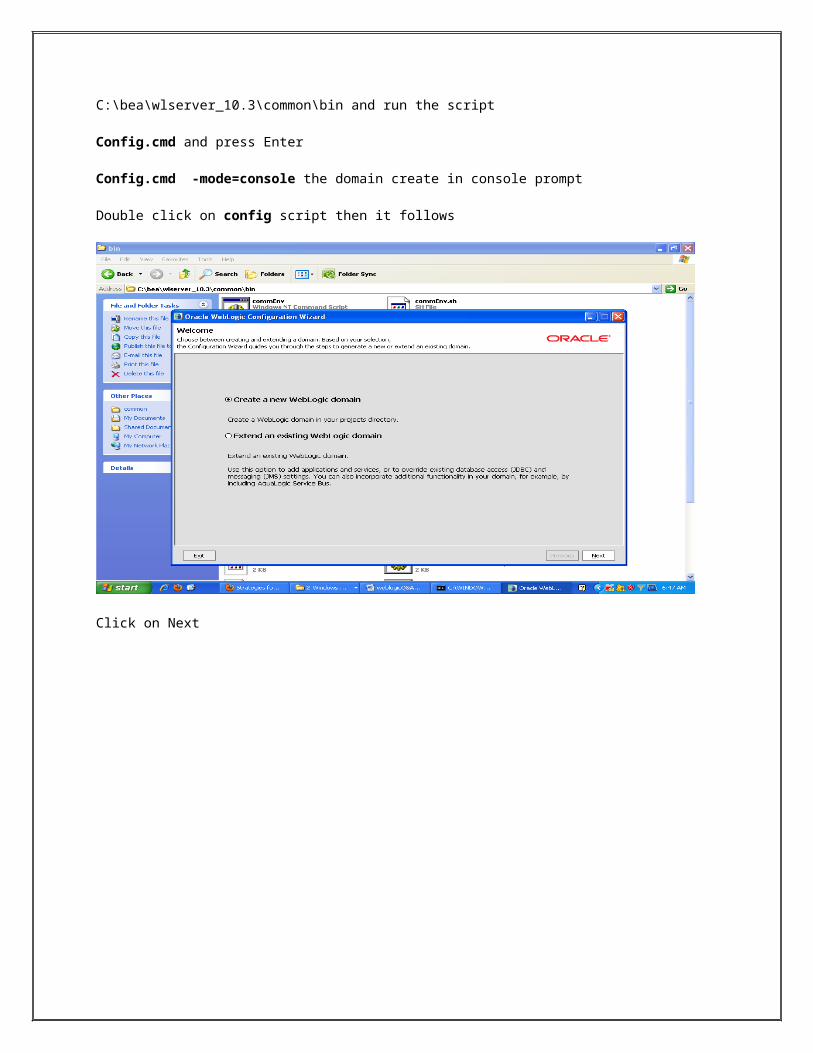
If you are creating domain using existing template select the Base this domain on an existing templateOtherwise default option and click on next button
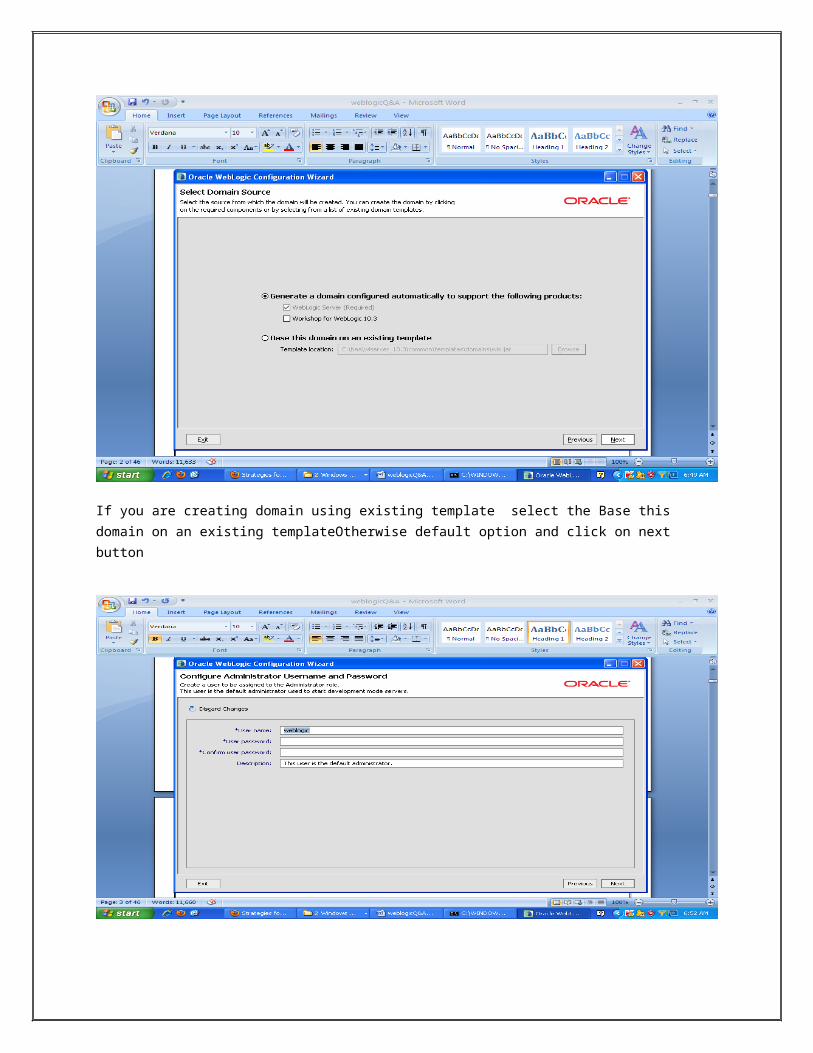
Enter the user name ,password , Confirm password and description then after click on Next button ,but default username is weblogic.
Here select the Domain startup mode1).Development Mode
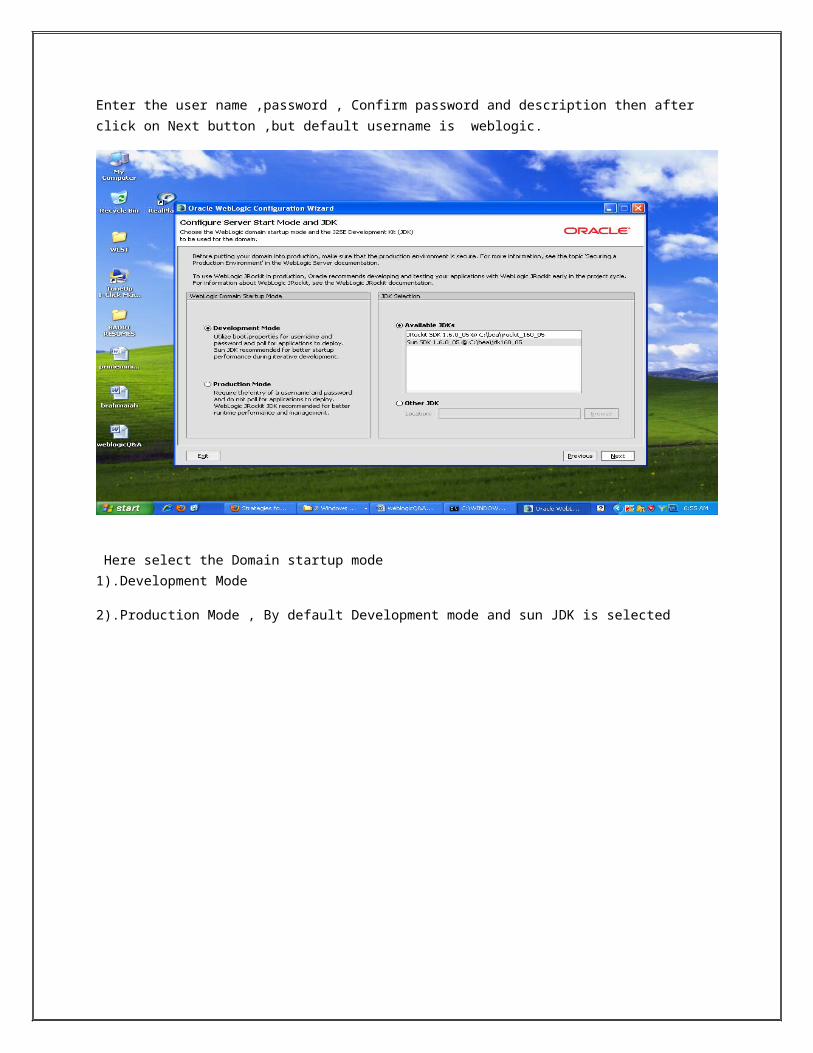
2).Production Mode , By default Development mode and sun JDK is selected
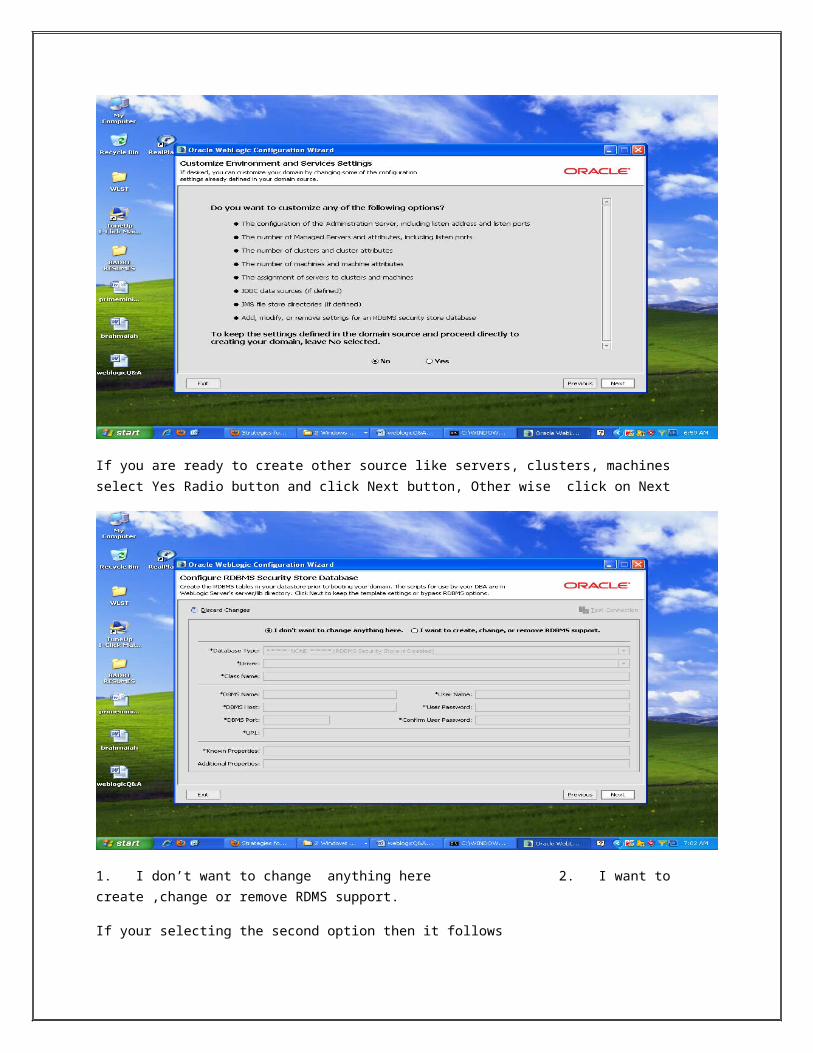
If you are ready to create other source like servers, clusters, machines select Yes Radio button and click Next button, Other wise click on Next
1. I don’t want to change anything here 2. I want to create ,change or remove RDMS support.
If your selecting the second option then it follows
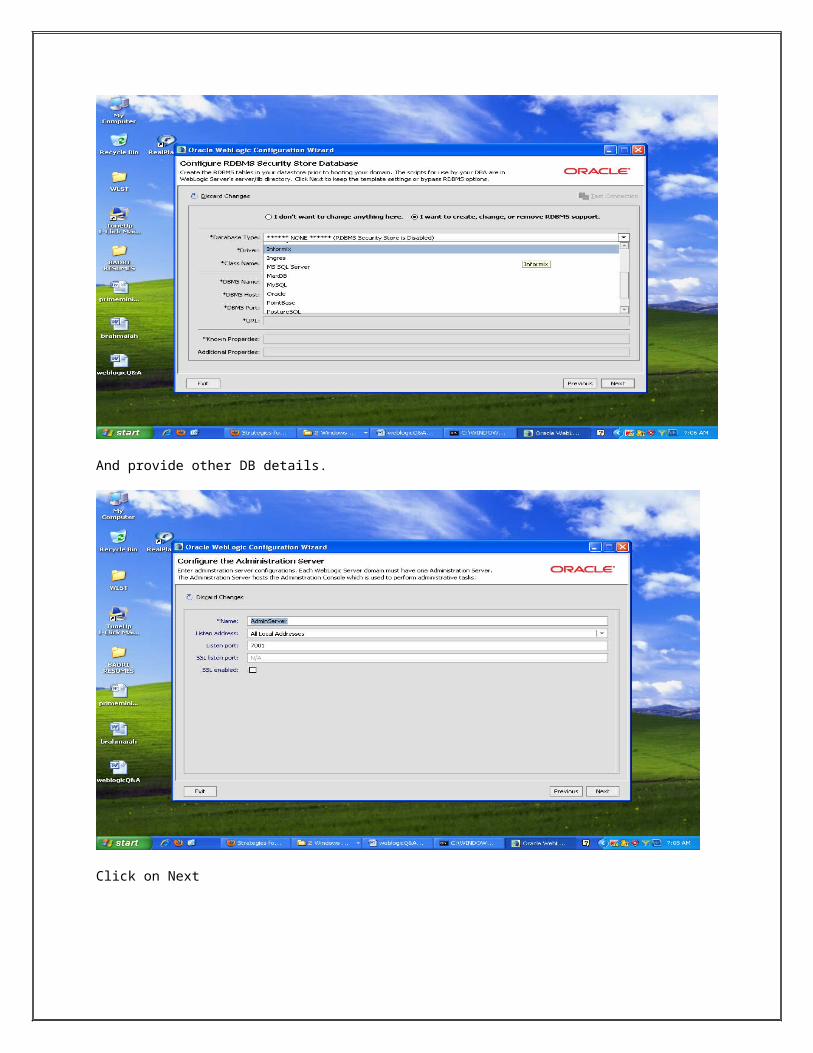
And provide other DB details.
Click on Next
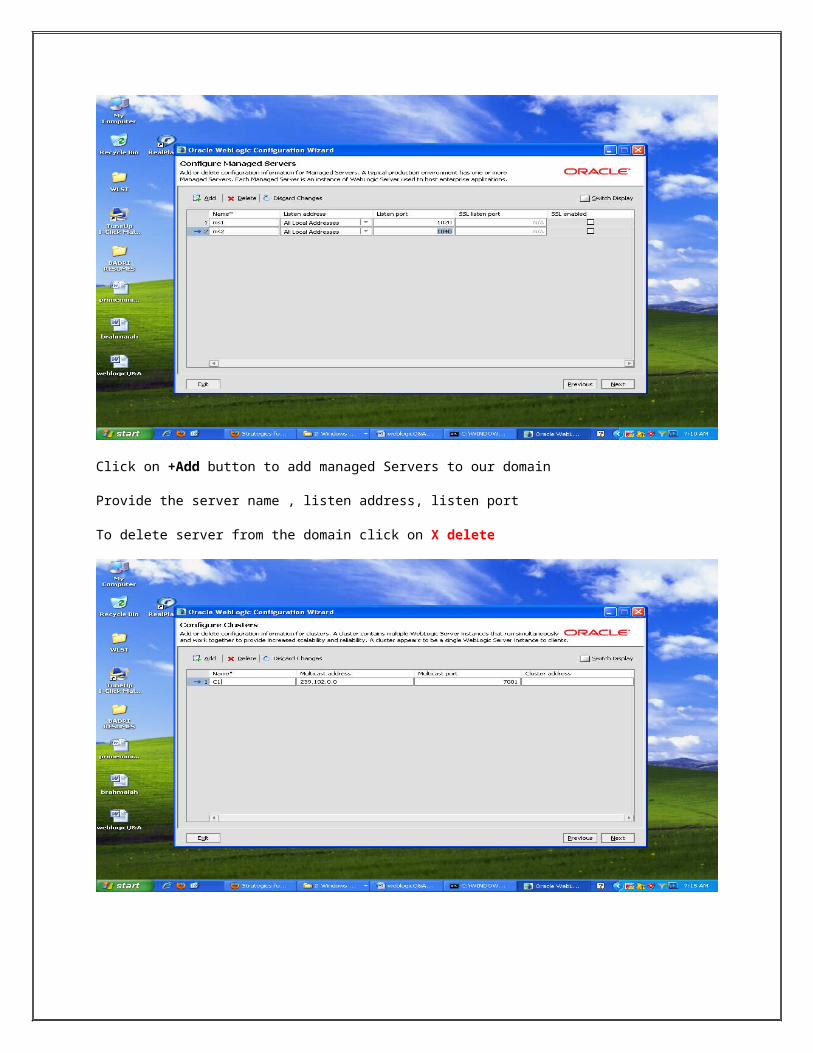
Click on +Add button to add managed Servers to our domain
Provide the server name , listen address, listen port
To delete server from the domain click on X delete
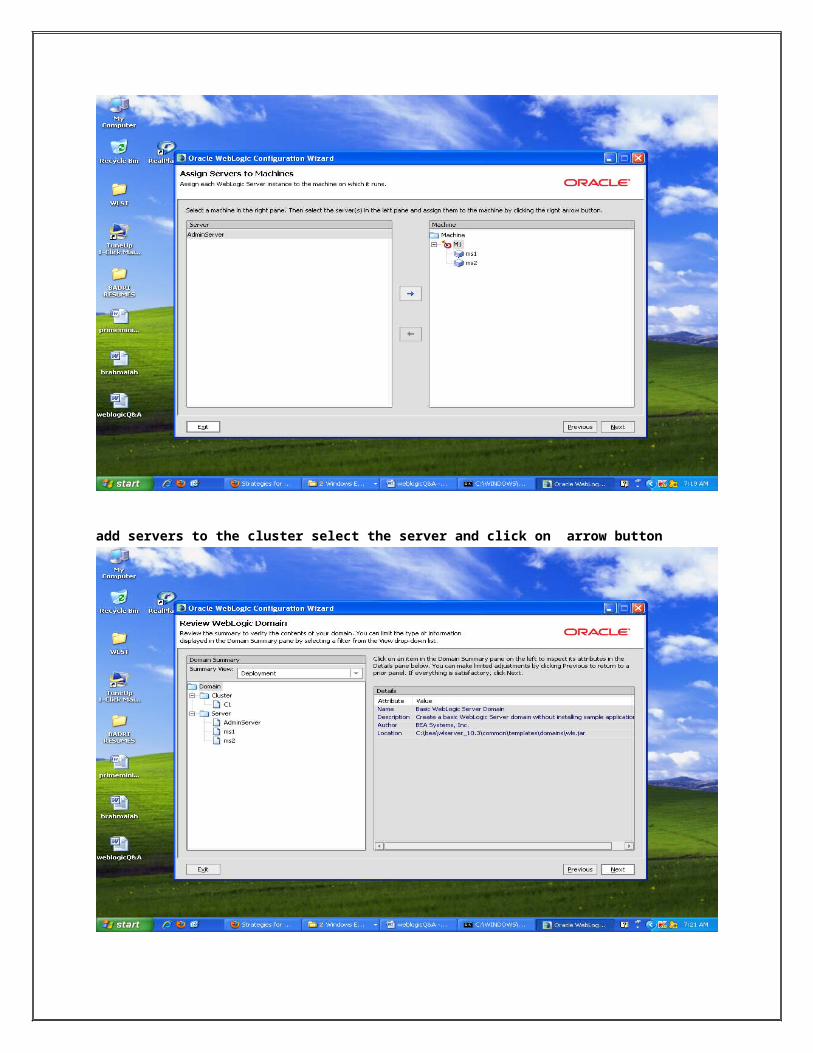
add servers to the cluster select the server and click on arrow button
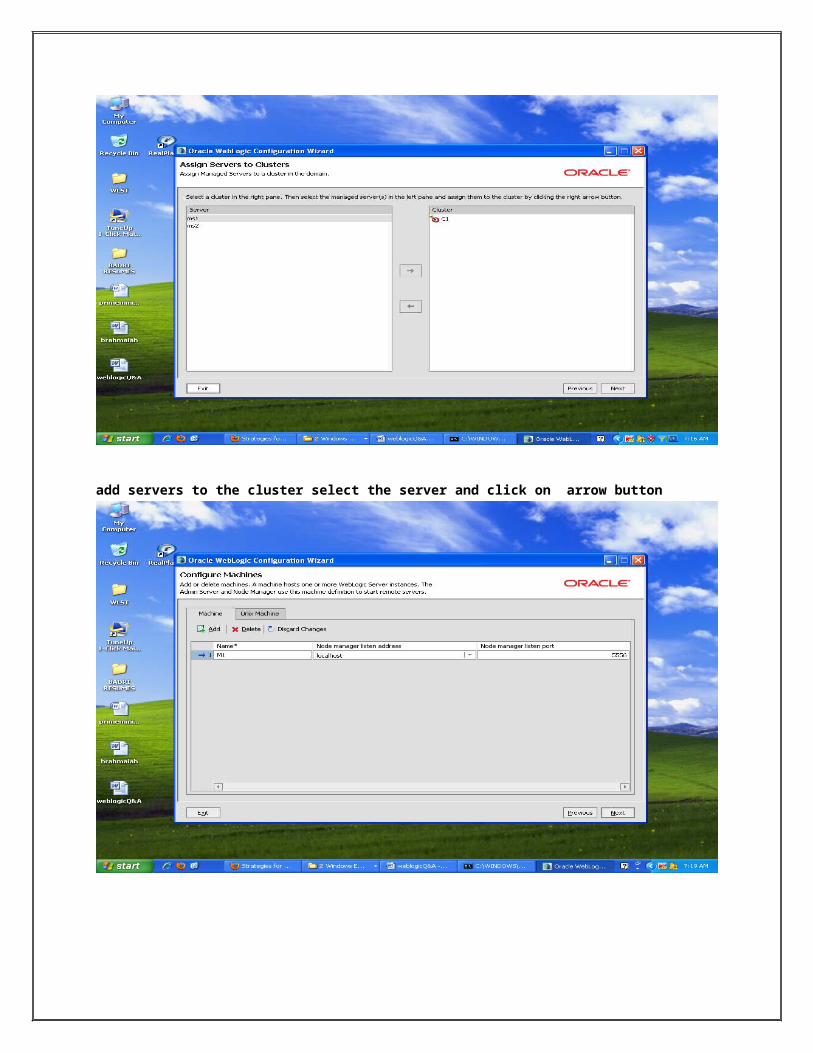
add servers to the cluster select the server and click on arrow button
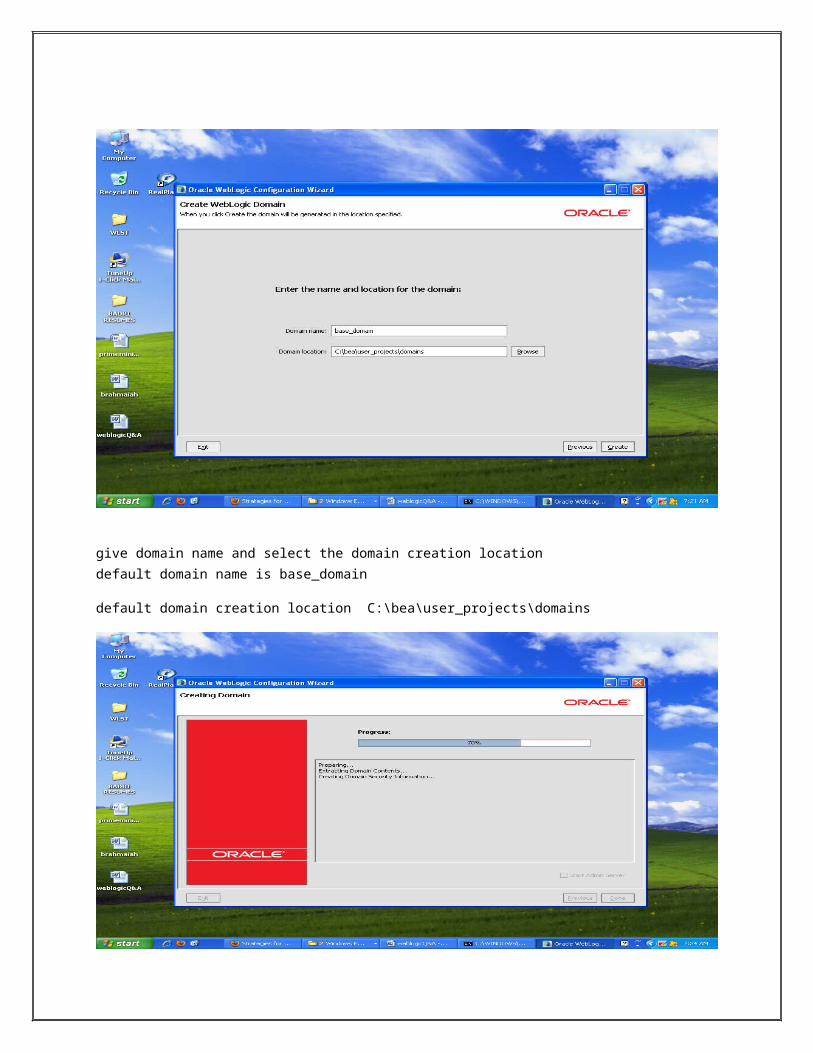
give domain name and select the domain creation locationdefault domain name is base_domain
default domain creation location C:\bea\user_projects\domains
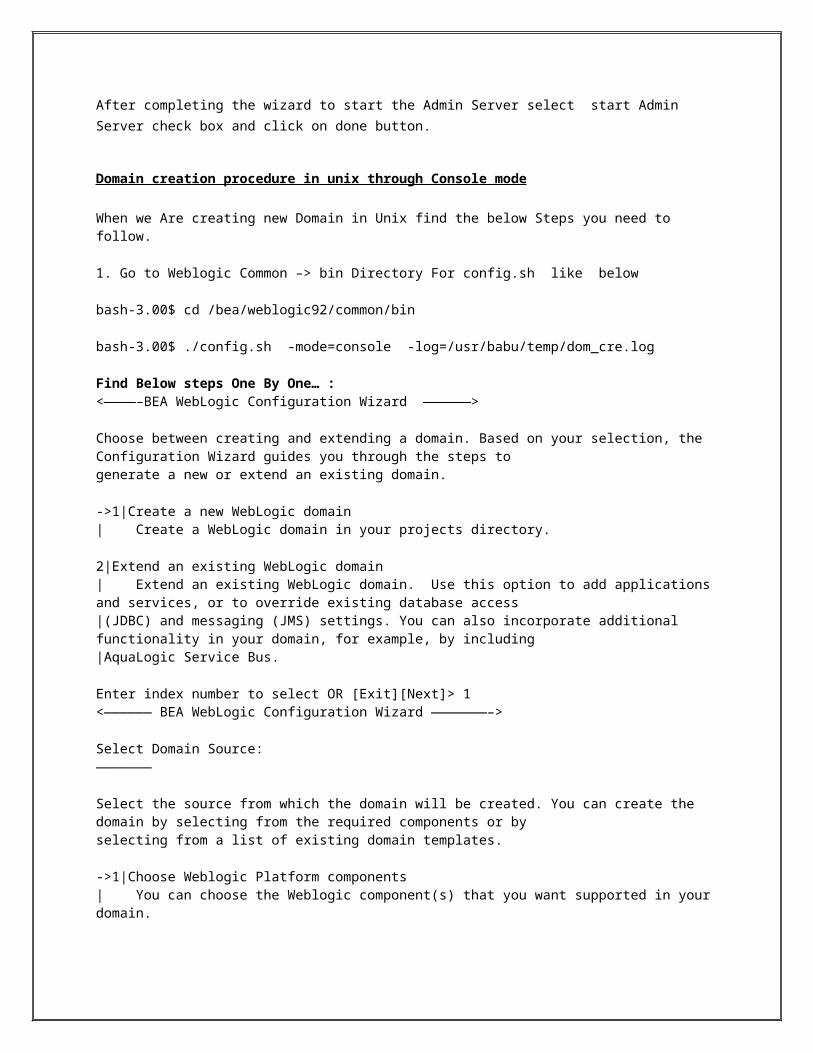
After completing the wizard to start the Admin Server select start Admin Server check box and click on done button.
Domain creation procedure in unix through Console mode
When we Are creating new Domain in Unix find the below Steps you need to follow.
1. Go to Weblogic Common –> bin Directory For config.sh like below
bash-3.00$ cd /bea/weblogic92/common/bin
bash-3.00$ ./config.sh -mode=console -log=/usr/babu/temp/dom_cre.log
Find Below steps One By One… : <————–BEA WebLogic Configuration Wizard ——————>
Choose between creating and extending a domain. Based on your selection, the Configuration Wizard guides you through the steps togenerate a new or extend an existing domain.
->1|Create a new WebLogic domain| Create a WebLogic domain in your projects directory.
2|Extend an existing WebLogic domain| Extend an existing WebLogic domain. Use this option to add applications and services, or to override existing database access|(JDBC) and messaging (JMS) settings. You can also incorporate additional functionality in your domain, for example, by including|AquaLogic Service Bus.
Enter index number to select OR [Exit][Next]> 1<—————— BEA WebLogic Configuration Wizard ———————–>
Select Domain Source:———————
Select the source from which the domain will be created. You can create the domain by selecting from the required components or byselecting from a list of existing domain templates.
->1|Choose Weblogic Platform components| You can choose the Weblogic component(s) that you want supported in your domain.
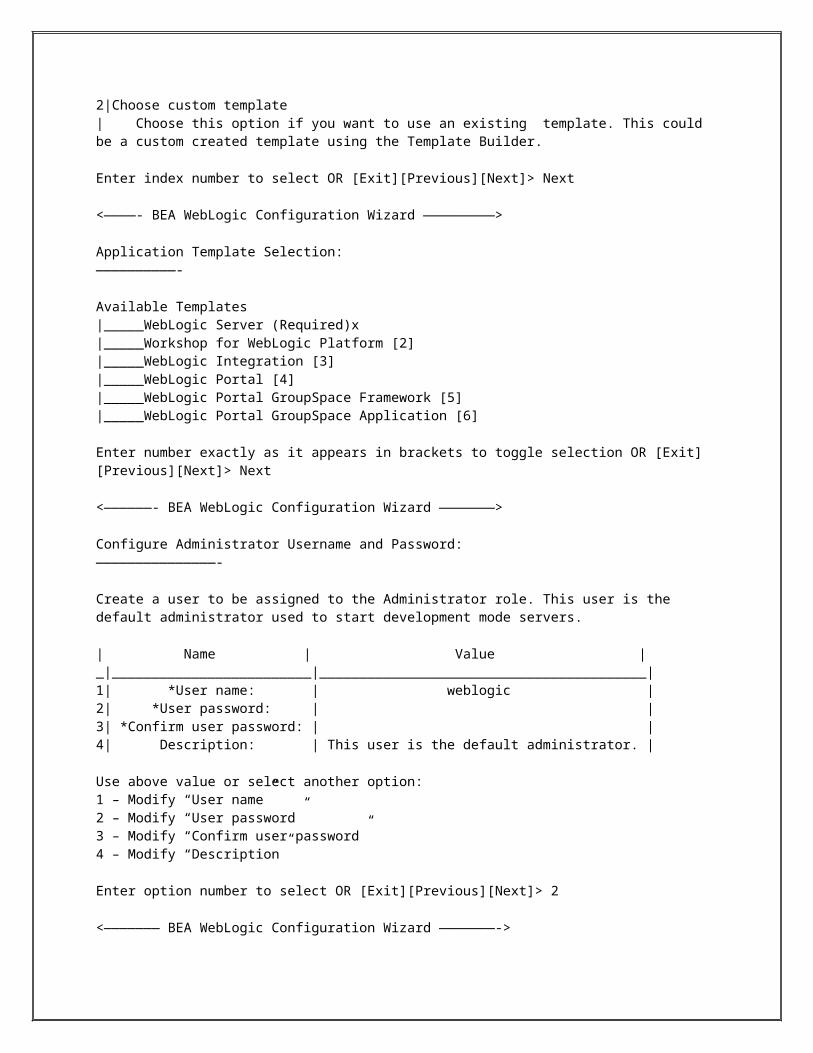
2|Choose custom template| Choose this option if you want to use an existing template. This could be a custom created template using the Template Builder.
Enter index number to select OR [Exit][Previous][Next]> Next
<————- BEA WebLogic Configuration Wizard —————————>
Application Template Selection:——————————-
Available Templates|_____WebLogic Server (Required)x|_____Workshop for WebLogic Platform [2]|_____WebLogic Integration [3]|_____WebLogic Portal [4]|_____WebLogic Portal GroupSpace Framework [5]|_____WebLogic Portal GroupSpace Application [6]
Enter number exactly as it appears in brackets to toggle selection OR [Exit][Previous][Next]> Next
<——————- BEA WebLogic Configuration Wizard ———————>
Configure Administrator Username and Password:———————————————-
Create a user to be assigned to the Administrator role. This user is the default administrator used to start development mode servers.
| Name | Value |_|_________________________|_________________________________________|1| *User name: | weblogic |2| *User password: | |3| *Confirm user password: | |4| Description: | This user is the default administrator. |
Use above value or select another option:1 – Modify “User name”2 – Modify “User password”3 – Modify “Confirm user password”4 – Modify “Description”
Enter option number to select OR [Exit][Previous][Next]> 2
<——————— BEA WebLogic Configuration Wizard ———————->
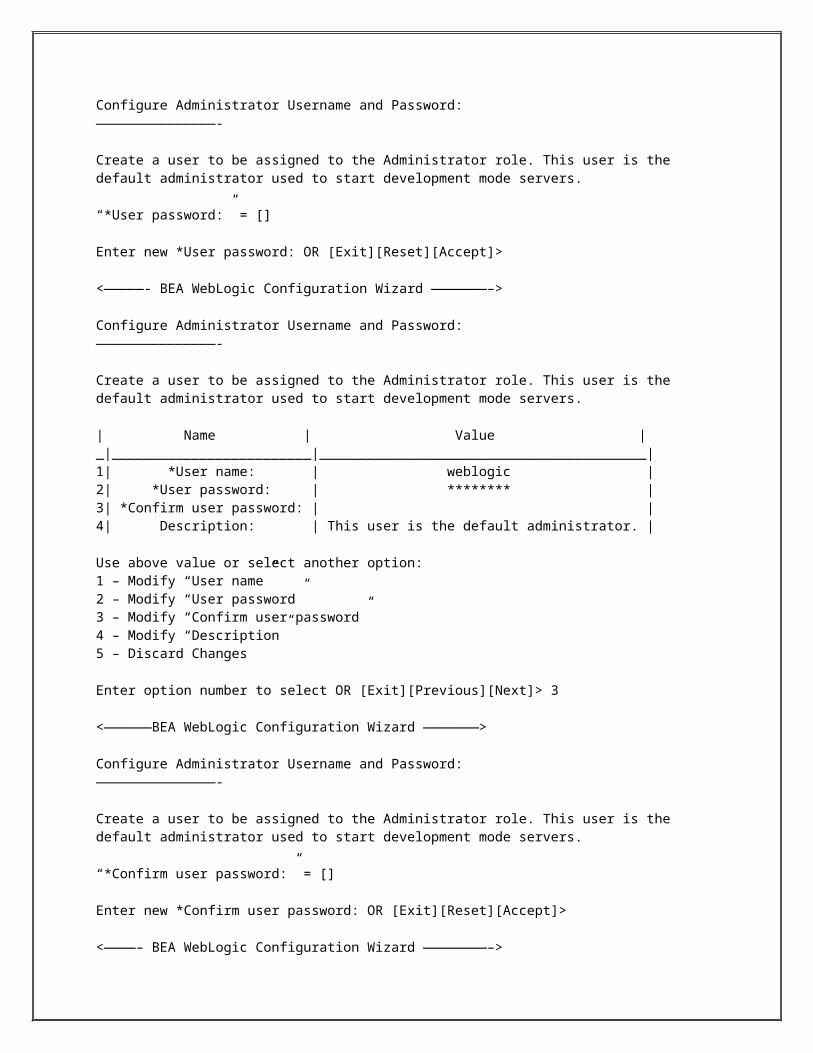
Configure Administrator Username and Password:———————————————-
Create a user to be assigned to the Administrator role. This user is the default administrator used to start development mode servers.
“*User password:” = []
Enter new *User password: OR [Exit][Reset][Accept]>
<—————- BEA WebLogic Configuration Wizard ———————–>
Configure Administrator Username and Password:———————————————-
Create a user to be assigned to the Administrator role. This user is the default administrator used to start development mode servers.
| Name | Value |_|_________________________|_________________________________________|1| *User name: | weblogic |2| *User password: | ******** |3| *Confirm user password: | |4| Description: | This user is the default administrator. |
Use above value or select another option:1 – Modify “User name”2 – Modify “User password”3 – Modify “Confirm user password”4 – Modify “Description”5 – Discard Changes
Enter option number to select OR [Exit][Previous][Next]> 3
<——————BEA WebLogic Configuration Wizard ———————>
Configure Administrator Username and Password:———————————————-
Create a user to be assigned to the Administrator role. This user is the default administrator used to start development mode servers.
“*Confirm user password:” = []
Enter new *Confirm user password: OR [Exit][Reset][Accept]>
<————– BEA WebLogic Configuration Wizard ————————–>
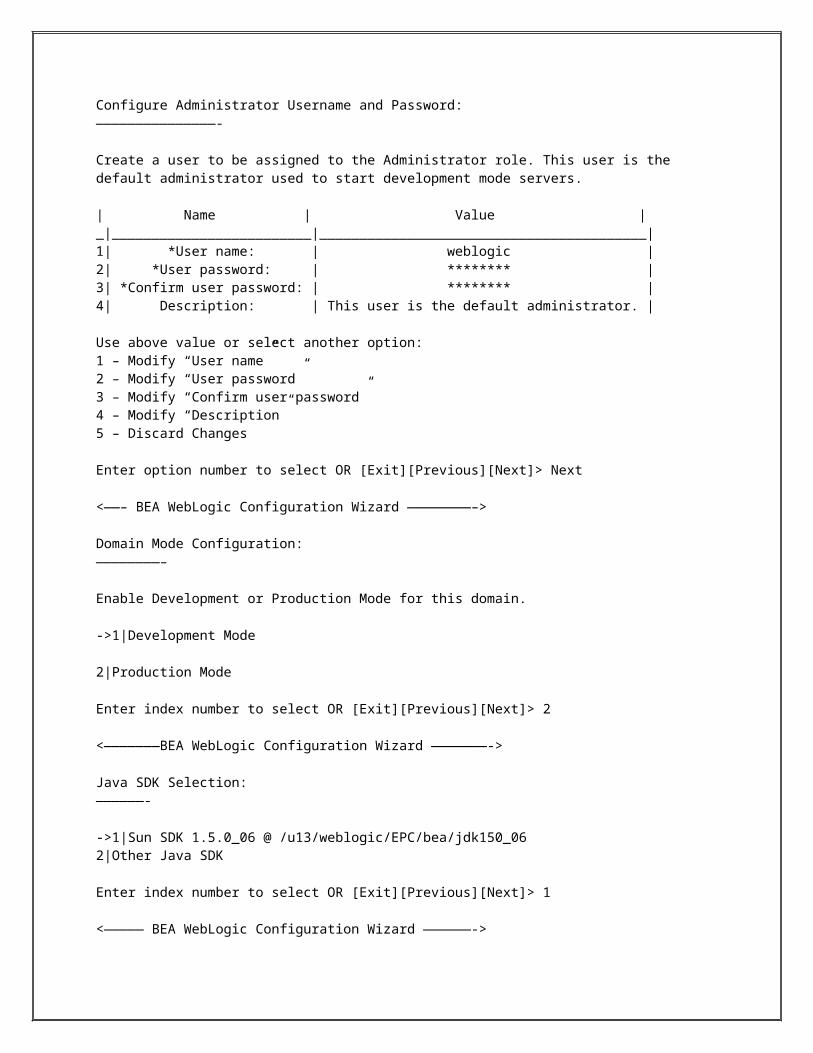
Configure Administrator Username and Password:———————————————-
Create a user to be assigned to the Administrator role. This user is the default administrator used to start development mode servers.
| Name | Value |_|_________________________|_________________________________________|1| *User name: | weblogic |2| *User password: | ******** |3| *Confirm user password: | ******** |4| Description: | This user is the default administrator. |
Use above value or select another option:1 – Modify “User name”2 – Modify “User password”
3 – Modify “Confirm user password”4 – Modify “Description”5 – Discard Changes
Enter option number to select OR [Exit][Previous][Next]> Next
<——– BEA WebLogic Configuration Wizard ————————–>
Domain Mode Configuration:————————–
Enable Development or Production Mode for this domain.
->1|Development Mode
2|Production Mode
Enter index number to select OR [Exit][Previous][Next]> 2
<———————BEA WebLogic Configuration Wizard ———————->
Java SDK Selection:——————-
->1|Sun SDK 1.5.0_06 @ /u13/weblogic/EPC/bea/jdk150_062|Other Java SDK
Enter index number to select OR [Exit][Previous][Next]> 1
<————— BEA WebLogic Configuration Wizard ——————->
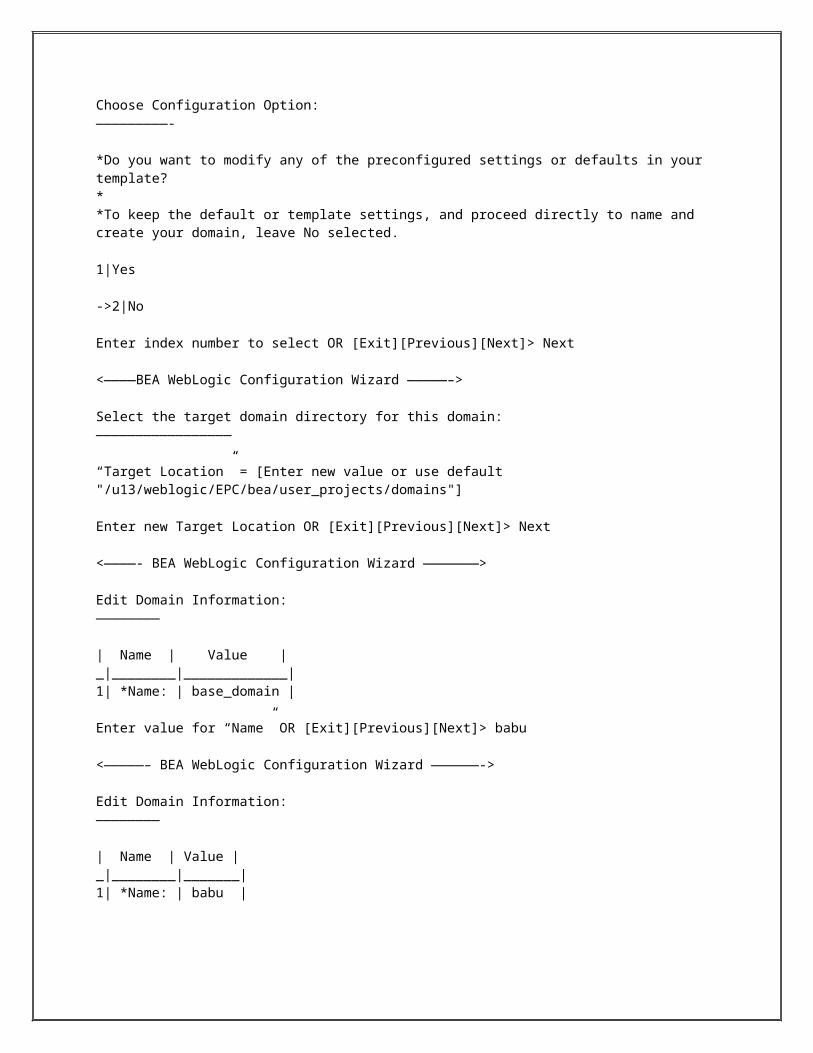
Choose Configuration Option:—————————-
*Do you want to modify any of the preconfigured settings or defaults in your template?**To keep the default or template settings, and proceed directly to name and create your domain, leave No selected.
1|Yes
->2|No
Enter index number to select OR [Exit][Previous][Next]> Next
<————BEA WebLogic Configuration Wizard —————–>
Select the target domain directory for this domain:—————————————————
“Target Location” = [Enter new value or use default "/u13/weblogic/EPC/bea/user_projects/domains"]
Enter new Target Location OR [Exit][Previous][Next]> Next
<————- BEA WebLogic Configuration Wizard ———————>
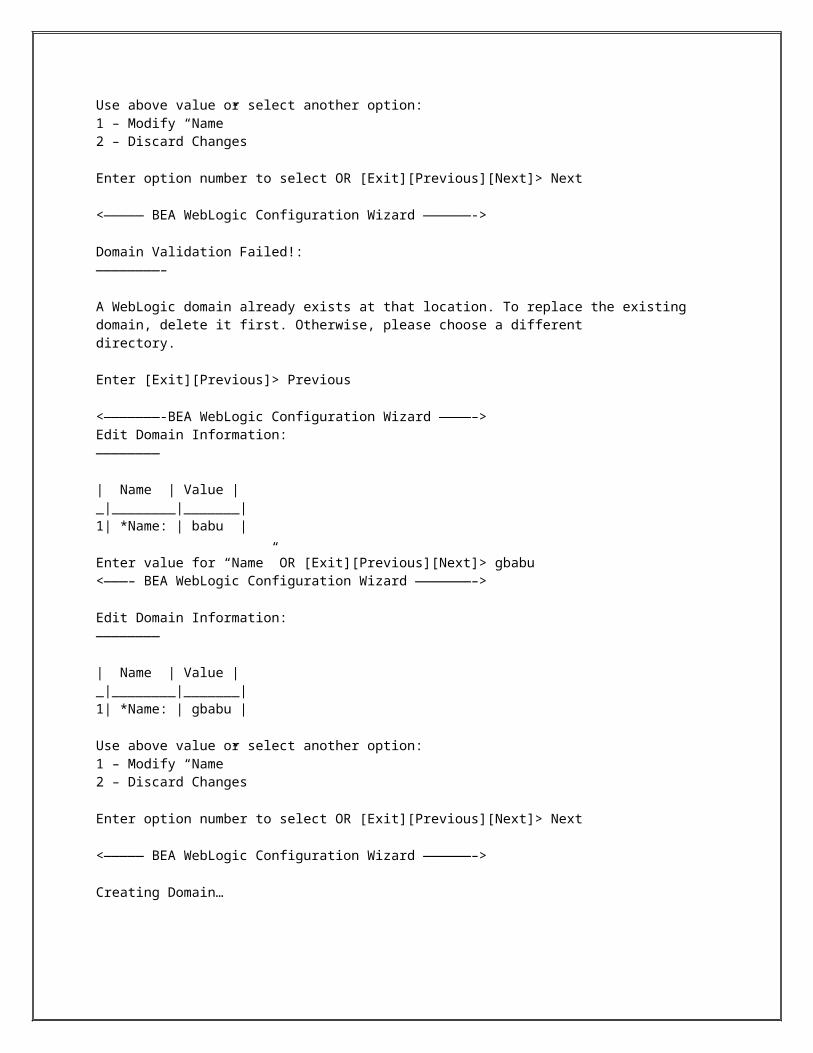
Edit Domain Information:————————
| Name | Value |_|________|_____________|1| *Name: | base_domain |
Enter value for “Name” OR [Exit][Previous][Next]> babu
<—————– BEA WebLogic Configuration Wizard ——————->
Edit Domain Information:————————
| Name | Value |_|________|_______|1| *Name: | babu |
Use above value or select another option:1 – Modify “Name”2 – Discard Changes
Enter option number to select OR [Exit][Previous][Next]> Next
<————— BEA WebLogic Configuration Wizard ——————->
Domain Validation Failed!:————————–
A WebLogic domain already exists at that location. To replace the existing domain, delete it first. Otherwise, please choose a differentdirectory.
Enter [Exit][Previous]> Previous
<———————-BEA WebLogic Configuration Wizard ————–>Edit Domain Information:————————
| Name | Value |_|________|_______|1| *Name: | babu |
Enter value for “Name” OR [Exit][Previous][Next]> gbabu<———– BEA WebLogic Configuration Wizard ———————–>
Edit Domain Information:————————
| Name | Value |_|________|_______|1| *Name: | gbabu |
Use above value or select another option:1 – Modify “Name”2 – Discard Changes
Enter option number to select OR [Exit][Previous][Next]> Next
<————— BEA WebLogic Configuration Wizard ——————–>
Creating Domain…
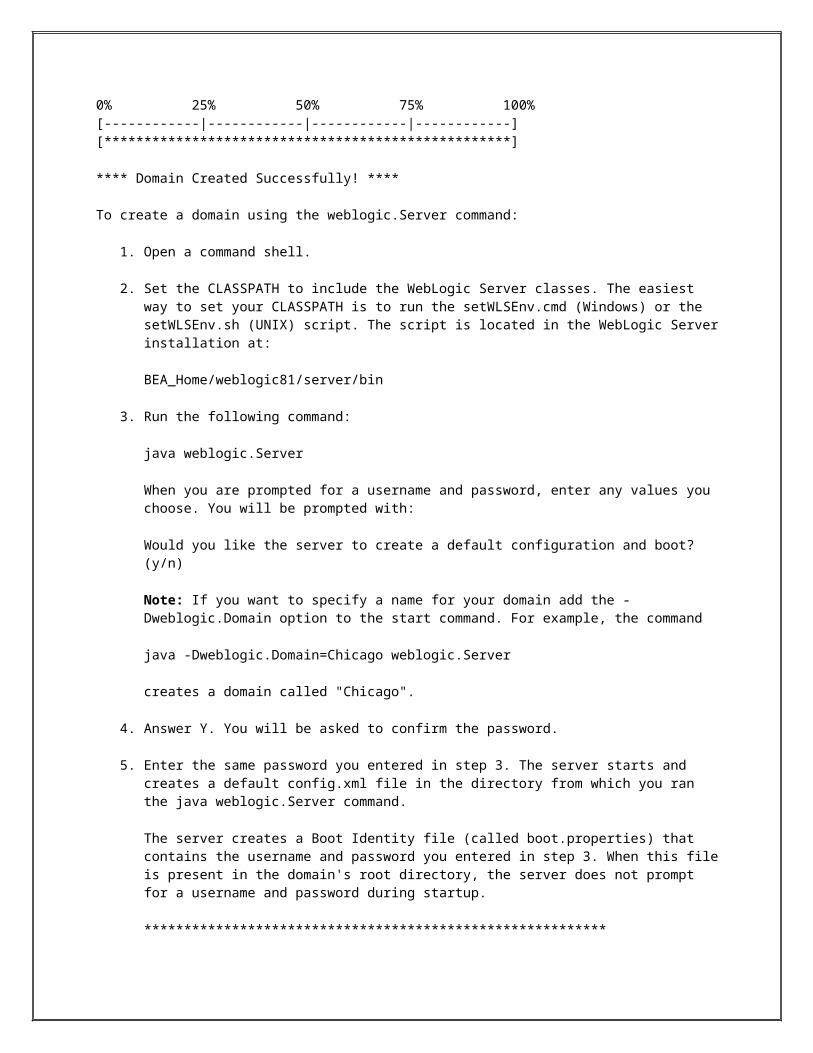
0% 25% 50% 75% 100%[------------|------------|------------|------------][***************************************************]
**** Domain Created Successfully! ****
To create a domain using the weblogic.Server command:
1. Open a command shell.
2. Set the CLASSPATH to include the WebLogic Server classes. The easiest way to set your CLASSPATH is to run the setWLSEnv.cmd (Windows) or the setWLSEnv.sh (UNIX) script. The script is located in the WebLogic Server installation at:
BEA_Home/weblogic81/server/bin
3. Run the following command:
java weblogic.Server
When you are prompted for a username and password, enter any values you choose. You will be prompted with:
Would you like the server to create a default configuration and boot? (y/n)
Note: If you want to specify a name for your domain add the -Dweblogic.Domain option to the start command. For example, the command
java -Dweblogic.Domain=Chicago weblogic.Server
creates a domain called "Chicago".
4. Answer Y. You will be asked to confirm the password.
5. Enter the same password you entered in step 3. The server starts and creates a default config.xml file in the directory from which you ran the java weblogic.Server command.
The server creates a Boot Identity file (called boot.properties) that contains the username and password you entered in step 3. When this file is present in the domain's root directory, the server does not prompt for a username and password during startup.
**********************************************************
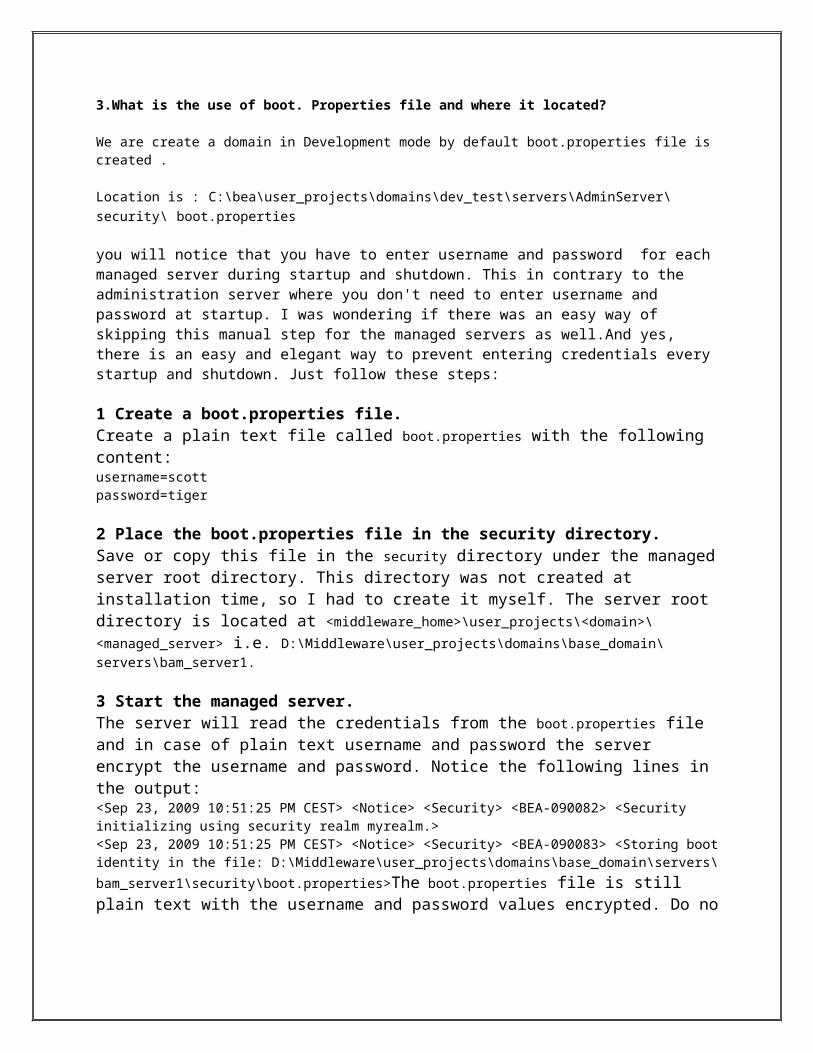
3.What is the use of boot. Properties file and where it located?
We are create a domain in Development mode by default boot.properties file is created .
Location is : C:\bea\user_projects\domains\dev_test\servers\AdminServer\security\ boot.properties
you will notice that you have to enter username and password for each managed server during startup and shutdown. This in contrary to the administration server where you don't need to enter username and password at startup. I was wondering if there was an easy way of skipping this manual step for the managed servers as well.And yes, there is an easy and elegant way to prevent entering credentials every startup and shutdown. Just follow these steps:
1 Create a boot.properties file. Create a plain text file called boot.properties with the following content: username=scottpassword=tiger
2 Place the boot.properties file in the security directory.Save or copy this file in the security directory under the managed server root directory. This directory was not created at installation time, so I had to create it myself. The server root directory is located at <middleware_home>\user_projects\<domain>\<managed_server> i.e. D:\Middleware\user_projects\domains\base_domain\servers\bam_server1.
3 Start the managed server. The server will read the credentials from the boot.properties file and in case of plain text username and password the server encrypt the username and password. Notice the following lines in the output:<Sep 23, 2009 10:51:25 PM CEST> <Notice> <Security> <BEA-090082> <Security initializing using security realm myrealm.><Sep 23, 2009 10:51:25 PM CEST> <Notice> <Security> <BEA-090083> <Storing boot identity in the file: D:\Middleware\user_projects\domains\base_domain\servers\
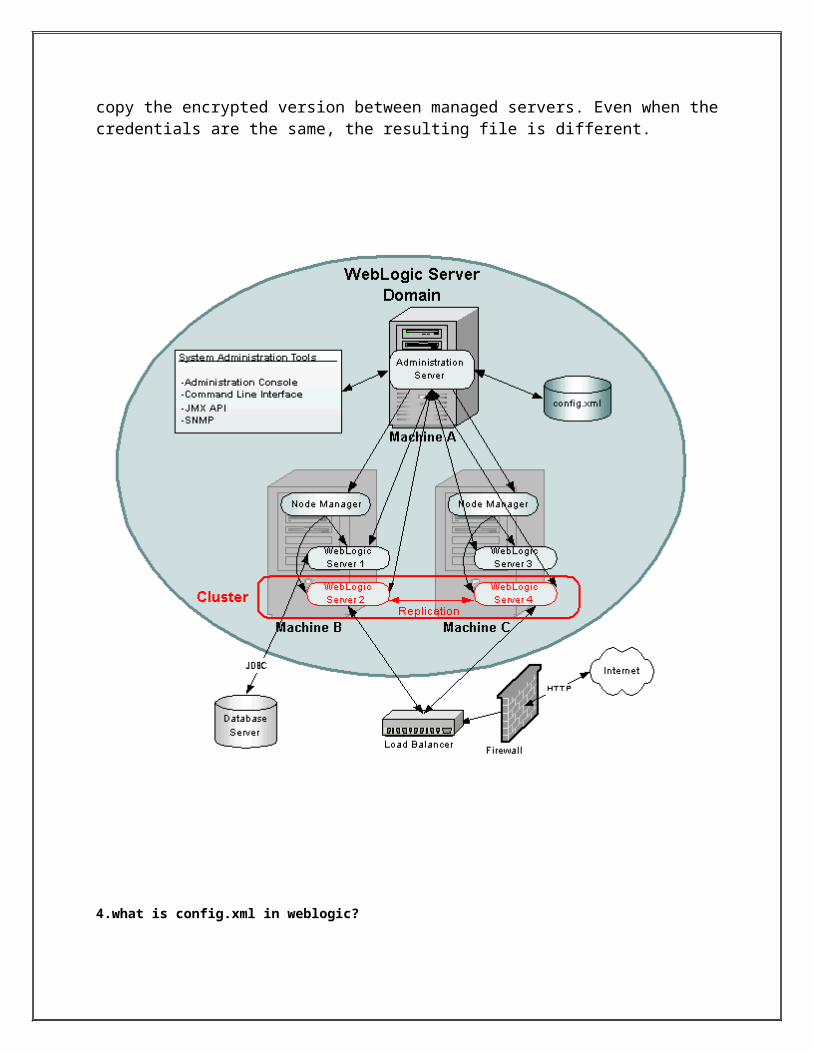
bam_server1\security\boot.properties>The boot.properties file is still plain text with the username and password values encrypted. Do no copy the encrypted version between managed servers. Even when the credentials are the same, the resulting file is different.
4.what is config.xml in weblogic?
it is heart of the weblogic server and its maintains the all the info about managed and admin server details like Ipadd,portno...etc, and whenever you update the admin console that info is updated in config.xml and while restart the server,server will get details from config.xml only....it is also called as configuration repository config.xml.
The config.xml file consists of a series of XML elements. The Domain element is the top-level element, and all elements in the Domain are children of the Domain element. The Domain element includes child elements, such as the Server, Cluster, and Application elements. These child elements may have children themselves.
What we can edit in the config.xml file?1. We can replicate the server instances.2. We can replicate the cluster instances.3. We can replicate the machine configurations.
What we should not touch(cannot change)?1. security settings -- realm details2. encrypted password data...What are the basic changes observed compared to WebLogic 8.1?1. The configuration in the 8.1 is un-ordered as and when you configured new resource that will be appendded at the end. whereas in the WebLogic 9.x it is very clear that follows the xml schema so we cannot place a tag line up or down, it follows strict rules defined in domain.xsd.
2. The schema defination clearly mentioned that an element if selected to place in the config.xml that could we need to check for parent element, data type (string, boolean, number etc. Note: Do not edit the config.xml file while the Administration Server is running.
5.Ways to start Administration Serverin Oracle WebLogic
1.Using startup script2. From Windows Start Menu (windows only)3. Using “java weblogic.Server” command4. Using WLST (WebLogic Scripting Tool) and Node Manager5. Using WLST without Node Manager
Ways to start Managed Serverin Oracle WebLogic
1.Using startup script2. Using Administration Console3. Using WLST and Node Manager4. Using “java weblogic.Server” command
1. Starting Administration Server (startWebLogic.cmd or .sh) ./ startWebLogic.sh2. Starting Managed Server (startManagedWebLogic.sh or .cmd)
A. To Start WebLogic Administration Server Instance
Go to domain for which you wish to start Administration Server
cd $BEA_HOME/user_projects/domains/<domain_name>/bin
startWebLogic.cmd (for Windows)startWebLogic.sh (for Unix)
./startWebLogic.sh
confirm that WebLogic Adminstration Server started properly by looking at message “Service started RUNNING mode“. Log file in below picture shows that AdminSever is listening on Port 7001 and all IP addresses on specific machine.
Startup/Shutdown Log file can be found at $BEA_HOME/ user_projects/ domains/ <domain_name> /servers/<ServerName> /logs / <ServerName>.log
B. Start Managed Server InstanceIf you created Managed Server while creating domain then you can start Managed Server using startManagedWebLogic command
$BEA_HOME/user_projects/domains/<domain_name>/bin
startManagedWebLogic.cmd <managed_server_name> <admin_url> (for Windows)./startManagedWebLogic.sh <managed_server_name> <admin_url> (for Unix)
I created Managed Server MS1 with Admin Port as 7003startManagedWebLogic.cmd ms1 http://localhost:7003 (Windows)
6. What is cluster in Web Logic Server? How to create cluster in Web Logic Server?How to configure Cluster in webserver/PROXY?tell me complete configuration?
A WebLogic Server cluster consists of multiple WebLogic Server server instances running simultaneously and working together to provide increased scalability and reliability. A cluster appears to clients to be a single WebLogic Server instance. The server instances that constitute a cluster can run on the same machine, or be located on different machines. You can increase a cluster’s capacity by adding additional server instances to the cluster on an existing machine, or you can add machines to the cluster to host the incremental server instances. Each server instance in a cluster must run the same version of WebLogic Server.(Or)
Group of WebLogic Managed Server Instances that work together to provide high availability and scalability for applications is called cluster. WebLogic Servers with in cluster can run on same machine or different machines. These are also called as managed Server cluster.
The Tools for Creating and Configuring a WebLogic Cluster
The primary tools you have available to create or configure a WebLogic cluster are the Domain Configuration Wizard and the Administration Console. Which tool you use depends on the type of clustering architecture you want to employ and the capabilities of these tools to support your efforts.
The Domain Configuration Wizard is an excellent tool if you are creating a WebLogic cluster from scratch. This tool presents you with options on the type of WebLogic domain you want
to create. One such option is a domain with an administration server and one or more managed servers that are clustered. However, this option creates the administration server and the clustered WebLogic Server instances on the same single server machine.
The Administration Console is a tool that you can use to configure a WebLogic cluster from existing managed servers in a domain. For example, if your clustering architecture warrants the clustered servers to be on separate server machines, the best approach would be to create the administration server and managed servers independently on each of those machines using the Domain Configuration Wizard. After the managed servers are created and registered with the domain's administration server, you could use the Administration Console to graphically configure a cluster from the existing managed servers.
You can also use the Administration Console to do the following:
Clone a cluster to form a new cluster Assign additional managed servers to a cluster Delete a cluster, which does not remove the managed servers from the domain
Guidelines for Configuring Your WebLogic Cluster
Before you start creating your WebLogic cluster, it is worth reviewing the following guidelines for creating a cluster:
You should try to use DNS names in a production environment to specify the location of the managed servers that will comprise a WebLogic cluster. The use of IP addresses can result in IP address translation errors if you are using a firewall to form a DMZ. However, if you do use IP addresses, they should be permanently assigned to the server machine (static) and not dynamically assigned.
The WebLogic cluster must have a unique IP address and listen port combination for each of its managed server instances. The following are some examples:
o If managed server instances in a cluster share an IP address, as in the case of a non-multihomed single server, a unique listen port number is assigned to each server instance in the cluster.
NOTE
A non-multihomed server machine has only one IP address assigned to its network card (NIC).
o If managed server instances in a cluster have different IP addresses, they may use the same or different listen port numbers. This is applicable if managed servers exist on a multihomed machine or are physically located on separate server machines.
Each WebLogic Server instance in a cluster must run the same version of WebLogic Server software, including service packs.
You should use a dedicated multicast address and port for the sole purpose of enabling cluster communications. Also, each server machine must be able to receive multicast traffic. As you can see in Figure 25.7, you can test the capability of a server machine to receive and respond to multicast traffic by using the MulticastTest utility and typing the following at the command prompt:
java utils.MulticastTest -N Test -A <multicast address>
Figure 25.7 Testing the multicast network capabilities of a server machine using the MulticastTest utility.
Ideally, all managed servers should be located on the same network subnet. Avoid WAN tunneling if you can.
Do not cluster the administration server because the administration objects cannot be clustered and take advantage of any failover mechanisms.
TIP
As a general rule, the administration server should not handle incoming client requests because this will obstruct administration tasks from occurring in a timely fashion.
Configuring a Cluster Using the Administration Console
This section provides a step-by-step guide showing how you can configure a WebLogic cluster using the Administration Console. The assumptions for this exercise are that you already have a WebLogic domain set up with two managed servers, and the network configuration for the WebLogic domain adheres to the clustering guidelines discussed in the preceding section. The name of the WebLogic domain, cluster and managed servers, and their network configurations can differ from those used in the example because the steps to configure the WebLogic cluster still remain the same.
To learn how to set up and configure a WebLogic domain, see "Understanding WebLogic Domains," "Creating and Extending WebLogic Domains," and "Configuring the Network Resources for a WebLogic Domain."
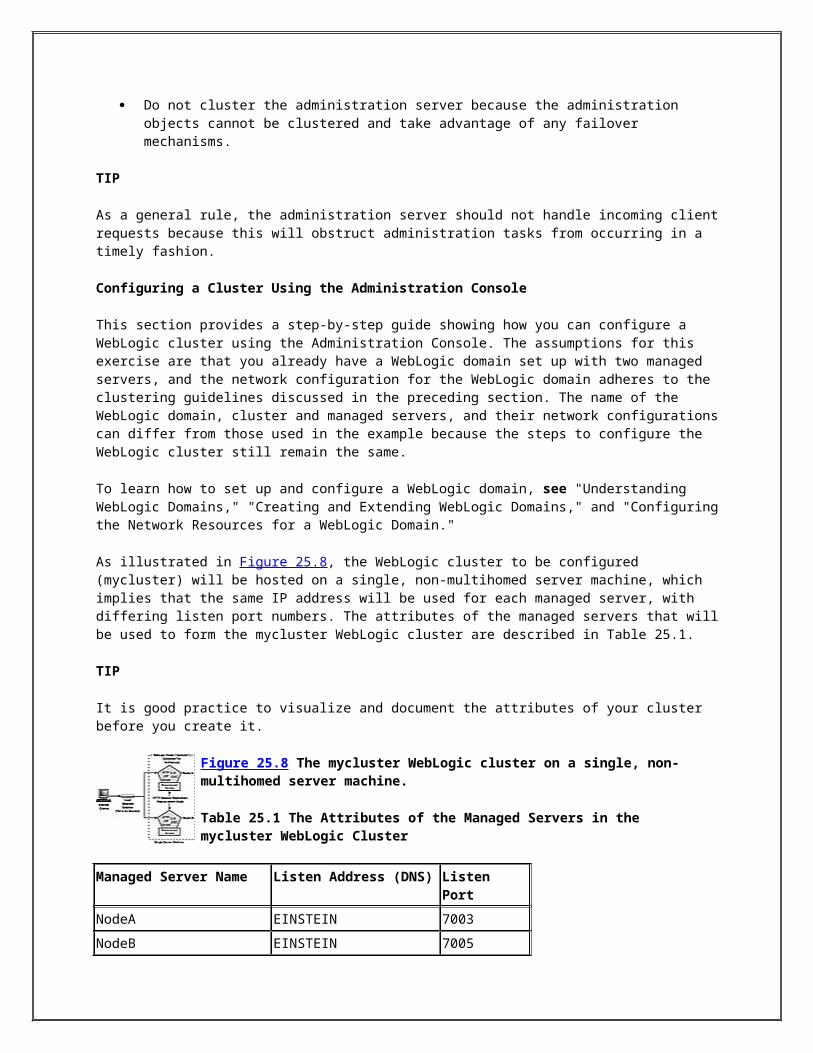
As illustrated in Figure 25.8, the WebLogic cluster to be configured (mycluster) will be hosted on a single, non-multihomed server machine, which implies that the same IP address will be used for each managed server, with differing listen port numbers. The attributes of the managed servers that will be used to form the mycluster WebLogic cluster are described in Table 25.1.
TIP
It is good practice to visualize and document the attributes of your cluster before you create it.
Figure 25.8 The mycluster WebLogic cluster on a single, non-multihomed server machine.
Table 25.1 The Attributes of the Managed Servers in the mycluster WebLogic Cluster
Managed Server Name Listen Address (DNS) Listen Port
NodeA EINSTEIN 7003
NodeB EINSTEIN 7005
TIP
If your server machines are dynamically assigned IP addresses, you should use the server DNS names as the listen addresses.
To configure the mycluster WebLogic cluster using the Administration Console, follow these steps:
1. Launch the Administration Console in a Web browser using the appropriate URL for your administration server.
2. From the left pane in the Administration Console, select the Clusters node.3. In the right pane of the Administration Console, click Configure a New Cluster.4. On the Create a New Cluster screen (the Configuration, General tab), enter the
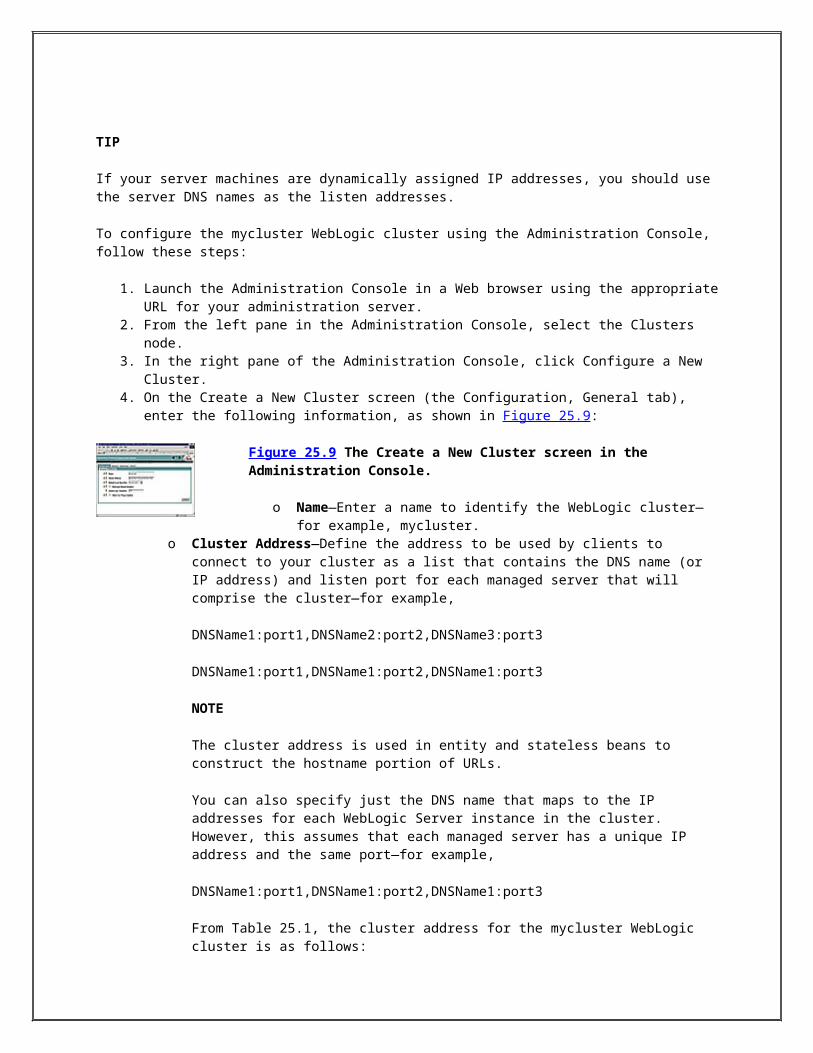
following information, as shown in Figure 25.9:
Figure 25.9 The Create a New Cluster screen in the Administration Console.
o Name—Enter a name to identify the WebLogic cluster—for example, mycluster.
o Cluster Address—Define the address to be used by clients to connect to your cluster as a list that contains the DNS name (or IP address) and listen port for each managed server that will comprise the cluster—for example,
DNSName1:port1,DNSName2:port2,DNSName3:port3
DNSName1:port1,DNSName1:port2,DNSName1:port3
NOTE
The cluster address is used in entity and stateless beans to construct the hostname portion of URLs.
You can also specify just the DNS name that maps to the IP addresses for each WebLogic Server instance in the cluster. However, this assumes that each managed server has a unique IP address and the same port—for example,
DNSName1:port1,DNSName1:port2,DNSName1:port3
From Table 25.1, the cluster address for the mycluster WebLogic cluster is as follows:
EINSTEIN:7003,EINSTEIN:7005
Each WebLogic Server instance in a cluster must have a unique combination of IP address and listen port number.
o Default Load Algorithm—Select the algorithm to be used for load-balancing method calls between replicated EJBs and RMI classes; your choices are Round-Robin, Weight-Based, or Random. (The default is Round-Robin.)
o WebLogic Plug-in Enabled—Select this option if you are using a WebLogic plug-in for a third-party Web server.
o Service Age Threshold—Enter the number of seconds by which the age of two conflicting services must differ before one is considered older than the other. (The default is 180 seconds.)
o Client Cert Proxy Enabled—Select this option if you are using the HttpClusterServlet proxy because it enables the client certificate to be securely proxied using a special header.
5. Click Create to configure your new cluster.6. Select the Configuration, Multicast tab to configure the Multicast parameters for your
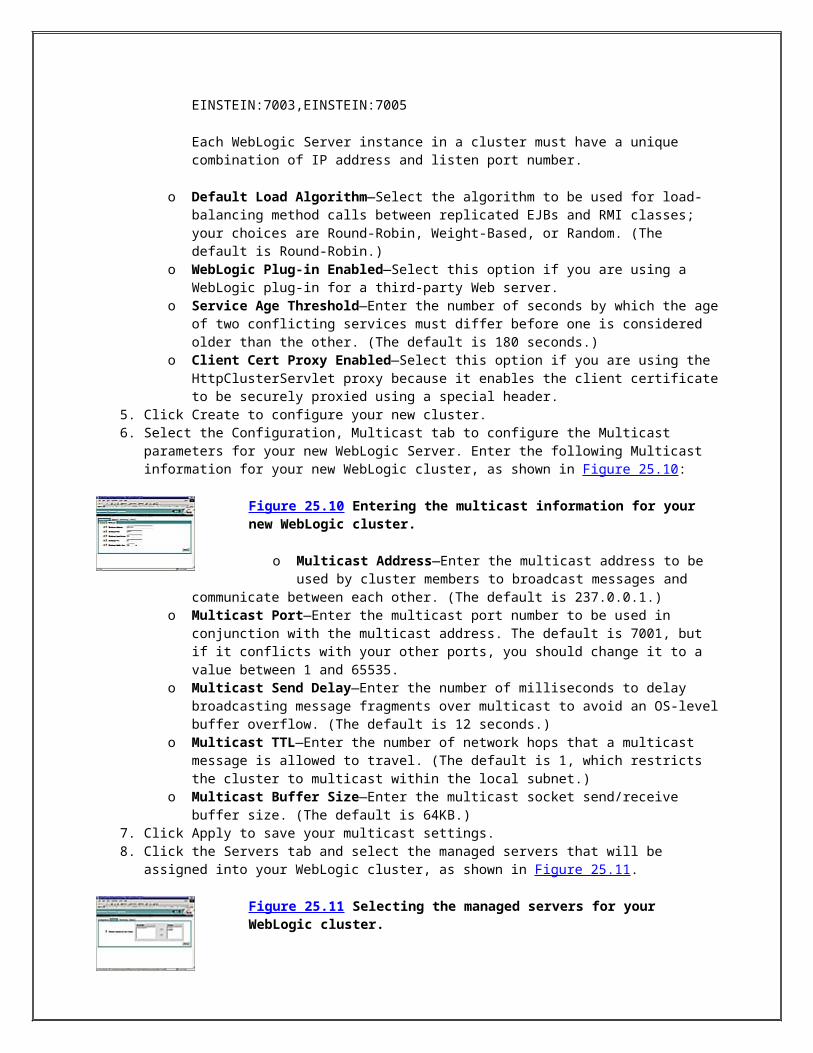
new WebLogic Server. Enter the following Multicast information for your new WebLogic cluster, as shown in Figure 25.10:
Figure 25.10 Entering the multicast information for your new WebLogic cluster.
o Multicast Address—Enter the multicast address to be used by cluster members to broadcast messages and communicate
between each other. (The default is 237.0.0.1.)o Multicast Port—Enter the multicast port number to be used in conjunction
with the multicast address. The default is 7001, but if it conflicts with your other ports, you should change it to a value between 1 and 65535.
o Multicast Send Delay—Enter the number of milliseconds to delay broadcasting message fragments over multicast to avoid an OS-level buffer overflow. (The default is 12 seconds.)
o Multicast TTL—Enter the number of network hops that a multicast message is allowed to travel. (The default is 1, which restricts the cluster to multicast within the local subnet.)
o Multicast Buffer Size—Enter the multicast socket send/receive buffer size. (The default is 64KB.)
7. Click Apply to save your multicast settings.8. Click the Servers tab and select the managed servers that will be assigned into your
WebLogic cluster, as shown in Figure 25.11.
Figure 25.11 Selecting the managed servers for your WebLogic cluster.
9. Click Apply to save your clustered server settings.
This completes the tasks related to configuring a WebLogic cluster using the Administration Console. The next section describes how you can now start your WebLogic cluster.
Configure Apache Webserver with Weblogic Server
Step 1) Make sure the Apache server runs on port 8080.( This is because sometimes IIS, or some antivirus s/w runs on that port).This can be done by modifying the httpd.conf present atD:\Program Files\Apache Group\Apache2\confModify the Listen port to 8080
Listen 8080
Step 2) Copy the mod_wl_20.so from <bea_home>\wlserver_10.3\server\plugin\win\32 toD:\Program Files\Apache Group\Apache2\modules
Step 3) Add these lines in the httpd.conf file
LoadModule weblogic_module modules/mod_wl_20.so
<Location />SetHandler weblogic-handler</Location>
<IfModule mod_weblogic.c>WebLogicCluster localhost:7003,localhost:7005Debug ONWLLogFile c:/temp/wlproxy.logWLTempDir c:/temp</IfModule>
Step 4) Restart Apache and access the application deployed on the Cluster using
http://localhost:8080/YourApp
This will forward the request to the Weblogic Cluster
You can check the headers sent and received to WLS in wlproxy.log file.
4.What Kind of proxy Servers are using in your project ?what is the configuration file(s)?
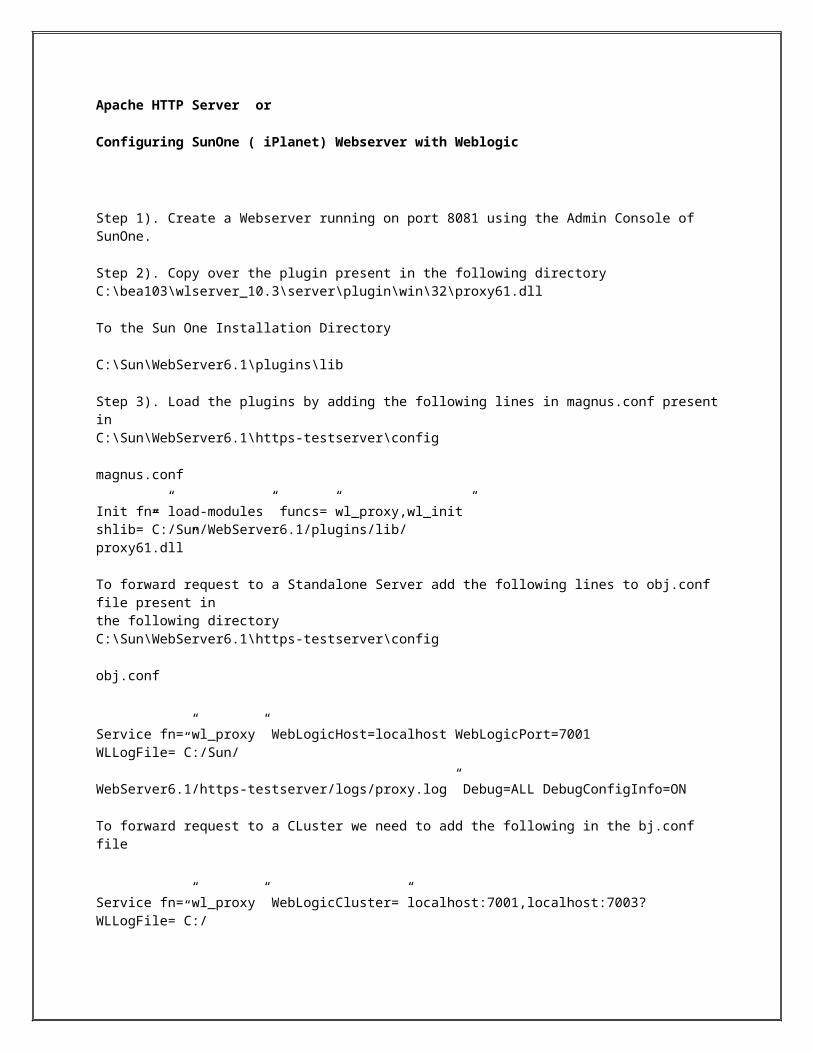
Apache HTTP Server or
Configuring SunOne ( iPlanet) Webserver with Weblogic
Step 1). Create a Webserver running on port 8081 using the Admin Console of SunOne.
Step 2). Copy over the plugin present in the following directoryC:\bea103\wlserver_10.3\server\plugin\win\32\proxy61.dll
To the Sun One Installation Directory
C:\Sun\WebServer6.1\plugins\lib
Step 3). Load the plugins by adding the following lines in magnus.conf present inC:\Sun\WebServer6.1\https-testserver\config
magnus.conf
Init fn=”load-modules” funcs=”wl_proxy,wl_init” shlib=”C:/Sun/WebServer6.1/plugins/lib/proxy61.dll”
To forward request to a Standalone Server add the following lines to obj.conf file present inthe following directoryC:\Sun\WebServer6.1\https-testserver\config
obj.conf
Service fn=”wl_proxy” WebLogicHost=localhost WebLogicPort=7001 WLLogFile=”C:/Sun/
WebServer6.1/https-testserver/logs/proxy.log” Debug=ALL DebugConfigInfo=ON
To forward request to a CLuster we need to add the following in the bj.conf file
Service fn=”wl_proxy” WebLogicCluster=”localhost:7001,localhost:7003? WLLogFile=”C:/
Sun/WebServer6.1/https-testserver/logs/proxy.log” Debug=ALL DebugConfigInfo=ON
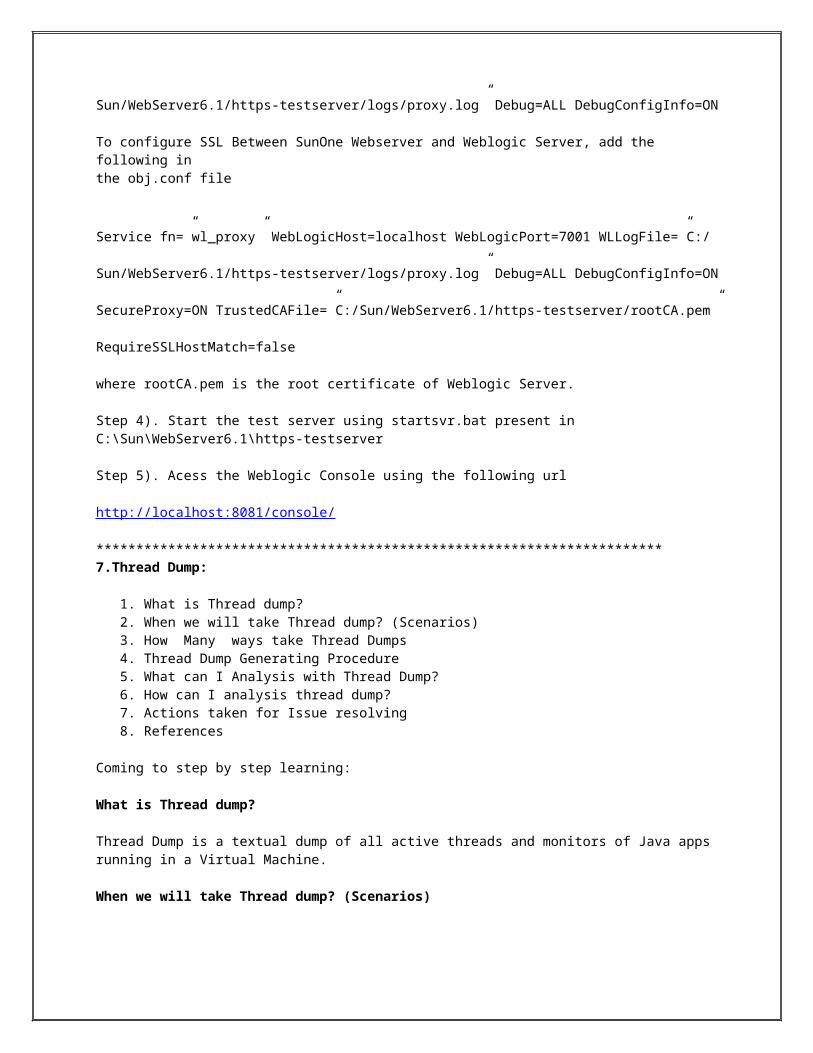
To configure SSL Between SunOne Webserver and Weblogic Server, add the following inthe obj.conf file
Service fn=”wl_proxy” WebLogicHost=localhost WebLogicPort=7001 WLLogFile=”C:/
Sun/WebServer6.1/https-testserver/logs/proxy.log” Debug=ALL DebugConfigInfo=ON
SecureProxy=ON TrustedCAFile=”C:/Sun/WebServer6.1/https-testserver/rootCA.pem”
RequireSSLHostMatch=false
where rootCA.pem is the root certificate of Weblogic Server.
Step 4). Start the test server using startsvr.bat present inC:\Sun\WebServer6.1\https-testserver
Step 5). Acess the Weblogic Console using the following url
http://localhost:8081/console/
***********************************************************************7.Thread Dump:
1. What is Thread dump?2. When we will take Thread dump? (Scenarios)3. How Many ways take Thread Dumps4. Thread Dump Generating Procedure5. What can I Analysis with Thread Dump?6. How can I analysis thread dump?7. Actions taken for Issue resolving8. References
Coming to step by step learning:
What is Thread dump?
Thread Dump is a textual dump of all active threads and monitors of Java apps running in a Virtual Machine.
When we will take Thread dump? (Scenarios)
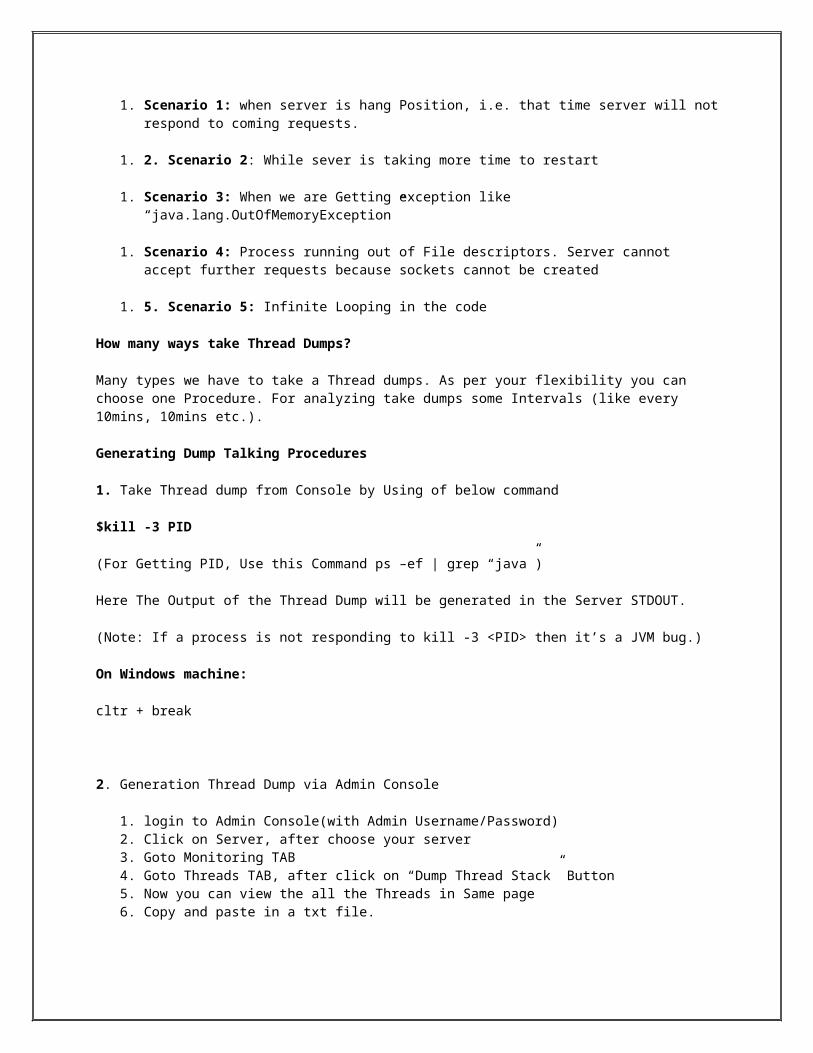
1. Scenario 1: when server is hang Position, i.e. that time server will not respond to coming requests.
1. 2. Scenario 2: While sever is taking more time to restart
1. Scenario 3: When we are Getting exception like “java.lang.OutOfMemoryException”
1. Scenario 4: Process running out of File descriptors. Server cannot accept further requests because sockets cannot be created
1. 5. Scenario 5: Infinite Looping in the code
How many ways take Thread Dumps?
Many types we have to take a Thread dumps. As per your flexibility you can choose one Procedure. For analyzing take dumps some Intervals (like every 10mins, 10mins etc.).
Generating Dump Talking Procedures
1. Take Thread dump from Console by Using of below command
$kill -3 PID
(For Getting PID, Use this Command ps –ef | grep “java”)
Here The Output of the Thread Dump will be generated in the Server STDOUT.
(Note: If a process is not responding to kill -3 <PID> then it’s a JVM bug.)
On Windows machine:
cltr + break
2. Generation Thread Dump via Admin Console
1. login to Admin Console(with Admin Username/Password)2. Click on Server, after choose your server3. Goto Monitoring TAB4. Goto Threads TAB, after click on “Dump Thread Stack” Button5. Now you can view the all the Threads in Same page
6. Copy and paste in a txt file.
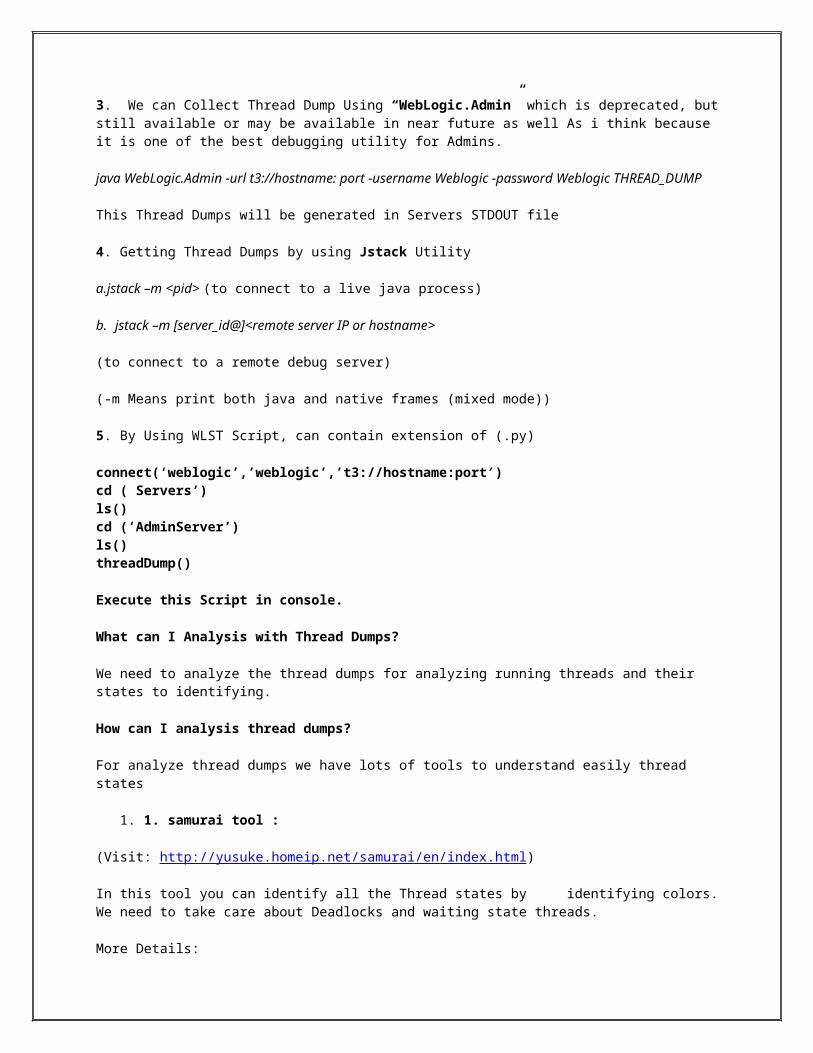
3. We can Collect Thread Dump Using “WebLogic.Admin” which is deprecated, but still available or may be available in near future as well As i think because it is one of the best debugging utility for Admins.
java WebLogic.Admin -url t3://hostname: port -username Weblogic -password Weblogic THREAD_DUMP
This Thread Dumps will be generated in Servers STDOUT file
4. Getting Thread Dumps by using Jstack Utility
a.jstack –m <pid> (to connect to a live java process)
b. jstack –m [server_id@]<remote server IP or hostname>
(to connect to a remote debug server)
(-m Means print both java and native frames (mixed mode))
5. By Using WLST Script, can contain extension of (.py)
connect(‘weblogic’,’weblogic’,’t3://hostname:port′)cd (”Servers’)ls()cd (‘AdminServer’)ls()threadDump()
Execute this Script in console.
What can I Analysis with Thread Dumps?
We need to analyze the thread dumps for analyzing running threads and their states to identifying.
How can I analysis thread dumps?
For analyze thread dumps we have lots of tools to understand easily thread states
1. 1. samurai tool :
(Visit: http://yusuke.homeip.net/samurai/en/index.html)
In this tool you can identify all the Thread states by identifying colors. We need to take care about Deadlocks and waiting state threads.
More Details:
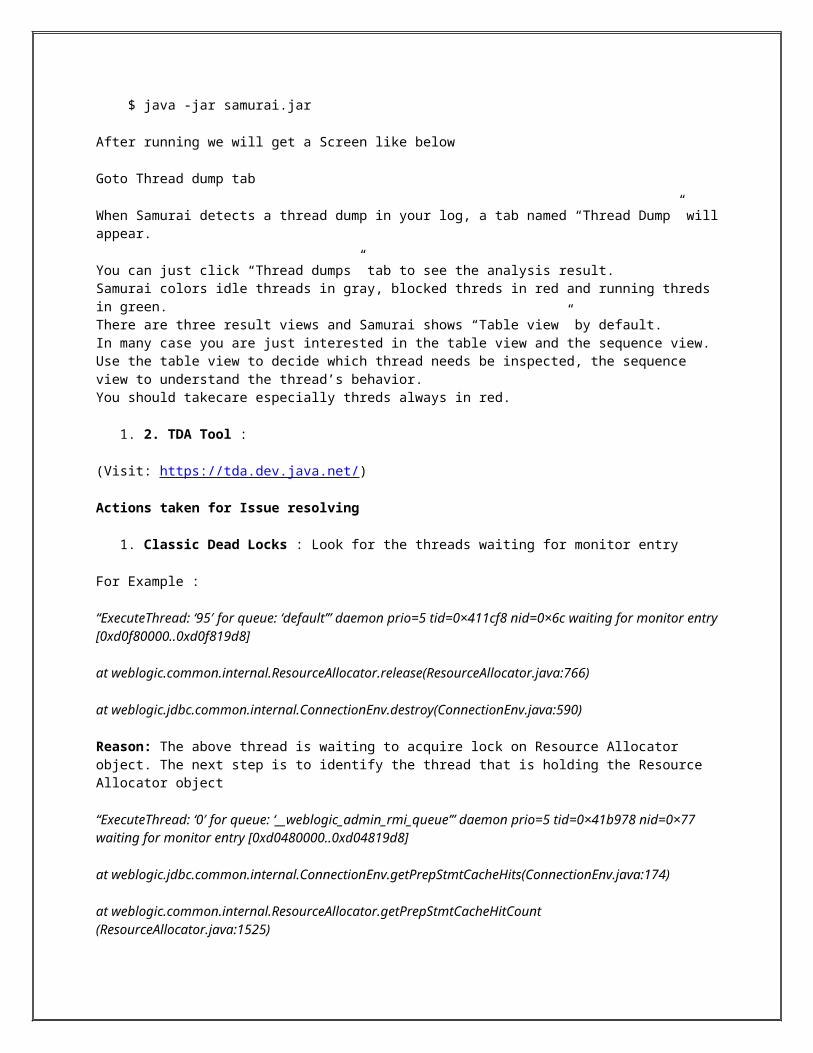
$ java -jar samurai.jar
After running we will get a Screen like below
Goto Thread dump tab
When Samurai detects a thread dump in your log, a tab named “Thread Dump” will appear.
You can just click “Thread dumps” tab to see the analysis result.Samurai colors idle threads in gray, blocked threds in red and running threds in green.There are three result views and Samurai shows “Table view” by default.In many case you are just interested in the table view and the sequence view. Use the table view to decide which thread needs be inspected, the sequence view to understand the thread’s behavior.You should takecare especially threds always in red.
1. 2. TDA Tool :
(Visit: https://tda.dev.java.net/)
Actions taken for Issue resolving
1. Classic Dead Locks : Look for the threads waiting for monitor entry
For Example :
“ExecuteThread: ‘95′ for queue: ‘default’” daemon prio=5 tid=0×411cf8 nid=0×6c waiting for monitor entry [0xd0f80000..0xd0f819d8]
at weblogic.common.internal.ResourceAllocator.release(ResourceAllocator.java:766)
at weblogic.jdbc.common.internal.ConnectionEnv.destroy(ConnectionEnv.java:590)
Reason: The above thread is waiting to acquire lock on Resource Allocator object. The next step is to identify the thread that is holding the Resource Allocator object
“ExecuteThread: ‘0′ for queue: ‘__weblogic_admin_rmi_queue’” daemon prio=5 tid=0×41b978 nid=0×77 waiting for monitor entry [0xd0480000..0xd04819d8]
at weblogic.jdbc.common.internal.ConnectionEnv.getPrepStmtCacheHits(ConnectionEnv.java:174)
at weblogic.common.internal.ResourceAllocator.getPrepStmtCacheHitCount (ResourceAllocator.java:1525)
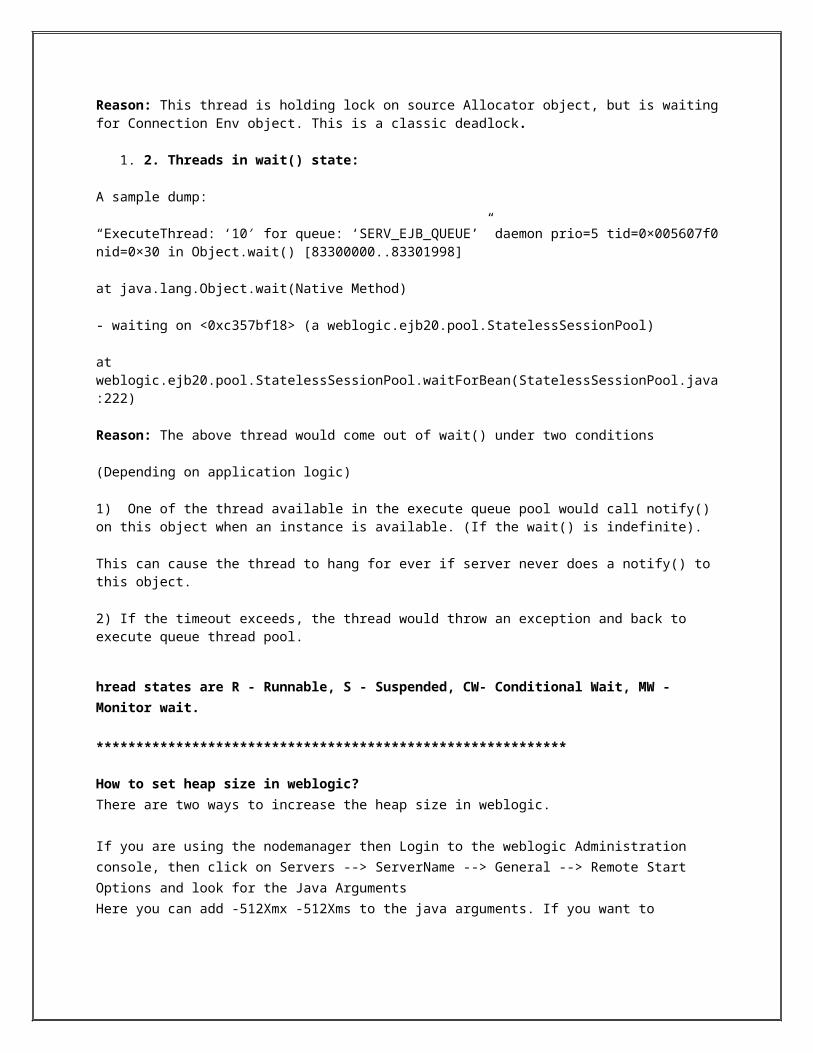
Reason: This thread is holding lock on source Allocator object, but is waiting for Connection Env object. This is a classic deadlock.
1. 2. Threads in wait() state:
A sample dump:
“ExecuteThread: ‘10′ for queue: ‘SERV_EJB_QUEUE’” daemon prio=5 tid=0×005607f0 nid=0×30 in Object.wait() [83300000..83301998]
at java.lang.Object.wait(Native Method)
- waiting on <0xc357bf18> (a weblogic.ejb20.pool.StatelessSessionPool)
at weblogic.ejb20.pool.StatelessSessionPool.waitForBean(StatelessSessionPool.java:222)
Reason: The above thread would come out of wait() under two conditions
(Depending on application logic)
1) One of the thread available in the execute queue pool would call notify() on this object when an instance is available. (If the wait() is indefinite).
This can cause the thread to hang for ever if server never does a notify() to this object.
2) If the timeout exceeds, the thread would throw an exception and back to execute queue thread pool.
hread states are R - Runnable, S - Suspended, CW- Conditional Wait, MW - Monitor wait.
***********************************************************
How to set heap size in weblogic? There are two ways to increase the heap size in weblogic.
If you are using the nodemanager then Login to the weblogic Administration console, then click on Servers --> ServerName --> General --> Remote Start Options and look for the Java Arguments Here you can add -512Xmx -512Xms to the java arguments. If you want to increase the heap size then alter these values from 512 to 1024 depending on your requirements.
If you do not have a nodemanager configured. Login the operating system , Under $domain_home/bin directory look for setDomainEnv.sh and add the following -512Xmx -512Xms to the java options.
These changes will require a restart of the JVM.
********************************************************************
8.What is perfomance tuning?how do you tune the perfomance step by step process ?Ans OS Level to our Application Level?
Ans:
Performance tuning WebLogic Server and your WebLogic Server application is a complex and iterative process.
Tuning allows you to adjust resources to achieve your performance objectives.
The following sections provide a tuning roadmap and tuning tips for you can use to improve system performance.
1. Understand Your Performance Objectives
2. Measure Your Performance Metrics 2.1. Monitor Disk and CPU Utilization
2.2. Monitor Data Transfers Across the Network
3. Locate Bottlenecks in Your System
4. Minimize Impact of Bottlenecks
Tune Your Application
Tune your DB
Tune WebLogic Server Performance Parameters
Tune Your JVM
Tune the Operating System
Tuning the WebLogic Persistent Store
5. Capacity Planning
*************************************************************************
Understand Your Performance Objectives
To determine your performance objectives, you need to understand the application deployed and the environmental constraints placed on the system. Gather information about the levels of activity that components of the application are expected to meet, such as:
§ The anticipated number of users.
§ The number and size of requests.
§ The amount of data and its consistency.
§ Determining your target CPU utilization.
Your target CPU usage should not be 100%, you should determine a target CPU utilization based on your application needs, including CPU cycles for peak usage. If your CPU utilization is optimized at 100% during normal load hours, you have no capacity to handle a peak load. In applications that are latency sensitive and maintaining the ability for a fast response time is important, high CPU usage (approaching 100% utilization) can reduce response times while throughput stays constant or even increases because of work queuing up in the server. For such applications, a 70% - 80% CPU utilization recommended. A good target for non-latency sensitive applications is about 90%.
Performance objectives are limited by constraints, such as
§ The configuration of hardware and software such as CPU type, disk size vs. disk speed, sufficient memory.
There is no single formula for determining your hardware requirements. The process of determining what type of hardware and software configuration is required to meet application needs adequately is called capacity planning. Capacity planning requires assessment of your system performance goals and an understanding of your application. Capacity planning for server hardware should focus on maximum performance requirements.
The ability to interoperate between domains, use legacy systems, support legacy data.
§ Development, implementation, and maintenance costs.
You will use this information to set realistic performance objectives for your application environment, such as response times, throughput, and load on specific hardware.Measure Your Performance Metrics
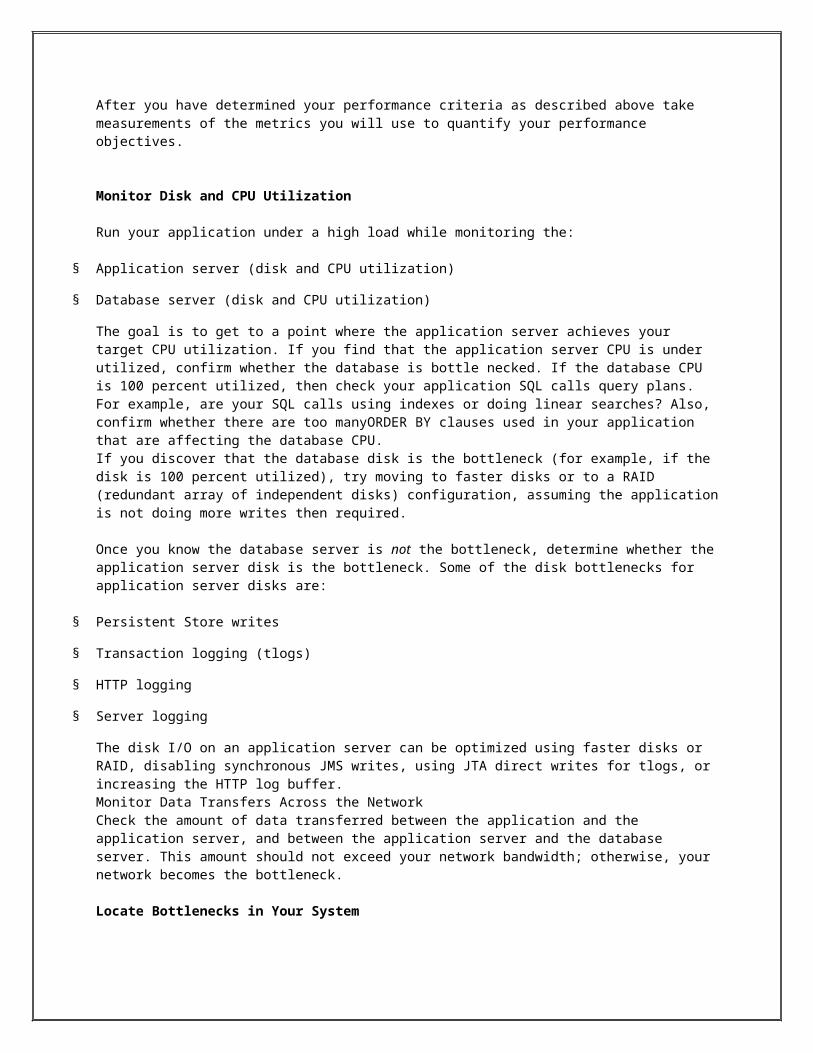
After you have determined your performance criteria as described above take measurements of the metrics you will use to quantify your performance objectives.
Monitor Disk and CPU Utilization
Run your application under a high load while monitoring the:
§ Application server (disk and CPU utilization)
§ Database server (disk and CPU utilization)
The goal is to get to a point where the application server achieves your target CPU utilization. If you find that the application server CPU is under utilized, confirm whether the database is bottle necked. If the database CPU is 100 percent utilized, then check your application SQL calls query plans. For example, are your SQL calls using indexes or doing linear searches? Also, confirm whether there are too manyORDER BY clauses used in your application that are affecting the database CPU. If you discover that the database disk is the bottleneck (for example, if the disk is 100 percent utilized), try moving to faster disks or to a RAID (redundant array of independent disks) configuration, assuming the application is not doing more writes then required.
Once you know the database server is not the bottleneck, determine whether the application server disk is the bottleneck. Some of the disk bottlenecks for application server disks are:
§ Persistent Store writes
§ Transaction logging (tlogs)
§ HTTP logging
§ Server logging
The disk I/O on an application server can be optimized using faster disks or RAID, disabling synchronous JMS writes, using JTA direct writes for tlogs, or increasing the HTTP log buffer.Monitor Data Transfers Across the NetworkCheck the amount of data transferred between the application and the application server, and between the application server and the database server. This amount should not exceed your network bandwidth; otherwise, your network becomes the bottleneck.
Locate Bottlenecks in Your System
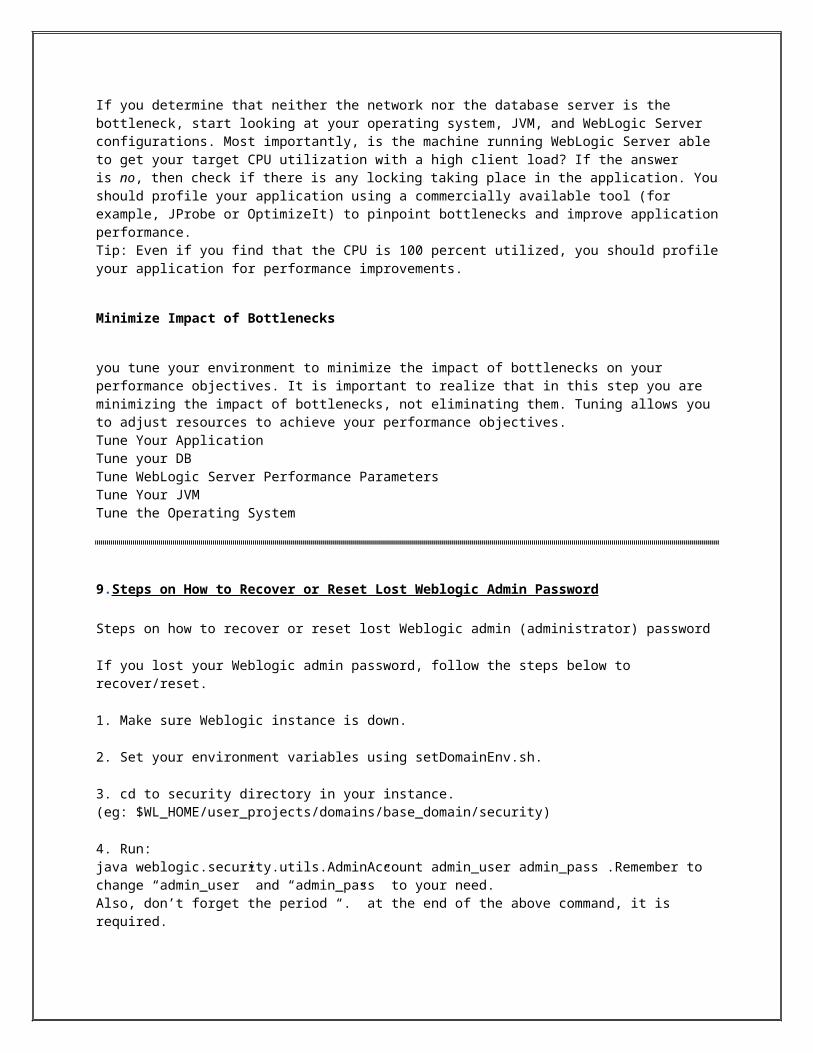
If you determine that neither the network nor the database server is the bottleneck, start looking at your operating system, JVM, and WebLogic Server configurations. Most importantly, is the machine running WebLogic Server able to get your target CPU utilization with a high client load? If the answer is no, then check if there is any locking taking place in the application. You should profile your application using a commercially available tool (for example, JProbe or OptimizeIt) to pinpoint bottlenecks and improve application performance.Tip: Even if you find that the CPU is 100 percent utilized, you should profile your application for performance improvements.
Minimize Impact of Bottlenecks
you tune your environment to minimize the impact of bottlenecks on your performance objectives. It is important to realize that in this step you are minimizing the impact of bottlenecks, not eliminating them. Tuning allows you to adjust resources to achieve your performance objectives.Tune Your ApplicationTune your DBTune WebLogic Server Performance ParametersTune Your JVMTune the Operating System
9.Steps on How to Recover or Reset Lost Weblogic Admin Password
Steps on how to recover or reset lost Weblogic admin (administrator) password
If you lost your Weblogic admin password, follow the steps below to recover/reset.
1. Make sure Weblogic instance is down.
2. Set your environment variables using setDomainEnv.sh.
3. cd to security directory in your instance.(eg: $WL_HOME/user_projects/domains/base_domain/security)
4. Run:java weblogic.security.utils.AdminAccount admin_user admin_pass .Remember to change “admin_user” and “admin_pass” to your need.Also, don’t forget the period “.” at the end of the above command, it is required.
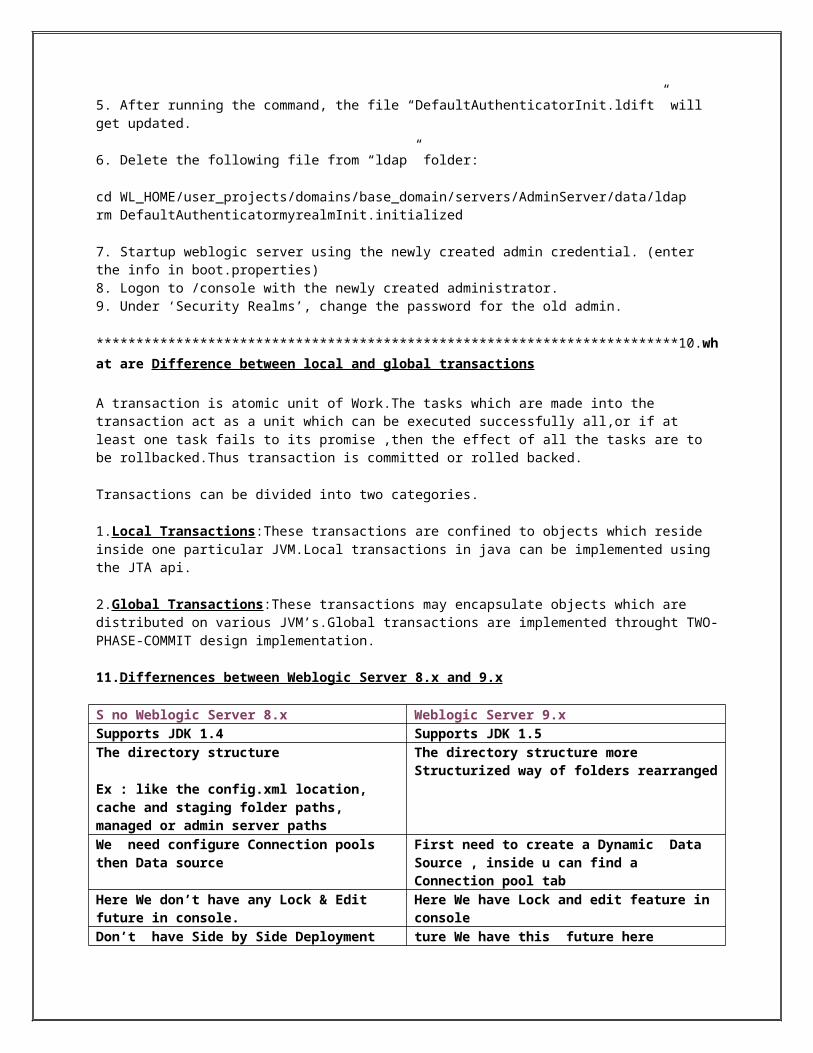
5. After running the command, the file “DefaultAuthenticatorInit.ldift” will get updated.
6. Delete the following file from “ldap” folder:
cd WL_HOME/user_projects/domains/base_domain/servers/AdminServer/data/ldaprm DefaultAuthenticatormyrealmInit.initialized
7. Startup weblogic server using the newly created admin credential. (enter the info in boot.properties)8. Logon to /console with the newly created administrator.9. Under ‘Security Realms’, change the password for the old admin.
*************************************************************************10.what are Difference between local and global transactions
A transaction is atomic unit of Work.The tasks which are made into the transaction act as a unit which can be executed successfully all,or if at least one task fails to its promise ,then the effect of all the tasks are to be rollbacked.Thus transaction is committed or rolled backed.
Transactions can be divided into two categories.
1.Local Transactions:These transactions are confined to objects which reside inside one particular JVM.Local transactions in java can be implemented using the JTA api.
2.Global Transactions:These transactions may encapsulate objects which are distributed on various JVM’s.Global transactions are implemented throught TWO-PHASE-COMMIT design implementation.
11.Differnences between Weblogic Server 8.x and 9.x
S no Weblogic Server 8.x Weblogic Server 9.xSupports JDK 1.4 Supports JDK 1.5The directory structure
Ex : like the config.xml location, cache and staging folder paths, managed or admin server paths
The directory structure more Structurized way of folders rearranged
We need configure Connection pools then Data source
First need to create a Dynamic Data Source , inside u can find a Connection pool tab
Here We don’t have any Lock & Edit future in console.
Here We have Lock and edit feature in console
Don’t have Side by Side Deployment feature
ture We have this future here
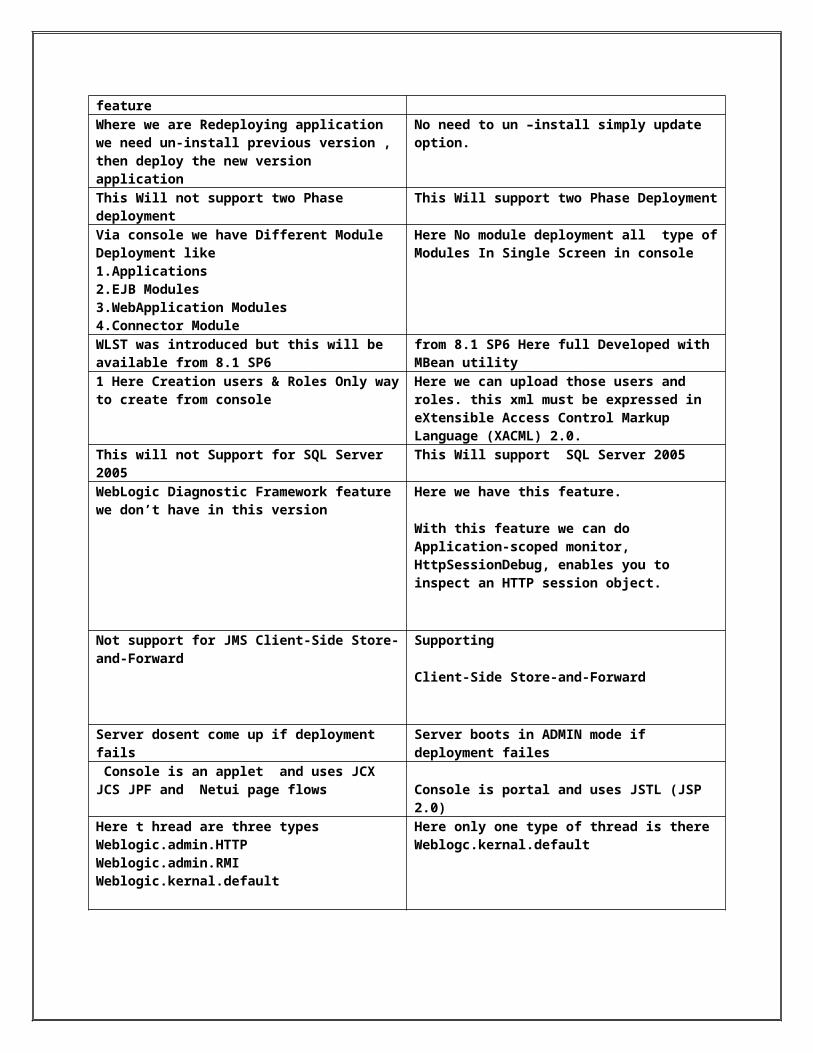
Where we are Redeploying application we need un-install previous version , then deploy the new version application
No need to un –install simply update option.
This Will not support two Phase deployment
This Will support two Phase Deployment
Via console we have Different Module Deployment like 1.Applications
Here No module deployment all type of Modules In Single Screen in console
2.EJB Modules3.WebApplication Modules4.Connector ModuleWLST was introduced but this will be available from 8.1 SP6
from 8.1 SP6 Here full Developed with MBean utility
1 Here Creation users & Roles Only way to create from console
Here we can upload those users and roles. this xml must be expressed ineXtensible Access Control Markup Language (XACML) 2.0.
This will not Support for SQL Server 2005
This Will support SQL Server 2005
WebLogic Diagnostic Framework feature we don’t have in this version
Here we have this feature.
With this feature we can doApplication-scoped monitor, HttpSessionDebug, enables you to inspect an HTTP session object.
Not support for JMS Client-Side Store-and-Forward
Supporting
Client-Side Store-and-Forward
Server dosent come up if deployment fails
Server boots in ADMIN mode if deployment failes
Console is an applet and uses JCX JCS JPF and Netui page flows Console is portal and uses JSTL (JSP 2.0)
Here t hread are three types Weblogic.admin.HTTPWeblogic.admin.RMIWeblogic.kernal.default
Here only one type of thread is there Weblogc.kernal.default
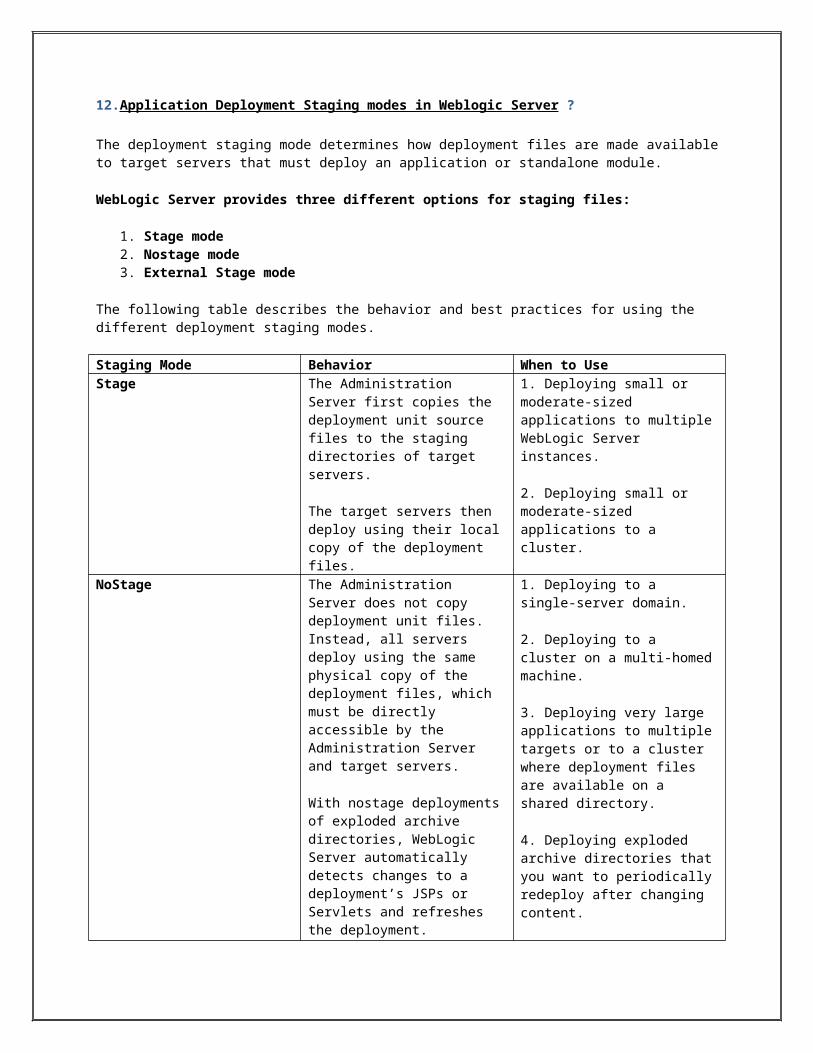
12.Application Deployment Staging modes in Weblogic Server ?
The deployment staging mode determines how deployment files are made available to target servers that must deploy an application or standalone module.
WebLogic Server provides three different options for staging files:
1. Stage mode2. Nostage mode3. External Stage mode
The following table describes the behavior and best practices for using the different deployment staging modes.
Staging Mode Behavior When to Use
Stage The Administration Server first copies the deployment unit source files to the staging directories of target servers.
The target servers then deploy using their local copy of the deployment files.
1. Deploying small or moderate-sized applications to multiple WebLogic Server instances.
2. Deploying small or moderate-sized applications to a cluster.
NoStage The Administration Server does not copy deployment unit files. Instead, all servers deploy using the same physical copy of the deployment files, which must be directly accessible by the Administration Server and target servers.
With nostage deployments of exploded archive directories, WebLogic Server automatically detects changes to a deployment’s JSPs or Servlets and refreshes the deployment.
1. Deploying to a single-server domain.
2. Deploying to a cluster on a multi-homed machine.
3. Deploying very large applications to multiple targets or to a cluster where deployment files are available on a shared directory.
4. Deploying exploded archive directories that you want to periodically redeploy after changing content.
5. Deployments that require dynamic update of selected Deployment Descriptors via the Administration Console.
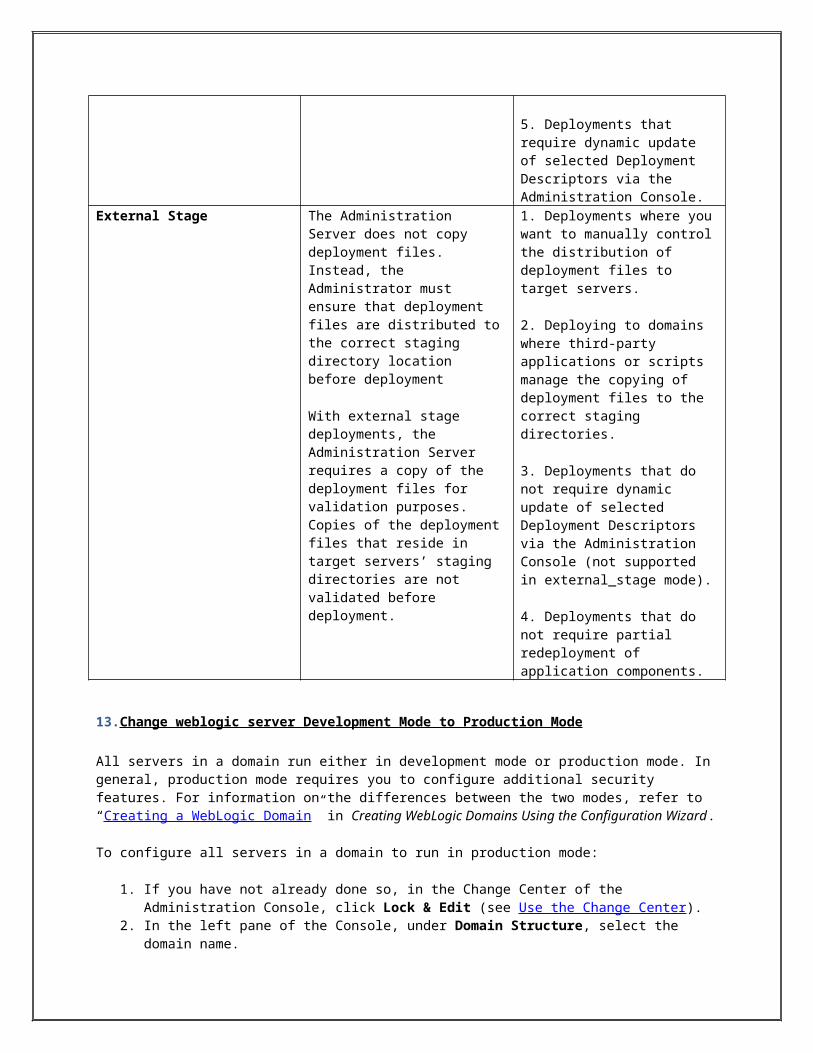
External Stage The Administration Server does not copy deployment files. Instead, the Administrator must ensure that deployment files are distributed to the correct staging directory location before deployment
With external stage deployments, the Administration Server requires a copy of the deployment files for validation purposes. Copies of the deployment files that reside in target servers’ staging directories are not validated before deployment.
1. Deployments where you want to manually control the distribution of deployment files to target servers.
2. Deploying to domains where third-party applications or scripts manage the copying of deployment files to the correct staging directories.
3. Deployments that do not require dynamic update of selected Deployment Descriptors via the Administration Console (not supported in external_stage mode).
4. Deployments that do not require partial redeployment
of application components.
13.Change weblogic server Development Mode to Production Mode
All servers in a domain run either in development mode or production mode. In general, production mode requires you to configure additional security features. For information on the differences between the two modes, refer to “Creating a WebLogic Domain” in Creating WebLogic Domains Using the Configuration Wizard.
To configure all servers in a domain to run in production mode:
1. If you have not already done so, in the Change Center of the Administration Console, click Lock & Edit (see Use the Change Center).
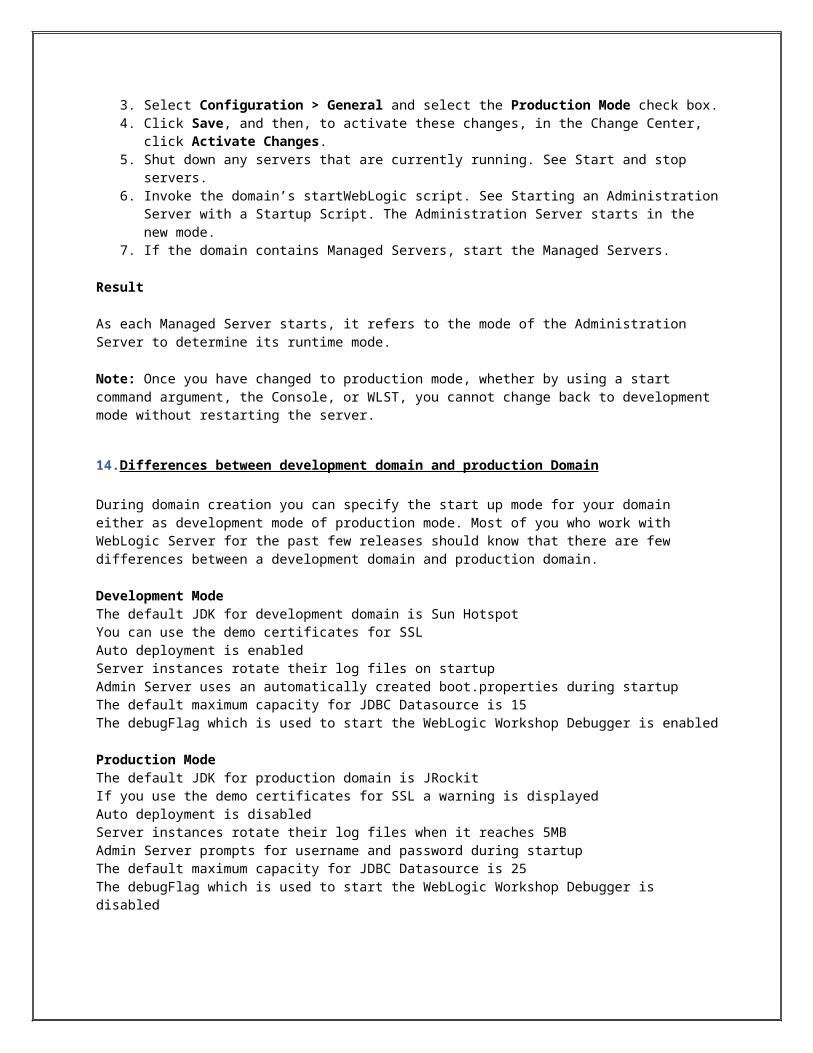
2. In the left pane of the Console, under Domain Structure, select the domain name.3. Select Configuration > General and select the Production Mode check box.4. Click Save, and then, to activate these changes, in the Change Center, click
Activate Changes.5. Shut down any servers that are currently running. See Start and stop servers.6. Invoke the domain’s startWebLogic script. See Starting an Administration Server with
a Startup Script. The Administration Server starts in the new mode. 7. If the domain contains Managed Servers, start the Managed Servers.
Result
As each Managed Server starts, it refers to the mode of the Administration Server to determine its runtime mode.
Note: Once you have changed to production mode, whether by using a start command argument, the Console, or WLST, you cannot change back to development mode without restarting the server.
14.Differences between development domain and production Domain
During domain creation you can specify the start up mode for your domain either as development mode of production mode. Most of you who work with WebLogic Server for the past few releases should know that there are few differences between a development domain and production domain.
Development ModeThe default JDK for development domain is Sun HotspotYou can use the demo certificates for SSLAuto deployment is enabledServer instances rotate their log files on startupAdmin Server uses an automatically created boot.properties during startupThe default maximum capacity for JDBC Datasource is 15The debugFlag which is used to start the WebLogic Workshop Debugger is enabled
Production ModeThe default JDK for production domain is JRockitIf you use the demo certificates for SSL a warning is displayed
Auto deployment is disabledServer instances rotate their log files when it reaches 5MBAdmin Server prompts for username and password during startupThe default maximum capacity for JDBC Datasource is 25The debugFlag which is used to start the WebLogic Workshop Debugger is disabled
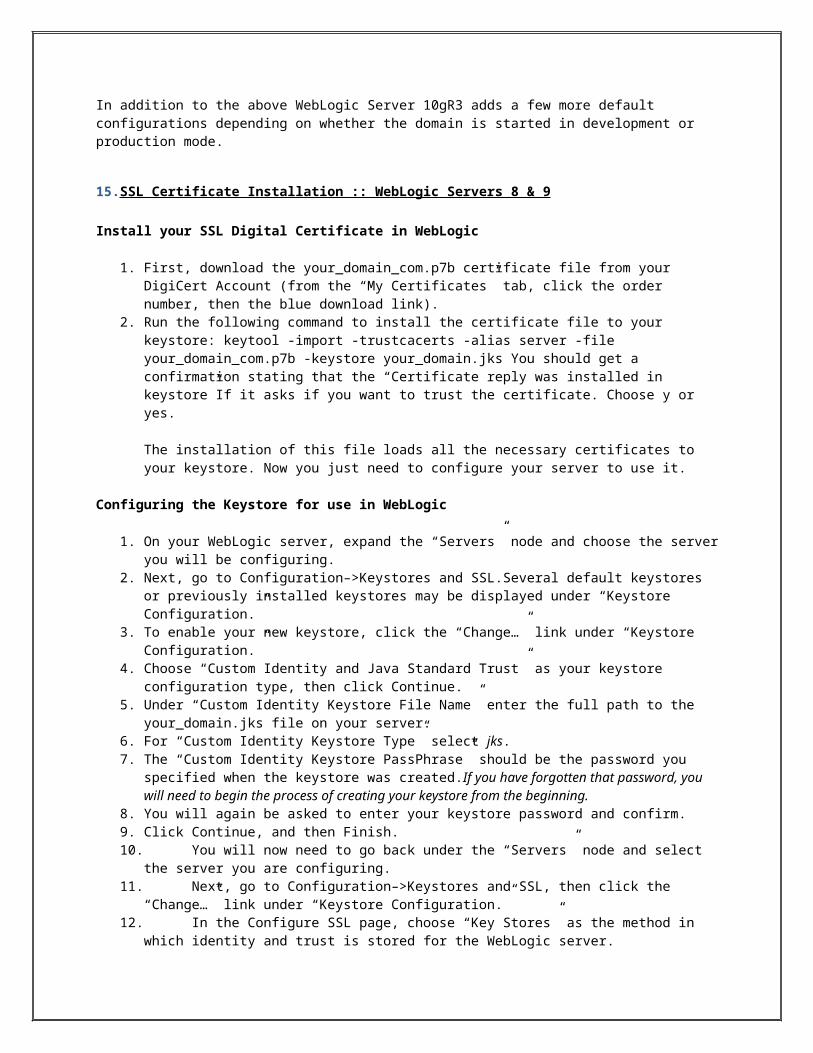
In addition to the above WebLogic Server 10gR3 adds a few more default configurations depending on whether the domain is started in development or production mode.
15.SSL Certificate Installation :: WebLogic Servers 8 & 9
Install your SSL Digital Certificate in WebLogic
1. First, download the your_domain_com.p7b certificate file from your DigiCert Account (from the “My Certificates” tab, click the order number, then the blue download link).
2. Run the following command to install the certificate file to your keystore: keytool -import -trustcacerts -alias server -file your_domain_com.p7b -keystore your_domain.jks You should get a confirmation stating that the “Certificate reply was installed in keystore”If it asks if you want to trust the certificate. Choose y or yes.
The installation of this file loads all the necessary certificates to your keystore. Now you just need to configure your server to use it.
Configuring the Keystore for use in WebLogic
1. On your WebLogic server, expand the “Servers” node and choose the server you will be configuring.
2. Next, go to Configuration–>Keystores and SSL.Several default keystores or previously installed keystores may be displayed under “Keystore Configuration.”
3. To enable your new keystore, click the “Change…” link under “Keystore Configuration.”
4. Choose “Custom Identity and Java Standard Trust” as your keystore configuration type, then click Continue.
5. Under “Custom Identity Keystore File Name” enter the full path to the your_domain.jks file on your server.
6. For “Custom Identity Keystore Type” select jks.7. The “Custom Identity Keystore PassPhrase” should be the password you specified
when the keystore was created.If you have forgotten that password, you will need to begin the process of creating your keystore from the beginning.
8. You will again be asked to enter your keystore password and confirm.9. Click Continue, and then Finish.10. You will now need to go back under the “Servers” node and select the server you are
configuring.11. Next, go to Configuration–>Keystores and SSL, then click the “Change…” link under
“Keystore Configuration.”12. In the Configure SSL page, choose “Key Stores” as the method in which identity and
trust is stored for the WebLogic server.13. Specify the “Private Key Alias” and “Passphrase” that were used when creating your
keystore.If you followed our instructions or used our command generator, “server” is your alias. The passphrase is the keystore password.
14. Click Continue, then Finish.Reboot the WebLogic server. Your keystore should now be installed and enabled
SSL Configuration on WebLogic Server 9.2 on solaris
Generate private Key : (Identity Key)
keytool -genkey -keyalg RSA -alias privkey -keystore yourdomain-private.jks
Generate CSR certificate :
keytool -certreq -v -alias privkey -keystore yourdomain-private.jks
Send CSR certificate to the SSL Vendor.
The Server certificate, Root CA, Intermediate certificate and CA Chain certificate will be sent to you.
Combine three certificates into one certificate in the same order as below :
Public.cert (Server Certificate we received in the name of number.crt)
Intermediate.cert(Intermediate Certificate)
Root.cert ( Root CA Certificate)
Save these three certificates into one file yourdomain.crt
Import yourdomain.crt file into yourdomain-private.jks
keytool -import -alias privkey -file yourdomain.crt -keystore yourdomain-private.jks -trustcacerts
keytool -list -v -keystore yourdomain-private.jks (To check the certificate is imported properly or not)
Import Trust identity (Trusted Root certificate)
keytool -import -alias yourdomain -file RootCA.crt -keystore yourdomaintrust.jks -trustcacerts
keytool -list -v -keystore yourdomaintrust.jks ( To check the certificate is imported properly or not)
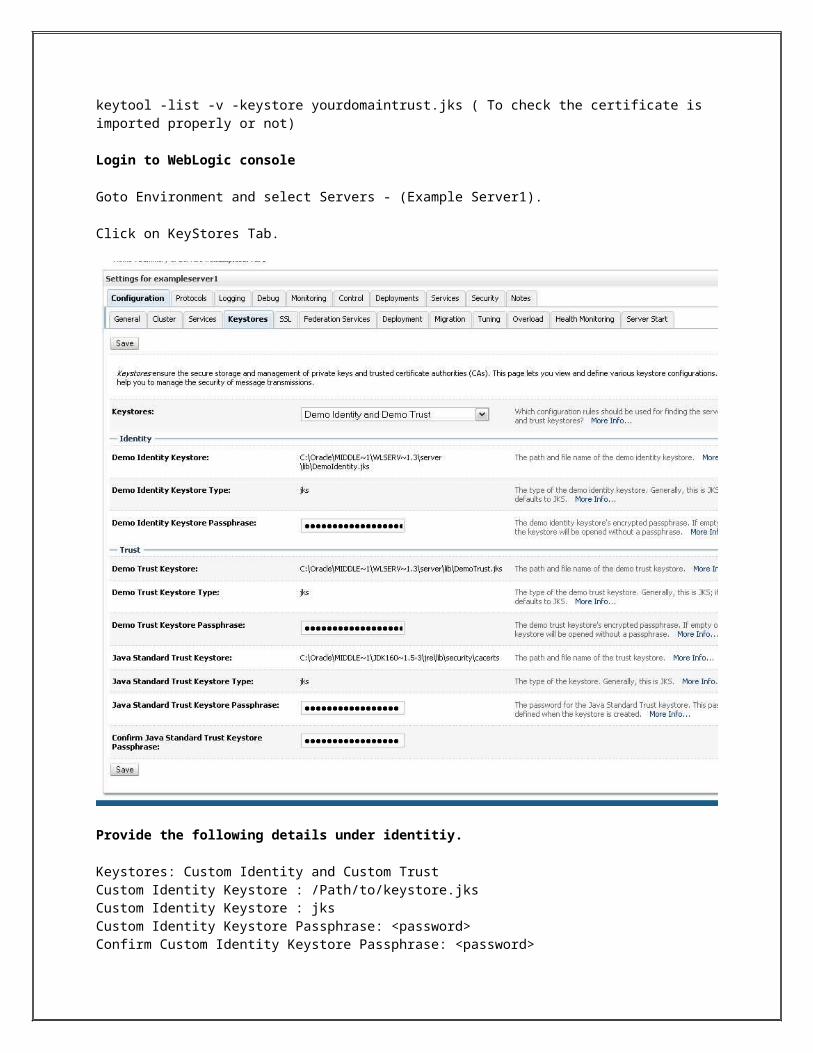
Login to WebLogic console
Goto Environment and select Servers - (Example Server1).
Click on KeyStores Tab.
Provide the following details under identitiy.
Keystores: Custom Identity and Custom TrustCustom Identity Keystore : /Path/to/keystore.jksCustom Identity Keystore : jksCustom Identity Keystore Passphrase: <password> Confirm Custom Identity Keystore Passphrase: <password>
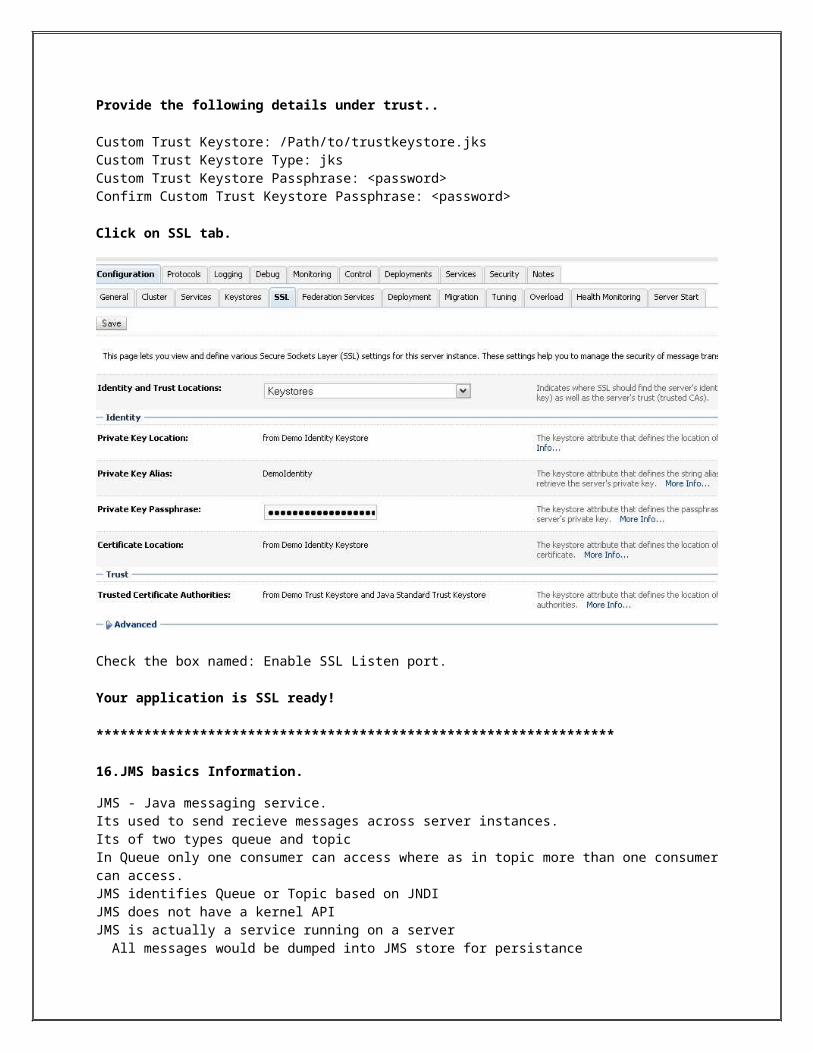
Provide the following details under trust..
Custom Trust Keystore: /Path/to/trustkeystore.jksCustom Trust Keystore Type: jksCustom Trust Keystore Passphrase: <password>Confirm Custom Trust Keystore Passphrase: <password>
Click on SSL tab.
Check the box named: Enable SSL Listen port.
Your application is SSL ready!
*****************************************************************
16.JMS basics Information.
JMS - Java messaging service.Its used to send recieve messages across server instances.Its of two types queue and topicIn Queue only one consumer can access where as in topic more than one consumer can access. JMS identifies Queue or Topic based on JNDIJMS does not have a kernel APIJMS is actually a service running on a server All messages would be dumped into JMS store for persistanceIf JMS server is down no failover of loadbalancing is possible as its a pinned serviceIn weblogic 9/10 queue/connection factory are stored in JMS modules.JMS modules are deploymed using subdeployment on the serverOn.message is used to communicate back to the publisher in Async method
JMS Queue typePoint to Point Queue:Only one receiver will receive the message.Publish-Subscript topics decouples producers from consumersA JMS client can use JTA to participate in a distributed transaction
Administrative tasks JMS
1. Creating and maintiaing JMS server
2. Create connection factories
3. Monitoring desitinations
4. Creating JMS stores
5. Configure thresholds and quotas
6. Configur durable subscriptions
7. Manage JMS server failover
JMS configuration is defined by an XML schema file that conforms to the weblogic-jmsmd.xsd schema
An administrator can make and manage JMS modules as
Global System resources
Global standalone modules
Module packages as an enterprise application
Connection factory is stored in JNDI.
By default subscribers are non durable but we can register durable subscriptions
**************************************************************
17.how to view the log file in unix with example ?
This example displays only last 50 lines of /var/log/messages file. Change 50 to 100 to display the last 100 lines of the log file.
Syntax: tail -n N FILENAME
$ tail -n 50 /var/log/messages
This is probably one of the most used command by sysadmins.To view a growing log file and see only the newer contents use tail -f as shown below.
The following example shows the content of the /var/log/syslog command in real-time.
Syntax: tail -f FILENAME
$ tail -f /var/log/syslog
Changing file permissions and attributes
chmod 755 file Changes the permissions of file to be rwx for the owner, and rx for
the group and the world. (7 = rwx = 111 binary. 5 = r-x = 101 binary)chgrp user file Makes file belong to the group user.chown cliff file Makes cliff the owner of file.chown -R cliff dir Makes cliff the owner of dir and everything in its directory tree.
Viewing and editing files:
cat filename Dump a file to the screen in ascii. more filename Progressively dump a file to the screen: ENTER = one line down SPACEBAR = page down q=quitless filename Like more, but you can use Page-Up too. Not on all systems. vi filename Edit a file using the vi editor. All UNIX systems will have vi in some form. emacs filename Edit a file using the emacs editor. Not all systems will have emacs. head filename Show the first few lines of a file.head -n filename Show the first n lines of a file.tail filename Show the last few lines of a file.tail -n filename Show the last n lines of a file.
**************************************************************
18. What is there in access log?
The server access log records all requests processed by the server. The location and content of the access log are controlled by the CustomLog directive. The LogFormat directive can be used to simplify the selection of the contents of the logs. This section describes how to configure the server to record information in the access log.
The access log file contains ip address of where the request,Request MethodName,Rquest URI,Protocol Version Numberand status codes
192.168.1.7—[26/aug/2011:8:31:18:18-0600]”post/benefits/servlet http/1.1 200 264 “
192.168.1.7___________ipaddress where the request getting
[26/aug/2011:8:31:18:18-0600]_______time stamp when we get the request
Post_________request method Name
benefits/servlet_______request uri
http/1.1___________http protocol number used by the server
200 264_________________status codes
1xx______________Information Message
2xx_____________Indicate success
3xx__________redirecting the client
4xx___________failure due to client
5xx___________failure due to Server
The location of the access file is :
C:\Program Files\Apache Software Foundation\Apache2.2\logs\ access
***********************************************************
19.What is server log in weblogic ?
The server log records information about events such as the startup and shutdown of servers, the deployment of new applications, or the failure of one or more subsystems. The messages include information about the time and date of the event as well as the ID of the user who initiated the event.
You can view and sort these server log messages to detect problems, track down the source of a fault, and track system performance. You can also create client applications that listen for these messages and respond automatically. For example, you can create an application that listens for messages indicating a failed subsystem and sends email to a system administrator.
In the left pane of the Administration Console, expand the Servers folder and select the server. (See Figure 70-8 .)
In the right pane, select—>Logging —>Server.
In the File Name box, enter a path and filename for the server log.
Enter an absolute pathname or a pathname that is relative to the server's root directory. If you use the Node Manager to start a Managed Server, the root directory is located on the computer that hosts the Node Manager process. For more information, refer to "A Server's Root Directory."
For information about including a time stamp in the server log's file name, refer to Rotating Log Files.
Click Apply to apply your changes.
Restart the server.
The server writes all subsequent domain messages to the new file.
C:\bea\user_projects\domains\dev_test\servers\AdminServer\logs
Log file name is AdminServer.log00017
Here AdminServer is the name of the Admin Server
C:\bea\user_projects\domains\dev_test\servers\ms2\logs
Log file name ms2, Here ms2 is name of the Managed server
*************************************************************
20.Data Source Configuration in weblogic?
Data sources provide Database access and connection management.
Steps to create Data Source :
1. In Administration Console, click Lock & Edit2. In the Domain Structure tree, expand Services > JDBC, then select Data
Sources.3. On the Summary of Data Sources page, click New.4. Enter below details : Name , JNDI Name , Database Type , Database Driver then
click Next to continue.5. In Supports Global Transactions select “two-Phase Commit” then click next 6. Enter below Details : Database Name , Host Name , Port , Database User Name
, Password/Confirm Password , Click Next to continue.7. For Test Database Connection , click Test Configuration then Click Next to
continue. .8. Then Click to Finish finally Activate changes.
****************************************************************
21.How to deploy an application through command line ?
open the shell prompt go to
C:\bea\wlserver_10.3\server\bin
And run setWLSEnv.cmd
After use weblogic.Deployer to deploy the application
Syntax :
Java weblogic.Deployer -adminurl <admin url> -username <username> -password <password> -name <ApplicationName> -targets <target server or cluster> -nostage -deploy <path of the source file>
*****************************************************************
22. What is OOM problem/memory leak,how to overcome this problem?
We Recommend These Resources
Permanent Generation
Class information is stored in the perm generation. Also constant strings are stored there. Strings created dynamically in your application with String.intern() will also be stored in the perm generation. Reflective objects (classes, methods, etc.) are stored in perm. It holds all of the reflective data for the JVM
JVM process memory
The windows task manager just shows the memory usage of the java.exe task/process. It is not unusual for the total memory consumption of the VM to exceed the value of -Xmx Managed Heap (java heap, PERM, code cache) + NativeHEAP + ThreadMemory <= 2GB (PAS on windows) Code-cache contains JIT code and hotspot code. ThreadMemory = Thread_stack_size*Num_threads.ManagedHeap: Managed by the developer. Java heap: This part of the memory is used when you create new java objects. Perm: for relfective calls etc. NativeHeap : Used for native allocations.ThreadMemory: used for thread allocations.
What you see in the TaskManager is the total PAS, while what the profiler shows is the Java Heap and the PERM(optionally)
Platforms Maximum PAS*
1. x86 / Redhat Linux 32 bit 2 GB2. x86 / Redhat Linux 64 bit 3 GB3. x86 / Win98/2000/NT/Me/XP 2 GB4. x86 / Solaris x86 (32 bit) 4 GB5. Sparc / Solaris 32 bit 4 GB
Why GC needs tuning
• • •
Limits of Vertical scaling
If F is the fraction of a calculation that is sequential (i.e. cannot benefit from parallelization), and (1 − F) is the fraction that can be parallelized, then the maximum speedup that can be achieved by using N processors is:
1------------ Amdahl's lawF + (1-F)/N
In the limit, as N -> infinity, the maximum speedup tends to 1/F. If F is only 10%, the problem can be sped up by only a maximum of a factor of 10, no matter how large the value of N used.
So we assume that there is a scope of leveraging benefits of multiple CPUs or multithreading.All right, enough of theory..........can it solve my problem??
Problem Statements
1. Application slow
Your application may be crawling because it's spending too much time cleaning up the garbage , rather than running the app.
Solution: Need to tune the JVM parameters. Take steps to Balance b/w pause and GC freq.
2. Consumes too much memoryThe memory footprint of the application is related to the number and size of the live objects that are in the JVM at any given point of time. This can be either due to valid objects that are required to stay in memory, or because programmer forgot to remove the reference to unwanted objects (typically known as 'Memory leaks' in java parlance. And as the memory footprint hits the threshold, the JVM throws the java.lang.OutOfMemoryError.
Normal 0
Java.lang.OutOfMemoryError can occur due to 3 possible reasons:
1. JavaHeap space low to create new objects . Increase by -Xmx (java.lang.OutOfMemoryError: Java heap space).java.lang.OutOfMemoryError: Java heap spaceMaxHeap=30528 KB TotalHeap=30528 KB FreHeap=170 KB UsedHeap=30357 KB
2. Permanent Generation low. Increase by XX:MaxPermSize=256m (java.lang.OutOfMemoryError: PermGen space)java.lang.OutOfMemoryError: PermGen spaceMaxHeap=65088 KB TotalHeap=17616 KB FreeHeap=9692 KB UsedHeap=7923 KB
Heap
def new generation total 1280K, used 0K [0x02a70000, 0x02bd0000, 0x02f50000)
eden space 1152K, 0% used [0x02a70000, 0x02a70000, 0x02b90000)
from space 128K, 0% used [0x02bb0000, 0x02bb0000, 0x02bd0000)
to space 128K, 0% used [0x02b90000, 0x02b90000, 0x02bb0000)
tenured generation total 16336K, used 7784K [0x02f50000, 0x03f44000, 0x06a70000)
the space 16336K, 47% used [0x02f50000, 0x036ea3f8, 0x036ea400, 0x03f44000)
compacting perm gen total 12288K, used 12287K [0x06a70000, 0x07670000, 0x07670000)
the space 12288K, 99% used [0x06a70000, 0x0766ffd8, 0x07670000, 0x07670000)
3. java.lang.OutOfMemoryError: .... Out of swap space ...
JNI Heap runs low on memory, even though the JavaHeap and the PermGen have memory. This typically happens if you are meking lots of heavy JNI calls, but the JavaHeap objects occupy little space. In that scenario the GC might not feel the urge to cleanup JavaHeap, while the JNI Heap keeps on increasing till it goes out of memory.
If you use java NIO packages, watch out for this issue. DirectBuffer allocation uses the native heap.
The NativeHeap can be increasded by -XX:MaxDirectMemorySize=256M (default is 128)
Diagnosis:
There are some starting points to diagnose the problem.You may start with the '-verbose:gc' flag on the java command and see the memory footprint as the application progresses, till you find a spike. You may analyze the logs or use a light profiler like JConsole (part of JDK) to check the memory graph. If you need the details of the objects that are occupying the memory at a certain point, then you may use JProfiler or AppPerfect which can provide the details of each object instance and all the in/out bound references to/from it. This is a memory intensive procedure and not meant for production systems. Depending upon your application, these heavy profilers can slow down the app upto 10 times.
Below are some of the ways you can zero-in on the issue.
A) GC outputs
-verbose:gc
This flag starts printing additional lines to the console, like given below

[GC 65620K -> 50747K(138432K), 0.0279446 secs][Full GC 46577K -> 18794K(126848K), 0.2040139 secs] Combined size of live objects before(young+tenured) GC -> Combined size of live objects(young+tenured) after GC (Total heap size, not counting the space in the permanent generation-XX:+PrintHeapAtGC : More details•-XX:+PrintGCTimeStamps will additionally print a time stamp at the start of each collection.111.042: [GC 111.042: [DefNew: 8128K->8128K(8128K), 0.0000505 secs]111.042: [Tenured: 18154K->2311K(24576K), 0.1290354 secs]26282K->2311K(32704K), 0.1293306 secs]The collection starts about 111 seconds into the execution of the application. The tenured generation usage was reduced to about 10%18154K->2311K(24576K) B) hprof output file
java –Xrunhprof:heap=sites,cpu=samples,depth=10,thread=y,doe=yThe heap=sites tells the profiler to write information about memory utilization on the heap, indicating where it was allocated.cpu=samples tells the profiler to do statistical sampling to determine CPU use.depth=10 indicates the depth of the trace for threads.thread=y tells the profiler to identify the threads in the stack traces.doe=y tells the profiler to produce dump of profiling data on exit.
C) -XX:+HeapDumpOnOutOfMemoryError -XX:HeapDumpPath=C:\OOM.txt
Dump the heap on OOM, and then analyze the OOM.txt (Binary file) with jhat tool (bundled with JDK)
The command below will launch http server @port 7777 . Open a browser with the URL 'http://localhost:7777' to see the results.
jhat -port 7777 c:\OOM.txt
D) Profiling the app
Normal 0
You can profile the application to figure out Memory Leaks.
Java memory leaks (or what we like to call unintentionally retained objects), are often caused by saving an object reference in a class level collection and forgetting to remove it at the proper time. The collection might be storing 100 objects, out of which 95 might never be used. So in this case those 95 objects are creating the memory leak, since the GC cannot free them as they are referenced by the collection.
There are also other kinds of problems with managing resources that impact performance, such as not closing JDBC Statements/ResultSets in a finally block (many JDBC drivers store a Statement reference in the Connection object).
A java "memory leak" is more like holding a strong reference to an object though it would never be needed anymore. The fact that you hold a strong reference to an object prevents the GC from deallocating it.. Java "memory leaks" are objects that fall into category (2). Objects that are reachable but not "live" can be considered memory leaks.
JVMPI for Profiling applications give a high level of detailingProfilers: Hprof, JConsole, JProfiler, AppPerfect, YourKit, Eclipse Profiler, NetBeans Profiler ,JMP, Extensible Java Profiler (EJP), TomcatProbe, Profiler4j
JConsole is good for summary level info, tracking the memory footprint, checking Thread deadlocks etc. It does not provide details of the Heap object. For Heap details you may use AppPerfect (licensed) or JProfiler.
E) For NativeHeap issues.....
JRockit JDK (from BEA) provides better tools than the SUN JDK to peep inside the JNI Heap(atleast on Windows).
JRockt Runtime Analyzer ...this is part of the jrockit install.jrcmd PSID print_memusageJRMC.exe ...launch from /bin and start recording.
Try to get some Solution:
Based on the findings from the diagnosis, you may have to take these actions:
1. Code change - For memory leak issues, it has to be a code change.2. JVM parameters tuning - You need to find the behavior of your app in terms of the
ratio of young to old objects, and then tune the JVM accordingly. We ll talk abt when to tune a parameter as we discuss the relevant params below.
Memory parameters:
Memory Size: overall size, individual region sizes
-ms, -Xms sets the initial heap size (young and tenured generation ONLY, NOT Permanent)
If the app starts with a large memory footprint, then you should set the initial heap to a large value so that the JVM does not consume cycles to keep expanding the heap.
-mx, -Xmxsets the maximum heap size(young and tenured gen ONLY,NOT Perm) (default: 64mb)
This is the most frequently tuned parameter to suit the max memory requirements of the app. A low value overworks the GC so that it frees space for new objects to be created, and may lead to OOM. A very high value can starve other apps and induce swapping. Hence, Profile the memory requirements to select the right value.
-XX:PermSize=256 -XX:MaxPermSize=256m
MaxPermSize default value (32mb for -client and 64mb for -server)Tune this to increase the Permanent gereration max size.
3. GC parameters:
-Xminf [0-1], -XX:MinHeapFreeRatio [0-100]
sets the percentage of minimum free heap space - controls heap expansion rate
-Xmaxf [0-1], -XX:MaxHeapFreeRatio [0-100]
sets the percentage of maximum free heap space - controls when the VM will return unused heap memory to the OS
-XX:NewRatio
sets the ratio of the old and new generations in the heap. A NewRatio of 5 sets the ratio of new to old at 1:5, making the new generation occupy 1/6th of the overall heapdefaults: client 8, server 2
-XX:SurvivorRatio
sets the ratio of the survivor space to the eden in the new object area. A SurvivorRatio of 6 sets the ratio of the three spaces to 1:1:6, making each survivor space 1/8th of the new object region
Garbage Collector Tuning:
Types of GarbageCollectors (not complete list)
1. Throughput collector: (default for Server JVM)•parallel version of the young generation collector.•-XX:+UseParallelGC•The tenured gc is the same as the serial collector (default GC for client JVM).•multiple threads to execute a minor collection•application has a large number of threads allocating objects / large Eden•-XX:+UseParallelOldGC (major also in parallel)
2. Concurrent low pause collector :•collects the tenured generation and does most of the collection concurrently with the execution of the application. Attempts to reduce the pause times needed to collect the tenured generation•-Xincgc™ or -XX:+UseConcMarkSweepGC•The application is paused for short periods during the collection. A parallel version of the young generation copying collector is used with the concurrent collector.•Multiprocessor; apps that have a relatively large set of long-lived data (a large tenured generation;•Apps where response time is more important than overall throughput e.g. JAVA_OPTS= -Xms128M -Xmx1024M -XX:NewRatio=1 -verbose:gc -XX:+PrintGCDetails -XX:+PrintGCTimeStamps -Xloggc:E:\loggc.txt
FlipSide: Synchronization overhead, Fragmentation
Performance Solution
1. Application Software profiling2. Server and JVM tuning3. Right Hardware and OS4. Code improvement as per the Behaviour of your application & profiling results….….
easier said than done5. Use JVM the right way : optimal JVM params6. Client / server application 7. •-XX:+UseParallelGC if u have multiprocessors
Some Tips
Unless you have problems with pauses, try granting as much memory as possible to the virtual machine
Setting -Xms and -Xmx to the same value ….but be sure about the application behaviour
Be sure to increase the memory as you increase the number of processors, since allocation can be parallelized
Don’t forget to tune the Perm generation Minimize the use of synchronization Use multithreading only if it benefits. Be aware of the thread overheads. e.g a simple
task like counter incrementing from 1 to billion ....use single thread. Multiple threads will ruin to mutiple of 10. I tested it out on dual CPU WinXP with 8 threads.
Avoid premature object creation. Creation should be as close to the actual place of use as possible. Very basic concept that we tend to overlook.
JSPs are generally slower than servlets. Too many custom CLs, reflection : increase Perm generation. Don't be PermGen-
agnostic. Soft References for memory leakages. They enable smart caches and yet do not load
memory. GC will flush out SoftReferences automatically if the JVM runs low on memory.
StringBuffer instead of String concat Minimize JNI calls in your code XML APIs – be careful …SAX or DOM- make correct choice. Use precompiled xpaths
for better performance of the queries.
Conclusion:
There can be various bottlenecks for the entire application, and application JVM may be one of the culprits.There can be various reasons like JVM not tuned optimally to suit your application, Memory leakages, JNI issues etc. They need to be diagnosed, analyzed and then fixed.
Weblogic 10.3 Memory Leaks
After having to work with Weblogic 8.1 / jdk 1.4 for 3 months again, I had now the chance to port our application to Weblogic 10.3. Which went extremly smoothly,apart from some minor annoyances from ejbgen (Internal NullPointerException without telling what went wrong :( ).
Then I tried to redeploy the application a few times and got a OutOfMemoryException (PermGen) :( I had hoped to finally be able to redeploy infinitely without having to restart the server. But no luck. The server kept loosing about 30MB for each redeploy. Using the
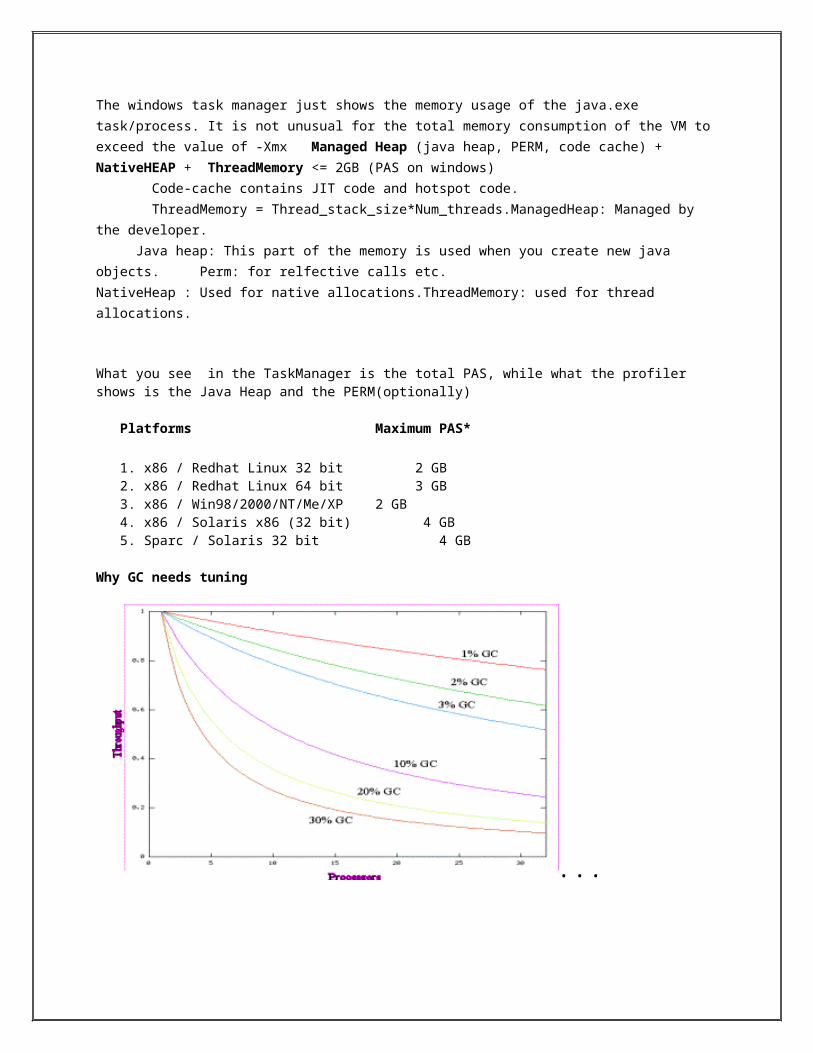
great work from Frank Kievit (http://blogs.sun.com/fkieviet/entry/how_to_fix_the_dreaded) I tried to find out what was happening.
And this is the result:
System Class Reference :--> class sun.rmi.transport.proxy.RMIDirectSocketFactory (84 bytes) (??:) exclude--> class java.rmi.server.RMISocketFactory (84 bytes) (static field defaultSocketFactory:) exclude--> sun.rmi.transport.proxy.RMIMasterSocketFactory@0x51655f8 (24 bytes) (??:) exclude--> class sun.rmi.transport.proxy.RMIMasterSocketFactory (84 bytes) (static field proxyLog:) exclude--> sun.rmi.runtime.Log$LoggerLog@0x51655e0 (20 bytes) (??:) exclude--> class sun.rmi.runtime.Log$LoggerLog (84 bytes) (??:) exclude--> class sun.rmi.runtime.Log (84 bytes) (static field VERBOSE:) exclude--> java.util.logging.Level@0x5166028 (20 bytes) (??:) exclude--> class java.util.logging.Level (84 bytes) (static field known:) exclude--> java.util.ArrayList@0x5167c18 (20 bytes) (field elementData:) exclude--> [Ljava.lang.Object;@0x5a63e58 (160 bytes) (Element 15 of [Ljava.lang.Object;@0x5a63e58:) exclude--> com.bea.logging.LogLevel@0x5321270 (28 bytes) (??:) exclude--> class com.bea.logging.LogLevel (84 bytes) (??:) exclude--> sun.misc.Launcher$AppClassLoader@0x5161db8 (63 bytes) (field classes:) exclude--> java.util.Vector@0x51753d8 (24 bytes) (field elementData:) exclude--> [Ljava.lang.Object;@0x5d4b300 (40968 bytes) (Element 4604 of [Ljava.lang.Object;@0x5d4b300:) exclude--> class weblogic.j2ee.ApplicationManager (84 bytes) (static field APPCLASSLOADER_MANAGER:) exclude--> weblogic.application.internal.AppClassLoaderManagerImpl@0x5d3e610 (16 bytes) (field interAppCLMap:) exclude--> weblogic.utils.collections.WeakConcurrentHashMap@0x5d677e8 (48 bytes) (field table:) exclude--> [Lweblogic.utils.collections.WeakConcurrentHashMap$Entry;@0x5d7e268 (412 bytes) (Element 67 of [Lweblogic.utils.collections.WeakConcurrentHashMap$Entry;@0x5d7e268:) exclude--> weblogic.utils.collections.WeakConcurrentHashMap$Entry@0xf1fa700 (36 bytes) (field value:) exclude--> weblogic.utils.collections.WeakConcurrentHashMap@0xf1fa510 (48 bytes) (field table:) exclude--> [Lweblogic.utils.collections.WeakConcurrentHashMap$Entry;@0xf1fa560 (412 bytes) (Element 67 of [Lweblogic.utils.collections.WeakConcurrentHashMap$Entry;@0xf1fa560:) exclude--> weblogic.utils.collections.WeakConcurrentHashMap$Entry@0xf1fab50 (36 bytes) (field value:) exclude--> weblogic.utils.classloaders.GenericClassLoader@0xf1fa728 (71 bytes) (field parent:) exclude--> weblogic.utils.classloaders.GenericClassLoader@0xb0ed108 (71 bytes) exclude
The weblogic.application.internal.AppClassLoaderManagerImpl keeps a reference to the ear-classloader and therefor classes cannot be unloaded.The WeakConcurrentHashMap is called “weak” but it only seems to use the classloader as a weak key. But the value references the classloader as well. And as a strong reference. So it never gets garbage collected.
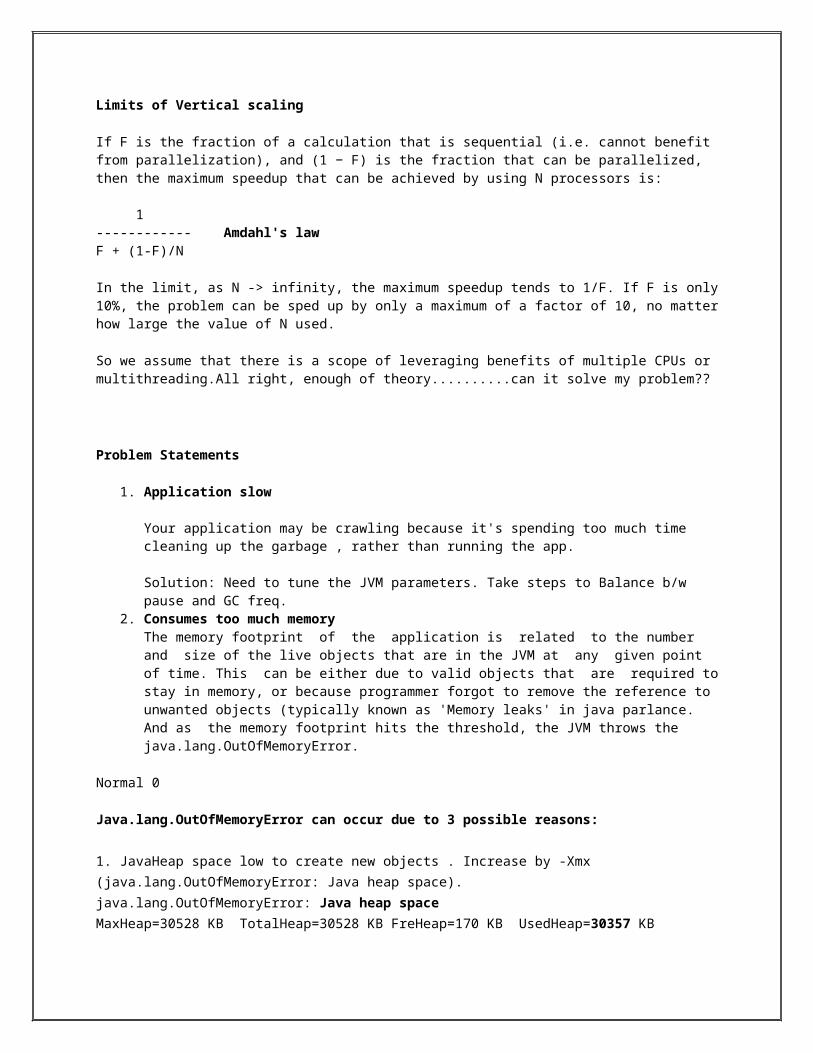
What to do about this? For development I decided not to care about breaking stuff:
public class SomeLifecycleListener extends ApplicationLifecycleListener {private void clearReferences() {try {Field declaredField = AppClassLoaderManagerImpl.class.getDeclaredField("interAppCLMap");declaredField.setAccessible(true);Map map = (Map) declaredField.get(AppClassLoaderManager.getAppClassLoaderManager());map.clear();} catch (Exception e) {e.printStackTrace();}}
@Overridepublic void postStop(ApplicationLifecycleEvent applicationlifecycleevent) throws ApplicationException {clearReferences();}}
So when the application is stopped, it simply clears the offending map. Which does not seem to cause problems (I still wouldn‘t use this in production or when multiple applications are deployed on the same server ;)
I hope Oracle manages to fix this in the next Weblogic release.
And for those who like pretty pictures:
Screenshot of jconsole before:
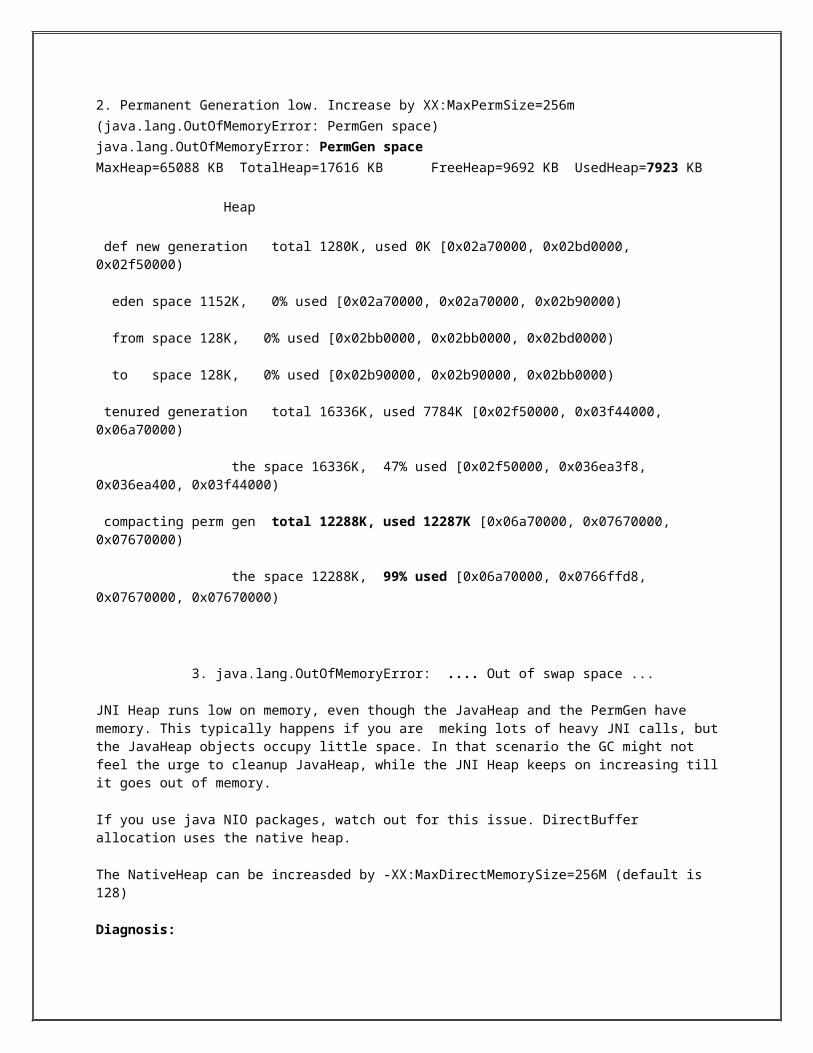
And after
the changes.After making these changes I was able to redeploy the application for a whole day without restarting the server :)
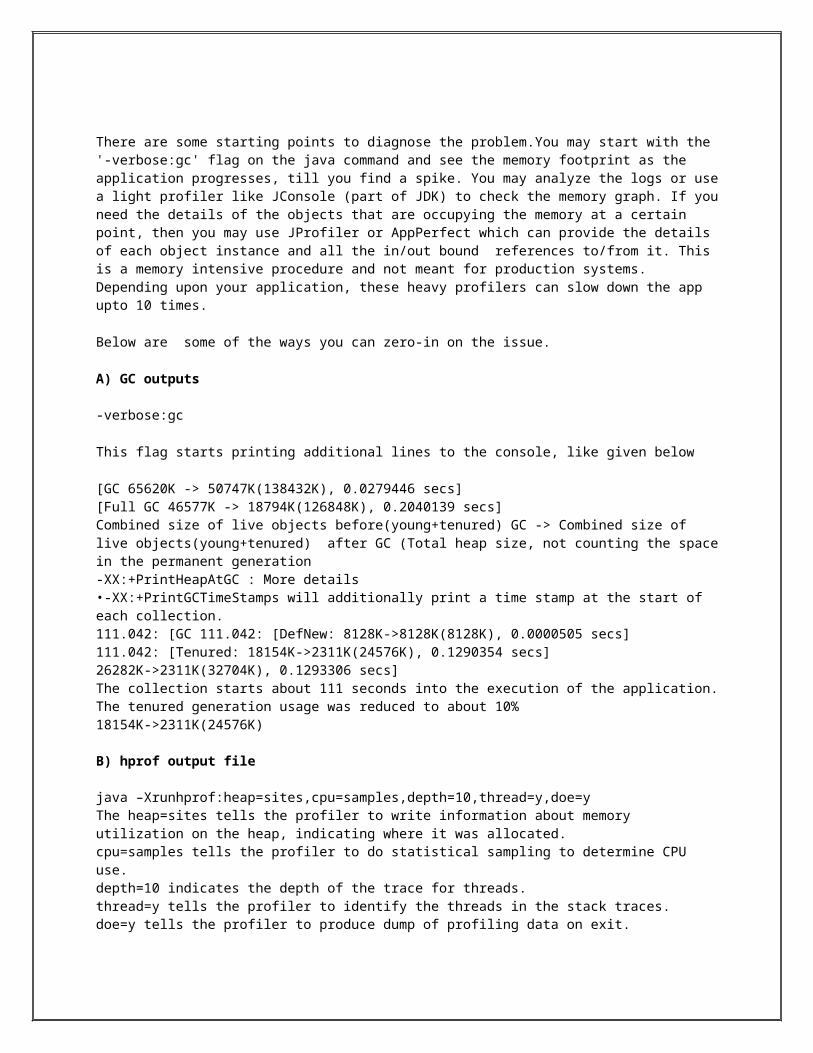
Connection pool leak using Hibernate 3.2.3 and Weblogic 10.3
This case study describes the complete steps from root cause analysis to resolution of a JDBC connection pool leak problem experienced with Oracle Weblogic 10.3 and using the open source Java persistence framework Hibernate 3.2.3.
This case study will also demonstrate the importance of best coding practices when using Hibernate and how a simple code problem can have severe consequences on a production environment.Environment specifications
Java EE server: Oracle Weblogic Portal 10
OS: AIX 5.3 TL9 64-bit
JDK: IBM JRE 1.6.0 SR2 64-bit
RDBMS: Oracle 11g
Persistence API: Hibernate 3.2.3
Platform type: Portal application
Monitoring and troubleshooting tools Enterprise internal remote JMX client monitoring tool
Problem overview
Problem type: JDBC Connection Pool Leak
JDBC Data Source Connection Pool depletion was observed in our production environment following an upgrade from Weblogic Portal 8.1 to Weblogic Portal 10.3.
Initial problem mitigation did involve restarting all the Weblogic managed servers almost every hour until decision was taken to rollback to the previous Weblogic Portal 8.1 environment.
Gathering and validation of facts
As usual, a Java EE problem investigation requires gathering of technical and non technical facts so we can either derived other facts and/or conclude on the root cause. Before applying a corrective measure, the facts below were verified in order to conclude on the root cause:
What is the client impact? HIGH Recent change of the affected platform? Yes, the application was migrated recently from
Weblogic Portal 8.1 to Weblogic Portal 10.3. Also, the application code was migrated from EJB Entity Beans to Hibernate for the read and write operations to the Oracle database
Any recent traffic increase to the affected platform? No Since how long this problem has been observed? Right after the upgrade project
deployment Is the JDBC Connection Pool depletion happening suddenly or over time? It was observed
via our internal enterprise JMX client monitoring tool that the connection pool is increasing over time at a fast rate. The current pool capacity is 25
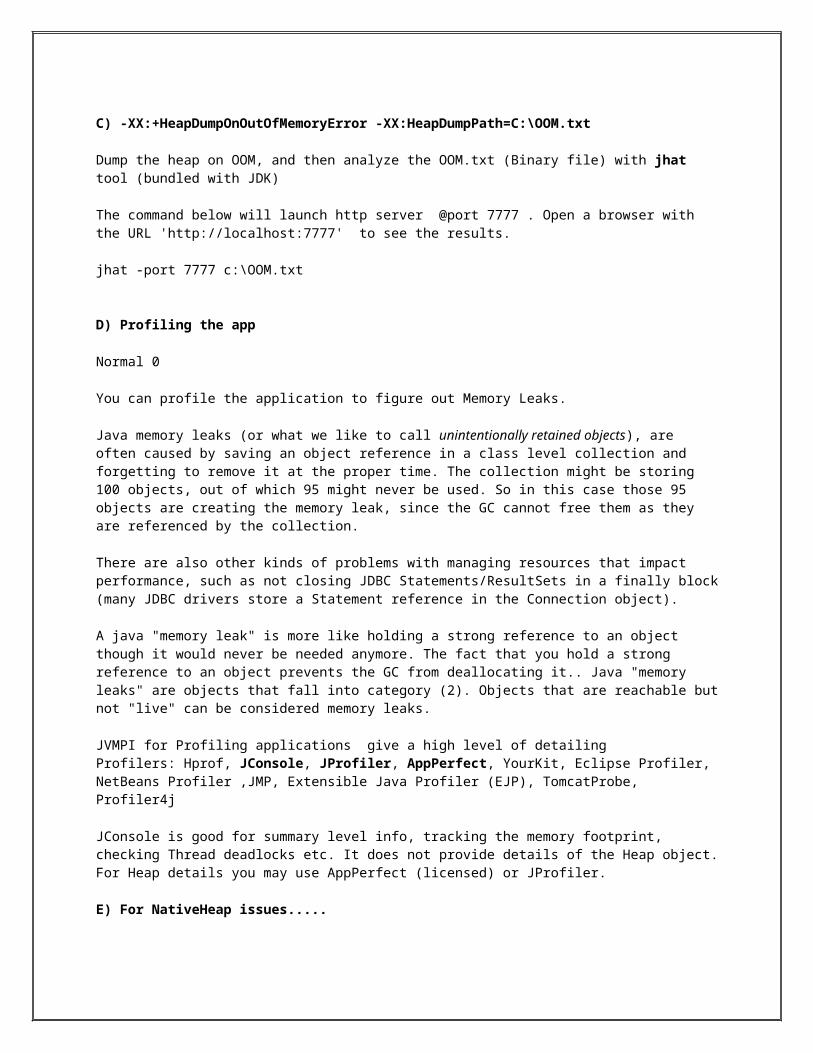
Did a restart of the Weblogic server resolve the problem? No, rollback to the previous environment was required
Conclusion #1: The problem is related to a JDBC Connection Pool leak of the primary application JDBC data source
Conclusion #2: This problems correlates with the Weblogic upgrade and migration of our application code to HibernateJDBC Pool utilization
The history of JDBC Pool utilization was captured using our internal enterprise remote JMX monitoring tool. Such monitoring is achieved by connecting remotely to the Weblogic server and pull detail from the runtime Weblogic MBeans:
StringBuffer canonicalObjNameBuffer = new StringBuffer();
// MBean querycanonicalObjNameBuffer.append("com.bea:Name="); canonicalObjNameBuffer.append(jdbcDSName);canonicalObjNameBuffer.append(",ServerRuntime=");canonicalObjNameBuffer.append(instanceName);
canonicalObjName = CanonicalObjectNameObjectCacheFactory.getInstance().getCanonicalObjectName(canonicalObjNameBuffer.toString(), null);
// JDBC data source MBean metrics extractionint activeConnectionCount = (Integer)adapter.getJMXService().getJMXConnection().getMBeanAttribute(canonicalObjName, "ActiveConnectionsCurrentCount");int leakedConnectionCount = (Integer)adapter.getJMXService().getJMXConnection().getMBeanAttribute(canonicalObjName, "LeakedConnectionCount");long reservedRequestCount = (Long)adapter.getJMXService().getJMXConnection().getMBeanAttribute(canonicalObjName, "ReserveRequestCount");int connectionDelayTime = (Integer)adapter.getJMXService().getJMXConnection().getMBeanAttribute(canonicalObjName, "ConnectionDelayTime");
The graph below represents a history of the ActiveConnectionsCurrentCount MBean metric. This corresponds to your current connection pool utilization.
The results were quire conclusive as it did reveal such connection pool leak and some sudden surge leading to full depletion.Error log review
The log review did reveal the following error during these 2 episodes of connection leak surge. There was a very good correlation with # of errors found in these logs and the # of leaked connections increase observed from graph. The error was thrown during execution of the Hibernate Session.flush() method due to null value injection.
Unexpected exception has occured: org.hibernate.PropertyValueException: not-null property references a null or transient value: app.AppComponent.method UnExpected Exception has been occured: org.hibernate.PropertyValueException: not-null property references a null or transient value: app.AppComponent.method at org.hibernate.engine.Nullability.checkNullability(Nullability.java:72) at org.hibernate.event.def.DefaultFlushEntityEventListener.scheduleUpdate(DefaultFlushEntityEventListener.java:263) at org.hibernate.event.def.DefaultFlushEntityEventListener.onFlushEntity(DefaultFlushEntityEventListener.java:121) at org.hibernate.event.def.AbstractFlushingEventListener.flushEntities(AbstractFlushingEventListener.java:196) at org.hibernate.event.def.AbstractFlushingEventListener.flushEverythingToExecutions(AbstractFlushingEventListener.java:76) at org.hibernate.event.def.DefaultFlushEventListener.onFlush(DefaultFlushEventListener.java:26) at org.hibernate.impl.SessionImpl.flush(SessionImpl.java:1000) at app.DaoComponent.insert
Weblogic Profile Connection Leak
The next step was to enable to Profile Connection Leak; similar to what we did with another JDBC connection pool leak using Weblogic 9.0.
The exercise did reveal the source of the leak from one of our application DAO using Hibernate; same DAO component which was generating errors in our log due to null value injection.
Hibernate best practices and code review
Proper coding best practices are important when using Hibernate to ensure proper Session / Connection resource closure. Any Hibernate Session along with JDBC resource must be closed in a finally{} block to properly handle any failure scenario. Such finally{} block must also be shielded against any failure condition in order to guarantee closure of the Hibernate session by adding proper try{} catch{} block when applicable.
The code analysis did reveal a problem with the Hibernate Session / Connection closure code; bypassing the execution of the Hibernate session.close() in the scenario an Exception is thrown during execution of session.flush().
finally { if (session != null) { session.flush(); session.close(); }}
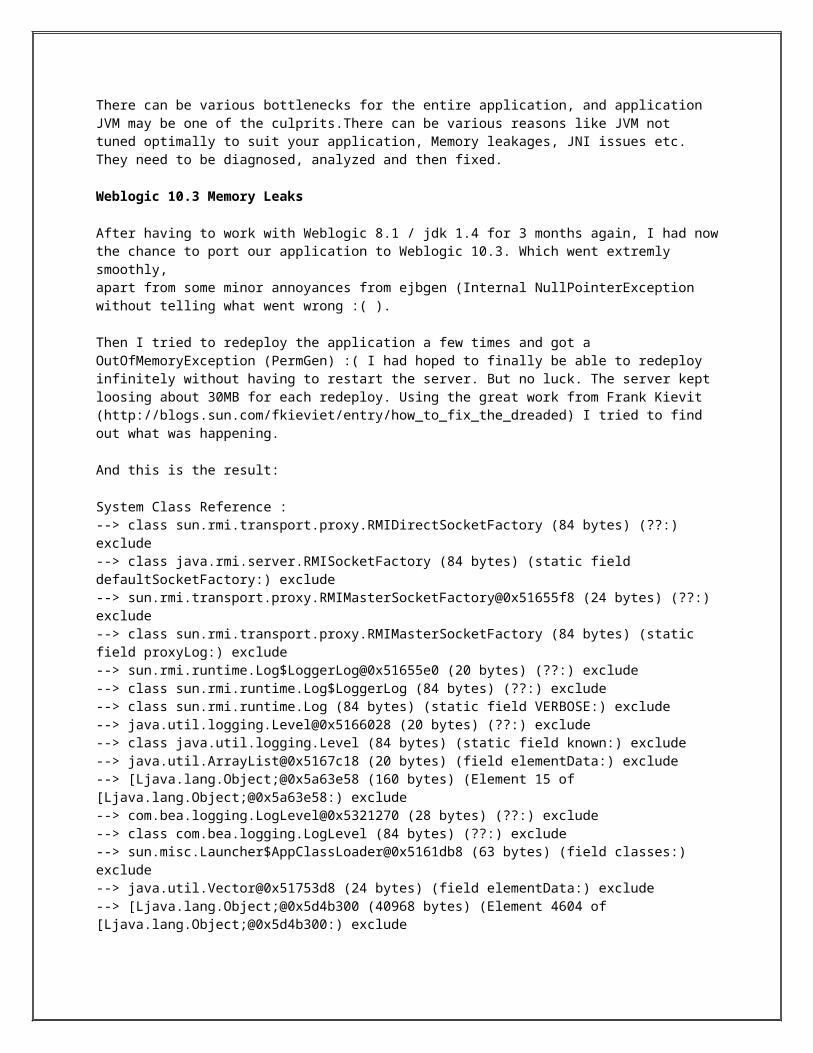
Root causeThe root cause of the connection leak was concluded as a combination code defect within our DAO component. The code portion that is taking care of the Hibernate session flush was not embedded in a try{} catch{} block. Any failure of the Session.flush() was bypassing closure of the Hibernate session; triggering a leak of the associated JDBC connection.
Solution and results
A code fix was applied to the problematic DAO component as per below and deployed to our production environment following proper testing.
BEFORE
AFTER
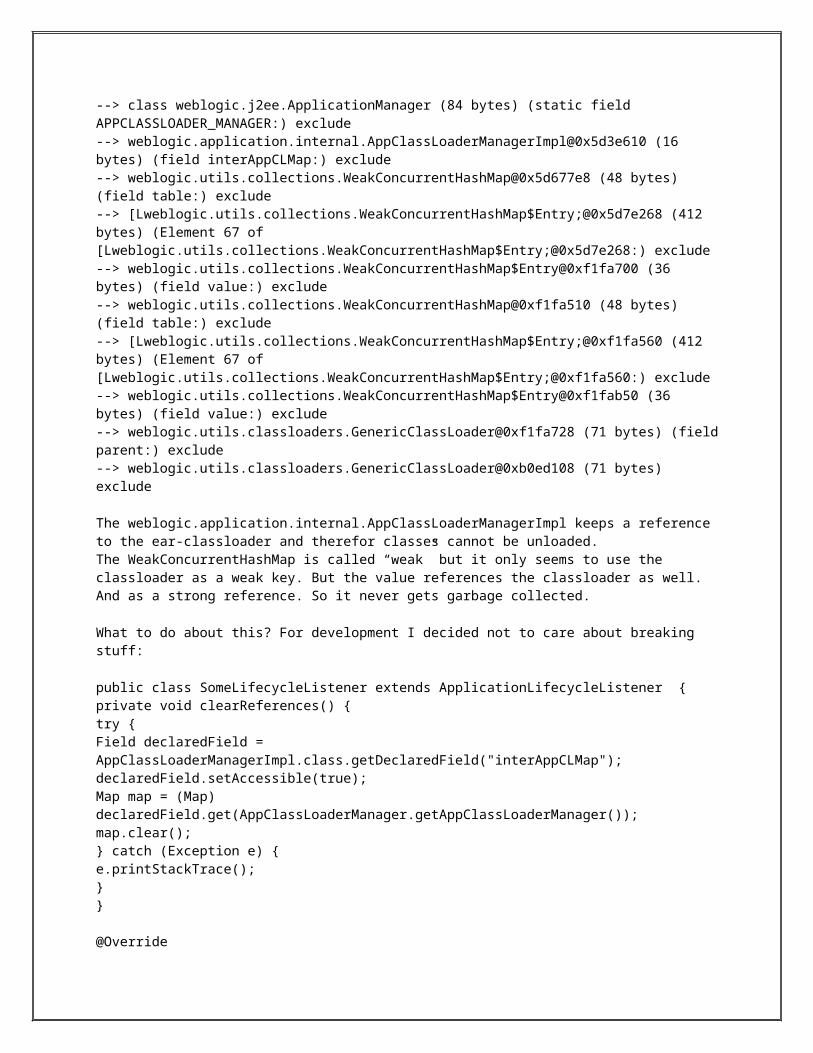
The results were quite conclusive and did confirm a complete resolution of the JDBC connection pool leak.
Conclusion and recommendations
Perform regular code walkthrough of any new code with an increased focus for any new code dealing with JDBC and third party API implementation such as Hibernate. Always ensure that your JDBC and Hibernate related resource closure code is bullet proof against any negative scenario.
Perform regular monitoring of your production Weblogic JDBC Pool utilization, ensure no JDBC Pool leak is present (proactive monitoring). Same exercise should be done in your load testing environment before deploying a major release.
Difference between jdk 1.4 and jdk1.5
Generics: provides compile-time (static) type safety for collections and eliminates the need for most typecasts (type conversion).
- Metadata: also called annotations; allows language constructs such as classes and methods to be tagged with additional data, which can then be processed by metadata-aware utilities.
- Autoboxing/unboxing: automatic conversions between primitive types (such as int) and primitive wrapper classes (such as integer).
- Enumerations: the enum keyword creates a typesafe, ordered list of values (such as day.monday, day.tuesday, etc.). Previously this could only be achieved by non-typesafe constant integers or manually constructed classes (typesafe enum pattern).
- Swing: new skinnable look and feel, called synth.
- Var args: the last parameter of a method can now be declared using a type name followed by three dots (e.g. Void drawtext(string... Lines)). In the calling code any number of parameters of that type can be used and they are then placed in an array to be passed to the method, or alternatively the calling code can pass an array of that type.
- Enhanced for each loop: the for loop syntax is extended with special syntax for iterating over each member of either an array or any iterable, such as the standard collection classesfix the previously broken semantics of the java memory model, which defines how threads interact through memory.
- Automatic stub generation for rmi objects.
- Static imports concurrency utilities in package java.util.concurrent.
- Scanner class for parsing data from various input streams and buffers.
- Assertions
- StringBuilder class (in java.lang package)
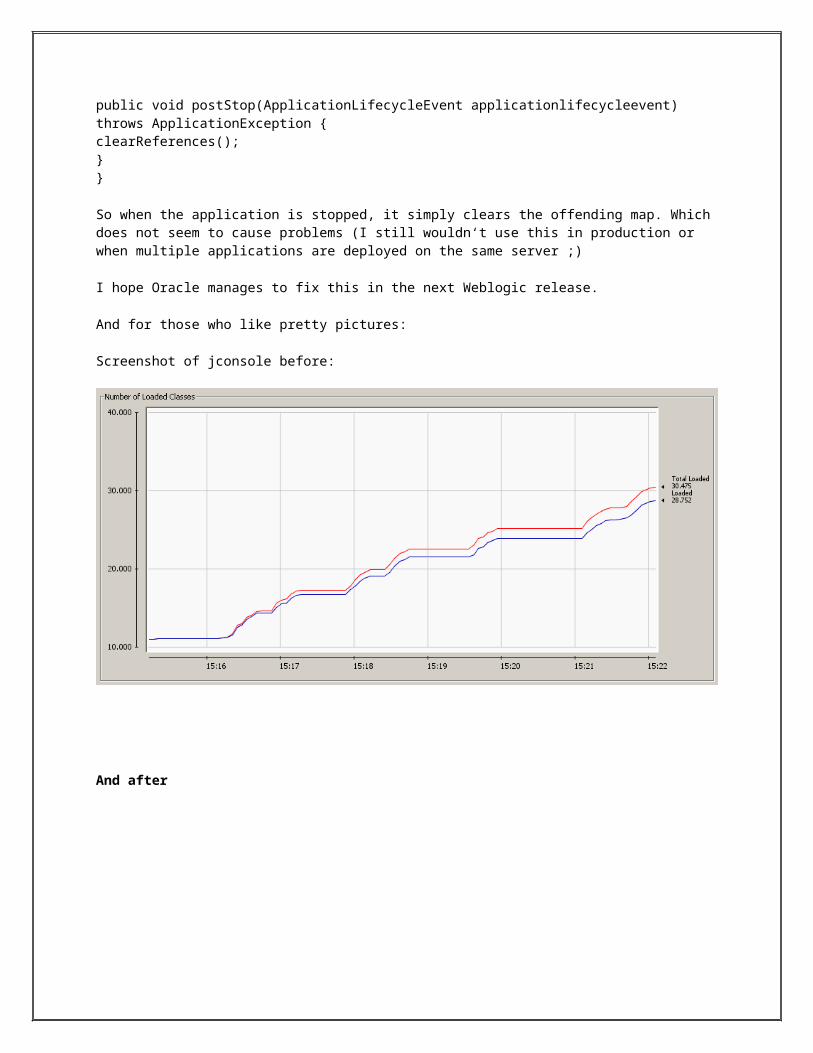
- Annotations
23.What is diff b/w weblogic and websphere?
Functionally these two products are fairly close except for some minor differences in supported standards.
While WebSphere tends to focus more on integration, connectivity, and web services - WebLogic has in the past focused more on emerging J2EE standards and ease-of-use.
Because of WebSphere's rich implementations of J2EE it is a little more involved, but benefits with better performance, more extensive integration and transaction management
In terms of transaction WebLogic is having default transaction attribute as "Supports", but WebSphere does not have any default transaction attribute.
Although WebLogic server and WebSphere server are two of the leading Java EE-based application servers,
they have their own differences. WebLogic application server is developed by Oracle,
heavily in the industry, and the Java Community believe they are more or less the same when it comes to features and
functionality they provide. But according to a study conducted by Crimson consulting group in May, 2011 on cost difference between
these two application servers, WebSphere server was found to be more costlier than WebLogic server. The three main reasons for this
are WebLogic’s performance advantage (which means less hardware/software and support costs), WebLogic’s lesser operational costs,
and WebSphere’s higher “people costs” due to the need to use trained professionals.
******************************************************************
24.How to check the CPU utilization in UNIX ?
Under Sun Solaris UNIX (and other UNIX oses like HP-UX and *BSD oses) you can use following commands to gather CPU information:
sar : System activity reporter
mpstat : Report per-processor or per-processor-set statistics
ps / top commands
UNIX sar command examples
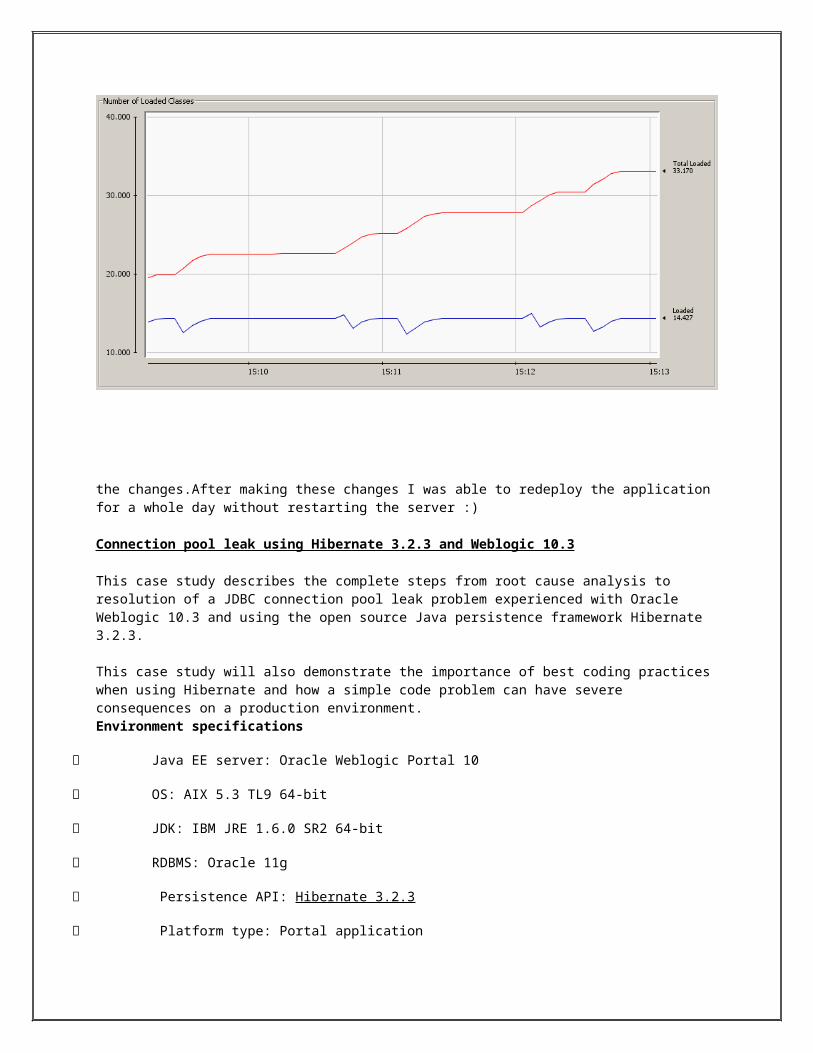
General syntax is as follows:sar t [n]In the first instance, sar samples cumulative activity counters in the operating system at n intervals of t seconds, where t should be 5 or greater. If t is specified with more than one option, all headers are printed together and the output may be difficult to read.
Task: Display today's CPU activity, use
# sar
Task:Watching system activity evolve i.e. reports CPU Utilization
# sar -u 12 5
Where,
-u 12 5: Comparison of CPU utilization; 12 seconds apart; 5 times.
Output includes:
1. %usr: User time (% of CPU)2. %sys: System time (% of CPU)3. %wio: Percent of CPU running idle with a process waiting for block I/O4. %idle: Percent of CPU that is idle
Task: You can watch CPU activity evolve for 10 minutes and save data
# sar -o file-name 60 10
Task: You can just sar and logout and let the report store in files
# nohup sar -A -o output-file 60 10 1>/dev/null 2>&1 &Note to display data stored in output-file pass -f option to sar command:# sar -f output-file
UNIX mpstat example
Type the following command to display per-processor statistics; 12 seconds apart; 5 times# mpstat 12 5
You can also use traditional ps and top command:# top# ps -e -o pcpu -o pid -o user -o args
***************************************************************
25.How to check the disk space in UNIX?A quick way to get a summary of the available and used disk space on your Linux system is to type in the df command in a terminal window. The command df stands for "disk filesystem". With the -h option (df -h) it shows the disk space in "human readable" form, which in this case means, it gives you the units along with the numbers.
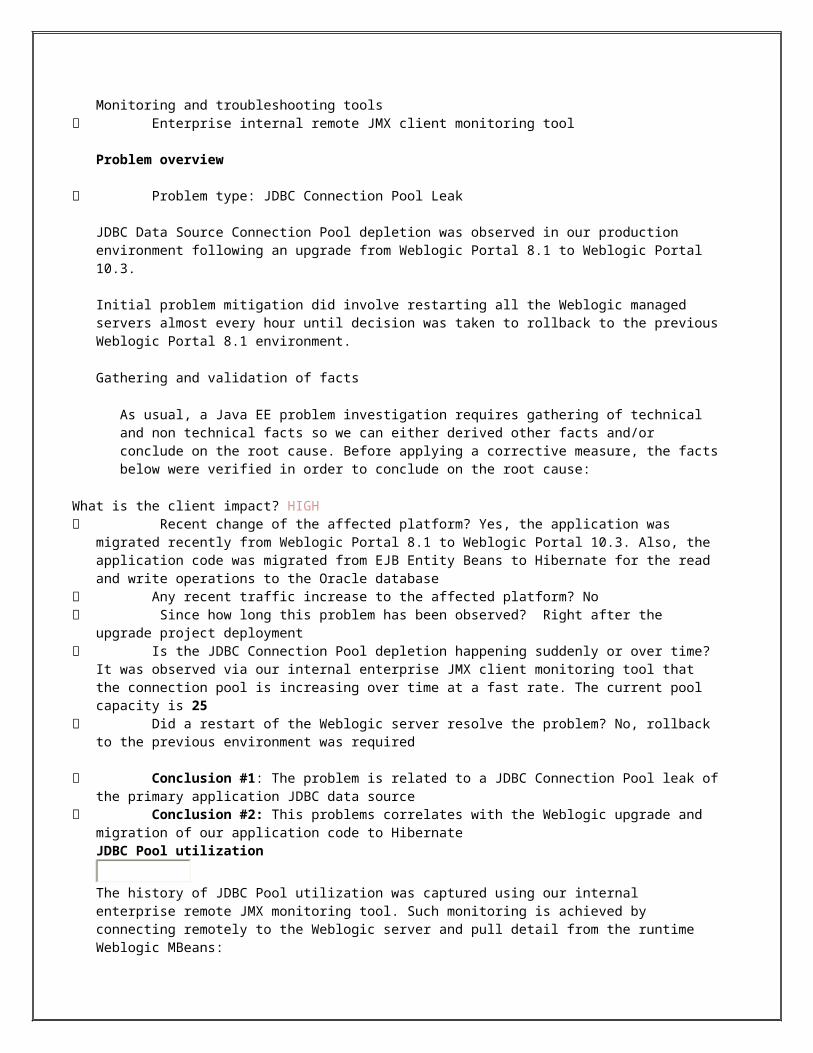
The du command on the other hand shows the disk space used by the files and directories in the current directory. Again the -h option (df -h) makes the output easier to comprehend.
Type df -h or df -k to list free disk space:$ df -hOR$ df –k
Output:
Filesystem Size Used Avail Use% Mounted on/dev/sdb1 20G 9.2G 9.6G 49% /varrun 393M 144k 393M 1% /var/runvarlock 393M 0 393M 0% /var/lockprocbususb 393M 123k 393M 1% /proc/bus/usbudev 393M 123k 393M 1% /devdevshm 393M 0 393M 0% /dev/shmlrm 393M 35M 359M 9% /lib/modules/2.6.20-15-generic/volatile/dev/sdb5 29G 5.4G 22G 20% /media/docs/dev/sdb3 30G 5.9G 23G 21% /media/isomp3s/dev/sda1 8.5G 4.3G 4.3G 51% /media/xp1/dev/sda2 12G 6.5G 5.2G 56% /media/xp2/dev/sdc1 40G 3.1G 35G 9% /media/backup
************************************************************
26.What is Nodemanager and what is use of it?
Node Manageris Weblogic Server utility to start, stop and restartAdministration and Managed Server Instances from remote location (There are other ways as well to start/stop Weblogic check here - Node Manager is optional component).
1. Node Manager Process is associated with a Machine and NOT with specific Weblogic Domain (i.e. Use one node manager for multiple domains on same machine)
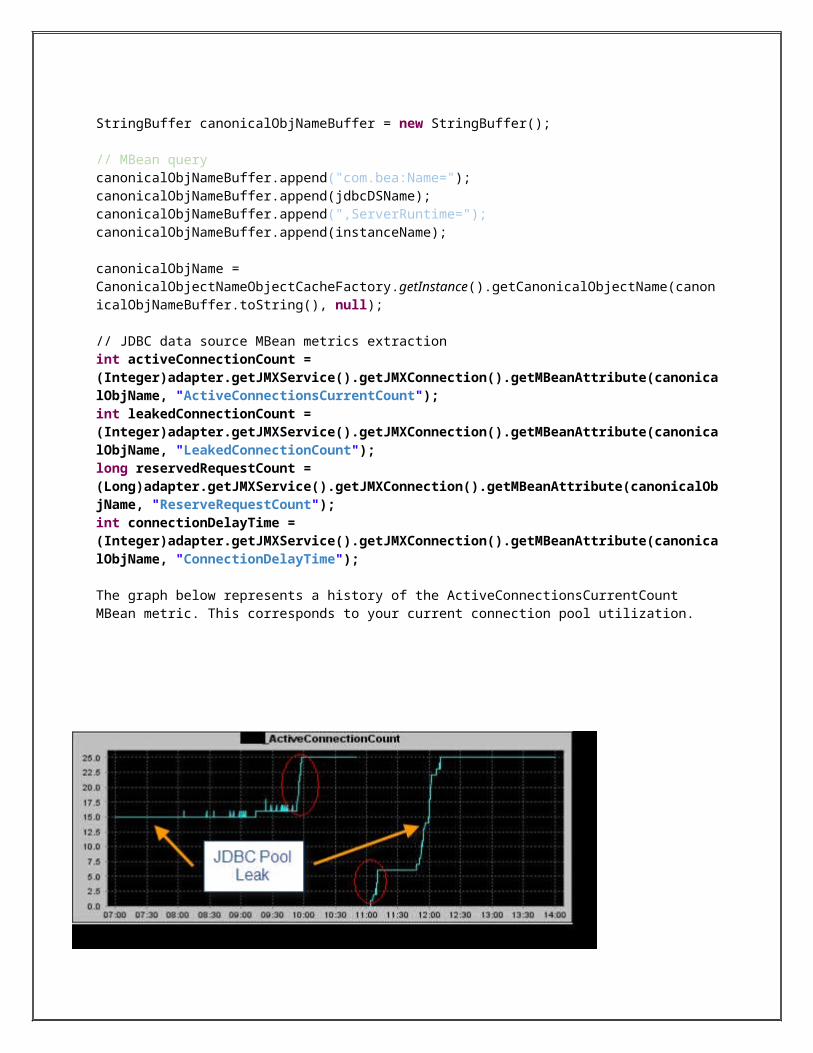
2. There are two versions of Node Manager - Java-based and Script-based
Java-based node manager - runs with in JVM (Java Virtual Machine) Process and more secure than script-based node manager. Configuration for java-based node manager are stored in nodemanager.properties
Script-based node manager - is available for Linux and Unix systems only and is based on shell script.
3. There are multiple ways to access Node Manager- From Administration Console : Environments -> Machines -> Configuration -> Node Manager- JMX utilities (Java Management eXtension) more here- WLST commands (WebLogic Scripting Tool)
4.Default port on which node manager listen for requests is localhost:5556, When you configure Node Manager to accept commands from remote systems, you must uninstall the default Node Manager service, then reinstall it to listen on a non-localhost (IP’s other than 127.0.0.1) listen address.
5. Any domain created before creation of Node Manager Service will not be accessible via node Manager(even after restarting node manager), solution is to run the WLST command “nmEnroll” to enroll that domain with the Node Manager.
6. Any domains created after the Node Manager service has been installed should not have to be enrolled against the Node Manager. The Node Manager should automatically be ‘reachable‘ by the domain.
.How to Configure Node Manager ?
1.Configure each computer (on which you wish to use Node Manager) as a Machine in WebLogic ServerEnvironments -> Machines -> New (Add Machine) Use Link hereEnvironments -> Machines -> Machine Name (created above) -> Configuration -> Node Manager
2. Assign each server instance (Admin or Managed that you wish to control with Node Manager) to Machine.Environments -> Machines -> Machine Name (created above) -> Configuration -> Servers -> Add (Add Server running on this node which you would like to monitor using Node Manager) for more info Click here
3. Enroll domain (created before installation of Node Manager) to Node Manager
Windowscd $BEA_HOME\user_projects\domains\<domain_name>\binsetDomainEnv.cmdjava weblogic.WLSTwls> connect(’weblogic’,'weblogic’, ‘t3://mymachine.mydomain:7001′)wls> nmEnroll(’C:\bea\user_projects\domains/<domainName>’, ‘C:\bea\wlserver_<version>/common/nodemanager’)
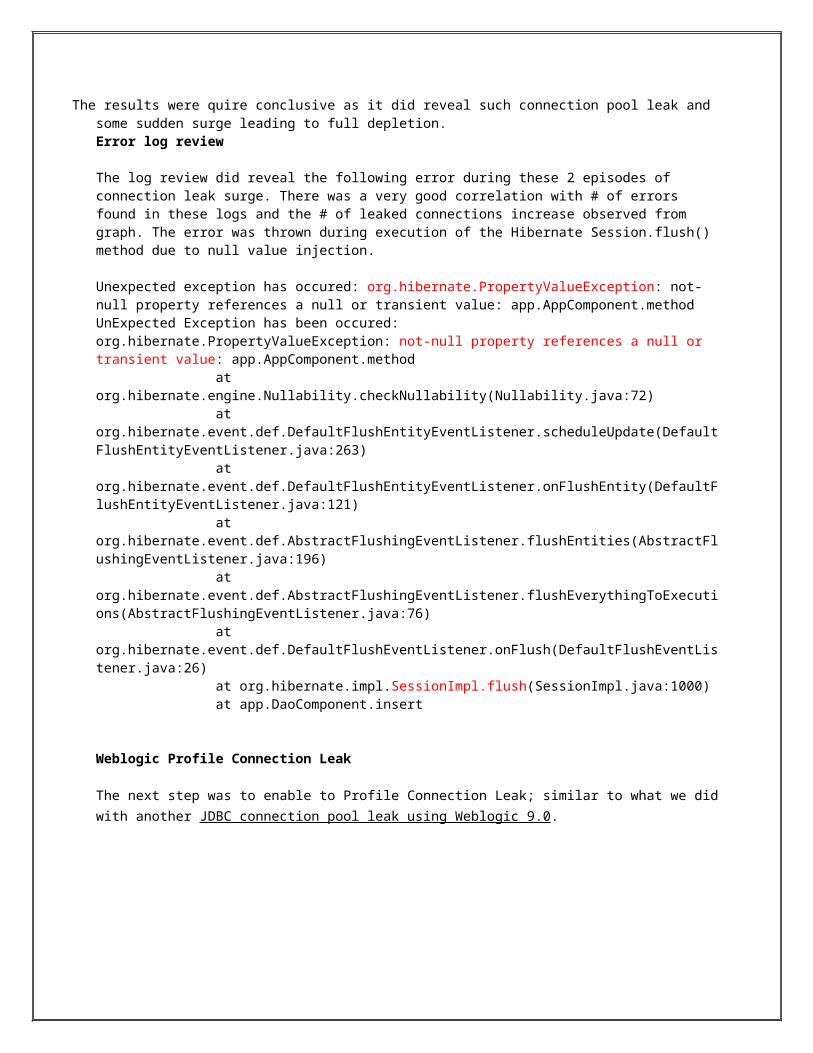
.Unix /Linuxcd $BEA_HOME/user_projects/domains/<domain_name>/bin/. setDomainEnv.shjava weblogic.WLSTwls> connect(’weblogic’,'weblogic’, ‘t3://mymachine.mydomain:7001′)wls> nmEnroll(’$BEA_HOME/user_projects/domains/<domain_name>’, ‘$BEA_HOME/wlserver_<version>/common/nodemanager’)
where “mymachine.mydomain:7001″ is the reference to the Admin Server of the domain to which the server and machine definition belongsHow to start Node Manager ?
$WL_HOME\server\bin\startNodeManager.sh (startNodeManager.cmd on Windows)
How to install Node Manager as Service on Windows ?
Use $WLS_HOME\server\bin\installNodeMgrSvc.cmd (Where default WLS_HOME location is c:\bea\wlserver_<version>)
To uninstall Node Manager Service on windows use $WLS_HOME\server\bin\uninstallNodeMgrSvc.cmd
installNodeMgrSvc.cmd will create Windows server with name as Oracle WebLogic NodeManager (C_bea_wlserver_<version>).Important Configuration files
– $WL_HOME/common/nodemanager/ nodemanager.properties, nodemanager.domains, nm_data.properties
–$DOMAIN_HOME/config/nodemanager/nm_password.properties
–$DOMAIN_HOME/servers/<server_name>/data/nodemanager/ boot.properties, startup.properties, server_name.addr, server_name.lck, server_name.pid, server_name.state
.Node Manager Log Files$WL_HOME/common/nodemanager/nodemanager.log
27.How to verify network performance in unix ?
If the ping times are higher than you expect, then you should start to get some basic statistics about the network interface you are using to see if the problem is related to the network interface, or a specific protocol.
Under Linux, you can get some basic network statistic information by using the ifconfig tool (see Listing 7).
Listing 7. Getting basic network statistic information using the ifconfig tool
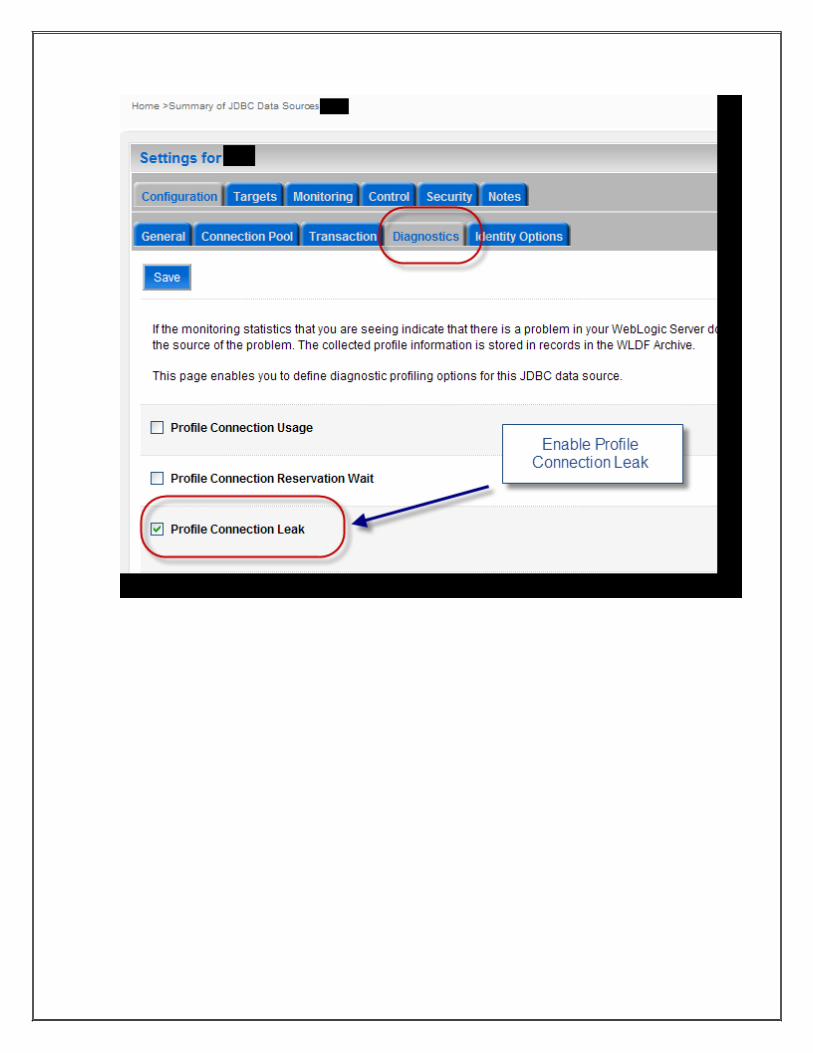
$ ifconfig eth1eth1 Link encap:Ethernet HWaddr 00:1a:ee:01:01:c0 inet addr:192.168.0.2 Bcast:192.168.3.255 Mask:255.255.252.0 inet6 addr: fe80::21a:eeff:fe01:1c0/64 Scope:Link UP BROADCAST RUNNING MULTICAST MTU:1500 Metric:1 RX packets:7916836 errors:0 dropped:78489 overruns:0 frame:0 TX packets:6285476 errors:0 dropped:0 overruns:0 carrier:0 collisions:0 txqueuelen:1000 RX bytes:11675092739 (10.8 GiB) TX bytes:581702020 (554.7 MiB) Interrupt:16 Base address:0x2000
The important rows are those beginning RX and TX, which show information about the packets sent and received. The packets value is a simple count of the packets transferred. The errors, dropped, and overruns figures show how many of the packets indicated some kind of fault. A high number of dropped packets in comparison to the packets sent probably indicate that the network is busy.
You can also get extended statistic information on all platforms by using the netstat tool. Under Linux, the tool provides more specific base protocol statistics, such as the packet transmissions for TCP-IP and UDP packet types. Again, the information contains some basic statistics (see Listing 8).
Listing 8. Using netstat
$ netstat -sIp: 8437387 total packets received 1 with invalid addresses 0 forwarded 0 incoming packets discarded 8437383 incoming packets delivered 6820934 requests sent out 6 reassemblies required 3 packets reassembled okIcmp: 502 ICMP messages received 3 input ICMP message failed. ICMP input histogram: destination unreachable: 410 echo requests: 82 echo replies: 10 1406 ICMP messages sent 0 ICMP messages failed ICMP output histogram: destination unreachable: 1313 echo request: 11 echo replies: 82IcmpMsg: InType0: 10 InType3: 410 InType8: 82 OutType0: 82 OutType3: 1313 OutType8: 11Tcp:
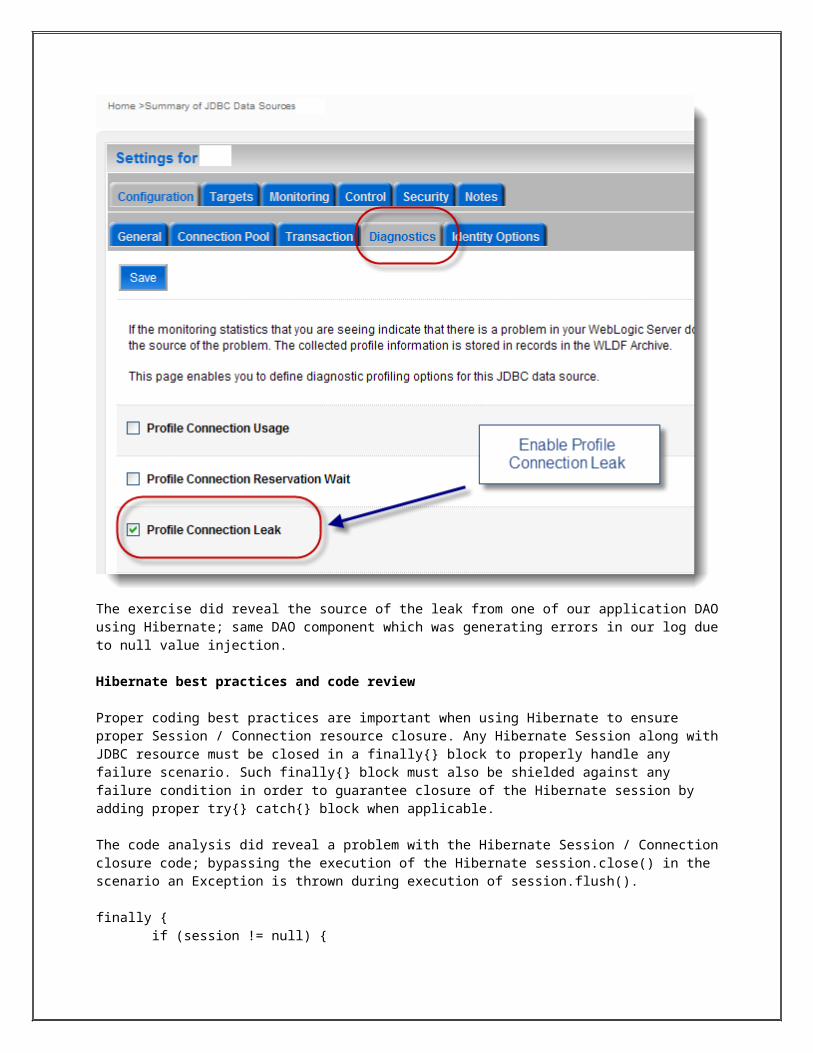
8361 active connections openings 6846 passive connection openings 1 failed connection attempts 164 connection resets received 33 connections established 8305361 segments received 6688553 segments send out 640 segments retransmitted 0 bad segments received. 676 resets sentUdp: 126083 packets received 1294 packets to unknown port received. 0 packet receive errors 130335 packets sentUdpLite:TcpExt: 5 packets pruned from receive queue because of socket buffer overrun 6792 TCP sockets finished time wait in fast timer 5681 delayed acks sent Quick ack mode was activated 11637 times 150861 packets directly queued to recvmsg prequeue. 74333 bytes directly in process context from backlog 9141882 bytes directly received in process context from prequeue 3608274 packet headers predicted 42627 packets header predicted and directly queued to user 77132 acknowledgments not containing data payload received 374105 predicted acknowledgments 2 times recovered from packet loss by selective acknowledgements 77 congestion windows recovered without slow start after partial ack 1 TCP data loss events 17 timeouts after SACK recovery 2 fast retransmits 8 retransmits in slow start 236 other TCP timeouts 1453 packets collapsed in receive queue due to low socket buffer 11634 DSACKs sent for old packets 2 DSACKs sent for out of order packets 2 DSACKs received 77 connections reset due to unexpected data 50 connections aborted due to timeout TCPDSACKIgnoredNoUndo: 1 TCPSackShiftFallback: 23IpExt: InBcastPkts: 4126
Under Solaris and other UNIX variants, the information provided by netstat differs depending upon the platform. For example, under Solaris, you get detailed statistics for each protocol, and separate information for IPv4 and IPv6 connections (see Listing 9). The output in the listing has been truncated.
Listing 9. Using netstat on Solaris
$ netstat -s
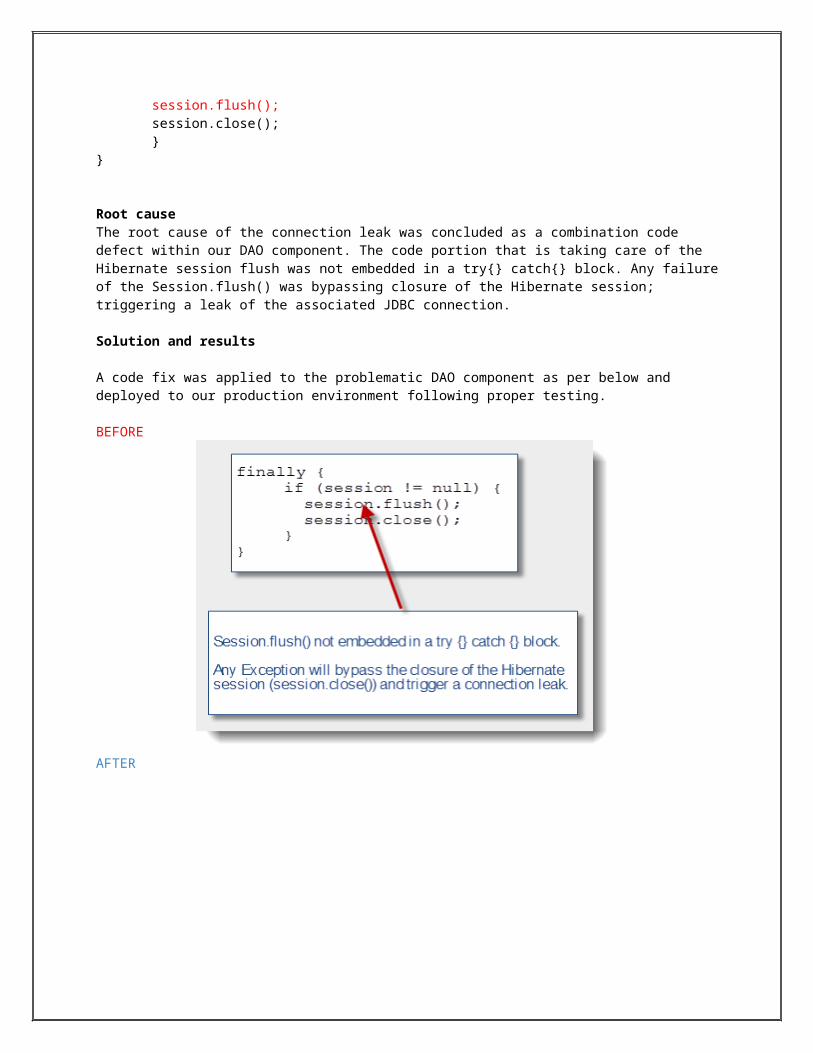
RAWIP rawipInDatagrams = 440 rawipInErrors = 0 rawipInCksumErrs = 0 rawipOutDatagrams = 91 rawipOutErrors = 0
UDP udpInDatagrams = 15756 udpInErrors = 0 udpOutDatagrams = 16515 udpOutErrors = 0
TCP tcpRtoAlgorithm = 4 tcpRtoMin = 400 tcpRtoMax = 60000 tcpMaxConn = -1 tcpActiveOpens = 1735 tcpPassiveOpens = 54 tcpAttemptFails = 2 tcpEstabResets = 35 tcpCurrEstab = 2 tcpOutSegs =13771839 tcpOutDataSegs =13975728 tcpOutDataBytes =1648876686 tcpRetransSegs = 90215 tcpRetransBytes =130340273 tcpOutAck =151539 tcpOutAckDelayed = 5570 tcpOutUrg = 0 tcpOutWinUpdate = 31 tcpOutWinProbe = 86 tcpOutControl = 3750 tcpOutRsts = 63 tcpOutFastRetrans = 6 tcpInSegs =7548720 tcpInAckSegs =2882026 tcpInAckBytes =1648874900 tcpInDupAck =4413016 tcpInAckUnsent = 0 tcpInInorderSegs =415007 tcpInInorderBytes =367832646 tcpInUnorderSegs = 7650 tcpInUnorderBytes =10389516 tcpInDupSegs = 222 tcpInDupBytes = 74649 tcpInPartDupSegs = 0 tcpInPartDupBytes = 0 tcpInPastWinSegs = 0 tcpInPastWinBytes = 0 tcpInWinProbe = 0 tcpInWinUpdate = 2 tcpInClosed = 33 tcpRttNoUpdate = 660 tcpRttUpdate =2880379 tcpTimRetrans = 2262 tcpTimRetransDrop = 10 tcpTimKeepalive = 630 tcpTimKeepaliveProbe= 314 tcpTimKeepaliveDrop = 17 tcpListenDrop = 0 tcpListenDropQ0 = 0 tcpHalfOpenDrop = 0 tcpOutSackRetrans = 69348...
In all cases, you are looking for a high level of error packets, retransmissions, or dropped packet transmission, all of which indicate that the network is busy. If the error rate is excessively high compared to the packets transmitted or received, then it may indicate a fault with the network hardware.
28.what are the variables of heapsize in weblogic 10.3?
Java heap size values must be specified whenever you start WebLogic Server. This can be done either from the Java command line or by modifying the default values in the sample startup scripts that are provided with the WebLogic distribution for starting WebLogic Server.
For example, when starting WebLogic Server from a Java command line, the heap size values could be specified as follows:
java -XX:NewSize=128m -XX:MaxNewSize=128m -XX:SurvivorRatio=8 -Xms512m -Xmx512m
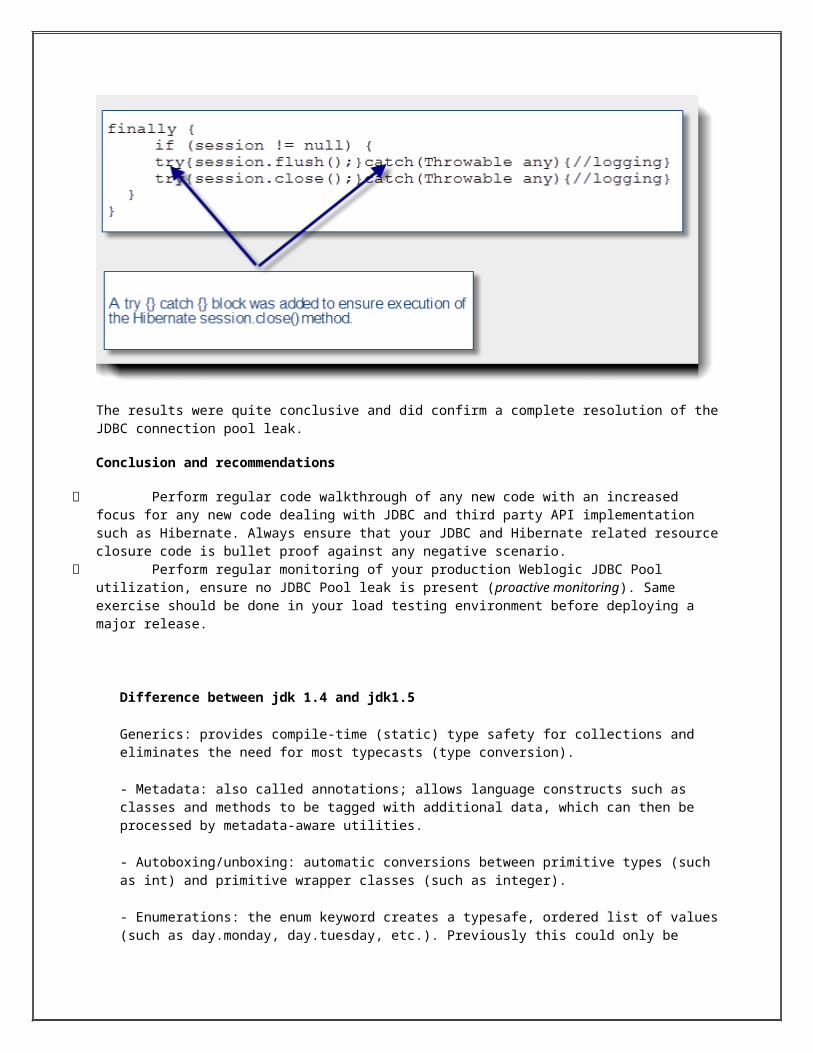
-Dweblogic.Name=%SERVER_NAME% -Dbea.home="C:\bea"-Dweblogic.management.username=%WLS_USER%-Dweblogic.management.password=%WLS_PW%-Dweblogic.management.server=%ADMIN_URL%-Dweblogic.ProductionModeEnabled=%STARTMODE%-Djava.security.policy="%WL_HOME%\server\lib\weblogic.policy" weblogic.Server
The default size for these values is measured in bytes. Append the letter `k' or `K' to the value to indicate kilobytes, `m' or `M' to indicate megabytes, and `g' or `G' to indicate gigabytes. For more information on the heap size options
Using WebLogic Startup Scripts to Set Heap Size
Sample startup scripts are provided with the WebLogic Server distribution for starting the server and for setting the environment to build and run the server:
startWLS.cmd and setEnv.cmd for Windows systems. startWLS.sh and setEnv.sh for UNIX systems.
These scripts are located in WL_HOME\server\bin, where WL_HOME is the location in which you installed WebLogic Server. The startup scripts set environment variables, such as the default memory arguments passed to Java (that is, heap size) and the location of the JDK, and then starts the JVM with WebLogic Server arguments.
Task Option DescriptionSetting the New generation heap size
-XX:NewSize Use this option to set the New generation Java heap size. Set this value to a multiple of 1024 that is greater than 1MB. As a general rule, set -XX:NewSize to be one-fourth the size of the maximum heap size. Increase the value of this option for larger numbers of short-lived objects.Be sure to increase the New generation as you increase the number of processors. Memory allocation can be parallel, but garbage collection is not parallel.
Setting the maximum New generation heap size
-XX:MaxNewSize Use this option to set the maximum New generation Java heap size. Set this value to a multiple of 1024 that is greater than 1MB.
Setting New heap size ratios -XX:SurvivorRatio The New generation area is divided into three sub-areas: Eden, and two survivor
spaces that are equal in size.
Use the -XX:SurvivorRatio=X option to configure the ratio of the Eden/survivor space size. Try setting this value to 8, and then monitor your garbage collection.
Setting minimum heap size -Xms Use this option to set the minimum size of the memory allocation pool. Set this value to a multiple of 1024 that is greater than 1MB. As a general rule, set minimum heap size (-Xms) equal to the maximum heap size (-Xmx) to minimize garbage collections.
Setting maximum heap size -Xmx Use this option to set the maximum Java heap size. Set this value to a multiple of 1024 that is greater than 1MB.
29.What is head and tail commands ?
Sure. The Linux head and tail commands are very similar, so I've included them here together. The head command command prints lines from the beginning of a file (the head), and the tail command prints lines from the end of files. There's one very cool extra thing you can do with the tail command, and I'll show that in the tail example commands below.
By default the head command prints the first ten lines of a file, as shown in this head command example:
head file1
If you want to print more or less than 10 lines from the beginning of the file, the head command -n option lets you specify how many lines you want to see. Here I specify that I only want five lines:
head -n 5 file1
and here I say that I want to see 25 lines:
head -n 25 file1
It's also common to use the Linux head command in a command pipeline, something like this:
ps auxwww | grep apache | head -20
The Linux tail command
By default the Linux tail command also prints ten lines of a file, but it prints the last 10 lines, as shown in this tail command example:
tail file1
Like the head command, the tail command also lets you specify a number other than 10 using the -n option:
tail -25 file1
The Linux tail command has another very powerful option: the -f option prints from the end of the file, but also keeps the file open, and keeps printing from the tail of the file as the file itself grows. This is great for looking at the end of a log file. For instance, you can see new lines that are added to the end of an Apache log file, as they are added, like this:
tail -f apache.log
************************************************************
30.what is Certificate Signature Request ?
You must submit your request in a particular format called a Certificate Signature Request (CSR). WebLogic Server includes a Certificate Request Generator servlet that creates a CSR. The Certificate Request Generator servlet collects information from you and generates a private key file and a certificate request file. You must then submit the CSR. Before you can use the Certificate Request Generator servlet, WebLogic Server must be installed and running.
Start the Certificate Request Generator servlet (certificate.war). The .war file is automatically installed when you start WebLogic Server. In a Web browser, enter the URL for the Certificate Request Generator servlet as follows:
https://hostname:port/Certificate
hostname is the DNS name of the machine running WebLogic Server. port is the number of the port at which WebLogic Server listens for SSL connections.
For example, if WebLogic Server is running on a machine named Networking4all and it is configured to listen for SSL communications at the default port 7002 to run the Certificate Request Generator servlet, you must enter the following URL in your Web browser:
https://Networking4all:7002/certificate
The Certificate Request Generator servlet loads a form in your web browser. Complete the form displayed in your browser.
Click the Generate Request button. The Certificate Request Generator servlet displays messages informing you if any required fields are empty or if any fields contain invalid values. Click the Back button in your browser and correct any errors.
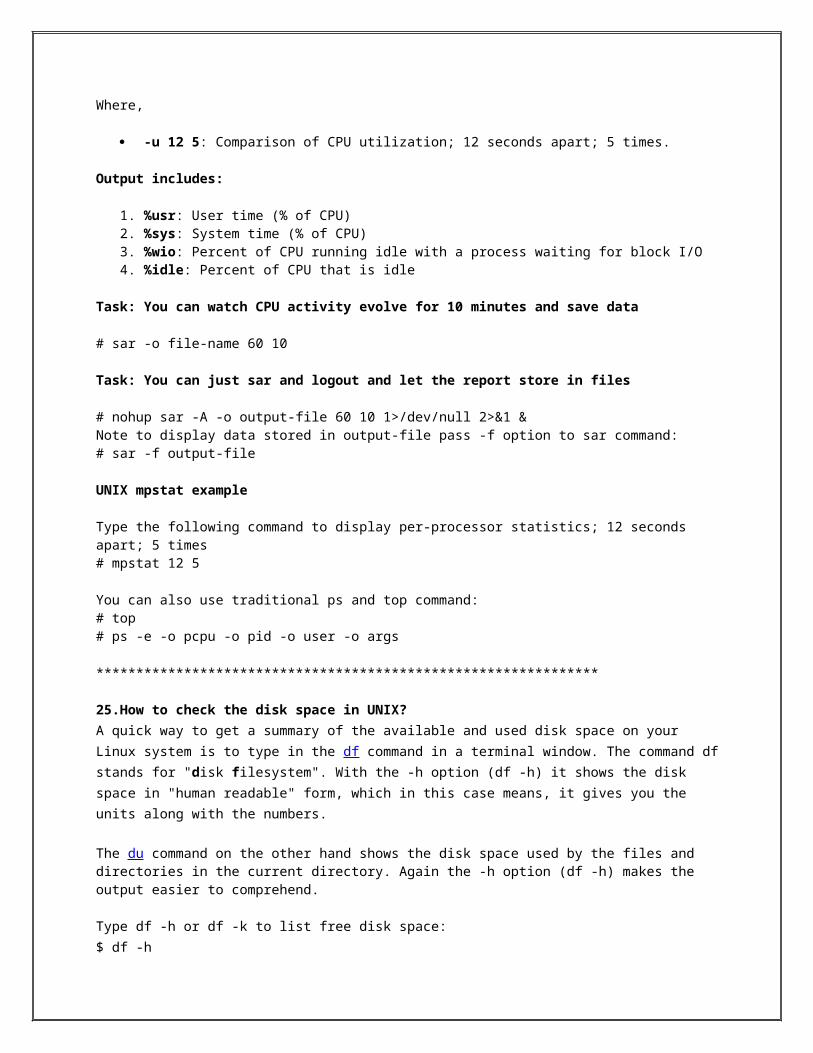
Note: Private Key Password If you don't not specify a password, you will get an unencyrpted RSA private key. If you specify a password, you will get a PKCS-8 encrypted private key. When using PKCS-8 encrypted private keys, you need to enable the Use Encrytped Keys field on the SSL tab of the Server window in the Administration Console.
When all fields have been accepted, the Certificate Request Generator servlet generates the following files in the startup directory of your WebLogic Server: mydomain_com-key.der-The private key file. The name of this file should go into the Server Key File Name field on the SSL tab in the Administration Console. mydomain_com-request.dem-The certificate request file, in binary format. mydomain_com-request.pem-The CSR file that you submit.. It contains the same data as the .dem file but is encoded in ASCII so that you can copy it into email or paste it into a Web form.
**********************************************************************
31.What netstat Command ?netstat is a useful tool for checking your network configuration and activity. It is in fact a collection of several tools lumped together. We discuss each of its functions in the following sections.
When you invoke netstat with the –r flag, it displays the kernel routing table in the way we've been doing with route. On vstout, it produces: # netstat -nrKernel IP routing tableDestination Gateway Genmask Flags MSS Window irtt Iface127.0.0.1 * 255.255.255.255 UH 0 0 0 lo172.16.1.0 * 255.255.255.0 U 0 0 0 eth0172.16.2.0 172.16.1.1 255.255.255.0 UG 0 0 0 eth0
The –n option makes netstat print addresses as dotted quad IP numbers rather than the symbolic host and network names. This option is especially useful when you want to avoid address lookups over the network (e.g., to a DNS or NIS server).
The second column of netstat 's output shows the gateway to which the routing entry points. If no gateway is used, an asterisk is printed instead. The third column shows the “generality” of the route, i.e., the network mask for this route. When given an IP address to find a suitable route for, the kernel steps through each of the routing table entries, taking the bitwise AND of the address and the genmask before comparing it to the target of the route.
The fourth column displays the following flags that describe the route:
G ------ The route uses a gateway.
U ------ The interface to be used is up.
H ------ Only a single host can be reached through the route. For example, this is the case for the loopback entry 127.0.0.1.
D ------ This route is dynamically created. It is set if the table entry has been generated by a routing daemon like gated or by an ICMP redirect message (see the section Section 2.5” in Chapter 2).
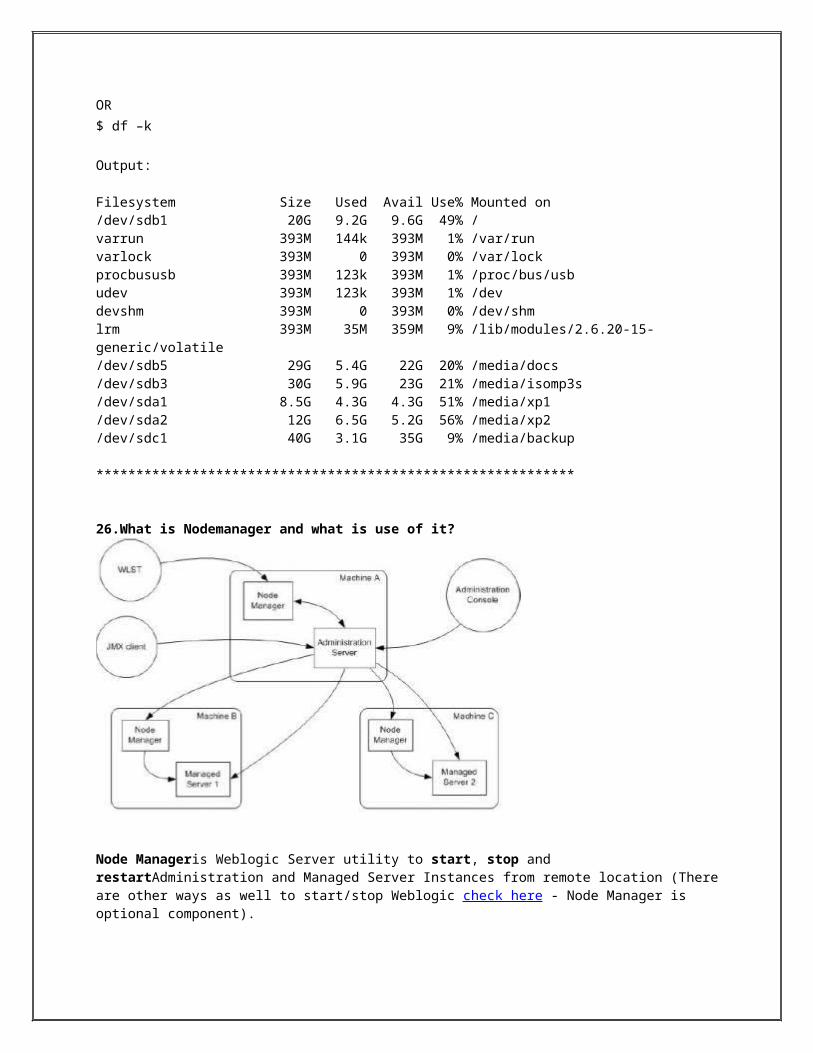
M ------ This route is set if the table entry was modified by an ICMP redirect message.
! ------ The route is a reject route and datagrams will be dropped.
32.What is URL Rewriting in weblogic ?
URL rewriting is another way of implementing session handling. In this technique a unique session identifier is generated and attached to each and every URL sent to the client browser. For example, if any HTML page is sent to the client browser, any URLs in that page will contain the session identifier. For every request from the client browser, the servlet checks for this session identifier. If this identifier is missing in the URL, the servlet treats it as a new session and generates another session identifier.
WebLogic Server provides an implementation of the encodeURL() method for the response object that generates and appends the session ID to the URL being written to the browser. URL links in any HTML page that the servlet generates need to be encoded with the encodeURL() method and not be written directly. A code snippet would be
out.println("<a href=\"" + response.encodeURL("/servlet/myServlet") + "\"> Click here!</a>");
The encodeURL method appends the session ID to this link in the generated HTML code. Hence, the HTML page contains the following HTML code:
<a href="/servlet/myServlet/sessionID=12345678">Click here!</a>
WebLogic Server provides support for URL rewriting by handling the generation of the unique session ID and appending to URLs in your application. However, since each and every URL in your application must be encoded to add the session identifier, this is not a foolproof method. Also, this method is cumbersome for developers to incorporate.
Listing 3.2 BookShoppingServlet.java
/****************************************************************************** * Class Name:BookShoppingServlet * Extends:HttpServlet * Description:Shopping Cart Application Using url rewriting, * @author Mandar S. Chitnis, Lakshmi AM. @version 1.1 * Copyright (c) by Sams Publishing. All Rights Reserved.******************************************************************************/package com.sams.learnweblogic7.servlets;
//import the utils packageimport com.sams.learnweblogic7.utils.*;
//importing standard servlet packagesimport javax.servlet.*;import javax.servlet.http.*;
//import io,util, and math packagesimport java.io.*;import java.util.*;import java.math.*;
public class BookShoppingServlet extends HttpServlet{
//declaring global variables Book book1; Book book2; Book book3;
PrintWriter out;
private static final int DEFAULT_ZERO_VALUE = 0; private static final String EXAMPLE_TYPE= "Shopping Cart Using URL Rewriting"; ... public void doPost(HttpServletRequest req, HttpServletResponse res)throws ServletException, IOException{ res.setContentType("text/html"); out = res.getWriter(); writeHeaderZone(out, EXAMPLE_TYPE); doSessionUsingURLRewriting(out, req, res); writeFooterZone(out); }//end of doPost
public void doSessionUsingURLRewriting(PrintWriter outputObject,HttpServletRequest req, HttpServletResponse res){ String clickedButton= (req.getParameter("buttonName") == null)?"":req.getParameter("buttonName"); if(clickedButton.equals("view")) { outputObject.println("<FORM name=\"viewcart\" action=\"/ShoppingApp/BookShoppingServlet\" method=\"get\">"); outputObject.println("<B><font face = \"Verdana\" color=\"blue\" -size=-2><p align = \"right\">Shopping Cart using URL Rewriting</p> </font></B>"); int book1Qty= Utility.getDefaultValue(req.getParameter("Book1Qty"),0); int book2Qty= Utility.getDefaultValue(req.getParameter("Book2Qty"),0); int book3Qty= Utility.getDefaultValue(req.getParameter("Book3Qty"),0); writeViewCartZone(outputObject,book1Qty, book2Qty, book3Qty); outputObject.println("<p align =\"center\"><INPUT type=\"submit\" name=\"buttonName\" value=\"Empty Shopping Cart\"></p>"); outputObject.println("</FORM>"); } else { rewriteURL(outputObject, req, res); outputObject.println("<B><font face = \"Verdana\" color=\"blue\" -size=-2><p align = \"right\">Shopping Cart using URL Rewriting</p> </font></B>"); writeBookListZone(outputObject); outputObject.println("<CENTER><TABLE width = 100%><TR>"); outputObject.println("<TD><INPUT type=\"submit\"
name=\"buttonName\" value=\"add\"></TD>"); outputObject.println("<TD><INPUT type=\"submit\" name=\"buttonName\" value=\"view\"></TD>"); outputObject.println("</TR></TABLE></CENTER>"); outputObject.println("</FORM>"); }
public void rewriteURL(PrintWriter outputObject, HttpServletRequest req, HttpServletResponse res){ int Book1Qty = Utility.getDefaultValue(req.getParameter("Book1Qty"),0)+ Utility.getDefaultValue(req.getParameter("book1_qty"),0); int Book2Qty = Utility.getDefaultValue(req.getParameter("Book2Qty"),0)+ Utility.getDefaultValue(req.getParameter("book2_qty"),0); int Book3Qty = Utility.getDefaultValue(req.getParameter("Book3Qty"),0)+ Utility.getDefaultValue(req.getParameter("book3_qty"),0); -String reWrittenURL = res.encodeURL("/ShoppingApp/ BookShoppingServlet?Book1Qty="+Book1Qty+" &Book2Qty="+Book2Qty+"&Book3Qty="+Book3Qty); outputObject.println("<FORM name=\"addcart\" action="+reWrittenURL+" method=\"post\">"); } ...}//end of BookShoppingServlet
If you look at the servlet program, the only difference in the code is the addition of the doSessionUsingURLRewriting() method, which performs the session handling for the servlet. This method is called from the doPost() method.
The doSessionUsingURLRewriting() method retrieves the existing contents of the shopping cart using the getParameter() method of the request object. Also, note that to demonstrate the appending of the session ID in URL rewriting, the HTML form's method was changed to GET instead of the default POST method. This enables you to look at the session ID appended to the URL.
To determine whether the user action is Add To Cart or View Cart, retrieve the value of the buttonName parameter from the request. This is similar to what was done for the previous session-handling techniques:
outputObject.println("<FORM name=\"viewcart\" action=\"/ShoppingApp/BookShoppingServlet\" method=\"get\">");
For the Add To Cart function, you need to retrieve the contents of the shopping cart as well as the new user selections. This is done by calling the rewriteURL() method. The shopping cart contents are retrieved by calling the getParameter() method with the parameter name as Book1Qty. The user selection is retrieved by calling the getParameter() method with the parameter name as book1_qty. These new shopping cart contents are then calculated:
int Book1Qty = Utility.getDefaultValue(req.getParameter("Book1Qty"),0)+ Utility.getDefaultValue(req.getParameter("book1_qty"),0);
Similar calculations are done for the other books in your store.
Since the HTML form in the book-listing page is now sending the form data in a GET request instead of a POST request, you have to modify the action URL and append the shopping cart
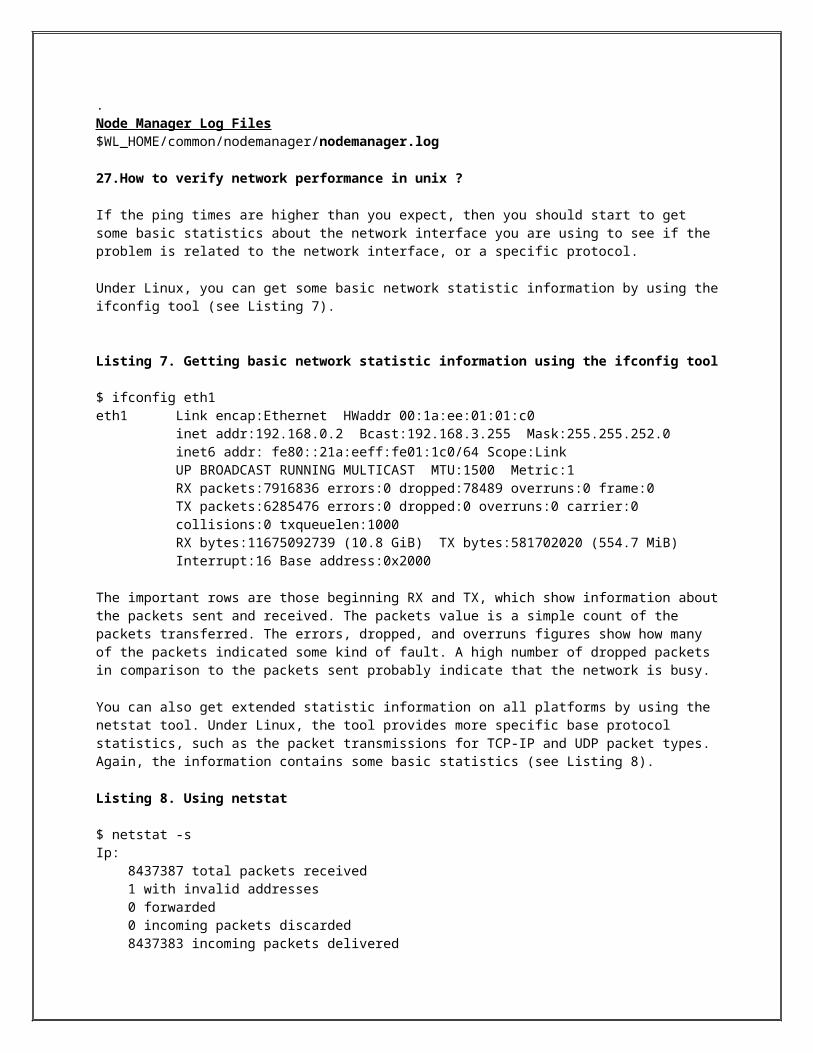
contents (updated with the user selection). This form-action URL is generated using the encodeURL() method, thus enabling the WebLogic Server to append the session ID to the URL:
String reWrittenURL = res.encodeURL("/ShoppingApp/BookShoppingServlet? Book1Qty="+Book1Qty+"&Book2Qty="+Book2Qty+"&Book3Qty="+Book3Qty);
Finally, send the book-listing page back to the browser.
For the View Cart function, you need to retrieve the contents of the shopping cart stored in the browser. This is done by the following call:
int book1Qty = Utility.getDefaultValue(req.getParameter("Book1Qty"),0);
This is similar to the retrieval of shopping contents for the Add To Cart function. The only difference is that there will be no new user selections and hence no updates required to the shopping cart data. You will perform similar actions for the rest of the books in your store.
Finally, generate the View Cart page using the writeViewCartZone() method with the retrieved shopping cart data as parameters.
To keep the application simple, no functionality for emptying or removing the contents of the shopping cart is provided.
Compile the Program
Since you are not adding any new classes nor are you changing the deployment location of the application, the compiling of the servlet program is similar to compiling performed in the hidden-variables session-handling method.
Deploy the Program
You need to edit the WebLogic Server–specific deployment descriptor file weblogic.xml to enable the settings for URL rewriting. To do this, set the following tags:
<session-descriptor> <session-param>URLRewritingEnabled</session-param> <session-value>true</session-value></session-descriptor>
In web.xml<session-config> <session-timeout>30</session-timeout> </session-config>
*****************************************************
33.What is VAMSTAT command in solaris ?
vmstat - report virtual memory statistics
SYNOPSIS vmstat [ -cisS ] [ disks ] [ interval [ count ] ]
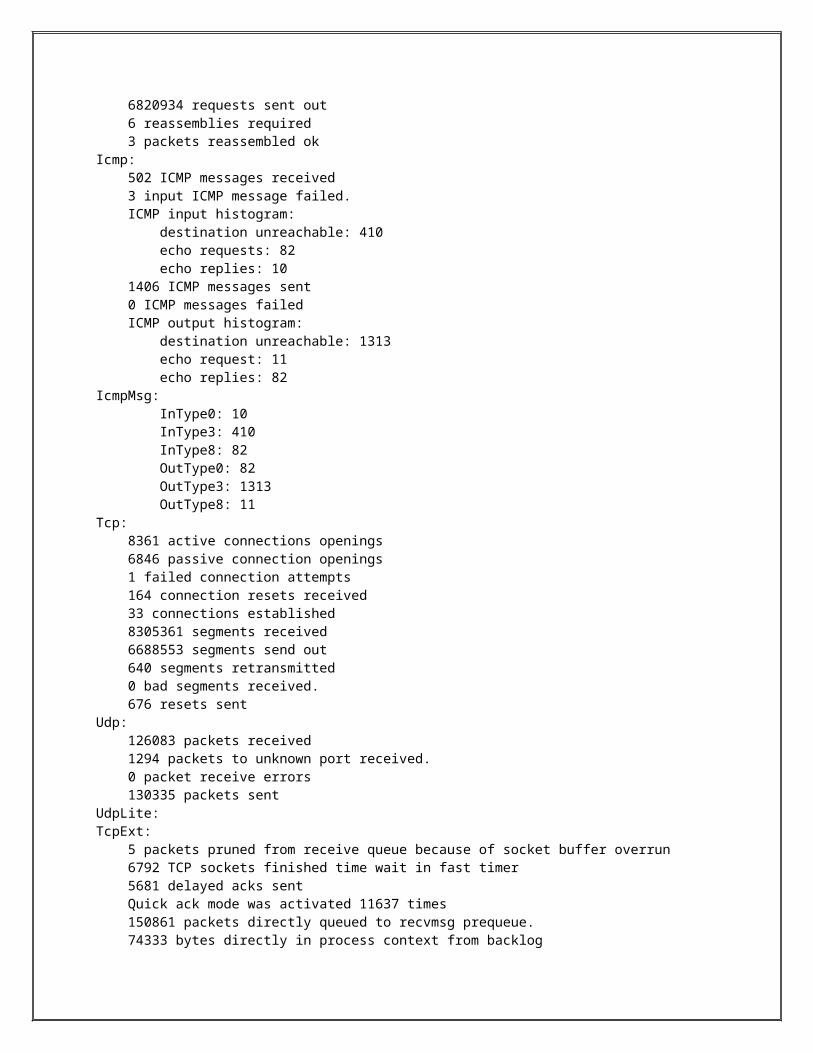
vmstat delves into the system and reports certain statistics kept about process, virtual memory, disk, trap and CPU activity. Note: vmstat statistics are only supported for certain devices.
Without options, vmstat displays a one-line summary of the virtual memory activity since the system was booted. If interval is specified, vmstat summarizes activity over the last interval seconds, repeating forever. If a count is given, the statistics are repeated count times. Note: interval and count do not apply to the -i and -s options. If disks are specified, they are given priority when vmstat chooses which disks to display (only four fit on a line). Common disk names are id, sd, xd, or xy, followed by a number, for example, sd2, xd0, and so forth. For more gen- eral system statistics, use sar(1), iostat(1M), or sar(1M).
-c Report cache flushing statistics. By default, report the total number of each kind of cache flushed since boot time. The types are: user, context, region, seg- ment, page, and partial-page.
-i Report the number of interrupts per device.
-s Display the total number of various system events since boot.
-S Report on swapping rather than paging activity. This option will change two fields in vmstat's ``paging'' display: rather than the ``re'' and ``mf'' fields, vmstat will report ``si'' (swap-ins) and ``so'' (swap- outs).
*****************************************************
34.How do you find out port numbers in linux?
In linux we have commandslsof -i TCP (displays online open tcp ports)lsof -i UDPabove commands work for linux onlynetstat -anp | head -20 nmap -anp ( if the nmap utility is installed in linux system)thru netstat only we can get much of the information regarding the open ports
35.What are the difference between authentication and authorization ?
Authentication An authentication system is how you identify yourself to the computer. The goal behind an authentication system is to verify that the user is actually who they say they are. There are many ways of authenticating a user.Like
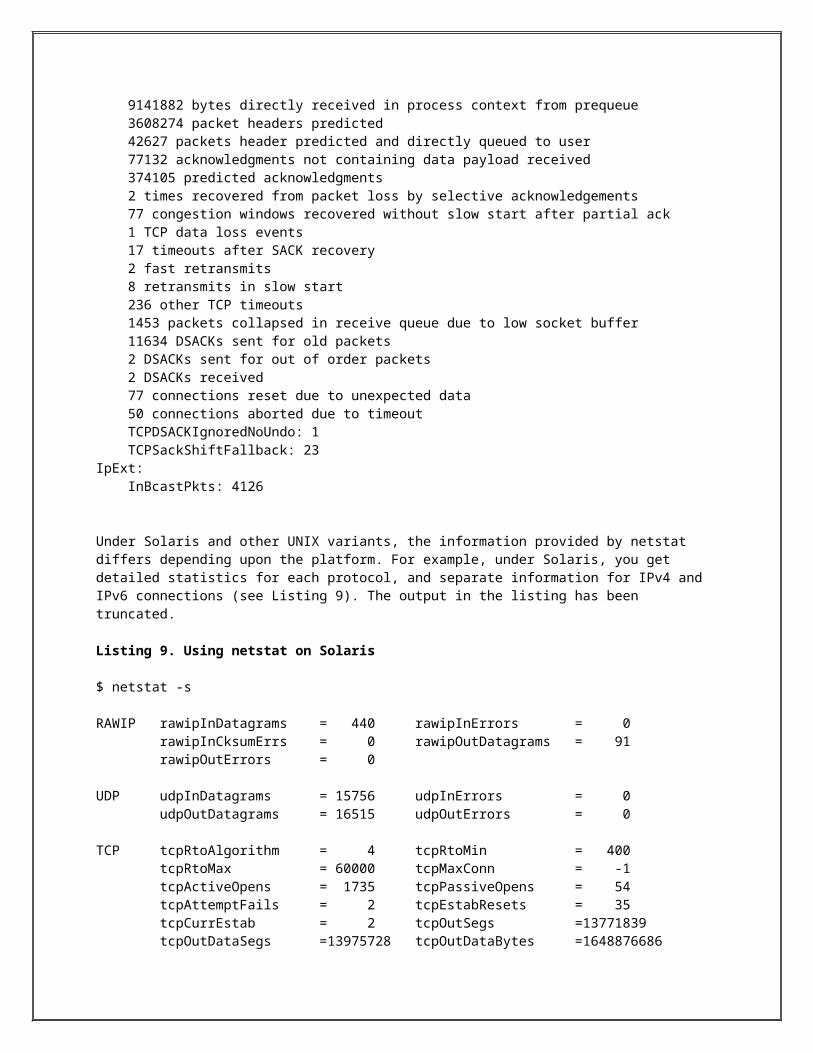
Password based authentication Device based authentication Biometric Authentication
Authorization Once the system knows who the user is through authentication, authorization is how the system decides what the user can do.A good example of this is using group permissions or the difference between a normal user and the superuser on a unix system.
36.Application is working but DB is not suppoting what kind of exception you will get?
ORA-12505,TNS:Listener does not currently know of SID give in connect descriptor The connection Descriptor used by the client was 192.167.221.224:1521:xe
192.167.221.224------ip address of database running system1521-------port numberXe------database service name or schema name
Weblogic.application.ModuleException:At weblogic.jdbc.module.JDBCModule.prepare<JDBCModule.java289>
******************************************************************
37.Garbage collection Related topic
Most articles about Garbage Collection ignore the fact that the Sun Hotspot JVM is not the only game in town. In fact whenever you have to work with either IBM WebSphere or Oracle WebLogic you will run on a different runtime. While the concept of Garbage Collection is the same, the implementation is not and neither are the default settings or how to tune it. This often leads to unexpected problems when running the first load tests or in the worst case when going live. So let’s look at the different JVMs, what makes them unique and how to ensure that Garbage Collection is running smooth.
The Garbage Collection ergonomics of the Sun Hotspot JVMEverybody believes to know how Garbage Collection works in the Sun Hotspot JVM, but lets take a closer look for the purpose of reference.
The memory model of the Sun Hotspot JVM
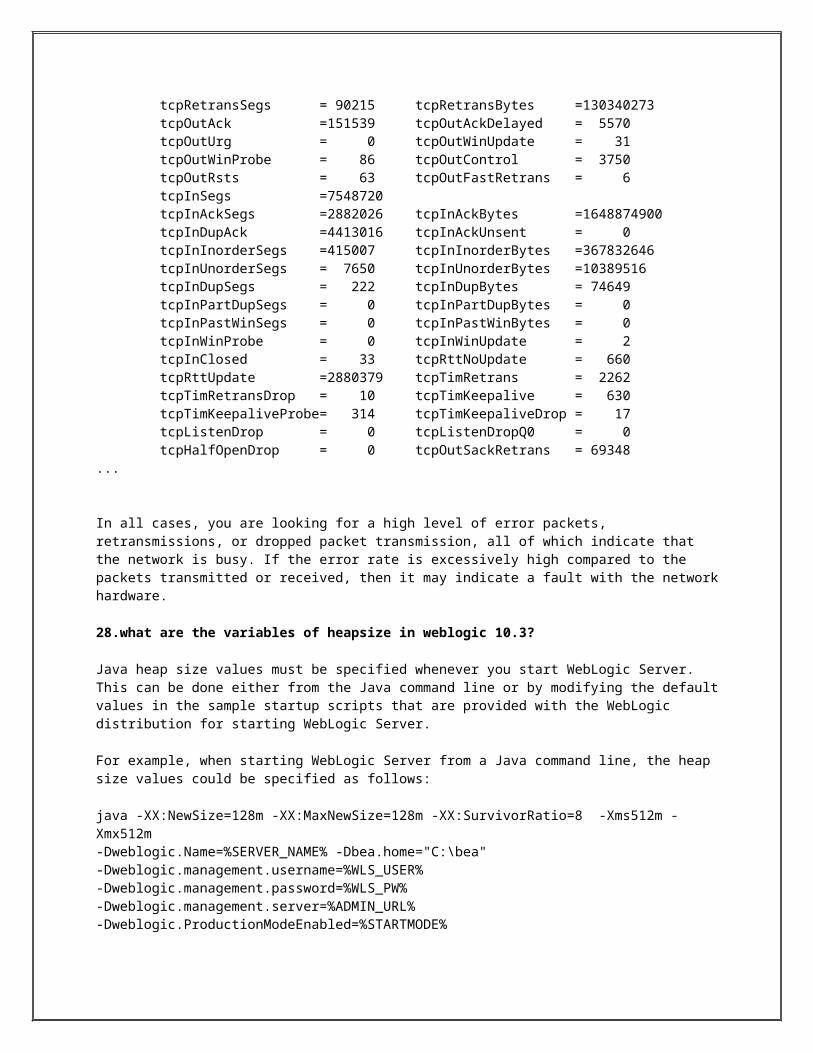
The Generational HeapThe Hotspot JVM is always using a Generational Heap. Objects are first allocated in the young generation, specifically in the Eden area. Whenever the Eden space is full a young generation garbage collection is triggered. This will copy the few remaining live objects into the empty survivor space. In addition objects that have been copied to Survivor in the previous garbage collection will be checked and the live ones will be copied as well. The result is that objects only exist in one survivor, while eden and the other survivor is empty. This form of Garbage Collection is called copy collection. It is fast as long as nearly all objects have died. In addition allocation is always fast because no fragmentation occurs. Objects that survive a couple of garbage collections are considered old and are promoted into the Tenured/Old space.
Tenured Generation GCsThe Mark and Sweep algorithms used in the Tenured space are different because they do not copy objects. As we have seen in one of my previous posts garbage collection takes longer the more objects are alive. Consequently GC runs in tenured are nearly always expensive which is why we want to avoid them. In order to avoid GCs we need to ensure that objects are only copied from Young to Old when they are permanent and in addition ensure that the tenured does not run full. Therefore generation sizing is the single most important optimization for the GC in the Hotspot JVM. If we cannot prevent objects from being copied to Tenured space once in a while we can use the Concurrent Mark and Sweep algorithm which collects objects concurrent to the application.
Comparison of the different Garbage Collector Strategies
While that shortens the suspensions it does not prevent them and they will occur more frequently. The Tenured space also suffers from another problem, fragmentation. Fragmentation leads to slower allocation, longer sweep phases and eventually out of memory errors when the holes get too small for big objects.
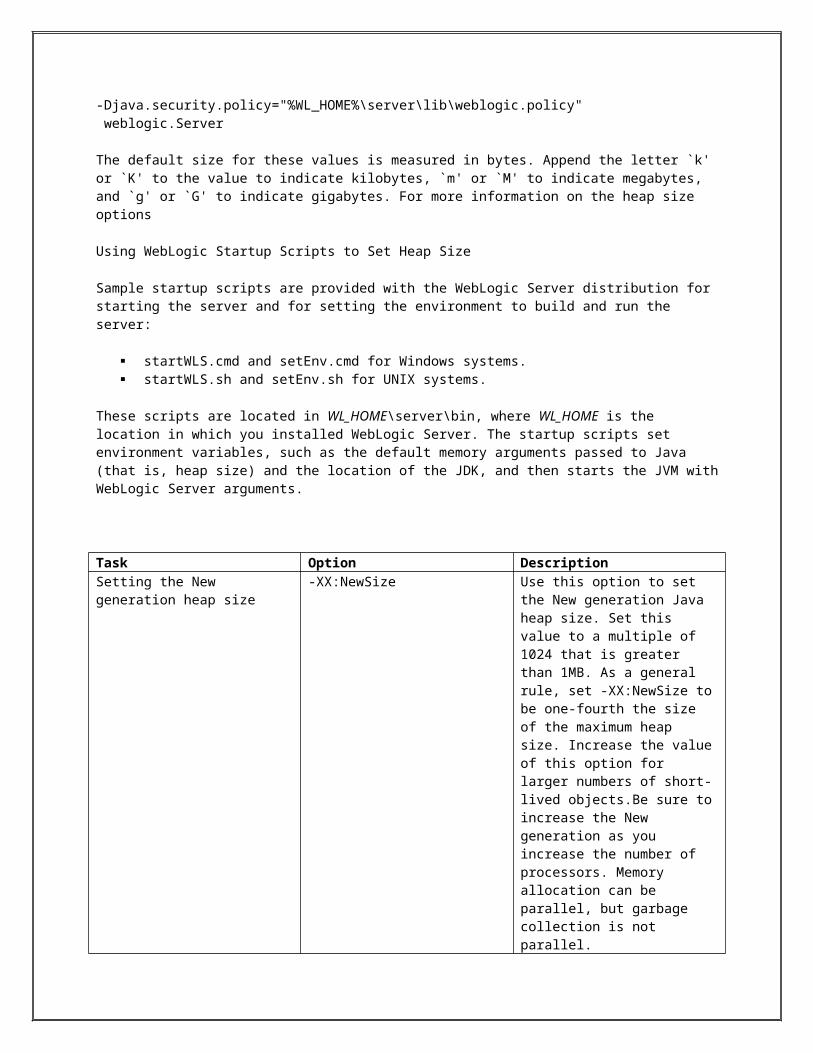
Java Heap before and after compacting
This is remedied by a compacting phase. The serial and parallel compacting GC perform compaction for every GC run in the Tenured space. Important to note is that, while the parallel GC performs compacting every time, it does not compact the whole Tenured heap but just the area that is worth the effort. Worth the effort means when the heap has reached a certain level of fragmentation. In contrast, the Concurrent Mark and Sweep does not compact at all. Once objects cannot be allocated anymore a serial major GC is triggered. When choosing the concurrent mark and sweep strategy we have to be aware of that side affect.
The second big tuning option is therefore the choice of the right GC strategy. It has big implications for the impact the GC has on the application performance. The last and least known tuning option is around fragmentation and compacting. The Hotspot JVM does not provide a lot of options to tune it, so the only way is to tune the code directly and reduce the number of allocations.
There is another space in the Hotspot JVM that we all came to love over the years, the Permanent Generation. It holds classes and string constants that are part of those classes. While Garbage Collection is executed in the permanent generation, it only happens during a major GC. You might want to read up what a Major GC actually is, as it does not mean a Old Generation GC. Because a major GC does not happen often and mostly nothing happens in the permanent generation, many people think that the Hotspot JVM does not do garbage collection there at all.
Over the years all of us run into many different forms of the OutOfMemory situations in PermGen and you will be happy to hear that Oracle intends to do away with it in the future versions of Hotspot.
Oracle JRockitNow that we had a look at Hotspot, let us look at the difference in the Oracle JRockit. JRockit is used by Oracle WebLogic Server and Oracle has announced that it will merge it with the Hotspot JVM in the future.
Heap Strategy
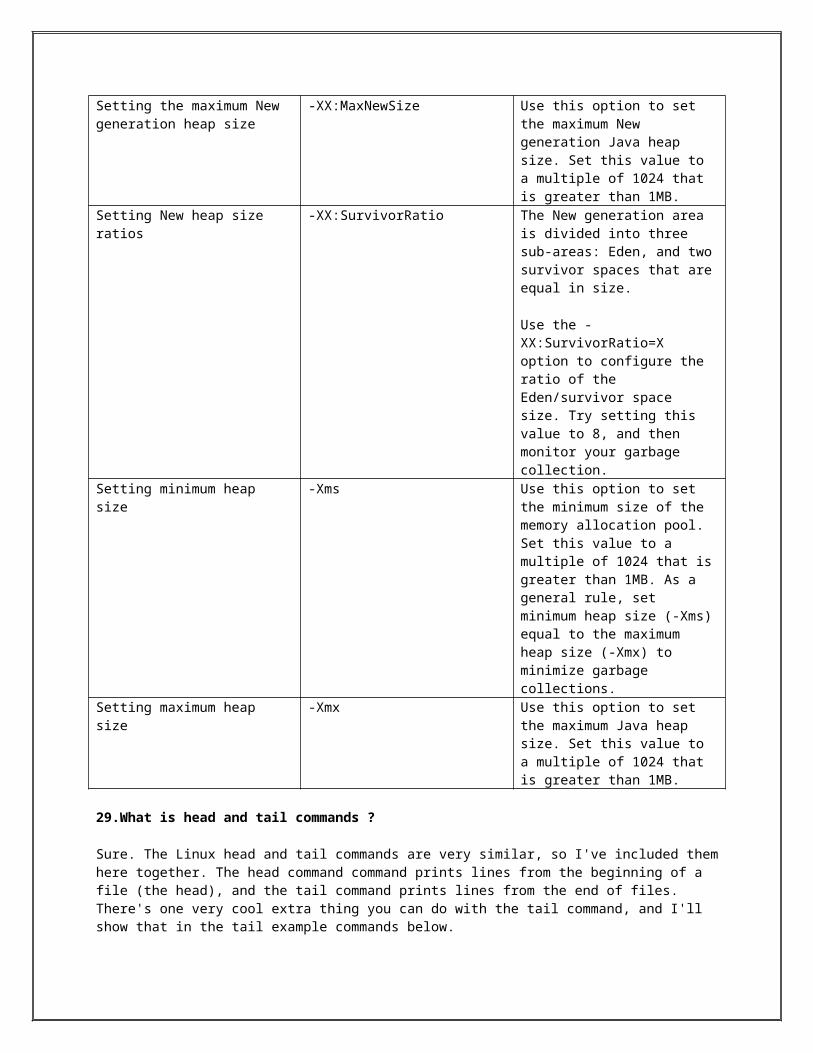
The biggest difference is the heap strategy itself. While Oracle JRockit does have a generational heap it also supports a so called continuous heap. In addition the generational heap looks different as well.
Heap of the Oracle JRockit JVM
The Young space is called Nursery and it only has two areas. When objects are first allocated they are placed in a so called Keep Area. Objects in the Keep Area are not considered during garbage collection while all other objects still alive are immediately promoted to tenured. That has major implications for the sizing of the Nursery. While you can configure how often objects are copied between the two survivors in the Hotspot JVM, JRockit promotes objects in the second Young Generation GC.
38.Complete trouble shooting steps ?
39. Disabling and Enabling Admin Console
Many at times for most of our administration work including the changes (deployments, start/stop of servers, etc) or configurations (JMS, creation/deletion/editing of our servers, etc) we use our weblogic admin console.
But, for security reasons some of the banking companies for its core banking applications prefer to disable the admin console in its banking applications.
This short and sweet article mainly targets to present you on how to enable and disable your admin console:
Disabling your Admin Console:
We can disable our weblogic admin console in two different ways
1) Admin console
2) Weblogic Scripting Tool
From Admin console:-
To disable access to the Administration Console:
1. After you log in to admin console click Lock & Edit.2. In the left pane of the Console, under Domain Structure, select the domain name.

3. Select Configuration > General, and click Advanced at the bottom of the page.4. Deselect Console Enabled.5. Click Save.6. To activate these changes, click Activate Changes.
From WLST:-
connect(“weblogic“,”weblogic“,”t3://localhost:7001“)
edit()
startEdit()
cmo.setConsoleEnabled(false)
save()
activate()
disconnect()
exit()
Enabling the Admin Console:
After we disable the admin console we can enable it again by using WLST.
Following are the steps on the same:
connect(“weblogic“,”weblogic“,”t3://localhost:7001“)
edit()
startEdit()
cmo.setConsoleEnabled(true)
save()
activate()
disconnect()
exit()
40.how to findout the application status using WLST?
connect('weblogic','weblogic','t3://localhost:8001')
domainRuntime()
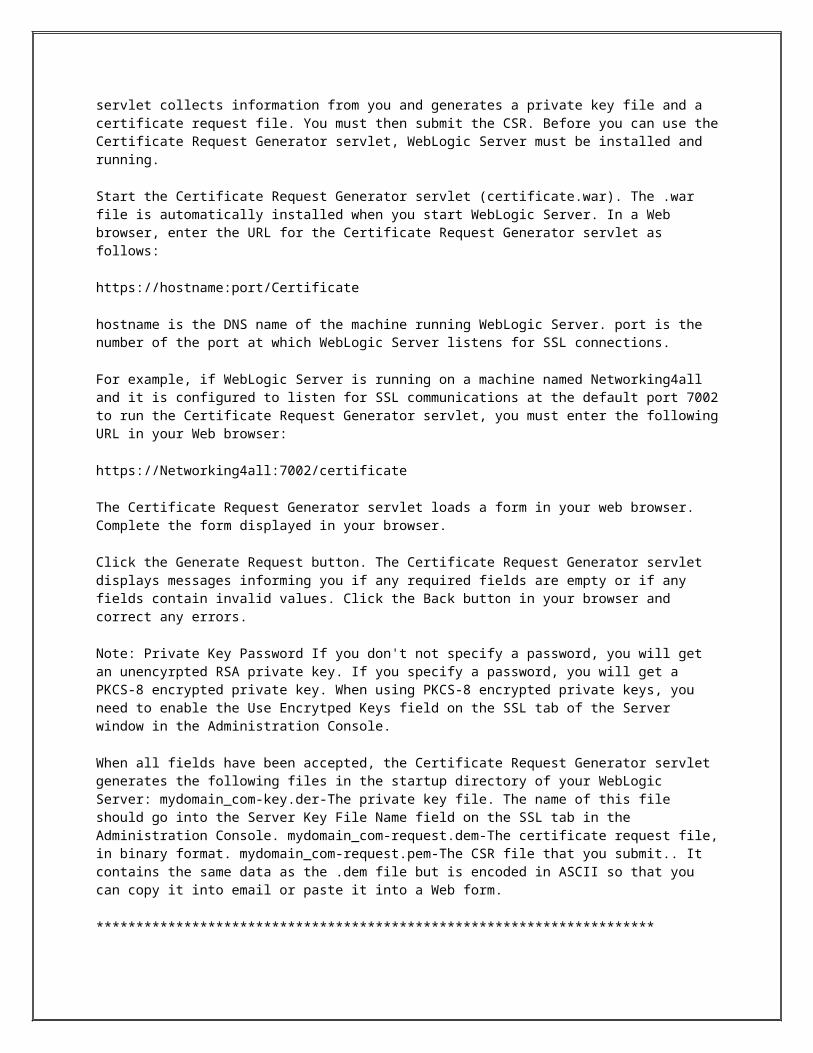
cd('AppRuntimeStateRuntime/AppRuntimeStateRuntime')
AppList = cmo.getApplicationIds()
print '####### Application ####### Application State\n'
print '***********************************************\n'
for App in AppList:
print '#######',App ,' #######', cmo.getIntendedState(App)
print '***********************************************\n'
41.How to find out the server status using WLST?
username = 'weblogic'
password = 'weblogic'
URL='t3://localhost:8001'
connect(username,password,URL)
domainRuntime()
cd('ServerRuntimes')
servers=domainRuntimeService.getServerRuntimes()
for server in servers:
serverName=server.getName();
print '**************************************************'
print '############## serverName ###############'
print '**************************************************'
print '##### Server State #####', server.getState()
print '##### Server ListenAddress #####', server.getListenAddress()
print '##### Server ListenPort #####', server.getListenPort()
print '##### Server Health State #####', server.getHealthState()
*************************************************************
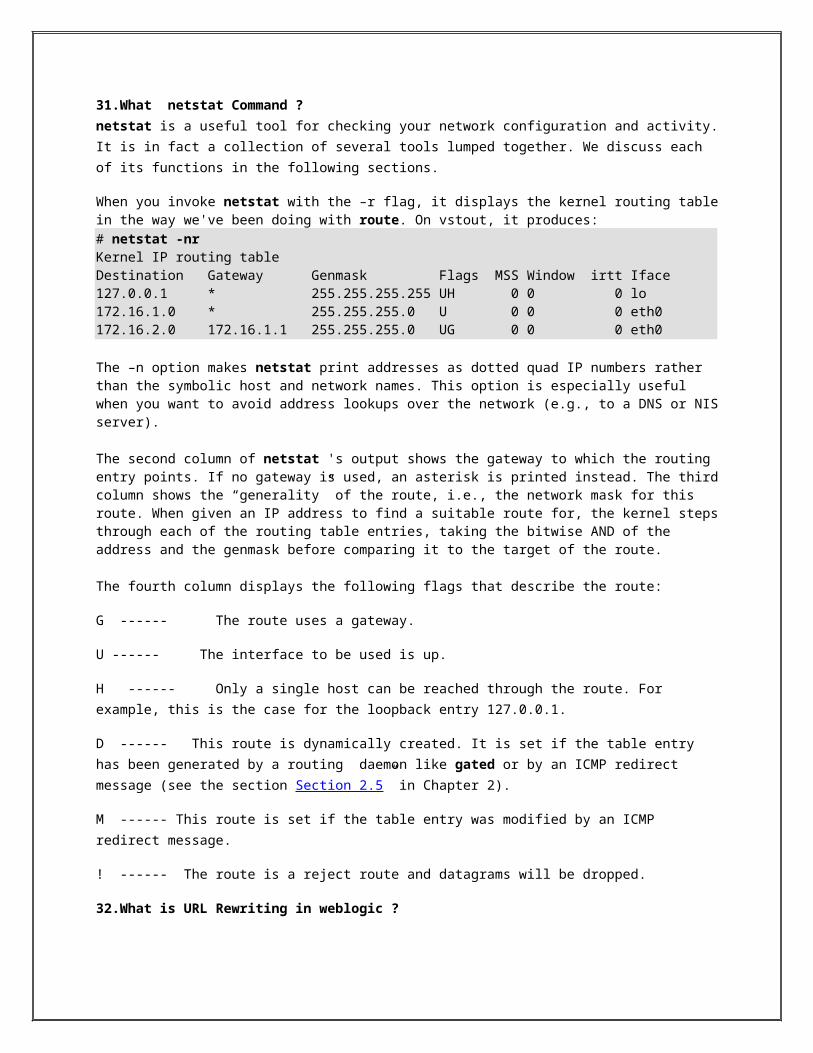
Understanding Server States in the Server Life Cycle
SHUTDOWN State
In the SHUTDOWN state, a WebLogic Server instance is configured but inactive.
A server instance enters the SHUTDOWN state as result of a Shutdown or Force Shutdown command. In addition, a server instance can kill itself when it detects, as a result of self-health monitoring, that it has become unstable. Only a server instance with its Auto Kill If Failed attribute is true will kill itself when it detects that it is failed
You can transition a server instance in the SHUTDOWN state to the STARTING state with the Start, Start in Admin, or Start in Standby commands.
STARTING State
During the STARTING state, a WebLogic Server instance transitions from SHUTDOWN to STANDBY, as a result of a Start, Start in Admin, or Start in Standby command.
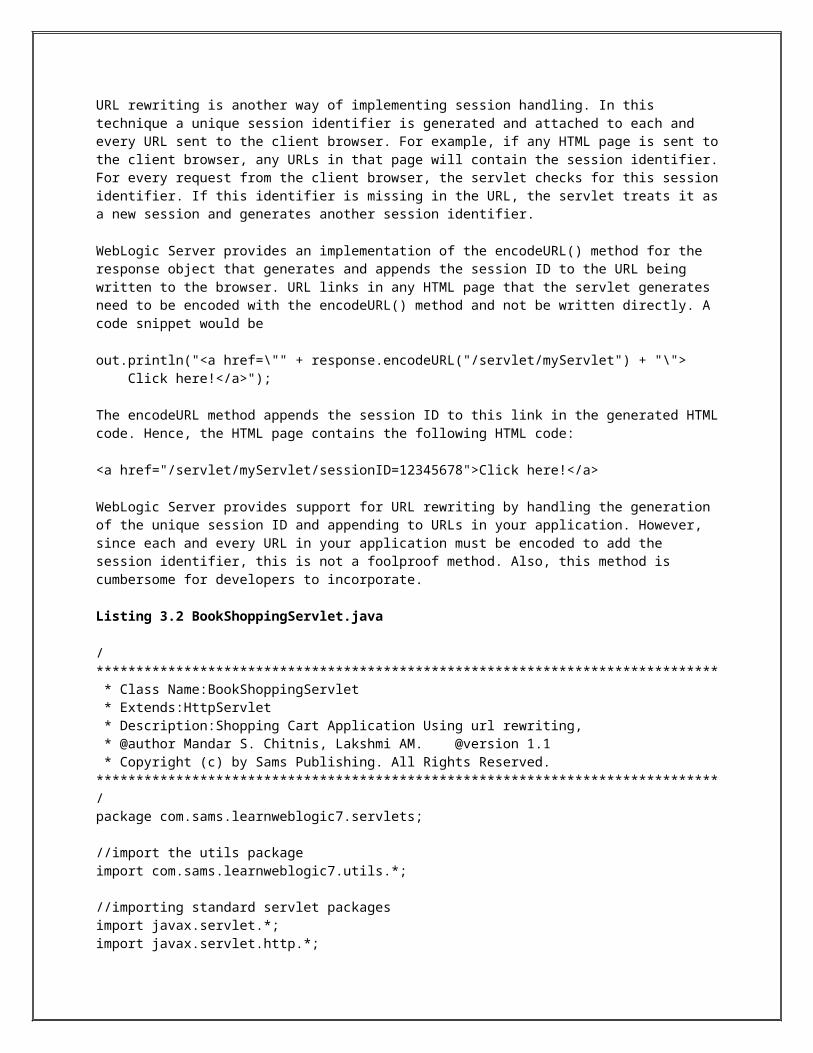
In the STARTING state, a server instance cannot accept any client or administrative requests.
The server instance obtains its configuration data:
An Administration Server retrieves domain configuration data, including the domain security configuration, from its config directory.
A Managed Server contacts the Administration Server for its configuration and security data. If the Managed Server is configured for SSL communications, it uses its own certificate files, key files, and other SSL-related files and contacts the Administration Server for the remaining configuration and security data.
Note: If the Managed Server cannot contact its Administration Server, by default, it starts up in Managed Server Independence mode, using its locally cached copy of the domain config directory.
ADMIN State
In the ADMIN state, WebLogic Server is up and running, but available only for administration operations, allowing you to perform server and application-level administration tasks. When a server instance is in the ADMIN state:
The Administration Console is available. The server instance accepts requests from users with the admin role. Requests from non-admin users are refused. Applications are activated in the application ADMIN state. They accept requests only from users with the admin role. A user with the admin role accessing an application in the application ADMIN state continues to have access to all application functionality, not just administrative functions. The JDBC, JMS, and JTA subsystems are active, and administrative operations can be performed upon them. However, you do not have to have administrator-level priviledges to access these subsystems when the server is in the ADMIN state. Deployments or re-deployments are allowed, and take effect when you transition the server instance from the ADMIN to the RUNNING state (using the Resume command). ClusterService is active and listens for heartbeats and announcements from other cluster members. It can detect that other Managed Servers have joined the cluster, but is invisible to other cluster members.
You can transition a server instance to the ADMIN state using the Start in Admin, Suspend, or Force Suspend commands.
A server instance transitions through the ADMIN state as a result of Start, Shutdown, and Force Shutdown commands.
You can transition a server instance in the ADMIN state to RUNNING with the Resume command, or to SHUTDOWN, with the Shutdown or Force Shutdown command.
RESUMING State
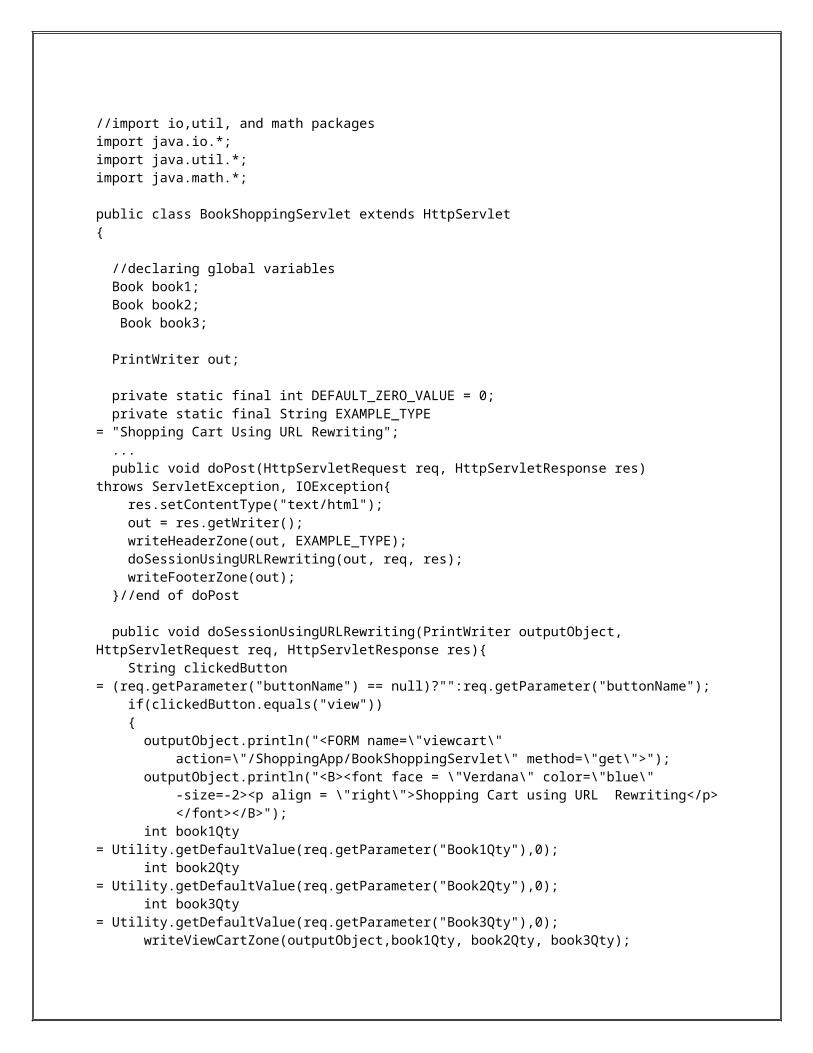
During this transitional state, WebLogic Server performs the operations required to move itself from the STANDBY or ADMIN state to the RUNNING state.
A server instance transitions to the RESUMING state when you issue the Resume command. A server instance transitions through the RESUMING state when you issue the Start command.
RUNNING State
In the RUNNING state, WebLogic Server is fully functional, offers its services to clients, and can operate as a full member of a cluster.
A server instance transitions to the RUNNING state as a result of the Start command, or the Resume command from the ADMIN or STANDBY states.
You can transition a server instance in the RUNNING state to the SUSPENDING state or the FORCE_SUSPENDING state using graceful and force Suspend and Shutdown commands.
FORCE_SUSPENDING State
During this transitional state, WebLogic Server performs the operations required to place itself in the ADMIN state, suspending a subset of WebLogic Server subsystems and services in an ordered fashion. During the FORCE_SUSPENDING state, WebLogic Server does not complete in-flight work gracefully; application work in progress is abandoned.
A server instance transitions through the FORCE_SUSPENDING state when you issue the Force Suspend or Force Shutdown command.
SHUTTING_DOWN State
During this transitional state, WebLogic Server completes the suspension of subsystems and services and does not accept application or administration requests.
A server instance transitions to the SHUTTING_DOWN state when you issue a Shutdown or Force Shutdown command.
FAILED State
A running server instance can fail as a result of out-of-memory exceptions or stuck application threads, or if one or more critical services become dysfunctional. A server instance monitors its health, and upon detecting that one or more critical subsystems are unstable, it declares itself FAILED.
A FAILED server instance cannot satisfy administrative or client requests.
When a server instance enters the FAILED state, it attempts to return to a non-failed state. If it failed prior to reaching the ADMIN state, the server instance
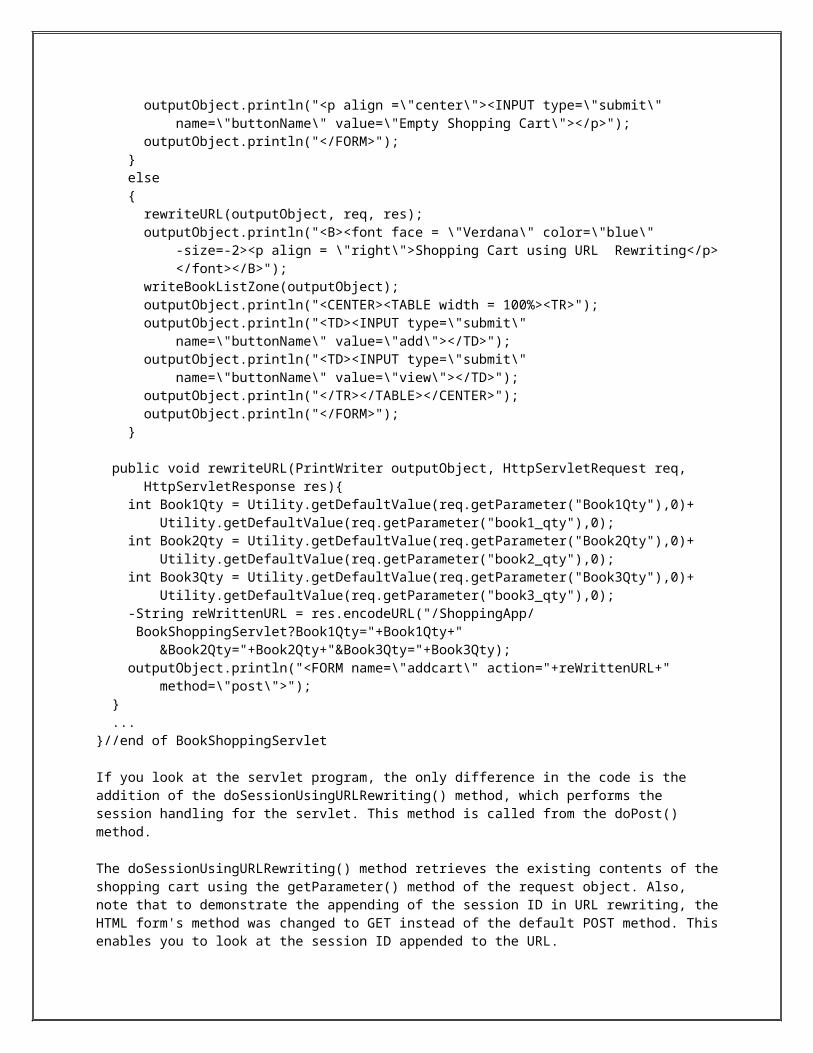
shuts itself down with an exit code that is less than zero.
If the server instance fails after reaching the ADMIN state, but before reaching the RUNNING state, by default, it returns to the ADMIN state, if the administration port is enabled.
Note: If desired, you can configure a server instance that fails after reaching the ADMIN state, to shut itself down, rather than return to the ADMIN state
A server instance can enter the FAILED state from any other state. However, once a server instance has entered the FAILED state, it cannot return to a running state directly. The FAILED state is fatal and a server must go into the ADMIN or SHUTDOWN state before returning to the RUNNING state.
Note: It is theortically possible that a server could become available again once the FAILED state is entered, for example if hung threads causing a failed state become unhung.
Note: However, once FAILED state is entered, a server must go into the ADMIN or SHUTDOWN states before returning to RUNNING.