Embed Size (px)
Citation preview

© WCRI 2020
January 30, 2020
Webinar: Highlights From Recent CompScope™ Studies For
Pennsylvania

© WCRI 2020
• Independent, not-for-profit research organization providing high-quality, objective information about public policy issues involving workers’ compensation systems
• Serve as a resource for public officials and stakeholders, but we do not make recommendations or take positions
• Studies are peer-reviewed with a focus on benefit delivery
• Diverse membership support, including gov’t agencies, employers, insurers, labor unions, service providers, etc.
2
About WCRI

© WCRI 2020
• The presentation is 30 minutes long: 25 minutes of slides and 5 minutes for your questions
• To submit a question, use the “Questions” box located on the right-hand side of your screen
• If you are having issues with your connection or audio, please call GoToWebinar at 1-800-263-6317
3
About The Webinar

© WCRI 2020
• A copy of the slides can be downloaded under “Handouts” on the right-hand side of your screen
• Today’s presentation is being recorded and will be provided within 48 hours
• At the end of the webinar we ask that you take a short online survey. For every completed survey, WCRI will donate $2.00 to Kids’ Chance
4
About The Webinar (Cont.)

© WCRI 2020
Your Presenter – Will Monnin-Browder
Mr. Monnin-Browder studies the performance of state workers’ compensation systems as part of WCRI’s CompScope™ benchmarking team. He previously served as executive director of the Massachusetts Workers’ Compensation Advisory Council and as legal counsel to the Massachusetts Legislature’s Joint Committee on Labor and Workforce Development. Mr. Monnin-Browder received his B.A. from Tufts University and his J.D. from Suffolk University Law School.
5

© WCRI 2020
January 30, 2020
Webinar: Highlights From Recent CompScope™ Studies For
Pennsylvania

© WCRI 2020
Main Questions Addressed Today
• What are the major cost drivers in Pennsylvania’s workers’ compensation system?
• How does Pennsylvania compare to other states on different system performance metrics?
• How have those system performance metrics changed over time?
7

© WCRI 2020
What Is CompScope™?
• Annual benchmarking studies that compare state WC benefit delivery systems
• Contains 18 larger-than-average states representing over 60% of U.S. WC benefits paid
• Goals:• Facilitate continuous improvement of state WC systems• Monitor the impact of reforms• Ground public policy debates in facts that are based on
data
8

© WCRI 2020
Scope Of CompScope™ Multistate Benchmarks
9
CompScope™ MedicalCompScope™• Benefit amounts• Timeliness• Medical costs• Disability duration• Attorney involvement• Vocational rehabilitation use• Benefit delivery expenses
• Medical costs• Medical prices• Utilization of services• By provider type• By service type

© WCRI 2020
Findings From Recent WCRI CompScope™ Reports For Pennsylvania
• Total costs per claim and key components higher in PA compared with other study states • Higher indemnity benefits per claim: Drivers were longer
duration of temporary disability and larger settlements• Higher medical payments per claim: Higher utilization partially
offset by lower-to-typical prices paid for medical services• Litigation expenses per claim were among the highest of study
states, likely related to system features and processes
• Total costs per claim increased 2-3 percent per year since 2012; key components stable or grew moderately
10
Findings included in this presentation are based on claims with more than seven days of lost timeSources: CompScope™ Benchmarks For Pennsylvania, 19th Edition & CompScope™ Medical Benchmarks For Pennsylvania, 20th Edition

© WCRI 2020
PA Total Costs Per Claim With > 7 Days Lost Time Among Highest Of Study States
11
2015/2018 Claims With > 7 Days Of Lost Time, Adjusted For Injury/Industry Mix And Wages
$54,362
$0
$10,000
$20,000
$30,000
$40,000
$50,000
$60,000
$70,000
MI TN TX MA AR MN IN FL WI NJ CA GA IA IL NC VA PA LA
Aver
age
Tota
l Cos
t Per
Cla
im Median State: $41,888

© WCRI 2020
Indemnity, Medical, & Expenses All Contributed To Higher Total Costs Per Claim In Pennsylvania
12
* With Expenses2015/2018 Claims With > 7 Days Of Lost Time, Adjusted For Injury/Industry Mix And Wages
Total Costs Per Claim
Indemnity Benefits/Claim
Medical Payments/Claim
Benefit Delivery Expenses/Claim*
Total Costs Per Claim:30% Higher Than Median Study State
Indemnity Benefits/Claim:
52% Higher Than Median
Medical Payments/Claim:20% Higher Than
Median
Benefit Delivery Expenses/Claim*25% Higher Than
Median
Benefit Delivery Expenses/Claim*
Medical Cost Containment Expenses Per Claim: Typical
Litigation Expenses/Claim: Higher

© WCRI 2020
Indemnity Benefits Per Claim In Pennsylvania Among Highest Of Study States
13
2015/2018 Claims With > 7 Days Of Lost Time, Adjusted For Injury/Industry Mix And WagesIndemnity benefits include settlements, which may include some amount for future medical payments.
$27,055
$0
$5,000
$10,000
$15,000
$20,000
$25,000
$30,000
$35,000
WI IN TX MI TN AR NJ MN FL MA VA CA IL IA LA GA PA NC
Aver
age
Inde
mni
ty B
enef
it/Cl
aim Median State: $17,778

© WCRI 2020
Factors Contributing To Higher-Than-Typical Indemnity Benefits Per Claim In Pennsylvania
14
• Longer duration of temporary disability compared with other study states
• Higher average temporary total disability benefit rate• Larger lump-sum settlements and a higher
percentage of claims with lump sums compared with most other wage-loss states

© WCRI 2020
General Classification Of Indemnity Benefit Systems: Wage-Loss Versus PPD States
15
Indemnity Benefit Systems
Wage-Loss Benefit Systems
PPD Benefit Systems
5 Study States:
LA, MA, MI, PA, VA
11 Study States:
AR, CA, FL, IA, IL, IN, MN, NJ, TN, TX, WI
2 Study States:
GA, NC
Attributes Of Both Wage-Loss And PPD

© WCRI 2020
Longer Duration Of Temporary Disability Contributed To Higher Indemnity Benefits Per Claim In PA
16
2015/2018 Claims With > 7 Days Of Lost Time, Adjusted For Injury/Industry Mix And Wages
11 11 12 12 12 1314 14
1718 20 20 21
1618
22 23
32
0
5
10
15
20
25
30
35
WI IA FL TN IN MN AR NJ TX IL CA GA NC MI VA PA MA LA
Tem
pora
ry D
isab
ility
Dur
atio
n (w
eeks
) PPD Benefit System Wage-Loss Benefit System
Wage-Loss &
PPD

© WCRI 2020
PA Had Highest Weekly TTD Benefit Rate; Contributed To Higher Indemnity Benefits/Claim
Measure (2017/18) PARange Of Study States
Min. Median Max.
Average TTD Weekly Benefit Rate $545 $444 $513 $545
Maximum TTD Benefit As % SAWW* 100% 75% 100% 200%
Maximum Statutory TTD Benefit** $995 $575 $970 $1,720
AWW Of Injured Workers $852 $716 $804 $914
Statutory TTD Benefit Rate as % Of AWW*** 66⅔% 60% 66⅔% 70%
% Workers With Benefits Limited By Maximum 11% 0.1% 10% 30%
172017/18 Claims With > 7 Days Of Lost Time, Adjusted For Injury/Industry Mix
*Georgia and Indiana have no provisions; the maximum benefit as a percentage of the SAWW is calculated. **Maximum Statutory Weekly Benefit As Of July 1, 2017***Some states use 80% of spendable earnings.Note: In Texas, the maximum weekly statutory TTD benefit is set at the state average wage, which is 88% of the average weekly wage in covered employment as computed by the Texas Workforce Commission.

© WCRI 2020
$57,781
$0
$20,000
$40,000
$60,000
$80,000
TX NJ IN TN FL WI CA IL AR MN IA NC GA LA VA MI MA PA+ +
PA Lump-Sum Payments Per Claim Highest Of The Study States
18
2015/2018 Claims With Lump-Sum Payments As % Of Claims With > 7 Days Of Lost Time, Adjusted For Injury/Industry Mix And Wages
12%17%
23%25% 27%
0%10%20%30%40%50%
TX WI AR MN NJ IN IA TN FL CA IL GA NC MI MA VA PA LA
+ No/Little Lump Sum Of Future Medical
++ ++
Wage-Loss Benefit System
PPD Benefit SystemWage-Loss
& PPD
Average Lump-Sum Payment Per Claim With Lump Sum
% Of Claims With Lump-Sum Settlements
PPD Benefit SystemWage-Loss
& PPDWage-Loss
Benefit System
++
© WCRI 2020
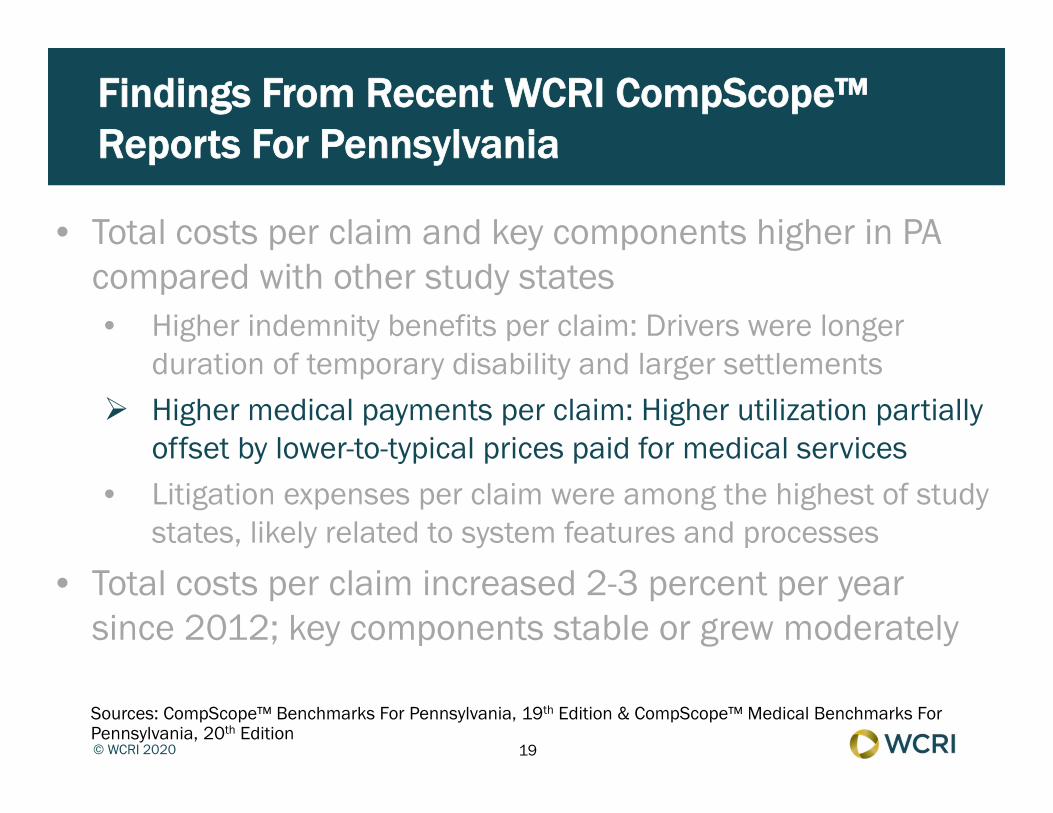
Findings From Recent WCRI CompScope™ Reports For Pennsylvania
• Total costs per claim and key components higher in PA compared with other study states • Higher indemnity benefits per claim: Drivers were longer
duration of temporary disability and larger settlements Higher medical payments per claim: Higher utilization partially
offset by lower-to-typical prices paid for medical services• Litigation expenses per claim were among the highest of study
states, likely related to system features and processes
• Total costs per claim increased 2-3 percent per year since 2012; key components stable or grew moderately
19
Sources: CompScope™ Benchmarks For Pennsylvania, 19th Edition & CompScope™ Medical Benchmarks For Pennsylvania, 20th Edition

© WCRI 2020
$19,280
$0$5,000
$10,000$15,000$20,000$25,000$30,000
MA CA MI TN TX NC AR MN GA FL PA NJ IL IA IN WI LA VA
2015/201818-State Median: $16,014
$13,951
$0$5,000
$10,000$15,000$20,000$25,000$30,000
MA CA TX MI NC TN MN GA FL AR PA IL NJ LA IA IN VA WI
PA Medical Payments/Claim Were In Middle Group Of Study States For 12- & 36-Month Claims
20
Claims With > 7 Days Of Lost Time, Adjusted For Injury/Industry Mix
2017/2018
Aver
age
Med
ical
Pay
men
t Per
Cla
im 18-State Median: $13,524

© WCRI 2020
Offsetting Components Resulted In Typical Medical Payments Per Claim In PA (2017/2018 Claims)
21
* Hospital inpatient is based on 2016/2018 claims. Physical medicine: PT/OTs were the largest provider of these services in terms of payments and volume of provided services.
2017/2018 Claims
PA Relative To Other Study States
Payments Per Claim
% Of Claims
Price OrPayments/Service
Utilization Or Services/Claim
Hospital Outpatient Higher Higher Lower Higher
Hospital Inpatient* Typical Typical n/a n/a
Physician Lower Typical Typical Typical
Providers Of Physical Medicine*
Higher Typical Typical Higher

© WCRI 2020
Findings From Recent WCRI CompScope™ Reports For Pennsylvania
• Total costs per claim and key components higher in PA compared with other study states • Higher indemnity benefits per claim: Drivers were longer
duration of temporary disability and larger settlements• Higher medical payments per claim: Higher utilization partially
offset by lower-to-typical prices paid for medical services Litigation expenses per claim were among the highest of study
states, likely related to system features and processes
• Total costs per claim increased 2-3 percent per year since 2012; key components stable or grew moderately
22
Sources: CompScope™ Benchmarks For Pennsylvania, 19th Edition & CompScope™ Medical Benchmarks For Pennsylvania, 20th Edition

© WCRI 2020
PA Had Highest Litigation Expenses Per Claim Of All Study States
23
2015/2018 Claims With > 7 Days Of Lost Time With Litigation Expenses, Adjusted For Injury/Industry Mix
$9,387
$0
$1,000
$2,000
$3,000
$4,000
$5,000
$6,000
$7,000
$8,000
$9,000
$10,000
TN WI TX IN AR NJ MI VA MA IA IL NC FL MN GA CA LA PA
Median State: $5,120
Note: Litigation expenses include payments that are allocated to individual claims.
Aver
age
Litig
atio
n Ex
pens
e Pe
r Cla
im
Litigation Expenses Include:• Defense Attorney• Medical-Legal• Ancillary Legal
Litigation Expenses Include:• Defense Attorney• Medical-Legal• Ancillary Legal

© WCRI 2020
Many Components Of Litigation Expenses Were Higher Than Typical In Pennsylvania
24
Note that the values shown for Pennsylvania and the median state reflect rounding; differences were calculated based on unrounded numbers.2015/2018 Claims With > 7 Days Of Lost Time, Adjusted For Injury/Industry Mix
Measure PAMedian State
% Or PPT Difference
(relative to median)% Of Claims With Defense Attorney (payments > $500) 33.8% 32.5%
1.3 ppt (typical)
Defense Attorney Payments/Claim (payments > $500) $7,452 $5,721
30% (higher)
% Of Claims With Medical-Legal Expenses 31.7% 22.4%
9.2 ppt(higher)
Medical-Legal Expenses/Claim $3,105 $2,035 53%
(higher)
% Of Claims With Ancillary Legal Expenses 38.6% 43.0%
-4.4 ppt(lower)
Ancillary Legal Expenses/Claim $2,294 $1,18693%
(among highest)

© WCRI 2020
Possible Reasons For Higher-Than-Typical Litigation Expenses Per Claim In Pennsylvania
• Defense attorney representation required at formal hearing
• Litigation and discovery—often involves multiple hearings to collect all of the evidence
• Medical evidence often provided through depositions rather than medical reports
25

© WCRI 2020
Findings From Recent WCRI CompScope™ Reports For Pennsylvania
• Total costs per claim and key components higher in PA compared with other study states • Higher indemnity benefits per claim: Drivers were longer
duration of temporary disability and larger settlements• Higher medical payments per claim: Higher utilization partially
offset by lower-to-typical prices paid for medical services• Litigation expenses per claim were among the highest of study
states, likely related to system features and processes
• Total costs per claim increased 2-3 percent per year since 2012; key components stable or grew moderately
26
Sources: CompScope™ Benchmarks For Pennsylvania, 19th Edition & CompScope™ Medical Benchmarks For Pennsylvania, 20th Edition

© WCRI 2020
Total Costs Per Claim In PA Increased 3%/Year At Most Maturities Since 2012
27
Claims With > 7 Days Of Lost Time, Not Adjusted For Injury/Industry Mix
$0
$10,000
$20,000
$30,000
$40,000
$50,000
$60,000
$70,000
Aver
age
Tota
l Cos
t Per
Cla
im
12 Months 24 Months 36 Months 48 Months
AAPC2000–2012
Since 2012
12 Mos. 6.9% 3.1%
24 Mos. 6.9% 3.3%
36 Mos. 6.5% 3.1%
48 Mos. 6.1% 2.4%

© WCRI 2020
PA Total Costs/Claim & Key Components Grew 3-4%/ Year Since 2012 (36 Mos.); Mostly Similar To Other States
28
Claims With > 7 Days Of Lost Time At 36 Months Of Experience, Not Adjusted For Injury/Industry Mix And Wages
-8%-6%-4%-2%0%2%4%6%8%
10%TN N
C CA IN GA WI
MI
MN VA NJ IL FL AR PA IA TX MA LA
-8%-6%-4%-2%0%2%4%6%8%
10%
CA NC IN GA
MN TN NJ
AR TX IL WI
MI
FL MA VA PA IA LA
-8%-6%-4%-2%0%2%4%6%8%
10%
TN WI
MI
VA GA IA NC IN NJ IL PA M
N CA FL MA
AR TX LA
-8%-6%-4%-2%0%2%4%6%8%
10%
TN FL CA GA IL
MA VA AR PA MI
NC WI
TX IN MN IA NJ
LA
AAPC
201
2/2
015
To
201
5/2
018
Total Costs/Claim Medical Payments/Claim
Indemnity Benefits/Claim BDE/Claim With BDE

© WCRI 2020
Increases In Wages & % Of Lump Sums Contributed To Growth In Indemnity Benefits/Claim Since 2012
Key Indemnity Metrics In PA
2012/2015 2015/2018Annual Avg. % or
PPT Change
Indemnity Benefits Per Claim $25,837 $28,261 3.0%
AWW Of Injured Workers $768 $807 1.7%
Duration Of Temporary Disability 22.8 weeks 21.8 weeks -1.5%
% Of Lump-Sum Claims 22.6% 25.4% 0.9 ppt
Average Lump-Sum Settlement Per Claim $59,915 $60,253 0.2%
29
Claims With > 7 Days Of Lost Time, Not Adjusted For Injury/Industry Mix And Wages

© WCRI 2020
-16%-12%
-8%-4%0%4%8%
12%16%
NC CA TX TN MN IN GA NJ IL
MA PA VA MI
WI
FL AR LA IA
-16%-12%
-8%-4%0%4%8%
12%16%
NC IN GA
AR IL MI
TN CA MN TX NJ
MA LA IA FL WI
VA PA
-16%-12%
-8%-4%0%4%8%
12%16%
NC IN MN TX NJ
FL CA MI
PA WI IA IL
MA VA TN GA LA
Payments/Claim To Hospital Outpatient Providers Grew More In PA Than In Other Study States
30
Claims With > 7 Days Of Lost Time At 12 Months Of Experience, Not Adjusted For Injury/Industry Mix
-16%-12%
-8%-4%0%4%8%
12%16%
TX CA TN NC FL NJ
GA
MN AR MA VA WI
PA IL LA IA MI
IN
Annu
al A
vera
ge %
Cha
nge
201
2/2
013
To
201
7/2
018
Hospital Outpatient
Nonhospital
Hospital Inpatient
Overall
© WCRI 2020
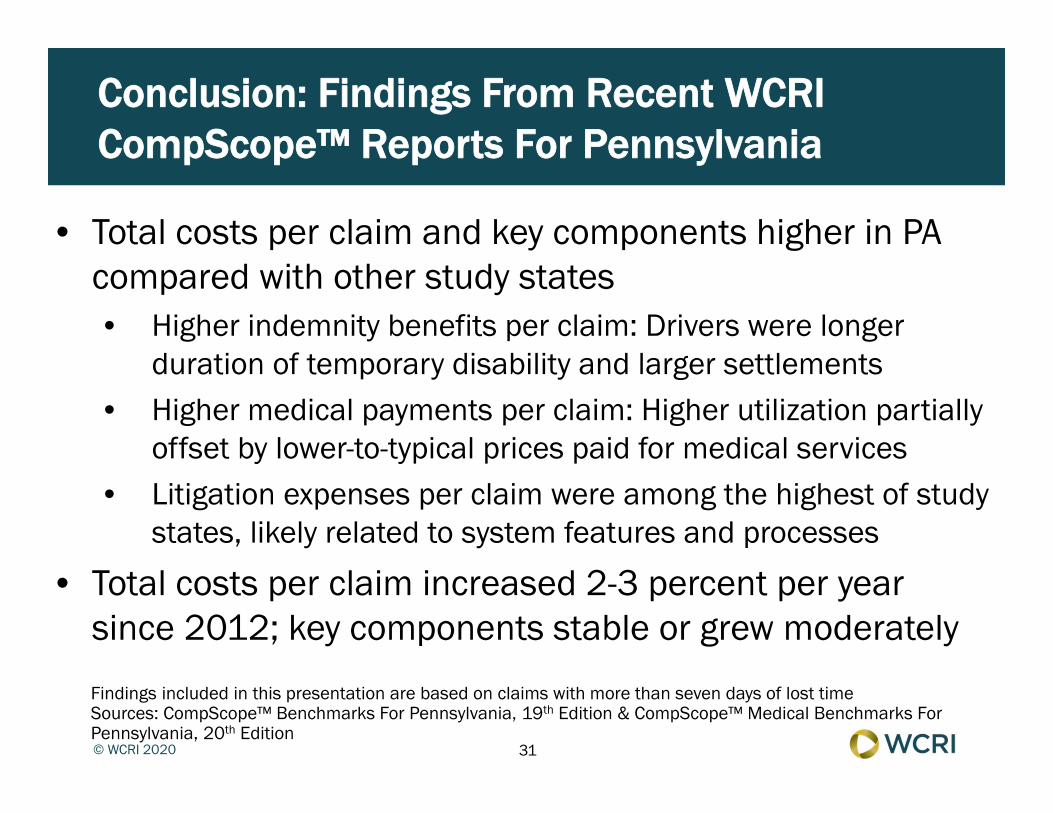
Conclusion: Findings From Recent WCRI CompScope™ Reports For Pennsylvania
• Total costs per claim and key components higher in PA compared with other study states • Higher indemnity benefits per claim: Drivers were longer
duration of temporary disability and larger settlements• Higher medical payments per claim: Higher utilization partially
offset by lower-to-typical prices paid for medical services• Litigation expenses per claim were among the highest of study
states, likely related to system features and processes
• Total costs per claim increased 2-3 percent per year since 2012; key components stable or grew moderately
31
Findings included in this presentation are based on claims with more than seven days of lost timeSources: CompScope™ Benchmarks For Pennsylvania, 19th Edition & CompScope™ Medical Benchmarks For Pennsylvania, 20th Edition

© WCRI 2020
Thank You!
• Please take our survey when you exit this webinar
• Registration is open for WCRI’s 2020 Conference, March 5–6 in Boston, MA. Learn more at https://conference.wcrinet.org
32
• Thank you to our members! Non-members can learn about the benefits of membership at https://www.wcrinet.org/membership
• Please follow us on social media


![[Eateria webinar] cool off in 30 minutes](https://img.pdfslide.us/doc/110x75/55b6dd6dbb61ebf7588b46ea/eateria-webinar-cool-off-in-30-minutes.jpg)