Embed Size (px)
Citation preview
Enterprise BI – Increase Your Competitive
Advantage
Oliver Weigel - Global CoE for Analytics
–The Audio for this event is being streamed live to your computer.
–To listen, Please connect PC speakers or headphones to your computer.
–International Toll : +1 (212 )444 0889
–US / CAN Toll Free : +1 (866) 651 8117
–Passcode : 665321
© 2011 SAP AG. All rights reserved. 2
Agenda
Executive Summary
Background
Impact of Enterprise-wide BI
Components of an Enterprise BI Strategy
Enterprise BI value
Business Intelligence Benchmarking
Summary
© 2011 SAP AG. All rights reserved. 3
Agenda
Executive Summary
Background
Impact of Enterprise-wide BI
Components of an Enterprise BI Strategy
Enterprise BI value
Business Intelligence Benchmarking
Summary
© 2011 SAP AG. All rights reserved. 4
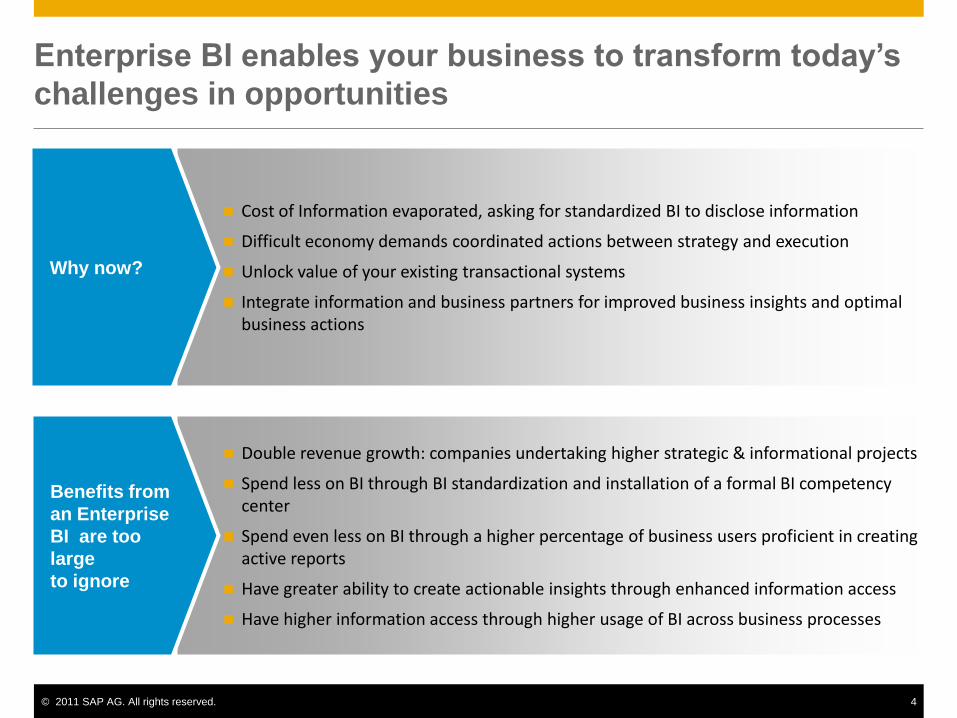
Enterprise BI enables your business to transform today’s
challenges in opportunities
Double revenue growth: companies undertaking higher strategic & informational projects
Spend less on BI through BI standardization and installation of a formal BI competency center
Spend even less on BI through a higher percentage of business users proficient in creating active reports
Have greater ability to create actionable insights through enhanced information access
Have higher information access through higher usage of BI across business processes
Benefits from
an Enterprise
BI are too
large
to ignore
Cost of Information evaporated, asking for standardized BI to disclose information
Difficult economy demands coordinated actions between strategy and execution
Unlock value of your existing transactional systems
Integrate information and business partners for improved business insights and optimal business actions
Why now?
© 2011 SAP AG. All rights reserved. 5
Agenda
Executive Summary
Background
Impact of Enterprise-wide BI
Components of an Enterprise BI Strategy
Enterprise BI value & benefits
Business Intelligence Benchmarking
Summary
© 2011 SAP AG. All rights reserved. 6
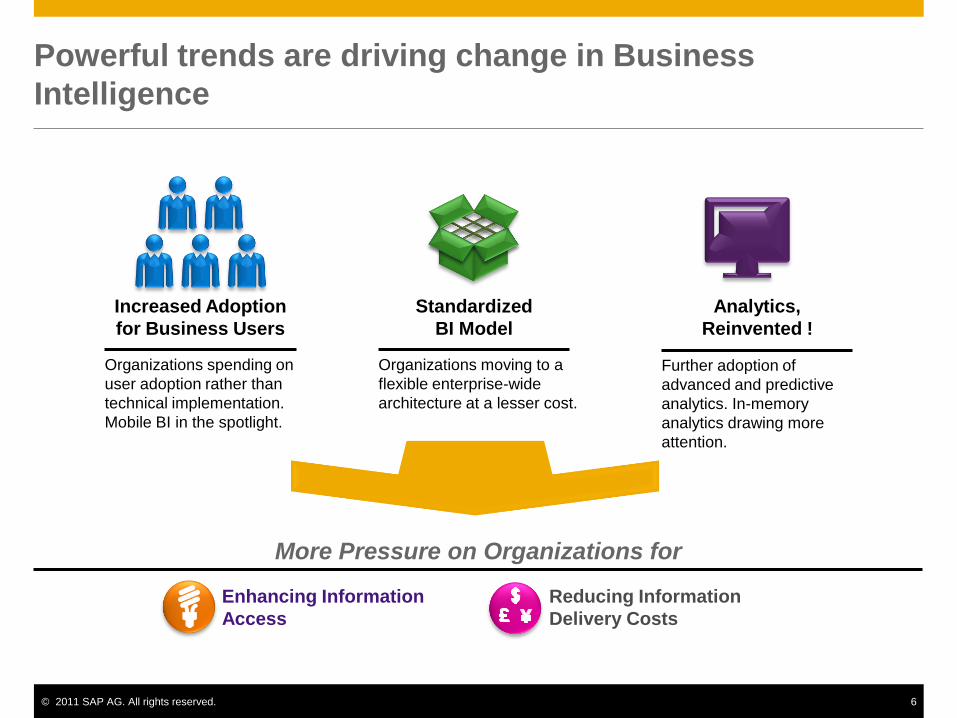
Increased Adoption
for Business Users
Analytics,
Reinvented !
Standardized
BI Model
Organizations spending on
user adoption rather than
technical implementation.
Mobile BI in the spotlight.
Organizations moving to a
flexible enterprise-wide
architecture at a lesser cost.
Further adoption of
advanced and predictive
analytics. In-memory
analytics drawing more
attention.
More Pressure on Organizations for
Enhancing Information
Access
Reducing Information
Delivery Costs
Powerful trends are driving change in Business
Intelligence
© 2011 SAP AG. All rights reserved. 7
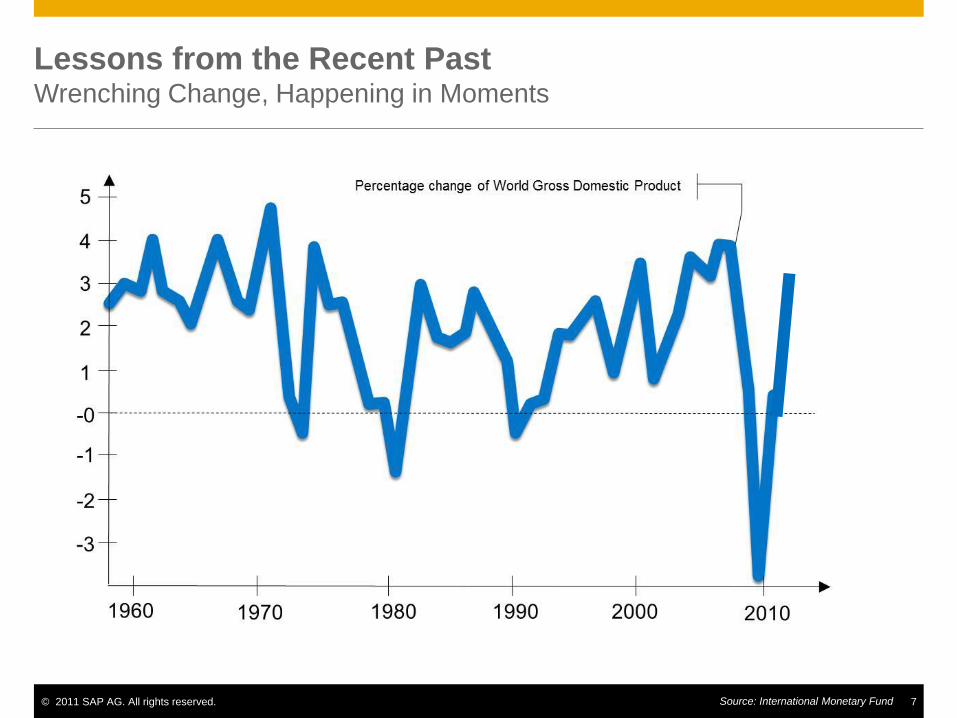
Lessons from the Recent Past Wrenching Change, Happening in Moments
Source: International Monetary Fund
© 2011 SAP AG. All rights reserved. 8
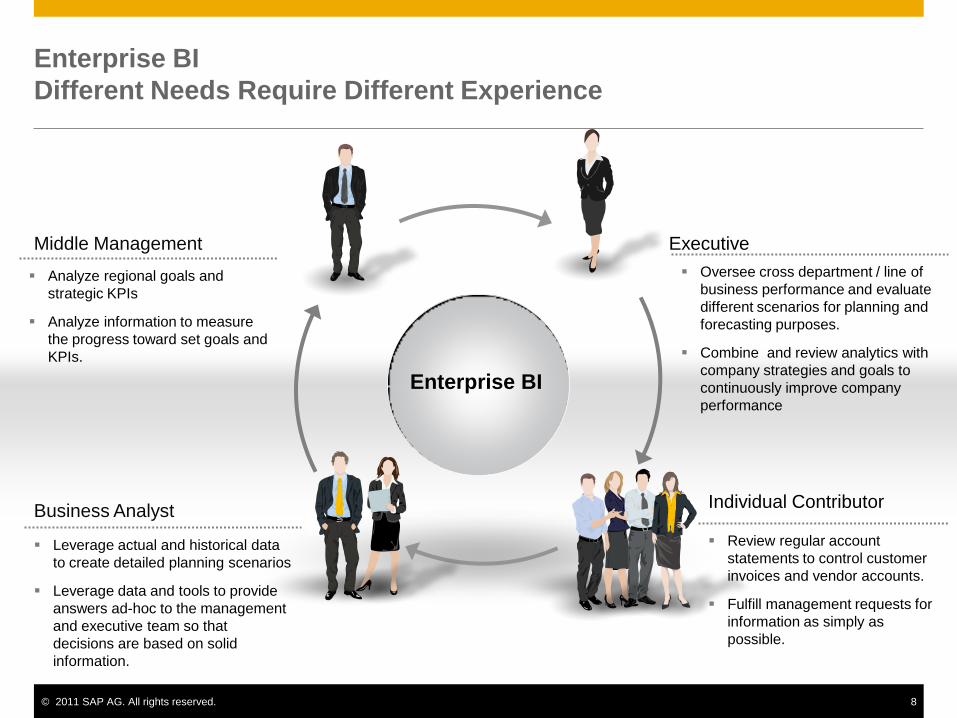
Enterprise BI
Different Needs Require Different Experience
Executive
Individual Contributor
Middle Management
Business Analyst
Enterprise BI
Placeholder
text
Placeholder
text
Placeholder
text
Analyze regional goals and
strategic KPIs
Analyze information to measure
the progress toward set goals and
KPIs.
Leverage actual and historical data
to create detailed planning scenarios
Leverage data and tools to provide
answers ad-hoc to the management
and executive team so that
decisions are based on solid
information.
Oversee cross department / line of
business performance and evaluate
different scenarios for planning and
forecasting purposes.
Combine and review analytics with
company strategies and goals to
continuously improve company
performance
Review regular account
statements to control customer
invoices and vendor accounts.
Fulfill management requests for
information as simply as
possible.
© 2011 SAP AG. All rights reserved. 9
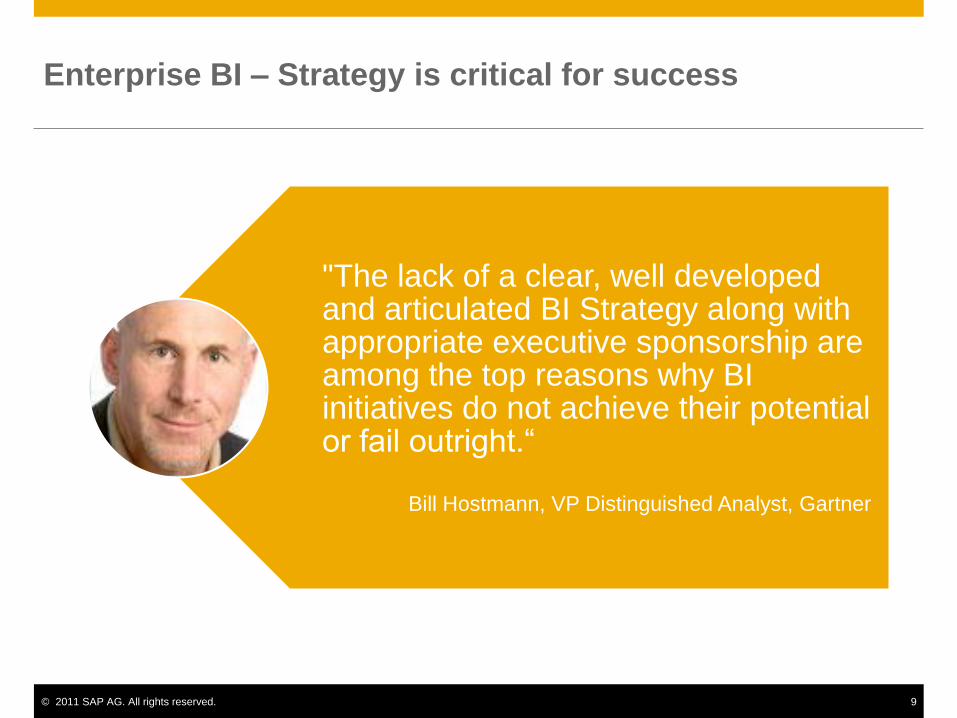
"The lack of a clear, well developed and articulated BI Strategy along with appropriate executive sponsorship are among the top reasons why BI initiatives do not achieve their potential or fail outright.―
Bill Hostmann, VP Distinguished Analyst, Gartner
Enterprise BI – Strategy is critical for success
© 2011 SAP AG. All rights reserved. 10
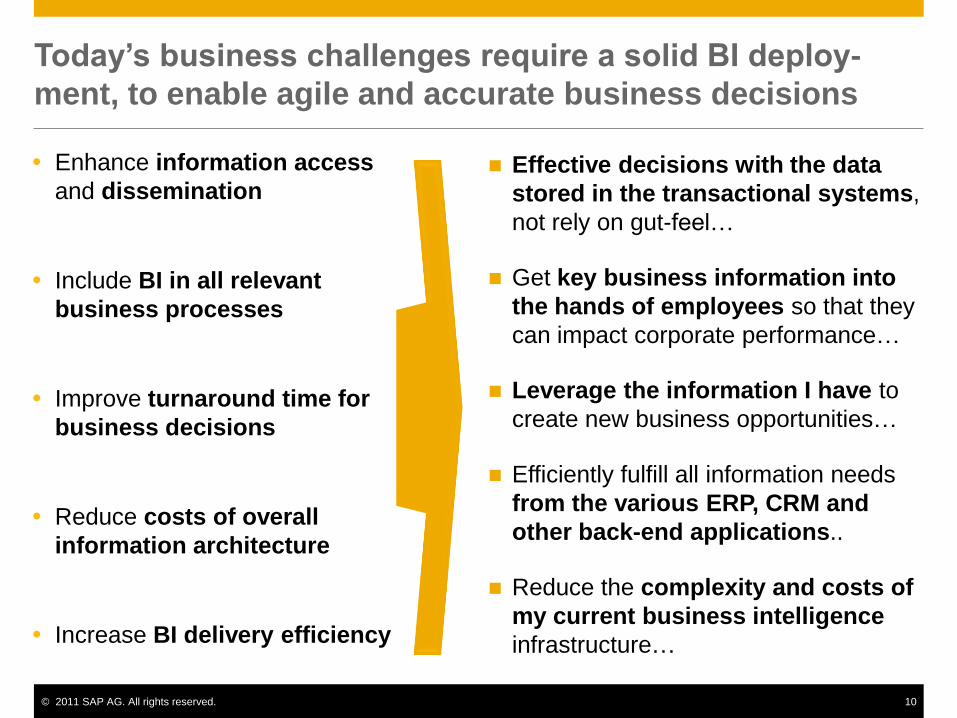
Today’s business challenges require a solid BI deploy-
ment, to enable agile and accurate business decisions
Effective decisions with the data
stored in the transactional systems,
not rely on gut-feel…
Get key business information into
the hands of employees so that they
can impact corporate performance…
Leverage the information I have to
create new business opportunities…
Efficiently fulfill all information needs
from the various ERP, CRM and
other back-end applications..
Reduce the complexity and costs of
my current business intelligence
infrastructure…
Enhance information access
and dissemination
Include BI in all relevant
business processes
Improve turnaround time for
business decisions
Reduce costs of overall
information architecture
Increase BI delivery efficiency
© 2011 SAP AG. All rights reserved. 11
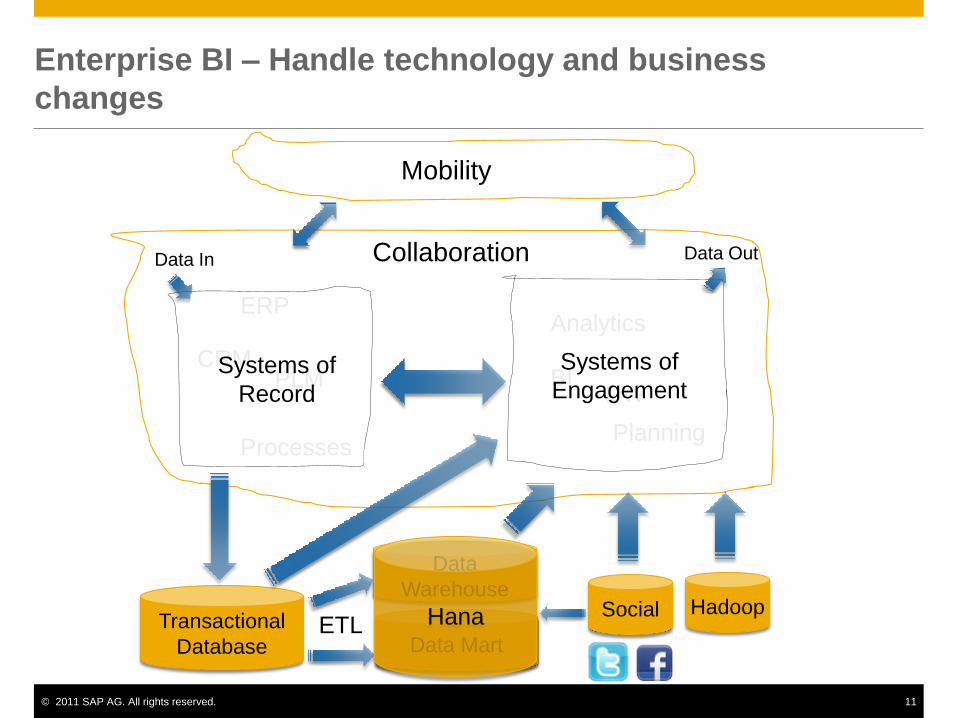
Enterprise BI – Handle technology and business
changes
ERP
Processes
Data In
Analytics
CRM PLM BI
DW
Planning
Collaboration
Mobility
Systems of
Record
Data Out
Systems of
Engagement
Transactional
Database
Data
Warehouse
Data Mart ETL
Social Hadoop Hana
© 2011 SAP AG. All rights reserved. 12
Agenda
Executive Summary
Background
Impact of Enterprise-wide BI
Components of an Enterprise BI Strategy
Enterprise BI value
Business Intelligence Benchmarking
Summary
© 2011 SAP AG. All rights reserved. 13
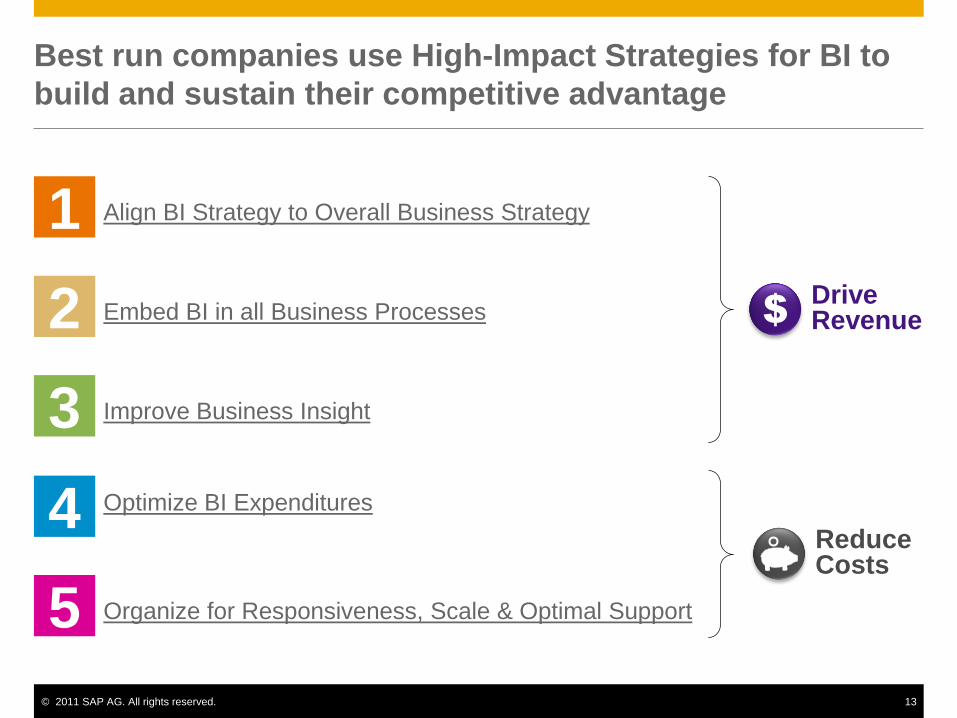
Best run companies use High-Impact Strategies for BI to
build and sustain their competitive advantage
Reduce Costs
Align BI Strategy to Overall Business Strategy 1
Embed BI in all Business Processes 2
Improve Business Insight 3
Optimize BI Expenditures 4
Organize for Responsiveness, Scale & Optimal Support 5
Drive Revenue
© 2011 SAP AG. All rights reserved. 14
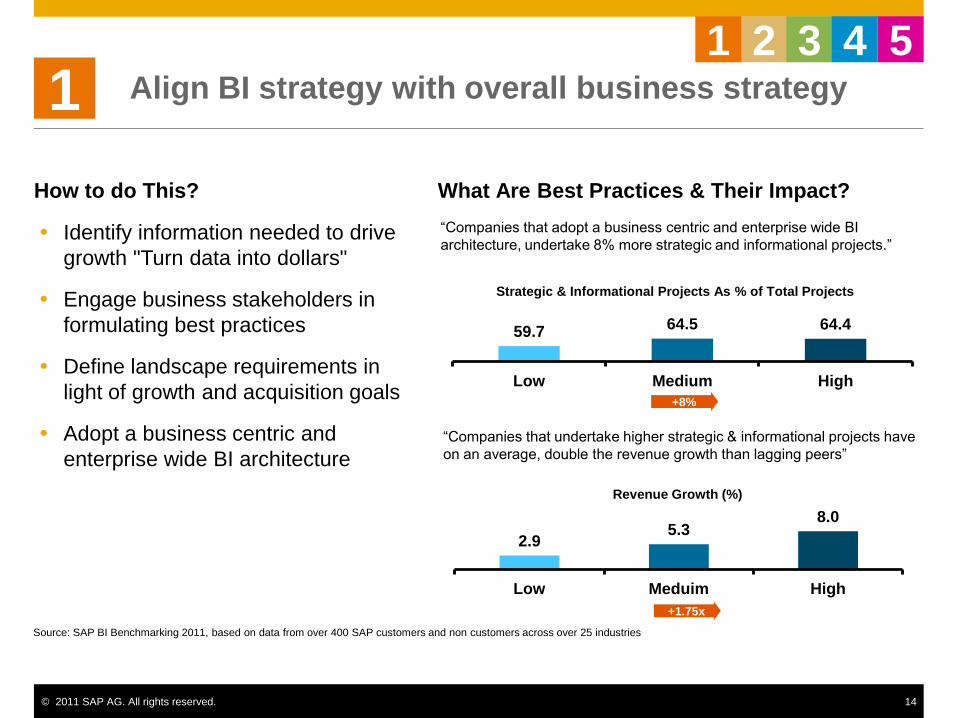
Align BI strategy with overall business strategy
How to do This?
Identify information needed to drive
growth "Turn data into dollars"
Engage business stakeholders in
formulating best practices
Define landscape requirements in
light of growth and acquisition goals
Adopt a business centric and
enterprise wide BI architecture
What Are Best Practices & Their Impact?
1
―Companies that adopt a business centric and enterprise wide BI
architecture, undertake 8% more strategic and informational projects.‖
59.7 64.5 64.4
Low Medium High
Strategic & Informational Projects As % of Total Projects
+8%
Source: SAP BI Benchmarking 2011, based on data from over 400 SAP customers and non customers across over 25 industries
5 2 3 4 1
―Companies that undertake higher strategic & informational projects have
on an average, double the revenue growth than lagging peers‖
+1.75x
2.9 5.3
8.0
Low Meduim High
Revenue Growth (%)
© 2011 SAP AG. All rights reserved. 15
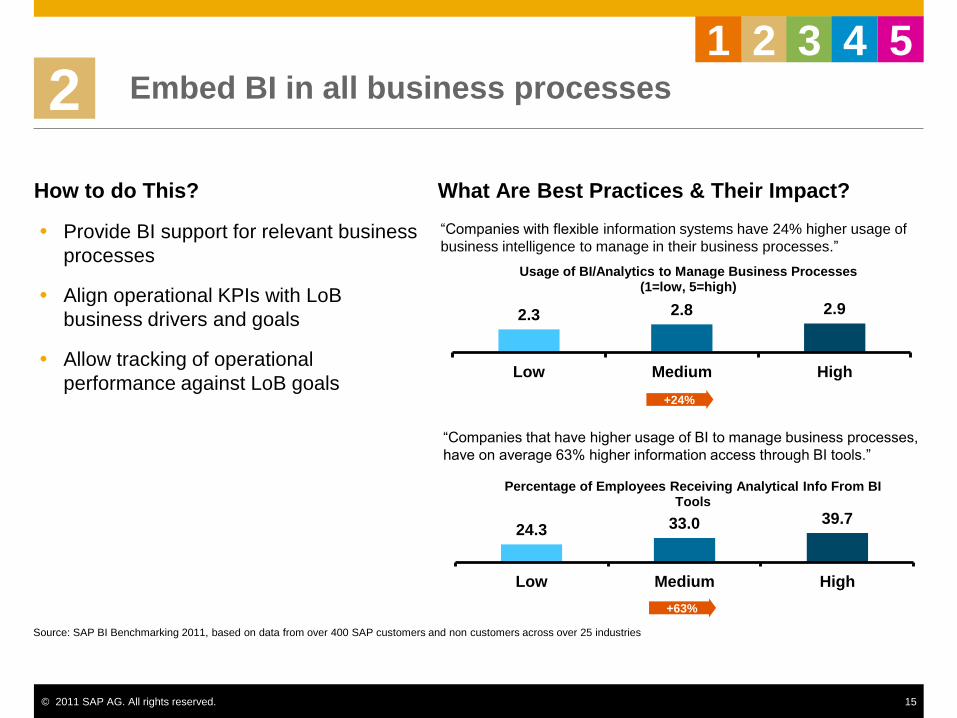
Embed BI in all business processes
How to do This?
Provide BI support for relevant business
processes
Align operational KPIs with LoB
business drivers and goals
Allow tracking of operational
performance against LoB goals
What Are Best Practices & Their Impact?
2
―Companies with flexible information systems have 24% higher usage of
business intelligence to manage in their business processes.‖
2.3 2.8 2.9
Low Medium High
Usage of BI/Analytics to Manage Business Processes (1=low, 5=high)
+24%
Source: SAP BI Benchmarking 2011, based on data from over 400 SAP customers and non customers across over 25 industries
5 2 3 4 1
―Companies that have higher usage of BI to manage business processes,
have on average 63% higher information access through BI tools.‖
24.3 33.0 39.7
Low Medium High
Percentage of Employees Receiving Analytical Info From BI Tools
+63%
© 2011 SAP AG. All rights reserved. 16
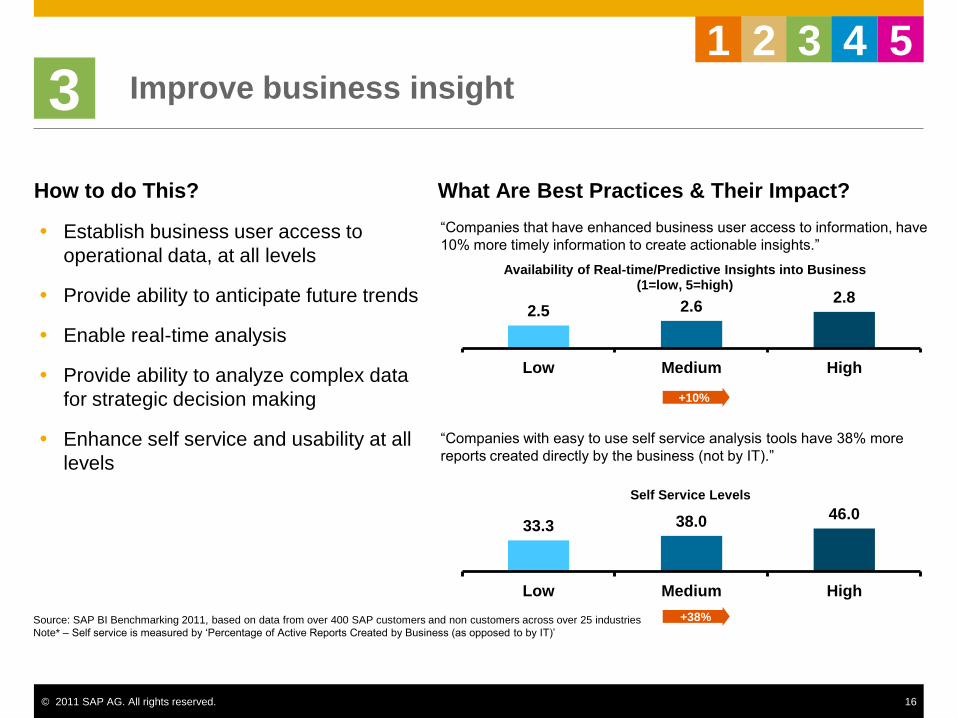
Improve business insight
How to do This?
Establish business user access to
operational data, at all levels
Provide ability to anticipate future trends
Enable real-time analysis
Provide ability to analyze complex data
for strategic decision making
Enhance self service and usability at all
levels
What Are Best Practices & Their Impact?
3
―Companies that have enhanced business user access to information, have
10% more timely information to create actionable insights.‖
+10%
Source: SAP BI Benchmarking 2011, based on data from over 400 SAP customers and non customers across over 25 industries
Note* – Self service is measured by ‗Percentage of Active Reports Created by Business (as opposed to by IT)‘
5 2 3 4 1
2.5 2.6 2.8
Low Medium High
Availability of Real-time/Predictive Insights into Business (1=low, 5=high)
―Companies with easy to use self service analysis tools have 38% more
reports created directly by the business (not by IT).‖
33.3 38.0 46.0
Low Medium High
Self Service Levels
+38%
© 2011 SAP AG. All rights reserved. 17
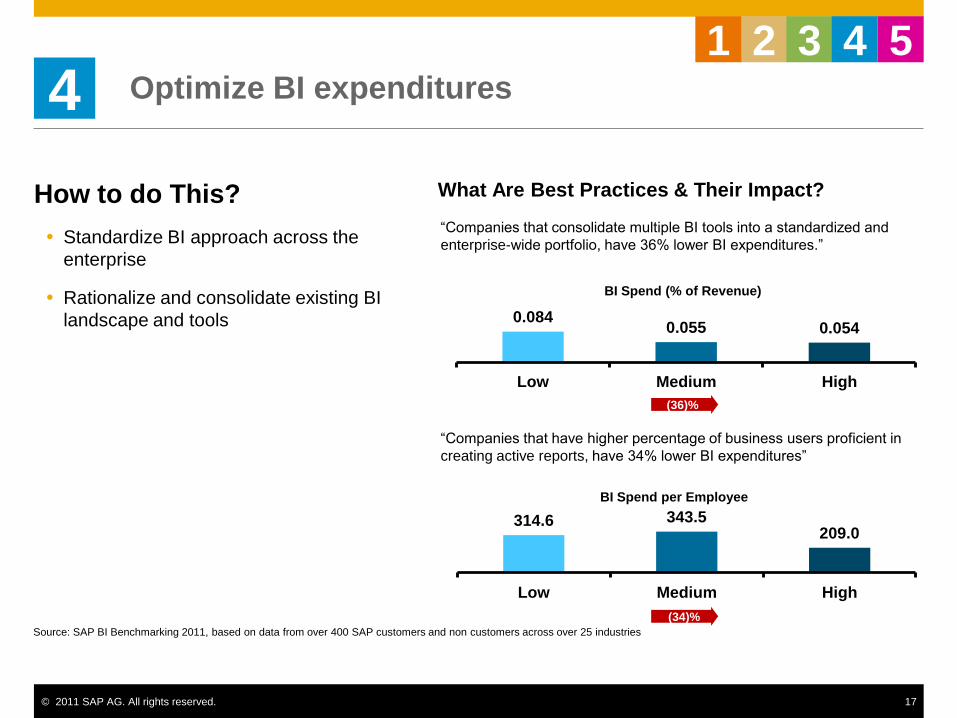
Optimize BI expenditures
How to do This?
Standardize BI approach across the
enterprise
Rationalize and consolidate existing BI
landscape and tools
What Are Best Practices & Their Impact?
4
―Companies that consolidate multiple BI tools into a standardized and
enterprise-wide portfolio, have 36% lower BI expenditures.‖
0.084 0.055 0.054
Low Medium High
BI Spend (% of Revenue)
(36)%
―Companies that have higher percentage of business users proficient in
creating active reports, have 34% lower BI expenditures‖
314.6 343.5 209.0
Low Medium High
BI Spend per Employee
(34)%
5 2 3 4 1
Source: SAP BI Benchmarking 2011, based on data from over 400 SAP customers and non customers across over 25 industries
© 2011 SAP AG. All rights reserved. 18
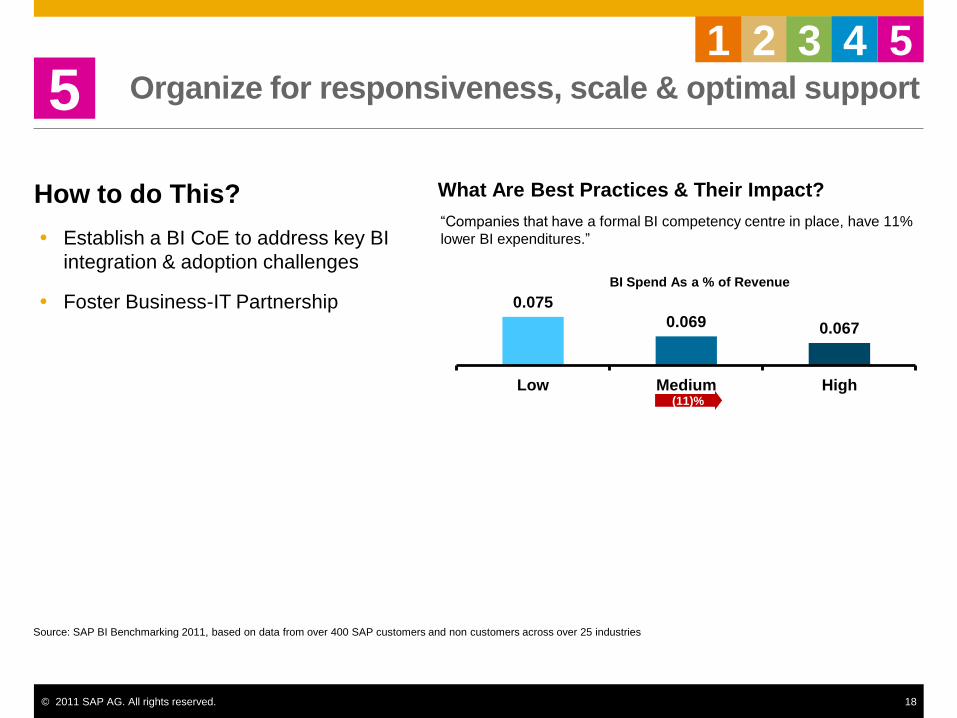
Organize for responsiveness, scale & optimal support
How to do This?
Establish a BI CoE to address key BI
integration & adoption challenges
Foster Business-IT Partnership
What Are Best Practices & Their Impact?
5 5 2 3 4 1
―Companies that have a formal BI competency centre in place, have 11%
lower BI expenditures.‖
0.075
0.069 0.067
Low Medium High
BI Spend As a % of Revenue
(11)%
Source: SAP BI Benchmarking 2011, based on data from over 400 SAP customers and non customers across over 25 industries
© 2011 SAP AG. All rights reserved. 19
Agenda
Executive Summary
Background
Impact of Enterprise-wide BI
Components of an Enterprise BI Strategy
Enterprise BI value
Business Intelligence Benchmarking
Summary
© 2011 SAP AG. All rights reserved. 20
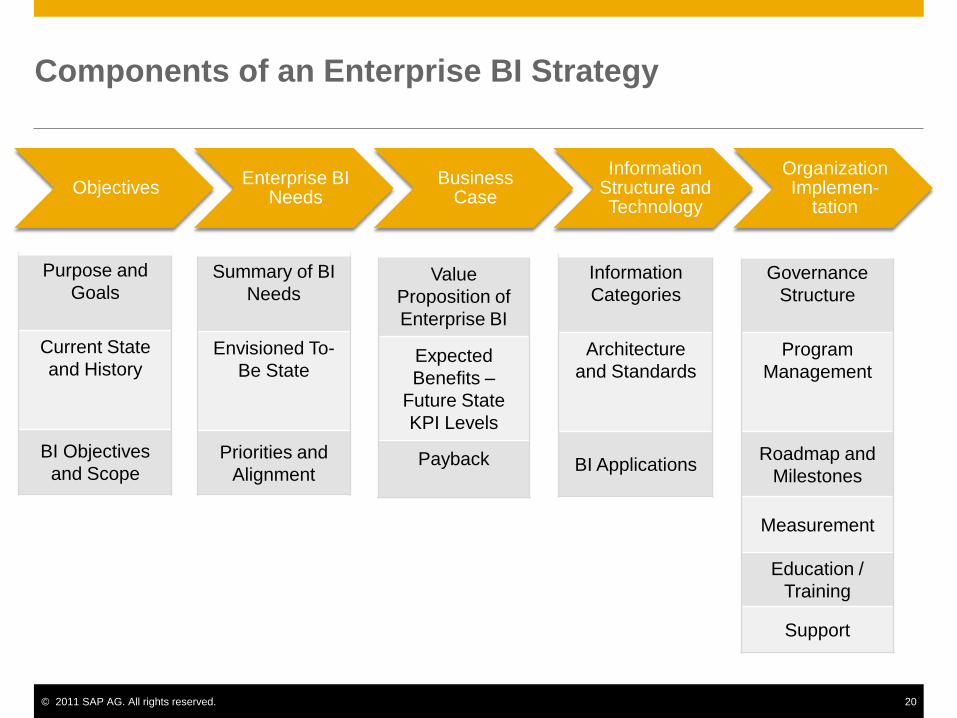
Components of an Enterprise BI Strategy
Objectives Enterprise BI
Needs Business
Case
Information Structure and Technology
Organization Implemen-
tation
Purpose and
Goals
Current State
and History
BI Objectives
and Scope
Summary of BI
Needs
Envisioned To-
Be State
Priorities and
Alignment
Value
Proposition of
Enterprise BI
Expected
Benefits –
Future State
KPI Levels
Payback
Information
Categories
Architecture
and Standards
BI Applications
Governance
Structure
Program
Management
Roadmap and
Milestones
Measurement
Education /
Training
Support
© 2011 SAP AG. All rights reserved. 21
Agenda
Executive Summary
Background
Impact of Enterprise-wide BI
Components of an Enterprise BI Strategy
Enterprise BI value & benefits
Business Intelligence Benchmarking
Summary
© 2011 SAP AG. All rights reserved. 22
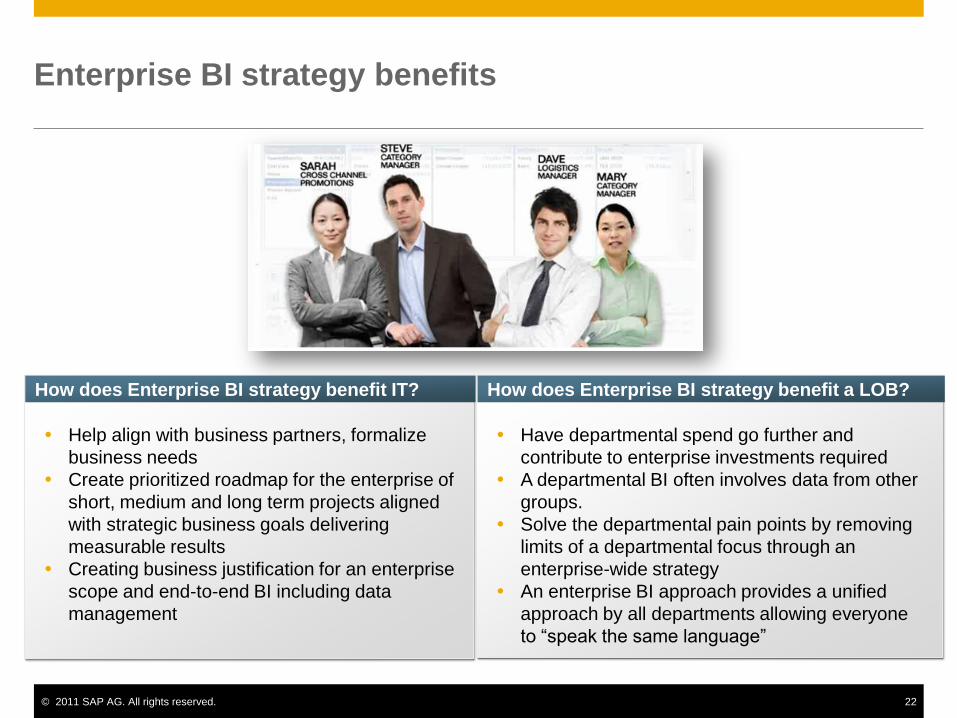
Enterprise BI strategy benefits
Help align with business partners, formalize
business needs
Create prioritized roadmap for the enterprise of
short, medium and long term projects aligned
with strategic business goals delivering
measurable results
Creating business justification for an enterprise
scope and end-to-end BI including data
management
How does Enterprise BI strategy benefit IT?
Have departmental spend go further and
contribute to enterprise investments required
A departmental BI often involves data from other
groups.
Solve the departmental pain points by removing
limits of a departmental focus through an
enterprise-wide strategy
An enterprise BI approach provides a unified
approach by all departments allowing everyone
to ―speak the same language‖
How does Enterprise BI strategy benefit a LOB?
© 2011 SAP AG. All rights reserved. 23
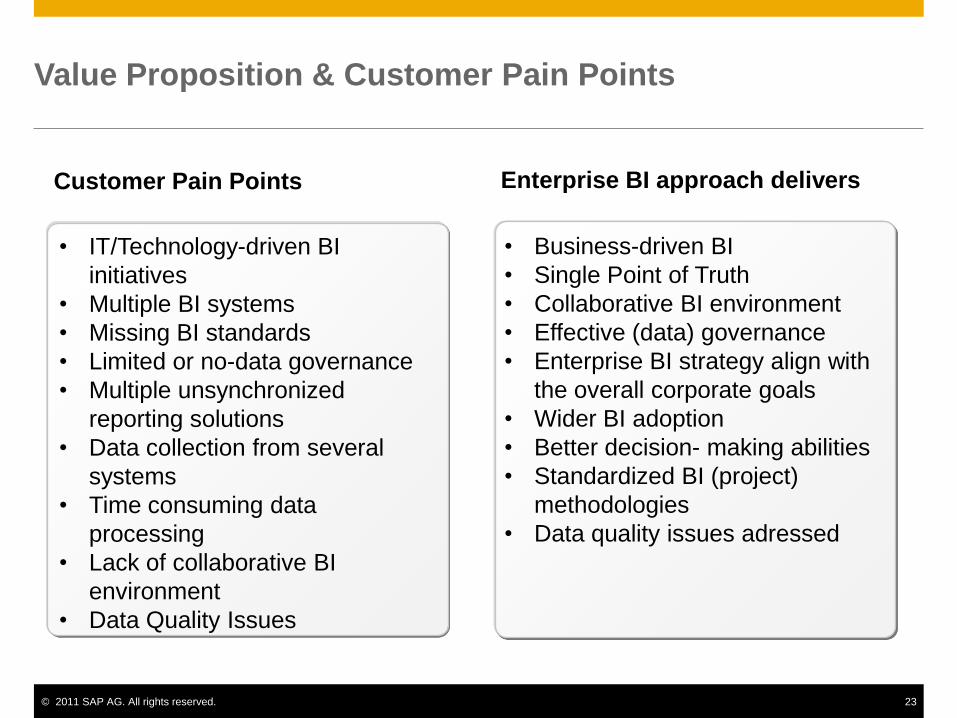
Value Proposition & Customer Pain Points
Enterprise BI approach delivers Customer Pain Points
• IT/Technology-driven BI
initiatives
• Multiple BI systems
• Missing BI standards
• Limited or no-data governance
• Multiple unsynchronized
reporting solutions
• Data collection from several
systems
• Time consuming data
processing
• Lack of collaborative BI
environment
• Data Quality Issues
• Business-driven BI
• Single Point of Truth
• Collaborative BI environment
• Effective (data) governance
• Enterprise BI strategy align with
the overall corporate goals
• Wider BI adoption
• Better decision- making abilities
• Standardized BI (project)
methodologies
• Data quality issues adressed
© 2011 SAP AG. All rights reserved. 24
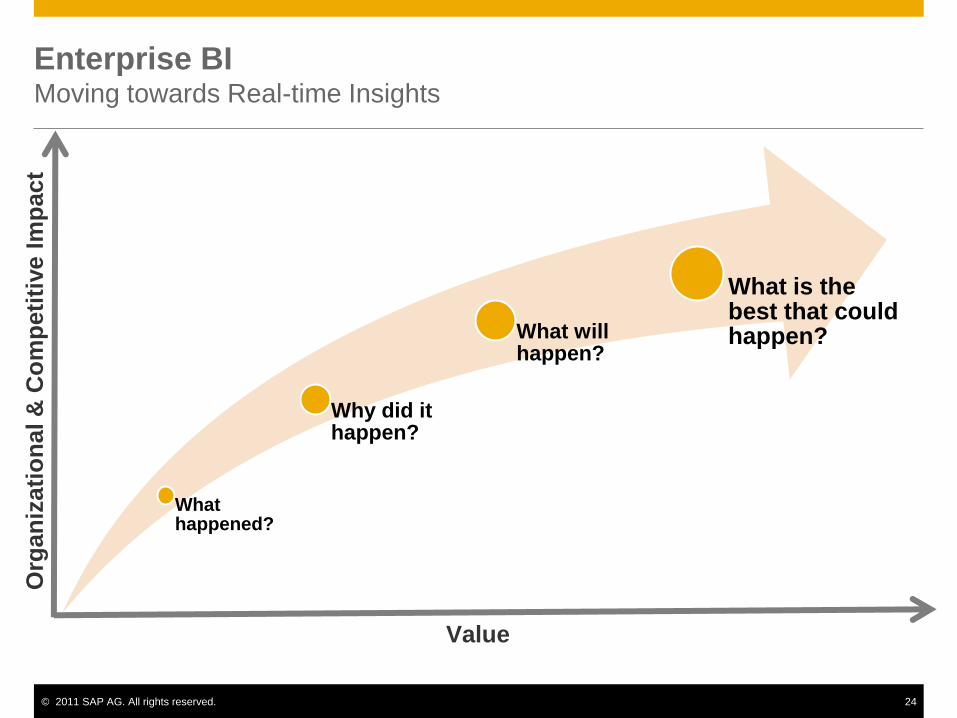
What happened?
Why did it happen?
What will happen?
What is the best that could happen?
Value
Org
an
izati
on
al &
Co
mp
eti
tive I
mp
act
Enterprise BI Moving towards Real-time Insights
© 2011 SAP AG. All rights reserved. 25
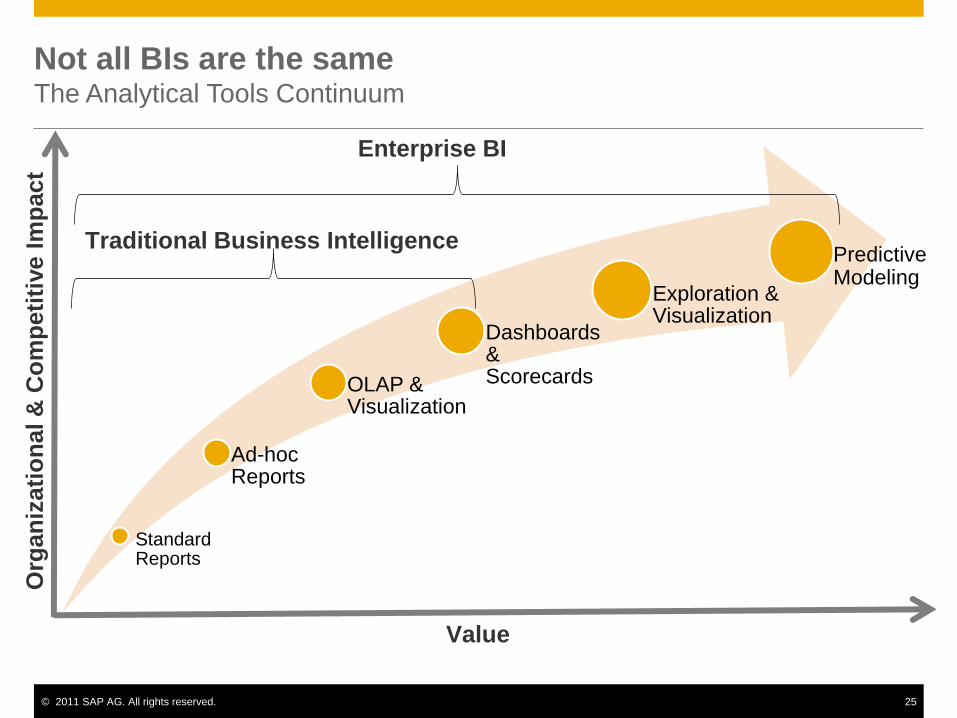
Standard Reports
Ad-hoc Reports
OLAP & Visualization
Dashboards & Scorecards
Exploration & Visualization
Value
Predictive Modeling
Traditional Business Intelligence
Enterprise BI
Org
an
izati
on
al &
Co
mp
eti
tive I
mp
act
Not all BIs are the same The Analytical Tools Continuum
© 2011 SAP AG. All rights reserved. 26
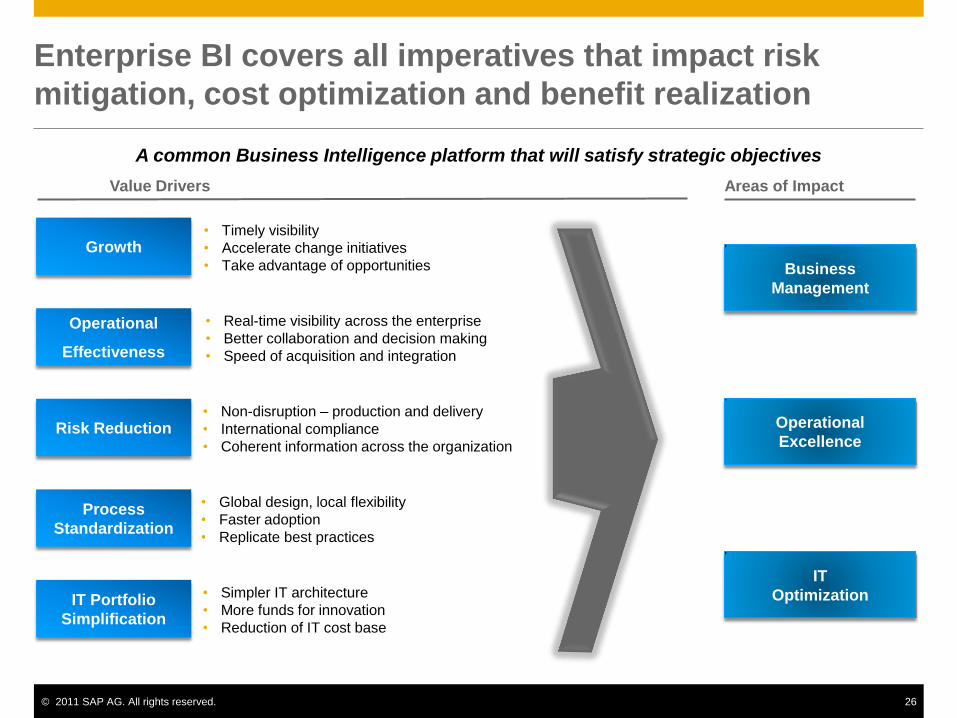
Enterprise BI covers all imperatives that impact risk
mitigation, cost optimization and benefit realization
A common Business Intelligence platform that will satisfy strategic objectives
Value Drivers Areas of Impact
Business
Management
Operational
Excellence
IT
Optimization
Process
Standardization
• Global design, local flexibility
• Faster adoption
• Replicate best practices
Operational
Effectiveness
• Real-time visibility across the enterprise
• Better collaboration and decision making
• Speed of acquisition and integration
Growth • Timely visibility
• Accelerate change initiatives
• Take advantage of opportunities
Risk Reduction • Non-disruption – production and delivery
• International compliance
• Coherent information across the organization
IT Portfolio
Simplification
• Simpler IT architecture
• More funds for innovation
• Reduction of IT cost base
© 2011 SAP AG. All rights reserved. 27
Agenda
Executive Summary
Background
Impact of Enterprise-wide BI
Components of an Enterprise BI Strategy
Enterprise BI value & benefits
Business Intelligence Benchmarking
Summary
© 2011 SAP AG. All rights reserved. 28
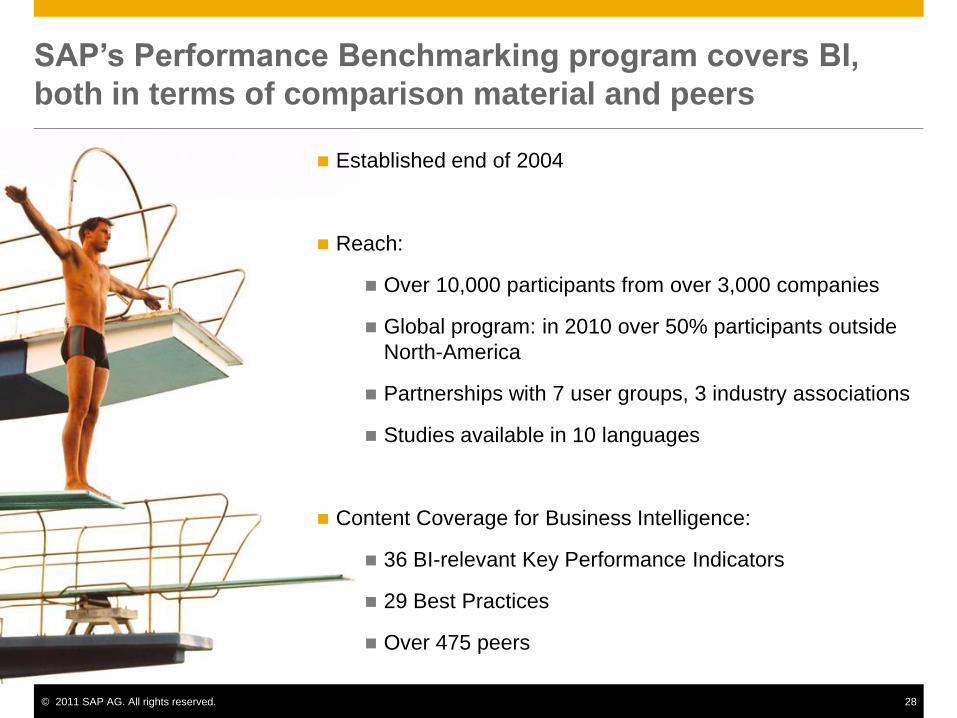
SAP’s Performance Benchmarking program covers BI,
both in terms of comparison material and peers
Established end of 2004
Reach:
Over 10,000 participants from over 3,000 companies
Global program: in 2010 over 50% participants outside
North-America
Partnerships with 7 user groups, 3 industry associations
Studies available in 10 languages
Content Coverage for Business Intelligence:
36 BI-relevant Key Performance Indicators
29 Best Practices
Over 475 peers
© 2011 SAP AG. All rights reserved. 29
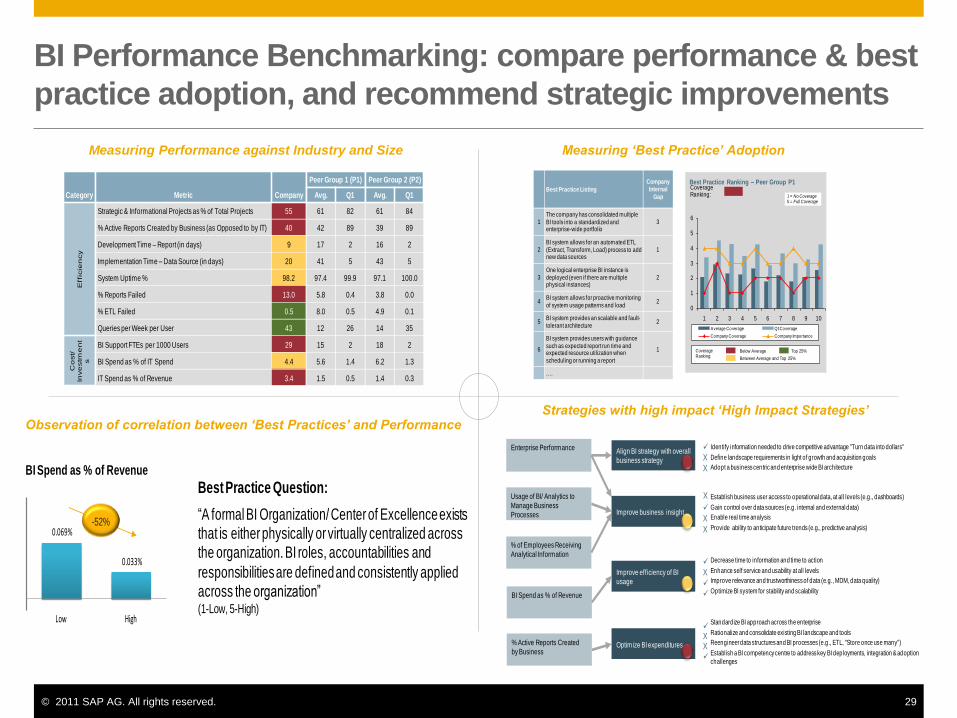
BI Performance Benchmarking: compare performance & best
practice adoption, and recommend strategic improvements
Measuring Performance against Industry and Size Measuring ‘Best Practice’ Adoption
Observation of correlation between ‘Best Practices’ and Performance Strategies with high impact ‘High Impact Strategies’
Category Metric Company
Peer Group 1 (P1) Peer Group 2 (P2)
Avg. Q1 Avg. Q1
Eff
icie
ncy
Strategic & Informational Projects as % of Total Projects 55 61 82 61 84
% Active Reports Created by Business (as Opposed to by IT) 40 42 89 39 89
Development Time – Report (in days) 9 17 2 16 2
Implementation Time – Data Source (in days) 20 41 5 43 5
System Uptime % 98.2 97.4 99.9 97.1 100.0
% Reports Failed 13.0 5.8 0.4 3.8 0.0
% ETL Failed 0.5 8.0 0.5 4.9 0.1
Queries per Week per User 43 12 26 14 35
Co
st/
Inve
stm
en
ts
BI Support FTEs per 1000 Users 29 15 2 18 2
BI Spend as % of IT Spend 4.4 5.6 1.4 6.2 1.3
IT Spend as % of Revenue 3.4 1.5 0.5 1.4 0.3
1 = No Coverage5 = Full Coverage
Best Practice Listing
Company Internal
Gap
1The company has consolidated multiple BI tools into a standardized and enterprise-wide portfolio
3
2BI system allows for an automated ETL (Extract, Transform, Load) process to add new data sources
1
3One logical enterprise BI instance is deployed (even if there are multiple physical instances)
2
4BI system allows for proactive monitoring of system usage patterns and load
2
5BI system provides an scalable and fault-tolerant architecture
2
6
BI system provides users with guidance such as expected report run time and expected resource utilization when scheduling or running a report
1
….
Best Practice Ranking – Peer Group P1
Top 25%
Between Average and Top 25%
Below AverageCoverage Ranking:
1 = No Coverage5 = Full Coverage
0
1
2
3
4
5
6
1 2 3 4 5 6 7 8 9 10
Average Coverage Q1 Coverage
Company Coverage Company Importance
Coverage Ranking:
0.069%
0.033%
Low High
BI Spend as % of Revenue
-52%
Best Practice Question:
―A formal BI Organization/ Center of Excellence exists that is either physically or virtually centralized across the organization. BI roles, accountabilities and
responsibilities are defined and consistently applied across the organization‖ (1-Low, 5-High)
Enterprise Performance
% Active Reports Created by Business
BI Spend as % of Revenue
% of Employees Receiving Analytical Information
Align BI strategy with overall business strategy
Identify information needed to drive competitive advantage "Turn data into dollars"
Define landscape requirements in light of growth and acquisition goals
Adopt a business centric and enterprise wide BI architecture
XX
Usage of BI/ Analytics to Manage Business Processes
Improve efficiency of BI usage
Decrease time to information and time to action
Enhance self service and usability at all levels
Improve relevance and trustworthiness of data (e.g., MDM, data quality)
Optimize BI system for stability and scalability
X
Improve business insight
Establish business user access to operational data, at all levels (e.g., dashboards)
Gain control over data sources (e.g. internal and external data)
Enable real time analysis
Provide ability to anticipate future trends (e.g., predictive analysis)
X
X
X
Optimize BI expenditures
Standardize BI approach across the enterprise
Rationalize and consolidate existing BI landscape and tools
Reengineer data structures and BI processes (e.g., ETL, "Store once use many")
Establish a BI competency centre to address key BI deployments, integration & adoption
challenges
XX
© 2011 SAP AG. All rights reserved. 30
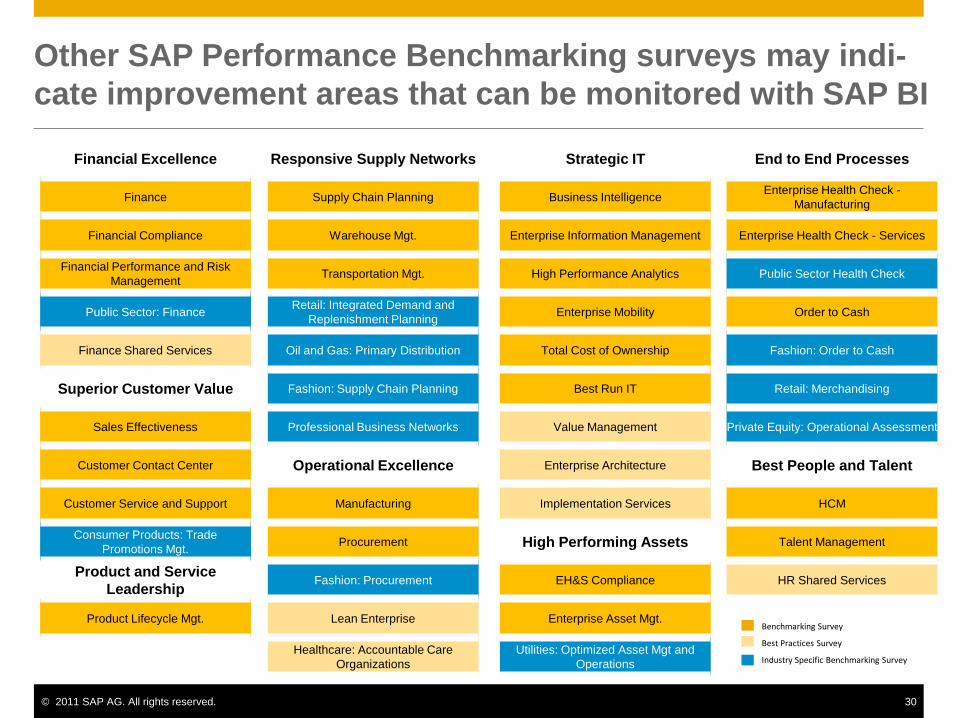
Other SAP Performance Benchmarking surveys may indi-
cate improvement areas that can be monitored with SAP BI
Financial Excellence
Finance
Financial Compliance
Financial Performance and Risk
Management
Public Sector: Finance
Finance Shared Services
Superior Customer Value
Sales Effectiveness
Customer Contact Center
Customer Service and Support
Consumer Products: Trade
Promotions Mgt.
Product and Service
Leadership
Product Lifecycle Mgt.
Responsive Supply Networks
Supply Chain Planning
Warehouse Mgt.
Transportation Mgt.
Retail: Integrated Demand and
Replenishment Planning
Oil and Gas: Primary Distribution
Fashion: Supply Chain Planning
Professional Business Networks
Operational Excellence
Manufacturing
Procurement
Fashion: Procurement
Lean Enterprise
Healthcare: Accountable Care
Organizations
End to End Processes
Enterprise Health Check -
Manufacturing
Enterprise Health Check - Services
Public Sector Health Check
Order to Cash
Fashion: Order to Cash
Retail: Merchandising
Private Equity: Operational Assessment
Best People and Talent
HCM
Talent Management
HR Shared Services
Strategic IT
Business Intelligence
Enterprise Information Management
High Performance Analytics
Enterprise Mobility
Total Cost of Ownership
Best Run IT
Value Management
Enterprise Architecture
Implementation Services
High Performing Assets
EH&S Compliance
Enterprise Asset Mgt.
Utilities: Optimized Asset Mgt and
Operations
Benchmarking Survey
Best Practices Survey
Industry Specific Benchmarking Survey
© 2011 SAP AG. All rights reserved. 31
Agenda
Executive Summary
Background
Impact of Enterprise-wide BI
Components of an Enterprise BI Strategy
Enterprise BI value & benefits
Business Intelligence Benchmarking
Summary
© 2011 SAP AG. All rights reserved. 32 © SAP 2009 /
Page 32
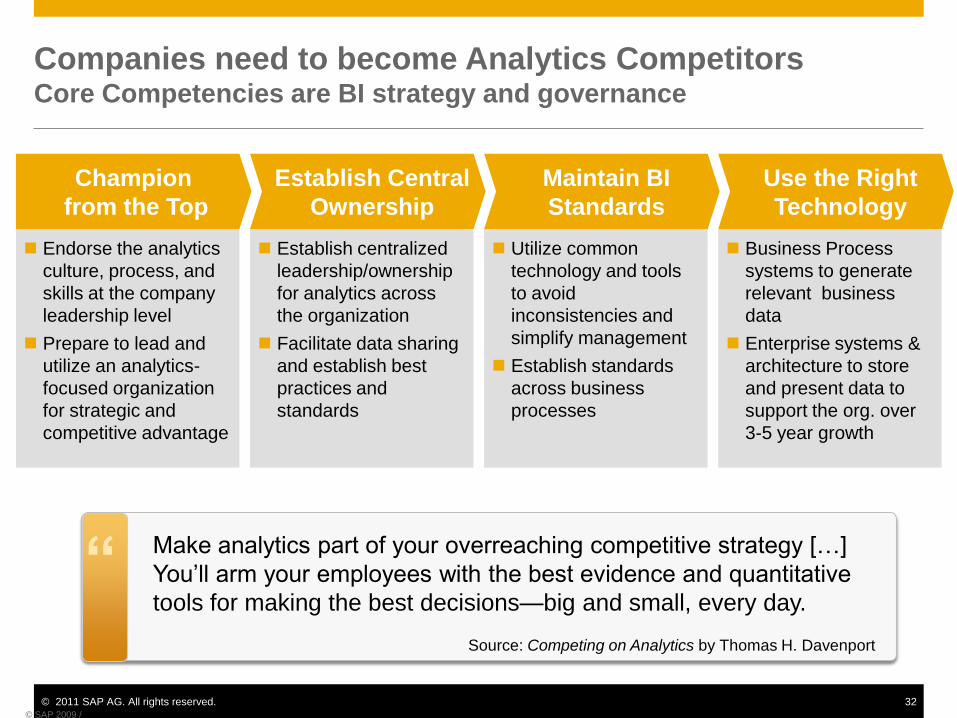
Companies need to become Analytics Competitors Core Competencies are BI strategy and governance
“ Make analytics part of your overreaching competitive strategy […]
You‘ll arm your employees with the best evidence and quantitative
tools for making the best decisions—big and small, every day.
Source: Competing on Analytics by Thomas H. Davenport
Endorse the analytics
culture, process, and
skills at the company
leadership level
Prepare to lead and
utilize an analytics-
focused organization
for strategic and
competitive advantage
Establish centralized
leadership/ownership
for analytics across
the organization
Facilitate data sharing
and establish best
practices and
standards
Utilize common
technology and tools
to avoid
inconsistencies and
simplify management
Establish standards
across business
processes
Business Process
systems to generate
relevant business
data
Enterprise systems &
architecture to store
and present data to
support the org. over
3-5 year growth
Champion
from the Top
Establish Central
Ownership
Maintain BI
Standards
Use the Right
Technology
© 2011 SAP AG. All rights reserved. 33
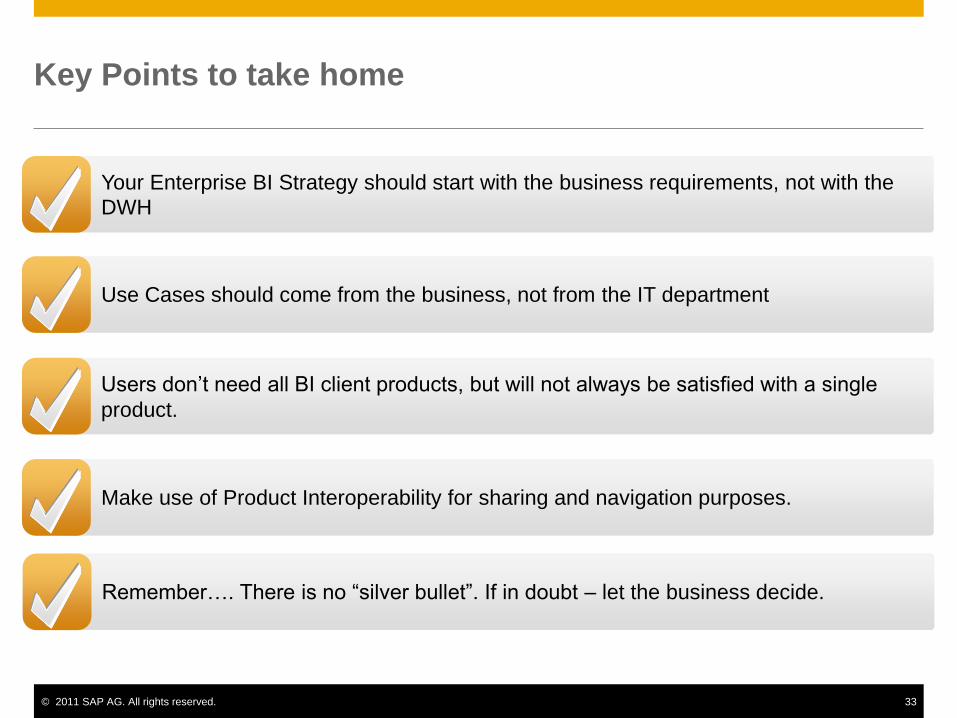
Your Enterprise BI Strategy should start with the business requirements, not with the
DWH
Key Points to take home
Use Cases should come from the business, not from the IT department
Users don‘t need all BI client products, but will not always be satisfied with a single
product.
Make use of Product Interoperability for sharing and navigation purposes.
Remember…. There is no ―silver bullet‖. If in doubt – let the business decide.
Thank You!
Contact information:
Oliver Weigel
Global CoE Solution Director BI
SAP AG – Dietmar-Hopp-Allee 16 – 69190 Walldorf
M: +49 151 62345014
© 2012 SAP AG. All rights reserved.
No part of this publication may be reproduced or transmitted in any form or for any purpose without the express permission of SAP AG. The information contained herein may be changed without prior notice.
Some software products marketed by SAP AG and its distributors contain proprietary software components of other software vendors.
Microsoft, Windows, Excel, Outlook, and PowerPoint are registered trademarks of Microsoft Corporation.
IBM, DB2, DB2 Universal Database, System i, System i5, System p, System p5, System x, System z, System z10, System z9, z10, z9, iSeries, pSeries, xSeries, zSeries, eServer, z/VM, z/OS, i5/OS, S/390, OS/390, OS/400, AS/400, S/390 Parallel Enterprise Server, PowerVM, Power Architecture, POWER6+, POWER6, POWER5+, POWER5, POWER, OpenPower, PowerPC, BatchPipes, BladeCenter, System Storage, GPFS, HACMP, RETAIN, DB2 Connect, RACF, Redbooks, OS/2, Parallel Sysplex, MVS/ESA, AIX, Intelligent Miner, WebSphere, Netfinity, Tivoli and Informix are trademarks or registered trademarks of IBM Corporation.
Linux is the registered trademark of Linus Torvalds in the U.S. and other countries.
Adobe, the Adobe logo, Acrobat, PostScript, and Reader are either trademarks or registered trademarks of Adobe Systems Incorporated in the United States and/or other countries.
Oracle is a registered trademark of Oracle Corporation.
UNIX, X/Open, OSF/1, and Motif are registered trademarks of the Open Group.
Citrix, ICA, Program Neighborhood, MetaFrame, WinFrame, VideoFrame, and MultiWin are trademarks or registered trademarks of Citrix Systems, Inc.
HTML, XML, XHTML and W3C are trademarks or registered trademarks of W3C®, World Wide Web Consortium, Massachusetts Institute of Technology.
Java is a registered trademark of Sun Microsystems, Inc.
JavaScript is a registered trademark of Sun Microsystems, Inc., used under license for technology invented and implemented by Netscape.
SAP, R/3, SAP NetWeaver, Duet, PartnerEdge, ByDesign, SAP BusinessObjects Explorer, StreamWork, and other SAP products and services mentioned herein as well as their respective logos are trademarks or registered trademarks of SAP AG in Germany and other countries.
© 2012 SAP AG. All rights reserved
Business Objects and the Business Objects logo, BusinessObjects, Crystal Reports, Crystal Decisions, Web Intelligence, Xcelsius, and other Business Objects products and services mentioned herein as well as their respective logos are trademarks or registered trademarks of Business Objects Software Ltd. Business Objects is an SAP company.
Sybase and Adaptive Server, iAnywhere, Sybase 365, SQL Anywhere, and other Sybase products and services mentioned herein as well as their respective logos are trademarks or registered trademarks of Sybase, Inc. Sybase is an SAP company.
All other product and service names mentioned are the trademarks of their respective companies. Data contained in this document serves informational purposes only. National product specifications may vary.
The information in this document is proprietary to SAP. No part of this document may be reproduced, copied, or transmitted in any form or for any purpose without the express prior written permission of SAP AG.
This document is a preliminary version and not subject to your license agreement or any other agreement with SAP. This document contains only intended strategies, developments, and functionalities of the SAP® product and is not intended to be binding upon SAP to any particular course of business, product strategy, and/or development. Please note that this document is subject to change and may be changed by SAP at any time without notice.
SAP assumes no responsibility for errors or omissions in this document. SAP does not warrant the accuracy or completeness of the information, text, graphics, links, or other items contained within this material. This document is provided without a warranty of any kind, either express or implied, including but not limited to the implied warranties of merchantability, fitness for a particular purpose, or non-infringement.
SAP shall have no liability for damages of any kind including without limitation direct, special, indirect, or consequential damages that may result from the use of these materials. This limitation shall not apply in cases of intent or gross negligence.
The statutory liability for personal injury and defective products is not affected. SAP has no control over the information that you may access through the use of hot links contained in these materials and does not endorse your use of third-party Web pages nor provide any warranty whatsoever relating to third-party Web pages.