Embed Size (px)
Citation preview

Webinar 8: Performance Measurement and
Attribution
New Jersey Department of Health (NJDOH)
1Prepared by Myers and Stauffer LC

Training Session Objectives
To review program updates
To review key performance measurement requirements
To review the final attribution and patient roster layout
To discuss matching results and next steps
To review FAQs
2Prepared by Myers and Stauffer LC

3Prepared by Myers and Stauffer LC
Program Updates and Reminders
Databook has been approved and posted on the dsrip.nj.gov website. • A revision log has been added to the databook that
indicates the changes that were made between the draft and the first edition. This will be maintained as updates occur throughout the waiver.
Final retrospective attribution is expected to be sent to hospitals and reporting partners next week.

4Prepared by Myers and Stauffer LC
Program Updates and Reminders For hospitals with reporting partners:
• An email was sent requesting your reporting partner information be updated to include point of contacts for FTP access.
• An email will be sent to these contacts with the terms of use agreement.• Upon electronic acceptance of the agreement, user ids and passwords will
be generated and sent to the contacts. • The reporting partner attribution files will then be sent directly to your
reporting partner contacts for download. If you believe you should have received this email and you
did not, please contact the DSRIP team. If you have received this email and have not yet returned
contact information, please be aware that the reporting partner file cannot be shared at this time.
Data sharing cannot be to a third party vendor (i.e. NJHITECH).

5Prepared by Myers and Stauffer LC
Key Performance Measure Requirements
DSRIP measurement is based on the New Jersey Low Income population. This includes Medicaid, CHIP (Children’s Health Insurance Program), and Charity Care patients. • Inclusive of fee-for-service, managed care, and dually-eligible patients • DSRIP projects do not need to limit patients by coverage criteria, but measurement will. • All-payer data does not meet measure criteria.
Performance measurement can be calculated using one, or a combination, of the following methodologies:• Administrative Claims Data - Medicaid Management Information System (MMIS) extracts• Medical Records - Electronic Health Records (EHR)• Medical Records - Direct Chart abstraction

6Prepared by Myers and Stauffer LC
Key Performance Measure Requirements All Stage 3 and Inpatient Stage 4 Chart/ EHR measures are due to be reported as of
April 30, 2015 as described in the Databook.
CMS has approved a one year deferral for all Outpatient Stage 4 Chart/ EHR measures. If however, the measure (Controlling High Blood Pressure) is reportable for your Stage 3 project, it is still due to be reported April 2015.
All Stage 3 and Stage 4 Chart/ EHR measurement results are reportable by the Hospital via the Standard Reporting Workbook included in the Databook.
The denominator for all Stage 3 and Stage 4 measures will be based on the final retrospective attributed population for the hospital.
7Prepared by Myers and Stauffer LC
Data Source DSRIP # NQF # Metric NameResponsible
PartySteward Setting of Care
Reporting Period
Experience Period
Baseline Period Stage 3 Stage 4
Chart/EHR 30Based on
0064Comprehensive Diabetes Care:
LDL-C Control <100mg/dLHospital/ DSRIP
NetworkNCQA Outpatient Annual; April Calendar Year CY 2015 NA 17
Chart/EHR 31 0018Controlling High Blood Pressure
(CBP)Hospital/ DSRIP
NetworkNCQA Outpatient Annual; April Calendar Year
Stage 3= CY 2014Stage 4= CY 2015
6.2, 7.3, 8.3, 11.8, 12.6
16
Chart/EHR 55Based on
0075
Ischemic Vascular Disease (IVD): Complete Lipid Profile and LDL-C
Control <100mg/dL
Hospital/ DSRIP Network
NCQA Outpatient Annual; April Calendar Year CY 2015 6, 7, 8 18
Chart/EHR 56 0068Ischemic Vascular Disease (IVD):
Use of Aspirin or Another Antithrombotic
Hospital/ DSRIP Network
NCQA Outpatient Annual; April Calendar Year CY 2015 6, 7, 8 14
Chart/EHR 75Not
FoundPreventive Care and Screening:
High Blood PressureHospital/ DSRIP
NetworkCMS Outpatient Annual; April Calendar Year CY 2015 6, 7, 8 15
Chart/EHR 76 0028Preventive Care and Screening:
Tobacco Use: Screening and Cessation Intervention
Hospital/ DSRIP Network
AMA-PCPI
Outpatient Annual; April Calendar Year CY 2015 6, 7, 8 19
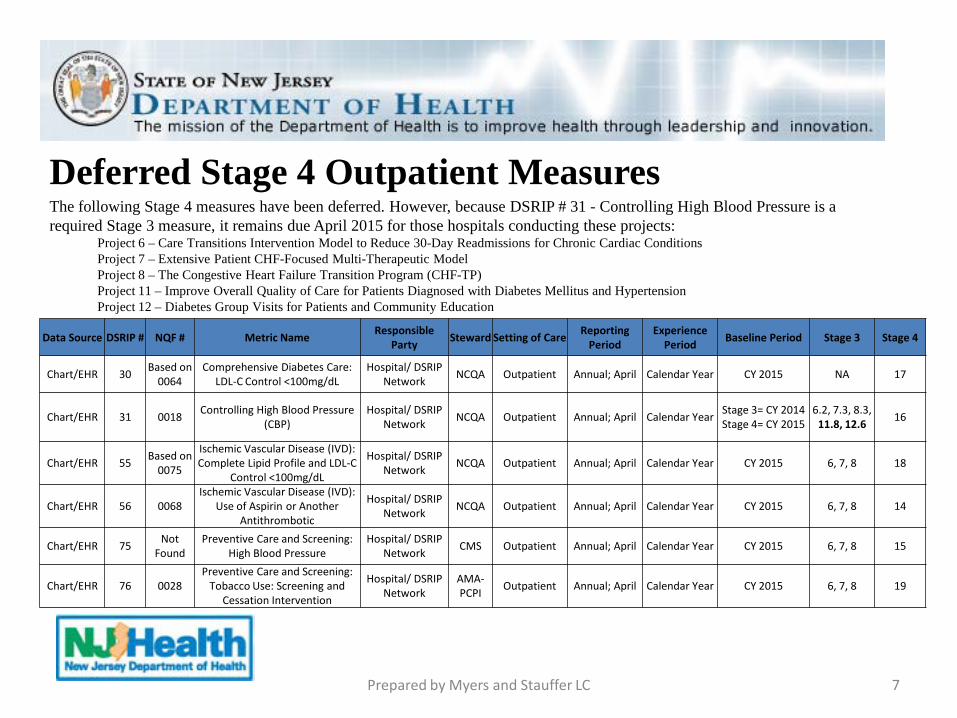
The following Stage 4 measures have been deferred. However, because DSRIP # 31 - Controlling High Blood Pressure is a required Stage 3 measure, it remains due April 2015 for those hospitals conducting these projects:
Project 6 – Care Transitions Intervention Model to Reduce 30-Day Readmissions for Chronic Cardiac ConditionsProject 7 – Extensive Patient CHF-Focused Multi-Therapeutic ModelProject 8 – The Congestive Heart Failure Transition Program (CHF-TP)Project 11 – Improve Overall Quality of Care for Patients Diagnosed with Diabetes Mellitus and HypertensionProject 12 – Diabetes Group Visits for Patients and Community Education
Deferred Stage 4 Outpatient Measures

8Prepared by Myers and Stauffer LC
Substitution Measures If a hospital’s Stage 3 P4P baseline year performance exceeds the baseline
performance threshold, the measure will be replaced by a substitution measure.
Stage 3 Substitution measures are included in Addendum 1 - Stage 3 Measures Catalogue and marked as substitution measures.
Refer to Planning Protocol pages 39-41 for further information regarding Stage 3 substitution requirements. Substitution measures are not required to be reported unless determined as such by the Department.
UPP substitution measures for maternity and pediatric services have been determined based on your hospital’s completion of your Data Reporting Plan. Stage 4 pay for reporting does not require substitution.

9Prepared by Myers and Stauffer LC
Measure Specifications
Databook specifications were compiled from the measure steward. If there is information that is not applicable to how your hospital captures information, your hospital must determine whether to pull data from your billing system or electronic medical record system.
If your hospital does not have the referenced measure steward CPT codes , your hospital can utilize the corresponding codes utilized by your hospital. If you crosswalk codes, ensure that your facility maintains documentation of the crosswalk.
The Department continues to await feedback from CMS regarding retired measures.

10
Links patients to hospitals based on two years of a patient’s utilization pattern identified through claims
Based on Evaluation and Management Visits – code list is located in the Appendix B - Programming Assumptions document
30/70 Weighting – most current year’s utilization has higher weighting value as it reflects more current patient behavior
To act as evidence of an established relationship with a provider, a minimum threshold of ten percent (10%) of utilization per categoryis included in the attribution approach
Prepared by Myers and Stauffer LC
Attribution Model - hierarchical, with 10% threshold
11Prepared by Myers and Stauffer LC
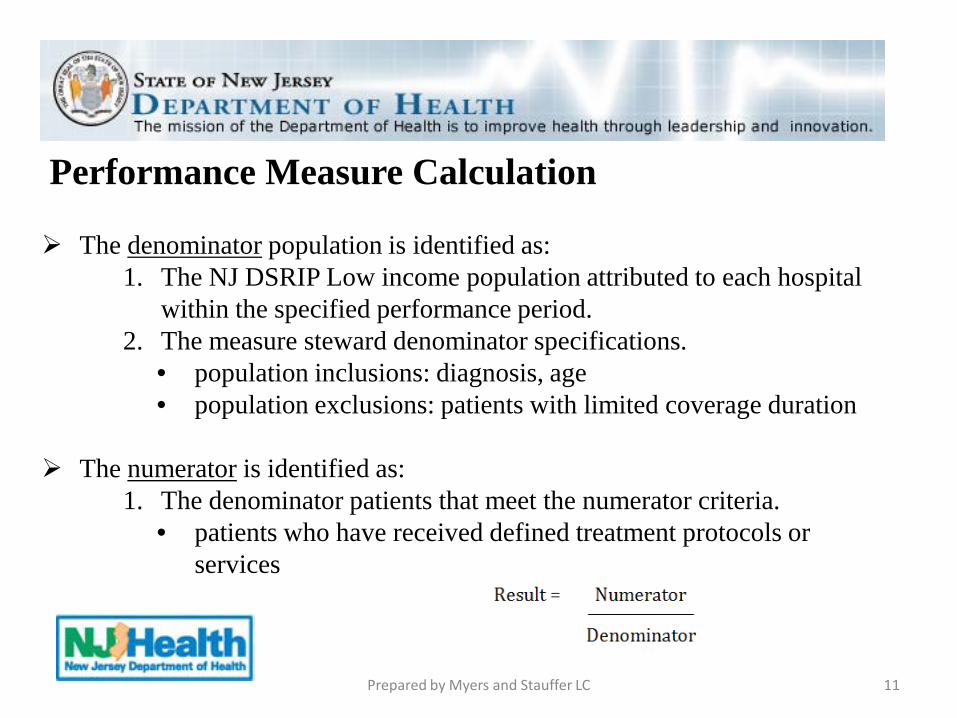
Performance Measure Calculation
The denominator population is identified as:1. The NJ DSRIP Low income population attributed to each hospital
within the specified performance period.2. The measure steward denominator specifications.
• population inclusions: diagnosis, age• population exclusions: patients with limited coverage duration
The numerator is identified as:1. The denominator patients that meet the numerator criteria.
• patients who have received defined treatment protocols or services

Performance Measure CalculationHospital Entity Only
Represents data “walls” which excludes a much larger universe of patients that are not included in the DSRIP dataset (non-attributed Medicaid, commercial, Medicare-only)
A patient does not have to be enrolled in your project to be attributed to your hospital.
Prepared by Myers and Stauffer LC 12

There may be multiple reporting entities if the following applies:
Inpatient measures –• A hospital system has multiple hospital reporting sites
Outpatient measures –• A DSRIP network has a hospital-based clinic and a community-
based partner reporting the same outpatient measure• A DSRIP network has multiple hospital-based clinic sites• A DSRIP network has multiple community-based partners reporting
the same outpatient measure
Performance Measure Calculation – Chart measures
Prepared by Myers and Stauffer LC 13

Performance Measure CalculationMultiple Reporting Entities Data collection is limited to the provider’s data only. Provider A will collect information available to Provider A. Provider B will collect information available to Provider B.
Represents SEPARATE data “walls”
Prepared by Myers and Stauffer LC 14

Semi-Annual Denominator Patient Population
“N”
Minimum RequiredSample Size
“n”
>501 150
301 - 50025% of the Denominator Patient
Population
76 - 300 7546 - 75 45
1-45No sampling; 100% of the
Denominator Patient Population is required
Semi-Annual Sample Size Sample size is calculated based on the minimum sample required to estimate the proportion with 95% confidence and a 5 point margin of error.
Annual Sample Size Sample size is calculated based on the minimum sample required to estimate the proportion with 95% confidence and a 5 point margin of error.
Annual DenominatorPatient Population
“N”
Minimum RequiredSample Size
“n”>1001 250
401 - 100025% of the Denominator
Patient Population 151 - 400 10076 - 150 7546 - 75 45
1-45No sampling; 100% of the
Denominator Patient Population is required
Performance Measure Calculation – Chart/ EHR measures
Sampling Tables - Because chart abstraction is very resource intensive (labor and cost), hospitals can choose to calculate results based on a representative sample.
Prepared by Myers and Stauffer LC 15

• If there are multiple reporting entities, weighting calculations apply and impact the overall hospital adjusted total rate.
16Prepared by Myers and Stauffer LC
Multiple Reporting Entity Measure Calculation

17Prepared by Myers and Stauffer LC
Measurement Calculation Process – PER REPORTING ENTITY
Entity downloads attributed patient roster
from FTP site.
Entity matches attributed patient list to internal data systems.
Patient Smith –Medicaid patient who
visited ED in 2014 included in file.
Patient Smith identified through
matching logic.
PROCESS PATIENT EXAMPLE 2
Entity runs query to identify patient total
who meet denominator measure specifications.
Patient Smith matches
denominator criteria for measure.
PATIENT EXAMPLE 1
Patient Harris –Commercial patient
who visited ED in 2014 NOT included in file.
PATIENT EXAMPLE 3
Patient Jones –Dually-eligible patient
who visited ED in 2013 included in file.
Patient does not qualify for DSRIP.
Patient Jones does NOT matches
denominator criteria for any measure.
Patient does not qualify for inclusion
during 2014 performance period.
Patient Jones identified through
matching logic.
Entity identifies chart sample from that initial
patient total.
Entity determines if chart sample meets numerator criteria.
Patient Sanchez is randomly selected in the
sample.
Patient does not qualify for numerator.
PATIENT EXAMPLE 4
Patient Smith is NOT randomly selected in
the sample.
Patient Smith medical record does
NOT qualify for review.
Patient Sanchez – Medicaid patient who visited ED in
2014 included in file.
Patient Sanchez identified through matching logic.
Patient Sanchez matches denominator criteria for
measure.
Upon chart review, patient has NOT had required treatment protocol.

Gap Reduction Formula
18Prepared by Myers and Stauffer LC
Original 10% Gap Reduction Model
Incentive 8% Gap Reduction Model
Line 1 Improvement Target Goal (90th percentile) 69.60 69.60
Line 2 Baseline 42.10 42.10
Line 3 Gap = Improvement Target Goal – Baseline[Line 1 – Line 2]
27.50(69.60 – 42.10)
27.50(69.60 – 42.10)
Line 4 Required reduction in the gap (10%) Incentive reduction (8%)
0.10 0.08
Line 5 Required reduction = Gap * Reduction %[Line 3 * Line 4]
2.75 (27.50 * 0.10)
2.20(27.50 * 0.08)
Line 6 Expected Improvement Target[Line 2 + Line 5]
44.85(42.10 + 2.75)
44.3(42.10 + 2.20)
Line 7 Actual Performance Result 50.21 Payment awarded
44.5 Payment awarded
If an Improvement Target Goal (ITG) cannot be set, the hospital will have to achieve a simple ten percent rate of improvement over the hospital’s baseline.

Baseline Performance Threshold – It is the expectation that a hospital will select a project for which substantial need for improvement in the Focus Area is reflected;
• For each Stage 3 P4P metric, a performance threshold will be established using baseline data to determine if substantial improvement is achievable.
• the lower of 20 percentile points below the metric’s high performance level (improvement target goal), based on New Jersey hospital’s data, or
• 20 percentile points below the 95th percentile of national performance data, if national data is available for the low income population
Performance Measure Requirements – Baseline Threshold
Example:Improvement target goal = 90th percentile
Baseline performance threshold = 90th percentile – 20 percentile points = 70th percentile
Baseline Performance Threshold
Hospital Metric Baseline
Metric Improvement Target Goal
Prepared by Myers and Stauffer LC 19
20Prepared by Myers and Stauffer LC
Data Sources:The information that is included in this workbook is based on the following data sources:
(1) administrative claims data that is captured in the New Jersey Medicaid Management Information System (MMIS).
(2) eligibility enrollment files for recipients enrolled, or have been enrolled, in the Medicaid/CHIP programs.
Patient Roster Layout

NJ DSRIP Baseline Attribution Results
Attribution Category Recipients
Hospital-Based Clinic 168,023ED Hospital 543,944
Reporting Partner 49,185Total 761,152
• 761,152 patients were attributed. • 71% of the patents were attributed based on visits to the ED.• 22% of the patients were attributed based on visits to the clinic.• 6% of the patients were attributed based on visits to the reporting partner.
• Statistics for the patient volume by hospitals: Average -15,223 attributed number of patients to a hospitalMinimum - 2,914 Maximum - 65,522
Attributed Recipients by NJ Hospital:
Charity Care 224,702
Medicaid/CHIP 536,450
Total 761,152
Prepared by Myers and Stauffer LC 21

22Prepared by Myers and Stauffer LC
The purpose of the workbook is to provide a roster of your hospital's attributed population based on that attribution model.
Hospital’s Patient LayoutPatients that are included in this workbook have been attributed based on the hospital-based clinic or the emergency department (ED) category. This also includes patients who have received services at both the hospital (either hospital-based clinic or ED) and the reporting partner location.
• If a patient received services ONLY at the hospital, the patient will be included on your layout.
• If a patient received services at the hospital AND the reporting partner, the patient will be included on your layout.
• If a patient was NEVER seen by the hospital, the patient will be excluded from your layout.
Patient Roster Layout

23Prepared by Myers and Stauffer LC
Reporting Partner’s Patient LayoutPatients that are included in the reporting partner’s workbook have been attributed based on the reporting partner category. This also includes patients who have received services at both the reporting partner location and the hospital (either hospital-based clinic or ED).
• If a patient received services ONLY at the reporting partner, the patient will be included on their layout.
• If a patient received services at the reporting partner AND the hospital, the patient will be included on their layout.
• If a patient was NEVER seen by the reporting partner, the patient will be excluded from their layout.
Patient Roster Layout

24Prepared by Myers and Stauffer LC
Each tab includes your hospital's data and a layout description of the information for each tab to refer to.
• Tab 1 - Summary: This tab includes summary level data regarding your hospital's overall attributed population.
• Tab 1 - Summary Desc: This describes what information is included in each field for this tab.
• Tab 2 - Medicaid: This tab includes patient-level information for all Medicaid and CHIP-only patients attributed to your hospital.
• Tab 2 - Medicaid Desc: This describes what information is potentially included in each field for this tab.
• Tab 3 - Charity Care: This tab includes patient-level information for all Charity Care patients, and current Charity Care patients who are, or were previously, Medicaid/ CHIP enrolled, attributed to your hospital.
• Tab 3 - Charity Care Desc: This describes what information is potentially included in each field for this tab.
Patient Roster Layout

25Prepared by Myers and Stauffer LC
For some fields, the data may be populated differently based on the program type (Medicaid/CHIP versus Charity Care). If this is the case, there will be two available field descriptions shown as: (1) -OR- (2), with a full explanation describing when each description applies.
If information is not available, or not applicable, the field will be left blank unless otherwise specified.
For some fields, the data may be blank because the information is not yet available. The administrative claims data source is being updated to submit additional fields for the purposes of DSRIP. Information will be available on the next attribution cycle and is noted as such in the field description.
Per patient, some fields may be blank if the data is not available for that patient.
Patient Roster Layout
26Prepared by Myers and Stauffer LC
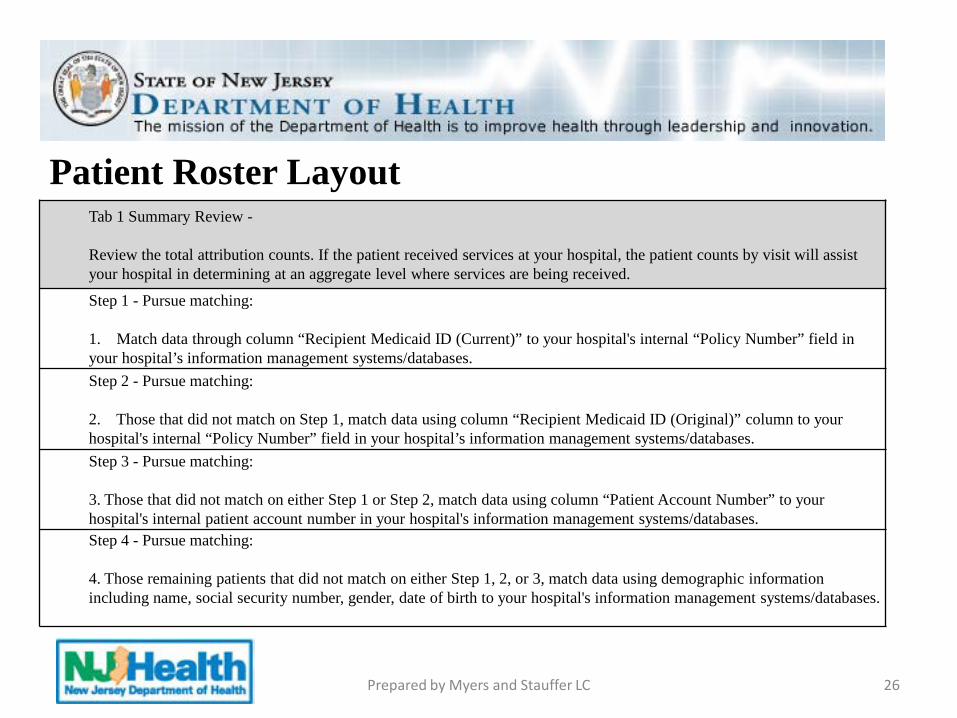
Tab 1 Summary Review -
Review the total attribution counts. If the patient received services at your hospital, the patient counts by visit will assist your hospital in determining at an aggregate level where services are being received.
Step 1 - Pursue matching:
1. Match data through column “Recipient Medicaid ID (Current)” to your hospital's internal “Policy Number” field in your hospital’s information management systems/databases. Step 2 - Pursue matching:
2. Those that did not match on Step 1, match data using column “Recipient Medicaid ID (Original)” column to your hospital's internal “Policy Number” field in your hospital’s information management systems/databases. Step 3 - Pursue matching:
3. Those that did not match on either Step 1 or Step 2, match data using column “Patient Account Number” to your hospital's internal patient account number in your hospital's information management systems/databases.Step 4 - Pursue matching:
4. Those remaining patients that did not match on either Step 1, 2, or 3, match data using demographic information including name, social security number, gender, date of birth to your hospital's information management systems/databases.
Patient Roster Layout

27Prepared by Myers and Stauffer LC
Recommended Steps to Identify and Match Attributed Patient-level Data to Reporting Partner Patient-level Data
Submit the patient attribution roster to your reporting partner(s). Reporting partners may determine that following the same matching procedures will be feasible, however they may determine that a hierarchy of matching based off of demographic information first may be more suitable. Step 3 would not apply to reporting partners.
Patient Roster Layout

28Prepared by Myers and Stauffer LC
Run date:
Attribution Period:
Visits
Attribution_ID Hospital_Name Attribution Category Recipients Hospital-Based Clinic
ED Hospital
Reporting Partner
Other Provider Totals
Hospital-Based Clinic 0 0 0 0 0 0ED Hospital 0 0 0 0 0 0Reporting Partner 0 0 0 0 0 0
Visits
Attribution_ID Hospital_Name Claim Source Category Recipients Hospital-Based Clinic
ED Hospital
Reporting Partner
Other Provider Totals
Charity Care 0 0 0 0 0 0
Medicaid/CHIP 0 0 0 0 0 0
Tab 1 – Summary Tab
Patient Roster Layout

29Prepared by Myers and Stauffer LC
Attribution Category
Recipient Medicaid
ID (Original)
Recipient Medicaid
ID (Current)
Patient Account Number
SSN (from Eligibility)
Recipient Last Name
(from Eligibility)
Recipient First Name
(from Eligibility)
Recipient Middle Initial
(from Eligibility)
Date of Birth (from
Eligibility)
Gender (from
Eligibility)
SSN (from
Claims)
Recipient Full Name (from
Claims)
Preliminary Prospective Indicator
Tab 2 – Medicaid Layout DescriptionPatient Roster Layout

30Prepared by Myers and Stauffer LC
Attribution Category
Recipient Medicaid ID
(Original)
Recipient Medicaid ID
(Current)
Patient Account Number
SSN (from Claims)
Date of Birth (from
Claims)
Gender (from
Claims)
Recipient Full Name
(from Claims)
Recipient Last Name
(from Eligibility)
Recipient First Name
(from Eligibility)
Recipient Middle
Initial (from Eligibility)
Tab 3 – Charity Care Layout Description

FAQ
31Prepared by Myers and Stauffer LC

Question:What is the expectation for matching? Is it >80% or 90% or what?
Answer:CMS has not indicated a required match rate, however, based on beta-testing, it is anticipated that hospitals will have high match rates, 90% or above.
Question: The tally numbers on page 1 of the form do not match the patient list. Why are there more in the tally count than on the detailed information sheets?
Answer:Because the tally provides summary level data (and not protected health information), it reflects all patients and their visits, including those patients only seen by the reporting partner, as applicable.
32Prepared by Myers and Stauffer LC

Question:Can you clarify the summary tab and what is included. Those patients indicated as Clinic, do they meet the following criteria:1. Seen in clinic OR2. Seen in clinic and at external reporting partner OR3. Seen in clinic and in the ED/Hospital OR4. Seen in all 3 places
Those labeled as ED means:1. Seen in hospital/ED only
Answer:The patient counts are unique patients that were attributed based on the category. The visit counts show where those unique patients are being seen.
33Prepared by Myers and Stauffer LC

Question: If patient abc is in the attribution list with Medicaid policy 123, and a metric requires to search for that patient history; if we happen to find qualifying history under a commercial payer, would that still count for inclusion or do we need to search history when the patient was low income population?
Answer:The qualifying denominator is for the attributed low income, therefore, treatment history during the performance period should consider care while the patient was low income.
Question: Will the final attribution roster be more complete than the preliminary roster?
Answer:The final attribution will be most representative of current utilization by the patients seen by your hospital/partner(s) for the time period the report is run. The final attribution will be using 2013-2014 data.
34Prepared by Myers and Stauffer LC

Question:For stage 3 submission (April 2015) we are only submitting the Project Specific inpatient measures?
Answer:Stage 4 inpatient measures are due April 2015. Stage 4 outpatient measures were deferred. Please refer to slide 7.
Question:Data reporting partners will receive their own patient attribution list and submit their own data?
Answer:Reporting partners will not submit their own data. Reporting partners must follow the steps described in the databook (refer to pages 14-18). This includes sending the results to the hospital, the hospital entering the information into the Standard Reporting Workbook, and submitting all reportable data by the required deadlines.
35Prepared by Myers and Stauffer LC

Question: I need clarification on sampling. If we were to run a query to determine the denominator for multiple chart abstracted measures there are certain fields that cannot be generated by a query. So for example DSRIP #23. I ran a query of all Medicaid patients with V27.0, LOS<=120 days, 8 <Age<65. For this I got 846 patients. However, what I could not put together in that query was whether they were nulliparious, enrolled in clinical trials, and gestational age.
Is the expectation that we then review those 846 charts to see if any of the above exclusion criteria is met and then come up with the “True” Denominator? From there we can sample? Or can the Sampling be based off the 25% of the 846 generated from the initial criteria. This would then give us 212 charts to review but in some of them the exclusion criteria would kick in so the submitted denominator would then be less than 212.
Answer:
The hospital would be required to oversample until the 212 charts are met.
36Prepared by Myers and Stauffer LC

Question: I have noticed in the metrics’ specifications that the diagnosis and procedure codes are missing the zeroes to the right: e.g. 401 instead of 401.0 or 401.00. For example, in metric DSRIP #31: Hypertension 401When I search our classification master table for 401, 401.0 and 401.00 I get only: 401.0 MALIGNANT ESSENTIAL HYPERTENSION, but the specification looks only for hypertension code 401.
Answer:Please refer to page 21 of the databook. When NCQA code tables were utilized, the minimum specificity may be indicated. There was an assumption applied for MMIS measures to expand the minimum level to the highest specificity level available based on NCQA instructions. This also applies to chart/EHR measures. AHRQ code tables were consistently identified at the highest level of code specificity and in these cases, no further expansion should be required.
37Prepared by Myers and Stauffer LC

Question:In preparation for the final attribution roster. When matching the patients on the roster we noticed they were only Emergency Department Patients and Clinic Patients. Were hospital inpatients excluded? Are the patient names for reference and then we run the measure for these patients to see if they had an inpatient occurrence that qualified?
Answer:The Evaluation and Management visits listed in the Programming Assumptions document were utilized in the attribution algorithm. For each measure, reporting entities consider whether the attributed patient meets denominator criteria (qualifies) for the measure.
38Prepared by Myers and Stauffer LC

Question:The Appendix B Programming Assumptions states that the attribution model uses E&M codes from CY2011 & CY2012 dates of service. The webinar stated that our data is from 2012-2013 data. I just want to make sure we are actually looking at data in this prospective model from 2012-2013 and not CY2011-2012.
Answer:The dates utilized for attribution for the preliminary prospective model were updated to that of CY2012-2013. The final retrospective model will be for dates CY2013-2014.
39Prepared by Myers and Stauffer LC

Question:I am looking at the “Patient Account Number” in the attribution sheet we received. We cannot seem to correlate the number provided to anything related to the patient. Can you provide information as to what this number is? This is true of Medicaid and Charity Care patients.
Answer:For Medicaid and CHIP patients, as defined on the layout description, the information available is the internal claim number of the managed care organization (MCO) responsible for payment of the claim. During the transmission of data from the MCO to the Medicaid fiscal agent, the data in this field is changed. The hospital provider's patient account number (as indicated on the claim form) is replaced by the MCO internal claim number. The MCO claim number may be data returned to the hospital provider when the claim is processed for payment. The maximum date of service (most recent date) in the attribution period with a claim will be used for that patient for that hospital. Patient account numbers of project partners are not utilized. This applies to claims with Claim Source = "Encounter - HMO."
For Charity Care patients, the information may be the hospital provider's patient account number as indicated on the claim form when the claim is submitted for payment to the Medicaid program. This number is not expected to be altered from what was originally submitted on the claim. Patient account numbers of project partners are not utilized. This applies to claims with Claim Source = "Fee for Service" or "Charity Care."
40Prepared by Myers and Stauffer LC

Question:In order for us to abstract the Medication Reconciliation measure we need to identify patients that were discharged and seen by external reporting partners within 30 days. Will the attribution list that we receive identify those patients discharged from the hospital and also seen by the partners within 30 days? Otherwise how would we be able to identify these patients? The file for the partners are not being given to us. How would we find/match to those patients?
Answer:As described in the specification, the denominator for the Medication Reconciliation is:
Of the New Jersey Low Income attributed population, all patients aged 18 years and older discharged from any inpatient facility (i.e. hospital) between January 1 and December 1 of the measurement year and seen within 30 days of discharge in the office by the physician, prescribing practitioner, registered nurse, or clinical pharmacist providing on-going care.
This is an outpatient measure monitoring outpatient provider patterns. It is expected that outpatient providers are receiving discharge information, and for those patients who are being seen post discharge, medication reconciliations are being conducted.
41Prepared by Myers and Stauffer LC

Q & A
42Prepared by Myers and Stauffer LC