Embed Size (px)
Citation preview
41
Tsukuba Geoenvironmental Sciences, Vol. 5, pp. 41-45, Dec. 26, 2009
Abstract This article examines walkability areas in Tsukuba and presents results on the web by creating Walkability WebGIS. ALOS image, Zenrin, and road maps were used for the study. Greenness index was computed to highlight urban greeneries in the walkability areas. A fieldwork was conducted to verify the research results. From well settled to tranquil areas were identified to better inform the walkers or bicycle riders. Walkability routes were further graded into five levels of suitability ranging from very low to very high based on the greenness index. Walkability WebGIS (http://sae.sk.tsukuba.ac.jp/TsukubaWalkability/default.aspx) including easy-to-use help system was developed on ArcGIS Server platform to disseminate the results to the Tsukuba residents. Geographic data exploration tool bar, search and proximity analysis functions were also provided in the system. In this system, the residents can freely explore the maps and use spatial functions to understand their surrounding walkability environments, and print the maps for their daily use.
Key words: walkability, WebGIS, health GIS, Tsukuba
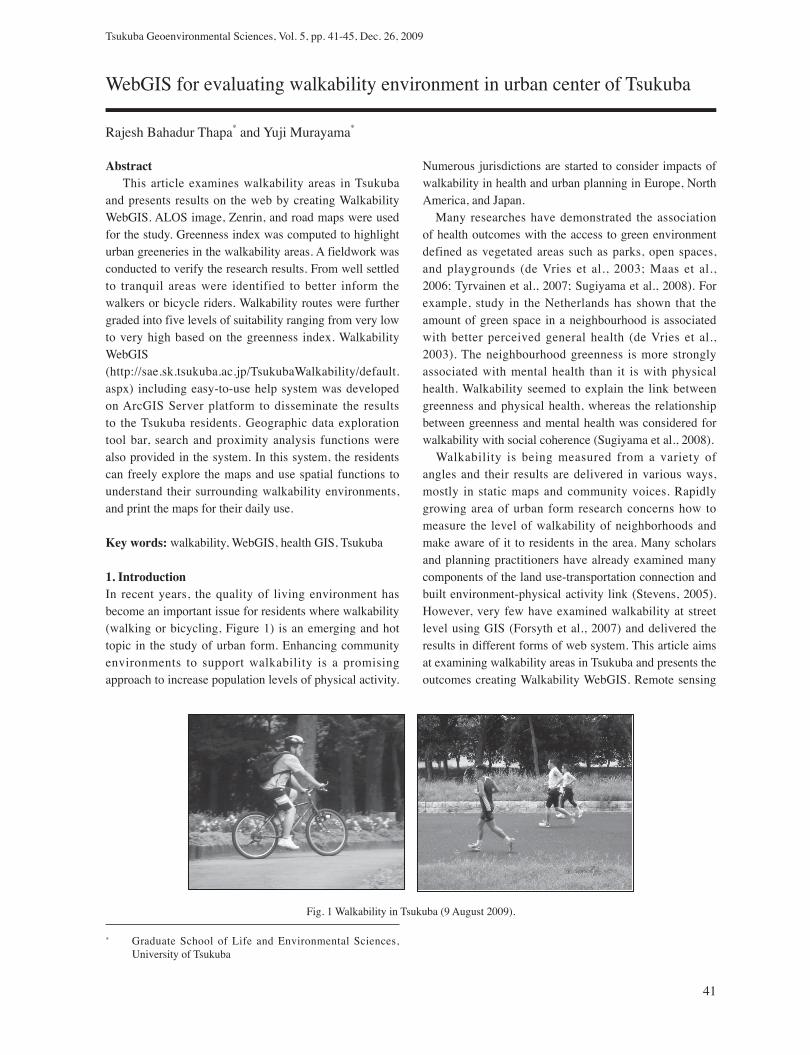
1. IntroductionIn recent years, the quality of living environment has become an important issue for residents where walkability (walking or bicycling, Figure 1) is an emerging and hot topic in the study of urban form. Enhancing community environments to support walkability is a promising approach to increase population levels of physical activity.
Numerous jurisdictions are started to consider impacts of walkability in health and urban planning in Europe, North America, and Japan. Many researches have demonstrated the association of health outcomes with the access to green environment defined as vegetated areas such as parks, open spaces, and playgrounds (de Vries et al., 2003; Maas et al., 2006; Tyrvainen et al., 2007; Sugiyama et al., 2008). For example, study in the Netherlands has shown that the amount of green space in a neighbourhood is associated with better perceived general health (de Vries et al., 2003). The neighbourhood greenness is more strongly associated with mental health than it is with physical health. Walkability seemed to explain the link between greenness and physical health, whereas the relationship between greenness and mental health was considered for walkability with social coherence (Sugiyama et al., 2008). Walkability is being measured from a variety of angles and their results are delivered in various ways, mostly in static maps and community voices. Rapidly growing area of urban form research concerns how to measure the level of walkability of neighborhoods and make aware of it to residents in the area. Many scholars and planning practitioners have already examined many components of the land use-transportation connection and built environment-physical activity link (Stevens, 2005). However, very few have examined walkability at street level using GIS (Forsyth et al., 2007) and delivered the results in different forms of web system. This article aims at examining walkability areas in Tsukuba and presents the outcomes creating Walkability WebGIS. Remote sensing
* Graduate School of Life and Environmental Sciences, University of Tsukuba
WebGIS for evaluating walkability environment in urban center of Tsukuba
Rajesh Bahadur Thapa* and Yuji Murayama*
Fig. 1 Walkability in Tsukuba (9 August 2009).
42
Rajesh Bahadur Thapa and Yuji Murayama
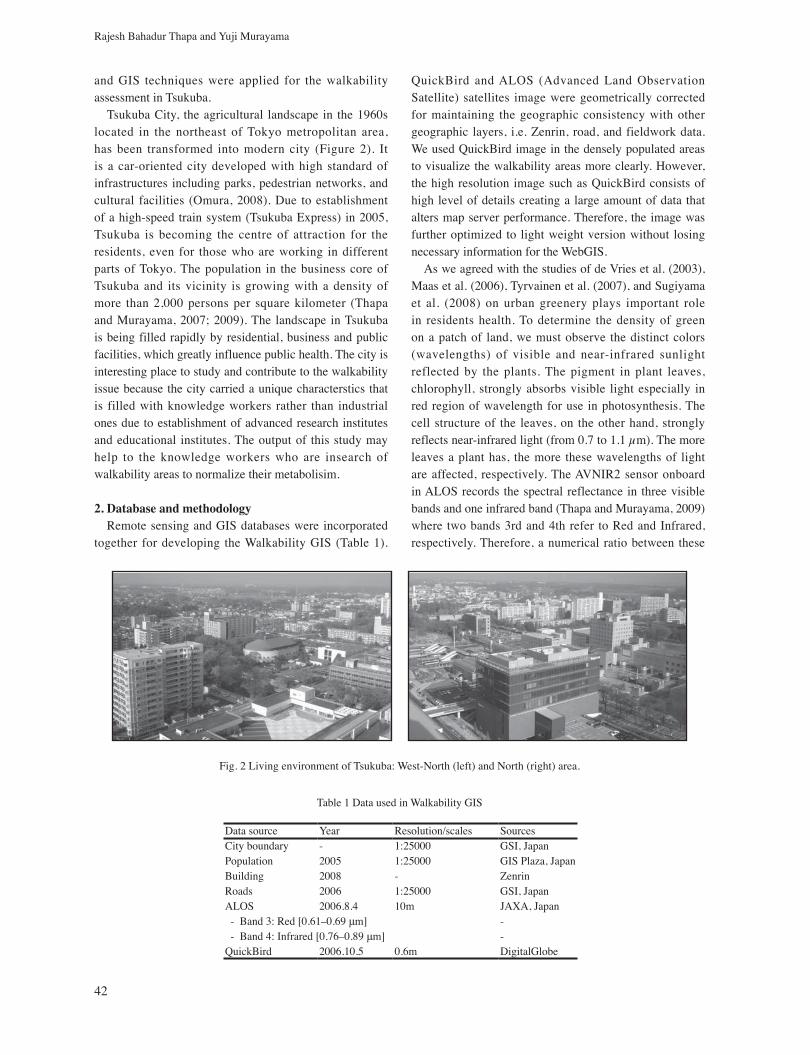
and GIS techniques were applied for the walkability assessment in Tsukuba. Tsukuba City, the agricultural landscape in the 1960s located in the northeast of Tokyo metropolitan area, has been transformed into modern city (Figure 2). It is a car-oriented city developed with high standard of infrastructures including parks, pedestrian networks, and cultural facilities (Omura, 2008). Due to establishment of a high-speed train system (Tsukuba Express) in 2005, Tsukuba is becoming the centre of attraction for the residents, even for those who are working in different parts of Tokyo. The population in the business core of Tsukuba and its vicinity is growing with a density of more than 2,000 persons per square kilometer (Thapa and Murayama, 2007; 2009). The landscape in Tsukuba is being filled rapidly by residential, business and public facilities, which greatly influence public health. The city is interesting place to study and contribute to the walkability issue because the city carried a unique characterstics that is filled with knowledge workers rather than industrial ones due to establishment of advanced research institutes and educational institutes. The output of this study may help to the knowledge workers who are insearch of walkability areas to normalize their metabolisim.
2. Database and methodology Remote sensing and GIS databases were incorporated together for developing the Walkability GIS (Table 1).
QuickBird and ALOS (Advanced Land Observation Satellite) satellites image were geometrically corrected for maintaining the geographic consistency with other geographic layers, i.e. Zenrin, road, and fieldwork data. We used QuickBird image in the densely populated areas to visualize the walkability areas more clearly. However, the high resolution image such as QuickBird consists of high level of details creating a large amount of data that alters map server performance. Therefore, the image was further optimized to light weight version without losing necessary information for the WebGIS. As we agreed with the studies of de Vries et al. (2003), Maas et al. (2006), Tyrvainen et al. (2007), and Sugiyama et al. (2008) on urban greenery plays important role in residents health. To determine the density of green on a patch of land, we must observe the distinct colors (wavelengths) of visible and near-infrared sunlight reflected by the plants. The pigment in plant leaves, chlorophyll, strongly absorbs visible light especially in red region of wavelength for use in photosynthesis. The cell structure of the leaves, on the other hand, strongly reflects near-infrared light (from 0.7 to 1.1 µm). The more leaves a plant has, the more these wavelengths of light are affected, respectively. The AVNIR2 sensor onboard in ALOS records the spectral reflectance in three visible bands and one infrared band (Thapa and Murayama, 2009) where two bands 3rd and 4th refer to Red and Infrared, respectively. Therefore, a numerical ratio between these
Data source Year Resolution/scales SourcesCity boundary - 1:25000 GSI, JapanPopulation 2005 1:25000 GIS Plaza, JapanBuilding 2008 - ZenrinRoads 2006 1:25000 GSI, JapanALOS 2006.8.4 10m JAXA, Japan - Band 3: Red [0.61–0.69 μm] - - Band 4: Infrared [0.76–0.89 μm] -QuickBird 2006.10.5 0.6m DigitalGlobe
Table 1 Data used in Walkability GIS
Fig. 2 Living environment of Tsukuba: West-North (left) and North (right) area.
43
WebGIS for evaluating walkability environment in urban center of Tsukuba
red and infrared bands provides a clearer picture of green density in the study area. Based on the spectra recorded in the ALOS satellite image, a greenness index (eq. 1) also known as a normalized differential vegetation index (NDVI) was computed to highlight the density of urban greeneries in the walkability area.
NDVI = +1..…….. (eq. 1)
Note: λ = wavelength NIR= near infrared R = red
[ ]λNIR ‐ λR
λNIR + λR
The equation produces a gradient score between 1 and 2 which represents higher the value in a patch of land, greater the greenness density in the land. The score of greenness index was further aggregated to the street level. Based on the index value, the streets were further classified into five levels of greenery from very high to
very low. As an walkability area awareness, the city core area was presented in four categories, i.e., well settled walking area, easy access to shopping malls, mixed landscape area, and tranquil area based on the study of Asai (2008). A field work was conducted to verify the results and update information in the web. PDA (Personal Digital Assistant) integrated with the GPS was used in the field work. The PDA was equipped with a geographic data collection form and the map layers of roads, walkability area and greenery. An interactive Walkability WebGIS in ArcGIS Server 9.3 (ESRI, 2008a, 2008b) platform was established to deliver the research results to the Tsukuba residents as a practical scenario. The WebGIS packaged all the results from this research, basic spatial functions for map exploration, and help system.
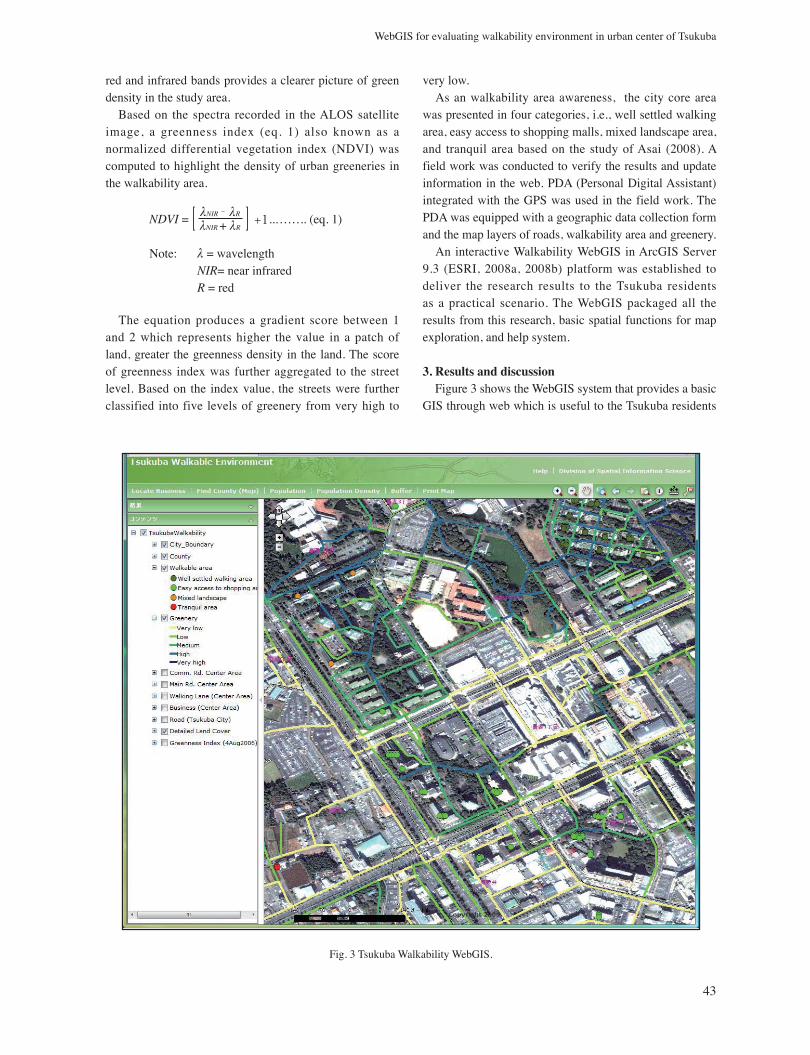
3. Results and discussion Figure 3 shows the WebGIS system that provides a basic GIS through web which is useful to the Tsukuba residents
Fig. 3 Tsukuba Walkability WebGIS.
44
Rajesh Bahadur Thapa and Yuji Murayama
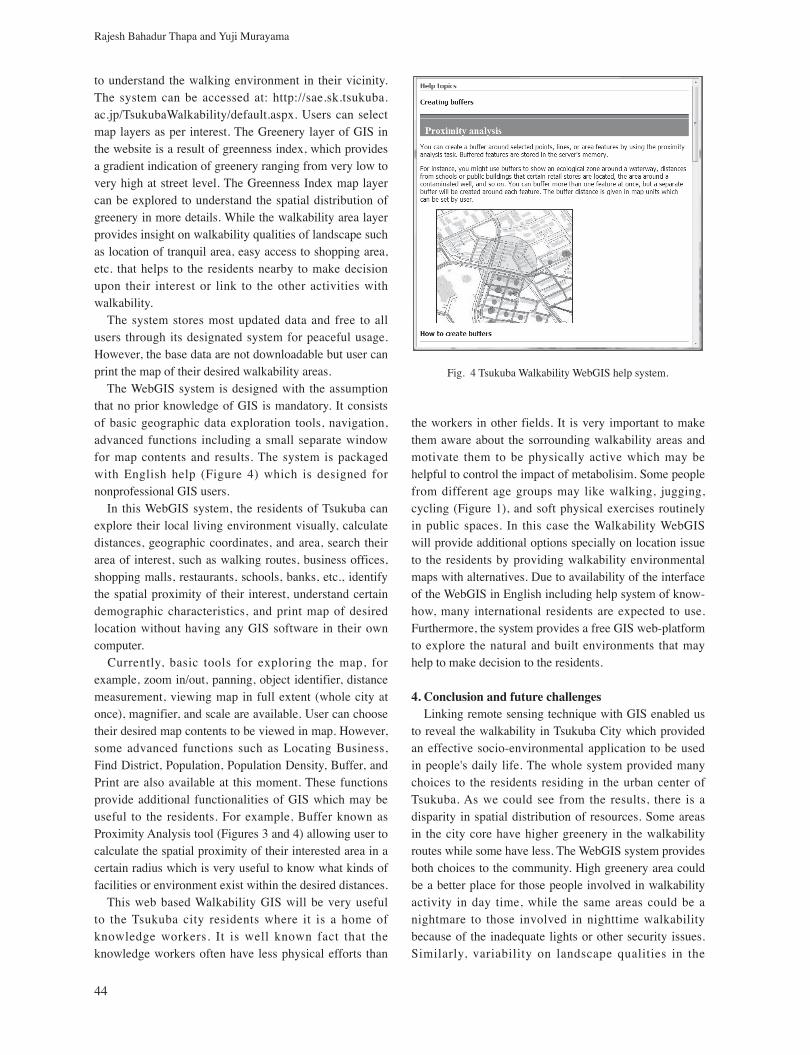
to understand the walking environment in their vicinity. The system can be accessed at: http://sae.sk.tsukuba.ac.jp/TsukubaWalkability/default.aspx. Users can select map layers as per interest. The Greenery layer of GIS in the website is a result of greenness index, which provides a gradient indication of greenery ranging from very low to very high at street level. The Greenness Index map layer can be explored to understand the spatial distribution of greenery in more details. While the walkability area layer provides insight on walkability qualities of landscape such as location of tranquil area, easy access to shopping area, etc. that helps to the residents nearby to make decision upon their interest or link to the other activities with walkability. The system stores most updated data and free to all users through its designated system for peaceful usage. However, the base data are not downloadable but user can print the map of their desired walkability areas. The WebGIS system is designed with the assumption that no prior knowledge of GIS is mandatory. It consists of basic geographic data exploration tools, navigation, advanced functions including a small separate window for map contents and results. The system is packaged with English help (Figure 4) which is designed for nonprofessional GIS users. In this WebGIS system, the residents of Tsukuba can explore their local living environment visually, calculate distances, geographic coordinates, and area, search their area of interest, such as walking routes, business offices, shopping malls, restaurants, schools, banks, etc., identify the spatial proximity of their interest, understand certain demographic characteristics, and print map of desired location without having any GIS software in their own computer. Currently, basic tools for exploring the map, for example, zoom in/out, panning, object identifier, distance measurement, viewing map in full extent (whole city at once), magnifier, and scale are available. User can choose their desired map contents to be viewed in map. However, some advanced functions such as Locating Business, Find District, Population, Population Density, Buffer, and Print are also available at this moment. These functions provide additional functionalities of GIS which may be useful to the residents. For example, Buffer known as Proximity Analysis tool (Figures 3 and 4) allowing user to calculate the spatial proximity of their interested area in a certain radius which is very useful to know what kinds of facilities or environment exist within the desired distances. This web based Walkability GIS will be very useful to the Tsukuba city residents where it is a home of knowledge workers. It is well known fact that the knowledge workers often have less physical efforts than
the workers in other fields. It is very important to make them aware about the sorrounding walkability areas and motivate them to be physically active which may be helpful to control the impact of metabolisim. Some people from different age groups may like walking, jugging, cycling (Figure 1), and soft physical exercises routinely in public spaces. In this case the Walkability WebGIS will provide additional options specially on location issue to the residents by providing walkability environmental maps with alternatives. Due to availability of the interface of the WebGIS in English including help system of know-how, many international residents are expected to use. Furthermore, the system provides a free GIS web-platform to explore the natural and built environments that may help to make decision to the residents.
4. Conclusion and future challenges Linking remote sensing technique with GIS enabled us to reveal the walkability in Tsukuba City which provided an effective socio-environmental application to be used in people's daily life. The whole system provided many choices to the residents residing in the urban center of Tsukuba. As we could see from the results, there is a disparity in spatial distribution of resources. Some areas in the city core have higher greenery in the walkability routes while some have less. The WebGIS system provides both choices to the community. High greenery area could be a better place for those people involved in walkability activity in day time, while the same areas could be a nightmare to those involved in nighttime walkability because of the inadequate lights or other security issues. Similarly, variability on landscape qualities in the
Fig. 4 Tsukuba Walkability WebGIS help system.
45
WebGIS for evaluating walkability environment in urban center of Tsukuba
walkability areas is also existed which can be connected with personal choice of the residents. For example, some residents like to combine walkability with shoppings there fore they can choose the areas that have easy access to shopping, areas. As a future prospect, adding more spatial functions can offer further opportunities for exploration of walkability environment in the area. More locational information associated with walkability, for example, bicycle service centers, bus stops, public taps and toilets, AED services, etc., should be added as a map layer. In this research, we computed only one greenness index to show an application of remote sensing and ALOS data potential. However, seasonal factor should be considered in the future as the density of greenery measured by the index varied based on season.
Acknowledgements We appreciate the comments from reviewers. Financial support for this research from the Health Project, Grant-in-Aid, Ministry of Health, Labour and Welfare (Grant number: WDA22101, Chief: Teruichi Shimomitsu, Professor of Tokyo Medical University) is gratefully acknowledged. We would like to express our gratitude to Professor Shigeru Inoue of Tokyo Medical University for his valuable advice.
ReferencesAsai, T. 2008. Characteristics of walking activity and
walkability evaluation in Tsukuba City. MSc. Thesis, University of Tsukuba.
de Vries, S., Verheij, R. A., Groenewegen, P. P., and Spreeuwenberg, P. 2003. Natural environments—healthy environments? An exploratory analysis of the relationship between greenspace and health. Environment and Planning A, 35(10):1717–1731.
ESRI. 2008a. ArcGIS Server 9.3 web help. http://support.esri.com/index.cfm?fa=knowledgebase.webHelp.agServer93. [Last accessed 2009.8.10.]
ESRI. 2008b. ArcGIS Server white papers. http://www.esr i .com/software/arcgis /arcgisserver /brochures_whitepapers.html. [Last accessed
2009.8.10.]Forsyth, A. (ed.), D’Sousa, E., Koepp, J., Oakes, J.
M., Schmitz, K. H., Riper, D. V., Zimmerman, J., Rodriguez, D., and Song, Y. 2007. Environment and physical activity: GIS protocols. Ver. 4.1, University of Minnesota and Cornell.
Maas, J., Verheij, R. A., Groenewegen, P. P., de Vries, S., and Spreeuwenberg, P. 2006. Green space, urbanity, and health: how strong is the relation? Journal of Epidemiology and Community Health, 60(7), 587–592.
Omura, K. 2008. Critical review of planned city: Tsukuba Science City. International Symposium on New Paradigm in Worldwide Urban Planning and Development, University of Tsukuba, Japan, 04 March.
Stevens, R. D. 2005. Walkability around neighborhood parks: an assessment of four parks in Springfield, Oregon. A project report. Department of Planning, Public Policy and Management and the Graduate School of the University of Oregon, 81p.
Sugiyama, T., Leslie, E. Giles-Corti, B., and Owen, N. 2008. Associations of neighbourhood greenness with physical and mental health: do walking, social coherence and local social interaction explain the relationships? Journal of Epidemiology and Community Health , 62(e9). doi:10.1136/jech.2007.064287
Thapa, R. B. and Murayama, Y. 2007. Image classification techniques in mapping urban landscape: A case study of Tsukuba city using AVNIR-2 sensor data. Tsukuba Geoenvironmental Sciences, 3, 3-10.
Thapa, R. B. and Murayama, Y. 2009. Evaluating walkability in Tsukuba using remote sensing and GIS. Papers and Proceedings of the Geographic Information Systems Association, 18, 549-552.
Tyrvainen, L., Makinen, K., and Schipperijn, J. 2007. Tools for mapping social values of urban woodlands and other green areas. Landscape and Urban Planning, 79(1), 5-19.
Received 3 September 2009Accepted 30 October 2009