Embed Size (px)
Citation preview

Troubleshooting high CPU on a 6500 with sup720.
The purpose of this document is to cover how to determine the cause of high CPU on a 6500/7600 with a sup720. The troubleshooting methods discussed in this documentation will make it possible to determine the cause of 90% of all high CPU issues on the sup720.
The majority of high CPU on the sup720 is related to CPU usage on the MSFC, thus the majority of this document will cover high CPU on the MSFC.
Because it would not be possible to cover every possible reason high CPU can be caused on the sup720, I will demonstrate how to use some of the tools built-in to the sup720 to show general methods on how to narrow down the cause of high CPU.
If you are unable to determine the reason based on this documentation, please open a TAC case to investigate this issue further.
**Note that these methods can be used to fine high CPU on a RSP720, Sup32 and VS-S720, due to common architecture.
Determining Where the CPU utilization is occurring:
Within the sup720 6500, there are two types of CPU’s. One is located on the supervisor and is commonly referred as the SP (Switch Processor) CPU. The other CPU is located on the MSFC (Multilayer Switch Feature Card) and it commonly referred to as the RP(Route Processor) CPU.
Also depending on the module you may also have a DFC (Distributed Feature Card) to perform forwarding locally on that module. The DFC also has its own CPU, which performs processing locally on the line card. Under certain scenarios high CPU can be seen on these modules.
High CPU on the SP (Switch processor):
High CPU on the SP is much less common than high CPU on the RP. The reasons for high CPU on the SP are typically related to layer 2 operations of the sup720, such a spanning-tree (processing of BPDU's) or processing IGMP snooping/IGMP queries/membership reports as well as LACP/PAGP.
You can view the CPU utilization using the following command:
SP CPU Util:Switch# remote command switch show process cpu
High CPU on the MSFC/RP (Route Processor):
This will be traffic that needs to be processed for layer 3 operations, such as ARP, HSRP, forwarding traffic in software. Below I will go over troubleshooting steps when seeing high CPU on the IP Input/ARP input process as well as CPU utilization caused by interrupt switched traffic on the RP

CPU.
You can view the CPU utilization using the following command:
RP CPU Util:Switch#show process cpu
High CPU on a DFC/module:
The CPU on the DFC will help in programming TCAM and router in hardware, since each DFC has its own TCAM.
High CPU on a DFC is not very common and can occur for a few different reasons. One reason you may see high CPU on the DFC is due to Netflow Data Export. Typically CPU from NDE is expected, but in rare instances it can become high enough to disrupt other processes.
You can view the CPU utilization using the following command:
DFC CPU Util:Switch# attach <module>
Switch-DFC#show process cpu
Types of CPU utilization:
There are two type of CPU utilization within IoS, interrupt and process.
Process based CPU utilization:CPU utilization caused by a process can be caused by few reasons listed below:
1.) Processes switched traffic. This is traffic that is hitting a specific process in order to be forwarded OR processed by the CPU. An example of each would traffic being forwarded via the "IP Input" process OR control-plane traffic hitting the "PIM process".
2.) A process trying to clean up tables/previous actions performed. This can be seen in process such a "CEF Scanner" OR "BGP Scanner", which are used to clean/update the CEF and BGP tables.
Interrupt based CPU utilization:
CPU caused by an interrupt is always traffic based. Interrupt switched traffic, is traffic that does not match a specific process, but still needs to be forwarded. Determining the type of CPU utilization:
Process and Interrupt CPU utilization are listed within the "show process cpu" command. This is

broken down below on how to determine what percentage of the CPU utilization is due to interrupt traffic or processed switched traffic:
6500-3#sh proc cpuCPU utilization for five seconds: 0%/0%; one minute: 0%; five minutes: 0%
Red - Percentage of total CPU utilizationBlue - Percentage of the CPU that is caused by Interrupts.
Percentage of process CPU util. = Total CPU - Interrupt CPU util.
Common reasons for HIGH CPU on the MSFC/RP:
IP traffic with a TTL of 1 - Due to the fact we need to send an IP unreachable message to the host letting them know the message has expired in transit. This cannot be done in hardware and thus the packet must be punted to the MSFC. Find the device sending traffic the TTL of 1 and stop is from sending traffic, increase the TTL OR install the MLS TTL rate-limiter.
Using an ACL with the log keyword - Since a log keyword requires a syslog message to be generated this must be punted to the RP CPU as it cannot be done in hardware. Remove the log keyword from the ACL.
Using a PBR route-map without a set statement - Any traffic that matches a PBR route-map with no set statement will be punted. This is due to the fact that we need to program the next-hop in hardware and if the next-hop is not known, this traffic must be punted to determine the next hop. Configure a set statement OR remove the policy route from the interface.
FIB TCAM Exception - If you try to install more routes than are possible into the FIB TCAM you will see the following error message in the logs:
CFIB-SP-STBY-7-CFIB_EXCEPTION : FIB TCAM exception, Some entries will be software switched
%CFIB-SP-7-CFIB_EXCEPTION : FIB TCAM exception, Some entries will be software switched %CFIB-SP-STBY-7-CFIB_EXCEPTION : FIB TCAM exception, Some entries will be softwareswitched
This error message is received when the amount of available space in the TCAM is exceeded. This results in high CPU. This is a FIB TCAM limitation. Once TCAM is full, a flag will be set and FIB TCAM exception is received. This stops from adding new routes to the TCAM. Therefore, everything will be software switched. The removal of routes does not help resume hardware switching. Once the TCAM enters the exception state, the system must be reloaded to get out of that state. You can view if you have hit a FIB TCAM exception with the following command:

6500-2#sh mls cef exception status
Current IPv4 FIB exception state = TRUE
Current IPv6 FIB exception state = FALSE
Current MPLS FIB exception state = FALSE
When the exception state is TRUE, the FIB TCAM has hit an exception.
The maximum routes that can be installed in TCAM is increased by the mls cef maximum-routes command.
This issue is common when trying to route a full BGP table on PFC-3A or a PFC-3B.
**Note a failover of the supervisors in dual supervisor system will not recover this exception, even through the “show mls cef exception status” will no longer indicate a FIB exception. A full reload of the switch is required.
ICMP redirects - If traffic is taking a path that is not efficient, an ICMP redirect will be sent out to inform the host of a better next-hop. This will cause the packet to be punted in order to trigger the MSFC to send the ICMP redirect to the host. On the 6500 ICMP redirects will be sent to the CPU with a destination index of 0x7F07. This can be seen when performing a netdr capture.
Turn off icmp redirects to stop this traffic from being punted. However this is an indication of network inefficiency that was attempting to be dynamically resolved. User interaction is needed in order to track down this inefficiency.
If you need assistance in determining why ICMP redirects are being generated please open a TAC case.
CEF Glean adjacency - This can happen when no ARP resolution for the next hop. All traffic must be punted in order to trigger an ARP request for the next hop. This will always manifest it self as interrupt based traffic.
To protect the RP CPU from this issue you can implement the Glean adj. mls rate-limiter.
Netflow and ACL feature configured on the same interface matching the same traffic - You cannot have an ACL based feature and a Flow based feature configured on the same interface for the same traffic. An Example of this would be having NAT and PBR configured on the same interface matching the same traffic.
NAT is netflow assisted, as the first packet in every flow would need to be punted to create the netflow entry in hardware. Once the netflow entry is created all subsequent packets will hit this hardware netflow entry and thus be forwarded in hardware.
Policy-Based Routing is ACL based. This will create a “policy-route” state when a route-map is configured to use PBR and applied to that interface. This will point to a special

adjacency, which is where the next-hop is specified in the “set” statement of the route-map.
The issue comes when a packet matches both the NAT and the PBR feature, the traffic can not be sent to the CPU to be put into Netflow AND be redirected to the PBR special adj, thus this traffic must be software switched. If these two features overlap, these features are taken out of hardware and the traffic is software switched. When this occurs neither feature may be applied to the matching traffic.
If a packet does not match both the ACL based feature and Netflow based feature match criteria then the relevant function (ACL based or Netflow based) will be performed in hardware.
Therefore, for proper hardware based performance in situations where ACL based features and Netflow based features are configured on the same interfaces it is important to have unique policies.
In order to look at this information in feature manager and ACL TCAM please refer to section “Determining features programmed on a layer 3 interface” below.
To work around this problem do not have both an ACL based and Netflow based feature configured on the same interface, matching the same traffic.
**Note- For a more indepth look at how features are programmed on a interface please go to the Determining the reason why traffic is punted to the CPU, section.
Directed Broadcast traffic – All broadcast traffic must be sent to the MSFC on a vlan when a layer 3 interface is configured within that vlan. This includes directed broadcast traffic. Use multicast instead of directed broadcast.
Bridging loop - If a bridging loop occurs on the network, this could cause high CPU on the MSFC. All broadcast traffic must be sent to the MSFC on a vlan when a layer 3 interface is configured within that vlan.
You can determine what traffic is hitting the CPU by using a netdr capture to track down the source interface of the loop (See Using Netdr to determine traffic punted to the CPU section).
Determining the source of the CPU utilization:
Determine the source of RP CPU utilization using interface buffers:
**Note** you will only be able to see traffic in the interface buffers on a layer 3 interface if the traffic is being processed switched (see “Determining type of CPU utilization” above). This will not work when traffic is being interrupt switched. In the case of interrupt switched traffic use the netdr capture instead.
One of the quickest ways to determine the layer 3 interface that is the source of traffic that is causing
high CPU is to see which interface has a large amount of drops flushes on the interfaces input queue. The input queue on a layer 3 interface is the CPU queue for that interface on the sup720. If we ever see packets/drops on the input queue on the sup720 it is always due to traffic that is being sent towards the CPU. You can narrow down the location of such an interface with the following commands:
6500-2#show interface | include is up|dropVlan10 is up, line protocol is up Input queue: 74/75/18063/18063 (size/max/drops/flushes); Total output drops: 0 Vlan20 is up, line protocol is up Input queue: 0/75/0/0 (size/max/drops/flushes); Total output drops: 0
We can see that SVI (Switched Virtual Interface) 10 has 74 packets in its buffer, whose queue size is 75 packets. This demonstrates that a large amount of traffic is being punted on this interface to the RP CPU, since this queue is full.
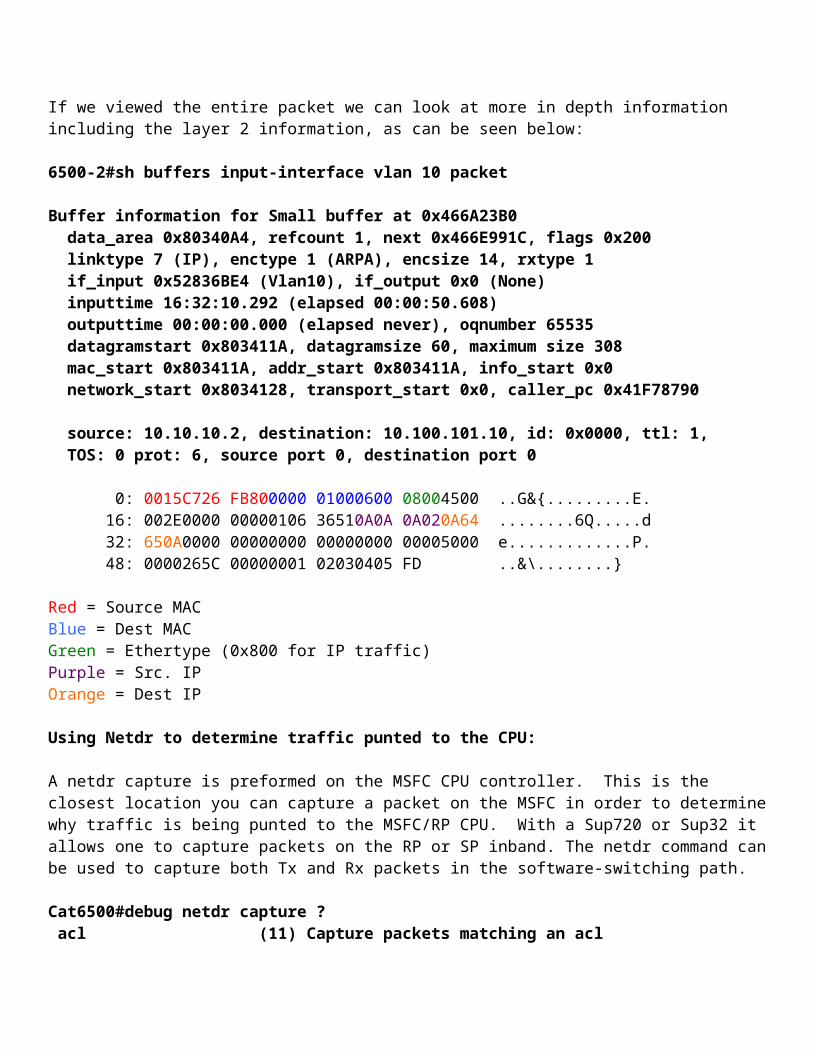
Now that we can see a large amount of traffic within this queue, we can look at what is in this queue with the command "show buffers input-interface vlan 10 header". This command will display the IP header of the packet so we can attempt to determine the source. If you want to look at the entire packet you can use the command "show buffers input-interface vlan 10 packet".
Below is the output from this command for SVI 10
6500-2#sh buffers input-interface vlan 10 header
Buffer information for Small buffer at 0x4667A08C data_area 0x802F664, refcount 1, next 0x466AE968, flags 0x200 linktype 7 (IP), enctype 1 (ARPA), encsize 14, rxtype 1 if_input 0x530D5048 (Vlan10), if_output 0x0 (None) inputtime 00:00:00.000 (elapsed never) outputtime 00:00:00.000 (elapsed never), oqnumber 65535 datagramstart 0x802F6DA, datagramsize 60, maximum size 308 mac_start 0x802F6DA, addr_start 0x802F6DA, info_start 0x0 network_start 0x802F6E8, transport_start 0x802F6FC, caller_pc 0x41F78790
source: 10.10.10.2, destination: 10.100.101.10, id: 0x0000, ttl: 1, TOS: 0 prot: 6, source port 0, destination port 0
Above we can see the basic information about this traffic that is included in the IP header, including the TOS, TTL and protocol encapsulated within the IP header.
If we viewed the entire packet we can look at more in depth information including the layer 2 information, as can be seen below:
6500-2#sh buffers input-interface vlan 10 packet

Buffer information for Small buffer at 0x466A23B0 data_area 0x80340A4, refcount 1, next 0x466E991C, flags 0x200 linktype 7 (IP), enctype 1 (ARPA), encsize 14, rxtype 1 if_input 0x52836BE4 (Vlan10), if_output 0x0 (None) inputtime 16:32:10.292 (elapsed 00:00:50.608) outputtime 00:00:00.000 (elapsed never), oqnumber 65535 datagramstart 0x803411A, datagramsize 60, maximum size 308 mac_start 0x803411A, addr_start 0x803411A, info_start 0x0 network_start 0x8034128, transport_start 0x0, caller_pc 0x41F78790
source: 10.10.10.2, destination: 10.100.101.10, id: 0x0000, ttl: 1, TOS: 0 prot: 6, source port 0, destination port 0
0: 0015C726 FB800000 01000600 08004500 ..G&{.........E. 16: 002E0000 00000106 36510A0A 0A020A64 ........6Q.....d 32: 650A0000 00000000 00000000 00005000 e.............P. 48: 0000265C 00000001 02030405 FD ..&\........} Red = Source MACBlue = Dest MACGreen = Ethertype (0x800 for IP traffic)Purple = Src. IPOrange = Dest IP
Using Netdr to determine traffic punted to the CPU:
A netdr capture is preformed on the MSFC CPU controller. This is the closest location you can capture a packet on the MSFC in order to determine why traffic is being punted to the MSFC/RP CPU. With a Sup720 or Sup32 it allows one to capture packets on the RP or SP inband. The netdr command can be used to capture both Tx and Rx packets in the software-switching path.
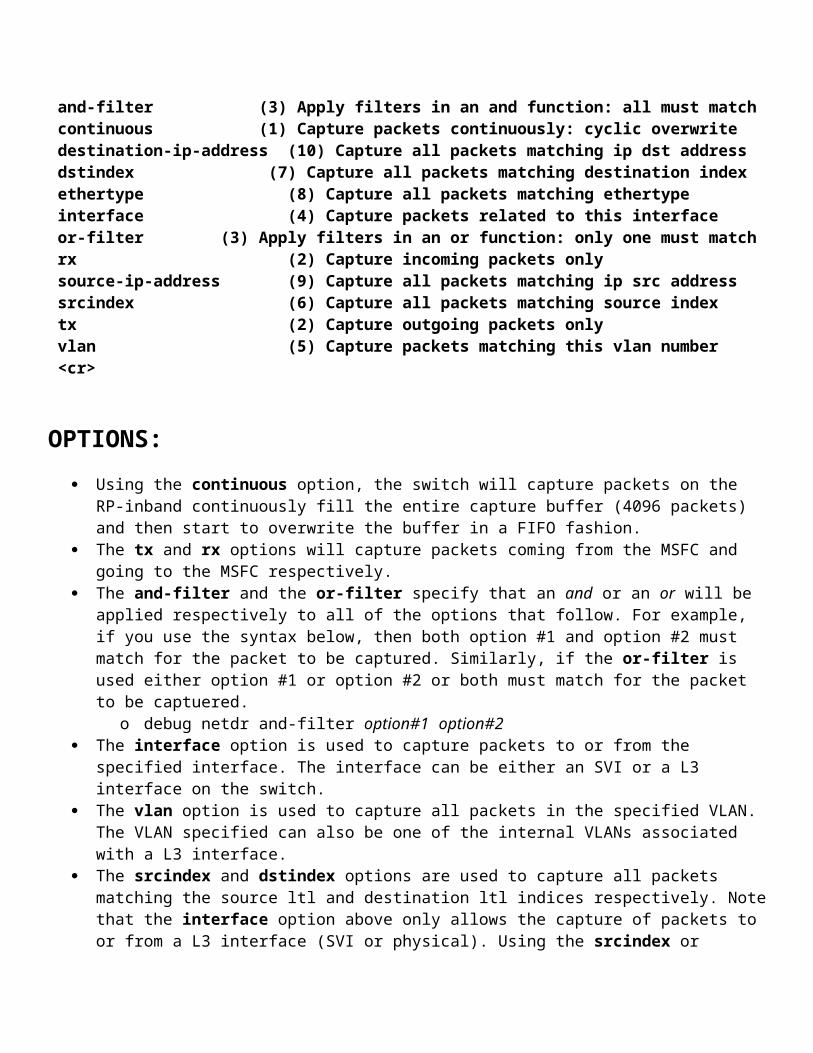
Cat6500#debug netdr capture ? acl (11) Capture packets matching an acl and-filter (3) Apply filters in an and function: all must match continuous (1) Capture packets continuously: cyclic overwrite destination-ip-address (10) Capture all packets matching ip dst address dstindex (7) Capture all packets matching destination index ethertype (8) Capture all packets matching ethertype interface (4) Capture packets related to this interface or-filter (3) Apply filters in an or function: only one must match rx (2) Capture incoming packets only source-ip-address (9) Capture all packets matching ip src address srcindex (6) Capture all packets matching source index tx (2) Capture outgoing packets only vlan (5) Capture packets matching this vlan number <cr>

OPTIONS: Using the continuous option, the switch will capture packets on the RP-inband continuously
fill the entire capture buffer (4096 packets) and then start to overwrite the buffer in a FIFO fashion.
The tx and rx options will capture packets coming from the MSFC and going to the MSFC respectively.
The and-filter and the or-filter specify that an and or an or will be applied respectively to all of the options that follow. For example, if you use the syntax below, then both option #1 and option #2 must match for the packet to be captured. Similarly, if the or-filter is used either option #1 or option #2 or both must match for the packet to be captuered.
o debug netdr and-filter option#1 option#2 The interface option is used to capture packets to or from the specified interface. The
interface can be either an SVI or a L3 interface on the switch. The vlan option is used to capture all packets in the specified VLAN. The VLAN specified can
also be one of the internal VLANs associated with a L3 interface. The srcindex and dstindex options are used to capture all packets matching the source ltl
and destination ltl indices respectively. Note that the interface option above only allows the capture of packets to or from a L3 interface (SVI or physical). Using the srcindex or dstindex options allows the capture of Tx or Rx packets on a given L2 interface. The srcindex and dstindex options work with either L2 or L3 interface indices.
The ethertype option allows the capture of all packets matching the specified ethertype. The source-ip-address and destination-ip-address options allow the capture of all packets
matching the specified source or destination IP address respectively.
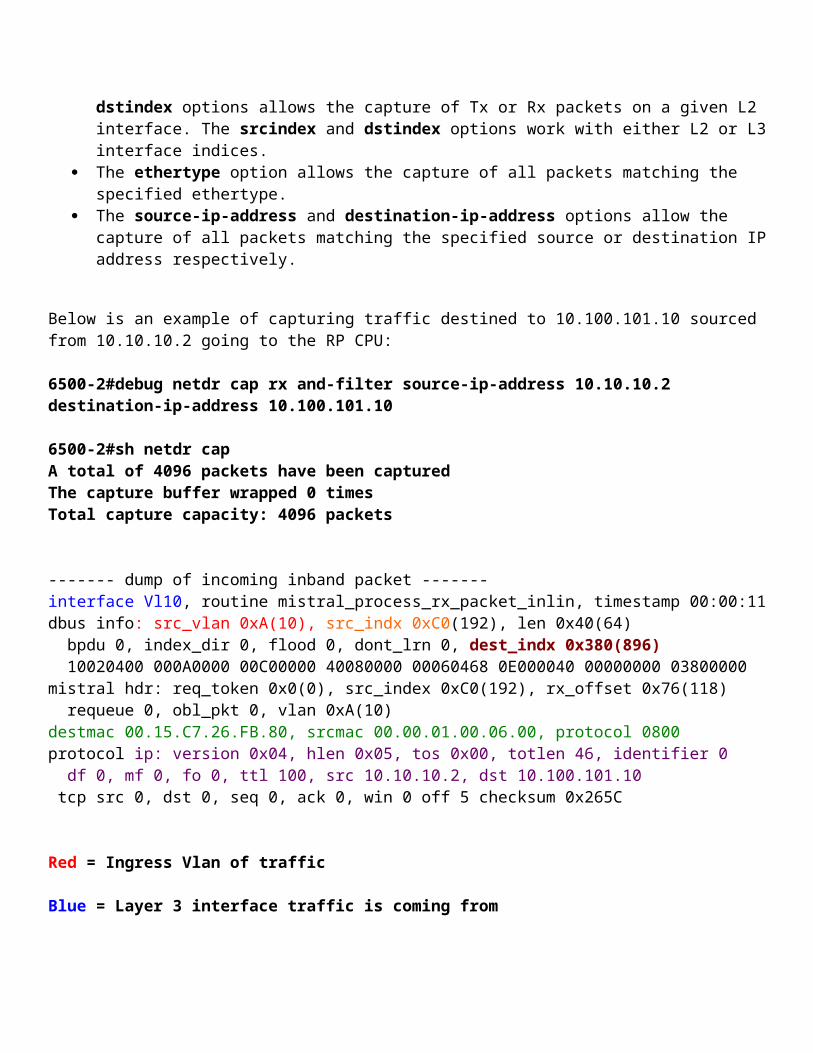
Below is an example of capturing traffic destined to 10.100.101.10 sourced from 10.10.10.2 going to the RP CPU:
6500-2#debug netdr cap rx and-filter source-ip-address 10.10.10.2 destination-ip-address 10.100.101.10
6500-2#sh netdr capA total of 4096 packets have been captured The capture buffer wrapped 0 timesTotal capture capacity: 4096 packets
------- dump of incoming inband packet -------interface Vl10, routine mistral_process_rx_packet_inlin, timestamp 00:00:11 dbus info: src_vlan 0xA(10), src_indx 0xC0(192), len 0x40(64) bpdu 0, index_dir 0, flood 0, dont_lrn 0, dest_indx 0x380(896) 10020400 000A0000 00C00000 40080000 00060468 0E000040 00000000 03800000 mistral hdr: req_token 0x0(0), src_index 0xC0(192), rx_offset 0x76(118)
requeue 0, obl_pkt 0, vlan 0xA(10) destmac 00.15.C7.26.FB.80, srcmac 00.00.01.00.06.00, protocol 0800 protocol ip: version 0x04, hlen 0x05, tos 0x00, totlen 46, identifier 0 df 0, mf 0, fo 0, ttl 100, src 10.10.10.2, dst 10.100.101.10 tcp src 0, dst 0, seq 0, ack 0, win 0 off 5 checksum 0x265C
Red = Ingress Vlan of traffic
Blue = Layer 3 interface traffic is coming from
Green = Ethertype and SRC/DST MAC addresses
Purple = IP Header
Orange = SRC index (source of ingress traffic).
Dark Red = Dest Index (where traffic is being sent).
Using the above information you should be able to track down the host or interface that
You can track down the physical port where this traffic is sourced from by tracking down the mac-address (which is the last device to own this traffic). This can be done in the following manner:
-6500-2#show mac-address address 0000.0100.0600Legend: * - primary entry age - seconds since last seen n/a - not available
vlan mac address type learn age ports------+----------------+--------+-----+----------+--------------------------Active Supervisor:* 10 0000.0100.0600 dynamic Yes 0 Gi4/1
You can look at ingress location of this traffic by taking the source index and seeing what interface it references:
switch#remote command switch test mcast ltl index c0
index 0xC0 contain ports 4/1
We can see this traffic is coming from port 4/1, which is confirmed based on the port where the MAC is learned. This can be very useful when determining the source of the traffic during bridging loop, if multiple types of traffic is being flooded, but sent from the same port.
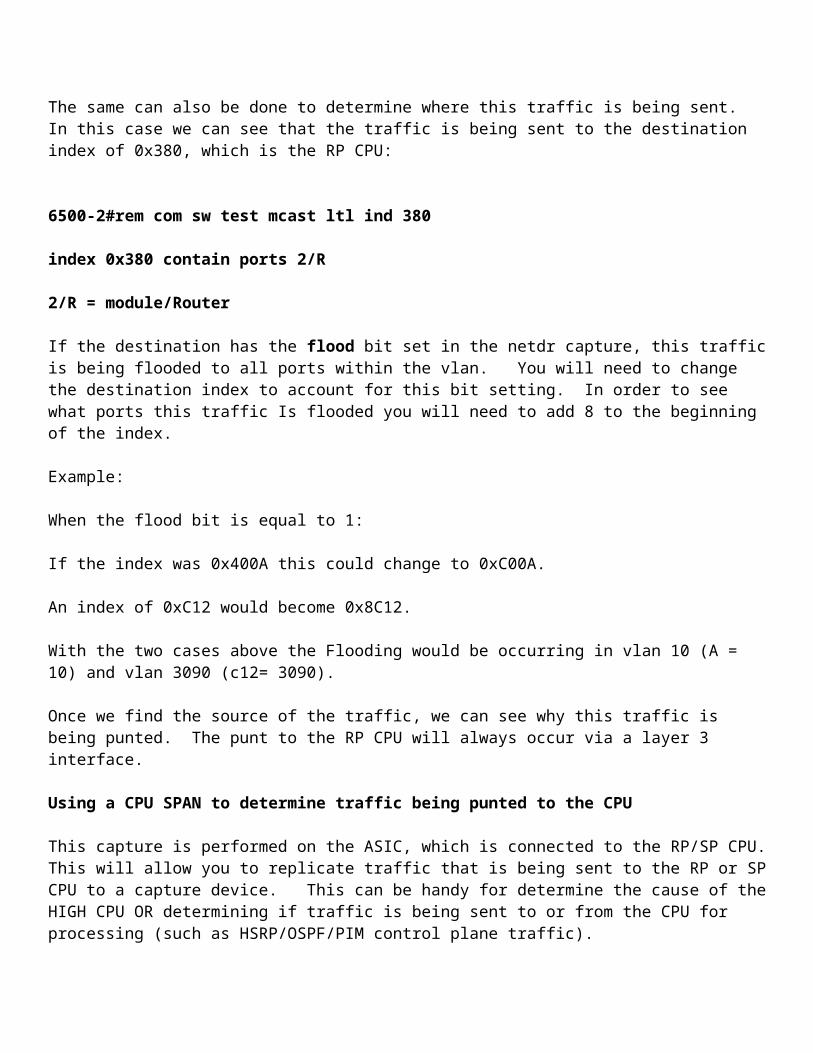
The same can also be done to determine where this traffic is being sent. In this case we can see that the traffic is being sent to the destination index of 0x380, which is the RP CPU:
6500-2#rem com sw test mcast ltl ind 380
index 0x380 contain ports 2/R
2/R = module/Router
If the destination has the flood bit set in the netdr capture, this traffic is being flooded to all ports within the vlan. You will need to change the destination index to account for this bit setting. In order to see what ports this traffic Is flooded you will need to add 8 to the beginning of the index.
Example:
When the flood bit is equal to 1:
If the index was 0x400A this could change to 0xC00A.
An index of 0xC12 would become 0x8C12.
With the two cases above the Flooding would be occurring in vlan 10 (A = 10) and vlan 3090 (c12= 3090).
Once we find the source of the traffic, we can see why this traffic is being punted. The punt to the RP CPU will always occur via a layer 3 interface.
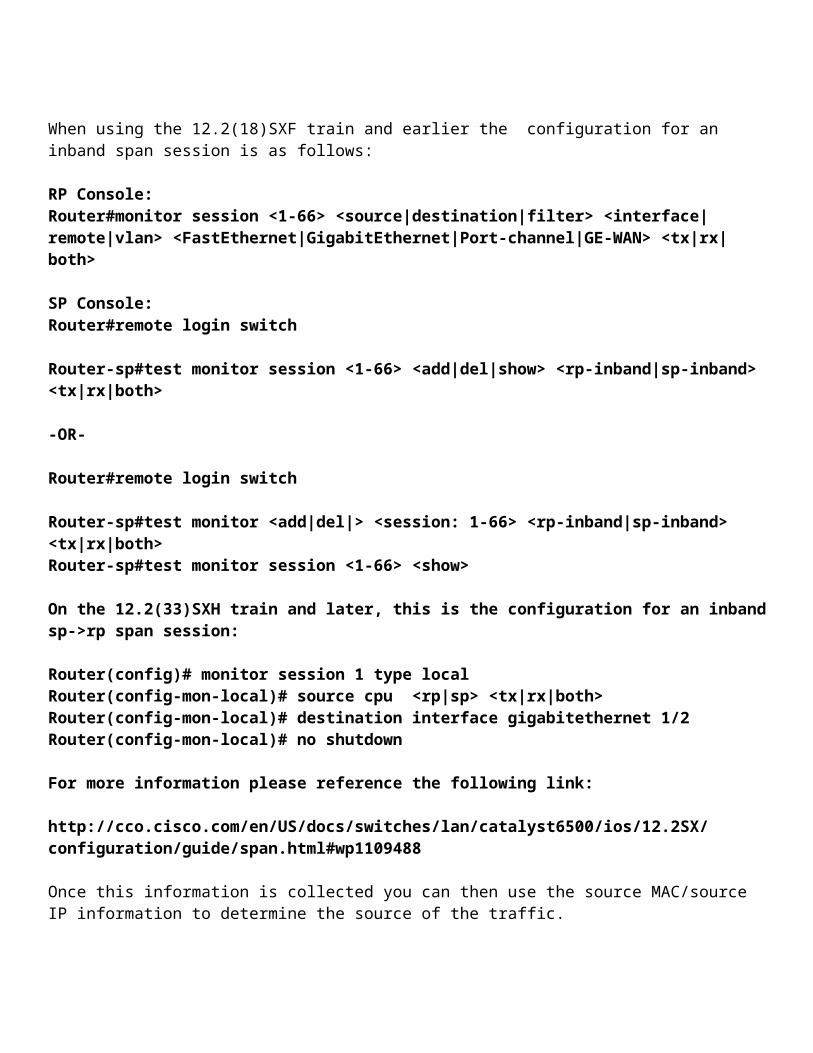
Using a CPU SPAN to determine traffic being punted to the CPU
This capture is performed on the ASIC, which is connected to the RP/SP CPU. This will allow you to replicate traffic that is being sent to the RP or SP CPU to a capture device. This can be handy for determine the cause of the HIGH CPU OR determining if traffic is being sent to or from the CPU for processing (such as HSRP/OSPF/PIM control plane traffic).
When using the 12.2(18)SXF train and earlier the configuration for an inband span session is as follows:
RP Console:Router#monitor session <1-66> <source|destination|filter> <interface|remote|vlan> <FastEthernet|GigabitEthernet|Port-channel|GE-WAN> <tx|rx|both>
SP Console:Router#remote login switch
Router-sp#test monitor session <1-66> <add|del|show> <rp-inband|sp-inband> <tx|rx|both>
-OR-
Router#remote login switch
Router-sp#test monitor <add|del|> <session: 1-66> <rp-inband|sp-inband> <tx|rx|both>Router-sp#test monitor session <1-66> <show>
On the 12.2(33)SXH train and later, this is the configuration for an inband sp->rp span session:
Router(config)# monitor session 1 type localRouter(config-mon-local)# source cpu <rp|sp> <tx|rx|both>Router(config-mon-local)# destination interface gigabitethernet 1/2 Router(config-mon-local)# no shutdown
For more information please reference the following link:
http://cco.cisco.com/en/US/docs/switches/lan/catalyst6500/ios/12.2SX/configuration/guide/span.html#wp1109488
Once this information is collected you can then use the source MAC/source IP information to determine the source of the traffic.
Troubleshooting CPU spikes.
At times it is not possible to determine the cause of a CPU spike, since a "show process CPU" cannot be run during the times of the issue. One way to get around this would be to setup an EEM script to run the command for you when the CPU goes above a certain value. The following EEM script will run a "show process cpu sorted" when the CPU utilization of the device goes above 50%:
event manager scheduler script thread class default number 1 event manager applet High_CPUevent snmp oid 1.3.6.1.4.1.9.9.109.1.1.1.1.3.1 get-type exact entry-op ge entry-val 50 poll-interval 0.5 action 0.0 syslog msg "High CPU DETECTED. Please wait - logging Information to <file system>:high_cpu.txt" action 0.1 cli command "enable" action 0.2 cli command "show clock | append <file system>:high_cpu.txt" action 1.2 cli command "term length 0" action 1.3 cli command "show process cpu sorted | append <file system>:high_cpu.txt"
Please fill in <file system> with the location of the file system without "<" or ">".
Determining the reason why traffic is punted to the CPU.

Once we determine what traffic is punted to the CPU, determining the why requires a little more digging. You can use the following commands to help determine why traffic is being punted.
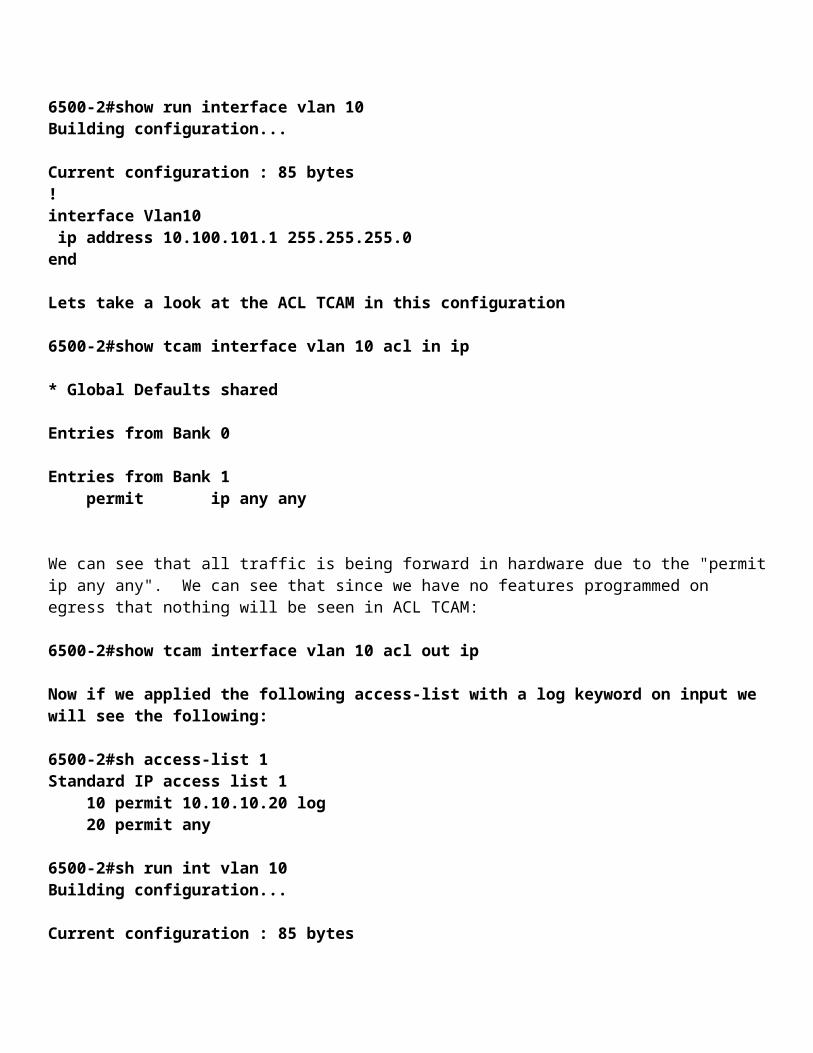
Looking at the ACL TCAM on a Layer 3 interface:
Under normal scenarios we should not see any punt adjacencies installed in ACL TCAM on the interface. This can be determined by looking at the ACL TCAM for the layer 3 interface.
Example:
6500-2#show run interface vlan 10Building configuration...
Current configuration : 85 bytes!interface Vlan10 ip address 10.100.101.1 255.255.255.0end
Lets take a look at the ACL TCAM in this configuration
6500-2#show tcam interface vlan 10 acl in ip
* Global Defaults shared
Entries from Bank 0
Entries from Bank 1 permit ip any any
We can see that all traffic is being forward in hardware due to the "permit ip any any". We can see that since we have no features programmed on egress that nothing will be seen in ACL TCAM:
6500-2#show tcam interface vlan 10 acl out ip
Now if we applied the following access-list with a log keyword on input we will see the following:
6500-2#sh access-list 1Standard IP access list 1 10 permit 10.10.10.20 log 20 permit any
6500-2#sh run int vlan 10
Building configuration...
Current configuration : 85 bytes!interface Vlan10 ip address 10.100.101.1 255.255.255.0 ip access-group 1 inend
6500-2#sh tcam interface vlan 10 acl in ip
* Global Defaults shared
Entries from Bank 0
Entries from Bank 1
punt ip host 10.10.10.20 any permit ip any any
Now we can see a punt installed for any traffic from host 10.10.10.20, due to the log keyword on input. The punt represents traffic that needs to be sent to the RP CPU. In this case, all this traffic that is sources from 10.10.10.20 will be sent to the RP CPU to be processed switched.
Keep in mind that this is only configured on ingress. If we look at the egress ACL TCAM programming, we can see that this has not been adjusted.
6500-2#show tcam interface vlan 10 acl out ip
Determining features programmed on a layer 3 interface:
Lets take the same interface and see what FM (Feature Manager) says about the features configured on this interface:
6500-2#sh access-list 1Standard IP access list 1 10 permit 10.10.10.20 log 20 permit any
6500-2#sh run int vlan 10Building configuration...
Current configuration : 85 bytes!interface Vlan10 ip address 10.100.101.1 255.255.255.0 ip access-group 1 inend
Lets take a look at FM with a ACL configured.
6500-2#sh fm fie interface vlan 10Interface Vl10: Feature interaction state created: Yes Flowmask conflict status for protocol IP : FIE_FLOWMASK_STATUS_SUCCESS Flowmask conflict status for protocol OTHER : FIE_FLOWMASK_STATUS_SUCCESSInterface Vl10 [Ingress]: Slot(s) using the protocol IP : 2 FIE Result for protocol IP : FIE_SUCCESS_NO_CONFLICT Features Configured : RACL - Protocol : IP FM Label when FIE was invoked : 52 Current FM Label : 52 Last Merge is for slot: 0 Features in Bank2 = RACL +-------------------------------------+
Action Merge Table+-------------------------------------+ RACL RSLT R_RSLT COL+-------------------------------------+ L2R L2R P 0 SB HB P 0 HB HB P 0 L3D L3D L3D 0 P P P 0+-------------------------------------+ num# of strategies tried : 1 Description of merging strategy used: Serialized Banks: FALSE Bank1 Only Features: [empty] Bank2 Only Features: [empty] Banks Swappable: TRUE Merge Algorithm: ODM num# of merged VMRs in bank 1 = 0 num# of free TCAM entries in Bank1 = 32730 num# of merged VMRs in bank 2 = 2 num# of free TCAM entries in Bank2 = 32758 Slot(s) using the protocol OTHER : 2

FIE Result for protocol OTHER : FIE_SUCCESS_NO_CONFLICT Features Configured : OTH_DEF - Protocol : OTHER FM Label when FIE was invoked : 52 Current FM Label : 52 Last Merge is for slot: 0 Features in Bank2 = OTH_DEF +-------------------------------------+
Action Merge Table+-------------------------------------+ OTH_DEF RSLT R_RSLT COL+-------------------------------------+ SB HB P 0 X P P 0+-------------------------------------+ num# of strategies tried : 1 Description of merging strategy used: Serialized Banks: FALSE Bank1 Only Features: [empty] Bank2 Only Features: [empty] Banks Swappable: TRUE Merge Algorithm: ODM num# of merged VMRs in bank 1 = 0 num# of free TCAM entries in Bank1 = 32730 num# of merged VMRs in bank 2 = 1 num# of free TCAM entries in Bank2 = 32757Interface Vl10 [Egress]: No Features ConfiguredNo IP Guardian Feature Configured No IPv6 Guardian Feature Configured No QoS Feature Configured
Above we can see that the feature “RACL” (Routed ACL) is configured as ingress feature. We can see that this has invoked FM label 52 to be applied to this interface. FM decides this label based on the features configured as well the flowmask configured.
We can also see the IP Guardian has not been triggered. IP Guardian determines what flowmask is needed on an interface for the features configured. This is used when netflow assistance is needed for a feature. It will also protect from having incompatible features programmed into hardware.
Some features require specific flowmasks in order to be put into hardware. This can be seen at the following link:
http://www.cisco.com/en/US/docs/switches/lan/catalyst6500/ios/12.2SXF/native/configuration/guide/netflow.html#wp1132875
If no flowmask is configured, the 6500 will dynamically choose the appropriate flowmask via IP
guardian.
On Egress we can see that no features have been configured.
Feature Conflict:
If we had a feature conflict, such as if we had PBR and NAT configured on the same interface it would look like the following:
ip nat pool test 10.10.101.2 10.10.101.20 prefix-length 24ip nat inside source list 7 pool testaccess-list 7 permit 10.10.10.0 0.0.0.255
route-map PBR permit 10 match ip address 1 set ip next-hop 10.10.101.1!access-list 1 permit 10.10.10.0 0.0.0.255!interface Vlan10 ip address 10.100.101.1 255.255.255.0 ip nat inside ip policy route-map PBRend!interface Vlan20 ip address 10.10.101.2 255.255.255.0 ip nat outsideend
Looking at FM to see what these incompatible features would look like:
6500-2#show fm fie interface vlan 10Interface Vl10: Feature interaction state created: Yes Flowmask conflict status for protocol IP : FIE_FLOWMASK_STATUS_SUCCESS Flowmask conflict status for protocol OTHER : FIE_FLOWMASK_STATUS_SUCCESSInterface Vl10 [Ingress]: Slot(s) using the protocol IP : 2 FIE Result for protocol IP : FIE_SUCCESS_NO_CONFLICT Features Configured : PBR - Protocol : IP FM Label when FIE was invoked : 52

Current FM Label : 52 Last Merge is for slot: 0 Features in Bank1 = PBR +-------------------------------------+
Action Merge Table+-------------------------------------+ PBR RSLT R_RSLT COL+-------------------------------------+ SB HB P 0 AdR AdR P 0 X P P 0+-------------------------------------+ num# of strategies tried : 1 Description of merging strategy used: Serialized Banks: TRUE Merge Algorithm: ODM num# of merged VMRs in bank 1 = 12 num# of free TCAM entries in Bank1 = Unknown num# of merged VMRs in bank 2 = 0 num# of free TCAM entries in Bank2 = Unknown Slot(s) using the protocol OTHER : 2 FIE Result for protocol OTHER : FIE_SUCCESS_NO_CONFLICT Features Configured : OTH_DEF - Protocol : OTHER FM Label when FIE was invoked : 52 Current FM Label : 52 Last Merge is for slot: 0 Features in Bank2 = OTH_DEF +-------------------------------------+
Action Merge Table+-------------------------------------+ OTH_DEF RSLT R_RSLT COL+-------------------------------------+ SB HB P 0 X P P 0+-------------------------------------+ num# of strategies tried : 1 Description of merging strategy used: Serialized Banks: FALSE Bank1 Only Features: [empty] Bank2 Only Features: [empty] Banks Swappable: TRUE Merge Algorithm: ODM num# of merged VMRs in bank 1 = 0 num# of free TCAM entries in Bank1 = 32730 num# of merged VMRs in bank 2 = 1 num# of free TCAM entries in Bank2 = 32760

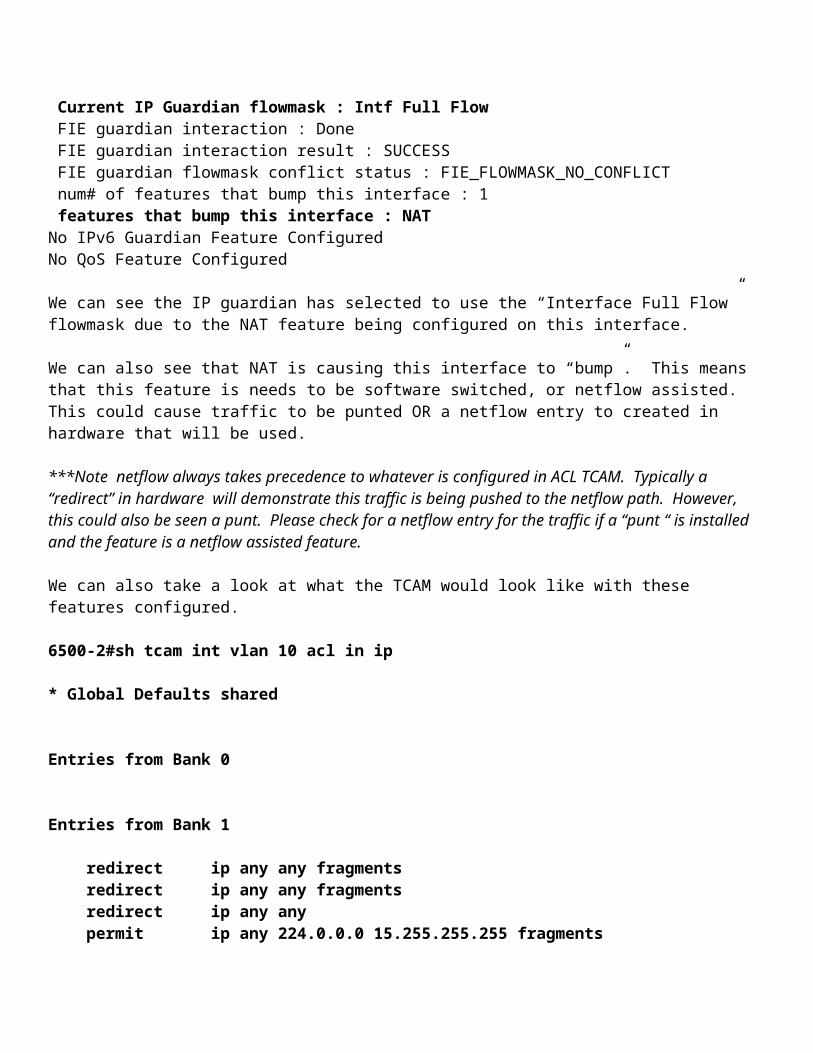
Interface Vl10 [Egress]: No Features ConfiguredIP Guardian Feature Configured Current IP Guardian flowmask : Intf Full Flow FIE guardian interaction : Done FIE guardian interaction result : SUCCESS FIE guardian flowmask conflict status : FIE_FLOWMASK_NO_CONFLICT num# of features that bump this interface : 1 features that bump this interface : NAT No IPv6 Guardian Feature Configured No QoS Feature Configured
We can see the IP guardian has selected to use the “Interface Full Flow” flowmask due to the NAT feature being configured on this interface.
We can also see that NAT is causing this interface to “bump”. This means that this feature is needs to be software switched, or netflow assisted. This could cause traffic to be punted OR a netflow entry to created in hardware that will be used.
***Note netflow always takes precedence to whatever is configured in ACL TCAM. Typically a “redirect” in hardware will demonstrate this traffic is being pushed to the netflow path. However, this could also be seen a punt. Please check for a netflow entry for the traffic if a “punt “ is installed and the feature is a netflow assisted feature.
We can also take a look at what the TCAM would look like with these features configured.
6500-2#sh tcam int vlan 10 acl in ip
* Global Defaults shared
Entries from Bank 0
Entries from Bank 1
redirect ip any any fragments redirect ip any any fragments redirect ip any any permit ip any 224.0.0.0 15.255.255.255 fragments permit ip any 224.0.0.0 15.255.255.255 fragments permit ip any 224.0.0.0 15.255.255.255 policy-route ip 10.10.10.0 0.0.0.255 any fragments policy-route ip 10.10.10.0 0.0.0.255 any fragments policy-route ip 10.10.10.0 0.0.0.255 any permit ip any any fragments

permit ip any any fragments permit ip any any
We can see that a redirect is installed for NAT traffic. We also see the “policy-route” statement installed, which is trying to redirect the same traffic that is attempting to have NAT applied.
The redirect installed for NAT will cause this traffic to be redirected to the CPU for a netflow entry to be installed. However, If we look at netflow we will see the netflow entry installed you will see that no traffic is hitting the entry that was created in hardware:
6500-2#sh mls netflow ipDisplaying Netflow entries in Active Supervisor EARL in module 2DstIP SrcIP Prot:SrcPort:DstPort Src i/f :AdjPtr-----------------------------------------------------------------------------Pkts Bytes Age LastSeen Attributes---------------------------------------------------0.0.0.0 0.0.0.0 0 :0 :0 -- :0x0 30 1380 72 13:31:25 L3 - Dynamic10.10.102.10 10.10.10.2 tcp :0 :0 Vl10 :0x0 0 0 82 13:31:25 L3 - Dynamic
We can see in red above that not packets/bytes have hit this entry. This is because this traffic is being software forwarded. This is due to the fact that PBR is configured for the same subnet (10.10.10.x). We can also see that the CPU is high:
6500-2#sh processes cpu CPU utilization for five seconds: 57%/57%; one minute: 13%; five minutes: 7%
**Note all this will cause the CPU to be drive by interrupts not a process.
As soon as we remove PBR we can see that this entry is now being hit:
6500-2(config)#int vlan 106500-2(config-if)#no ip policy route-map PBR6500-2(config-if)#do sh mls netflow ipDisplaying Netflow entries in Active Supervisor EARL in module 2DstIP SrcIP Prot:SrcPort:DstPort Src i/f :AdjPtr-----------------------------------------------------------------------------Pkts Bytes Age LastSeen Attributes---------------------------------------------------

10.10.102.10 10.10.10.2 tcp :0 :0 Vl10 :0x80002 77239 3552994 6 13:36:03 L3 - SwInstalled0.0.0.0 0.0.0.0 0 :0 :0 -- :0x0 126 5796 351 13:35:57 L3 – Dynamic
We can also see that the netflow entry has moved from SwInstalled compared to Dynamic. Our ultimate goal is to have the CPU util drop, which it does:
6500-2#sh proc cpu | ex 0.00CPU utilization for five seconds: 0%/0%; one minute: 45%; five minutes: 20%
Though FM still shows that NAT is bumping this interface we can now see that the hardware installed netflow entry is being hit. We can also see that PBR is not longer listed as an installed feature and is now listed as “empty”. Note that the same FM label in this case is also used.
6500-2#sh fm fie int vlan 10Interface Vl10: Feature interaction state created: Yes Flowmask conflict status for protocol IP : FIE_FLOWMASK_STATUS_SUCCESS Flowmask conflict status for protocol OTHER : FIE_FLOWMASK_STATUS_SUCCESSInterface Vl10 [Ingress]: Slot(s) using the protocol IP : 2 FIE Result for protocol IP : FIE_SUCCESS_NO_CONFLICT Features Configured : [empty] - Protocol : IP FM Label when FIE was invoked : 52 Current FM Label : 52 Last Merge is for slot: 0 num# of strategies tried : 1 num# of merged VMRs in bank 1 = 0 num# of free TCAM entries in Bank1 = Unknown num# of merged VMRs in bank 2 = 6 num# of free TCAM entries in Bank2 = Unknown Slot(s) using the protocol OTHER : 2 FIE Result for protocol OTHER : FIE_SUCCESS_NO_CONFLICT Features Configured : OTH_DEF - Protocol : OTHER FM Label when FIE was invoked : 52 Current FM Label : 52 Last Merge is for slot: 0 Features in Bank2 = OTH_DEF +-------------------------------------+
Action Merge Table+-------------------------------------+ OTH_DEF RSLT R_RSLT COL+-------------------------------------+ SB HB P 0 X P P 0

+-------------------------------------+ num# of strategies tried : 1 Description of merging strategy used: Serialized Banks: FALSE Bank1 Only Features: [empty] Bank2 Only Features: [empty] Banks Swappable: TRUE Merge Algorithm: ODM num# of merged VMRs in bank 1 = 0 num# of free TCAM entries in Bank1 = 32730 num# of merged VMRs in bank 2 = 1 num# of free TCAM entries in Bank2 = 32746Interface Vl10 [Egress]: No Features ConfiguredIP Guardian Feature Configured Current IP Guardian flowmask : Intf Full Flow FIE guardian interaction : Done FIE guardian interaction result : SUCCESS FIE guardian flowmask conflict status : FIE_FLOWMASK_NO_CONFLICT num# of features that bump this interface : 1 features that bump this interface : NAT No IPv6 Guardian Feature Configured No QoS Feature Configured
Using “show ip traffic” statistics to see why traffic is punted:
6500-2#show interface | i is up|drop Input queue: 0/75/0/0 (size/max/drops/flushes); Total output drops: 0Vlan10 is up, line protocol is up Input queue: 74/75/18063/18063 (size/max/drops/flushes); Total output drops: 0 we can see a large amount of traffic in the vlan 10 queue. Vlan20 is up, line protocol is up
SVI 10 is receiving a large amount of traffic that is being punted to the RP CPU. When we look at what is in this queue with the command "show buffers input-interface vlan 10 header".
Below is the output from this command for SVI 10
6500-2#sh buffers input-interface vlan 10 header
Buffer information for Small buffer at 0x4667A08C data_area 0x802F664, refcount 1, next 0x466AE968, flags 0x200 linktype 7 (IP), enctype 1 (ARPA), encsize 14, rxtype 1 if_input 0x530D5048 (Vlan10), if_output 0x0 (None) inputtime 00:00:00.000 (elapsed never)

outputtime 00:00:00.000 (elapsed never), oqnumber 65535 datagramstart 0x802F6DA, datagramsize 60, maximum size 308 mac_start 0x802F6DA, addr_start 0x802F6DA, info_start 0x0 network_start 0x802F6E8, transport_start 0x802F6FC, caller_pc 0x41F78790
source: 10.10.10.2, destination: 10.100.101.10, id: 0x0000, ttl: 1, TOS: 0 prot: 6, source port 0, destination port 0
Buffer information for Small buffer at 0x4667C7E8 data_area 0x80314A4, refcount 1, next 0x46695FD0, flags 0x200 linktype 7 (IP), enctype 1 (ARPA), encsize 14, rxtype 1 if_input 0x530D5048 (Vlan10), if_output 0x0 (None) inputtime 00:00:00.000 (elapsed never) outputtime 00:00:00.000 (elapsed never), oqnumber 65535 datagramstart 0x803151A, datagramsize 60, maximum size 308 mac_start 0x803151A, addr_start 0x803151A, info_start 0x0 network_start 0x8031528, transport_start 0x803153C, caller_pc 0x41F78790
source: 10.10.10.1, destination: 10.10.10.2, id: 0xD096, ttl: 255, prot: 1
Since at this point we are unsure why this traffic is being punted, we can look at “show ip traffic" statistics to see why this traffic is being punted to the CPU. First start by clearing the IP traffic statistics. We can then see what is incrementing in these counters to see what would be the cause:
6500-2#clear ip traffic Clear "show ip traffic" counters [confirm]6500-2#sh ip traffic IP statistics: Rcvd: 33516 total, 0 local destination 0 format errors, 0 checksum errors, 33516 bad hop count <------We can see that the bad Hop count in this case is incrementing 0 unknown protocol, 0 not a gateway 0 security failures, 0 bad options, 0 with options Opts: 0 end, 0 nop, 0 basic security, 0 loose source route 0 timestamp, 0 extended security, 0 record route 0 stream ID, 0 strict source route, 0 alert, 0 cipso, 0 ump 0 other Frags: 0 reassembled, 0 timeouts, 0 couldn't reassemble 0 fragmented, 0 couldn't fragment Bcast: 0 received, 0 sent Mcast: 0 received, 0 sent Sent: 0 generated, 0 forwarded Drop: 40005 encapsulation failed, 0 unresolved, 0 no adjacency 0 no route, 0 unicast RPF, 0 forced drop
0 options denied, 0 source IP address zero
ICMP statistics: Rcvd: 0 format errors, 0 checksum errors, 0 redirects, 0 unreachable 0 echo, 0 echo reply, 0 mask requests, 0 mask replies, 0 quench 0 parameter, 0 timestamp, 0 info request, 0 other 0 irdp solicitations, 0 irdp advertisements 0 time exceeded, 0 timestamp replies, 0 info replies Sent: 0 redirects, 0 unreachable, 0 echo, 0 echo reply 0 mask requests, 0 mask replies, 0 quench, 0 timestamp 0 info reply, 58464 time exceeded, 0 parameter problem <---- We can also the 6500 is sending ICMP TTL expired messages as well. 0 irdp solicitations, 0 irdp advertisements
<snip>
Looking at the traffic statistics we can see that the bad hop count counter is incrementing and the switch is sending ICMP time exceeded messages. On the 6500 all traffic with a TTL of 1 is punted to the CPU so that an ICMP TTL expired message can be sent to the host who sent this traffic.
The first packet in the buffer can be seen to have TTL of 1, which is why this traffic is punted. We can see that the 2nd packet is sourced from 10.10.10.1 (SVI 10) sent to 10.10.10.2. This packet is an ICMP TTL expired message.
Looking at the InBand Channel between the SP and the RP.
The IBC on the sup720 is used for traffic that needs to go to the MSFC for processing an is a 1 gigabit port. This will show interrupt-based traffic hitting the CPU. This should be a relatively low value as there should be very little traffic being sent to on the IBC.
If we see a large amount of traffic being received on the IBC (towards the MSFC from the SP) this could be an indication that traffic is being punted.
F340.05.04-6500-2# sh ibcInterface information:
Interface IBC0/0(idb 0x5153A9B8)Hardware is Mistral IBC (revision 5)0 minute rx rate 0 bits/sec, 1 packets/sec0 minute tx rate 1000 bits/sec, 1 packets/sec233965095 packets input, 14038036500 bytes0 broadcasts received27419 packets output, 2176622 bytes14 broadcasts sent

0 Inband input packet drops0 Bridge Packet loopback drops6893268 Packets out of 6893268 CEF Switched, 0 Packets out of 0 Tag CEF Switched 0 Packets Fast Switched0 Packets SLB Switched, 0 Packets CWAN SwitchedPotential/Actual paks copied to process level 227045667/50587903 (176457764 dropped,
0 spd drops)1259 paks copied at vlan soutput0 paks copied at ibc fast soutput0 paks copied at ibc fastsend 22773678 inband interrupts39 transmit ring cleanups25805398 ibl inputs
39 total tx interrupts set 39 tx ints due to packets outstanding 0 tx ints due low free buffers in pool 0 tx ints due to application settingtx dma done batch size=32buffers free minimum before tx int=4mistral ran out of tx descriptors 0 timesmistral tx interrupt inconsisteny occured 0 timesLabel switched pkts dropped: 0Xconnect pkts processed: 0, dropped: 0IBC resets = 2; last at 01:37:42.747 UTC Tue Mar 1 2011
<snip>
You can also look at this command to look for any drops of traffic that is forwarded towards the CPU. These counters are highlighted above in blue.