Embed Size (px)
Citation preview
Author's Accepted Manuscript
A multiple objective optimization based QFD approach for efficient resilient strategies to mitigate supply chain vulnerabilities: The case of garment industry of Bangladesh
Md. Maruf Hossan Chowdhury, Mohammed A. Quaddus
www.elsevier.com/locate/omega
PII:DOI:Reference:
S0305-0483(15)00133-4 http://dx.doi.org/10.1016/j.omega.2015.05.016 OME1557
To appear in: Omega
Received date: 1 January 2014Accepted date: 22 May 2015
Cite this article as: Md. Maruf Hossan Chowdhury, Mohammed A. Quaddus, A multiple objective optimization based QFD approach for efficient resilient strategies to mitigate supply chain vulnerabilities: The case of garment industry of Bangladesh, Omega, http://dx.doi.org/10.1016/j.omega.2015.05.016
This is a PDF file of an unedited manuscript that has been accepted for publication. As a service to our customers we are providing this early version of the manuscript. The manuscript will undergo copyediting, typesetting, and review of the resulting galley proof before it is published in its final citable form. Please note that during the production process errors may be discovered which could affect the content, and all legal disclaimers that apply to the journal pertain.

A multiple objective optimization based QFD approach for efficient
resilient strategies to mitigate supply chain vulnerabilities: The case of
garment industry of Bangladesh *
Md. Maruf Hossan Chowdhury
School of Marketing, Curtin University, Perth, WA, Australia. [email protected]
Mohammed A. Quaddus1
School of Marketing, Curtin University, Perth, WA, Australia, [email protected]
* It is an equally authored paper. Author’s names are listed in alphabetical order.
1 Corresponding author
1

A multiple objective optimization based QFD approach for efficient resilient strategies to mitigate supply chain vulnerabilities: The case of garment industry of Bangladesh
Abstract
With the upsurge of frequent disruptive events, organizations have become more
vulnerable to the consequences of these disruptive events. As a result, the need for more
resilient supply chain (SC) to mitigate the vulnerabilities has become paramount. Supply
chain resilience (SCR) has been discussed in the literature and resilience index has been
developed, but developing and selecting a portfolio of supply chain resilience capabilities
in order to mitigate the vulnerabilities have not been studied. In this research we develop
a 0-1 multi-objective optimization model based on QFD methodology. Our multi-objective
method is interactive and interacts with the decision makers to choose the most satisfactory efficient
portfolio of supply chain resilience strategies. We apply our methodology to three large ready-made
garment (RMG) companies of Bangladesh. Results show that lack of materials (high dependence on
imported materials), disruptions in utility supply, increased competition (and hence competitive
pressure), impact of economic recession, and reputation loss are the top most vulnerabilities of
Bangladesh RMG industry. The most preferred resilience strategies to mitigate the vulnerabilities
are: back-up capacity, building relation with buyers and suppliers, quality control, skill and
efficiency development, ICT adoption, demand forecasting, responsiveness to customers, and
security system improvement. Theoretical and managerial implications of our study are included.
Keywords: Supply chain, resilience-efficiency, vulnerability, multi-objective model, AHP, QFD.
1. Introduction
Ready Made Garment (RMG) industry contributes hugely to Bangladesh’s economy. It
creates more than four million direct employment and several millions of indirect
employment and accounts for 78.6 percent of countries export earnings (BGMEA 2012).
RMG sector also immensely contributes in reducing the high rate of women
2

unemployment in the country as eighty percent of the garments workers are
women (BGMEA 2012). Thanks to the RMG sector, Bangladesh is also the
second largest apparel exporter in the world.
Despite its huge potentials the industry is struggling with numerous Supply Chain (SC)
disruptions (Islam and Deegan 2008; Haider 2007). The consequences of the disruptions are
huge, for example, RMG industry of Bangladesh loses $26.15 million per day due to problems
in SC functions caused by political instability (Asia News Network 2013). Moreover, the
preferential access in U.S market is cancelled because of the poor safety standard in
production plants as building collapse in garment factory caused the death of more than eleven
hundred workers (Fibre2fashion News Desk 2013). These disruptions have chain effect to all
the members in SC network including the international buyers (retail chains) and suppliers. In
the wake of such a critical state in RMG supply chain, developing resilience capabilities is
vital, which is the primary objective of this study.
Resilience has been defined by a number of authors in a related manner. Vugrin et al
(2011) define system resilience and resilience in general. The authors highlight that
resilience is the ability of a systems to respond to a “disruption” due to an event or set of
events. Along the same vein Christopher and Peck (2004), Ponomarov and Holcomb
(2009) and Juttner and Maklan (2011) define supply chain resilience as the “capability of
the supply chain to responds to disruptions and recover from them”. On the other hand
Pettit et al (2010, 2013) developed a supply chain resilience framework by identifying
seven categories of vulnerabilities and creating supply chain capabilities along fourteen
areas (sourcing, order fulfilment, capacity development; among others). The authors
surmise that current level of vulnerabilities and capabilities must be assessed in order to
ascertain the current level of resilience. Literature emphasizes that developing resilience
capability is vital for organizations. It enables organizations to improve system
3
performance (Vurgin et al. 2011, Pettit et al. 2010), achieve sustainable competitive
advantage (Ponomarov and Holcomb (2009), gain market share in competitive
environments (Sheffi and Rice (2005), and decreases vulnerabilities (Pettit et al. 2010,
2013, Juttner and Maklan (2011). However current literature lacks in proposing the ways
and means to achieve supply chain resilience capabilities. In this research we stress that
resilience capabilities of RMG supply chain of Bangladesh must be developed to mitigate
organizations vulnerabilities. In pursuing this research objective we introduce
the concept of “supply chain resilience efficiency (SCREF)” which has
significant pedagogical importance.
It has been established that supply chain resilience capabilities has multiple dimensions
(objectives). For example Pettit et al. (2010, 2013) in their framework highlight fourteen
areas of supply chain resilience capabilities to be developed from order fulfilment,
capacity development to financial strengths. From multiple objectives decision making
(MODM) perspectives the supply chain resilience capabilities must be “efficient” to
mitigate vulnerabilities. While literature on efficiency approach in MODM and its
applications in production/operations management area are plentiful (for example see,
Larbani and Aouni 2011; among many others), the notion of “supply chain resilience
efficiency (SCREF)” from multiple objectives perspective is novel.
In this research we define SCREF as follows:
(i) resilience capability must be resource efficient (eg. minimum cost of implementation), and
(ii) portfolio of chosen resilience capabilities must be efficient (or non-dominated) from
multiple objectives perspective (Larbani and Aouni 2011).
4
We shall elaborate on (i) and (ii) later. It is observed that a number of logistics and SC
related capabilities are discussed in the literature (for example; Pettit et al. 2010; Fiksel
2003; Ponomarov and Holcomb 2009; Sheffi and Rice 2005; Christopher and Peck
2004; among many others) to develop SC resilience but most of those are conceptual
studies and fall short of introducing the notion of resilience efficiency. Furthermore, in
a state of uncertainty, dynamic changes and resource limitation, selection of optimal
and efficient portfolio of resilience capabilities has not yet been addressed adequately
in the existing SC literature.
While a number of approaches could be undertaken to achieve the research
objective, this study has adopted Quality Function Deployment (QFD) (Park and Kim
1998; Wang and Hong 2007) as a methodology to develop the resilience capabilities of the
RMG supply chain of Bangladesh and find the optimal efficient portfolio of the resilience
capabilities using a non-linear 0-1 programming approach. Literature on QFD approach is
plentiful, which will be reviewed briefly in a later section. It is suffice to say that QFD
enables organizations to be proactive to vulnerabilities mitigation rather than reactive and it
is a proven technique for designing supply chain mitigation capabilities in such situations
(Faisal 2013). However we shall use Analytical Hierarchy Process (AHP) (Saaty 1980)
within QFD for the analysis of data. It is important to note that methodologically our
contribution lies as follows: we define supply chain resilience efficiency (SCREF) and find
portfolio of efficient resilience capabilities for implementation using multiple objectives
based non-linear 0-1 mathematical program.
It is noted that overall domain of our present study is Enterprise Risk management
(ERM). Enterprise risk management (ERM) has been defined in many different ways.
However, one common theme of ERM is that it takes a “holistic and strategic” approach
5
to manage all risks that an organization faces (Dickinson 2001, Olson and Wu 2010a).
A recent literature review (Choi et al. 2015) has found that Desheng Wu and David
Olson are two of the most dominant contributors on ERM and various aspects of
enterprise risk. One of their highly cited works is the application of ERM to assess
credit worthiness in bank (Wu and Olson 2010b). Wu and Olson (2009), Wu et al
(2011, 2014) have edited special issues of various journals on various aspects of ERM,
ranging from risk methods and tools in operations, enterprise risk management in
operations and business intelligence in risk management. Various other applications of
ERM are available elsewhere (Choi et al. 2015) and hence will not be repeated here.
Our present research focusses on resilience capabilities of RMG supply chain of
Bangladesh to mitigate supply chain vulnerabilities. Literature suggests that vulnerability
is an “exposure to serious disturbance arising from risks within supply chain” (Peck 2006).
Hence our present study is highly relevant to the supply chain aspect of enterprise risk
management. There are applications of enterprise risk management (ERM) in supply chain.
For example, Wu and Olson (2010a) developed a DEA based value at risk (VaR) model to
manage supply risks, specifically vendor selection problem. Olson and Wu (2010b)
presented a review of ERM in supply chain. Jian et al (2009) developed a LOGIT model of
job satisfaction to reduce supply chain risks. However, it has been mentioned before that
we developed a new approach to find an optimal portfolio of efficient resilience
capabilities to mitigate supply chain vulnerabilities.
In the next several sections we present the state of affairs of RMG industry of
Bangladesh, relevant literature, methodology (QFD based mixed qualitative-
quantitative approach), application in RMG industry, followed by the results. The
paper concludes with the discussions & implications and conclusions.
6
1. Background
Bangladesh is one of the leading exporters of Ready Made Garments (RMG) in the world.
RMG industry is an economic propeller of Bangladesh and apparel exports stood-up at
19.90 billion US dollar in 2011 and marked Bangladesh as the second largest apparel
exporter in the world (BGMEA 2012). Because of enormous economic importance of RMG
in the economy of Bangladesh, smooth and efficient functioning of supply chain activities
is crucial. But, the RMG supply chain is facing a climax situation owing to numerous
challenges, such as, labour unrest for violation of human rights, poor wages, poor and
hazardous working environment, political instability, interruption in utility supply
especially power shortage, inefficiency in customs and port management, exchange rate
fluctuation, disruption in timely supply of fabrics and other accessories, increased
competition, inefficiency in operations, intensive competitive pressure, strict compliance
code regarding social and environmental issues; among many others (Islam and Deegan
2008; Chowdhury, Sarker, and Afroze 2012; Haider 2007). Furthermore, increased lead
time and cost due to disruptions in procurement and shipment of goods, lack of linkages
and co-ordination among related industries in the value chain, dependence on imported
inputs, limited variety of finished products (Haider 2007), fall of order because of global
economic downturn are also issues of high concern for the RMG supply chain of
Bangladesh. As a result of these disruptions the growth of RMG export from Bangladesh
has fallen from 23% in 2005-06 to 15% in 2008-09 (Chowdhury, Sarker, and Afroze 2012).
In such a situation it is crucial to find ways and means to make RMG supply chain resilient
and sustainable. Previous researchers focused mainly on RMG competitiveness, the existing
problems and challenges of the industry. Table 1 summarizes these briefly. However, the
issue of making RMG supply chain resilient and efficient has not been investigated yet.
This study aims to fill this gap in the literature.
7
(Insert Table 1 about here)
3. Literature Review
3.1 Supply chain vulnerabilities
Maintaining an effective Supply Chain (SC) has become challenging and difficult as the
supply chains are inherently complex and in recent times are overwhelmed with disruptive
events. These disruptive events make a supply chain vulnerable, as supply chain
vulnerability is the susceptibility of the supply chains to the consequences of disruptive
events (Blos et al. 2009; Juttner 2011). Wagner and Neshat (2012) posit that supply chain
vulnerability is determined by the vulnerability drivers arising from demand side, supply
side and supply chain design issues. Similarly, supply chain vulnerability may also arise
from a number of factors such as, delay during transportation, port stoppages, frequent
occurrence of natural disasters, weak communication, supply shortages, demand volatility,
quality problem, operational issues and terrorism; among many others (Colicchia, Dallaria,
and Melacini 2010; Kleindorfer and Saad 2005; Blackhurst, Scheibe, and Johnson 2008).
Schmitt et al. (2015) study the impact of supply disruptions on both centralized and the
decentralized multi-location system. Sawik (2015) presents a bi-objective (minimum cost
and maximum service level) model to study the impact of supplier disruptions Mizgier et al.
(2012) show the far-reaching effect of disruptions in a SC network and the impact on the
performance of overall system. The studies by Hendricks and Singhal (2003) show that
announcement of SC disruptions, such as, operational issue or delay in shipment cause
decrease in shareholder value significantly. Kleindorfer and Saad (2005) identify three main
sources of SC vulnerability: firstly, operational factors which include equipment
malfunctions and systemic failures, abrupt discontinuity of supply, labour strikes, among
others; secondly,
8
natural hazards which include earthquakes, hurricanes, storms; and thirdly, terrorism
or political instability, among others. Blos et al. (2009) suggest four major sources of
SC vulnerabilities such as, financial vulnerability, strategic vulnerability, hazard
vulnerability, and operations vulnerability. Similarly, a number of researchers (such
as Pettit et al. 2013; Christopher and Peck 2004; Sheffi and Rice 2005; Blackhurst et
al. 2008; Kleindorfer and Saad 2005 ; among others) discussed SC vulnerability
factors which are summarized in Table 2 in terms of various vulnerability factors.
However, these studies did not deal with strategies and capabilities to mitigate SC
vulnerabilities. Furthermore, most of the studies are conceptual rather than empirical
in nature. The research reported in this paper prioritizes the existing vulnerabilities
and finds the efficient mitigation strategies and capabilities in the context of RMG
supply chain of Bangladesh by using AHP integrated QFD approach. It thus
addresses a specific gap in the existing literature.
(Insert Table 2 about here)
3.2 Supply chain resilience capability
Resilience is a multidisciplinary concept. Holling (1973) was one of the pioneers to
conceptualize resilience “as the ability of system to absorb changes”. Since then many
authors echoed the concept of resilience as system’s ability to recover and get back to the
original state (Mitroff and Alpasan 2003; Ponomarov and Holcomb 2009; Christopher and
Peck 2004). Heckmann et al. (2015) however mention that supply chain resilience must
have the ability to ‘overcome supply chain vulnerability and to reduce supply chain risk’.
In line with extant literature (Ponomarov and Holcomb 2009, Heckmann et al. 2015), in
this paper, we define supply chain resilience (SCR) as the capability of a
supply chain to reduce the impact of vulnerabilities (due to disruptions) through
developing required level of readiness, quick response and recovery ability.
9
Vulnerabilities in the SC are sometimes beyond the direct control of SC managers.
However, SC managers need to be proactive to predict the vulnerability factors in
advance and develop resilience capacity for mitigating the vulnerabilities (Juttner
and Maklan 2011). Otherwise, the consequence will be the discontinuity of SC
operations which will adversely affect both revenue and cost of the whole chain
(Ponomarov and Holcomb 2009).
Researchers in supply chain management (SCM) emphasized on capabilities,
such as, adaptability, pro-activeness, diversity, flexibility, efficiency, reserve capacity,
integration, market development, cohesion, control, connectedness to measure
resilience (Pettit et al. 2010; Ponomarov and Holcomb 2009; Tomlin 2006). Table 3
summarizes these capabilities. It is noted that two fundamental organizational resilience
capabilities are buffering and bridging (Bode et al. 2011, Fennell et al. 1987). All others
are related to these two fundamental strategies. Buffering is external to a current
relationship with a supply chain partner and acts as “shock absorbers” to mitigate the
detrimental consequences (Bode et al. 2011). For example the capability factors of
‘flexibility’, ‘reserve/backup capacity’ of table 3 fall in this category. On the other hand
bridging is internal to a current relationship and refers to strengthening the current
relationship via formal structure (Bode et al. 2011). The capability factors of
‘integration’, ‘efficiency’ of table 3 fall in this category. The resilience capability
needed by a system depends on context, extent and type of vulnerabilities (Carpenter et
al. 2001). Therefore, in order to deal with resilience it is important to identify the
vulnerability factors of the specific SC and the corresponding mitigation capabilities.
(Insert Table 3 about here)
Along with developing resilience it is also important to measure resilience to
ensure a better resilience outcome. In the literature, resilience is measured in a number of
10
ways: (i) based on the extent of systems departure from desired state (Holling 1973;
Ludwig, Walker, and Holling 1996), (ii) based on recovery time after disaster or
disruptions (Simchi-levi et al. 2014; Sheffi and Rice 2005), (iii) based on reduction of
impact and consequences (Rose 2004; Lockwood and Pimm 1994), (iv) based on time
to respond (Sheffi and Rice 2005) and (v) based on cost of recovery (Martin 2004;
Vugrin et al. 2011).
Once the resilience capabilities are designed and measured, it is also important
to determine the efficiency of the resilience capability for reducing the impact of
vulnerabilities (Vugrin et al. 2011). Literature lacks significantly in conceptualizing
resilience efficiency. In this paper, therefore, we offer a unique and elegant
operationalization of resilience efficiency in the methodology section.
3.3 Quality function deployment (QFD)
QFD is a systematic process used by cross-functional teams to identify and resolve the
issues involved in providing products, processes, services, and strategies that enhance
customer satisfaction (González et al. 2004). The benefits of QFD model have been
highlighted by various researchers. For example Chan and Wu (2002) in their review of
QFD theory and applications have noted wide range successful applications of QFD from
product development, customer needs analyses to decision making. Carnevalli and Miguel
(2008) in another review of QFD highlight QFD’s ability in adapting into various research
methods from modelling, theoretical-conceptual to action-research, experimental. Because
of its wide applicability QFD has been used in various fields, such as, determining
customer needs (Stratton 1989), developing priorities (Han et al. 1998), manufacturing
strategies (Crowe and Cheng 1996; Jugulum and Sefik 1998), logistics and SCM (Bottani
and Rizzi 2006; Bevilacqua, Ciarapica, and Giacchetta 2006).
11
QFD has also been applied successfully for supply chain risk identification and
mitigation (Pujawan and Geraldin 2009; Faisal 2013). In line with previous literature
we have adapted QFD methodology to identify supply chain vulnerabilities and
mitigate the vulnerabilities with optimal and efficient resilience capabilities.
In QFD modelling, ‘customer requirements’ or existing problems of the
organizations (for example vulnerabilities) are referred to as WHATs and ‘how to fulfil
the customer’s requirements’ or organizational problems are referred to as HOWs
(resilience capabilities). The basic QFD framework is shown in Figure 1 where CRi
and DRj are the HOWs and WHATS respectively. The process of using appropriate
HOWs to meet the given WHATs is represented in the relationship matrix (Rij in
Figure 1). Different researchers build different QFD models involving various elements
but the most widely used QFD model contains at least the requirements/problems
(WHATs) and their relative importance (Wi in Figure 1), technical measures or design
requirements (HOWs) and their relationships with the WHATs, and the correlation
between the HOWs (see Figure 1).
(Insert Figure 1 about here)
In our case row elements CRi (WHATs) of figure 1 represent the vulnerabilities
that RMG supply chains are facing currently. The column elements DRj (HOWs) are
the resilience strategies or capabilities to mitigate the vulnerabilities. We define the
elements of the relationship matrix Rij (see figure 1) as the “extent of mitigating the
specific vulnerabilities by specific resiliency strategies”. In line with QFD literature
(Chan and Wu 2002, Pujawan and Geraldin 2009; Faisal 2013) we measure Rij using
the sacle of 9 (strong mitigation), 3 (moderate mitigation), 1 (little mitigation) and 0
(no mitigation). The AI and RI in figure 1 are the absolute and relative importances of
the HOWs (resilience strategies) which are found as follows (Park and Kim 1998):
12
m
AI j = ∑wi Rij∀ j , j = 1,……, n (1)i =1
where,
AIj = absolute importance of jth design requirement (DR) (or, resilience strategy) wi = weight of the ith supply chain vulnerability.
Rij = relationship value; extent of mitigating ith vulnerability by jth resilience strategy
(9, 3, 1, or 0)
n = number of design requirements (resilience strategies);
m = number of supply chain vulnerabilities.
It is noted that in our case AI j is interpreted as “total resilience” of the jth resilience
strategy to mitigate the vulnerabilities.
The relative importance (resilience) of the resilience strategy j is:
RI j =
AI j
(2)∑ n
AI jj =1
The correlation between the DRjs (HOWs) (see Figure 1) plays a significant part in many
QFD applications including ours. It represents the extent of correlation (similarities) when
two HOWs are implemented. Literature suggests that there is some degree of dependencies
among the HOWs in real applications (Wasserman 1993, Park and Kim 1998). If HOWi
and HOWj are correlated then there is cost savings sij in their
implementation (Park and Kim 1998). These sij’s need to be estimated from the decision
13
makers. We argue that in most business, management and social science applications
(inclduing our present case) some HOWs will be highly correlated.
3.3.1 Integration with Analytical Hierarchy Process (AHP)
In basic QFD three fundamental data are needed: (i) relative importance of WHATs,
(ii) the relationships between the WHATs and HOWs, and (iii) the correlation between the
HOWs. In finding the relative importance of WHATs (i.e.wi’s; see Figure 1) we plan to use
AHP. AHP was originally developed by Saaty (1980) which is an well-established multi-
criteria decision making approach that employs a unique method of hierarchical structuring
of a problem and subsequent ranking of alternative solutions by a paired comparison
technique. For brevity full description of AHP process will not be presented in this paper,
which is available elsewhere in the literature (Saaty 1980). AHP is frequently used in QFD
process, for instance see, Kamvysi et al. (2014), Park and Kim (1998), Bhattacharya et al.
(2005), Chan and Wu (1998); among others. Methodologically QFD has been frequently
combined with other tools to increase its robustness and applicability. For example
Ramanathan and Yunfeng (2009) combined QFD with Data Envelopment Analysis (DEA)
and applied it to design security fasteners in a Chinese company. Lin et al (2011) combined
QFD with DEA and AHP and applied it to evaluate the economic performance of local
governments in China.
3.3.2 QFD Optimization
It is noted that in QFD an optimization method is always needed to determine the most
desirable HOWs to satsify the WHATs (Delice and Gunger 2011, Karsak 2004b) under
14
certain constarints. For example, Park and Kim (1998) optimize total absolute importance
of the HOWs by formulating a 0-1 linear and quadratic program to find the most deriable
HOWs under budget constraint. Wasserman (1993) formulates a linear program to find the
most desrirable design requirements, HOWs, under budget constraints. Zhou (1998)
proposes a mixed integer linear program that maximizes an unitily function under budget,
technological feasibiity and competition constraints to determine the HOWs.
Multiple objective optimization approaches (Koksalan et al. 2011, Deb 2014) have
also been used in determining the HOWs. For example, Karsak et al (2002) formulated a 0-
1 goal program combining analytical network process in QFD application in product
planning. Delic and Gunger (2011) proposes a mixed integer goal program where the
objectives functions (customer satisfaction, cost and technicial difficulties) are converted
into goals. Other multiple objectives optimization based QFD applications also include
various variations of goal program, for example see Karsak and Ozogul (2009), Chen and
Weng (2006), Lee et al. (2010), Buyukozkan and Berkol (2011); among others. Karsak
(2004a and 2004b) on the other hand has applied multiple objective optimization in QFD
and has determined the non-dominated (efficient) solutions of QFD design requirements
(HOWs). The author however has not gone far enough and developed any procedure of
obtaining efficient design requirements in QFD applications. In our research we contribute
in this aspect and develop a procedure to obtain efficient design requirements (efficient
resilience capabilities in our case).
4. Proposed Methodology to Determine Efficient Resilience Capabilities in QFD
15
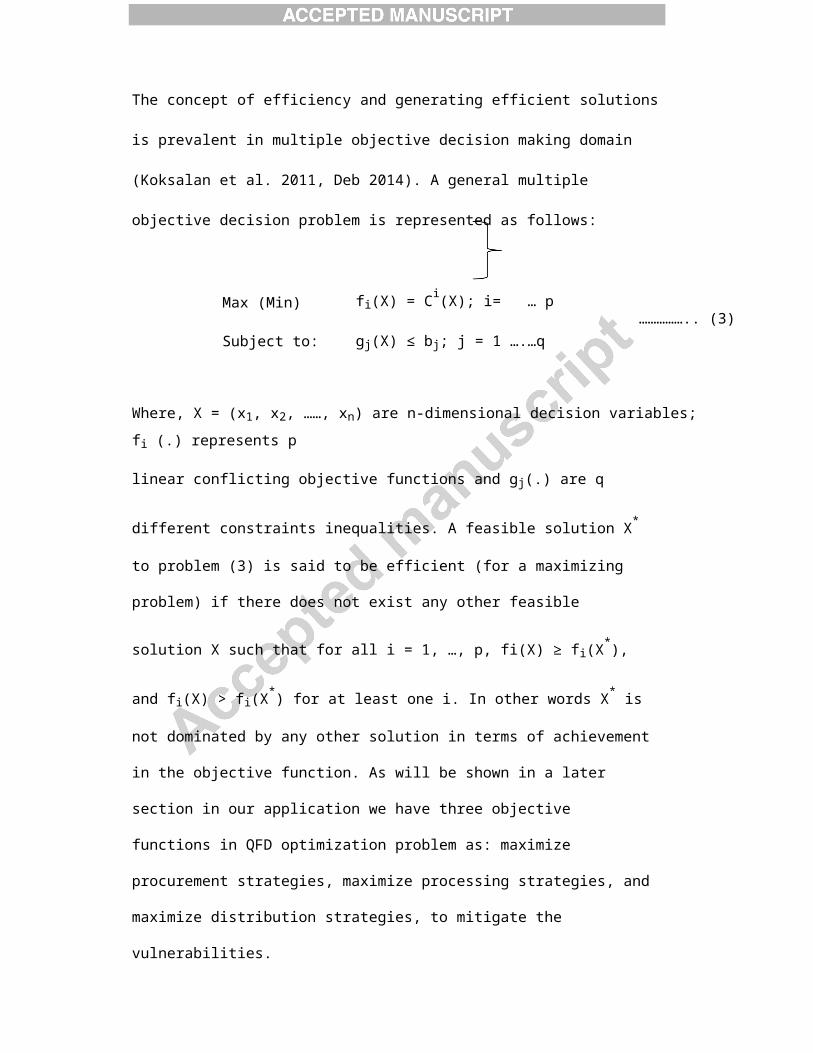
The concept of efficiency and generating efficient solutions is prevalent in multiple
objective decision making domain (Koksalan et al. 2011, Deb 2014). A general multiple
objective decision problem is represented as follows:
Max (Min) fi(X) = Ci(X); i= … p…………….. (3)
Subject to: gj(X) ≤ bj; j = 1 ….…q
Where, X = (x1, x2, ……, xn) are n-dimensional decision variables; fi (.) represents p
linear conflicting objective functions and gj(.) are q different constraints inequalities. A
feasible solution X* to problem (3) is said to be efficient (for a maximizing problem) if
there does not exist any other feasible solution X such that for all i = 1, …, p, fi(X) ≥
fi(X*), and fi(X) > fi(X
*) for at least one i. In other words X* is not dominated by any
other solution in terms of achievement in the objective function. As will be shown in a
later section in our application we have three objective functions in QFD optimization
problem as: maximize procurement strategies, maximize processing strategies, and
maximize distribution strategies, to mitigate the vulnerabilities.
As presented earlier we define “supply chain resilience efficiency (SCREF)” as
follows:
(i) resilience capability must be resource efficient (eg. minimum cost of implementation),
and
(ii) portfolio of chosen resilience capabilities must be efficient (or non-dominated) from
multiple objectives perspective (Larbani and Aouni 2011)
Vurgrin et al (2011) touched on the efficiency of system resilience. According to the
authors system resilience must use “lowest possible amount of resources” to be efficient.
In line with Vurgrin et al. (2011) we define “Resilience Efficiency” REj as ( AI j / C j ) ,
16
where C j is the cost of implementing jth resilience strategy. It is noted that parameters in
the objective functions in our QFD optimization problem are the REj. This satisfies our
condition (i) of SCREF.
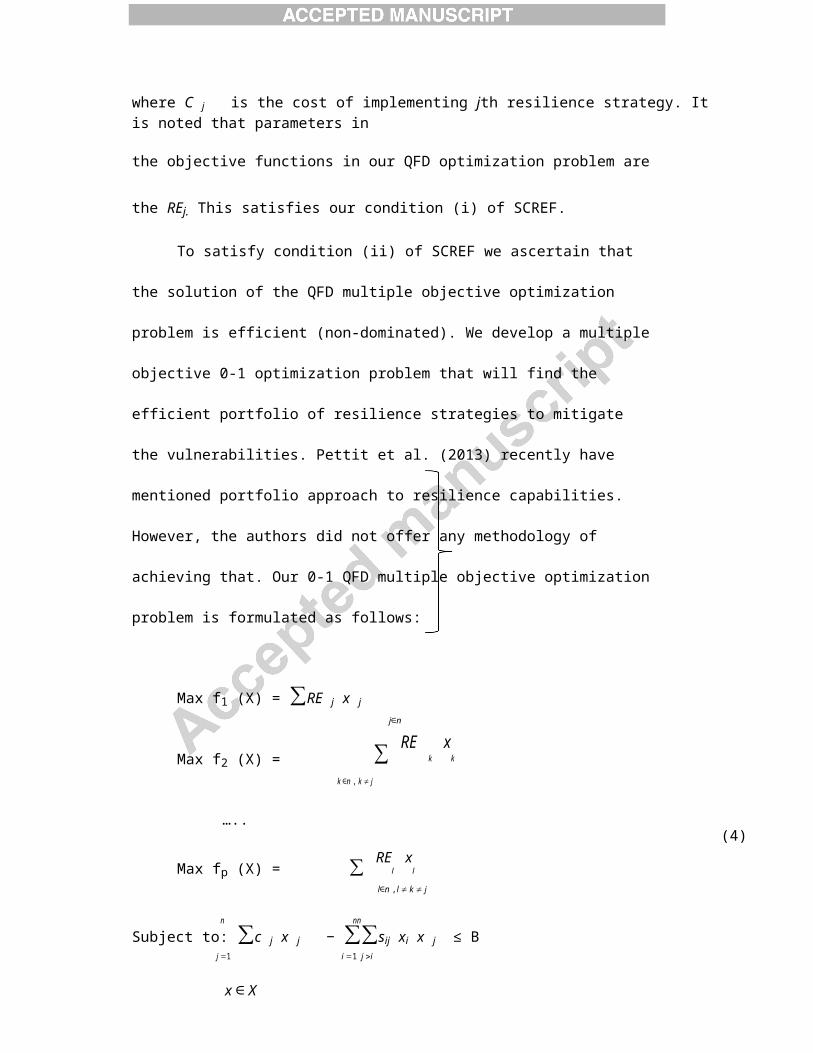
To satisfy condition (ii) of SCREF we ascertain that the solution of the QFD
multiple objective optimization problem is efficient (non-dominated). We develop a
multiple objective 0-1 optimization problem that will find the efficient portfolio of
resilience strategies to mitigate the vulnerabilities. Pettit et al. (2013) recently have
mentioned portfolio approach to resilience capabilities. However, the authors did not
offer any methodology of achieving that. Our 0-1 QFD multiple objective optimization
problem is formulated as follows:
Max f1 (X) = ∑RE j x jj∈n
Max f2 (X) = ∑ RE k xk
k ∈n , k ≠ j
…..(4)
Max fp (X) = ∑ REl xl
l∈n ,l ≠ k ≠ j
n nn
Subject to: ∑c j x j − ∑∑sij xi x j ≤ Bj =1 i =1 j >i
x ∈ X
where, n is the number of resilience startegies; RE j is the resilience efficiency (described
earlier) of resilience strategy j, xj is one or zero depending on if the corresponding
resilience strategy j is selected or not; cj is the expected cost of implementing resilience
strategy j; sij is the savings if resilience strategies i and j are implemented together; B is the
available budget.
17
It is noted that our constraints are non-linear and similar to Park and Kim (1998). But
depending on the application the constraint set could be formulated in an extensive way
including the budget, technological feasibility and competition constraints (Zhou 1998).
We argue that there are p different conflciting objectives among the REj’s which need to
be optimized simultaneously, hence satisfactory effcient solution of problem (4) need to be
found out by interacting with the decision maker. It is noted that any solution to problem
(4) will offer a portfolio of resilience strategies to mitigate the vulnerabilities. To find the
efficient portfolios of strategies we need to reformulate problem 4 as follows:
p
Max ∑λi f i ( X )(5)i =1
n n n
Subject to: ∑c j x j − ∑∑sij xi x j ≤ Bj =1 i =1 j >i
x ∈ X
where λi (i = 1, .. p) are positive numbers representing the weights (importance)
attached to the objective function f i ( X ) by the decision maker. Theorems from
multiobjective optimization domain suggest that any solution of problem (5) above is an
efficient (non-dominated) solution to problem (4) (Larbani and Aouni 2011). It is noted
that the important weights λi are only needed to find the first efficient solution to
problem (4). It is noted that Karasak (2004a, 2004b) has also determined efficient solution
for multiple objective optimization in QFD. However our multi-objective model
formulation and solution approach are different from Karasak (2004a, 2004b) in the
following ways: (i) Karasak deals with fuzzy multiple objectives, while we deal with non-
fuzzy multiple objective formulation, (ii) Karasak finds fuzzy priorities of the
18
objectives and use those priorities to find a single efficient solution, while we provide an
interactive method which finds an initial efficient solution then explores other efficient
solutions by changing the weights as par the likings of the decision makers. It is noted
that in the domain of multiple objective decision making interactive approaches are
preferred than the non-interactive approaches (Shin and Ravindran 1991, pp. 98).
We now offer an interactive procedure to find satisfactory portfolio of efficient resilience
strategies to mitigate the vulnerabilities.
Step 1: Optimize each objective function of problem (4). There will be p such
solutions. Offer them to the decision maker. These will act as maximum goal of
each individual objective. Any efficient solution will be a compromise solution
from these goals.
Step 2: Formulate problem (5) where each λi = 1, (i = 1, .. p). Solve problem (5). The
solution will be efficient (non-dominated) for problem (4). Offer it to the decision maker.
Step 3: If the decision maker is satisfied with this solution (after comparing it with
the solutions found in step 1), Stop. This will be the satisfactory portfolio of
resilience strategies to mitigate the vulnerabilities. If the decision maker is not
satisfied, go to step 4.
Step 4: Interact with the decision maker to find new values of λi ’s which represent
his/her preferences for the objective functions.
Step 5: Formulate and solve problem (5) with the new values of λi ’s. Offer it to the
decision maker. Go to Step 3.
19
5. Application in RMG Industry of Bangladesh
5.1. Methodology
There are fundamentally two research paradigms: positivist and interpretivist
(Onwuegbuzie and Leech 2005). Positivist paradigm is associated with the quantitative
research method based on specific research questions and hypotheses testing (Johnson
and Onwuegbuzie 2004; Creswell and Clark 2007). Whereas the interpretivist paradigm
relies on the qualitative method and there is subjective interpretation of the researcher
involved (Creswell and Clark 2007). However, in recent times research based on mixed
methods, a combination of qualitative and quantitative methods, has gained popularity
(Bryman 2006), because it assists in increasing the quality, accuracy, validity and
reliability of data (Creswell and Clark 2007; Babbie 2007).
It is noted that the primary objective of this study is to “develop efficient
resilience capabilities of RMG supply chain of Bangladesh to mitigate
organizations vulnerabilities”. To effectively conduct this study we have adopted mixed
methods of qualitative and quantitative approaches under positivist paradigm. This
uniquely fits with the Quality Function Deployment (QFD) as a research methodology
which has aspects of both qualitative and quantitative methods (Park and Kim 1998, Wang
and Hong 2007) and which we have embraced in our current study.
Our applications in RMG industry of Bangladesh are conducted in two studies and in
three stages as follows.
5.2. Study 1
20
Our study 1 is conducted on one of the largest apparel manufacturer in Bangladesh. Since
its establishment in 1984, the company has been attaining specific experience in designing
and manufacturing different types of apparels. It specializes in high quality apparel
production, and is one of the leading apparel exporters in Bangladesh. It has 30,000
employees in 28 apparel production units in different parts of Bangladesh as well in
Cambodia and Vietnam. It produces Bottom, Shirt, Sportswear, Polo knit & Sweater
compliant with various quality requirements. It exports its products to North America,
South America and Western Europe. The total export volume of the company is 120,000
dozen/month which accounts for an aggregate turnover of US$100 Million. Sears, C & A,
PVH, GAP, Wal-mart, JCPanny and H&M are the major buyers of its products. Paired with
the apparel production, it has developed the backward linkage facilities as it has its own
textile (waiving, cotton yarn spinning) with dying facilities of cotton & synthetic, poly,
label, button, zipper, thread and carton factories. The apparel export of the company is
increasing every year however, it is still bogged with multiple disruptive events like labour
unrest, political instability, interruption in utility supply especially power shortage; among
others. These disruptive events expose the company to various types of vulnerabilities.
Although the conglomerate has 30 years of experience in combatting various
vulnerabilities, a formal resilient approach to mitigate the vulnerabilities is needed.
Consequently, the management of this group of companies has agreed to take part in QFD
approach proposed in this paper to explicate the vulnerabilities and resilience strategies to
overcome the vulnerabilities.
21
5.2.1. Stage 1
In stage 1 the supply chain vulnerabilities (WHATs) and corresponding resilience strategies
(HOWs) to mitigate these vulnerabilities are found. To accomplish this, data have been
collected from three RMG manufacturing companies and two accessory production
companies of the parent Group. Although under the same conglomerate, these five
companies have unique features, and face and try to resolve problems independently. It also
allows us to collect data from multiple sources (five decision makers) and thus, enhances
the reliability of our data (Barratt et al. 2011). The data have been collected via semi-
structured detailed interviews from five respondents. Table 4 provides the profiles of the
five companies and the respondents. Each interview lasted between 60 to 80 minutes.
(Insert Table 4 about here)
Table 5 presents the explicated supply chain vulnerabilities and resilience strategies.
There are twenty-six vulnerabilities. Out of these, seventeen vulnerabilities have been
supported by majority of the respondents. These seventeen vulnerabilities are considered
for further analysis. Corresponding to the seventeen vulnerabilities the respondents
identified thirteen resilience strategies to mitigate the vulnerabilities. It is observed that
most of these vulnerabilities and resilience strategies are consistent with the literature (as
par Table 2 and 3). This adds further validity to our collected data (Barratt et al. 2011).
(Insert Table 5 about here)
5.2.2. Stage 2
In stage 2 we collect the quantitative data (wi, Rij) to find the AIj and RIj (see table 2 and
equations 1 and 2). We also collect the data on costs (cj) of implementing the resilience
22
strategies in order to find the resilience efficiency REj (see earlier discussion) and the
savings sij’s when two resilience strategies i and j are implemented together. As these data
are extremely demanding to collect, we select one RMG manufacturing company from the
parent group of companies (D1 in Table 4). Table 4 shows that it is a large company both
in terms of number of employees and sales volume. It also produces more than one
product type and hence susceptible to more vulnerabilities. Barratt et al. (2011) mention
that single case company allows to collect much deeper data, which is the situation in our
study. However, we collect data from multiple sources (three decision makers) of the case
company which enhances reliability of the collected data (Barratt et al. 2011).
To find the wi we use Saaty’s (1980) AHP method in a hierarchical setting. The
wi’s are averaged for three respondents and are shown in the last column of table 5. To
find Rij’s we ask the respondents to indicate (in their opinions) the “extent of mitigating
the vulnerability i by resiliency strategy j” using the widely used scale of 9, 3, 1 and 0
(Chan and Wu 2002, Pujawan and Geraldin 2009; Faisal 2013). The Rij’s are also
averaged for three respondents. Figure 2 shows the wiRij values ( in the main body of the
matrix) and the AIj’s and the RIj’s for different resilence strategies. It is observed that
Resilience strategies 13 (building relations with with buyers and suppliers) and 4 (back-up
capacity) have the highest AIs of 4.11 and 3.74 respectively. (Insert Figure 2 about here)
The cost (cj) of implementing the resilience strategies is found in a more elaborate
way. Each respondent is asked to give their most likely, optimistic and pessimistic
estimates of cj. Then the expected cost is found by the formula Ce= (4Cm+ Co+ Cp)/6,
where Ce, Cm, Co and Cp are the expected, most likely, optimistic and pessimistic cost
estimates. These costs are then averaged for three respondents. Figure 2 shows the costs
23
cj’s and the resilience efficiencies REj’s. It is noted that resilience strategy 13 (building
relations with buyers and suppliers) has the highest RE of 0.19 followed by resilience
strategy 8 (forecasting and prediction) of 0.15. The cost figures are in Millions of Taka1.
To find the savings sij the respondents were asked to indicate which resilience strategies
could be implemented simultaneously and what could be the estimated savings. The roof
of figure 2 shows these savings data. For example, resilience strategies 1 and 10 can be
implemented simultaneously and the estimated savings would be Taka 3.6 Million.
5.2.3. Stage 3
In stage 3 we develop the 0-1 multiple objective problem (as in (4)) and apply the
stepwise procedure to find the satisfactory portfolio of efficient resilience strategies. In
order to find the multiple objectives among the resilience strategies we interacted with
the three decision makers of the case company and came up with three objectives to be
maximized as follows:
f1(X) = ‘Procurement’ related strategies which includes strategies ST2, ST4, ST9
and ST13.
f2(X) = ‘Processing’ related strategies which includes ST5, ST6, ST7, ST11 and
ST12.
f3(X) = ‘Distribution’ related strategies which includes ST3, ST8, ST1, and ST10.
Problem (4) now becomes:
Max f1(X) = RE2x2 + RE4x4 + RE9x9 + RE13x13
Max f2(X) = RE5x5 + RE6x6 + RE7x7 + RE11x11 + RE12x12
Max f3(X) = RE3x3 + RE8x8 + RE1x1 + RE10x10
Subject to:
1 Taka is Bangladeshi currency. At the time of this study the exchange rate was 1 US$ = 77 Taka.
24
c1 x1 + c2 x2 + c3 x3 + c4 x4 + c5 x5 + c6 x6 + c7 x7 + c8 x8 + c9 x9 + c10 x10 + c11 x11 + c12 x12 + c13 x13 -
S1,6
x1 x
6 -
S
1,10 x
1 x
10 −
S
2,4 x
2 x
4 -
S
3,8 x
3 x
8 -
S
3,9 x
3 x
9 -
S
3,10 x
3 x
10 -
S
4,8 x
4 x
8 -,-,-
S 4,13 x
4 x
13 - S
5,6 x
5 x
6 - S
5,7 x
5 x
7 - S
6,7 x
6 x
7 - S
7,10 x
7 x
10 - S
7,11 x
7 x
11 - S
7,13 x
7 x
13 - S
8,13 x
8 x
13 - S
9,13 x
9 x
13 -
S10,11
x10
x11
- S
10,12 x
10 x
12 -
S
11,13 x
11 x
13 ≤
B
where xj = 0 or 1.
The values of REj and cj are obtained from figure 2. According to the decision makers the
budget can be set aside as 110 Million Taka. Hence the budget B is set at 110 Million Taka.
We now follow the stepwise procedure to find the satisfactory portfolio of efficient
resilience strategies. As par step 1 of the stepwise procedure, each objective is optimized
separately. We use EXCEL Solver as the optimization software. The optimal solutions and
corresponding portfolio of resilience strategies are shown in Table 6. It is observed that
optimal values of the resilience efficiencies (REs) of the procurement (f1), processing (f2)
and distribution (f3) strategies are 0.416, 0.411 and 0.316 respectively. If f1 is optimized
alone then ‘multiple sources of supply’ (St2), ‘back up capacity’ (St4) and ‘cooperation and
communication with buyers and suppliers’ (St13) should be implemented (see Table 5) for
a total cost of 85.3 Million Taka leaving 24.7 Million Taka unspent. However, since (St2,
St4) and (St4, St13) are implemented together there is potential savings of 13.6 Million
Taka (see roof of figure 2). Thus, there is still 38.3 Million Taka available for implementing
other strategies. Since ‘forward and backward linkages’ (St9; another component of f1)
costs 71.8 Million Taka to implement the management can look into other strategies to be
implemented for the remaining budget of 38.3 Million Taka. Other optimized solution for f2
and f3 can be analysed similarly.
(Insert Table 6 about here)
25
In our case the three decision makers wanted to explore more efficient solutions in
order to obtain a compromise among the three objectives. We then applied step 3 of the
stepwise procedure using equal weighting for the three objectives. This produces an
efficient solution as shown in table 7 (first row). It is noted that the objective function
values (resilience efficiencies) are 0.327 (for f1; a deviation of 21.65% from the optimal
value of f1), 0.329 (for f2; a deviation of 19.95% from the optimal value of f2) and 0.231
(for f3; a deviation of 26.89% from the optimal value of f3). The decision makers now
wanted to weight the objectives according to their preferences and explore further
compromise and efficient solutions. The steps 3 and 4 come into action now. After some
deliberations the weights of (0.2, 0.5, and 0.3) were settled with for objectives f1, f2 and f3
respectively. It shows that the decision makers prefer ‘processing’ objective (f2) more
compared to other two objectives. Applying step 5 we now obtain a second efficient
solution as shown in table 7 (second row). The objective function values of this solution are
0.327 (for f1; a deviation of 21.65% from the optimal value of f1), 0.411 (for f2; a deviation
of 0% from the optimal value of f2), and 0.149 (for f3; a deviation of 52.8% from the
optimal value of f3). It is interesting to note that this solution produces optimal value for
objective f2 (processing), as more weight (0.5) was given to this objective. However, the
deviation from the optimal solution for f3 was on the high side. The decision maker
therefore chose the earlier (equal weighting) solution with objective function values of
(0.327, 0.329, and 0.231). It is observed from table 7 that this solution selects strategies St4
(back-up capacity), St13 (building relation with buyers and suppliers), St5 (quality control),
St6 (skill and efficiency development), St12 (ICT adoption), St8 (forecasting), and St10
(responsiveness to customers) to be implemented which require a total budget of 142.7
Million Taka. However there is a savings of 41.1 Million Taka as (St4, St8), (St4, St10),
(St4, St12), (St4, St13), (St5, St6), (St8, St12),
26
and (St10, St12) are implemented together. Thus net required budget is 101.6 Million
Taka which is well within the budget constraint of 110 Million Taka.
(Insert Table 7 about here)
5.3 Study 2
The study 2 is conducted on one of the leading manufacturer of jeans in Bangladesh to
ensure the transferability of our findings and applicability of our method in another setting.
From its modest beginning in 1984 the company has come a long way. It has modern
research and development facility. Within its six production units the company now
employs over 22,000 employees, produces over 30 million jeans per year and exports to
more than 25 countries. We conducted the case study on one of the units of the company
which produces casual wears for both men and women. Two executives of the unit took
part in our study.
5.3.1 Stages 1 and 2
Tashakkori and Teddlie (2010) mention that external validity of quantitative research and
transferability of qualitative research are similar in nature, which refer to the degree to
which results of one context can be applicable to other situation. Since our study 2 is also
on apparel industry, we offered the vulnerabilities of study 1 to the two executives of study
2 and asked them to delve into them and come up with vulnerabilities specific to their
situation. In the end the executives came up with 25 vulnerabilities of which 20 are similar
to study 1 and 5 are new. Table 8 shows these vulnerabilities. The red coloured and bolded
ones are the new vulnerabilities. It is noted that for the next stage of the analysis (ie.
developing the supply chain resilience model) the highest three weighted vulnerabilities
from each group were considered. For example, for hazard vulnerability
27
group HV1, HV2, and HV3 were selected which had the highest weights among the five
hazard vulnerabilities (see figure 3).
(Insert Table 8 about here)
Next, resilience strategies to mitigate these vulnerabilities were sought. Again the
strategies of study 1 were given to the executives. They explored these and at the end came
up with 14 strategies of which 13 are similar to study 1 and one is new (see table 8). This
acceptability of the outcomes from study 1 to study 2 ensures the transferability of our
results.
In the next stage of the analysis, the quantitative data (wi, Rij) were collected from
the two executives. The data on cost cj and savings sij were also estimated. Finally the
supply chain resilience model was developed as shown in Figure 3. Unlike study 1 the
resilience strategy 9 (Demand forecasting) has the highest RE of 0.108 followed by
resilience strategy 5 (Maintaining reserve capacity). However it is noted that demand
forecasting was ranked 2 in study 1. This highlights the need for accurate demand
forecasting in the apparel industry of Bangladesh to mitigate the demand-supply related
vulnerabilities.
(Insert Figure 3 about here)
5.3.2 Stage 3
Like study 1 in stage 3 we develop and solve the 0-1 multiple objective model and find
the satisfactory portfolio of efficient resilience strategies. After interacting with the two
executives the following three objectives were formulated:
28
f1(X) = ‘Procurement’ related strategies comprising ST3, ST5, ST10 and ST14.
f2(X) = ‘Processing’ related strategies comprising ST1, ST6, ST7, ST8, ST12, ST13.
f3(X) = ‘Distribution’ related strategies comprising ST4, ST9, ST2 and ST11.
For brevity the multi-objective model is not presented here which is similar to
study 1. The stepwise procedure is now followed to find the satisfactory efficient portfolio
for study 2. First, each objective function is optimized separately. The optimal solutions
and corresponding portfolio of resilience strategies are shown in Table 9. It is observed
that optimal values of the resilience efficiencies (REs) of the procurement (f1), processing
(f2) and distribution (f3) strategies are 0.163, 0.173 and 0. 196 respectively. It is noted that
the optimal values of the objectives are quite different from that of study 1. When f1 is
optimized alone ‘maintaining reserve capacity’ (St5), and ‘cooperation and collaboration
with suppliers’ (St14) should be implemented. It is noted that these two strategies were
also selected in study 1.
(Insert Table 9 about here)
Having seen the aspiration levels of three optimized objectives the two executives
wanted to explore further efficient portfolios of resilience strategies. Thus step 3 of our
stepwise procedure came into action at this stage. We first found an efficient solution by
equal weighting of the objectives. This solution is shown in Table 10 (first row). Next the
executives wanted to weight the objectives now and a weighting scheme of (0.25, 0.45, and
0.3) was settled with for objectives f1, f2 and f3 respectively. With this, the second efficient
solution is obtained which is shown in second row of table 10. Compared to the equal
weighting solution this solution stills offers the optimal value for objective f1, with some
improvement in objective f2 at the sacrifice of objective f3. The two executives preferred
this solution compared to the equal weighting solution. It is observed from
29
Table 10 that this compromise solution selected five out of fourteen resilience strategies as
follows: St1 (security system improvement), St5 (Maintaining reserve capacity), St6
(quality control), St7 (skill development training) and St9 (demand forecasting). The study
2 also selects one of the resilience strategies ‘security system improvement’ (St1) which
was not even one of the resilience strategies of study 1. It is noted that while in study 1 the
preferred optimal efficient solution was spread out among the three objectives
(procurement, processing, and distribution), in study 2 the preferred solution concentrated
more on the processing strategies. This highlights the difference in management attitude of
the two giant garment companies in Bangladesh.
(Insert Table 10 about here)
5.4 Study 3
Study 2 was primarily conducted to ensure the transferability (Tashakkori and Teddlie
2010) of results and findings from one context to another context (ie. transferring
vulnerabilities and resilience strategies from study 1 to study 2). To ensure further
external validity (Calder et al. 1982) of our method we have conducted study 3 on another
garment manufacturer from Bangladesh. It is noted that data from this company were
independently collected without any reference to studies 1 and 2. Two executives from
the company took part in the study.
Study 3 company is a family owned business, situated in Chittagong, Bangladesh and was
established in 1983. It has four manufacturing factories with work force of more than 3000.
The products of the company are casual and dress pants, shirts and men’s shorts. The
company is certified by the buyers for complying with the social and environmental
sustainability factors. It markets its products mainly in the USA, UK and Australia. It has
30
its own washing plant, screen printing unit, embroidery unit and in-house clearing unit.
This group also has their own transportation and logistical services. The company is
growing steadily but the external uncertainties, specifically the political and economic
factors, pose threat to the smooth operation and growth of its business. A resilience
approach is therefore essential for the survival and long term growth of the company.
5.4.1 Stages 1 and 2
The vulnerabilities and corresponding resilience strategies were collected first from the two
executives of the company. Table 11 shows these vulnerabilities and resilience strategies
along with their commonality with study 1 and 2. There are three hazard, five strategic,
three financial, five operational, two infrastructural, and five demand-supply
vulnerabilities. Among the twenty three vulnerabilities of study 3, nine vulnerabilities are
common to both study 1 and 2. These are: HV1-Political unrest, HV2-Fire and other
accident, HV3-Natural disaster, SV2-Increased competition, SV4-Problem of relation with
buyers & suppliers, OV1-Disruption of utility, IV1-Inefficient port facility, IV2-Inefficient
customs process, and DSV1-Dependence of imported material. It can be thus reasonably
assumed that these are the most common vulnerabilities of Bangladesh garment industry. It
is noted that for the next stage of the analysis (ie. developing the supply chain model) the
highest three weighted vulnerabilities from each group were considered.
Table 11 also shows the fourteen resilience strategies. It is noted that six of them are
common to both study 1 and 2. These are: St1-Back up capacity, St3-Focusing on
sustainability practise, St5-Customer relationship development, St10-Multiple suppliers,
St12-Developing relationship with suppliers, and St13-Product differentiation.
31
(Insert Table 11 about here)
In the next stage of the analysis the supply chain resilience model was developed as shown
in Figure 4. It is noted that the weight (wi) of the vulnerabilities, relationship value (Rij),
cost (cj) and savings (sij) were also collected form the two executives of the company
which are shown in Figure 4. It is observed that resilience strategy 5 (customer relationship
development) has the highest RE value of 0.332 followed by resilience strategy 6
(developing new buyers and markets) and resilience strategy 8 (strict quality control at
different stage). Interestingly these rankings of strategies are quite different from study 1
and 2.
5.4.2 Stage 3
Like study 1 and 2 we then develop the 0-1 multiple objective model and find the
satisfactory efficient resilient strategies. As par the two executives of the company there
are three objectives to be optimized as follows:
f1(X) = ‘Procurement’ related strategies comprising ST1, ST10, ST11 and ST12.
f2(X) = ‘Processing’ related strategies comprising ST2, ST3, ST4, ST7, ST8, ST9.
f3(X) = ‘Distribution’ related strategies comprising ST5, ST6, ST13 and ST14.
The stepwise procedure is now followed to find the satisfactory efficient portfolio of
strategies for study 3. First, each objective is optimized separately. Table 12 shows the
aspiration level of objectives for the budgetary restriction of 80 million Taka. Step 2 and 3
now comes into play to interact with the decision makers for satisfactory efficient solution.
The executives settled with a weighting scheme of (0.2, 0.4, 0.35) for objectives
32
f1, f2 and f3 respectively. The corresponding satisfactory solution is shown in table 13 (2nd
row). It is noted that the satisfactory solution is a compromise solution among the three
objectives. Table 13 shows that the selected portfolio of strategies is: St10 (Multiple
suppliers), St11 (Supplier selection & evaluation), St12 (Developing relationship with
suppliers), St2 (Risk management team), St7 (Flexibility in production), St8 (Strict quality
control at different stage), St9 (Training & development), St5 (Customer relationship
development), and St6 (Developing new buyers & markets).
(Insert tables 12 and 13 about here).
It is noted from the above findings of study 3 that our method possesses good external
validity. In spite of the fact that data on study 3 has been collected independently following
the structured procedure of our method, the results have similarities with study 1 and 2.
This was expected as all three companies belong to the readymade garment industry in
Bangladesh and they operate in similar competitive environment. The differences in results
can be attributed to the differences in management attitudes of three different companies
and their tangible and intangible resources.
6. Discussions and Implications
This research aimed to develop resilience capabilities of Bangladesh readymade garment
(RMG) supply chain in order to mitigate various vulnerabilities that RMG supply chain
face. In doing so, we adopted mixed-method research design with qualitative and
quantitative approaches (Creswell and Clark 2007). We defined supply chain resilience
efficiency (SCREF) and develop an interactive methodology to determine efficient
resilience capabilities based on QFD approach. The proposed methodology is then
33
applied on three large RMG companies in Bangladesh. The three studies were conducted
to ensure external validity (and transferability) (Calder et al. 1982, Tashakkori and Teddlie
2010) of our proposed methodology. Our experience indicates that the proposed
methodology can be successfully applied to determine efficient portfolio of resilience
strategies to mitigate vulnerabilities.
While three companies face somewhat similar vulnerabilities and their resilience
strategies are also similar, there are some differences in quantitative results that deserve
attention. Table 11 shows the similarities and differences of vulnerabilities and resilience
strategies among the three companies. It is noted that company 3 has come up with 11 new
vulnerabilities which are different from both companies 1 and 2. In terms of importance of
these vulnerabilities study 1 has identified four top vulnerabilities as DSV2 (lack of
materials), OV2 (disruptions in utility supply), SV1 (increased competition) and FV2
(impact of economic recession) (see figure 3 and table 6). While top four important
vulnerabilities of study 2 are DSV2 (high dependence on imported materials), OV2 (impact
of power crisis), SV2 (reputation loss), SV1 (competitive pressure), and FV2 (impact of
economic recession) with equal weighting with SV1 (see figure 3 and table 8). It is noted
that ‘reputation loss’ is a significant vulnerability of study 2, while this was not even
considered as a possible vulnerability by study 1. Both companies are export oriented.
However study 2 company prides in its R & D and takes quality issue very seriously, which
might explain why this company takes ‘reputation loss’ very seriously. The top four
vulnerabilities of study 3 are FV2 (lack of order), OV1 (disruption of utility), FV1
(increased production cost), and HV1 (political unrest) (see figure 4 and table 11). It is
noted that “lack of order” and “increased production cost” are significant vulnerabilities of
study 3, while these two were not even considered as possible vulnerabilities of studies 1
and 2 (see Table 11). Being family owned, company 3 works
34
in an extreme competitive environment. Hence these two vulnerabilities are very
significant for the company.
As pointed out earlier the three companies have different management attitude while
mitigating vulnerabilities via resilience strategies. This is reflected while finding the
satisfactory efficient resilience strategies via our interactive method. In study 1 the
decision makers settled with efficient resilience strategies which assigned equal weights to
the ‘procurement’ (f1), ‘processing’ (f2) and ‘distribution’ (f3) strategies. Their preferred
portfolio of resilience strategies included seven out of possible thirteen strategies with two
from procurement objective, three from processing objective and two from distribution
objective. This is a balanced management approach practised by this company in order to
mitigate the vulnerabilities. On the other hand, in study 2 the decision makers settled with
efficient resilience strategies that assigned more weight to the ‘processing’ strategy. Their
preferred solution included five out of possible fourteen strategies with one from
‘procurement’ objective, three from ‘processing’ objective and one from ‘distribution’
objective. The management of this company is more concerned with satisfying the
‘processing’ objective in order to mitigate the vulnerabilities. It is observed that in terms of
choosing the portfolio of resilience strategies study 3 is similar to study 1, where both
companies chose a compromise solution spread out among the three objectives. Study 3
thus chose nine strategies (among 14 strategies) with three from procurement objective,
four from processing objective and two from distribution objective.
6.1 Theoretical Implications
The most important theoretical contribution of our research is that we propose an
interactive methodology to obtain satisfactory portfolio of resilience efficient strategies.
35

This extends traditional QFD based optimization method to determine the most desirable
HOWs (Delice and Gunger 2011, Karsak 2004b), which are non-interactive and do not
guarantee to find efficient solutions. Our method interacts with the decision makers in a
systematic way and generates efficient solutions (portfolios) which satisfy the decision
makers. We therefore take the ‘satisficing’ approach to decision making in our proposed
methodology (Simon 1972, Schwartz et al 2011).
It is worthwhile to compare our methodology with existing methodologies which
deal with vulnerabilities in supply chains. Wagner and Neshat (2010) proposed a
methodology to mitigate supply chain vulnerabilities. The authors first found various
vulnerability drivers and then used graph theory to quantify vulnerability index. The
directed graph shows the relationship among the vulnerability drivers, the knowledge of
which is useful to mitigate vulnerabilities. The authors mention that supply chain managers
can use “risk management methods and implement mitigation strategies” to ease
vulnerability drivers. However, the authors do not offer any guide to explicate the
mitigation strategies nor do they show any relationship between the vulnerabilities and
mitigation strategies. In contrast in our proposed method, although we do not develop any
index for vulnerability, we prioritize the vulnerabilities which are grouped as hazard,
strategic, financial, operational, infrastructure, and demand-supply vulnerabilities (Bloss et
al. 2009). We also develop specific resilience strategies to mitigate the vulnerabilities and
help the decision makers in an interactive way to find the satisfactory efficient portfolio of
resilience strategies. Goh et al. (2007) also developed a quantitative stochastic model and
methodology to deal with supply chains and vulnerabilities. However their theoretical
model development was for international facility location and distribution problem for a
company with one product. Their primary objective was to find the optimal open-shut
decision of plants and the corresponding shipment quantities from
36
various plants to various markets in order to maximize profit and minimize risks. It is
noted that although along the same vein Goh et al.’s problem definition and solution
methodology is quite different. It needs rich and elaborate data. We are not yet aware of
its application in any real world problem.
6.2 Managerial Implications
Organizations need to develop resilience capabilities in order to mitigate supply chain
vulnerabilities (Wagner and Neshat 2012). In this vein our research can help managers,
primarily in the RMG sector in Bangladesh, answer three fundamental questions: (i) what
are the supply chain vulnerabilities that RMG sector currently facing? (ii) What are the
resilience strategies to mitigate these vulnerabilities? (iii) What is the efficient resilient
portfolio of strategies to mitigate vulnerabilities subject to budget constraint? Our study has
identified a number of vulnerabilities across three studies on three large RMG companies in
Bangladesh. With respect to question (i) it has been shown earlier that there are lot of
similarities among these vulnerabilities of three companies. Other RMG companies in
Bangladesh (and for that matter elsewhere) can start with these vulnerabilities and
contextualize them for their specific situation. It has been shown in our study that the
vulnerabilities have good external validity. With respect to question (ii) it has been
observed that resilience strategies are also similar for three companies. Once again, other
RMG companies (in Bangladesh and elsewhere) can start with these strategies and
contextualize them for their own use. For both questions (i) and (ii) starting with the
findings of our study will help the managers of RMG companies to be one-step ahead
instead of developing the vulnerabilities and resilience strategies from clean slate.
For question (iii) we used our methodology to find the portfolio of efficient
resilient strategies subject to budget constraint. We found that the three companies had
37
different approaches to managing the resilient strategies. Our findings can help the RMG
managers as an eye opener to find satisfactory efficient resilient strategies in their own
situation. It is highlighted here that our interactive methodology is targeted for interaction
with the managers (decision makers) where they can see the results when they input various
weight for various objectives.
7. Conclusions
In this research we address the problem of mitigating vulnerabilities of the ready-made
garment industry of Bangladesh. Our basic methodology is QFD (Chan and Wu 2002,
Gonzalez et al. 2004), which we use to find the vulnerabilities and their resilience
strategies. We then develop an interactive multi-objective methodology to find the
satisfactory (as par the decision makers) efficient portfolio of resilience strategies to
mitigate the vulnerabilities. We argue that this approach is novel and has a number of
advantages over existing approaches (Delice and Gunger 2011, Karsack 2004b). First,
our method ensures efficient portfolio of strategies and second, it interacts with the
decision makers and thus finds the satisfactory efficient solutions in an interactive way.
We applied our method to three large garment companies in Bangladesh. Using the
stepwise procedure of QFD we found the vulnerabilities, and corresponding resilience
strategies in study 1. We observed that these vulnerabilities and resilience strategies are
transferrable to study 2, although study 2 has few specific vulnerabilities and resilience
strategies of its own. Data for study 3 has been collected independently of study 1 and 2.
Even then there are some similarities among the vulnerabilities and resilient strategies of
studies 1, 2 and 3. Combining the top prioritized vulnerabilities of the three studies we
conclude that most important vulnerabilities of the RMG industry of Bangladesh are: lack
38

of materials (high dependence on imported materials), disruptions in utility supply,
increased competition (and hence competitive pressure), impact of economic recession,
and reputation loss. Similarly, combining the preferred resilience strategies of the two
studies we conclude that the most preferred strategies to mitigate the vulnerabilities are:
back-up capacity, building relation with buyers and suppliers, quality control, skill and
efficiency development, ICT adoption, demand forecasting, responsiveness to customers,
and security system improvement.
Our research is not free from limitations. First, for practical application any QFD
based method requires rich and detailed data. Hence data collection is the major limitation.
In our case one of the researchers had good contacts with the RMG industry of Bangladesh.
It helped us to make good connections with two of the largest RMG companies in
Bangladesh. The management of these companies understood the value of our analysis and
were deeply motivated in participating in the study. Second, in our data collection process
we used qualitative methods to collect various data. Hence reliability of the data could be
an issue. However, we dealt with real decision makers and as such all the qualitative data
(vulnerabilities, resilience strategies) reflect their perception as they see fit for the
companies.
We surmise that despite the limitations we have offered a detailed methodology
and its applications in RMG industry of Bangladesh in a systematic manner. The
methodology can be effectively applied in other industrial settings and in other
applications elsewhere. However, in any future applications the decision makers of the
targeted company need to be convinced about the value of the study. We have found that
once the value of the research is disseminated well the decision makers are happy to be
involved in the study.
39
Future research can be directed along the following ways. First, instead of multi-
objective optimization multi-attribute methods can be used based on the resilience
efficiency values (RE) to find the portfolio of resilience strategies (Chrstiano et al 2001).
Second, to cater for uncertainties in input data stochastic methodology can be used instead
of fuzzy methods and thus develop the stochastic efficient resilience strategies (Lee et al
2009). Third, the concept of dynamics of vulnerability (Raharjo et al. 2011) can be
introduced in our methodology and thus develop dynamic portfolio of resilience strategies.
Lastly, a decision support system based on our methodology can be developed and make it
more comprehensive to include a variety of constraints and objective functions.
Acknowledgements: We are indebted to Prof Ben Lev, the special issue editor and
three anonymous reviewers for their extensive feedbacks which greatly improved the
paper.
40
REFERENCES
Akao, Y. 1990. Quality Function Deployment (QFD): Integrating customer requirementsinto Product Design. Cambridge, MA: Productivity Press.
Asia News Network, A. 2013. Garment sector in B'desh hit hard by instability. http://www.asianewsnet.net/Garment-sector-in-Bdesh-hit-hard-by-instability-45844.html (accessed 18/06/2013).
Babbie, E. 2007. The practice of social research. 11th ed. Belmont, CA, USA: Thomson Wadsworth.
Barratt, M., T.Y. Choi, and M. Li. 2011. Qualitative case studies in operations management: trends, research outcomes, and future research implications. Journal of Operations Management 29(4): 329-342.
Bevilacqua, M., F. E. Ciarapica, and G. Giacchetta. 2006. A fuzzy-QFD approach to supplier selection. Journal of Purchasing and Supply Management 12 (1): 14-27.
BGMEA. 2012. Bangladesh Apparel and Textiles Exposition.http://www.bgmea.com.bd/batexpo/index.htm (accessed 04/04/2013).
Bhattacharya, A., B. Sarkar, and S. K. Mukherjee. 2005. Integrating AHP with QFD for robot selection under requirement perspective. International journal of production research 43 (17): 3671-3685.
Blackhurst, J. V., K. P. Scheibe, and D. J. Johnson. 2008. Supplier risk assessment and monitoring for the automotive industry. International Journal of Physical Distribution & Logistics Management 38 (2): 143 - 165.
Blos, M. F., M. Quaddus, H. M. Wee, and K. Watanabe. 2009. Supply chain risk management (SCRM): a case study on the automotive and electronic industries in Brazil. Supply Chain Management:An International Journal 14 (4): 247 - 252.
Bode, C., Wagner, S. M., Petersen, K. J., & Ellram, L. M. (2011). Understanding responses to supply chain disruptions: Insights from information processing and resource dependence perspectives. Academy of Management Journal, 54(4), 833-856.
Bottani, E., and A. Rizzi. 2006. Strategic management of logistics service: A fuzzy QFDapproach. International Journal of Production Economics 103 (2): 585-599.
Braunscheidel, M. J., and N.C. Suresh. 2009. The organizational antecedents of a firm’s supply chain agility for risk mitigation and response. Journal of Operations Management 27(2): 119-140.
Bryman, A. 2006. Integrating Quantitative and Qualitative Research: How is it done? .Qualitative Research 6 (1): 97-113.
Büyüközkan, G., and C. Berkol. 2011. Designing a sustainable supply chain using an integrated analytic network process and goal programming approach in quality function deployment. Expert Systems with Applications 38(11):13731-13748.
Calder, B.J., Phillips, L.W and Tybout, A. M (1982). The Concept of External Validity, Journal of Consumer Research, 9(3): 240-244.
Carnevalli, J. A., and P.C. Miguel.2008. Review, analysis and classification of the literature on QFD -Types of research, difficulties and benefits. International Journal of Production Economics 114(2): 737-754.
Carpenter, S., B. Walker, J. M. Anderies, and N. Abel. 2001. From metaphor to measurement: resilience of what to what? Ecosystems 4 (8): 765 - 781.
Chan, L.K., and M.L. Wu. 2002. Quality function deployment: A literature review.European Journal of Operational Research 143 (3): 463-497.
41
Chan, L. K., and M. L. Wu. 1998. Prioritizing the technical measures in Quality Function Deployment. Quality Engineering 10 (3): 467-479 .
Chen, L. H., and M.C. Weng. 2006. An evaluation approach to engineering design in QFD processes using fuzzy goal programming models. European Journal ofOperational Research 172(1): 230-248.
Choi, Y., Ye, X., Zhao, L. and Luo, A. C. (2015), Optimizing enterprise risk management: a literature review and critical analysis of the work of Wu and Olson, Annals of Opr Res, 1-20.
Choudhury, S. R., and M. G. Hossain. 2005. Post-MFA Issues and Challenges: SocialDimension. Dhaka, Bangladesh: Ministry of Commerce.
Chowdhury, G. H., M. A. R. Sarker, and R. Afroze. 2012. recent unrest in the RMG sector of Bangladesh: is this an outcome of poor labour practices? International Journal of Business and management 7 (3): 206-218.
Chowdhury, M. H., Dewan, M. N. A., & Quaddus, M. A. (2012). Supply Chain Resilience To Mitigate Disruptions: A QFD Approach. In Pacific Asia Conference on Information Systems (PACIS), Ho Chi Minh city, Vietnam: AIS
Christopher, M., and H. Peck. 2004. Building the resilient supply chain. International Journal of Logistics Management 15 (2): 1-13.
Colicchia, C., F. Dallaria, and M. Melacini. 2010. Increasing supply chain resilience in aglobal sourcing context. Production Planning & Control 21 (7): 680-694.
Craighead, C. W., J. Blackhurst, M. J. Rungtusanatham, and R. B. Handfield. 2007. TheSeverity of Supply Chain Disruptions: Design Characteristics and MitigationCapabilities. Decision Sciences 38 (1): 131-156.
Creswell, J. W., and V. L. P. Clark. 2007. Designing and conducting mixed methods research. Thousand Oaks, CA: Sage publications.
Cristiano, J. J., White III, C. C., & Liker, J. K. (2001). Application of multiattribute decision analysis to quality function deployment for target setting.Systems, Man, and Cybernetics, Part C: Applications and Reviews, IEEE Transactions on, 31(3), 366-382.
Crowe, T. J., and C.-C. Cheng. 1996. Using quality function deployment in manufacturing strategic planning. International Journal of Operations & Production Management 16 (4): 35-48.
Deb, K. 2014. Multi-objective optimization. In Search Methodologies: IntroductoryTutorials in Optimization and Decision Support Techniques, E. K. Burke and G.Kendall (Eds.):403-449. Springer New York.
Delice, E. K., and Z. Günger. 2011. A mixed integer goal programming model for discrete values of design requirements in QFD. International journal of production research 49(10): 2941-2957.
Dickinson, G. (2001). Enterprise risk management: Its origins and conceptual foundation. Geneva Papers on Risk and Insurance- Issues and Practice, 26(3): 360-366.
Duclos, L. K., R. J. Vokurka, and R. R. Lummus. 2005. Delphi study on supply chain flexibility. International Journal of Production Research 43 (13): 2687-2708.
Faisal, M. N. 2013. Managing risk in small and medium enterprises (SMEs) supply chains' using quality function deployment approach. International journal of Operations Research and Information Systems 4 (1): 64-83.
Fennell, M. L., & Alexander, J. A. (1987). Organizational boundary spanning in institutionalized environments. Academy of Management Journal, 30(3), 456-476.
42
Ferdousi, F., and A. Ahmed. 2009. An Investigation of Manufacturing Performance Improvement through Lean Production: A Study on Bangladeshi Garment Firms. International Journal of Business and Management 4 (9): 106-116.
Fibre2fashion News Desk. 2013. US suspends GSP facility to Bangladesh. http://www.fibre2fashion.com/news/apparel-news/newsdetails.aspx?news_id=147897 (accessed 4-06-2013).
Fiksel, J. 2003. Designing resilient, sustainable systems. Environmental Science & Technology 37 (23): 5330 - 5339.
Goh, M., J.Y.S Lim, and F. Meng. 2007. A stochastic model for risk management in global supply chain networks, European Journal of Operations Research, 182: 164-173.
González, M. E., G. Quesada, F. Picado, and C. A. Eckelman. 2004. Customer satisfaction using QFD: an e-banking case. Managing Service Quality 14 (4): 317-330.
Haider, M. Z. 2007. Competitiveness of the Bangladesh Ready-made Garment Industry in Major International Markets. Asia-Pacific Trade and Investment Review 3 (1):3-27.
Han, S. B., S. K. Chen, M. Ebrahimpour, and M. S. Sodhi. 2001. A conceptual QFD planning model. The International Journal of Quality & Reliability Management 18 (8): 796 - 812.
Heckmann, I, Comes, T and Nickel, S. (2015). A critical review on supply chain risk– Definition, measure and modeling, Omega 52: 119–132.
Hendricks, K. B., and V. R. Singhal. 2003. The effect of supply chain glitches on shareholder wealth. Journal of Operations Management 21: 501–522.
Holling, C. S. 1973. Resilience and Stability of Ecological Systems. Annual Review of Ecology and Systematics 4 : 1-23.
Hossan, C. G., M. A. R. Sarker, and R. Afroze. 2012. Recent Unrest in the RMG Sector of Bangladesh: Is this an Outcome of Poor Labour Practices? International Journal of Business and Management 7 (3): p206.
Islam, M. A., M. N. Begum, and C. A. A. Rashed. 2012. Operational Disturbances and Their Impact on the Manufacturing Business-An Empirical Study in the RMG Sector of Bangladesh. International Journal of Research in Management &Technology 2 (2): 184-191.
Islam, M. A., and C. Deegan. 2008. Motivations for an organisation within a developing country to report social responsibility information: Evidence from Bangladesh. Accounting, Auditing & Accountability Journal 21 (6): 850 - 874.
Jiang, B., Baker, R. C., & Frazier, G. V. (2009). An analysis of job dissatisfaction and turnover to reduce global supply chain risk: Evidence from China. Journal of Operations Management, 27(2), 169-184.
Johnson, R. B., and A.J. Onwuegbuzie. 2004. Mixed methods research: A research paradigm whose time has come. Educational Researcher 33(7):14-26.
Jugulum, R., and M. Sefik. 1998. Building a robust manufacturing strategy. Computers & Industrial Engineering 35 (1): 225-228.
Jüttner, U., and S. Maklan. 2011. Supply chain resilience in the global financial crisis: an empirical study. Supply Chain Management: An International Journal 16(4): 246-259.
Kamvysi, K., Gotzamani, K., Andronikidis, A., and Georgiou, A. (21014), Capturing and prioritizing students’ requirements for course design by embedding Fuzzy-AHP and linear programming in QFD, European Journal of Operational Research 237: 1083–1094
43
Karim, S. 2003. Coping With Post-MFA Challenges: Strategic Response For BangladeshRMG Sector. Dhaka: CPD.
Karsak, E. E. 2004a. Fuzzy multiple objective decision making approach to prioritize design requirements in quality function deployment. International Journal of
Production Research 42(18): 3957-3974.Karsak, E. E. 2004b. Fuzzy multiple objective programming framework to prioritize
design requirements in quality function deployment. Computers & Industrial Engineering 47(2):149-163.
Karsak, E. E., and C.O. Özogul. 2009. An integrated decision making approach for ERP system selection. Expert Systems with Applications 36(1): 660-667.
Khondker , B. H., A. Razzak, and N. Ahmed. 2005. Exports, Employment and Working Conditions: Emerging Issues in the Post-MFA RMG Industry( Revised draft). International Labour Office.
Kleindorfer, P. R., and G. H. Saad. 2005. Managing Disruption Risks in Supply Chains.Production & Operations Management 14 (1): 53-68.
Köksalan, M. M., J. Wallenius, and S. Zionts. 2011. Multiple criteria decision making:from early history to the 21st century. World Scientific.
Larbani, M., and B. Aouni. 2011. A new approach for generating efficient solutions within the goal programming model. Journal of the Operational Research Society 62(1): 175-182.
Lee, D. E., Lim, T. K., & Arditi, D. (2009). Automated stochastic quality function deployment system for measuring the quality performance of design/build contractors. Automation in Construction, 18(3), 348-356.
Lee, A. H., H.Y. Kang, C. Y. Yang, and C. Y.Lin. 2010. An evaluation framework for product planning using FANP, QFD and multi-choice goalprogramming. International Journal of Production Research 48(13): 3977-3997.
Lin, C. M., Lee, Y. and Ho, T. (2011), Applying integrated DEA/AHP to evaluate theeconomic performance of local governments in China, European Journal of Operational Research 209: 129–140
Lockwood, J. L., and S. L. Pimm. 1994. Biological Diversity: Species: would any ofthem be missed? Current Biology 4 (5): 455-457.
Ludwig D, Walker B, and CS. Holling 1996. Sustainability, stability and resilience.Conserv. Ecol 1: 1-27.
Martin, S. 2004. The cost of restoration as a way of defining resilience: a viabilityapproach applied to a model of lake eutrophication. Ecology and Society 9 (2): 8.
Mitroff, I. L. and M. C. Alpaslan. 2003. Preparing for evil. Harvard Business Review 81(4): 109-115.
Mizgier, K. J., S. M. Wagner, and J. A. Holyst 2012. Modeling defaults of companies in multi-stage supply chain networks. International Journal of Production Economics 135(1): 14-23.
Narasimhan, R., and S. W. Kim. 2001. Information system utilization strategy for supply chain integration. Journal of Business Logistics 22 (2): 51-75.
Nuruzzaman, A. Haque, and A. Rafiq. 2010. Is Bangladeshi RMG Sector fit in the Global Apparel Business? Analyses the supply Chain Management. The South East Asian Journal of Management 4 (1): 53-72.
Olson, D L and Wu, D (2010a), Enterprise Risk Management Models, Springer, Heidelberg.
Olson, D L and Wu, D (2010b),A Review of enterprise risk management in supply chain, Kybernetes, Vol 39, No 5, pp. 694-706.
44
Onwuegbuzie, A. J., and N.L. Leech. 2005. On becoming a pragmatic researcher: Theimportance of combining quantitative and qualitative researchmethodologies. International Journal of Social Research Methodology 8(5): 375-387.
Park, T., and K.J. Kim. 1998. Determination of an optimal set of design requirements using house of quality. Journal of Operations Management 16 (5): 569-581.
Peck, H. (2006), Reconciling supply chain vulnerability, risk and supply chain management, International J. of Logistics Research and Applications, 9:2 127-142.
Pettit, T. J., K. L. Croxton, and J. Fiksel. 2013. Ensuring Supply Chain Resilience: Development and Implementation of an Assessment Tool. Journal of Business Logistics 34 (1): 46-76.
Pettit, T. J., J. Fiksel, and K. L. Croxton. 2010. Ensuring supply chain resilience: Development of a conceptual framework. Journal of Business Logistics 31 (1): 1-21.
Ponomarov, S. Y., and M. C. Holcomb. 2009. Understanding the concept of supply chain resilience. International Journal of Logistics Management 20 (1): 124-139.
Pujawan, I.N. and L. H. Geraldin. 2009. House of risk: a model for proactive supplychain risk management. Business Process Management Journal 15 (6): 953 - 967.
Raharjo, H., Xie, M., & Brombacher, A. C. (2011). A systematic methodology to deal with the dynamics of customer needs in Quality Function Deployment.Expert Systems with Applications, 38(4), 3653-3662.
Ramanathan, R and Yunfeng, J. (2009) Incorporating cost and environmental factors in quality function deployment using data envelopment analysis, Omega 37: 711-723.
Rose, A. 2004. Defining and measuring economic resilience to disaster. Disaster Prevention and Management 13 (4): 307-314.
Saaty, T. L. 1980. AHP: The Analytic Hierarchy Process. New York: McGraw-Hill. Sawik, T. (2015) On the fair optimization of cost and customer service level in a supply
chain under disruption risks, Omega 53: 58-66.Schmitt, A., Sun, S., Snyder, L., and Shen, Z. (2015) Centralization versus
decentralization: Risk pooling, risk diversification, and supply chain disruptions, Omega 52: 201-212.
Schwartz,B., Ben-Haim, Y., and Dacso, C. 2011. What makes a good decision? Robust satisficing as a normative standdard of rational decision making, Journal for the Theory of Social Behaviour, 41 (2): 209-227.
Sheffi, Y., and Rice. 2005. A supply chain view of the resilient enterprise. MIT Sloan Management Review 47 (1): 41-48.
Shin, W. S., & Ravindran, A. (1991). Interactive multiple objective optimization: Survey I—Continuous case. Computers & Operations Research, 18(1), 97-114.
Simchi-Levi, D., W. Schmidt, and Y. Wei. 2014. From superstorms to factory fires managing unpredictable supply-chain disruptions. Harvard Business Review 92(1-2): 96-101.
Simon, H. 1972, Theories of Bounded Rationality, In C. B. McGuire and R. Radner (eds.), Decisions and Organizations, North Holland.
Stratton, B. 1989. The refined focus of automotive quality. Quality Progress 22 (10): 47-50.
Tang, C. S. 2006. Robust strategies for mitigating supply chain disruptions. International Journal of Logistics Research and Applications 9 (1): 33-45.
45
Tashakkori, A., and C. Teddlie, C. (Eds.). 2010. Sage handbook of mixed methods in social & behavioral research. Sage.
Tewari, M. 2006. Is Price and Cost Competitiveness Enough for Apparel Firms to Gain Market Share in the World after Quotas? A Review. Global Economy Journal 6(4): 1-46.
Tomlin, B. 2006. On the Value of Mitigation and Contingency Strategies for Managing Supply Chain Disruption Risks. Management Science 52 (5): 639-657.
Vugrin, E. D., D. E. Warren, and M. A. Ehlen. 2011. A resilience assessment framework for infrastructure and economic systems: Quantitative and qualitative resilience analysis of petrochemical supply chains to a hurricane. Process Safety Progress 30 (3): 280-290.
Wagner, S. M., & Neshat, N. (2010). Assessing the vulnerability of supply chains using graph theory. International Journal of Production Economics, 126(1), 121-129.
Wagner, S. M., and N. Neshat. 2012. A comparison of supply chain vulnerability indices for different categories of firms. International Journal of Production Research 50 (11): 2877-2891.
Wang, H.F., and W.K. Hong. 2007. An integrated service strategy by QFD approach: a case of a telecom company in Taiwan. International Journal of Management and Decision Making 8 (2-4/2007): 251-267.
Wang, H., M. Xie, and T. N. Goh. 1998. A comparative study of the prioritization matrix method and the analytic hierarchy process technique in quality function deployment. Total Quality Management 9 (6): 421-430.
Wasserman, G. S. 1993. On how to prioritize design requirements during the QFD planning process. IIE Transactions 25(3): 59-65.
Wu, D. and Olson, D.L. (2009), On the special issue of risk issues in operations: methods and tools, Production Planning and Control, 20:4 293-294.
Wu, D D and Olson, D (2010a), Enterprise risk management: a DEA VaR approach in vendor selection, International Journal of Production research, Vol 48, No 16, pp. 4919-4932.
Wu, D D and Olson, D (2010b), Enterprise risk management: coping with model risk in alarge bank, Journal of the Operational Research Society, 61(2): 179-190.
Wu, D., Olson, D.L.and Birge, J. R (2011), Introduction to special issue on "Enterprise risk management in operations", Int. J. Production Economics, 134: 1-2.
Wu, D., Chen, S. H. and Olson, D.L.(2014), Business intelligence in risk management:Some recent progress, Information Sciences, 256: 1-7.
Wu, T., J. Blackhurst, and V. Chidambaram. 2006. A model for inbound supply risk analysis. Computers in Industry 57 (4): 350-365.
Xie, M., T. N. Goh, and H. Wang. 1998. A study of the sensitivity of ‘‘customer voice’’ in QFD analysis. International Journal of Industrial Engineering 5 (4): 301-307.
Zhou, M. 1998. Fuzzy logic and optimization models for implementing QFD.Computers & Industrial Engineering 35(1): 237-240.
Zsidisin, G. A., S. A. Melnyk, and G. L. Ragatz. 2005. An institutional theory perspective of business continuity planning for purchasing and supply management.International Journal of Production Research 43 (16): 3401 - 3420.
46
Table 1: Vulnerability factors and the mitigation capabilities in RMG industry of
Bangladesh.
Khondker , Razzak, and Ahmed Deals with important issues and challenges facing the RMG(2005) industry during the post-MFA regime. It also discusses the
competitiveness issue in relation to productivity, workingenvironment and stakeholders.
Choudhury and Hossain (2005) The authors have taken step to define the challenges and opportunitiesin the post-MFA period in the RMG sector and indicated thegovernment response to combat post-MFA challenges.
Karim (2003) Discusses how the Bangladeshi RMG sector coped startegically withthe post-MFA challenges.
Tewari (2006) Emphasized on timely supply, short lead times, low inventories,innovation and the ability to contribute to design and full packagesupply.
Ferdousi and Ahmed (2009) Investigated the improvement of manufacturing performance throughlean practice that helps to reduce lead time and cost and to improveproductivity.
Hossan, Sarker, and Afroze (2012) Discuss the recent unrest in the RMG industry which indicates politicalaction in this industry.
Islam, Begum, and Rashed (2012) Operational disturbances, manufacturers are facing competition withrespect to quality, cost and time to market.
Ahmed (2009) Analysed the main drivers of growth, challenges faced andperformance of RMG manufacturing in Bangladesh in the post-MFAperiod.
Nuruzzaman, Haque, and Rafiq Described how to create competitive advantage through SCM.(2010)Chowdhury, Dewan and Addressed supply chain disruptions and mitigation processesQuaddus (2012)Chowdhury, Dewan, Dealt with upstream supply chain barriers and mitigationNuruzzaman and Quaddus processes(2012)Haider (2007) Presents the challenges and the surface-level and deep-level
competitiveness of the Bangladeshi RMG industry.
47
Table 2: Supply chain Vulnerability factors.
Vulnerability Specifc Vulnerabilities Referencesfactors
Natural disaster (flood, cyclone) Christopher and Peck (2004); Sheffi (2005);Kleindorfer and Saad (2005); Wu et al. (2006);Blackhurst et al. (2008).
Hazard Political instability Kleindorfer and Saad (2005); Wu et al. (2006);vulnerability Blackhurst et al. (2008); Blos et al. (2009).
Fire and other accidental damage Blos et al. (2009).Labour unrest Sheffi (2005); Kleindorfer and Saad (2005); Wu et
al. (2006); Blackhurst et al. (2008).Increased competition Haider (2007); Blos et al. (2009).Non-compliance of social and Islam and Deegan (2008).
environmental factors
StrategicProblem of relation with buyer Blos et al. (2009).
(switching of buyer)vulnerability
Problem of integration and real-time Gaudenzi and Borghesi (2006).information
Problem of relation with supplier Blos et al. (2009).Plant location problem Field studyCurrency fluctuation Blos et al. (2009); Blackhurstet et al. (2008).Economic recession Blos et al. (2009)
Financial Raw material price fluctuation Blos et al. (2009).vulnerability High bank interest & fund shortage Blos et al. (2009).
Bankruptcy or credit default of any Blos et al. (2009); Blackhurstet et al. (2008).supply chain member
Shortage of skilled worker Haider (2007).Switching and absenteeism of Chowdhury et al. (2012).
workersFault in production planning and Chowdhury et al. (2012); Wu et al (2006).
Operationalinventory management
Failure of IT system and Blos et al. (2009).vulnerability
machineriesDisruption in utility supply Blos et al. (2009).Product quality defection (poor Blos et al. (2009).
quality)Illiteracy of workers and supervisors Chowdhury et al. (2012)Delay in custom clearance Colicchia (2010).Delay for Congestion and Colicchia (2010); Blackhurst et al. (2008).
Infrastructure inefficiency in portvulnerability Strike by port workers Colicchia (2010); Blos et al. (2009).
Delay in transportation for Poor Blackhurst et al. (2008).infrastructure
Suppliers’ delay Blackhurst et al. (2008).Dependence on imported material Haider (2007); Nuruzzan (2009), Craighead et al.
and lack of backward linkage (2007).Lack of alternative for some critical Craighead et al. (2007).
Demand & itemssupply Defection or nonconformity of Blackhurst et al. (2008).
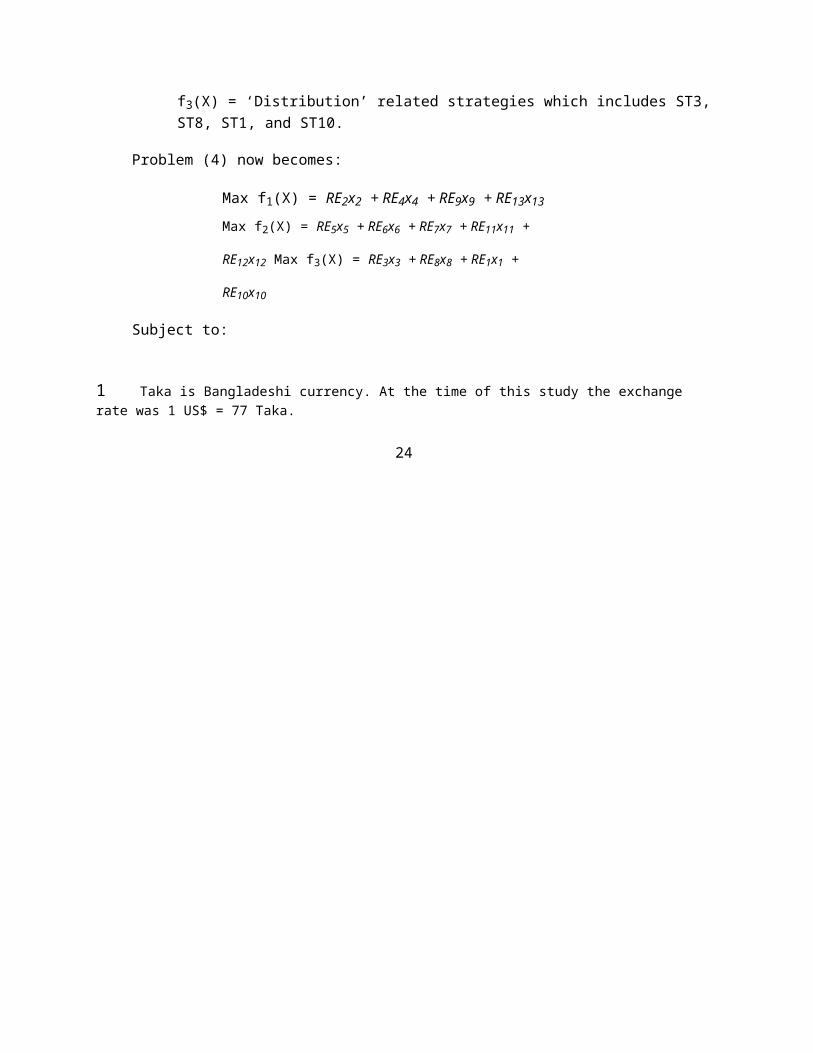
vulnerability materialOpportunism of buyers (expect Ponomarov and Hollcomb (2009).
discount)Demand fluctuation/uncertainaty Wu et al. (2006).Suppliers opportunism Ponomarov and Hollcomb (2009).
48

Table 3: Supply chain resilience capabilities.
CapabilitySpecific capabilities References
Factors
Flexibility in production (different volume of Duclos, Vokurka, and Lummus (2005);order, flexible production schedule) Braunscheidel and Suresh (2009).Ability to modify a wide varity of product as Braunscheidel and Suresh (2009).per buyer requirement (mix flexibility)Flexibility in contract with SC partners Duclos et al. (2005).(Partial order and payment, partial shipment)
Flexibility Efficient and effective logistics and supply Duclos et al. (2005).chain functions (e.g. sourcing, producing,distribution)Ability to respond to additional order or Juttner and Maklan (2011).sudden demandAbility to supply new and different products Braunscheidel and Suresh (2009).to different customer groups (mix flexibility)Alternative and reserve capacity (logistical Pettit et al. (2013).
Reserve/backup options)capacity Buffer stock Pettit et al. (2013).
Backup energy source Pettit et al. (2013).Integration Sharing information with supply chain Braunscheidel and Suresh (2009);
partners Blackhurst et al. (2005)Communication and information flow with Braunscheidel and Suresh (2009).different departments (e.g. supply chain andother departments)Joint or collaborative planning (e.g product Braunscheidel and Suresh (2009).development)Communication with supply chain partners Braunscheidel and Suresh (2009).ICT supported planning and integration Narasimhan and Kim (2001).
Efficiency Waste elimination (efficient use of resource) Pettit et al. (2013); (Fiksel 2003); Sheffi(2005).
Efficient and hardworking employeesQuality control and less defection Pettit et al. (2013); Kleindorfer and Saad
(2005).Buyer satisfaction (product quality and Pettit et al. (2013).
Customer service)satisfaction & Customer loyalty and Preference Pettit et al. (2013).market position Good relation with buyers and suppliers Zsidisin, Melnyk, and Ragatz (2005); Pettit
et al. (2013).
FinancialFund availability Pettit et al. (2013); Tang (2006).
Profitability Pettit et al. (2013).strength
Insurance Pettit et al. (2013).
49
Table 4: Profile of five companies and Participants
Participant Position Company type Product(s) Company Age of Productionsize (number company and salesof employees)
D1 Manager RMG Bottom item More than 10 years 60-80,000Merchandisi manufacturing (shorts, 5,000 dozens/yearng unit trousers)
D2 Deputy Accessory Cartoon and Less than 5 years 14-general supplying unit poly bags which 1000 15,00,000manager are used for cartoons
packing each yearproducts duringshipment.
D3 Manager RMG Main product is 2000-3000 10 years 25-30,000Merchandisi manufacturing shirt. dozens/yearng unit
D4 Supply RMG Main product is More than 25 years 40-50,000chain manufacturing shirt. 5,000 dozen/yearmanager unit
D5 Deputy Accessory Process raw Less than 15 years 40-50,00000General supplying unit cotton to yarn 1000 yard/ yearmanager and then spin
the yarn forknitting.
50
Table 5: Vulnerabilities and corresponding resilience capabilities
VulnerabilitySpecific vulnerabilities Enterprises AHP Adjusted
Weights weights
factors (WHATs)
1 2 3 4 5
Natural disaster (flood, cyclone) (HV1) y y y .169 .022
Political instability and labour unrest (HV2) y y y y y .534 .071
Hazard (.132) Fire and other accidental damage (HV3) y y y .297. .039
Sabotage y y
Piracy and theft y
Increased competition (SV1) y y y y y .445 .099
Failure to comply with social-environmental y y y y .383 .085
Strategic (.223)
factors (SV2)
Problem of relation with buyer & suppliers y y .172 .04(SV3)
Problem of integration y y
Currency & raw material price fluctuation y y y y .253 .039(FV1)
Financial (.154) Economic recession (FV2) y y y y y .602 .093
Bankruptcy of supply chain members (FV3) y y .145 .022
Higher rate of bank intest y
Worker (skill, absenteeism, illeteracy) y y y y .282 .055(OV1)
Disruption in utility supply (OV2) y y y y y .543 .106
Operational Product quality defection (poor quality) y y y .175 .034(.195) (OV3)
Machinery breakdown and failure y y
IT system failure
Production planning problem y y
Delay in port and customs (IV1) y y y y .578 .067
Infrastructural Delay in transportation for Poor y y .422 .049(.115) infrastructure and port facilities (IV2)
Strike by port workers y
Suppliers’ disruptions (DSV1) y y y .242 .043
Lack of material (Dependence on imported y y y y y .597 .108
Demand &material and lack of backward linkage)
(DSV2)
supply (.181)Buyers’ disruptions (expect discount) y y y .161 .029(DSV3)
Unpredictability of demand y
Product differentiation and customization y y y(St1)
Multiple sources of supply (St2) y y y y y
Channel rerouting, reconfiguration (St3) y y
Back up capacity (St4) y y y y
Quality control and reducing defection (St5) y y y y
Skill and efficiency development through y y y y y
Resience
traing and counselling (St6)Product and Process Improvement for y y y y
Strategies
efficiency and waste reduction (St7)
(HOWs)
Forecasting and predictive analysis (St8) y y y y
Forward and backward linkage (St9) y y y
Responsiveness to customer (St10) y y y y y
Compliance of social and environmental y y y y yissues (St11)
ICT adoption and information intergartion y y y y(St12)
Cooperation, communication and building y y y y yrelation with buyers and suppliers (St13)
Note: Factors with low responses have not been considered for importance rating
51
Table 6: Aspiration levels of the objectives for study 1
Objective Aspiration Procurement Processing strategy Distribution BudgetFunction level strategy (f1) (f2) strategy (f3)
X2
X4
X9
X13
X5
X6
X7
X11
X12
X1
X3
X8
X10
f1 .416 1 1 0 1 0 0 0 0 0 0 0 0 0
110f2 .411 0 0 0 0 1 1 1 0 1 0 0 0 0
f3 .316 0 0 0 0 0 0 0 0 0 1 1 1 1
Note: x2,x4,x9,x13= procurement strategy (f1); x5,x6,x7,x11,x12=processing strategy (f2);x1,x3,x8 and x10=distribution strategy (f3).
Table 7: Efficient Resilient Portfolios of study 1
Objective Function Procurement Processing strategies Distribution strategies Budstrategies get
f1 f2 f3 X2 X4 X9X
13 X5 X6 X7X
11X
12 X1 X3 X8X
10
Weighted(1,1,1)
.327 .329 .231 0 1 0 1 1 1 0 0 1 0 0 1 1
110Weighted(0.2, 0.5,0.3)
.327 .411 .149 0 1 0 1 1 1 1 0 1 0 0 1 0Note: 0.2 weight for f1 ; 0.5 weight for f2 ; 0.3 weight for f3 .
52
Table 8: Vulnerabilities and Strategies for Study 2
Vulenarabilities StrategiesHV1 = Sabotage St1= Security system improvementHV2 = Political instability St2= Product customizationHV3 = Factory fire St3=Alternative sources of supplyHV4 = Natural disaster (flood, cyclone) St4= Alternative transportation routingHV5 = Foreign government policy St5= Maintaining reserve capacity
change St6= Quality controlSV1= Competitive pressure St7= Skill development trainingSV2= Reputation loss St8= Improving process technologySV3= Problem of integration with St9= Demand forecasting
supply chain members St10= Backward linkage developmentSV4 = Failure to comply with socio- St11= Quick response to customers’
environmental issues requirementsFV1= Increasing raw material price St12= Improving social andFV2= Impact of Economic recession environmental performanceFV3= Cost of Finance St13= Information integrationFV4 = Exchnage rate fluctuation St14= Cooperation and collaborationOV1= Shortage of skilled worker with suppliers.OV2= Impact of Power crisisOV3= Concentrated production
locationOV4 = Machine breakdown & failureOV5 = IT system failureOV6 = Production planning problemIV1= Delay in portIV2= Poor transportation infrastructureIV3= Delay due to export import
document processingDSV1= Suppliers’ disruptionDSV2= High dependence on imported
materialsDSV3= Buyers’ disruption
53
Table 9: Aspiration levels of the objectives for study 2
Objectiv Aspiratio Procurement Processing strategy Distribution Budgee n level strategy (f1) (f2) strategy (f3) t
Function X XX
1X
1 X X X XX
1X
1 X X XX
1
3 5 0 4 1 6 7 8 2 3 2 4 9 1
f1 .163 0 1 0 1 0 0 0 0 0 0 0 0 0
130f2 .173 0 0 0 0 1 1 1 0 0 1 0 0 0 0
f3 .196 0 0 0 0 0 0 0 0 0 0 1 1 1Note: x3, x5, x10, x14 = procurement strategy (f1); x1, x6, x7, x8, x12, x13 =processing strategy (f2); x2, x4, x9, and x11 =distribution strategy (f3).
Table 10: Efficient Resilient Portfolios of study 2
Objective Function Procurement Processing strategies Distribution Budstrategies strategies get
f1 f2 f3 X3 X5 X10 X14 X1 X6 X7 X8 X12 X13 X2 X4 X9 X11
Weighted(1,1,1)
.092 .114 .158 0 1 0 0 1 0 1 0 0 0 0 1 1 0
130Weighted(0.25,0.45, 0.3)
.092 .151 .109 0 1 0 01
1 1 0 0 0 0 0 1 0Note: 0.25 weight for f1 ; 0.45 weight for f2 ; 0.3 weight for f3 .
54
Table 11: Vulnerabilities and Strategies for Study 3
VulnerabilitiesStudy 1 Study 2
StrategiesStudy 1 Study 2
HV1-Political unrest √ √ St1-Back up capacity √ √
√ √ St2-Risk managementHV2-Fire and other accident team
√ √ St3-Focusing on √ √HV3-Natural disaster sustainability practise
√ St4-Using updated √SV1-Reputation risk Technology
√ √ St5-Customer √ √relationship
SV2-Increased competition development
SV3-Selecting wrong production St6-Developing newsite buyers & markets
SV4-Problem of relation with √ √ St7-Flexibility inbuyers & suppliers production
St8-Strict quality √SV5-Lack of sustainability planning control at different& standard stage
St9-Training & √FV1-Increased production cost development
St10-Multiple √ √FV2-Lack of order suppliers
FV3-Loss due to rejection of St11-Suppliershipment selection & evaluation
√ √ St12-Developing √ √relationship with
OV1-Disruption of utility suppliers
St13-Product √ √OV2-Switching of workers differentiation
St14-Alternative √transportation (e.g. air
OV3-lead time failure shipment)
OV4-Lack of efficiency of workers √
OV5-Fault in Quality control √
IV1-Inefficient port facility √ √
IV2-Inefficient customs process √ √
DSV1-Dependence of imported √ √material
DSV2-Switching of buyers
DSV3-Lack of commitment ofsuppliers (late delivery, quality )
DSV4-Supply shortage
DSV5-Buyers' opportunism
55
Table 12: Aspiration levels of the objectives for study 3
Objective Aspiration Procurement strategy Processing strategy (f2) Distribution strategy BudgetFunction level (f1) (f3)
X1
X10
X11
X12
X2
X3
X4
X7
X8
X9
X5
X6
X13
X14
f1 .369 1 1 1 1 0 0 0 0 0 0 0 0 0 0
80f2 .749 0 0 0 0 1 0 1 1 1 1 0 0 0 0
f3 .698 0 0 0 0 0 0 0 0 0 0 1 1 1 1
Note: x1,x10,x11,x12= procurement strategy (f1); x2,x3,x4,x7,x8, x9=processing strategy (f2); x5,x6,x13 and x14=distribution strategy (f3).
Table 13: Efficient Resilient Portfolios of study 3
Objective Function Procurement strategies Processing strategies Distribution Budstrategies get
f1 f2 f3 X1X
10X
11X
12 X2 X3 X4 X7 X8 X9 X5 X6X
13X
14
Weighted .30 .696 .5970 1 1 1 1 0 0 1 1 1 1 1 0 0(1,1,1)
Weighted .30 .696 .597 80(0.25,0.40, .35) 0 1 1 1 1 0 0 1 1 1 1 1 0 0
Note: 0.25 weight for f1 ; 0.40 weight for f2 ; 0.35 weight for f3 .
56
Figure 1: QFD Framework
Note: = Custome r requirements; = Degree of importance of CRi’s; = Design Requireme nts; = Relationship Matrix (i.e. degree to which CRi is met by DRj ) A.I.= Absolute importance of DRj’s ; R.I.= Relative im portance of DRj’s.
57
#,
#,#
* #,)
&,
*,#
',)
(,!
&,#
),!
(,( !,'
(,
&
),' &,*
SCVs Weights St1 St! St# St& St( St St) St* St' St10 St11 St1! St1# A,I
HV1 0,0!! 0 0,0 0,0 0,'* 0 0 0 0,0#) 0,0!! 0 0 0,0(1 0 1,!!!
HV! 0,0)1 0 0,1( 0,&') 0 0 0,0)1 0,0)1 0 0 0,&') 0,1( 0 1,&
HV# 0,0#' 0 0,0#' 0,11) 0,#(1 0 0 0 0 0 0 0,#(1 0,11) 0 0,')(
SV1 0,0'' 0,*'1 0,1( 0 0,0'' 0,'# 0,'# 0,*'1 0,0'' 0,!#1 0,'# 0,&'( 0,!#1 0,*'1 ,0)!
SV! 0,0*( 0 0 0 0,!(( 0 0,1'* 0 0 0,0*( 0,('( 0 0 1,1##
SV# 0,0& 0,0) 0,1! 0 0,1! 0,0& 0 0,! 0 0,1! 0,!* 0,0& 0,0& 0,# 1,#*)
FV1 0,0#' 0 0,11) 0 0,1'( 0 0 0 0,#(1 0,0#' 0 0 0 0,1'( 0,*')
FV! 0,0'# 0,!)' 0,!)' 0 0 0,!! 0,(1 0,*#) 0,*#) 0,1(( 0,!)' 0,0'# 0,!! 0,*#) &,*)
FV# 0,0!# 0 0,11 0 0,0!# 0 0 0 0,0' 0,0#* 0,0!# 0 0,#* 0,(& 1,!#&
OV1 0,0(( 0 0 0 0 0 0,&'( 0,0(( 0 0 0 0,1( 0 0 0,)1(
OV! 0,10 0 0 0 0,!&) 0,10 0,10 0,10 0,10 0 0,10 0 0,10 0,!&) 1,1#
OV# 0,0#& 0,0#& 0,0* 0 0 0,#0 0,!#* 0,#0 0 0,0) 0,10! 0,0() 0,0#& 0,10! 1,#!
IV1 0,0) 0 0,( 0,1* 0,11! 0 0 0 0,1* 0,1* 0,0) 0 0,0) 0,11! 1,&(*
IV! 0,0&' 0,11& 0 0,1&) 0 0 0 0 0 0 0 0 0 0,!1
DSV1 0,0&# 0 0,#*) 0,)! 0,1!' 0,0&# 0 0 0,1 0,!1( 0,1!' 0 0,1!' 0,#*) !,!#'
DSV! 0,10* 0,#!& 0,')! 0,!(! 0,)( 0 0,10* 0,1* 0,!(! 0,)( 0 0 0,10* 0,1* #,***
DSV# 0,0!' 0,0!' 0 0,0!' 0,0*) 0,!0# 0,!1 0,!0# 0,0!' 0,0*) 0,0* 0,1&( 0,0*) 0,!1 1,&*'
A,I 1,!& #,!!( 1,#& #,)&# 1,* !,((! #,0&) !,1#1 1,'1 1,*#! !,&#* 1,)#( &,11!
Cost (1, #,& !(,! !),# !!,) 1*,* #),! 1&,# )1,* !!,& (,) 1(, !1,
RE 0,0#1&)# 0,0**('' 0,0(&1!) 0,1#)10 0,0*!!0# 0,1#()&( 0,0*1'0' 0,1&'0!1 0,0!0! 0,0*1)* 0,0&!''* 0,111!1* 0,1'0#)
Figure 2: Supply Chain Resilience model: Study 1
Note: A.I= Absolute importance; Stj = Resilience strategy j; HV, SV, FV, OV, IV, DSV
= Various vulnerabilities, RE= Resilience efficiency.
58
SCVs Weights St1 St! St# St& St( St St) St* St' St10 St11 St1! St1# St1& AIHV1 0,0! 0,!) 0 0 0,1 0 0 0 0 0 0 0 0 0 0,#)HV! 0,0# 0 0 0,1&) 0 0,() 0 0 0 0,11' 0 0 0 0,11' 0,0*& 1,0#
HV# 0,0#& 0,!#* 0 0,0#' 0 0,!)# 0 0 0 0 0 0 0,#(1 0,0( 0,10! 1,0*SV1 0,0*! 0 0,*'1 0,1( 0 0 0,'# 0,*'1 0,'# 0,!') 0,!#1 0,*'1 0,!#1 0,!#1 0,!') (,(11SV! 0,0*' 0 0 0 0 0 0,!# 0 0 0 0 0,*01 0 0,&1 1,*#&
SV# 0,0) 0 0,0) 1,! 0,0'# 0,0& 0 0,1! 0 0,1! 0,!* 0 0,0& 0,# !,#!FV1 0,0&1 0 0 0,0'1 0 0,11) 0 0 0 0,#(1 0,0#' 0 0 0 0,11) 0,)1(FV! 0,0*1 0 0,&( 0,!)' 0 0 0,0'# 0,*#) 0,(1 0,*#) 0,0'# 0,!1) 0,0'# 0,0'# 0,*#) &,&'(
FV# 0,0!# 0 0 0,!0) 0 0,0(& 0 0 0 0,0' 0,0!# 0,0(& 0 0,0(& 0,0' 0,(#OV1 0,0&* 0 0 0 0 0 0 0,&'( 0,(( 0 0 0 0,0' 0 0 1,1#(OV! 0,10& 0 0 0 0 0,'(& 0 0 0 0,1)) 0 0 0 0 0,10 1,!#)
OV# 0,0## 0 0 0 0 0,!#1 0 0 0 0 0 0 0 0 0 0,!#1IV1 0,01 0 0 0,##( 0,&' 0,1* 0 0 0 0,1* 0,1( 0 0 0 0,1* 1,(IV! 0,0&( 0 0,0* 0 0,!&( 0 0 0 0 0 0 0 0 0 0,#!(IV# 0,0# 0 0 0 0 0,1* 0 0 0 0,0* 0,10* 0 0 0 0 0,#*
DSV1 0,0& 0 0 0,#*) 0 0,!1( 0 0 0 0,!1( 0,!&( 0,1!' 0 0,0)! 0,1!' 1,#'!DSV! 0,10 0 0 0,')! 0 0,(& 0 0,!(! 0 0,#!& 0,')! 0 0 0 0,(& #,DSV# 0,0!( 0 0,0)( 0 0,1)( 0,0(* 0,1)( 0,0(* 0,1!( 0,0*) 0,0* 0,!!( 0,1!( 0,0(* 0 1,!!'
AI 1,00) 0,(0* 1,&'* !,)0! 1,*&& #,*0) 1,!& !,(## !,1#' !,)# !,0(( 1,)' 1,'1 0,)#! #,!#1Cost 11,( *!,! &(,) #),& &1, &#, #,# )(,) !(,! 1!0,& &,* 10!,# ##, &(,&
RE 0,0&& 0,01*!!& 0,0('1!( 0,0&'#0( 0,0'1(1& 0,0#)!&* 0,0')* 0,0!*!( 0,10*()1 0,01)0* 0,0#*#) 0,01(# 0,0!1)* 0,0)11)
Figure 3: Supply Chain Resilience model: Study 2
59
1.5
22
52 2
SCVs Weights St1 St2 St3 St4 St5 St6 St7 St8 St9 St10 St11 St12 St13 St14
HV1 0.113 0.339 1.017 0 0 0 0 0.339 0 0 0 0 0 0 0.339
HV2 0.028 0.252 0.252 0.252 0 0 0 0 0 0.084 0 0 0 0 0
HV3 0.011 0.099 0.099 0 0 0 0 0 0 0 0 0 0 0 0
SV1 0.069 0 0 0.207 0.621 0.207 0.621 0.207 0.207 0.207 0 0 0 0.621 0
SV2 0.021 0 0 0 0 0 0 0 0 0.063 0 0 0 0 0
SV3 0.038 0 0.114 0.342 0 0 0 0 0.342 0 0 0.342 0.114 0 0
FV1 0.113 0 0 0.339 1.107 0 0 0.339 0.339 1.107 0.339 0 0.339 0.339 0
FV2 0.225 0 0 0.675 0 2.025 2.025 0.675 0.675 0 0 0 0 0.675 0
FV3 0.056 0 0 0 0 0.168 0 0 0.504 0 0 0 0 0 0
OV1 0.13 1.17 0 0 0 0 0 0.39 0 0 0 0 0 0 0
OV2 0.041 0 0 0.123 0 0 0 0 0 0.123 0 0 0 0 0
OV3 0.017 0 0 0 0.051 0 0 0.153 0 0.051 0 0 0.051 0 0.153
IV1 0.024 0 0 0 0 0 0 0 0 0 0 0 0 0 0.072
IV2 0.012 0 0 0 0 0 0 0 0 0 0 0 0 0 0
DSV1 0.058 0.174 0 0 0 0 0 0 0 0 0.522 0 0 0 0.174
DSV2 0.029 0 0 0.087 0.087 0.261 0 0 0 0 0 0 0 0.087 0
DSV3 0.015 0.045 0 0 0 0 0 0 0 0 0.135 0.135 0.135 0 0
A.I 2.079 1.482 2.025 1.866 2.661 2.646 2.103 2.067 1.635 0.996 0.477 0.639 1.722 0.738
Cost 30 8 40 35 8 10 15 10 10 8 5 8 25 22
RE 0.069 0.185 0.051 0.053 0.332 0.265 0.14 0.207 0.164 0.125 0.095 0.08 0.067 0.034
Figure 4: Supply Chain Resilience model: Study 3
60
Highlights @4 th revision
• QFD methodology is used effectively to explicate supply chain vulnerability and resiliency.• Relevance of the paper with Enterprise Risk Management (ERM) is presented.• A new multi-objective optimization method is proposed based on QFD.• The method offers new ways to find portfolio of efficient resilient strategies.• The proposed method is applied to three large garment companies of Bangladesh• The results unearth some significant findings across the three companies.• Six new references have been added.
61


![World Patent Information - paperdownload.me · technology institutes and their technological innovation centers (TICs) [6]. Most TICs are part of public universities and control the](https://img.pdfslide.us/doc/110x75/5c0260af09d3f26f1e8e1b57/world-patent-information-technology-institutes-and-their-technological-innovation.jpg)