Embed Size (px)
Citation preview
Victorian City Council Budget Report – 2017/2018
This Budget Report has been prepared with reference to Chartered Accountants ANZ “Victorian City Council Model Budget 2017/2018” a best practice guide for reporting local government budgets in Victoria.
Chartered Accountants Australia and New ZealandVictorian City Council Model Budget – 2017/18 1

Contents Page Mayor’s introduction 12Executive summary 15
Budget reports1. Link to the Council Plan 232. Services and service performance indicators 273. Financial statements 41
4. Financial performance indicators 48
5. Other budget information (grants and borrowings) 52
6. Detailed list of capital works 55
7. Rates and charges 64
Budget analysis (best practice and optional)8. Summary of financial position 72
9. Budget influences 77
10. Analysis of operating budget 82
11. Analysis of budgeted cash position 90
12. Analysis of capital budget 94
13. Analysis of budgeted financial position 101
Long term strategies14. Strategic resource plan 106
15. Rating information 110
16. Other long term strategies 114
AppendicesA Fees and charges schedule 120
B Budget process 121
Chartered Accountants Australia and New ZealandVictorian City Council Model Budget – 2017/18 2

Mayor’s Introduction1
The Councillors and I are pleased to release the proposed Budget 2017/18 to the Community for comment and public submissions. This budget builds on our Council Plan 2017-2021 vision which focuses on the following six key areas:
Advocacy and leadership Community and economic development Community participation Resource management Quality service Urban development and environment
The Council Plan 2017-2021 (Year 1), sets out our strategic plan to deliver our vision over the full term of the Council. As this is the first year of the current Council term, the focus over the next year will be on planning and design activities to deliver current commitments.
The proposed budget details the resources required over the next year to fund the large range of services we provide to the community. It also includes details of proposed capital expenditure allocations to improve and renew our City’s physical infrastructure, buildings and operational assets as well as funding proposals for a range of operating projects.
As Councillors, it is our job to listen to community sentiment and understand your priorities. During and following the Council elections in 2016 we have consistently heard that Council’s services are valued by the community, and that Council also needs to be financially responsible and keep its rates as low as possible. In response, Council has continued an enterprise wide approach to identify savings that don’t impact on its services, to provide increased value for money to ratepayers. Council will continue to focus on identifying sustainable cost savings that will enable it to deliver on our Council Plan to deliver high quality, responsive and accessible services to the community
The proposed budget proposes a rate increase of 2.0 per cent. This is in line with the Fair Go Rates System (FGRS) which has capped rates increases by Victorian Councils. Council has also identified a number of significant and unexpected cost and revenue impacts during the budget process which it has had to fund. These include;
an anticipated increase of 2.0 per cent in the State Government landfill levy ($200,000) increased costs relating to statutory requirements for power line clearances (250,000) higher than inflation labour cost increases of 3.7 per cent which are linked to the current
Enterprise Agreement ($420,000).
These items alone are equivalent to a 2.3 per cent rate increase, over and above the mandatory 2.0 per cent increase in our base costs for delivering core services and projects allowed by the FGRS.
To ease the impact on ratepayers and ensure users help pay for Council services, we are proposing to increase most fees and charges by 2.0 per cent, in line with projected inflation.
In this proposed budget we have allocated funding of $21.5 million for asset renewals, upgrades and expansions. The proposed budget also funds $9.2 million for new assets. Highlights of the capital program include;
roads ($7.13 million) – including reconstructions, roads to recovery projects, resheeting, footpaths and the Integrated Transport Plan
drains ($1.65 million) – including road drainage replacement works, stage 1 of the Victoria Park Lake redevelopment and implementation of the Stormwater Management Plan
open space ($3.29 million) – including playground equipment, irrigation systems, street trees and completion of Victoria Park
buildings ($8.43 million) – including pavilion upgrades, construction of the Victorian Community Facility, construction of a Velodrome and State Bowls Centre and completion of the Block Arcade redevelopment
plant and equipment ($4.84 million) – including information technology, library materials and scheduled replacement of Council’s fleet.
Chartered Accountants Australia and New ZealandVictorian City Council Model Budget – 2017/18 3

We have also allocated funding to deliver tangible progress on other key priorities and initiatives including; expansion of the Community Grants program ($0.44 million) implementation of the aged partnerships program ($0.90 million) expansion of arboriculture services ($0.15 million) introduction of Council provided street cleansing service ($1.4 million) introduction of multicultural library and leisure services expansion of youth services ($0.06 million) opening of the Homestead Centre for Decorative Arts ($0.25 million) resourcing of the employment strategy ($0.18 million) opening of a new customer service centre at Victorian Community Centre ($0.11 million).
Our focus for the next year is to continue to deliver on the projects and services that make our City a great place to live in and respond to the challenges we are currently facing. These challenges include;
implementation of the Zero Carbon Evolution Strategy which aims to reduce our carbon emissions by 22 per cent across the municipality by 2020
the need to provide for significant projected growth of 25 per cent in the number of children accessing Council managed and run child care centres over the next five years
finalising the implementation of Councils’ Bicycle Strategy over the next six years increasing investment in the maintenance of our ageing community and infrastructure assets.
Community feedback was supportive about the use of borrowings to fund major long term community infrastructure rather than rates revenue. The community strongly supports the maintenance of existing service levels and for these to be funded through a mix of rates revenue and user charges. Council will continue to focus on the identification of sustainable cost reductions to protect existing service levels. We will also explore new approaches for providing services to our community in a tighter fiscal environment and ensure that we engage with you on any planned changes.
The proposed budget was developed through a rigorous process of consultation and review and Council endorses it as financially responsible. I encourage you to read the remainder of this document, in conjunction with our revised Council Plan 2017-2021 and I look forward to receiving your submission.
Cr Jo Johnson Mayor
Chartered Accountants Australia and New ZealandVictorian City Council Model Budget – 2017/18 4

Executive summary1
Council has prepared a Budget for 2017/18 which is aligned to the vision in the Council Plan 2017/2021. It seeks to maintain and improve services and infrastructure as well as deliver projects and services that are valued by our community, and do this within the rate increase mandated by the State Government.
This Budget projects a surplus of $1.0m for 2017/18, however, it should be noted that the adjusted underlying result is a deficit of $4.5m after adjusting for capital grants and contributions (refer Sections 5 and 10.1).
1. Key things we are funding
1) Ongoing delivery of services to the Victorian City community funded by a budget of $77.5m. These services are summarised in Section 2.1.
2) Continued investment in Infrastructure assets ($11.4m) primarily for renewal works. This includes roads ($5.3m); bridges ($0.1m); footpaths and bicycle paths ($0.7m); drainage ($1.9m); recreational, leisure and community facilities ($0.6m); parks, open space and streetscapes ($2.6m); and transport management ($0.3m). The Statement of Capital Works can be found in Section 3 and further details on the capital works budget can be found in Sections 6 and 12.
Strategic Objective 1: Advocacy and leadership2-10
3) Additional funding to the Community Grants program, which is the first additional funding for some years for this significant community program ($0.44 million net cost).
Strategic Objective 2: Community and economic development2-10
4) Council is the lead agency on aged partnerships project and although grants were received in 2016/17, the majority of programs will be implemented during the next financial year ($0.90 million net cost).
5) Resourcing of the Employment Strategy will see the engagement of a part time employment co-coordinator to ensure that Council gains its fair share of employment programs and is able to respond to employment and training issues in the municipality. Resources also include provision for Council’s participation in the State Government’s Community Jobs Program and implementing recommendations arising from the Employment Strategy ($0.18 million net cost).
Strategic Objective 3: Community participation2-10
6) A major step forward in the improvement of Council’s Multilingual Communication Service to meet the needs of a non-English speaking background community including a major redevelopment of Council’s multilingual website and other communication services ($0.05 million net cost).
Strategic Objective 4: Resource management2-10
7) Significant advances will be made in the further development of the Geographic Information System (GIS). Additionally, public access to the GIS will become operational during this calendar year, as will the commissioning of the Community Portal and community email facilities. These initiatives will place Council firmly at the forefront of local governments in Victoria and Australia for electronic public access to service information and facilities ($Nil net cost).
Strategic Objective 5: Quality service2-10
8) Customer service facilities will be provided at the new Victorian Community Centre following its completion ($0.11 million net cost).
Chartered Accountants Australia and New ZealandVictorian City Council Model Budget – 2017/18 5

Strategic Objective 6: Urban development and environment2-10
9) The major three year review of Council’s Municipal Strategic Statement will commence in July 2017 with a completion date of December 2017. This will be the main focus of work being undertaken by the Strategic Planning Unit next year ($Nil net cost).
10) In November 2016, Council resolved to deliver an in-house provided Street Cleansing service. This year’s allocation includes the recent employment of an additional 14 staff, plant maintenance, materials and tipping fees, to deliver this new in house service ($1.40 million net cost).
2. The Rate Rise
a. The average rate will rise by 2.0% in line with the order by the Minister for Local Government on 16 December 2016 under the Fair Go Rates System.
b. Key drivers
i. To fund ongoing service delivery – business as usual (balanced with greater service demands from residents)
ii. To fund renewal of infrastructure and community assets
iii. To cope with growth in the population of Victorian residents (2.2% in the last year)
iv. To cope with cost shifting from the State Government.
c. This is not a revaluation year. Valuations will be as per the General Revaluation dated 1 January 2016 (as amended by supplementary valuations).
d. The waste service charge incorporating kerbside collection and recycling will increase by 4.2% per property.
e. Note that for every $100 in taxes paid by Victorian residents, rates make up approximately $3.50. The other $96.50 goes to the State and Federal Governments.4
f. Refer Section 7 for further Rates and Charges details.
3. Key Statistics
Total Revenue : $77.5M (2016/17 = $72.5M)
Total Expenditure : $76.5M (2016/17 = $74.5M)
Accounting Result: $1.0M Surplus (2016/17 = $1.9M Deficit)
(Refer Income Statement in Section 3)
Underlying operating result: Deficit of $4.5M (2016/17 = Deficit of $4.7M)(Refer Analysis of operating Budget in Section 10.1)(Note: Underlying operating result is an important measure of financial sustainability as it excludes income which is to be used for capital, from being allocated to cover operating expenses)
Cash result: $11.3M Deficit (2016/17 = $8.9M Deficit)
(Refer Statement of Cash Flows in Section 3)This is the net funding result after considering the funding requirements to meet loan principal repayments and the reserve transfers.
Total Capital Works Program of $30.72M (2016/17 = $29.87M)o $8.87M from Council operations (rates funded)o $0.0M from borrowingso $1.68M from asset saleso $6.28M from external grants o $13.89M from cash and reserves
Chartered Accountants Australia and New ZealandVictorian City Council Model Budget – 2017/18 6

Chartered Accountants Australia and New ZealandVictorian City Council Model Budget – 2017/18 7

4. Budget Influences
External InfluencesThe preparation of the budget is influenced by the following external factors:
The Victorian State Government has introduced a cap on rate increases from 2016/17. The cap for 2017/18 has been set at 2.0% (2016/2017: 2.5%).
CPI for Victoria is forecast to be 2.0% for the 2017/18 year (Victorian Department of Treasury & Finance, 2016-17 Budget Update).
The Victorian Wage Price Index is projected to be 2.5% in 2017/18 (Victorian Department of Treasury & Finance, 2016-17 Budget Update).
Council must renegotiate a new Collective Agreement during the 2017/18 year for commencement on 1 July 2018.
Receipt of significant capital works funding of $6.28 million for the construction of a Velodrome and State Bowls Centre at Victoria Park and the completion of Roads to Recovery projects
Anticipated increases of 2.0% (or $1.24 per tonne) in the levy payable to the State Government upon disposal of waste into landfill, resulting in additional waste tipping costs of $0.20 million. The levy has increased from $9 per tonne in 2008/2009 to a forecast $63.27 per tonne in 2017/2018 (703% increase in 9 years) and has added $1.84 million to Council's costs.
Ongoing cost shifting. This occurs where Local Government provides a service to the community on behalf of the State and Federal Government. Over time the funds received by local governments do not increase in line with real cost increases.
Councils across Australia raise approximately 3.5% of the total taxation collected by all levels of Government in Australia. In addition Councils are entrusted with the maintenance of more than 30% of the all Australian public assets including roads, bridges, parks, footpaths and public buildings. This means that a large proportion of Council’s income must be allocated to the maintenance and replacement of these valuable public assets in order to ensure the quality of public infrastructure is maintained at satisfactory levels.
The Fire Services Property Levy will continue to be collected by Council on behalf of the State Government with the introduction of the Fire Services Property Levy Act 2012.
A write down of flood/fire affected assets which is estimated at $1.00 million in 2017/18 and estimated repairs of $1.20 million over two years. Compensation of $0.40 million has been confirmed by Council’s insurers, with the balance to be funded by the Natural Disaster Assistance Fund (NDAF). An advance payment of $1.00 million from the NDAF was received in 2016/17. Council is also eligible to claim the first $0.03 million from the Victoria Grants Commission.
Internal InfluencesAs well as external influences, there are also a number of internal influences which are expected to have a significant impact on the preparation of the 2017/18 Budget. These matters have arisen from events occurring in the 2016/17 year resulting in variances between the forecast actual and budgeted results for that year and matters expected to arise in the 2017/18 year. These matters and their financial impact are set out below:
Overrun of $0.48 million in the maintenance of trees due to the removal of severely diseased street trees.
Reduction in the budgeted draw down from discretionary reserves of $0.30 million as a result of government funding being awarded for the Victoria Civic Centre redevelopment.
Higher than expected wage increases of 5% per annum resulting in additional ongoing employee costs of $0.46 million per annum.
Ongoing savings of $0.23 million as a result of meals production being contracted out at a rate more favourable than budget.
Chartered Accountants Australia and New ZealandVictorian City Council Model Budget – 2017/18 8

Council’s decision during the year to bring the street cleansing service in-house. This has resulted in start-up investment costs of $0.80 million for plant and equipment to be funded from investment reserves and ongoing operational costs of $1.40 million per annum.
5. State Budget wish list
Council will continue to advocate for:
a. Bicycle safety improvement on Smith Street and the Railway bike path.
b. Funding for the final section of the Railway bike path.
c. Public Transport Improvements including:
i. Reinstatement of the Blue Orbital bus routeii. Reinstatement of the Hope Street busiii. All bus services to be a minimum MOTC standardiv. Restore the frequency of the Route 542 bus v. Lobby for more frequent services on all routes
d. State government investment to address the gaps in family violence prevention identified by the Victorian Community Safety Leadership Group.
e. State government investment to address the identified priority community infrastructure gaps in Victorian City.
f. Advocate acquisition of land owned by other levels of government that abuts Council-owned land or in areas that have been identified as deficient in open space as noted in the Victorian City Council Open Space Strategy, or where an expansion of open space increases the benefit to the community or environment (i.e. creek corridors).
6. Cost Shifting
Cost shifting occurs when Commonwealth and State programs transfer responsibilities to local government with insufficient funding or grants which don’t keep pace with delivery costs.
Type 1: Cost Shifting for Specific Services1. Home and Community Care (HACC) - $1.42m from 2011/12 to 2017/18
2. Library Services - $367k from 2011/12 to 2017/18
3. Maternal and Child Health - $193k from 2011/12 to 2017/18
4. School Crossing Supervision - $100k from 2011/12 to 2017/18. The State Government has recently announced it will start to honour the existing agreement to pay 50% of the costs for school crossing supervision. It acknowledges that payments to Councils in the past have not covered the agreed 50% of the cost. While this announcement is welcomed the details of the level of payments in future have not yet been provided.
5. Administration of the state wide temporary Food registration system ‘ Streatrader’– additional annual cost of $85k since 2013/14 due to the responsibility having been shifted from the State Government to Council.
Type 2: Loss of funding in General6. A freeze on indexation of the federal financial assistance grants. The Commonwealth
announced in its 2014/15 Budget that it would pause indexation of the total national pool of financial assistance grants to local government for three years (2014/15, 2015/16, 2016/17). The cumulative impact on Victorian City Council for the three years totals $1.75m and although the freeze has now been removed this is a permanent loss of revenue.
7. Discontinuance of the Community Support Program (CSP) Fund for Family Day Care program from 1 July 2015 - $140k per annum
Chartered Accountants Australia and New ZealandVictorian City Council Model Budget – 2017/18 9

Type 3: Statutory fee that prohibits full cost recovery8. After freezing planning fees since 2009 the State Government in October 2016 increased
the allowable fee that Council may charge for these services. While this belated action is welcomed the new fees still do not cover the full cost of providing the service hence rate payers are still forced to subsidise the activities of developers across the city.
Type 4: Levies9. State Government landfill levy - The levy has increased from $9 per tonne in 2008/2009
to a forecast $63.27 per tonne in 2017/2018. The increase from 2016/2017 to 2017/2018 is approximately 2%.
10. Animal registration levy - $190k from 2011/12 to 2017/18
11. Congestion levy (off street car parks) - $146k per annum from 2016/17
Type 4: Statutory requirements lead to increased costs Line clearance (cutting back tree branches around power lines) – approximately $1m from 2011/12 to 2017/18
12. New national policy of 15 hours kinder for four-year olds - $ 5.635m of capital works over the past 4 years.
7. Population Growth
Council’s population is forecast to grow from 154,245 in 2011 to 188,813 by 2020 and to 214,320 by 2036.
Chartered Accountants Australia and New ZealandVictorian City Council Model Budget – 2017/18 10

Budget Reports
The following reports include all statutory disclosures of information and are supported by the analysis contained in sections 8 to 16 of this report.
This section includes the following reports and statements in accordance with the Local Government Act 1989 and the Local Government Model Financial Report.
1 Links to Council Plan2 Services and service indicators3 Financial statements4 Financial performance indicators5 Grants and borrowings6 Detailed list of capital works7 Rates and charges
Chartered Accountants Australia and New ZealandVictorian City Council Model Budget – 2017/18 11
1. Link to the Council Plan1
This section describes how the Annual Budget links to the achievement of the Council Plan within an overall planning and reporting framework. This framework guides the Council in identifying community needs and aspirations over the long term (Vision 2030), medium term (Council Plan) and short term (Annual Budget) and then holding itself accountable (Annual Report).
1.1 Planning and accountability framework2
The Strategic Resource Plan, part of and prepared in conjunction with the Council Plan, is a rolling four year plan that outlines the financial and non-financial resources that Council requires to achieve the strategic objectives described in the Council Plan. The Annual Budget is framed within the Strategic Resource Plan, taking into account the services and initiatives which contribute to achieving the strategic objectives specified in the Council Plan. The diagram below depicts the planning and accountability framework that applies to local government in Victoria.
Source: Department of Environment, Land, Water and Planning
In addition to the above, Council has a long term plan (Vision 2030) which articulates a community vision, mission and values. The Council Plan is prepared with reference to Council's long term Community Plan.
The timing of each component of the planning framework is critical to the successful achievement of the planned outcomes. The Council Plan, including the Strategic Resource Plan, is required to be completed by 30 June following a general election and is reviewed each year in advance of the commencement of the Annual Budget process.
Chartered Accountants Australia and New ZealandVictorian City Council Model Budget – 2017/18 12

1.2 Our purpose3
Our vision ”one community – proudly diverse”Victorian City Council seeks to create an environmentally sustainable and liveable city, where people can shop, work and socialise locally; a city where a car and high income are not necessary for a rich and rewarding quality of life; and a city that will continue to provide a range of opportunities and choices for a diverse and prosperous community.
Our missionVictorian City Council will engage in partnership with the Victorian community to lead and develop: a city with sustainable growth a city that cares for and respects all of its citizens a city that welcomes people from across the globe a city that celebrates its social, cultural and ethnic heritage a city that promotes wellbeing.As an innovative and accountable organisation, Victorian City Council will promote vibrant democracy and provide high-quality services.
Our valuesVictorian City Council has a clear strength in the bond and affinity between its Councillors, the community and staff. Staff support the community leadership and governance role of Councillors, and work together to achieve the commitments of the Council Plan. Having all Victorian City Council staff practise the following organisational values enhances the quality of this partnership: Service - Our citizens, community and service users are the focus of all our actions Accountability - We are responsible for our actions, which are open to review Innovation - We encourage and seek new ideas in finding solutions Teamwork - We share our skills, knowledge and experience as part of a team and work together
towards achieving Council’s goals Recognition - We promote the achievements and efforts of others Safety - We look after our environment and the welfare of others Integrity - We are open and honest and work to the best of our ability Respect - We acknowledge the opinions of others and their rights and differences.
1.3 Strategic objectives4
Council delivers services and initiatives under 34 major service categories. Each contributes to the achievement of one of the six Strategic Objectives as set out in the Council Plan for the 2017-2021 years. The following table lists the six Strategic Objectives as described in the Council Plan.
Strategic Objective Description
1. Advocacy and leadership
Maintain an understanding of issues of local importance and will provide leadership in tackling them. Where appropriate, we will advocate on behalf of our community and ensure that our community is represented in debates which affect us.
2. Community and economic development
Work to improve the quality of life for the local community. Ensure that social and cultural services are tailored to meet specific local needs and work to stimulate the city’s economic activity.
3. Community participation
Communicate clearly with the community and consult in a meaningful and appropriate way. We will increasingly encourage residents and other stakeholders to participate in Council decision making.
4. Resource management
Take seriously its responsibility as the custodian of community resources. We commit to achieving maximum benefit for the community from all our resources while taking care of our natural environment.
5. Quality service Deliver high quality value for money services in areas that are important to the community and involve the community in determining and evaluating their performance on an ongoing basis.
6. Urban development
Work to improve the quality of our natural and urban environment, and will stimulate development activity within a framework that protects and enhances
Chartered Accountants Australia and New ZealandVictorian City Council Model Budget – 2017/18 13

and environment
the natural environment, heritage assets and residential amenity.
Chartered Accountants Australia and New ZealandVictorian City Council Model Budget – 2017/18 14
2. Services and service performance indicators1
This section provides a description of the services and initiatives to be funded in the Budget for the 2017/18 year and how these will contribute to achieving the strategic objectives outlined in the Council Plan. It also describes a number of major initiatives, initiatives and service performance outcome indicators for key areas of Council’s operations. Council is required by legislation to identify major initiatives, initiatives and service performance outcome indicators in the Budget and report against them in their Annual Report to support transparency and accountability. The relationship between these accountability requirements in the Council Plan, the Budget and the Annual Report is shown below.
Source: Department of Environment, Land, Water and Planning
Services for which there are prescribed performance indicators to be reported on in accordance with the Regulations are shown in bold and underlined in the following sections.
Chartered Accountants Australia and New ZealandVictorian City Council Model Budget – 2017/18 15

2.1 Strategic Objective 1: Advocacy and leadership2-10
To achieve our objective of Advocacy and Leadership, we will continue to plan, deliver and improve high quality, cost effective, accessible and responsive services. The services, initiatives, major initiatives and service performance indicators for each business area are described below.
Services
Service area Description of services providedExpenditure
(Revenue)Net Cost
$'000Councillors, Chief Executive and Executive Team
This area of governance includes the Mayor, Councillors, Chief Executive Officer and Executive Management Team and associated support which cannot be easily attributed to the direct service provision areas.
2,006 (0)
2,006
Social policy1)-3) This service has the responsibility to frame and respond to the challenges of social inclusion that present to Council. It is the responsibility of this service to ensure that issues that arise and situations and trends that develop of a social policy nature are responded to appropriately by Council.
1,546 (250)1,296
Major Initiatives
1) Additional funding to the Community Grants program, which is the first additional funding for some years for this significant community program ($0.44 million net cost).
Initiatives
2) The recommendations from the Poverty Inquiry will be implemented with a responsible gambling charter to be developed with gambling agencies in Council to ensure the promotion of responsible gambling among Council residents. Also, further dialogue will occur with the State Government to address adverse impacts of gambling in the municipality ($Nil net cost).
3) Council’s Friendship City Relationship with East Timor will be realised through the commencement of several projects to assist the rebuilding of community and basic infrastructure in East Timor ($Nil net cost).
Service Performance Outcome Indicators
Service Indicator Performance Measure Computation
Governance Satisfaction Satisfaction with Council decisions(Community satisfaction rating out of 100 with how Council has performed in making decisions in the interests of the community)
Community satisfaction rating out of 100 with how Council has performed in making decisions in the interests of the community
Chartered Accountants Australia and New ZealandVictorian City Council Model Budget – 2017/18 16

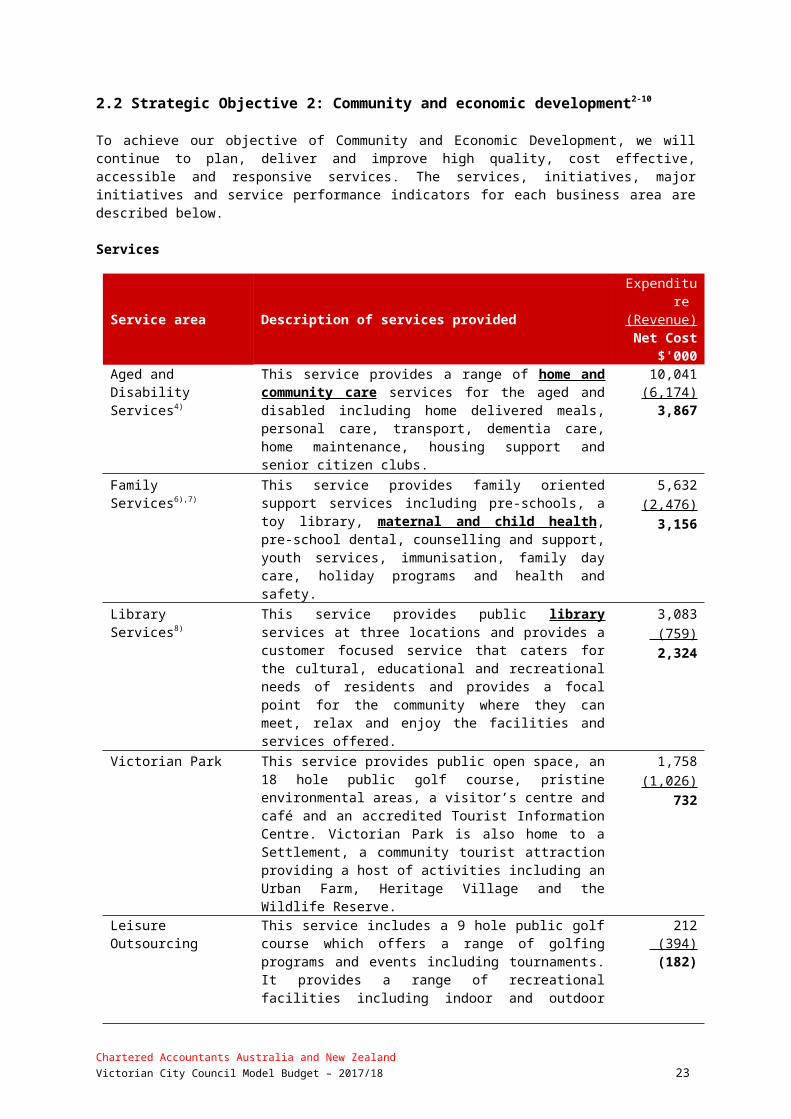
2.2 Strategic Objective 2: Community and economic development2-10
To achieve our objective of Community and Economic Development, we will continue to plan, deliver and improve high quality, cost effective, accessible and responsive services. The services, initiatives, major initiatives and service performance indicators for each business area are described below.
Services
Service area Description of services providedExpenditure
(Revenue)Net Cost
$'000Aged and Disability Services4)
This service provides a range of home and community care services for the aged and disabled including home delivered meals, personal care, transport, dementia care, home maintenance, housing support and senior citizen clubs.
10,041(6,174)
3,867
Family Services6),7) This service provides family oriented support services including pre-schools, a toy library, maternal and child health, pre-school dental, counselling and support, youth services, immunisation, family day care, holiday programs and health and safety.
5,632(2,476)
3,156
Library Services8) This service provides public library services at three locations and provides a customer focused service that caters for the cultural, educational and recreational needs of residents and provides a focal point for the community where they can meet, relax and enjoy the facilities and services offered.
3,083 (759)2,324
Victorian Park This service provides public open space, an 18 hole public golf course, pristine environmental areas, a visitor’s centre and café and an accredited Tourist Information Centre. Victorian Park is also home to a Settlement, a community tourist attraction providing a host of activities including an Urban Farm, Heritage Village and the Wildlife Reserve.
1,758(1,026)
732
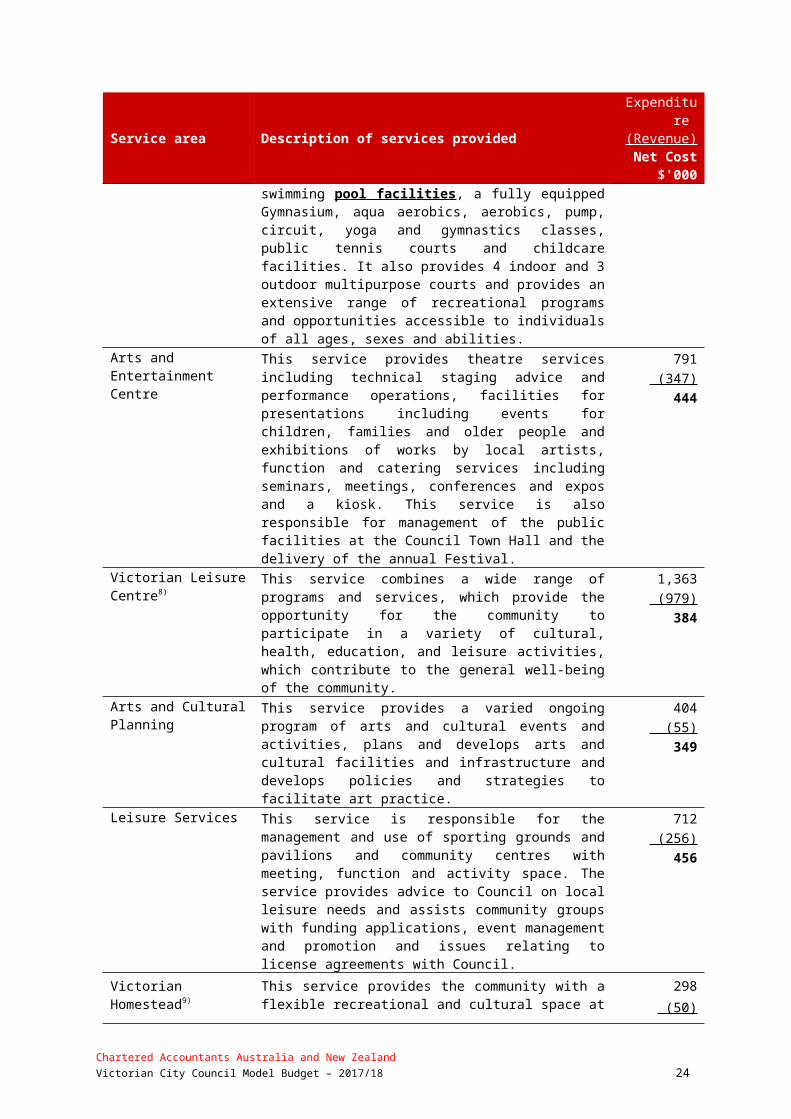
Leisure Outsourcing This service includes a 9 hole public golf course which offers a range of golfing programs and events including tournaments. It provides a range of recreational facilities including indoor and outdoor swimming pool facilities, a fully equipped Gymnasium, aqua aerobics, aerobics, pump, circuit, yoga and gymnastics classes, public tennis courts and childcare facilities. It also provides 4 indoor and 3 outdoor multipurpose courts and provides an extensive range of recreational programs and opportunities accessible to individuals of all ages, sexes and abilities.
212 (394)(182)
Arts and Entertainment Centre
This service provides theatre services including technical staging advice and performance operations, facilities for presentations including events for children, families and older people and exhibitions of works by local artists, function and catering services including seminars, meetings, conferences and expos and a kiosk. This service is also responsible for management of the public facilities at the Council Town Hall and the delivery of the annual Festival.
791 (347)
444
Victorian Leisure Centre8)
This service combines a wide range of programs and services, which provide the opportunity for the community to participate in a variety of cultural, health, education, and leisure activities, which contribute to the general well-being of the community.
1,363 (979)
384
Chartered Accountants Australia and New ZealandVictorian City Council Model Budget – 2017/18 17

Service area Description of services providedExpenditure
(Revenue)Net Cost
$'000Arts and Cultural Planning
This service provides a varied ongoing program of arts and cultural events and activities, plans and develops arts and cultural facilities and infrastructure and develops policies and strategies to facilitate art practice.
404 (55)
349
Leisure Services This service is responsible for the management and use of sporting grounds and pavilions and community centres with meeting, function and activity space. The service provides advice to Council on local leisure needs and assists community groups with funding applications, event management and promotion and issues relating to license agreements with Council.
712 (256)
456
Victorian Homestead9) This service provides the community with a flexible recreational and cultural space at Victorian Homestead. The service includes exhibition spaces which host a year round exhibition program that includes both historic and contemporary art and craft.
298 (50)248
Economic Development5)
The economic development service assists the organisation to facilitate an environment that is conducive to a sustainable and growing local business sector and provides opportunities for local residents to improve their skill levels and access employment.
785 (106)
679
Major Initiatives
4) Council is the lead agency on aged partnerships project and although grants were received in 2016/17, the majority of programs will be implemented during the next financial year ($0.90 million net cost).
5) Resourcing of the Employment Strategy will see the engagement of a part time employment co-coordinator to ensure that Council gains its fair share of employment programs and is able to respond to employment and training issues in the municipality. Resources also include provision for Council’s participation in the State Government’s Community Jobs Program and also implementing recommendations arising from the Employment Strategy ($0.18 million net cost).
Initiatives
6) Increase in service provision from Youth Resource Centre at Victorian Civic Centre. Support for youth consortium work, and for a young mother’s group run jointly with maternal and child health nurse and youth worker. Council’s music centre to offer employment opportunities to eight young people in music related disciplines ($0.06 million net cost).
7) Increase in hours of pre-school field officer who currently is funded for 28 hours per week, but provides service to over 100 families and 30 pre-schools in Council ($0.02 million net cost).
8) New programs will be developed to reflect the cultural diversity of Council including a community languages program through the Library Services, a volunteers’ support network for leisure organisation volunteers and opportunities for new residents to participate in culturally relevant activities ($Nil net cost).
9) The Victorian Homestead Centre for Decorative Arts on Mt Victorian Estate will open during the year to host major and decorative art exhibits ($0.25 million net cost).
Chartered Accountants Australia and New ZealandVictorian City Council Model Budget – 2017/18 18

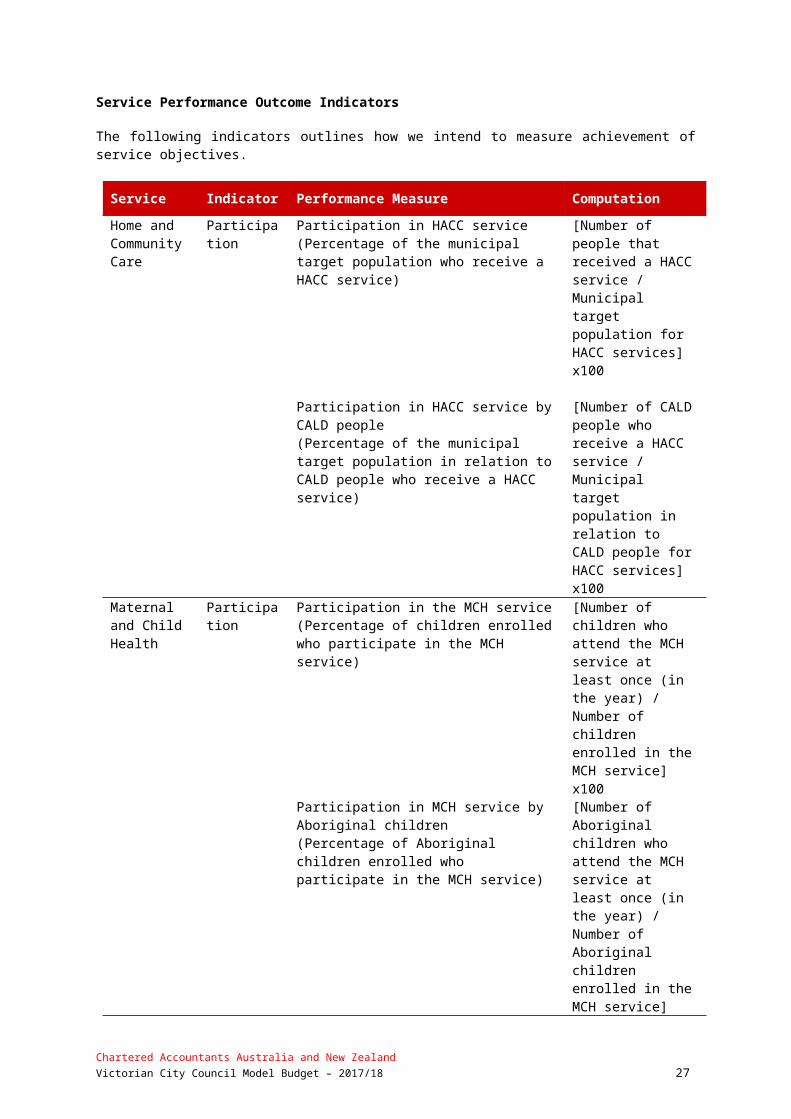
Service Performance Outcome Indicators
The following indicators outlines how we intend to measure achievement of service objectives.
Service Indicator Performance Measure Computation
Home and Community Care
Participation Participation in HACC service(Percentage of the municipal target population who receive a HACC service)
[Number of people that received a HACC service / Municipal target population for HACC services] x100
Participation in HACC service by CALD people(Percentage of the municipal target population in relation to CALD people who receive a HACC service)
[Number of CALD people who receive a HACC service / Municipal target population in relation to CALD people for HACC services] x100
Maternal and Child Health
Participation Participation in the MCH service(Percentage of children enrolled who participate in the MCH service)
[Number of children who attend the MCH service at least once (in the year) / Number of children enrolled in the MCH service] x100
Participation in MCH service by Aboriginal children(Percentage of Aboriginal children enrolled who participate in the MCH service)
[Number of Aboriginal children who attend the MCH service at least once (in the year) / Number of Aboriginal children enrolled in the MCH service] x100
Libraries Participation Active library members(Percentage of the municipal population that are active library members)
[Number of active library members / municipal population] x100
Aquatic Facilities
Utilisation Utilisation of aquatic facilities(Number of visits to aquatic facilities per head of municipal population)
Number of visits to aquatic facilities / Municipal population
Economic Development
Economic activity
Change in number of businesses(Percentage change in the number of businesses with an ABN in the municipality)
[Number of businesses with an ABN in the municipality at the end of the financial year less the number of businesses at the start of the financial year / Number of businesses with an ABN in the municipality at the start of the financial year] x100
Chartered Accountants Australia and New ZealandVictorian City Council Model Budget – 2017/18 19

2.3 Strategic Objective 3: Community participation2-10
To achieve our objective of Community Participation, we will continue to plan, deliver and improve high quality, cost effective, accessible and responsive services. The services, initiatives, major initiatives and service performance indicators for each business area are described below.
Services
Service area Description of services providedExpenditure
(Revenue)Net Cost
$'000Communications10)11) This service is responsible for the management and
provision of advice on external communication, in consultation with relevant stakeholders, on behalf of Council.
537 (0)537
Major Initiatives
10) A major step forward in the improvement of Council’s Multilingual Communication Service to meet the needs of a non-English speaking background community including a major redevelopment of Council’s multilingual website and other communication services ($0.05 million net cost).
Initiatives
11) Improve the use of social media in Council’s communications with the community ($0.02 million net cost).
2.4 Strategic Objective 4: Resource management 2-10
To achieve our objective of Resource Management, we will continue to plan, deliver and improve high quality, cost effective, accessible and responsive services. The services, initiatives, major initiatives and service performance indicators for each business area are described below.
Services
Service areas Description of services providedExpenditure
(Revenue)Net Cost
$'000Financial Services13) This service predominantly provides financial based
services to both internal and external customers including the management of Council’s finances, payment of salaries and wages to Council employees, procurement and contracting of services, raising and collection of rates and charges and valuation of properties throughout the municipality.
2,003 (345)1,658
Information Services12) This service provides, supports and maintains reliable and cost effective communications and computing systems, facilities and infrastructure to Council staff enabling them to deliver services in a smart, productive and efficient way.
1,729 (0)
1,729
Chartered Accountants Australia and New ZealandVictorian City Council Model Budget – 2017/18 20

Service areas Description of services providedExpenditure
(Revenue)Net Cost
$'000Organisation Development
This service provides Council with strategic and operational organisation development support. The service develops and implements strategies, policies and procedures through the provision of human resources and industrial relations services. The service also assists managers to determine and progress toward future structures, capability and cultures in their service units.
806 (0)806
Fleet Services This service purchases and maintains Council vehicles, plant and equipment to meet functionality and safety needs and to maximise the performance and minimise operational cost of the fleet. In addition, the service provides baby capsule hire to residents.
2,350(3,621)(1,271)
Infrastructure Planning This service conducts capital works planning for Council’s main civil infrastructure assets in an integrated and prioritised manner in order to optimise their strategic value and service potential. These include roads, laneways, car parks, foot/bike paths, drains and bridges.
268 (0)268
Facilities Maintenance This service prepares long term maintenance management programs for Council’s property assets in an integrated and prioritised manner in order to optimise their strategic value and service potential. These include municipal buildings, pavilions and other community buildings.
2,233 (280)1,953
Engineering Design and Management
This service undertakes design, tendering, contract management and supervision of various works within Council’s capital works program. The service also approves and supervises private development activities such as subdivisions and infrastructure associated with unit developments.
513 (0)513
Major Initiatives
12) Significant advances will be made in the further development of the Geographic Information System (GIS). Additionally, public access to the GIS will become operational during this calendar year, as will the commissioning of the Community (Internet) Portal and community email facilities. These initiatives will place Council firmly at the forefront of local governments in Victoria and Australia for electronic public access to service information and facilities ($Nil net cost).
Initiatives
13) Alternative payment options will be phased in during the year which will allow the following accounts to be paid at Australia Post via internet, phone and over-the-counter using cash, cheque, credit card and debit card – rates, homecare, family day care, meals, home maintenance, holiday program, animal registrations, parking fines and sundry debtors ($Nil net cost).
Chartered Accountants Australia and New ZealandVictorian City Council Model Budget – 2017/18 21

2.5 Strategic Objective 5: Quality service2-10
To achieve our objective of Quality Service, we will continue to plan, deliver and improve high quality, cost effective, accessible and responsive services. The services, initiatives, major initiatives and service performance indicators for each business area are described below.
Services
Service areas Description of services providedExpenditure
(Revenue)Net Cost
$'000Customer and Civic Services14)
This service provides a range of governance, statutory and corporate support services and acts as the main customer interface with the community. Services include the coordination of council and committee meetings, records and information management and office support services at the Civic Centre. Two municipal halls are available for hire and the customer support service is delivered from four located customer service centres.
2,369 (0)
2,369
Performance Support15)
This service provides organisational policy, systems and support in the areas of continuous improvement, corporate planning, performance measurement and reporting.
351 (0)351
Major Initiatives
14) Customer service facilities will be provided at the new Victorian Community Centre following its completion ($0.11 million net cost).
Initiatives
15) Fifteen of Council services will be going through a review under Council’s Continuous Improvement Program, which will include consultation with stakeholders and the development of service standards and commitments for these services ($Nil net cost).
2.6 Strategic Objective 6: Urban development and environment2-10
To achieve our objective of Urban Development and Environment, we will continue to plan, deliver and improve high quality, cost effective, accessible and responsive services. The services, initiatives, major initiatives and service performance indicators for each business area are described below.
Services
Service areas Description of services providedExpenditure
(Revenue)Net Cost
$'000Open Space Planning This service prepares policies and strategies relating to
open space and urban design issues and prepares and implements an annual capital works program. The service also provides landscape and urban design advice and is actively involved in setting service standards for parks maintenance activities.
554 (0)554
Urban Development16),18)
This statutory planning service processes all planning applications, provides advice and makes decisions about development proposals which require a planning permit, as well as representing Council at the Victorian Civil and Administrative Tribunal where necessary. It monitors the Council’s Planning Scheme as well as preparing major
2,358 (697)1,661
Chartered Accountants Australia and New ZealandVictorian City Council Model Budget – 2017/18 22
Service areas Description of services providedExpenditure
(Revenue)Net Cost
$'000policy documents shaping the future of the City. It also prepares and processes amendments to the Council Planning Scheme and carries out research on demographic, urban development, economic and social issues affecting Council.
Parks and Gardens19) This service is divided into four main operational units. Arboriculture provides tree pruning, planting, removal, planning and street tree strategies. Bushland provides the management of conservation and parkland areas, creeks and other areas of environmental significance. Parks Management provides management and implementation of open space strategies and maintenance programs. Infrastructure Maintenance provides management of all parks and gardens and infrastructure maintenance.
3,964 (0)
3,964
Traffic and Transportation Services
This service provides strategic planning, policy development and day to day management of traffic and transport related issues in Council. The unit also implements a Green Travel Plan for Council staff, the TravelSMART “Better Ways to Work” program, Local Area Traffic Management schemes and assists with implementation of the Road Safety Strategy.
511 (0)511
Property Management This service facilitates the smooth flow of traffic and parking throughout the municipality through the provision of safe, orderly and equitable parking enforcement and education. In addition the service is responsible for the maintenance, management and strategic planning for Council’s building, land and property leases and licenses.
985 (0)985
Environmental Services17)
This service provides waste collection including kerbside rubbish collections of garbage, hard waste and green waste from all households and some commercial properties in Council. It also provides street cleaning, leaf collection, weed removal, drainage pit cleaning and street litter bins throughout Council.
6,596 (212)6,384
Roads and Resource Recovery20)
This service provides public tipping to the Council and wider community and conducts ongoing maintenance of the Council’s 600km of roads, 2,000km of drains and 1.6 million square metres of footpath.
3,406(1,380)
2,026
Environmental Planning21)
This service develops environmental policy, coordinates and implements environmental projects and works with other services to improve Council’s environmental performance. Reducing greenhouse gas emissions within Council operations and the community are a key priority through Council’s ongoing involvement in the Cities for Climate Protection Plus program.
396 (36)
360
Amenity22) This service provides staff at school crossings throughout the municipality to ensure that all pedestrians, but mainly school aged children, are able to cross the road safely. It maintains and improves the health and safety of people, animals and the environment in Council by providing animal management services including a cat trapping program, a dog and cat collection service, a lost and found notification service, a pound service, a registration and administration service, an afterhours service and an emergency service. It also provides education, regulation
1,425 (652)
773
Chartered Accountants Australia and New ZealandVictorian City Council Model Budget – 2017/18 23
Service areas Description of services providedExpenditure
(Revenue)Net Cost
$'000and enforcement of the General Local Law and relevant State legislation.
Building Services23) This service provides statutory building services to the Council community including processing of building permits, emergency management responsibilities, fire safety inspections, audits of swimming pool barriers and investigations of complaints and illegal works.
624 (340)
284
Environmental Health This service protects the community’s health and well-being by coordinating food safety support programs, Tobacco Act activities and smoke free dining and gaming venue issues. The service also works to rectify any public health concerns relating to unreasonable noise emissions, housing standards and pest controls.
746 (314)
432
Major Initiatives
16) The major three year review of Council’s Municipal Strategic Statement will commence in July 2016 with a completion date of December 2016. This will be the main focus of work being undertaken by the Strategic Planning Unit next year ($Nil net cost).
17) In November 2015, Council resolved to deliver an in-house provided Street Cleansing service. This year’s allocation includes the recent employment of an additional 14 staff, plant maintenance, materials and tipping fees, to deliver this new in house service ($1.40 million net cost).
Initiatives
18) Two additional staff for Statutory Planning will enable Council to respond in a timelier manner to planning permit applications and also to an anticipated increased workload resulting from the newly introduced planning zones ($0.90 million net cost).
19) Arboriculture maintenance in Council equates to in excess of 80% of customer enquiries related to Council parks. As a result, an additional two employees will be recruited to continue with the delivery of this service. The contract allocation for Arboriculture Maintenance has also been increased to allow for additional line clearance within the municipality, in fill planting, stump removal and other tree maintenance costs ($0.15 million net cost).
20) As a result of delivering a Council provided street cleansing service, the increased labour allocation in the Roads and Recovery program includes an allowance for a new full time Drainage Inspector ($0.04 million net cost).
21) An extra position is included to implement the storm water management program and coordinate the implementation of the Victorian Park Lake water quality and weir works, including further funding work and community liaison. The position will be a two year role in line with the lake timescale. An additional $0.05 million is also included in this year’s budget for the environmental monitoring of the old landfill gas and leachate ($0.08 million net cost).
22) The number of Local Laws enquiries has increased, as has the number of abandoned vehicles, the number of permits and corresponding fines. The sharing of an Administration officer with the School Crossing Unit has slightly reduced the expenditure in this area, which combined with the extra predicted income, enables one extra Local Law officer to be employed with no net budget implications ($Nil net cost).
23) In recent years the Building Supervisor’s role has increased in scope and volume. This includes mandatory tasks related to site dispensation and consents, smoke detector and swimming pool fencing. Additionally complaints and enforcement requests for work carried out by private building supervisors and general complaints related to urban consolidation have increased. This budget sees the development of two new positions, an additional Building Supervisor and a Building Enforcement officer to address these issues ($0.03 million net cost).
Service Performance Outcome Indicators 6-10
Chartered Accountants Australia and New ZealandVictorian City Council Model Budget – 2017/18 24

Service Indicator Performance Measure Computation
Statutory planning
Decision making
Council planning decisions upheld at VCAT(Percentage of planning application decisions subject to review by VCAT and that were not set aside)
[Number of VCAT decisions that did not set aside Council’s decision in relation to a planning application / Number of VCAT decisions in relation to planning applications] x100
Waste collection
Waste diversion
Kerbside collection waste diverted from landfill(Percentage of garbage, recyclables and green organics collected from kerbside bins that is diverted from landfill)
[Weight of recyclables and green organics collected from kerbside bins / Weight of garbage, recyclables and green organics collected from kerbside bins] x100
Roads Satisfaction Satisfaction with sealed local roads(Community satisfaction rating out of 100 with how Council has performed on the condition of sealed local roads)
Community satisfaction rating out of 100 with how Council has performed on the condition of sealed local roads.
Animal Management
Health and safety
Animal management prosecutions(Number of successful animal management prosecutions)
Number of successful animal management prosecutions
Food safety Health and safety
Critical and major non-compliance notifications(Percentage of critical and major non-compliance notifications that are followed up by Council)
[Number of critical non-compliance notifications and major non-compliance notifications about a food premises followed up / Number of critical non-compliance notifications and major non-compliance notifications about food premises] x100
Chartered Accountants Australia and New ZealandVictorian City Council Model Budget – 2017/18 25

2.7 Performance Statement6-10
The service performance indicators detailed in the preceding pages will be reported on in the Performance Statement which is prepared at the end of the year as required by Section 132 of the Act and included in the 2017/18 Annual Report. The Performance Statement will also include reporting on prescribed indicators of financial performance (outlined in Section 8) and sustainable capacity, which are not included in this budget report. The prescribed performance indicators contained in the Performance Statement are audited each year by the Victorian Auditor General who issues an audit opinion on the Performance Statement. The major initiatives detailed in the preceding pages will be reported in the Annual Report in the form of a statement of progress in the Report of Operations.
2.8 Reconciliation with budgeted operating result11
Net Cost(Revenue) Expenditure Revenue
$’000 $’000 $’000Advocacy and leadership 3,302 3,552 250Community and economic development 12,455 25,079 12,624Community participation 537 537 0Resource management 5,656 9,902 4,246Quality service 2,720 2,720 0Urban development and environment 17,934 21,565 3,631
Total services and initiatives 42,604 63,355 20,751Other non-attributable 6,085Deficit before funding sources 48,689Funding sourcesRates and charges 43,457Capital grants 6,277Total funding sources 49,734Surplus for the year 1,045
Chartered Accountants Australia and New ZealandVictorian City Council Model Budget – 2017/18 26
3. Financial statements1-4
This section presents information in regard to the Financial Statements and Statement of Human Resources. The budget information for the years 2017/18 to 2020/21 has been extracted from the Strategic Resource Plan.
This section includes the following financial statements in accordance with the Local Government Act 1989 and the Local Government Model Financial Report:3.1 Comprehensive Income Statement3.2 Balance Sheet3.3 Statement of Changes in Equity3.4 Statement of Cash Flows3.5 Statement of Capital Works3.6 Statement of Human Resources
Chartered Accountants Australia and New ZealandVictorian City Council Model Budget – 2017/18 27

Comprehensive Income Statement For the four years ending 30 June 2021 Forecast
ActualBudget Strategic Resource Plan
Projections 2016/17 2017/18 2018/19 2019/20 2020/21 $’000 $’000 $’000 $’000 $’000Income Rates and charges 41,685 43,457 46,273 48,725 51,263Statutory fees and fines 2,445 2,690 2,818 2,785 2,834User fees 6,708 7,680 7,828 8,004 8,184Grants - Operating 14,523 13,617 13,604 13,746 13,987Grants - Capital 2,903 6,277 9,407 1,694 1,367Contributions - monetary 661 51 471 370 350Contributions - non-monetary 0 0 0 0 0Net gain/(loss) on disposal of property, infrastructure, plant and equipment
823 539 479 488 497
Fair value adjustments for investment property
0 0 0 0 0
Share of net profits/(losses) of associates and joint ventures
0 0 0 0 0
Other income 2,823 3,263 2,734 2,782 2,830Total income 72,571 77,574 83,614 78,594 81,312 Expenses Employee costs 31,541 34,091 35,367 36,655 37,711Materials and services 22,937 22,107 21,847 21,999 22,810Bad and doubtful debts 314 340 348 356 364Depreciation and amortisation 14,034 14,500 15,187 15,744 16,274Borrowing costs 380 312 247 410 340Other expenses 5,287 5,179 5,220 5,184 5,383Total expenses 74,493 76,529 78,216 80,348 82,882 Surplus/(deficit) for the year (1,922) 1,045 5,398 (1,754) (1,570) Other comprehensive income Items that will not be reclassified to surplus or deficit in future periods
Net asset revaluation increment /(decrement)
0 0 0 0 0
Share of other comprehensive income of associates and joint ventures
0 0 0 0 0
Items that may be reclassified to surplus or deficit in future periods(detail as appropriate)
0 0 0 0 0
Total comprehensive result (1,922) 1,045 5,398 (1,754) (1,570)
Chartered Accountants Australia and New ZealandVictorian City Council Model Budget – 2017/18 28

Balance Sheet For the four years ending 30 June 2021 Forecast
ActualBudget Strategic Resource Plan
Projections 2016/17 2017/18 2018/19 2019/20 2020/21 $’000 $’000 $’000 $’000 $’000Assets Current assets Cash and cash equivalents 23,476 12,207 12,428 12,776 13,028Trade and other receivables 5,272 5,367 5,467 5,567 5,667Other financial assets 6 6 6 6 6Inventories 0 0 0 0 0Non-current assets classified as held for sale
0 0 0 0 0
Other assets 1,440 200 200 200 200Total current assets 30,194 17,780 18,101 18,549 18,901 Non-current assets Trade and other receivables 206 12 12 12 12Investments in associates and joint ventures
0 0 0 0 0
Property, infrastructure, plant & equipment 501,795 514,527 518,681 517,558 514,586Investment property 0 0 0 0 0Intangible assets 0 0 0 0 0Total non-current assets 502,001 514,539 518,693 517,570 514,598Total assets 532,195 532,319 536,794 536,119 533,499 Liabilities Current liabilities Trade and other payables 5,880 5,880 5,880 5,880 5,880Trust funds and deposits 0 0 0 0 0Provisions 5,510 5,714 5,917 6,121 6,326Interest-bearing loans and borrowings 1,161 1,161 1,161 1,290 1,322Total current liabilities 12,551 12,755 12,958 13,291 13,528 Non-current liabilities Provisions 972 1,008 1,043 1,079 1,114Interest-bearing loans and borrowings 4,887 3,726 2,565 3,275 1,953Total non-current liabilities 5,859 4,734 3,608 4,354 3,067Total liabilities 18,410 17,489 16,566 17,645 16,595Net assets 513,785 514,830 520,228 518,474 516,904
Equity Accumulated surplus 398,518 407,910 413,228 411,392 409,742Reserves 115,267 106,920 107,000 107,082 107,162Total equity 513,785 514,830 520,228 518,474 516,904
Chartered Accountants Australia and New ZealandVictorian City Council Model Budget – 2017/18 29

Statement of Changes in Equity For the four years ending 30 June 2021
TotalAccumulated
SurplusRevaluation
ReserveOther
Reserves $’000 $’000 $’000 $’0002018 Balance at beginning of the financial year 513,785 398,518 102,118 13,149Surplus/(deficit) for the year 1,045 1,045 - -Net asset revaluation increment/(decrement) - - - -Transfer to other reserves - (2,001) - 2,001Transfer from other reserves - 10,348 - (10,348)Balance at end of the financial year 514,830 407,910 102,118 4,802 2019 Balance at beginning of the financial year 514,830 407,910 102,118 4,802Surplus/(deficit) for the year 5,398 5,398 - -Net asset revaluation increment/(decrement) - - - -Transfer to other reserves - (1,510) - 1,510Transfer from other reserves - 1,430 - (1,430)Balance at end of the financial year 520,228 413,228 102,118 4,882 2020 Balance at beginning of the financial year 520,228 413,228 102,118 4,882Surplus/(deficit) for the year (1,754) (1,754) - -Net asset revaluation increment/(decrement) - - - -Transfer to other reserves - (1,450) - 1,452Transfer from other reserves - 1,370 - (1,370)Balance at end of the financial year 518,474 411,392 102,118 4,964 2021 Balance at beginning of the financial year 518,474 411,392 102,118 4,964Surplus/(deficit) for the year (1,570) (1,570) - -Net asset revaluation increment/(decrement) - - - -Transfer to other reserves - (1,410) - 1,410Transfer from other reserves - 1,330 - (1,330)Balance at end of the financial year 516,904 409,742 102,118 5,044
Chartered Accountants Australia and New ZealandVictorian City Council Model Budget – 2017/18 30

Statement of Cash Flows For the four years ending 30 June 2021 Forecast
ActualBudget Strategic Resource Plan
Projections 2016/17 2017/18 2018/19 2019/20 2020/21 $’000 $’000 $’000 $’000 $’000 Inflows Inflows Inflows Inflows Inflows (Outflows
)(Outflows) (Outflows) (Outflows
)(Outflows)
Cash flows from operating activities Rates and charges 41,900 43,357 46,173 48,625 51,163Statutory fees and fines 2,195 2,690 2,818 2,785 2,834User fees 7,359 7,680 7,828 8,004 8,184Grants - operating 13,313 13,617 13,604 13,746 13,987Grants - capital 2,903 6,277 9,407 1,694 1,367Contributions - monetary 661 51 471 370 350Interest received 2,044 1,820 1,264 1,278 1,292Dividends received 0 0 0 0 0Trust funds and deposits taken 50 0 0 0 0Other receipts 2,511 1,443 1,469 1,503 1,538Net GST refund / payment 0 0 0 0 0Employee costs (31,185) (33,841) (35,117) (36,405) (37,461)Materials and services (24,043) (22,106) (21,848) (21,999) (22,810)Trust funds and deposits repaid 0 0 0 0 0Other payments (5,786) (5,529) (5,577) (5,549) (5,757)Net cash provided by/(used in) operating activities 11,922 15,459 20,492 14,052 14,687
Cash flows from investing activities Payments for property, infrastructure, plant and equipment
(21,007) (29,195) (20,881) (16,169) (14,859)
Proceeds from sale of property, infrastructure, plant and equipment
1,664 3,741 2,018 2,036 2,054
Payments for investments 0 0 0 0 0Proceeds from sale of investments 0 0 0 0 0Loan and advances made 0 0 0 0 0Payments of loans and advances 10 199 0 0 0Net cash provided by/ (used in) investing activities (19,333) (25,255) (18,863) (14,133) (12,805)
Cash flows from financing activities Finance costs (380) (312) (247) (410) (340)Proceeds from borrowings 0 0 0 2,000 0Repayment of borrowings (1,161) (1,161) (1,161) (1,161) (1,290)Net cash provided by/(used in) financing activities
(1,541) (1,473) (1,408) 429 (1,630)
Net increase/(decrease) in cash & cash equivalents
(8,952) (11,269) 221 348 252
Cash and cash equivalents at the beginning of the financial year
32,428 23,476 12,207 12,428 12,776
Cash and cash equivalents at the end of the financial year
23,476 12,207 12,428 12,776 13,028
Chartered Accountants Australia and New ZealandVictorian City Council Model Budget – 2017/18 31

Statement of Capital Works For the four years ending 30 June 2021 Forecast
ActualBudget Strategic Resource Plan
Projections 2016/17 2017/18 2018/19 2019/20 2020/21 $’000 $’000 $’000 $’000 $’000Property Land 0 0 0 0 0Land improvements 0 0 0 0 0Total land 0 0 0 0 0Buildings 10,678 13,368 10,114 8,064 7,550Heritage buildings 0 0 0 0 0Building improvements 75 117 89 71 66Leasehold improvements 0 0 0 0 0Total buildings 10,753 13,485 10,203 8,135 7,616Total property 10,753 13,485 10,203 8,135 7,616Plant and equipment Heritage plant and equipment 0 0 0 0 0Plant, machinery and equipment 2,093 3,179 2,406 1,917 1,796Fixtures, fittings and furniture 0 0 0 0 0Computers and telecommunications 1,687 2,112 1,598 1,274 1,193Library books 318 500 378 302 282Total plant and equipment 4,098 5,791 4,382 3,493 3,271Infrastructure Roads 3,598 5,367 4,061 3,239 3,031Bridges 6 10 8 6 6Footpaths and cycleways 577 681 515 411 385Drainage 1,301 1,885 1,426 1,137 1,065Recreational, leisure and community facilities 405 629 476 379 355
Waste management 0 0 0 0 0Parks, open space and streetscapes 1,686 2,614 1,978 1,577 1,476Aerodromes 0 0 0 0 0Off street car parks 88 115 87 69 65Other infrastructure 105 140 106 84 79Total infrastructure 7,766 11,441 8,657 6,902 6,462Total capital works expenditure 22,617 30,717 23,242 18,530 17,349 Represented by: New asset expenditure 6,850 9,176 5,767 3,296 2,791Asset renewal expenditure 12,225 17,454 15,928 13,145 13,560Asset expansion expenditure 2,190 3,455 702 857 268Asset upgrade expenditure 1,352 632 845 1,232 730Total capital works expenditure 22,617 30,717 23,242 18,530 17,349
Chartered Accountants Australia and New ZealandVictorian City Council Model Budget – 2017/18 32

Statement of Human Resources For the four years ending 30 June 2021 Forecast
ActualBudget Strategic Resource Plan
Projections 2016/17 2017/18 2018/19 2019/20 2020/21 $’000 $’000 $’000 $’000 $’000Staff expenditure Employee costs - operating 31,541 34,091 35,367 36,655 37,711Employee costs - capital 0 0 0 0 0Total staff expenditure 31,541 34,091 35,367 36,655 37,711 EFT EFT EFT EFT EFTStaff numbers Employees 567.4 568.7 570.2 573.4 575Total staff numbers 567.4 568.7 570.2 573.4 575
A summary of human resources expenditure categorised according to the organisational structure of Council is included below:
Comprises
Department
Budget2017/18
$’000
PermanentFull time
$’000
Permanent Part Time
$’000Asset Management 2,500 2,000 500 City Services 7,200 7,000 200 Community Services 8,500 7,000 1,500 Corporate Services 4,400 4,000 400 Culture and Leisure 5,300 5,000 300 Environment and Amenity 1,900 1,000 900 Strategy and Governance 3,100 3,000 100Total permanent staff expenditure 32,900 29,000 3,900 Casuals and other expenditure 1,191Capitalised Labour costs 0Total expenditure 34,091
A summary of the number of full time equivalent (FTE) Council staff in relation to the above expenditure is included below:
Comprises
DepartmentBudget
FTEPermanent
Full time Permanent
Part Time
Asset Management 41.6 33.3 8.3City Services 120.0 116.7 3.3Community Services 141.7 116.7 25.0Corporate Services 73.4 66.7 6.7Culture and Leisure 88.3 83.3 5.0Environment and Amenity 31.7 16.7 15.0Strategy and Governance 52.1 50.4 1.7Total permanent staff 548.8 483.8 65.0Casuals and other 19.9Capitalised Labour costs 0.0Total staff 568.7
Chartered Accountants Australia and New ZealandVictorian City Council Model Budget – 2017/18 33

4. Financial performance indicators 6-7
The following table highlights Council’s current and projected performance across a range of key financial performance indicators. These indicators provide a useful analysis of Council’s financial position and performance and should be interpreted in the context of the organisation’s objectives.
Indicator Measure
Not
es Actual Forecast Budget Strategic Resource Plan
Projections Trend2015/16 2016/17 2017/18 2018/19 2019/20 2020/21 +/o/-
Operating position Adjusted underlying result Adjusted underlying surplus (deficit) / Adjusted
underlying revenue1 (1.3%) (6.7%) (6.2%) (4.9%) (3.8%) (3.0%) +
LiquidityWorking Capital
Current assets / current liabilities 2 220.3% 240.6% 139.4% 139.7% 139.6% 139.7% o
Unrestricted cashUnrestricted cash / current liabilities 101.0% 127.2% 88.7% 95.9% 96.1% 96.3% o
ObligationsLoans and borrowings Interest bearing loans and borrowings / rate
revenue3 12.3% 14.7% 11.2% 8.1% 9.4% 6.4% +
Loans and borrowings Interest and principal repayments on interest bearing loans and borrowings / rate revenue
3.2% 3.7% 3.4% 3.0% 3.2% 3.2% +
Indebtedness Non-current liabilities / own source revenue 9.0% 10.8% 8.2% 6.0% 6.9% 4.7% +
Asset renewal Asset renewal expenses / Asset depreciation 4 102.6% 87.1% 120.4% 104.9% 83.5% 83.3% -
StabilityRates concentration Rate revenue / adjusted underlying revenue 5 56.3% 59.0% 60.3% 62.0% 63.0% 63.7% -
Rates effort Rate revenue / CIV of rateable properties in the municipality
0.4% 0.4% 0.4% 0.4% 0.4% 0.5% o
EfficiencyExpenditure level Total expenses/ no. of property assessments $1,302 $1,318 $1,340 $1,355 $1,377 $1,406 +
Revenue level Residential rate revenue / No. of residential $611 $625 $650 $678 $706 $735 +
Chartered Accountants Australia and New ZealandVictorian City Council Model Budget – 2017/18 34

property assessments
Workforce turnover No. of permanent staff resignations & terminations / average no. of permanent staff for the financial year
9.0% 9.3% 8.8% 8.4% 8.0% 7.6% +
Key to Forecast Trend:+ Forecasts improvement in Council's financial performance/financial position indicatoro Forecasts that Council's financial performance/financial position indicator will be steady - Forecasts deterioration in Council's financial performance/financial position indicator
Notes to indicators
1 Adjusted underlying result – An indicator of the sustainable operating result required to enable Council to continue to provide core services and meet its objectives. Improvement in financial performance expected over the period, although continued losses means reliance on Council's cash reserves or increased debt to maintain services.
2 Working Capital – The proportion of current liabilities represented by current assets. Working capital is forecast to decrease significantly in 2017/18 year due to a run down in cash reserves to fund the capital program. The trend in later years is to remain steady at an acceptable level.
3 Debt compared to rates - Trend indicates Council's reducing reliance on debt against its annual rate revenue through redemption of long term debt.
4 Asset renewal - This percentage indicates the extent of Council's renewal of assets against its depreciation charge (an indication of the decline in value of its existing capital assets). A percentage greater than 100 indicates Council is maintaining its existing assets, while a percentage less than 100 means its assets are deteriorating faster than they are being renewed and future capital expenditure will be required to renew assets.
5 Rates concentration - Reflects extent of reliance on rate revenues to fund all of Council's on-going services. Trend indicates Council will become more reliant on rate revenue compared to all other revenue sources.
Chartered Accountants Australia and New ZealandVictorian City Council Model Budget – 2017/18 35

5. Other budget information (required by the Regulations)This section presents other budget related information required by the Regulations
This section includes the following statements and reports:5.1.1 Grants operating5.2.1 Grants capital5.1.3 Statement of borrowings
Chartered Accountants Australia and New ZealandVictorian City Council Model Budget – 2017/18 36

5.1.1 Grants - operating ($0.91 million decrease)Operating grants include all monies received from State and Federal sources for the purposes of funding the delivery of Council’s services to ratepayers. Overall, the level of operating grants is projected to decrease by 6.2% or $0.91 million compared to 2016/17. A list of operating grants by type and source, classified into recurrent and non-recurrent, is included below.
Operating Grants
ForecastActual
2016/17$’000
Budget2017/18
$’000
Variance
$’000Recurrent - Commonwealth Government Victoria Grants Commission 7,191 6,779 (412)Family day care 365 522 157 General home care 2,930 3,165 235 Other 600 400 (200)Recurrent - State GovernmentPrimary care partnerships 80 240 160 Aged care 125 265 140 School crossing supervisors 240 240 -Libraries 200 200 -Maternal and child health 230 230 -Recreation 200 200 -Community safety 150 150 -Other 1,262 226 (1,036)Total recurrent grants 13,573 12,617 (956)
Non-recurrent - Commonwealth GovernmentDrainage maintenance 500 - (500)Environmental planning - 500 500Non-recurrent - State GovernmentCommunity health 450 - (450)Family and children - 500 500Total non-recurrent grants 950 1,000 50Total operating grants 14,523 13,617 (906)
Chartered Accountants Australia and New ZealandVictorian City Council Model Budget – 2017/18 37

5.1.2 Grants - capital ($3.37 million increase)Capital grants include all monies received from State, Federal and community sources for the purposes of funding the capital works program. Overall the level of capital grants has increased by 116.2% or $3.37 million compared to 2016/17 due mainly to specific funding for some large capital works projects. Section 6. “Analysis of Capital Budget” includes a more detailed analysis of the grants and contributions expected to be received during the 2017/18 year. A list of capital grants by type and source, classified into recurrent and non-recurrent, is included below.
Capital Grants
ForecastActual
2016/17$’000
Budget2017/18
$’000
Variance
$’000Recurrent - Commonwealth Government Roads to recovery 810 830 20Recurrent - State Government - - -Total recurrent grants 810 830 20Non-recurrent - Commonwealth GovernmentBuildings 1,500 2,000 500Plant and machinery - 435 435Drainage 593 560 (33)Footpaths - 161 161Non-recurrent - State GovernmentBuildings - 2,291 2,291Total non-recurrent grants 2,093 5,447 3,354Total capital grants 2,903 6,277 3,374
5.1.3 Statement of Borrowings
The table below shows information on borrowings specifically required by the Regulations.
2016/17 2017/18
$ $Total amount borrowed as at 30 June of the prior year 7,209,000 6,048,000Total amount proposed to be borrowed 0 0Total amount projected to be redeemed (1,161,000) (1,161,000) Total amount of borrowings as at 30 June 6,048,000 4,887,000
Chartered Accountants Australia and New ZealandVictorian City Council Model Budget – 2017/18 38

6. Detailed list of Capital Works
This section presents a listing of the capital works projects that will be undertaken for the 2017/18 year.
The capital works projects are grouped by class and include the following: New works for 2017/18 Works carried forward from the 2016/17 year.
Chartered Accountants Australia and New ZealandVictorian City Council Model Budget – 2017/18 39

Capital works programFor the year ending 30 June 2018
6.1 New works
Asset expenditure types Summary of Funding sources
Capital Works AreaProject
CostNew Renewal Upgrade Expansi
on GrantsContribu
tionsCouncil
CashBorrowi
ngs $’000 $’000 $’000 $’000 $’000 $’000 $’000 $'000 $'000PROPERTY
Land 0 0 0 0 0 0 0 0 0
Land Improvements 0 0 0 0 0 0 0 0 0
Buildings Community facilities: Victorian Community Facility 1,200 1,200 0 0 0 68 0 1,132 0Sports facilities: Velodrome / State Bowls Centre 4,000 4,000 0 0 0 4,000 0 0 0Victorian library concept plan 90 90 0 0 0 10 0 80 0Community facilities 1,127 0 1,127 0 0 0 0 1,127 0Municipal offices 529 0 529 0 0 0 0 529 0Sports facilities 166 0 166 0 0 30 0 136 0Pavilions 320 0 320 0 0 0 0 320 0Other buildings 882 0 882 0 0 0 0 882 0Total Buildings 8,314 5,290 3,024 0 0 4,108 0 4,206 0
Building ImprovementsMunicipal offices: Depot lift 117 117 0 0 0 0 0 117 0Total Building Improvements 117 117 0 0 0 0 0 117 0
Leasehold Improvements 0 0 0 0 0 0 0 0 0
Heritage buildings 0 0 0 0 0 0 0 0 0
TOTAL PROPERTY 8,431 5,407 3,024 0 0 4,108 0 4,323 0
Chartered Accountants Australia and New ZealandVictorian City Council Model Budget – 2017/18 40
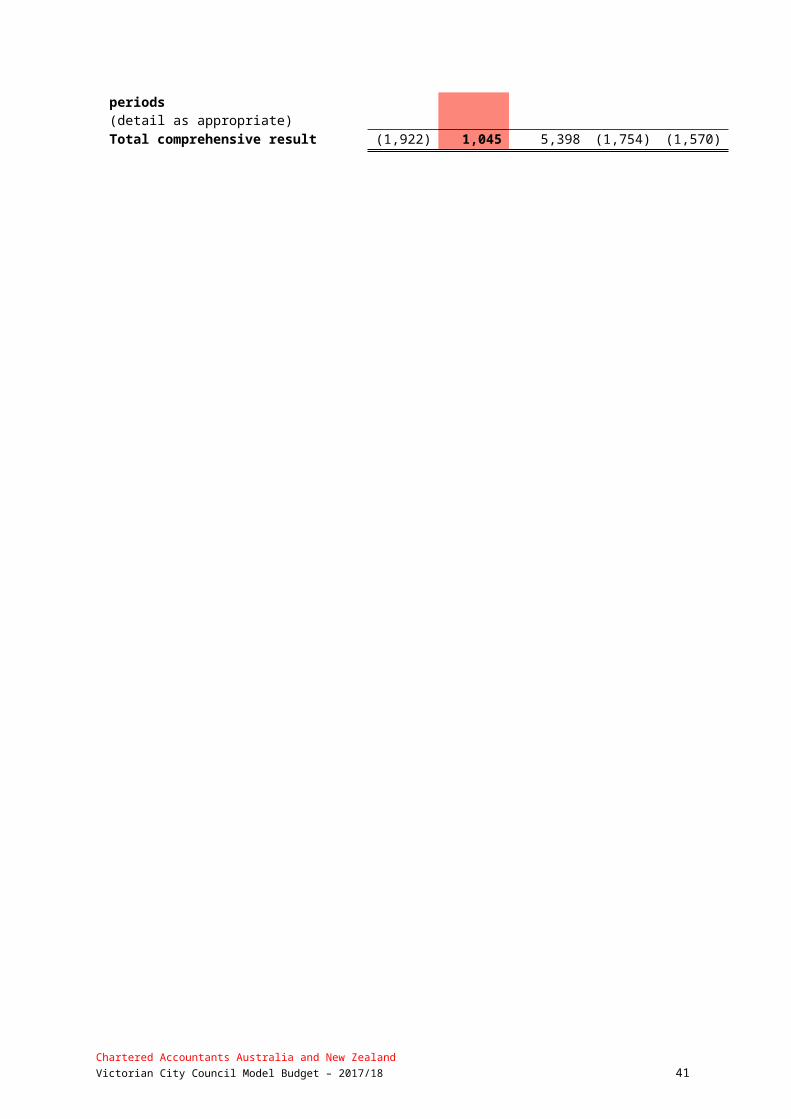
Asset expenditure types Summary of Funding sources
Capital Works AreaProject
CostNew Renewal Upgrade Expansi
on GrantsContribu
tionsCouncil
CashBorrowi
ngs $’000 $’000 $’000 $’000 $’000 $’000 $’000 $'000 $'000PLANT AND EQUIPMENT
Plant, Machinery and EquipmentMotor vehicles and plant 3,021 0 3,021 0 0 435 0 2,586 0Total Plant, Machinery and Equipment 3,021 0 3,021 0 0 435 0 2,586 0
Fixtures, Fittings and Furniture 0 0 0 0 0 0 0 0 0
Computers and TelecommunicationsInformation technology: Asset system 414 414 0 0 0 0 0 414 0Information technology: PCs and servers 550 550 0 0 0 0 0 550 0Information technology: WAN infrastructure 150 150 0 0 0 0 0 150 0Information technology 201 0 201 0 0 0 0 201 0Total Computers and Telecommunications 1,315 1,114 201 0 0 0 0 1,315 0
Heritage Plant and Equipment 0 0 0 0 0 0 0 0 0
Library booksBooks: Product purchases 500 500 0 0 0 0 0 500 0Total library books 500 500 0 0 0 0 0 500 0
TOTAL PLANT AND EQUIPMENT 4,836 1,614 3,222 0 0 435 0 4,401 0
INFRASTRUCTURE
RoadsLocal road: Northfield Plaza 60 60 0 0 0 0 0 60 0Carpark: Northfield Leisure Centre 55 55 0 0 0 0 0 55 0Traffic devices: Bestings to James 80 80 0 0 0 0 0 80 0Local roads 1,116 0 1,116 0 0 0 0 1,116 0Program works 797 0 797 0 0 0 0 797 0Declared main roads 368 0 368 0 0 0 0 368 0Traffic devices 506 0 506 0 0 0 0 506 0
Chartered Accountants Australia and New ZealandVictorian City Council Model Budget – 2017/18 41

Asset expenditure types Summary of Funding sources
Capital Works AreaProject
CostNew Renewal Upgrade Expansi
on GrantsContribu
tionsCouncil
CashBorrowi
ngs $’000 $’000 $’000 $’000 $’000 $’000 $’000 $'000 $'000Street lighting 20 0 20 0 0 0 0 20 0Traffic signals 75 0 75 0 0 0 0 75 0Integrated transport plan 220 0 220 0 0 0 0 220 0Roads to recovery 808 0 808 0 0 808 0 0 0Pedestrian safety 85 0 85 0 0 0 0 85 0Parking 80 0 80 0 0 0 0 80 0Traffic investigations 70 0 70 0 0 0 0 70 0Local road: Benjamin to High 200 0 0 100 100 0 0 200 0Local road: Pinders to Archfield 300 0 0 150 150 0 0 300 0Local road: David to Portmouth 110 0 0 55 55 0 0 110 0Total Roads 4,950 195 4,145 305 305 808 0 4,142 0
BridgesBridges and culverts 10 0 10 0 0 0 0 10 0Total Bridges 10 0 10 0 0 0 0 10 0
Footpaths and CyclewaysFootpath: James to High 25 25 0 0 0 0 0 25 0Footpath: Lanham to Elm 15 15 0 0 0 0 0 15 0Footpath: Watt to Clapam 20 20 0 0 0 0 0 20 0Footpath: Wembley to Jet 20 20 0 0 0 0 0 20 0Footpaths 173 0 173 0 0 0 0 173 0Bike paths 94 0 94 0 0 0 0 94 0Total Footpaths and Cycleways 347 80 267 0 0 0 0 347 0
DrainageStorm water trap: Muddy Creek 40 40 0 0 0 0 0 40 0Drains - roads 570 0 570 0 0 0 0 570 0Retarding basins 500 0 500 0 0 430 0 70 0Waterways 20 0 20 0 0 0 0 20 0Water quality 220 0 220 0 0 0 0 220 0Road drain: Burke stage 1 and 2 300 0 0 150 150 0 0 300 0Total Drainage 1,650 40 1,310 150 150 430 0 1,220 0
Chartered Accountants Australia and New ZealandVictorian City Council Model Budget – 2017/18 42

Asset expenditure types Summary of Funding sources
Capital Works AreaProject
CostNew Renewal Upgrade Expansi
on GrantsContribu
tionsCouncil
CashBorrowi
ngs $’000 $’000 $’000 $’000 $’000 $’000 $’000 $'000 $'000
Recreational, Leisure & Community FacilitiesPlaying surfaces: Training lights 91 91 0 0 0 0 0 91 0Playground equipment: Victoria Park 170 170 0 0 0 0 0 170 0Irrigation systems: Victoria Park 358 358 0 0 0 0 0 358 0Total Recreation, Leisure and Community Facilities 619 619 0 0 0 0 0 619 0
Waste Management 0 0 0 0 0 0 0 0 0
Parks, Open Space and StreetscapesParks 2,083 0 2,083 0 0 0 0 2,083 0Streetscapes 25 0 25 0 0 0 0 25 0Trees 380 0 380 0 0 0 0 380 0Other open space 76 0 76 0 0 0 0 76 0Total Parks, Open Space and Streetscapes 2,564 0 2,564 0 0 0 0 2,564 0
Aerodromes 0 0 0 0 0 0 0 0 0
Off Street Car ParksCar parks 80 0 80 0 0 0 0 80 0Total Off Street Car Parks 80 0 80 0 0 0 0 80 0
Other InfrastructurePublic art: Municipal square 105 105 0 0 0 35 0 70 0Total Other Infrastructure 105 105 0 0 0 35 0 70 0
TOTAL INFRASTRUCTURE 10,325 1,039 8,376 455 455 1,273 0 9,052 0
TOTAL NEW CAPITAL WORKS 2017/18 23,592 8,060 14,622 455 455 5,816 0 17,776 0
Chartered Accountants Australia and New ZealandVictorian City Council Model Budget – 2017/18 43

6.2 Works carried forward from the 2016/17 year
Asset expenditure types Funding sources
Capital Works AreaProject
CostNew Renewal Upgrade Expansi
on GrantsContribu
tionsCouncil
CashBorrowi
ngs $’000 $’000 $’000 $’000 $’000 $’000 $’000 $'000 $'000PROPERTY
Land 0 0 0 0 0 0 0 0 0Land Improvements 0 0 0 0 0 0 0 0 0Total Land 0 0 0 0 0 0 0 0 0
Buildings Municipal Offices: Civic Precinct 752 752 0 0 0 0 0 752 0Community facilities 300 0 300 0 0 20 0 280 0Municipal offices 490 0 490 0 0 150 0 340 0Sports facilities 215 0 215 0 0 0 0 215 0Other buildings 297 0 297 0 0 0 0 297 0Community facilities: Newlands Centre 3,000 0 0 0 3,000 0 0 3,000Total Buildings 5,054 752 1,302 0 3,000 170 0 4,884 0
Building Improvements 0 0 0 0 0 0 0 0 0
Leasehold Improvements 0 0 0 0 0 0 0 0 0
Heritage buildings 0 0 0 0 0 0 0 0 0
TOTAL PROPERTY 5,054 752 1,302 0 3,000 170 0 4,884 0
PLANT AND EQUIPMENT
Plant, Machinery and EquipmentMotor vehicles and plant 158 0 158 0 0 0 0 158 0Total Plant, Machinery and Equipment 158 0 158 0 0 0 0 158 0
Chartered Accountants Australia and New ZealandVictorian City Council Model Budget – 2017/18 44

Asset expenditure types Funding sources
Capital Works AreaProject
CostNew Renewal Upgrade Expansi
on GrantsContribu
tionsCouncil
CashBorrowi
ngs $’000 $’000 $’000 $’000 $’000 $’000 $’000 $'000 $'000Fixtures, Fittings and Furniture 0 0 0 0 0 0 0 0 0
Computers and TelecommunicationsInformation technology: PCs and servers 319 319 0 0 0 0 0 319 0Information technology 478 0 478 0 0 0 0 478 0Total Computers and Telecommunications 797 319 478 0 0 0 0 797 0
Heritage Plant and Equipment 0 0 0 0 0 0 0 0 0
Library books 0 0 0 0 0 0 0 0 0
TOTAL PLANT AND EQUIPMENT 955 319 636 0 0 0 0 955 0
INFRASTRUCTURE
RoadsLocal roads 151 0 151 0 0 0 0 151 0Traffic devices 60 0 60 0 0 0 0 60 0Integrated transport plan 77 0 77 0 0 0 0 77 0Local road: Johnson to Bates 129 0 0 129 0 0 0 129 0Total Roads 417 0 288 129 0 0 0 417 0
Bridges 0 0 0 0 0 0 0 0 0
Footpaths and CyclewaysFootpaths 63 0 63 0 0 0 0 63 0Bike paths 271 0 271 0 0 161 0 110 0Total Footpaths and Cycleways 334 0 334 0 0 161 0 173 0
DrainageDrains - roads 37 0 37 0 0 0 0 37 0Waterways 150 0 150 0 0 130 0 20 0Road drain: Grange final stage 48 0 0 48 0 0 0 48 0
Chartered Accountants Australia and New ZealandVictorian City Council Model Budget – 2017/18 45

Asset expenditure types Funding sources
Capital Works AreaProject
CostNew Renewal Upgrade Expansi
on GrantsContribu
tionsCouncil
CashBorrowi
ngs $’000 $’000 $’000 $’000 $’000 $’000 $’000 $'000 $'000Total Drainage 235 0 187 48 0 130 0 105 0
Recreational, Leisure & Community FacilitiesPlaying surfaces: Training lights 10 10 0 0 0 0 0 10 0Total Recreation, Leisure and Comm Facilities 10 10 0 0 0 0 0 10 0
Waste Management 0 0 0 0 0 0 0 0 0
Parks, Open Space and StreetscapesParks 50 0 50 0 0 0 0 50 0Total Parks, Open Space and Streetscapes 50 0 50 0 0 0 0 50 0
Aerodromes 0 0 0 0 0 0 0 0 0
Off Street Car ParksCar parks 35 0 35 0 0 0 0 35 0Total Off Street Car Parks 35 0 35 0 0 0 0 35 0
Other InfrastructurePublic art: Northfield shopping centre 35 35 0 0 0 0 0 35 0Total Other Infrastructure 35 35 0 0 0 0 0 35 0
TOTAL INFRASTRUCTURE 1,116 45 894 177 0 291 0 825 0
TOTAL CARRIED FORWARD CAPITAL WORKS 2016/17 7,125 1,116 2,832 177 3,000 461 0 6,664 0
Chartered Accountants Australia and New ZealandVictorian City Council Model Budget – 2017/18 46

6.3 Summary
Asset expenditure types Funding sources
Capital Works AreaProject
CostNew Renewal Upgrade Expansi
on GrantsContribu
tionsCouncil
CashBorrowi
ngs $’000 $’000 $’000 $’000 $’000 $’000 $’000 $'000 $'000
PROPERTY 13,485 6,159 4,326 0 3,000 4,278 0 9,207 0PLANT AND EQUIPMENT 5,791 1,933 3,858 0 0 435 0 5,356 0INFRASTRUCTURE 11,441 1,084 9,270 632 455 1,564 0 9,877 0TOTAL 30,717 9,176 17,454 632 3,455 6,277 0 24,440 0
Chartered Accountants Australia and New ZealandVictorian City Council Model Budget – 2017/18 47

7. Rates and charges1-7
This section presents information about rates and charges which the Act and the Regulations require to be disclosed in the Council’s annual budget.
Chartered Accountants Australia and New ZealandVictorian City Council Model Budget – 2017/18 48

7. Rates and charges
In developing the Strategic Resource Plan (referred to in Section 14.), rates and charges were identified as an important source of revenue, accounting for 56.8% of the total revenue received by Council annually. Planning for future rate increases has therefore been an important component of the Strategic Resource Planning process. The State Government have introduced the Fair Go Rates System (FGRS) which sets out the maximum amount councils may increase rates in a year. For 2017/18 the FGRS cap has been set at 2.0%. The cap applies to both general rates and municipal charges and is calculated on the basis of council’s average rates and charges.
The level of required rates and charges has been considered in this context, with reference to Council's other sources of income and the planned expenditure on services and works to be undertaken for the Victorian community.
In order to achieve these objectives while maintaining service levels and a strong capital expenditure program, the average general rate and the municipal charge will increase by 2.0% in line with the rate cap, the kerbside collection charge by 3.9% and the recycling charge by 5.3%. This will raise total rates and charges for 2017/18 of $43.46 million, including $0.98 million generated from supplementary rates. Council’s municipal and recycling charges have increased by more than the general rate due to an increase in administrative costs (municipal charge) and renegotiation of council’s collection services contract (recycling).
7.1 The rate in the dollar to be levied as general rates under Section 158 of the Act for each type or class of land compared with the previous financial year
Type or class of land 2016/17 2017/18cents/$CIV cents/$CIV Change
General rate for rateable residential properties 0.248354 0.253422 2.0%General rate for rateable commercial properties 0.434116 0.442976 2.0%General rate for rateable industrial properties 0.434116 0.442976 2.0%
7.2 The estimated total amount to be raised by general rates in relation to each type or class of land, and the estimated total amount to be raised by general rates, compared with the previous financial year
Type or class of land 2016/17 2017/18$’000 $’000 Change
Residential 22,159 22,875 3.2%Commercial 4,126 4,159 0.8%Industrial 3,576 3,605 0.8%Total amount to be raised by general rates 29,861 30,639 2.6%
7.3 The number of assessments in relation to each type or class of land, and the total number of assessments, compared with the previous financial year.
Type or class of land 2016/17 2017/18Number Number Change
Residential 51,909 52,584 1.3%Commercial 2,496 2,428 -2.7%Industrial 2,086 2,086 -Total number of assessments 56,491 57,098 1.1%
7.4 The basis of valuation to be used is the Capital Improved Value (CIV)
Chartered Accountants Australia and New ZealandVictorian City Council Model Budget – 2017/18 49
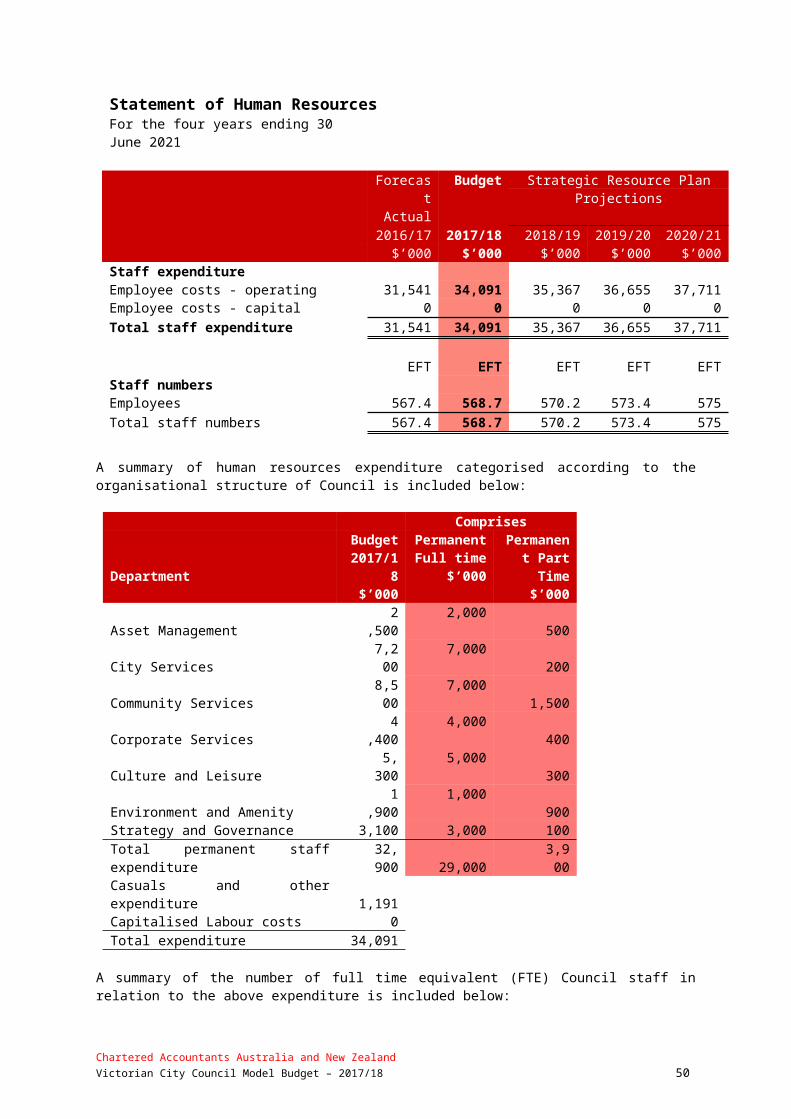
7.5 The estimated total value of each type or class of land, and the estimated total value of land, compared with the previous financial year
Type or class of land 2016/17 2017/18 Change $’000 $’000
Residential 8,922,250 9,026,652 1.2%Commercial 950,527 939,012 -1.2%Industrial 823,806 813,825 -1.2%Total value of land 10,696,583 10,779,490 0.8%
7.6 The municipal charge under Section 159 of the Act compared with the previous financial year
Per Rateable Property
Per Rateable Property
Type of Charge 2016/17 2017/18 Change $ $
Municipal 105 107 1.9%
7.7 The estimated total amount to be raised by municipal charges compared with the previous financial year
Type of Charge 2016/17 2017/18 Change$ $
Municipal 5,988 6,111 2.0%
7.8 The rate or unit amount to be levied for each type of service rate or charge under Section 162 of the Act compared with the previous financial year
Per Rateable
PropertyPer Rateable
Property Type of Charge 2016/17 2017/18 Change
$ $Kerbside collection 77 80 3.9%Recycling 19 20 5.3%Total 96 100 4.2%
7.9 The estimated total amount to be raised by each type of service rate or charge, and the estimated total amount to be raised by service rates and charges, compared with the previous financial year
Type of Charge 2016/17 2017/18 Change $ $
Kerbside collection 4,349 4,569 5.0%Recycling 1,007 1,142 13.4%Total 5,356 5,711 6.6%
7.10 The estimated total amount to be raised by all rates and charges compared with the previous financial year
2016/17 2017/18 Change $’000 $’000
General rates 29,861 30,639 2.6%Municipal charge 5,988 6,111 2.0%Kerbside collection and Recycling 5,356 5,711 6.6%Cultural and Creational Charges - in lieu of rates 14 15
1.9%
Supplementary rates and charges 465 981 111.1%Total Rates and charges 41,684 43,457 3.6%
Chartered Accountants Australia and New ZealandVictorian City Council Model Budget – 2017/18 50

7.11 Any significant changes that may affect the estimated amounts to be raised by rates and charges
There are no known significant changes which may affect the estimated amounts to be raised by rates and charges. However, the total amount to be raised by rates and charges may be affected by:
The making of supplementary valuations (2017/18: estimated $981,000 and 2016/17: $465,000) The variation of returned levels of value (e.g. valuation appeals) Changes of use of land such that rateable land becomes non-rateable land and vice versa Changes of use of land such that residential land becomes business land and vice versa.
7.12 Differential rates 5-7
Rates to be levied
The rate and amount of rates payable in relation to land in each category of differential are: A general rate of 0.253422% (0.248354 cents in the dollar of CIV) for all rateable residential
properties A general rate of 0.442976% (0.434116 cents in the dollar of CIV) for all rateable commercial and
industrial properties.
Each differential rate will be determined by multiplying the Capital Improved Value of rateable land (categorised by the characteristics described below) by the relevant percentages indicated above.
Council believes each differential rate will contribute to the equitable and efficient carrying out of council functions. Details of the objectives of each differential rate, the types of classes of land which are subject to each differential rate and the uses of each differential rate are set out below.
Commercial land
Commercial land is any land which is: Occupied for the principal purpose of carrying out the manufacture or production of, or trade in,
goods or services; or Unoccupied but zoned commercial or industrial under the City of Victoria Planning Scheme.
The objective of this differential rate is to ensure that all rateable land makes an equitable financial contribution to the cost of carrying out the functions of Council, including (but not limited to) the: Construction and maintenance of infrastructure assets Development and provision of health and community services Provision of general support services.
The types and classes of rateable land within this differential rate are those having the relevant characteristics described above.
The money raised by the differential rate will be applied to the items of expenditure described in the Budget by Council. The level of the rate for land in this category is considered to provide for an appropriate contribution to Council’s budgeted expenditure, having regard to the characteristics of the land.
The geographic location of the land within this differential rate is wherever it is located within the municipal district, without reference to ward boundaries.
The use of the land within this differential rate, in the case of improved land, is any use of land.
The characteristics of planning scheme zoning are applicable to the determination of vacant land which will be subject to the rate applicable to commercial land. The vacant land affected by this rate is that which is zoned commercial and/or industrial under the City of Victoria Planning Scheme. The classification of land which is improved will be determined by the occupation of that land, and have reference to the planning scheme zoning.
Chartered Accountants Australia and New ZealandVictorian City Council Model Budget – 2017/18 51

The types of buildings on the land within this differential rate are all buildings already constructed on the land or which will be constructed prior to the expiry of the 2017/18 financial year.
Residential land
Residential land is any land, which is: Occupied for the principal purpose of physically accommodating persons or Unoccupied but zoned residential under the City of Victoria Planning Scheme and which is not
commercial land or industrial land.
The objective of this differential rate is to ensure that all rateable land makes an equitable financial contribution to the cost of carrying out the functions of Council, including (but not limited to) the: Construction and maintenance of infrastructure assets Development and provision of health and community services Provision of general support services.
The types and classes of rateable land within this differential rate are those having the relevant characteristics described above.
The money raised by the differential rate will be applied to the items of expenditure described in the Budget by Council. The level of the rate for land in this category is considered to provide for an appropriate contribution to Council’s budgeted expenditure, having regard to the characteristics of the land.
The geographic location of the land within this differential rate is where it is located within the municipal district, without reference to ward boundaries.
The use of the land within this differential rate, in the case of improved land, is any use of land.
The characteristics of planning scheme zoning are applicable to the determination of vacant land which will be subject to the rate applicable to residential land. The vacant land affected by this rate is that which is zoned residential under the Victorian Local Council Planning Scheme. The classification of land which is improved will be determined by the occupation of that land, and have reference to the planning scheme zoning.
The types of buildings on the land within this differential rate are all buildings which are now constructed on the land or which will be constructed prior to the expiry of the 2017/18 financial year.
7.13 Fair Go Rates System Compliance
Victoria City Council is fully compliant with the State Government’s Fair Go Rates System.
Base Average Rates (2016/2017) $ 631.89
Maximum Rate Increase (set by the State Government) 2.00%
Capped Average Rate (2017/2018) $ 644.52
Maximum General Rates and Municipal Charges Revenue $ 36,801,067
Budgeted General Rates and Municipal Charges Revenue $ 36,750,696
Chartered Accountants Australia and New ZealandVictorian City Council Model Budget – 2017/18 52
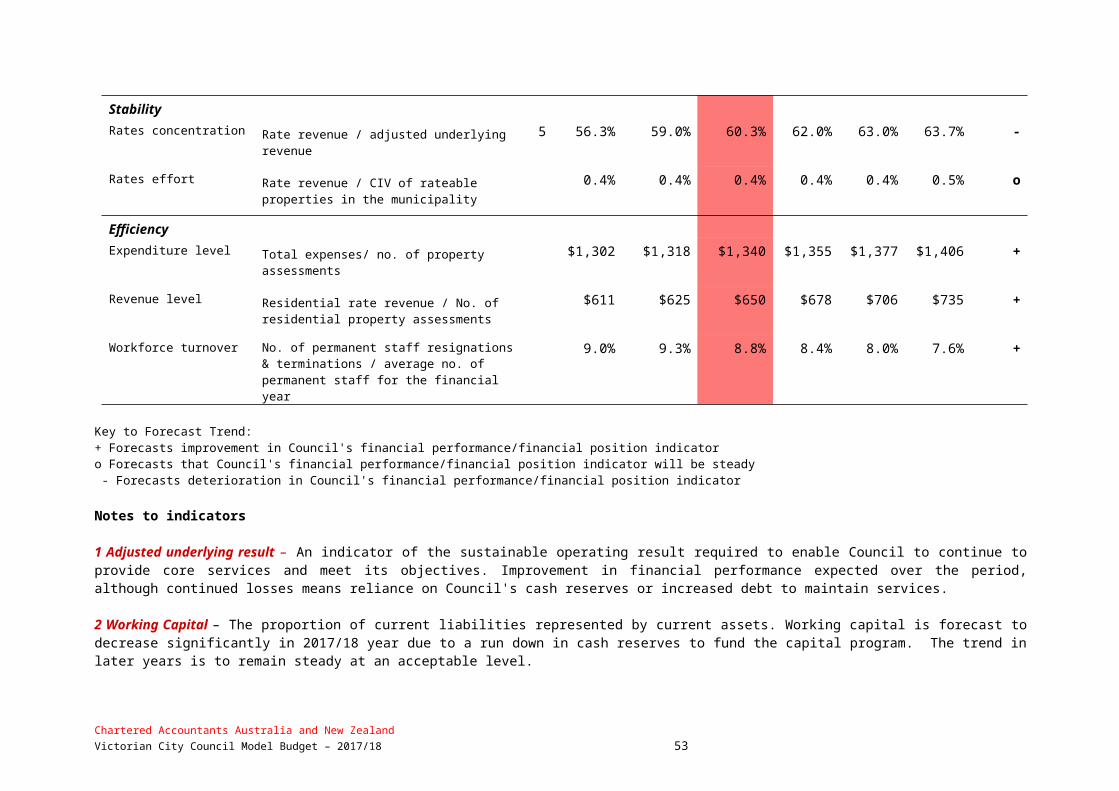
Budget Analysis
The following reports provide detailed analysis to support and explain the budget reports in the previous section.
This section includes the following analysis and information:
8 Summary of financial position9 Budget influences10 Analysis of operating budget11 Analysis of budgeted cash position12 Analysis of capital budget13 Analysis of budgeted financial position14 Strategic resource plan15 Summary of other strategies16 Rating strategy
Chartered Accountants Australia and New ZealandVictorian City Council Model Budget – 2017/18 53
8. Summary of financial position
Council has prepared a Budget for the 2017/18 financial year which seeks to balance the demand for services and infrastructure with the community’s capacity to pay. Key budget information is provided below about the rate increase, operating result, services, cash and investments, capital works, financial position, financial sustainability and strategic objectives of the Council.
8.1 Total rates and charges
A2015/16 F2016/17 B2017/18 SRP2018/19 SRP2019/20 SRP2020/210.0
10.0
20.0
30.0
40.0
50.0
60.0
40.3 41.4 43.4 46.2 48.6 51.2
$ m
illion
s
A = Actual F = Forecast B = Budget SRP = Strategic Resource Plan estimates
It is proposed that the average rate increase by 2.0% for the 2017/18 year, raising total rates of $43.46 million, including $0.98 million generated from supplementary rates. This will result in an increase in total revenue from rates and service charges of 4.3%. Of the 4.3% increase, 3.0% will go toward maintaining service levels and meeting the cost of a number of external influences affecting the operating budget including a $0.40 million reduction in the Victoria Grants Commission allocation. The remaining 1.3% increase will go toward capital works to address the asset renewal needs of the City. This rate increase is in line with rate cap set by the Minister for Local Government. (The rate increase for the 2016/17 year was 2.5%). Refer also Sections 7 and 10 for more information.
8.2 Operating result
A2015/16 F2016/17 B2017/18 SRP2018/19 SRP2019/20 SRP2020/21-4.0
-2.0
0.0
2.0
4.0
6.0
-2.80-1.92
1.05
5.40
-1.75 -1.57
Surp
lus /
-def
icit $
M
The expected operating result for the 2017/18 year is a surplus of $1.05 million, which is an increase of $2.97 million over 2016/17. The improved operating result is due mainly to external funding for capital works which is forecast to increase by $3.37 million to $6.28 million. The adjusted underlying result, which excludes items such as non-recurrent capital grants and non-cash contributions is a deficit of $4.40 million, which is an increase of $0.39 million over 2016/17. (The forecast operating result for the 2016/17 year is a deficit of $1.92 million).
Chartered Accountants Australia and New ZealandVictorian City Council Model Budget – 2017/18 54

8.3 Services
A2015/16 F2016/17 B2017/18 SRP2018/19 SRP2019/20 SRP2020/210.0
10.0
20.0
30.0
40.0
50.0
38.50 39.4042.60 43.20 44.50 46.20
net c
ost $
M
The net cost of services delivered to the community for the 2017/18 year is expected to be $42.60 million which is an increase of $3.20 million over 2016/17. A key influencing factor in the development of the 2017/18 budget has been the recently released results of the community satisfaction survey conducted by Council. The survey results show that while there is a relatively high level of satisfaction with most services provided by Council, there are some areas of concern where there is a clear message that ratepayers want improved service levels. For the 2017/18 year, service levels have been maintained and a number of initiatives proposed. (The forecast net cost for the 2016/17 year is $39.40 million).
Refer Section 2 for a list of services.
8.4 Cash and investments
A2016 F2017 B2018 SRP2019 SRP2020 SRP20210.0
10.0
20.0
30.0
40.0
31.60
23.48
12.21 12.43 12.78 13.03
cash
on
hand
$M
Cash and investments are expected to decrease by $11.27 million during the year to $12.21 million as at 30 June 2018. This is due mainly to the carried forward component of the 2016/17 capital works program and a number of major building projects. The reduction in cash and investments is in line with Council's Strategic Resource Plan. (Cash and investments are forecast to be $23.48 million as at 30 June 2017).
Refer also Section 4 for the Statement of Cash Flows and Section 11 for an analysis of the cash position.
Chartered Accountants Australia and New ZealandVictorian City Council Model Budget – 2017/18 55

8.5 Capital works
A2015/16 F2016/17 B2017/18 SRP2018/19 SRP2019/20 SRP2020/210.0
10.0
20.0
30.0
40.0
28.50
22.62
30.72
23.24
18.53 17.35
capit
al wo
rks
$M
The capital works program for the 2017/18 year is expected to be $30.72 million of which $7.13 million relates to projects which will be carried forward from the 2016/17 year. The carried forward component is fully funded from the 2016/17 budget. Of the $30.72 million of capital funding required, $6.28 million will come from external grants with the balance of $24.44 million from Council cash. The Council cash amount comprises asset sales ($1.68 million), cash held at the start of the year ($13.89 million) and cash generated through operations in the 2017/18 financial year ($8.87 million). The capital expenditure program has been set and prioritised based on a rigorous process of consultation that has enabled Council to assess needs and develop sound business cases for each project. This year's program includes a number of major building projects including the construction of a velodrome and lawn bowls centre. (Capital works is forecast to be $22.62 million for the 2016/17 year).
The graph below sets out the required and actual asset renewal over the life of the current Strategic Resource Plan and the renewal backlog.
2016/17 2017/18 2018/19 2019/20 2020/210
5,000
10,000
15,000
20,000
Renewal required Renewal program Backlog
$'000
The asset renewal program has been increased to $17.50 million in the 2017/18 year which will lead to a reduction in the backlog to $2.04 million. However over the rest of the four year period, it is expected to increase as funds are directed toward new asset projects with the backlog expected to climb to $6.61 million at the end of the 2019/20 year.
Refer also Section 4 for the Statement of Capital Works and Section12 for an analysis of the capital budget.
Chartered Accountants Australia and New ZealandVictorian City Council Model Budget – 2017/18 56

8.6 Financial position
A2016 F2017 B2018 SRP2019 SRP2020 SRP20210.00
10.00
20.00
30.00
40.00
27.70
17.64
5.03 5.14 5.26 5.37
work
ing c
apita
l $M
The financial position is expected to improve with net assets (net worth) to increase by $1.05 million to $514.83 million although net current assets (working capital) will reduce by $12.61 million to $5.03 million as at 30 June 2017. This is mainly due to the use of cash reserves to fund the capital works program. (Net assets is forecast to be $513.79 million as at 30 June 2018).
Refer also Section 4 for the Balance Sheet and Section13 for an analysis of the budgeted financial position.
8.7 Financial sustainability
F2016/17 B2017/18 SRP2018/19 SRP2019/20 SRP2020/21-6
-4
-2
0
-4.67 -4.45
-3.63-2.94
-2.39
adjus
ted
unde
rlying
sur
plus
/ -de
ficit
$M
A high level Strategic Resource Plan for the years 2017/18 to 2019/20 has been developed to assist Council in adopting a budget within a longer term prudent financial framework. The key objective of the Plan is financial sustainability in the medium to long term, while still achieving the Council’s strategic objectives as specified in the Council Plan. The adjusted underlying result, which is a measure of financial sustainability, shows a decreasing deficit over the four year period.
Refer Section 14 for more information on the Strategic Resource Plan.
Chartered Accountants Australia and New ZealandVictorian City Council Model Budget – 2017/18 57

8.8 Strategic objectives
Advocacy & leadership
Community & eco dev
Community partic-ipation
Resource manag Quality service Urban dev & envi-ron
0
4
8
12
16
20
3.1
12.3
0.6
5.6
2.5
15.5
3.3
12.5
0.5
5.7
2.7
17.9
2016/2017 2017/2018
net c
ost $
M
The Annual Budget includes a range of services and initiatives to be funded that will contribute to achieving the strategic objectives specified in the Council Plan. The above graph shows the level of funding allocated in the budget to achieve the strategic objectives as set out in the Council Plan for the 2017/18 year.
The services that contribute to these objectives are set out in Section 2.
8.9 Council expenditure allocations
Property and facilities; $4.58
Capital works; $27.13
Aged services; $14.29
Family services; $8.01
Parks and leisure; $12.19
Arts, culture and libraries; $6.51
Planning and amenity; $9.59
Environment and waste; $11.01
Roads and drainage; $6.69
The above chart provides an indication of how Council allocates its expenditure across the main services that it delivers. It shows how much is allocated to each service area for every $100 that Council spends. Council overheads, governance costs and administrative costs are allocated to our external facing services using an internal overhead allocation model.
Chartered Accountants Australia and New ZealandVictorian City Council Model Budget – 2017/18 58

9. Budget influences1
This section sets out the key budget influences arising from the internal and external environment within which the Council operates.
9.1 Snapshot of Victorian City Council2
Victorian City Council is located on the northern edge of Melbourne. The city, covering an area of 51 square kilometres, comprises the former cities of East and West and the southern parts of the former North municipality.
The current City was created through two stages of amalgamation with the first stage between the former City of East and the former City of West in 1994. Victorian City was then adopted as the official name of the City. In the second stage, the southern part of the former City of North was subsequently added to this newly created municipality.
PopulationThe population has been growing since 2005 and reached 154,245 in 2015. (Source: Australian Bureau of Statistics, Estimated Resident Population).Ageing populationThe population is ageing and the City has a greater proportion of older people than the Melbourne average. The age profile is similar to metropolitan averages however there is a slightly lower proportion of 5 to 14 year olds and 45 to 64 year olds. In addition, the proportion of 25 to 44 year olds is higher and the proportion of people aged over 65 years is significantly higher. (Source: Australian Bureau of Statistics, Census of Population and Housing).
BirthsDespite an ageing population, approximately 1,900 babies have been born each year since 2005. In the 2016/17 financial year 2,219 babies were born in the municipality. (Source: Maternal and Child Health database).
Cultural diversityThe City is a highly culturally and linguistically diverse municipality. Many different cultural groups live in Victorian City and more than 100 different languages are spoken at home by residents.
Just over one third of residents were born overseas. Of the total population, 61% were born in Australia. Of those residents born overseas, 88% were born in non-English-speaking countries and 12% were born in English-speaking countries. The main countries of birth of residents, apart from Australia, represent the traditional migrant groups from Europe, including Italy, Greece and the United Kingdom. (Source: Australian Bureau of Statistics, Census of Population and Housing).
Housing The number of homes is increasing. In 2017, there were 52,584 dwellings, of which 52,505 were private homes and 79 were non-private dwellings such as nursing homes, hotels and hostels. While more housing stock is available, the population has remained fairly stable, due to decreasing household sizes. Trends show that the number of one-person households is increasing, as is the number of small households.
The proportion of separate houses has fallen over the past decade with the growth of flats, units or apartments, along with semidetached, row, terrace and townhouses. Residential property prices have increased significantly over the past 10 years. The median house price increased from $298,000 in 2004 to $600,000 in 2017.
Chartered Accountants Australia and New ZealandVictorian City Council Model Budget – 2017/18 59

Education and occupationIn the past decade, Melbourne’s northern region, which includes Victorian City, has experienced a steadily improving retention of students from Year 10 to Year 12, up from 86% in 2002 to 87.7% in 2015. (Source: Department of Education and Training, Summary Statistics Victorian Schools).
People in Victorian City are also becoming better educated. The proportion of residents who have non-school qualifications is increasing. Many more residents in 2015 had completed a non-school qualification than in 2000 (33% compared with 22%). (Source: Australian Bureau of Statistics, Census of Population and Housing).
The occupations of residents have also changed. The proportion of professionals, associate professionals and intermediate clerical, sales and service workers has increased, while a fall has occurred in the proportion of tradespeople and related workers, advanced clerical, sales and service workers and labourers and related workers.
Budget implicationsAs a result of the City’s demographic profile there are a number of budget implications in the short and long term as follows:
Cultural and linguistic diversity means that Council needs to use a variety of media in languages other than English for mass communication with citizens, and use interpreting services for interpersonal communication with citizens. Council also draws on the abilities of its bilingual staff.
The small area of Victorian City reduces transport costs when compared to rural Shires. Services can be centralised as most citizens are able to reach Council facilities without extensive travel.
Over 25% of ratepayers are entitled to the pensioner rebate. As pensioners are often asset rich but income poor, the adoption of significant rate increases has a real impact on the disposable income of a significant proportion of our community. Council has hardship provisions in place but these can impact on cash balances when large volumes of ratepayers are involved. In addition, Council has long waiting lists for services to older people such as ‘Home Help’ and ‘Delivered Meals’ but not the income to service this demand.
The City is substantially developed and while it is experiencing a small increase in property numbers, these mainly arise from higher density developments. The budget implications arise in Council having to cope with replacement of infrastructure such as drains which cannot cope with the higher density. While Council has implemented an open space contribution scheme and an infrastructure development contribution plan, the income from these schemes do not fully fund the significant infrastructure costs and rates funding is required to be allocated to these works.
9.2 External influences3-6
Consumer Price Index (CPI) increases on goods and services of 1.4% through the year to the September quarter 2016 (ABS release 25 October 2016). State-wide CPI is forecast to be 2.0% for the 2017/18 year (Victorian Budget Papers 2016/17).
Australian Average Weekly Earnings (AWE) growth for Public Sector full-time adult ordinary time earnings in the 12 months to May 2015 was 3.4% (ABS release 18 August 2016). The wages price index in Victoria is projected to be 2.5% per annum in 2017/2018 increasing to 3.0% and 3.5% in the subsequent two years (Victorian Budget Papers 2016/17). Council must renegotiate a new Collective Agreement during the 2017/18 year for commencement on 1 July 2018.
Reduction of $0.40 million in Victoria Grants Commission funding compared to the prior year.
Receipt of significant capital works funding of $6.28 million for the construction of a Velodrome and State Bowls Centre at Victoria Park and the completion of Roads to Recovery projects
Anticipated increases of 2.0% (or $1.24 per tonne) in the levy payable to the State Government upon disposal of waste into landfill, resulting in additional waste tipping costs of $0.20 million. The levy has increased from $9 per tonne in 2008/09 to a forecast $63.27 per tonne in 2017/18 (703% increase in 9 years) and has added $1.84 million to Council's costs.
Cost Shifting occurs where Local Government provides a service to the community on behalf of the State and Federal Government. Over time the funds received by local governments do not
Chartered Accountants Australia and New ZealandVictorian City Council Model Budget – 2017/18 60
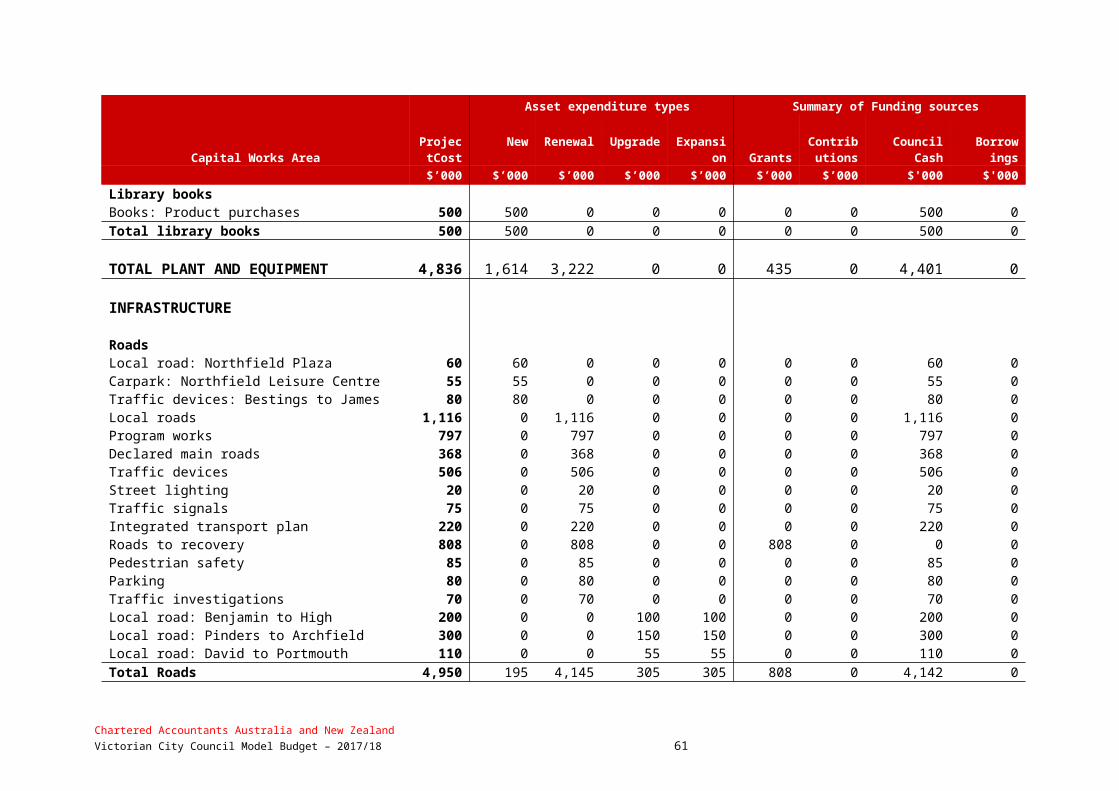
increase in line with real cost increases. Examples of services that are subject to Cost Shifting include school crossing supervision, Library services and Home and Community Care for aged residents. In all these services the level of payment received by Council from the State Government does not reflect the real cost of providing the service to the community.
Councils across Australia raise approximately 3.5% of the total taxation collected by all levels of Government in Australia. In addition Councils are entrusted with the maintenance of more than 30% of the all Australian public assets including roads, bridges, parks, footpaths and public buildings. This means that a large proportion of Council’s income must be allocated to the maintenance and replacement of these valuable public assets in order to ensure the quality of public infrastructure is maintained at satisfactory levels.
The Fire Services Property Levy will continue to be collected by Council on behalf of the State Government with the introduction of the Fire Services Property Levy Act 2012.
9.3 Internal influences7-8
As well as external influences, there are also a number of internal influences which are expected to have a significant impact on the preparation of the 2017/18 Budget. These matters have arisen from events occurring in the 2016/17 year resulting in variances between the forecast actual and budgeted results for that year and matters expected to arise in the 2017/18 year. These matters and their financial impact are set out below: Overrun of $0.48 million in the maintenance of trees due to the removal of severely diseased
street trees. Reduction in the budgeted draw down from discretionary reserves of $0.30 million as a result of
government funding being awarded for the Victoria Civic Centre redevelopment. Higher than expected wage increases of 5% per annum resulting in additional ongoing employee
costs of $0.46 million per annum. Ongoing savings of $0.23 million as a result of meals production being contracted out at a rate
more favourable than budget. Council’s decision during the year to bring the street cleansing service in-house. This has
resulted in start-up investment costs of $0.80 million for plant and equipment to be funded from investment reserves and ongoing operational costs of $1.40 million per annum.
9.4 Budget principles9
In response to these influences, guidelines were prepared and distributed to all Council officers with budget responsibilities. The guidelines set out the key budget principles upon which the officers were to prepare their budgets. The principles included: Existing fees and charges to be increased in line with CPI or market levels. Grants to be based on confirmed funding levels. New revenue sources to be identified where possible. Service levels to be maintained at 2016/17 levels with the aim to use less resources with an
emphasis on innovation and efficiency. Salaries and wages to be increased in line with Average Weekly Earnings. Contract labour to be minimised. Construction and material costs to increase in line with the Engineering Construction Index New initiatives or employee proposals to be justified through a business case. Real savings in expenditure and increases in revenue identified in 2016/17 to be preserved Operating revenues and expenses arising from completed 2016/17 capital projects to be
included.
9.5 Long term strategiesThe budget includes consideration of a number of long term strategies and contextual information to assist Council to prepare the Budget in a proper financial management context. These include a Strategic Resource Plan for 2017/18 to 2020/21 (Section 14.), Rating Information (Section 15.) and Other Long Term Strategies (Section 16.) including borrowings, infrastructure and service delivery.
Chartered Accountants Australia and New ZealandVictorian City Council Model Budget – 2017/18 61

10. Analysis of operating budget
This section analyses the operating budget including expected income and expenses of the Council for the 2017/18 year.
10.1 Budgeted income statement1-3
Ref
ForecastActual
2016/17$’000
Budget2017/18
$’000
Variance
$’000Total income 10.2 72,571 77,574 5,003Total expenses 10.3 (74,493) (76,529) (2,036)Surplus (deficit) for the year (1,922) 1,045 2,967Grants – capital non-recurrent 10.2.6 (2,093) (5,447) (3,354)Contributions - non-monetary assets 0 0 0Capital contributions - other sources 10.2.4 (661) (51) 610Adjusted underlying surplus (deficit) 10.1.1 (4,676) (4,453) 223
10.1.1 Adjusted underlying deficit ($0.22 million decrease)The adjusted underlying result is the net surplus or deficit for the year adjusted for non-recurrent capital grants, non-monetary asset contributions, and capital contributions from other sources. It is a measure of financial sustainability and Council’s ability to achieve its service delivery objectives as it is not impacted by capital income items which can often mask the operating result. The adjusted underlying result for the 2017/18 year is a deficit of $4.45 million which is a decrease of $0.22 million from the 2016/17 year. In calculating the adjusted underlying result, Council has excluded grants received for capital purposes which are non-recurrent and capital contributions from other sources. Contributions of non-monetary assets are excluded as the value of assets assumed by Council is dependent on the level of development activity each year.
10.2 Income4-7,11
Income Types Ref
ForecastActual
2016/17$’000
Budget2017/18
$’000
Variance
$’000Rates and charges 10.2.1 41,685 43,457 1,772 Statutory fees and fines 10.2.2 2,445 2,690 245 User fees 10.2.3 6,708 7,680 972 Contributions - monetary 10.2.4 661 51 (610)Grants - operating 5.1.1 14,523 13,617 (906)Grants – capital 5.1.2 2,903 6,277 3,374 Net gain on disposal of property, infrastructure, plant and equipment 10.2.5 823 539 (284)Other income 10.2.6 2,823 3,263 440 Total income 72,571 77,574 5,003
Chartered Accountants Australia and New ZealandVictorian City Council Model Budget – 2017/18 62
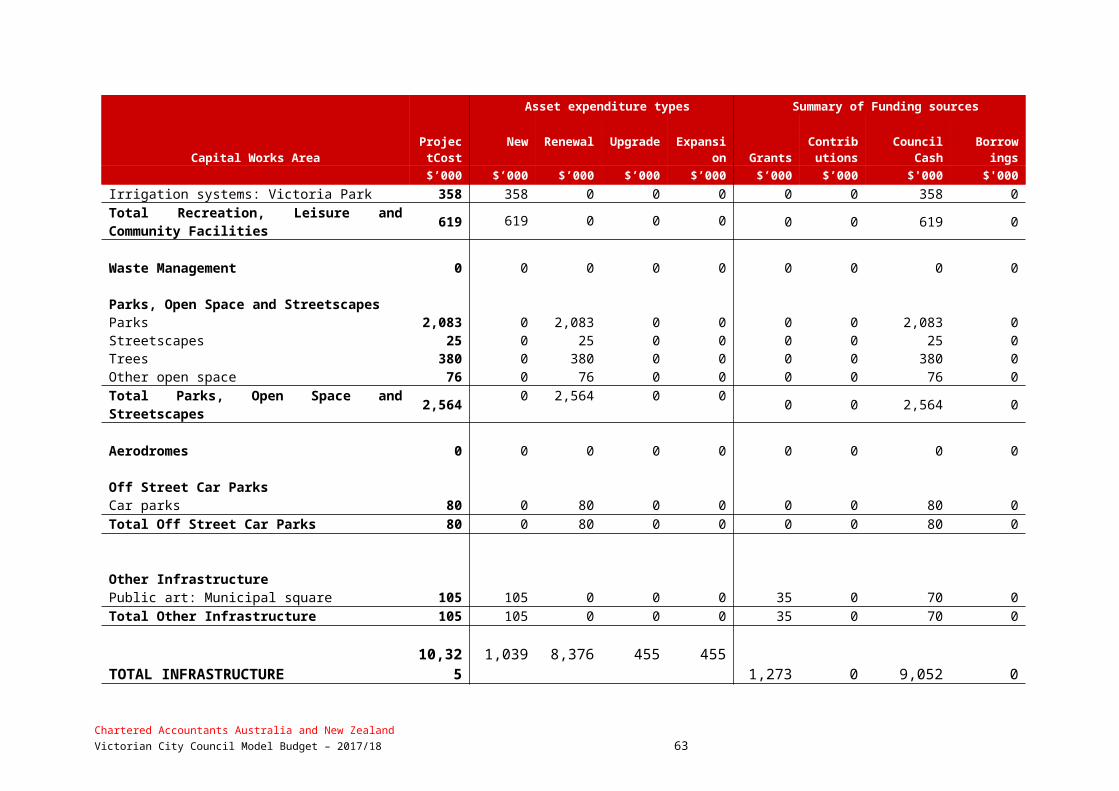
10.2.1 Rates and charges ($1.77 million increase)It is proposed that income raised by all rates and charges be increased by 4.3% or $1.77 million to $43.46 million. This includes an increase in general rates of 2.6%, the Municipal Charge of 2.0%; kerbside waste collection and recycling of 6.6% and forecasts supplementary rates to increase by $0.52 million over 2016/17 to $0.98 million.
Section 7 – Rates and Charges - includes a more detailed analysis of the rates and charges to be levied for 2017/18 and the rates and charges information specifically required by the Regulations.
10.2.2 Statutory fees and fines ($0.25 million increase)Statutory fees relate mainly to fees and fines levied in accordance with legislation and include animal registrations, Public Health and Wellbeing Act 2008 registrations and parking fines. Increases in statutory fees are made in accordance with legislative requirements.
Statutory fees are forecast to increase by 10.0% or $0.25 million compared to 2016/17. Statutory Planning fees will increase by $0.17 million due to the planned release of two major property developments and increased activity in the building sector. Traffic Enforcement fees will also increase by $0.06 million due to the appointment of an additional enforcement officer.
Chartered Accountants Australia and New ZealandVictorian City Council Model Budget – 2017/18 63

A detailed listing of statutory fees is included in Appendix A.
10.2.3 User fees ($0.97 million increase)User charges relate mainly to the recovery of service delivery costs through the charging of fees to users of Council’s services. These include separate rating schemes, use of leisure, entertainment and other community facilities and the provision of human services such as family day care and home help services. In setting the budget, the key principle for determining the level of user charges has been to ensure that increases do not exceed CPI increases or market levels.
User charges are projected to increase by 14.5% or $0.97 million over 2016/17. The main area contributing to the increase is leisure services ($0.55 million) due to expected increased patronage of Council facilities. Council has also anticipated a reduction in fees from the Transfer Station ($0.15 million) resulting from its temporary closure in the budget year. In addition, Council plans to increase user charges for all areas by 2.5% in line with expected inflationary trends over the budget period to maintain parity between user charges and the costs of service delivery.
A detailed listing of fees and charges is included in Appendix A.
10.2.4 Contributions - monetary ($0.60 million decrease)Contributions relate to monies paid by developers in regard to public resort and recreation, drainage and car parking in accordance with planning permits issued for property development.
Contributions are projected to decrease by $0.60 million or 92.3% compared to 2016/17 due mainly to the completion of a number of major property developments within the municipality during the 2016/17 year.
10.2.5 Net gain on disposal of property, infrastructure, plant and equipment ($0.29 million decrease)Proceeds from the disposal of Council assets is forecast to be $2.50 million for 2017/18 and relate mainly to the planned cyclical replacement of part of the plant and vehicle fleet ($1.70 million) and sale of properties including surplus land and numerous rights-of-way throughout the municipality ($0.80 million). The written down value of assets sold is forecast to be $1.96 million.
10.2.6 Other income ($0.44 million increase)Other income relates to a range of items such as private works, cost recoups and other miscellaneous income items. It also includes interest revenue on investments and rate arrears.
Other income is forecast to increase by 15.6% or $0.44 million compared to 2016/17. Interest on investments is forecast to decline by 10.0% or $0.10 million compared to 2017/18. This is mainly due to a forecast reduction in Council’s available cash reserves during 2016/17 to fund major infrastructure projects. Interest on unpaid rates is forecast to increase by $0.03 million compared to 2016/17 following an expected increase in the level of unpaid rates during 2017/18. The increase in other income items is due mainly to an increased share of the operating surpluses from Council's outsourced leisure centres ($0.20 million) and payments from the State Revenue Office for the purchase of valuation data ($0.25 million).
Chartered Accountants Australia and New ZealandVictorian City Council Model Budget – 2017/18 64

10.3 Expenses8-11
Expense Types
Ref
ForecastActual
2016/17$’000
Budget2017/18
$’000
Variance
$’000Employee costs 10.3.1 31,541 34,091 2,550Materials and services 10.3.2 22,937 22,107 (830) Bad and doubtful debts 10.3.3 314 340 26Depreciation and amortisation 10.3.4 14,034 14,500 466Borrowing costs 10.3.5 380 312 (68) Other expenses 10.3.6 5,287 5,179 (108) Total expenses 74,493 76,529 2,036
Chartered Accountants Australia and New ZealandVictorian City Council Model Budget – 2017/18 65

10.3.1 Employee costs ($2.55 million increase)9
Employee costs include all labour related expenditure such as wages and salaries and on-costs such as allowances, leave entitlements, employer superannuation, rostered days off, etc.
Employee costs are forecast to increase by 8.1% or $2.55 million compared to 2016/17. This increase relates to three key factors: Renegotiation of Council’s Enterprise Bargaining Agreement (EBA) which is estimated to cost
$1.30 million in 2017/18 Anticipated non EBA wages growth of 3.5% or $0.48 million due mainly to small increases in staff
numbers in Family Day Care and General Home Care in response to increased community demand for these services. As indicated above, additional funding will be available to cover the extension of these services.
A summary of human resources expenditure categorised according to the organisational structure of Council is included below:
Comprises
Department
Budget2017/18
$’000
PermanentFull time
$’000
Permanent Part Time
$’000Asset Management 2,500 2,000 500 City Services 7,200 7,000 200 Community Services 8,500 7,000 1,500 Corporate Services 4,400 4,000 400 Culture and Leisure 5,300 5,000 300 Environment and Amenity 1,900 1,000 900 Strategy and Governance 3,100 3,000 100Total permanent staff expenditure 32,900 29,000 3,900 Casuals and other expenditure 1,191Capitalised Labour costs 0Total expenditure 34,091
A summary of the number of full time equivalent (FTE) Council staff in relation to the above expenditure is included below:
Comprises
DepartmentBudget
FTEPermanent
Full time Permanent
Part Time
Asset Management 41.6 33.3 8.3City Services 120.0 116.7 3.3Community Services 141.7 116.7 25.0Corporate Services 73.4 66.7 6.7Culture and Leisure 88.3 83.3 5.0Environment and Amenity 31.7 16.7 15.0Strategy and Governance 52.1 50.4 1.7Total permanent staff 548.8 483.8 65.0Casuals and other 19.9Capitalised Labour costs 0.0Total staff 568.7
Chartered Accountants Australia and New ZealandVictorian City Council Model Budget – 2017/18 66

The most significant increases in employee costs by service unit are summarised below:
Department Service Unit
ForecastActual
2016/17$’000
Budget2017/18
$’000
Variance
$’000City Services Street cleansing 0 772 772
Collection services 1,089 1,503 414Strategy and Governance Statutory planning 690 866 176Community Services Home support 427 654 227Culture and Leisure Urban design 134 245 111
10.3.2 Materials and services ($0.83 million decrease)Materials and services include the purchases of consumables, payments to contractors for the provision of services and utility costs. Materials and services are forecast to decrease by 3.6% or $0.83 million compared to 2016/17.
Consumables is forecast to increase by $0.47 million or 13.8% compared to 2016/17 and relates mainly to an increase in fuel costs to operate the Council’s plant and vehicle fleet as a result of significant increases in diesel and petrol prices.
External contracts are forecast to decrease by 9.0% or $1.40 million compared to 2016/17. The main areas contributing to this decrease are the cessation of the Street Cleansing contract ($1.60 million) and Environmental Health ($0.31 million) as a result of a change in the Food Act 1984 requirements. These have been offset by expected increases in contracts relating to Primary Care Partnerships ($0.24 million) due to an expansion of the service, Facilities Maintenance ($0.13 million) due to Council requests to increase maintenance levels and Family Day Care ($0.11 million) due to additional contract staff required to meet anticipated increases in demand for the service.
Utility costs relate to telecommunications, including usage of telephones and other utilities such as water, gas and electricity. Utility costs are forecast to increase by 2.1% or $0.08 million compared to 2016/17 resulting from expected additional street lighting costs following an unfavourable renegotiation of Council’s electricity contract with its supplier.
10.3.3 Bad and doubtful debts ($0.03 million increase)Bad and doubtful debts is projected to increase by $0.03 million or 8.3% compared to 2016/17 due mainly to an increase in parking fines forwarded to the Infringements Court for collection and a consequent reduction in collection rates.
10.3.4 Depreciation and amortisation ($0.47 million increase)Depreciation is an accounting measure which attempts to allocate the value of an asset over its useful life for Council’s property, plant and equipment including infrastructure assets such as roads and drains. The increase of $0.47 million for 2017/18 is due mainly to the completion of the 2016/17 capital works program and the full year effect of depreciation on the 2016/17 capital works program. Refer to Section 6. ‘Analysis of Capital Budget’ for a more detailed analysis of Council’s capital works program for the 2017/18 year.
10.3.5 Borrowing costs ($0.07 million decrease)Borrowing costs relate to interest charged by financial institutions on funds borrowed. The reduction in borrowing costs results from the planned reduction in borrowings due to repayment of principal in accordance with loan agreements.
10.3.6 Other items of expense ($0.11 million decrease)Other items of expense relate to a range of unclassified items including contributions to community groups, advertising, insurances, motor vehicle registrations and other miscellaneous expenditure items. Other expenses are forecast to decrease by 2.0% or $0.11 million compared to 2016/17. This is mainly due to a reduction in Council’s contribution to the XYZ Children’s Services Association due to a change in government funding arrangements.
Chartered Accountants Australia and New ZealandVictorian City Council Model Budget – 2017/18 67

11. Analysis of budgeted cash position1-2
This section analyses the expected cash flows from the operating, investing and financing activities of Council for the 2017/18 year. Budgeting cash flows for Council is a key factor in setting the level of rates and providing a guide to the level of capital expenditure that can be sustained with or without using existing cash reserves.
The analysis is based on three main categories of cash flows: Operating activities - Refers to the cash generated or used in the normal service delivery
functions of Council. Cash remaining after paying for the provision of services to the community may be available for investment in capital works, or repayment of debt
Investing activities - Refers to cash generated or used in the enhancement or creation of infrastructure and other assets. These activities also include the acquisition and sale of other assets such as vehicles, property and equipment
Financing activities - Refers to cash generated or used in the financing of Council functions and include borrowings from financial institutions and advancing of repayable loans to other organisations. These activities also include repayment of the principal component of loan repayments for the year.
11.1 Budgeted cash flow statement3-9
Ref
ForecastActual
2016/17$’000
Budget2017/18
$’000
Variance
$’000Cash flows from operating activities 11.1.1 Receipts Rates and charges 41,900 43,357 1,457 User fees and fines 9,554 10,370 816Grants - operating 13,313 13,617 304 Grants - capital 2,903 6,277 3,374 Interest 2,044 1,820 (224)Other receipts 3,222 1,494 (1,728)
72,936 76,935 3,999 Payments Employee costs (31,185) (33,841) (2,656)Other payments (29,829) (27,635) 2,194
(61,014) (61,476) (462)Net cash provided by operating activities 11,922 15,459 3,537
Cash flows from investing activities 11.1.2 Payments for property, infrastructure, plant and equipment (21,007) (29,195) (8,188)Proceeds from sales of property, infrastructure, plant and equipment 1,664 3,741 2,077 Payments for investments - - -Proceeds from investments - - -Loans and advances made - - -Repayment of loans and advances 10 199 189 Net cash used in investing activities (19,333) (25,255) (5,922)
Cash flows from financing activities 11.1.3 Finance costs (380) (312) 68 Proceeds from borrowings 0 0 0 Repayment of borrowings (1,161) (1,161) 0 Net cash used in financing activities (1,541) (1,473) 68 Net decrease in cash and cash equivalents (8,952) (11,269) (2,317)Cash and cash equivalents at the beginning of the year 32,428 23,476 (8,952)Cash and cash equivalents at end of the year 11.1.4 23,476 12,207 (11,269)
Source: Appendix A
Chartered Accountants Australia and New ZealandVictorian City Council Model Budget – 2017/18 68

11.1.1 Operating activities ($3.58 million increase)The increase in cash inflows from operating activities is due mainly to a $3.37 million increase in capital grants to fund the capital works program and a $1.46 million increase in rates and charges.
The net cash flows from operating activities does not equal the surplus (deficit) for the year as the expected revenues and expenses of the Council include non-cash items which have been excluded from the Cash Flow Statement. The budgeted operating result is reconciled to budgeted cash flows available from operating activities as set out in the following table.
Forecast
Actual2016/17
$’000
Budget2017/18
$’000
Variance
$’000Surplus (deficit) for the year (1,922) 1,045 2,967 Depreciation 14,034 14,500 466 Loss (gain) on disposal of property, infrastructure, plant and equipment
(823) (539) 284
Finance costs 380 312 (68)Net movement in current assets and liabilities (829) (941) 112Cash flows available from operating activities 10,840 14,377 3,537
11.1.2 Investing activities ($5.92 million increase)The large increase in payments for investing activities represents the planned large increase in capital works expenditure disclosed in Section 10 of this budget report. Proceeds from sale of assets are forecast to increase by $2.1 million due to settlement of land sales achieved during 2017/18.
11.1.3 Financing activities ($0.07 million decrease)For 2017/18 the total of principal repayments is projected to be $1.16 million and finance charges to be $0.31 million.
11.1.4 Cash and cash equivalents at end of the year ($11.27 million decrease)Overall, total cash and investments is forecast to decrease by $11.27 million to $12.21 million as at 30 June 2018, reflecting Council’s strategy of using excess cash and investments to enhance existing and create new infrastructure. This is consistent with Council’s Strategic Resource Plan (see Section 8), which forecasts a significant reduction in the capital works program from 2017/18 onwards to balance future cash budgets.
11.2 Restricted and unrestricted cash and investments10-14
Cash and cash equivalents held by Council are restricted in part, and not fully available for Council’s operations. The budgeted cash flow statement above indicates that Council is estimating at 30 June 2016 it will have cash and investments of $12.21 million, which has been restricted as shown in the following table.
Forecast Actual Budget Variance Ref 2015 2016 $’000 $’000 $’000Total cash and investments 23,476 12,207 (11,269)Restricted cash and investments - Statutory reserves 11.2.1 (936) (894) 42- Cash held to fund carry forward capital works 11.2.2 (6,569) - 6,569- Trust funds and deposits - - -Unrestricted cash and investments 11.2.3 15,971 11,313 (4,658) - Discretionary reserves 11.2.4 (8,461) (3,908) 4,553Unrestricted cash adjusted for discretionary reserves 11.2.5 7,510 7,405 (105)
Chartered Accountants Australia and New ZealandVictorian City Council Model Budget – 2017/18 69

11.2.1 Statutory reserves ($0.89 million)These funds must be applied for specified statutory purposes in accordance with various legislative requirements. While these funds earn interest revenues for Council, the funds are not available for other purposes.
11.2.2 Cash held to fund carry forward capital worksThere is no amount shown as cash held to fund carry forward works at 30 June 2016, as it is expected that the capital works budget in the 2017/18 financial year will be fully expended. An amount of $6.57 million is forecast to be held at 30 June 2017 to fund capital works budgeted but not completed in the financial year. Section 6.2 contains further details on capital works funding.
11.2.3 Unrestricted cash and investments ($11.31 million)The amount shown is in accordance with the definition of unrestricted cash included in the Regulations. These funds are free of statutory reserve funds and cash to be used to fund capital works expenditure from the previous financial year.
11.2.4 Discretionary reserves ($3.91 million)These funds are shown as discretionary reserves as, although not restricted by a statutory purpose, Council has made decisions regarding the future use of these funds and unless there is a Council resolution these funds should be used for those earmarked purposes. During the 2017/2018 year $1.58 million is budgeted to be transferred to and $9.89 million from Discretionary Reserves. The decisions about future use of these funds has been reflected in Council’s Strategic Resource Plan and any changes in future use of the funds will be made in the context of the future funding requirements set out in the plan.11.2.5 Unrestricted cash adjusted for discretionary reserves ($7.41 million)These funds are free of all specific Council commitments and represent funds available to meet daily cash flow requirements, unexpected short term needs and any budget commitments which will be expended in the following year such as grants and contributions. Council regards these funds as the minimum necessary to ensure that it can meet its commitments as and when they fall due without borrowing further funds.
Chartered Accountants Australia and New ZealandVictorian City Council Model Budget – 2017/18 70
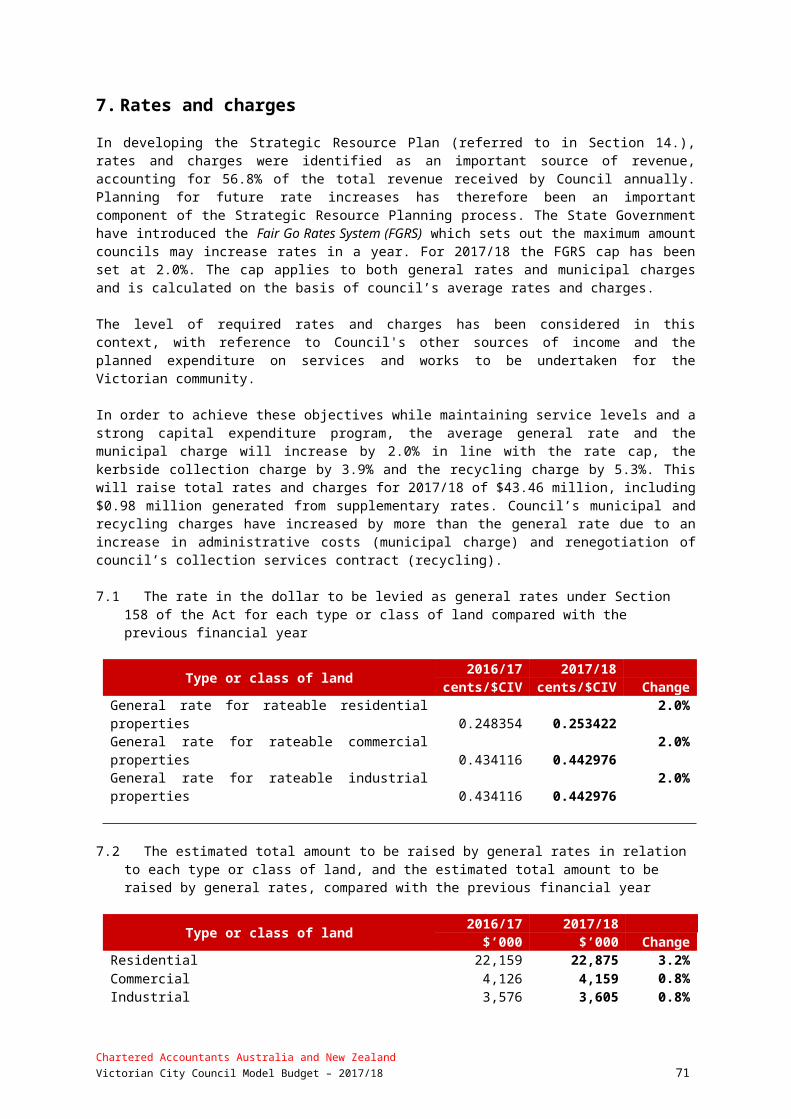
12. Analysis of capital budget1-3
This section analyses the planned capital works expenditure budget for the 2017/18 year and the sources of funding for the capital budget. Further detail on the capital works program can be found in Section 6.
12.1 Capital works expenditure4-6
Capital Works Areas Ref
ForecastActual
2016/17$’000
Budget2017/18
$’000
Variance
$’000Works carried forward 12.1.1PropertyLand 0 0 0Land improvements 0 0 0Total land 0 0 0Buildings 5,384 5,054 (330)Heritage buildings 0 0 0Building improvements 0 0 0Leasehold improvements 0 0 0Total buildings 5,384 5,054 (330)Total property 5,384 5,054 (330)Plant and equipmentHeritage plant and equipment - - -Plant, machinery and equipment 168 158 (10)Fixtures, fittings and furniture 0 0 0Computers and telecommunications 849 797 (52)Library books 0 0 0Total plant and equipment 1,017 955 (62)InfrastructureRoads 444 417 (27)Bridges 0 0 0Footpaths and cycleways 356 334 (22)Drainage 250 235 (15)Recreational, leisure and community facilities 11 10 (1)Waste management 0 0 0Aerodromes, Parks, open space and streetscapes 53 50 (3)Off street car parks 37 35 (2)Other infrastructure 38 35 (3)Total infrastructure 1,189 1,116 (73)Total works carried forward 7,590 7,125 (465)
New worksProperty 12.1.2Land 0 0 0Land improvements 0 0 0Total land 0 0 0Buildings 5,295 8,314 3,019Heritage buildings 0 0 0Building improvements 75 117 42Leasehold improvements 0 0 0Total buildings 0 0 0Total property 5,370 8,431 3,061Plant and equipment 12.1.3Heritage plant and equipmentPlant, machinery and equipment 1,924 3,021 1,097Computers and telecommunications 838 1,315 477
Chartered Accountants Australia and New ZealandVictorian City Council Model Budget – 2017/18 71
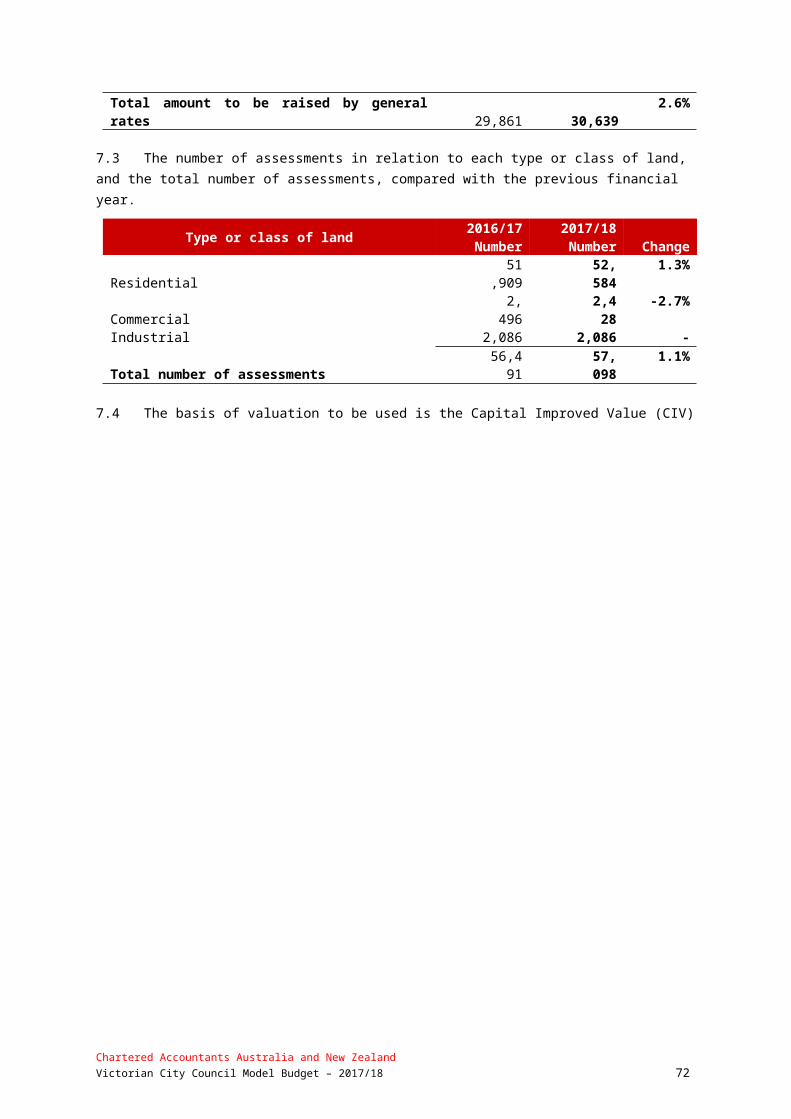
Library books 318 500 182Total plant and equipment 3,080 4,836 1,756Infrastructure 12.1.4Roads 3,154 4,950 1,796Bridges 6 10 4Footpaths and cycleways 221 347 126Drainage 1,051 1,650 599Rec, leisure and community facilities 394 619 225Parks, open space and streetscapes 1,633 2,564 931Off street car parks 51 80 29Other infrastructure 67 105 38Total infrastructure 6,577 10,325 3,748Total new works 15,027 23,592 8,565
Total capital works expenditure 22,617 30,717 8,100
Represented by: New asset expenditure 12.1.5 12,225 17,454 5,229Asset renewal expenditure 12.1.5 6,850 9,176 2,326Asset upgrade expenditure 12.1.5 1,352 632 (720)Asset expansion expenditure 12.1.5 2,190 3,455 1,265Total capital works expenditure 22,617 30,717 8,100
44%
19%
37%
Budgeted capital works 2017/18
Property
Plant and equipment
Infrastructure
Chartered Accountants Australia and New ZealandVictorian City Council Model Budget – 2017/18 72

57%30%
2%
11%
Budgeted capital works 2017/18
New asset expenditureAsset renewal expendi-tureAsset upgrade expendi-tureAsset expansion expendi-ture
Source: Section 3. A more detailed listing of the capital works program is included in Section 6.
12.1.1 Carried forward works ($7.13 million)At the end of each financial year there are projects which are either incomplete or not commenced due to factors including planning issues, weather delays and extended consultation. For the 2016/17 year it is forecast that $7.13 million of capital works will be incomplete and be carried forward into the 2017/18 year. The more significant projects include the Civic Precinct redevelopment ($0.75 million) and the Newlands Community Facility ($3.00 million).
12.1.2 Property ($8.43 million)The property class comprises buildings and building improvements including community facilities, municipal offices, sports facilities and pavilions.
For the 2017/18 year, $8.43 million will be expended on building and building improvement projects. The more significant projects include pavilion upgrades ($0.32 million), Victorian Community Facility ($1.20 million), redevelopment of the City Children’s Centre ($0.25 million), construction of a Velodrome and State Bowls Centre at Victoria Park ($4.00 million) and completion of the Block Arcade redevelopment ($0.97 million).
12.1.3 Plant and equipment ($4.84 million)Plant and equipment includes plant, machinery and equipment, computers and telecommunications, and library books.
For the 2017/18 year, $4.84 million will be expended on plant, equipment and other projects. The more significant projects include ongoing cyclical replacement of the plant and vehicle fleet ($3.02 million), upgrade and replacement of information technology ($1.32 million) and library material purchases ($0.50 million).
12.1.4 Infrastructure ($10.33 million)Infrastructure includes roads, bridges, footpaths and cycleways, drainage, recreation, leisure and community facilities, parks, open space and streetscapes, off street car parks and other structures.
Chartered Accountants Australia and New ZealandVictorian City Council Model Budget – 2017/18 73
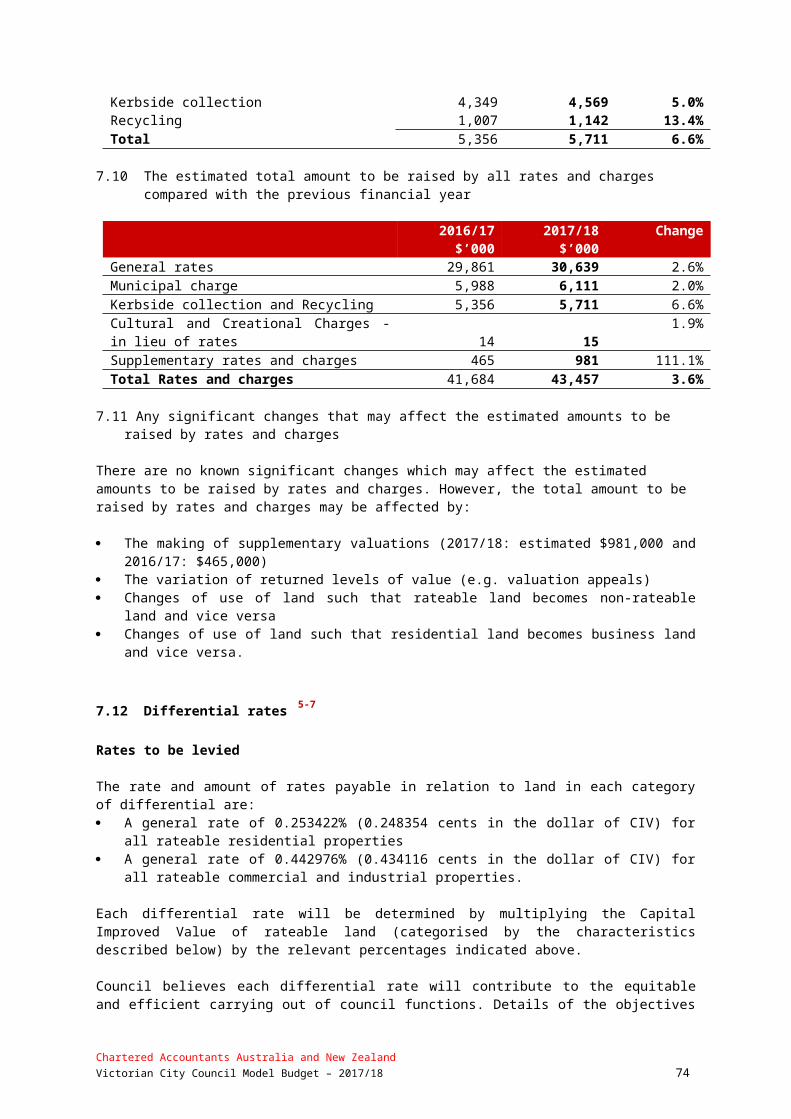
For the 2017/18 year, $4.95 million will be expended on road projects. The more significant projects include local road reconstructions ($1.80 million), federally funded Roads to Recovery projects ($0.81 million), road resheeting ($0.80 million), road safety ($0.51 million), and Integrated Transport Plan ($0.22 million).
$1.65 million will be expended on drainage projects. The more significant of these include road drainage replacement works ($0.87 million), Stage 1 of the Victoria Park Lake redevelopment ($0.50 million) and implementation of the Stormwater Management Plan ($0.22 million).
$2.56 million will be expended on parks, open space and streetscapes, including $1.90 million for the completion of Victoria Park.
Other new infrastructure expenditure includes $0.01 million on bridges, $0.35 million on footpaths and cycleways, $0.62 million on recreational, leisure and community facilities, $0.08 million on car parks and $0.11 million on other infrastructure.
12.1.5 Asset renewal ($17.45 million), new assets ($9.18 million), upgrade ($0.63 million) and expansion ($3.46 million)
A distinction is made between expenditure on new assets, asset renewal, upgrade and expansion. Expenditure on asset renewal is expenditure on an existing asset, or on replacing an existing asset that returns the service of the asset to its original capability. Expenditure on new assets does not have any element of expansion or upgrade of existing assets but will result in an additional burden for future operation, maintenance and capital renewal.
The major projects included in the above categories, which constitute expenditure on new assets, are the Victorian Community Facility ($1.20 million), construction of a Velodrome and State Bowls Centre at Victoria Park ($4.00 million) and information technology purchases ($1.11 million). The remaining capital expenditure represents renewals and expansion/upgrades of existing assets.
12.2 Funding sources7-8
Sources of Funding Ref
ForecastActual
2016/17$’000
Budget2017/18
$’000
Variance
$’000Works carried forwardCurrent year funding Grants 527 461 (66)Contributions - - -Borrowings - - -Council cash- operations - - -- proceeds on sale of assets 105 95 (10)- reserve cash and investments 5,851 3,752 (2,099)- unrestricted cash and investments 1,107 2,817 1,710Total works carried forward 12.2.1 7,590 7,125 (465)
New worksCurrent year funding Grants 12.2.2 2,376 5,816 3,440Contributions - - -Borrowings - - -Council cash- operations 12.2.3 8,589 8,870 281- proceeds from sale of assets 12.2.4 1,024 1,586 562- reserve cash and investments 12.2.5 1,826 6,596 4,770- unrestricted cash and investments 12.2.6 1,212 724 (488)Total new works 15,027 23,592 8,565Total funding sources 22,617 30,717 8,100
Chartered Accountants Australia and New ZealandVictorian City Council Model Budget – 2017/18 74

20%
29%
5%
34%
12%
Budgeted total funding sources 2017/18
Grants
Contributions
Operations
Proceeds on sale of assets
Reserve cash and investments
Unrestricted cash and investments
Source: Section 6
12.2.1 Carried forward works ($7.13 million)At the end of each financial year there are projects which are either incomplete or not commenced due to factors including planning issues, weather delays and extended consultation. For the 2016/17 year it is forecast that $7.13 million of capital works will be incomplete and be carried forward into the 2017/18 year. Significant funding includes grants for the Municipal Offices ($0.15 million) and reserve cash and investments for the Municipal Offices ($0.75 million) and Newland Centre ($3.00 million).
12.2.2 Grants - capital ($5.82 million)Capital grants include all monies received from State and Federal sources for the purposes of funding the capital works program. Significant grants and contributions are budgeted to be received for the State Bowls Centre and Training Velodrome ($4.00 million), Roads to Recovery projects ($0.81 million), Victoria Park Lake ($0.43 million) and Compressed Natural Gas Conversion ($0.34 million).
12.2.3 Council cash - operations ($8.87 million)Council generates cash from its operating activities, which is used as a funding source for the capital works program. It is forecast that $8.87 million will be generated from operations to fund the 2017/18 capital works program.
12.2.4 Council cash - proceeds from sale of assets ($1.59 million)Proceeds from sale of assets include motor vehicle sales in accordance with Council’s fleet renewal policy of $1.59 million.
12.2.5 Council cash - reserve cash and investments ($6.60 million)Council has significant cash reserves, which it is currently using to fund its annual capital works program. The reserves include monies set aside for specific purposes such as Golf Course Renewal and non-specific reserves such as the Building Replacement Reserve. For 2017/18 $6.60 million will be used to fund part of the new capital works program including the landfill ($1.90 million), Victoria Civic Centre ($3.60 million), Plant Replacement ($1.00 million), Victoria Arcade ($0.87 million) and the Victoria Civic Precinct ($0.10 million).
10.2.6 Council cash - unrestricted cash and investments ($0.72 million)In addition to reserve investments, Council has uncommitted cash and investments which represent unrestricted cash and investments and funds preserved from the previous year mainly as a result of grants and contributions being received in advance. It is forecast that $0.72 million will be available from the 2016/17 year to fund new capital works in the 2017/18 year.
Chartered Accountants Australia and New ZealandVictorian City Council Model Budget – 2017/18 75

13. Analysis of budgeted financial position1-2
This section analyses the movements in assets, liabilities and equity between 2016/17 and 2017/18. It also considers a number of key financial performance indicators.
13.1 Budgeted balance sheet3-8
Ref
ForecastActual
2017$’000
Budget2018$’000
Variance
$’000Current assets 13.1.1 Cash and cash equivalents 23,476 12,207 (11,269)Trade and other receivables 5,272 5,367 95 Financial assets 6 6 0 Other assets 1,440 200 (1,240)Total current assets 30,194 17,780 (12,414)
Non-current assets 13.1.1 Trade and other receivables 206 12 (194)Property, infrastructure, plant and equipment 501,795 514,527 12,732 Total non-current assets 502,001 514,539 12,538 Total assets 532,195 532,319 124
Current liabilities 13.1.2 Trade and other payables 5,880 5,880 0 Provisions 5,510 5,714 204Interest-bearing loans and borrowings 1,161 1,161 0 Total current liabilities 12,551 12,755 204
Non-current liabilities 13.1.2 Provisions 972 1,008 36Interest-bearing loans and borrowings 4,887 3,726 (1,161) Total non-current liabilities 5,859 4,734 (1,125)Total liabilities 18,410 17,489 (921)Net assets 513,785 514,830 1,045
Equity 13.1.4 Accumulated surplus 398,518 407,910 9,392 Reserves 115,267 106,920 (8,347)
Total equity 513,785 514,830 1,045 Source: Section 3
13.1.1 Current Assets ($12.41 million decrease) and Non-Current Assets ($12.54 million increase)
Cash and cash equivalents include cash and investments such as cash held in the bank and in petty cash and the value of investments in deposits or other highly liquid investments with short term maturities of three months or less. These balances are projected to decrease by $11.27 million during the year mainly to fund the capital works program during the year.
Trade and other receivables are monies owed to Council by ratepayers and others. Short term debtors are not expected to change significantly in the budget. Long term debtors (non-current) relating to loans to community organisations will increase by $0.09 million in accordance with agreed repayment terms.
Chartered Accountants Australia and New ZealandVictorian City Council Model Budget – 2017/18 76

Other assets includes items such as prepayments for expenses that Council has paid in advance of service delivery, inventories or stocks held for sale or consumption in Council’s services and other revenues due to be received in the next 12 months. Accrued income is expected to reduce by $1.24 million as land sales which became unconditional at the end of the 2016/17 year are paid.
Property, infrastructure, plant and equipment is the largest component of Council’s worth and represents the value of all the land, buildings, roads, vehicles, equipment, etc which has been built up by Council over many years. The $12.73 million increase in this balance is attributable to the net result of the capital works program ($29.08 million of new assets), depreciation of assets ($14.50 million) and the sale through sale of property, plant and equipment ($1.85 million).
13.1.2 Current Liabilities ($0.20 million increase) and Non-Current Liabilities ($1.13 million decrease)
Trade and other payables are those to whom Council owes money as at 30 June. These liabilities are budgeted to remain consistent with 2016/17 levels.
Provisions include accrued long service leave, annual leave and rostered days off owing to employees. These employee entitlements are only expected to increase marginally due to more active management of entitlements despite factoring in an increase for Collective Agreement outcomes.
Interest-bearing loans and borrowings are borrowings of Council. Council is budgeting to repay loan principal of $1.16 million over the year.
13.1.3 Working Capital ($12.62 million decrease)
Working capital is the excess of current assets above current liabilities. This calculation recognises that although Council has current assets, some of those assets are already committed to the future settlement of liabilities in the following 12 months, and are therefore not available for discretionary spending.
Some of Council’s cash assets are restricted in that they are required by legislation to be held in reserve for specific purposes or are held to fund carry forward capital works from the previous financial year.
ForecastActual
2017$’000
Budget2018$’000
Variance
$’000Current assets 30,194 17,780 (12,414)Current liabilities 12,551 12,755 (204)Working capital 17,643 5,025 (12,618) Restricted cash and investment current assets- Statutory reserves (936) (894) 42- Cash held to fund carry forward capital works (6,569) - 6,569- Trust funds and deposits - - -Unrestricted working capital 10,138 4,131 (6,007)
In addition to the restricted cash shown above, Council is also projected to hold $3.91 million in discretionary reserves at 30 June 2018. Although not restricted by a statutory purpose, Council has made decisions regarding the future use of these funds and unless there is a Council resolution these funds should be used for those earmarked purposes.
13.1.4 Equity ($1.05 million increase)Total equity always equals net assets and is made up of the following components: Asset revaluation reserve which represents the difference between the previously recorded value
of assets and their current valuations Other reserves that are funds that Council wishes to separately identify as being set aside to
meet a specific purpose in the future and to which there is no existing liability. These amounts are transferred from the Accumulated Surplus of the Council to be separately disclosed.
Chartered Accountants Australia and New ZealandVictorian City Council Model Budget – 2017/18 77

Accumulated surplus which is the value of all net assets less Reserves that have accumulated over time. $1.05 million of the $9.39 million increase in accumulated surplus results directly from the surplus for the year. An amount of $8.35 million (net) is budgeted to be transferred from other reserves to accumulated surplus. This reflects the usage of investment cash reserves to partly fund the capital works program. This is a transfer between equity balances only and does not impact on the total balance of equity.
13.2 Key assumptions9
In preparing the Balance Sheet for the year ending 30 June 2018 it was necessary to make a number of assumptions about assets, liabilities and equity balances. The key assumptions are as follows: A total of 98.5% of total rates and charges raised will be collected in the 2017/18 year (2016/17:
97.8% forecast actual) Trade creditors to be based on total capital and operating expenditure less written down value of
assets sold, depreciation and employee costs. Payment cycle is 30 days Other debtors and creditors to remain consistent with 2016/17 levels An advance of $0.19 million to Victorian Bowls Club will be repaid in full Proceeds from the sale of property in 2016/17 of $1.24 million will be received in full in the
2017/18 year Employee entitlements to be increased by the Collective Agreement outcome offset by the
impact of more active management of leave entitlements of staff Repayment of loan principal to be $1.16 million Total capital expenditure to be $21.95 million A total of $8.35 million to be transferred from reserves to accumulated surplus, representing the
internal funding of the capital works program for the 2017/18 year.
Chartered Accountants Australia and New ZealandVictorian City Council Model Budget – 2017/18 78

LONG TERM STRATEGIES
This section includes the following analysis and information
14 Strategic resource plan15 Rating information16 Other long term strategies
Chartered Accountants Australia and New ZealandVictorian City Council Model Budget – 2017/18 79

14. Strategic resource plan 1-2
This section includes an extract of the adopted Strategic Resource Plan (SRP) to provide information on the long term financial projections of the Council.
14.1 Plan development3,8-10
The Act requires a SRP to be prepared describing both financial and non-financial resources (including human resources) for at least the next four financial years to achieve the strategic objectives in the Council Plan. In preparing the SRP, Council must take into account all other plans and strategies in regard to services and initiatives which commit financial and non-financial resources for the period of the SRP.
Council has prepared a SRP for the four years 2017/18 to 2020/21 as part of its ongoing financial planning to assist in adopting a budget within a longer term framework. The SRP takes the strategic objectives and strategies as specified in the Council Plan and expresses them in financial terms for the next four years.
The key objective, which underlines the development of the SRP, is financial sustainability in the medium to long term, while still achieving Council’s strategic objectives as specified in the Council Plan. The key financial objectives, which underpin the SRP, are: Maintain existing service levels Achieve a breakeven operating result within five to six years Maintain a capital expenditure program of at least $16 million per annum Achieve a balanced budget on a cash basis.
In preparing the SRP, Council has also been mindful of the need to comply with the following Principles of Sound Financial Management as contained in the Act: Prudently manage financial risks relating to debt, assets and liabilities Provide reasonable stability in the level of rate burden Consider the financial effects of Council decisions on future generations Provide full, accurate and timely disclosure of financial information.
The SRP is updated annually through a rigorous process of consultation with Council service providers followed by a detailed sensitivity analysis to achieve the key financial objectives.
14.2 Financial resources4-5
The following table summarises the key financial results for the next four years as set out in the SRP for years 2017/18 to 2020/21. Section 3 includes a more detailed analysis of the financial resources to be used over the four year period.
Forecast
Actual Budget Strategic Resource Plan
Projections TrendIndicator 2016/17 2017/18 2018/19 2019/20 2020/21 +/o/- $’000 $’000 $’000 $’000 $’000Surplus/(deficit) for the year (1,922) 1,045 5,398 (1,754) (1,570) -Adjusted underlying result (4,676) (4,453) 4,927 (2,124) (1,920) +Cash and investments balance 23,476 12,207 12,428 12,776 13,028 oCash flow from operations 11,922 15,459 20,492 14,052 14,687 -Capital works expenditure 22,617 30,717 23,242 18,530 17,349 -
Key to Forecast Trend:+ Forecasts improvement in Council's financial performance/financial position indicatoro Forecasts that Council's financial performance/financial position indicator will be steady - Forecasts deterioration in Council's financial performance/financial position indicator
The following graph shows the general financial indicators over the four year period.
Chartered Accountants Australia and New ZealandVictorian City Council Model Budget – 2017/18 80

2015/16 2016/17 2017/18 2018/19 2019/20(10,000)
0
10,000
20,000
30,000
40,000
Surplus/(deficit) for the year Adjusted underlying resultCapital Works Expenditure Cash flows from operationsCash and investments balance
$'000
The key outcomes of the SRP are as follows: Financial sustainability (Section 11) - Cash and investments is forecast to increase marginally
over the four year period from $12.20 million to $13.03 million, which indicates a balanced budget on a cash basis in each year
Rating levels (Section 15) – Modest rate increases are forecast over the four years at an average of 3.0%.
Service delivery strategy (Section 16) – Service levels have been maintained throughout the four year period. Despite this, operating surpluses are forecast in years 2017/18 and 2018/19 as a result of significant capital grant revenue being received to fund the annual capital works program. Years 2019/20 to 2020/21 forecast reducing operating deficits with a view to breaking even. However, excluding the effects of capital items such as capital grants and contributions, the adjusted underlying result is a deficit reducing over the four year period. The adjusted underlying result is a measure of financial sustainability and is an important measure as once-off capital items can often mask the operating result
Borrowing strategy (Section 16) – Borrowings are forecast to reduce from $4.90 million to $3.28 million over the four year period. This includes new borrowings of $2.00 million in 2018/19
Infrastructure strategy (Section 16) - Capital expenditure over the four year period will total $89.84 million at an average of $22.46 million. Excluding the Lawn Bowls and Velodrome works, the average is $18.40 million.
Chartered Accountants Australia and New ZealandVictorian City Council Model Budget – 2017/18 81

15. Rating information1
This section contains information on Council’s past and foreshadowed rating levels along with Council's rating structure and the impact of changes in property valuations. This section should be read in conjunction with Council’s Rating Strategy which is available on Council’s website.
15.1 Rating context2
In developing the Strategic Resource Plan (referred to in Section 14.), rates and charges were identified as an important source of revenue, accounting for 59.1% of the total revenue received by Council annually. Planning for future rate increases has therefore been an important component of the Strategic Resource Planning process. The level of required rates and charges has been considered in this context, with reference to Council's other sources of income and the planned expenditure on services and works to be undertaken for the Victorian community.
15.1 Future Rates and Charges3
The following table sets out future proposed increases in revenue from rates and charges and the total rates to be raised, based on the forecast financial position of Council as at 30 June 2017, and the forecast rate increase used for financial planning purposes
GeneralRate
MunicipalCharge
GarbageCharge
RecyclingCharge
Total Rates
Year Increase Increase Increase Increase Raised% % % % $’000
2016/17 5.00 5.00 4.80 5.00 41,1952017/18 2.00 2.00 3.90 5.30 43,4572018/19 2.20 2.70 5.00 5.00 46,2732019/20 2.80 2.80 3.50 3.50 48,7252020/21 2.80 2.80 3.50 3.50 51,263
Chartered Accountants Australia and New ZealandVictorian City Council Model Budget – 2017/18 82

15.2 Rating structure4-7
Council has established a rating structure which is comprised of three key elements. These are: Property values, which form the central basis of rating under the Local Government Act 1989 A 'user pays' component to reflect usage of certain services provided by Council A fixed municipal charge per property to cover some of the administrative costs of the Council.
Striking a proper balance between these elements provides equity in the distribution of the rate burden across residents.
Council makes a further distinction within the property value component of rates based on the purpose for which the property is used, that is, whether the property is used for residential or commercial purposes. This distinction is based on the concept that business should pay a fair and equitable contribution to rates, taking into account the benefits those commercial properties derive from the local community.
Having reviewed the various valuation bases for determining the property value component of rates, Council has determined to apply a Capital Improved Value (CIV) basis on the grounds that it provides the most equitable distribution of rates across the municipality. There are currently no plans to change that basis, but Council does review its rating structure every four years.
The existing rating structure comprises two differential rates (residential and commercial), and a rate concession for recreational land. These rates are structured in accordance with the requirements of Section 161 ‘Differential Rates’ of the Act. Under the Cultural and Recreational Lands Act 1963, provision is made for a Council to levy the rate for recreational lands at “such amount as the municipal council thinks reasonable having regard to the services provided by the municipal council in relation to such lands and having regard to the benefit to the community derived from such recreational lands”. The commercial rate is set at 175% of the residential rate and the rate concession for recreational land is set at 50% of the commercial rate. Council also levies a municipal charge, a kerbside collection charge and a recycling charge as allowed under the Act.
The following table summarises the rates to be determined for the 2017/18 year. A more detailed analysis of the rates to be raised is contained in Section 7 ‘Statutory Disclosures’.
Rate type How applied 2016/17 2017/18Total
Raised$000’s
Change
Residential rates Cents in $ of CIV 0.248354 0.253422 22,875 3.9%Commercial rates Cents in $ of CIV 0.434116 0.442976 4,160 1.3%Industrial rates Cents in $ of CIV 0.434116 0.442976 3,605 1.3%
Municipal charge $ per property $105 $107 6,111 3.0%Kerbside collection charge $ per property $77 $80 4,569 3.9%Recycling charge $ per property $19 $20 1,142 5.3%
Council has adopted a formal Rating Strategy that contains expanded information on Council's rating structure and the reasons behind its choices in applying the rating mechanisms it has used.
Chartered Accountants Australia and New ZealandVictorian City Council Model Budget – 2017/18 83

16. Summary of other strategies1
This section sets out summaries of the strategies that have been developed and incorporated into the Strategic Resource Plan including borrowings, infrastructure and service delivery.
16.1 Borrowings2-5
In developing the Strategic Resource Plan (SRP) (see Section 14), borrowings was identified as an important funding source for capital works programs. In the past, Council has borrowed strongly to finance large infrastructure projects and since then has been in a phase of debt reduction. This has resulted in a reduction in debt servicing costs, but has meant that cash and investment reserves have been used as an alternate funding source to maintain robust capital works programs. With Council reserves now forecast to be $13.10 million at 30 June 2017, followed by a significant reduction in 2017/18 to complete current infrastructure works in progress, it has been necessary to reconsider the issue of borrowings.
The SRP includes the results of an analysis of Council’s debt position against both State averages and large council averages over a number of different indicators. It also shows the results of the ‘obligations’ indicators that are part of the prescribed financial reporting indicators. The outcome of the analysis highlighted that a debt of $8.00 million could be comfortably accommodated. Council has set a target goal of reaching $4.00 million by 2017/18 to allow spare debt capacity for future major projects.
For the 2017/18 year, Council has decided not to take out any new borrowings to fund the capital works program and therefore, after making loan repayments of $1.47 million, will reduce its total borrowings to $4.89 million as at 30 June 2018. However, it is likely that in future years, borrowings will be required to fund future infrastructure initiatives. The following table sets out future proposed borrowings, based on the forecast financial position of Council as at 30 June 2017.
YearNew
BorrowingsPrincipal
PaidInterest
PaidBalance 30 June
$’000 $’000 $’000 $’0002016/17 0 1,161 380 6,0482017/18 0 1,161 312 4,8872017/18 0 1,161 247 3,7262018/19 2,000 1,161 410 4,5652019/20 0 1,290 340 3,275
The table below shows information on borrowings specifically required by the Regulations.
2016/17 2017/18
$’000 $’000Total amount borrowed as at 30 June of the prior year 7,209 6,048Total amount proposed to be borrowed 0 0Total amount projected to be redeemed (1,161) (1,161) Total amount of borrowings as at 30 June 6,048 4,887
Chartered Accountants Australia and New ZealandVictorian City Council Model Budget – 2017/18 84

16.2 Infrastructure6-13
The Council has developed an Infrastructure Strategy based on the knowledge provided by various Asset Management Plans, which sets out the capital expenditure requirements of Council for the next 10 years by class of asset, and is a key input to the SRP. It predicts infrastructure consumption, renewal needs and considers infrastructure needs to meet future community service expectations. The Strategy has been developed through a rigorous process of consultation and evaluation. The key aspects of the process are as follows: Long term capital planning process which integrates with the Council Plan, Strategic Resource
Plan and Annual Budget processes Identification of capital projects through the preparation of asset management plans Prioritisation of capital projects within classes on the basis of evaluation criteria Methodology for allocating annual funding to classes of capital projects Business Case template for officers to document capital project submissions.
A key objective of the Infrastructure Strategy is to maintain or renew Council’s existing assets at desired condition levels. If sufficient funds are not allocated to asset renewal then Council’s investment in those assets will reduce, along with the capacity to deliver services to the community.
The graph below sets out the required and actual asset renewal over the life of the current SRP and the renewal backlog.
2016/17 2017/18 2018/19 2019/20 2020/210
5,000
10,000
15,000
20,000
Renewal required Renewal program Backlog
$'00
0
At present, Council is similar to most municipalities in that it is presently unable to fully fund asset renewal requirements identified in the Infrastructure Strategy. While the Infrastructure Strategy is endeavouring to provide a sufficient level of annual funding to meet ongoing asset renewal needs, the above graph indicates that in later years the required asset renewal is not being addressed creating an asset renewal gap and increasing the level of backlog. Backlog is the renewal works that Council has not been able to fund over the past years and is equivalent to the accumulated asset renewal gap. In the above graph the backlog at the beginning of the five year period was $5.00 million and $8.42 million at the end of the period.
In updating the Infrastructure Strategy for the 2017/18 year, the following influences have had a significant impact: Reduction in the amount of cash and investment reserves to fund future capital expenditure
programs Environmental issues at the Victoria Park Lake resulting in the bringing forward of future planned
expenditure Availability of significant Federal funding for upgrade of roads Decision by the Victorian State Government to award Council with construction of a Velodrome
and Lawn Bowls Centre within its municipality
Chartered Accountants Australia and New ZealandVictorian City Council Model Budget – 2017/18 85

The enactment of the Road Management Act 2004 removing the defence of non-feasance on major assets such as roads
New building regulations requiring all Child Care Centres to immediately upgrade to ensure compliance.
The following table summarises Council's forward outlook on capital expenditure including funding sources for the next four years.
Summary of funding sources
Year
Total Capital
Program Grants ContributionsCouncil
Cash Borrowings $’000 $’000 $’000 $’000 $’0002016/17 22,617 2,903 0 19,714 02017/18 30,717 6,277 0 24,440 02017/18 23,242 9,407 0 13,835 02018/19 18,530 1,694 0 14,836 2,0002019/20 17,349 1,367 0 15,982 0
In addition to using cash generated from its annual operations, borrowings and external contributions such as government grants, Council has significant cash or investment reserves that are also used to fund a variety of capital projects. These reserves are either ‘statutory’ or ’discretionary’ cash reserves. Statutory reserves relate to cash and investments held by Council that must be expended on a specific purpose as directed by legislation or a funding body, and include contributions to car parking, drainage and public resort and recreation. Discretionary cash reserves relate to those cash and investment balances that have been set aside by Council and can be used at Council’s discretion, even though they may be earmarked for a specific purpose.
16.3 Service delivery14-17
The key objectives in Council’s Strategic Resource Plan (referred to in Section 14.) which directly impact the future service delivery strategy are to maintain existing service levels and to achieve a breakeven operating result within five to six years. The Rating Information (see Section 15.) also refers to modest rate increases into the future. With these key objectives as a basis, a number of internal and external influences have been identified through discussions with management which will have a significant impact on the scope and level of services to be provided over the next four years.
The general influences affecting all operating revenue and expenditure include the following: 2017/2018 2018/2019 2019/2020 2020/2021
% % % %Consumer Price Index 2.00 2.25 2.25 2.50Average Weekly Earnings
3.66 3.75 3.75 3.75
Engineering Construction Index
0.47 2.00 2.00 2.00
Non-residential Building Index
0.15 2.00 2.00 2.00
Rate increases 2.00 2.70 2.80 2.80Property growth 1.00 1.00 1.00 0.60Wages growth 4.50 3.50 3.50 3.50Government funding 2.00 2.00 2.00 2.00Statutory fees 2.00 2.00 2.00 2.00Investment return 3.00 3.00 3.00 3.00
As well as the general influences, there are also a number of specific influences which relate directly to service areas or activities. The most significant changes in these areas are summarised below.
Chartered Accountants Australia and New ZealandVictorian City Council Model Budget – 2017/18 86

Transfer StationWaste tipping fees for inert waste are expected to rise further as the State Government has increased the levy payable upon disposal of waste at landfill. Following increases of $53.33 per tonne since 2008/09, the fee will rise a further $1.24 per tonne (2.3%) in 2017/18. The financial impact will be to increase tipping fee costs at the Transfer Station from $0.36 million in 2016/17 to $0.46 million in 2017/18. The pricing structure currently in place for Transfer Station users will be adjusted to absorb all future cost increases.
Residential Garbage CollectionWaste tipping charges associated with the disposal of residential garbage and also growth in the number of tenements (1,000 pa over the five year period) are expected to result in an increase of $0.03 million per annum excluding CPI. The increased landfill levy will also increase the cost of residential garbage disposal by $0.18 million in the 2017/18 financial year.
Kerbside CollectionThe contract for collection of recyclable waste expires on 1 July 2017. It is expected that the cost of this service will increase from $1.20 million to $1.40 million following re-tender in 2016/17. Future increases have been set at CPI.
Aged and Disability ServicesGovernment funding for aged and disability services is expected to increase by approximately $0.14 million from 2016/17. This includes General Home Care, Personal Care, Respite Care and Meals.
Valuation ServicesThe Council is required to revalue all properties within the municipality every two years. The last general revaluation was carried out as at 1 January 2016 effective for the 2017/18 year and the next revaluation will be undertaken as at 1 January 2018. An allowance of $0.08 million has been made every two years commencing in 2017/18 to meet the additional cost of resources to complete the revaluation process.
Animal ControlThe contract for the provision of animal control services has ended and is currently being renegotiated. It is expected that the cost of this service will rise from $0.36 million to $0.40 million per annum. This will be offset by predicted increases in registration fees of 5% above CPI or $0.02 million per annum in 2017/18 and 2018/19.
The service delivery outcomes measured in financial terms are shown in the following table.
Year
Surplus (Deficit)
for the year
Adjusted Underlying
Surplus (Deficit)
Net Service(Cost)
$’000 $’000 $’0002016/17 (1,922) (4,676) (39,369)2017/18 1,045 (4,453) (42,604)2018/19 5,398 (4,927) (43,233)2019/20 (1,754) (2,124) (44,451)2020/21 (1,570) (1,920) (46,151)
Service levels have been maintained throughout the four year period with operating surpluses forecast in years 2017/18 and 2017/18 as a result of significant capital grant revenue being received to fund the annual capital works program. Years 2018/19 to 2019/20 forecast reducing operating deficits with a view to almost breaking even by 2019/20. Excluding the effects of items such as capital contributions, the adjusted underlying result is a reducing deficit over the four year period. The net cost of the services provided to the community increases from $41.97 million to $46.15 million over the four year period.
Chartered Accountants Australia and New ZealandVictorian City Council Model Budget – 2017/18 87

Appendix AFees and charges schedule1
This appendix presents the fees and charges of a statutory and non-statutory nature which will be charged in respect to various goods and services provided during the 2017/18 year.
Chartered Accountants Australia and New ZealandVictorian City Council Model Budget – 2017/18 88

Appendix BBudget processes 1-6
This section lists the budget processes to be undertaken in order to adopt the Budget in accordance with the Local Government Act 1989 (the Act) and Local Government (Planning and Reporting) Regulations 2014 (the Regulations).
Under the Act, Council is required to prepare and adopt an annual budget for each financial year. The budget is required to include certain information about the rates and charges that Council intends to levy as well as a range of other information required by the Regulations which support the Act.
The 2017/18 budget, which is included in this report, is for the year 1 July 2017 to 30 June 2018 and is prepared in accordance with the Act and Regulations. The budget includes financial statements being a Comprehensive Income Statement, Balance Sheet, Statement of Changes in Equity, Statement of Cash Flows and Statement of Capital Works. These statements have been prepared for the year ending 30 June 2018 in accordance with the Act and Regulations, and consistent with the annual financial statements which are prepared in accordance with Australian Accounting Standards and the Local Government Model Accounts. The budget also includes information about the rates and charges to be levied, the capital works program to be undertaken, the human resources required, and other financial information Council requires in order to make an informed decision about the adoption of the budget.
A ‘proposed’ budget is prepared in accordance with the Act and submitted to Council in May for approval ’in principle’. Council is then required to give ’public notice’ that it intends to ’adopt’ the budget. It must give 28 days notice of its intention to adopt the proposed budget and make the budget available for inspection at its offices and on its web site. A person has a right to make a submission on any proposal contained in the budget and any submission must be considered before adoption of the budget by Council.
With the introduction of the State Governments Rate Capping legislation in 2015 Councils are now unable to determine the level of rate increase and instead must use a maximum rate increase determined by the Minister for Local Government which is announced in December for application in the following financial year.
If a Council wishes to seek a rate increase above the maximum allowable it must submit a rate variation submission to the Essential Services Commission (ESC). The ESC will determine whether the rate increase variation submission has been successful by 31 May. In many cases this will require Councils to undertake ‘public notice’ on two separate proposed budgets simultaneously, i.e. the Ministers maximum rate increase and the Council’s required rate increase. The final step is for Council to adopt the budget after receiving and considering any submissions from interested parties. The budget is required to be adopted by 30 June and a copy submitted to the Minister within 28 days after adoption. The key dates for the budget process are summarised below:
Budget process Timing1. Minister of Local Government announces maximum rate increase2. Officers update Council's long term financial projections Dec
3.Council to advise ESC if it intends to make a rate variation submission Jan/Feb
4. Council submits formal rate variation submission to ESC Mar
5. Proposed budget(s) submitted to Council for approval to advertise Apr/May
6. ESC advises whether rate variation submission I successful May
7. Public notice advising intention to adopt budget May
8. Budget available for public inspection and comment May
9. Public submission process undertaken May/Jun
10. Submissions period closes (28 days) Jun
11. Submissions considered by Council/Committee Jun
Chartered Accountants Australia and New ZealandVictorian City Council Model Budget – 2017/18 89
12. Budget and submissions presented to Council for adoption Jun
13. Copy of adopted budget submitted to the Minister Jul14. Revised budget where a material change has arisen
Chartered Accountants Australia and New ZealandVictorian City Council Model Budget – 2017/18 90

End of Victorian City Council Budget Report
The Institute of Chartered Accountants in AustraliaVictorian City Council Model Budget – 2017/2018 91